stellar performance and successful start as a focused
TRANSCRIPT
Stellar performance and successful start
as a focused technology company
Roland Busch, CEO Siemens AG
Ralf P. Thomas, CFO Siemens AG
Unrestricted | © Siemens 2021 | Media Relations | Annual Press Conference | 2021-11-11

Notes and forward-looking statements
This document contains statements related to our future business and
financial performance and future events or developments involving
Siemens that may constitute forward-looking statements. These
statements may be identified by words such as “expect,” “look forward
to,” “anticipate,” “intend,” “plan,” “believe,” “seek,” “estimate,” “will,”
“project” or words of similar meaning. We may also make forward-
looking statements in other reports, in prospectuses, in presentations,
in material delivered to shareholders and in press releases. In
addition, our representatives may from time to time make oral forward-
looking statements. Such statements are based on the current
expectations and certain assumptions of Siemens’ management, of
which many are beyond Siemens’ control. These are subject to a
number of risks, uncertainties and factors, including, but not limited to,
those described in disclosures, in particular in the chapter Report on
expected developments and associated material opportunities and
risks in the Annual Report and in the Half-year Financial Report, which
should be read in conjunction with the Annual Report. Should one or
more of these risks or uncertainties materialize, events of force
majeure, such as pandemics, occur or should decisions, assessments
or requirements of regulatory authorities deviate from our
expectations, or should underlying expectations including future
events occur at a later date or not at all or assumptions prove
incorrect, actual results, performance or achievements of Siemens
may (negatively or positively) vary materially from those described
explicitly or implicitly in the relevant forward-looking statement.
Siemens neither intends, nor assumes any obligation, to update or
revise these forward-looking statements in light of developments
which differ from those anticipated.
This document includes – in the applicable financial reporting
framework not clearly defined – supplemental financial measures that
are or may be alternative performance measures (non-GAAP-
measures). These supplemental financial measures should not be
viewed in isolation or as alternatives to measures of Siemens’ net
assets and financial positions or results of operations as presented in
accordance with the applicable financial reporting framework in its
Consolidated Financial Statements. Other companies that report or
describe similarly titled alternative performance measures may
calculate them differently.
Due to rounding, numbers presented throughout this and other
documents may not add up precisely to the totals provided and
percentages may not precisely reflect the absolute figures.
All information is preliminary.
Unrestricted | © Siemens 2021 | Media Relations | Annual Press Conference | 2021-11-11Page 2
Agenda
Page 3
Stellar FY 2021
Strong finish in Q4
Outlook FY 2022
Unrestricted | © Siemens 2021 | Media Relations | Annual Press Conference | 2021-11-11
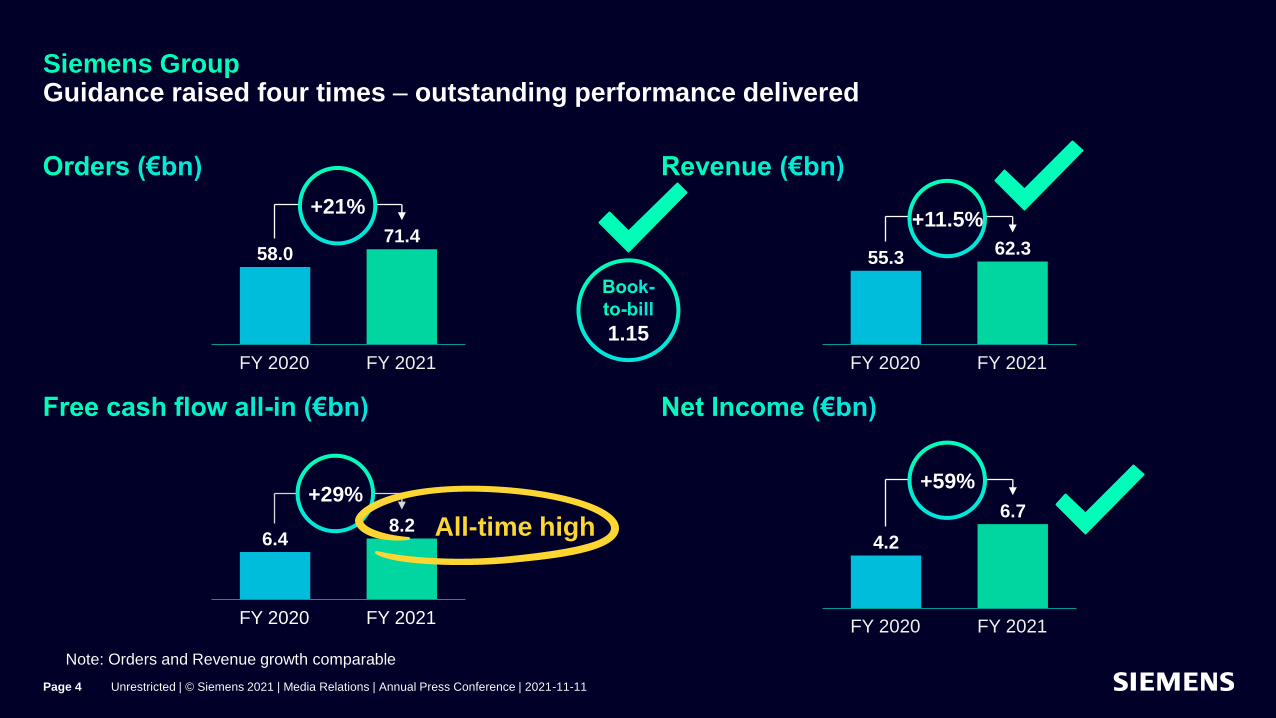
Siemens GroupGuidance raised four times – outstanding performance delivered
Page 4
FY 2020 FY 2021
58.071.4
FY 2020 FY 2021
55.362.3
FY 2020 FY 2021
4.2
6.7
FY 2021FY 2020
8.26.4
+21%
Note: Orders and Revenue growth comparable
+11.5%
+29%+59%
1.15
All-time high
Unrestricted | © Siemens 2021 | Media Relations | Annual Press Conference | 2021-11-11
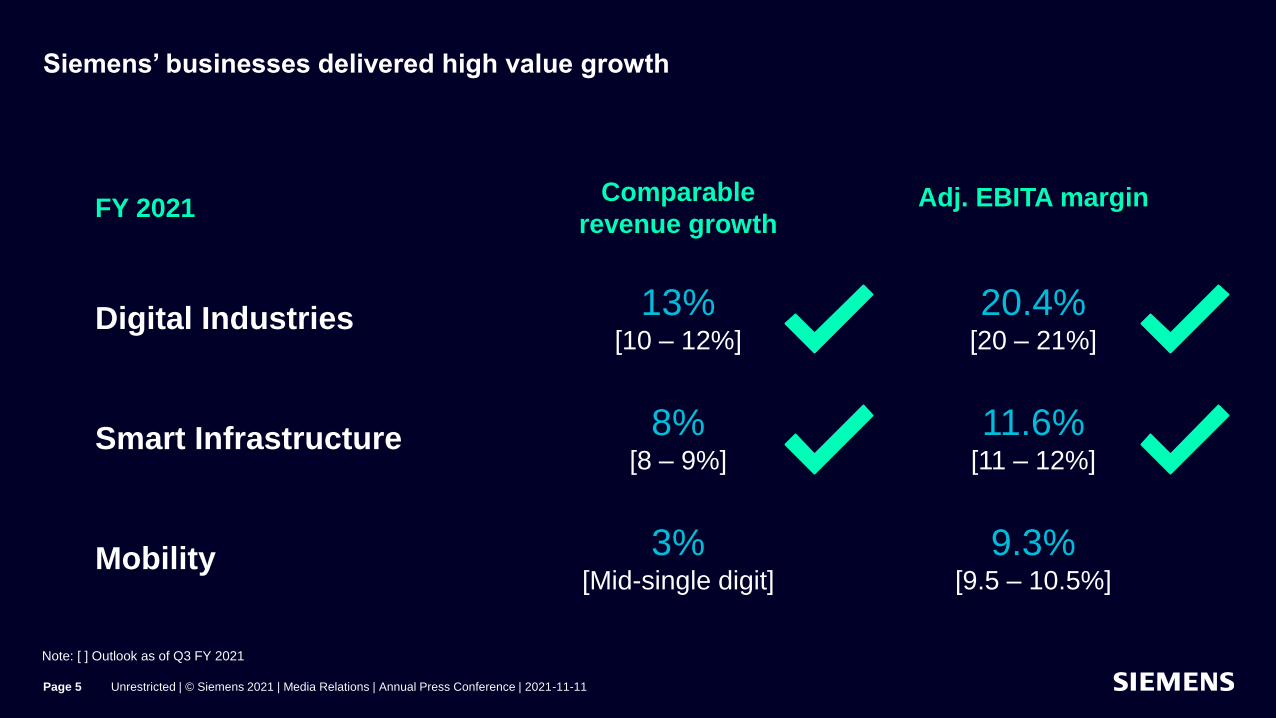
Siemens’ businesses delivered high value growth
Page 5
FY 2021Comparable
revenue growthAdj. EBITA margin
Digital Industries 13%[10 – 12%]
20.4%[20 – 21%]
Smart Infrastructure 8%[8 – 9%]
11.6%[11 – 12%]
Mobility 3%[Mid-single digit]
9.3%[9.5 – 10.5%]
Note: [ ] Outlook as of Q3 FY 2021
Unrestricted | © Siemens 2021 | Media Relations | Annual Press Conference | 2021-11-11

Stringent execution of DEGREE
Page 6
China Zero-carbon Pioneer Initiative
• Zero carbon in Chinese operations by 2030
• Assisting >500 suppliers and >10,000
customers in low-carbon transition
Lean & Green Management Award
• For Electronic Factory Erlangen in category
“Manufacturing Industry”
MyLearningWorld Offering
• Expanded to ~150.000 users
• >17 digital learning hours1) per employee in
FY 21
Employability
GovernanceEquity
Decarbonization
Resource efficiency
Ethics
1) Preliminary data; audited figures available on Dec. 2
Unrestricted | © Siemens 2021 | Media Relations | Annual Press Conference | 2021-11-11

Sustainability - a great business opportunity for SiemensDecarbonization and resource efficiency key drivers for customer value
Page 7
–
• Decarbonization of distributed energy system for
power, heat and mobility – a blueprint for thousands of
mid-sized communities in Europe
• Sustainable sector coupling with renewable supply, heat
generation, energy storage and hydrogen production
• Strategic partnership with SI and SFS equity
investment
• Market for Automation and Digitalization in vertical
farming expected to reach around $2.8bn by 2026
• Reduced food waste, use of renewable energy, 97%
less water consumption compared to traditional farming
• Leading vertical farming company, servicing >600 retail &
food locations with locally grown food year-round
• SFS equity investment to accelerate global expansion
Unrestricted | © Siemens 2021 | Media Relations | Annual Press Conference | 2021-11-11
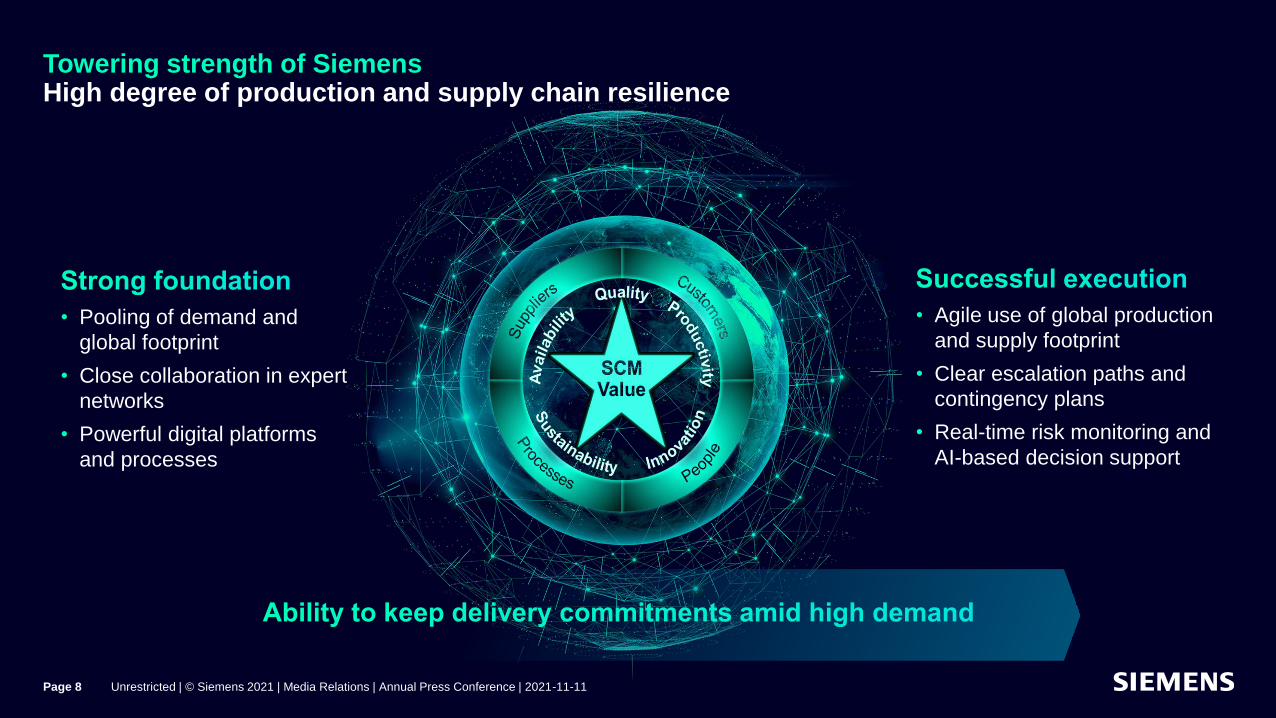
Towering strength of SiemensHigh degree of production and supply chain resilience
Page 8
• Pooling of demand and
global footprint
• Close collaboration in expert
networks
• Powerful digital platforms
and processes
• Agile use of global production
and supply footprint
• Clear escalation paths and
contingency plans
• Real-time risk monitoring and
AI-based decision support
Unrestricted | © Siemens 2021 | Media Relations | Annual Press Conference | 2021-11-11

Focused technology companyStringent capital allocation in future sustainable growth fields
Page 9
0.6
1.5
0.3
FY 2021
2.1
0.4
FY 2022e
7.8%
4.9~5.5
SHL
T/Other
MO
SI
DI
R&D in €bn
~8%R&D in % of
revenue
• SaaS Transition
• Future of Industrial Operation
• Leverage platforms, alternative drives
• Cloudification of Rail Infrastructure, autonomous trains
• Focus CCT’s to maximize impact across businesses
• ~€500m annual invest into tomorrow’s technologies
• Data driven building services
• Building automation and grid control software
Unrestricted | © Siemens 2021 | Media Relations | Annual Press Conference | 2021-11-11

Focused technology companyContinuing optimization of portfolio
Page 10
FY 2021 FY 2022
Divestment
IPO
Carve out
completed
Split in Parcel &
Airport business
Areas of growth?1
Potential profit pool?2
Why Siemens?3
Synergetic value?4
Paradigm shift?5
Sustainability impact?6
Siemens Large Drives
Carve out started
Siemens Logistics
Unrestricted | © Siemens 2021 | Media Relations | Annual Press Conference | 2021-11-11

Empowering customersMoving Egypt - A modern, sustainable rail system that will transform the everyday
Page 11
• Bringing state-of-the-art rail technology to Egypt
• Strengthening economy through safe & reliable transport
infrastructure
• Developing local jobs & skills and sustaining the environment
• Green line with 660 km of electrified rail network signed on Sep 1
• Siemens order share ~US$3bn of in total ~US$4.5bn for green line
• Potential for total 1,800 km of high-speed, commuter & freight lines
• Fully integrated rail system with Siemens trains & rail infrastructure
• Digital services and 15-years maintenance contract
• Up to 50 percent less travel time; >30m passengers a year
• 360,000 t CO2 savings for passenger and freight transport
• 70% less emissions compared to bus/car passenger travel
• >15,000 jobs to be created in Egypt, local skill development
Marsa Matrouh
Ain Sokhna
New Administrative Capital
El Alamein
Hurghada
Safaga
6th of October
Alexandria
Aswan
Luxor
Unrestricted | © Siemens 2021 | Media Relations | Annual Press Conference | 2021-11-11

Empowering customers Accelerating transformation towards sustainable mobility and cities
Page 12
• Cutting edge design & simulation software and
automation solutions for shift towards e-vehicles
• Comprehensive charging infrastructure solutions,
premiere of Autonomous Charging System
• Mobility as a service connecting all modes of
transport
• Buildings consume ~80% of energy supply in ME
• >130 buildings connected by Siemens which will be
nucleus of Dubai’s new District 2020
• Siemens’ technologies and applications to optimize
operations, save energy, curb emissions and
enhance comfort & safety
Unrestricted | © Siemens 2021 | Media Relations | Annual Press Conference | 2021-11-11

Combining the real and digital worldsSiemens Digital Business growth ambitions confirmed
Page 13
FY 2020 FY 2021
5.6
FY 2025e
5.3
~10% CAGR
1 “Digital Business” means Siemens vertical specific software and IoT services from Smart Infrastructure, Digital Industries,
Mobility, Siemens Advanta; unconsolidated values
€bn • Growth in Software business to ramp up slowly due to
SaaS transition related revenue conversion
• Expected to accelerate after FY 23
• Doubling digital revenue to €1.5bn by FY 2025
• Double-digit growth in digital building services business
• Expansion of “Mobility as a Service” offerings
• Maximizing value through digital asset management &
services enabled by Railigent
• Growth in digital transformation services
Unrestricted | © Siemens 2021 | Media Relations | Annual Press Conference | 2021-11-11
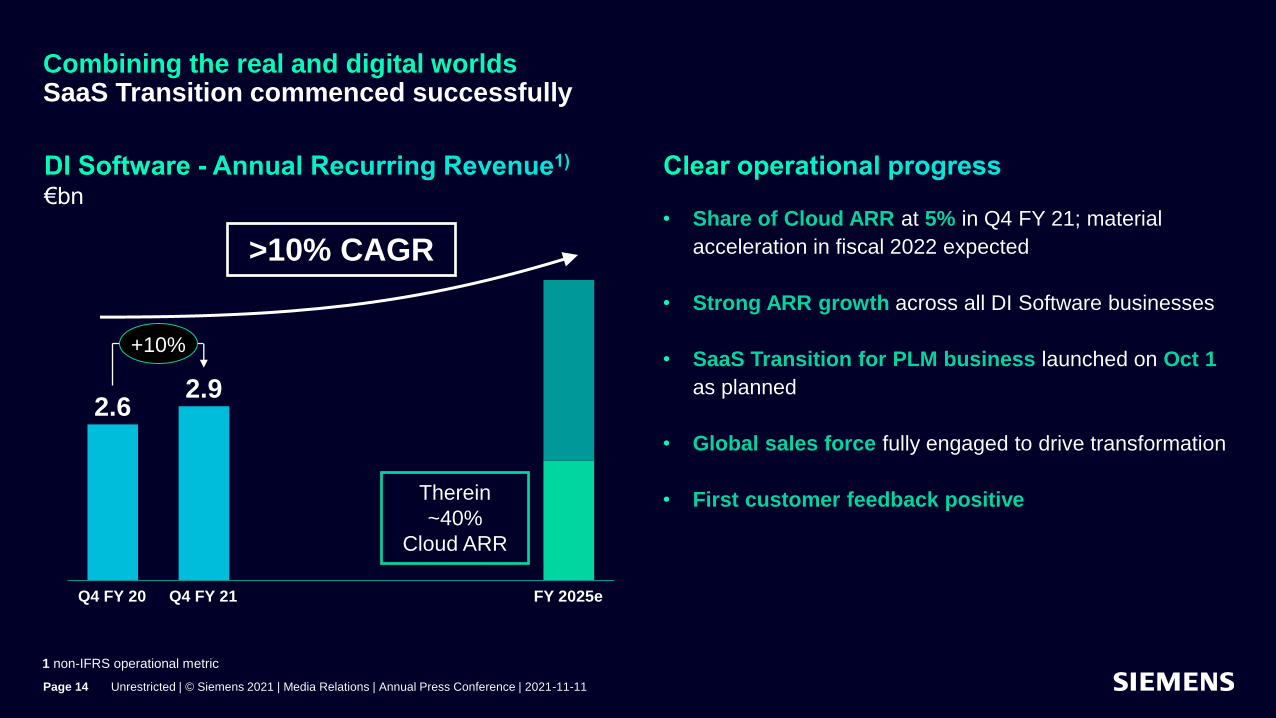
Combining the real and digital worldsSaaS Transition commenced successfully
Page 14
Q4 FY 21Q4 FY 20 FY 2025e
2.62.9
+10%
>10% CAGR
€bn• Share of Cloud ARR at 5% in Q4 FY 21; material
acceleration in fiscal 2022 expected
• Strong ARR growth across all DI Software businesses
• SaaS Transition for PLM business launched on Oct 1
as planned
• Global sales force fully engaged to drive transformation
• First customer feedback positiveTherein
~40%
Cloud ARR
1 non-IFRS operational metric
Unrestricted | © Siemens 2021 | Media Relations | Annual Press Conference | 2021-11-11

Focus on value creationOutstanding Total Shareholder Return
Page 15
Siemens
Sep 30, 2021
€141.92
DAX
+22%
2020 2021
Siemens
pre Siemens Energy spin-off
Sep 25, 2020 €100.681
+45%Siemens TSR
Note: 1) Share prices rebased for Siemens Energy spin-off; 2) MSCI World Industrials Gross USD
MSCI World Ind.2
+29%
Unrestricted | © Siemens 2021 | Media Relations | Annual Press Conference | 2021-11-11

Strong finish in Q4Excellent results across all metrics
Note: Orders and Revenue growth comparable
€19.1bn
+16%
€17.4bn
+10%
€1.45
13.8%
€3.8bn 1.5x
Page 16 Unrestricted | © Siemens 2021 | Media Relations | Annual Press Conference | 2021-11-11

Digital Industries (DI)Topline growth highlighting market share gains – excellent free cash flow
Page 17
• Strong market momentum in
short cycle automation
• Extension of delivery times,
price increases
• Backlog >€7bn
• Discrete Automation up 20%,
mastering component
shortages very well
• Process Automation with
clear growth
• Software growth driven by
PLM and Mendix
• Solid profit conversion, cost
structure improvements
• Higher material cost
• SaaS Transition and targeted
growth investments
• Impact from higher incentive
accruals
• Extraordinary performance
• Effective operating working
capital management
€bn (excl. Bentley effect of 1370bps in Q4 FY 20) €m
x.x1 Comparable Adj. EBITA margin excl. severancex.x% Cash Conversion Ratex.xtherein Software
5.2
3.9
Q4 FY 20 Q4 FY 21
+31%1)
1.0
2.8
Q4 FY 20
3.91.2
3.4
Q4 FY 21
4.5
+15%1)
Q4 FY 20 Q4 FY 21
+90bps
18.8%
19.0%19.2%
17-23%
17.9%
982
Q4 FY 21
1,057
Q4 FY 20
+8%
0.801.23
Unrestricted | © Siemens 2021 | Media Relations | Annual Press Conference | 2021-11-11
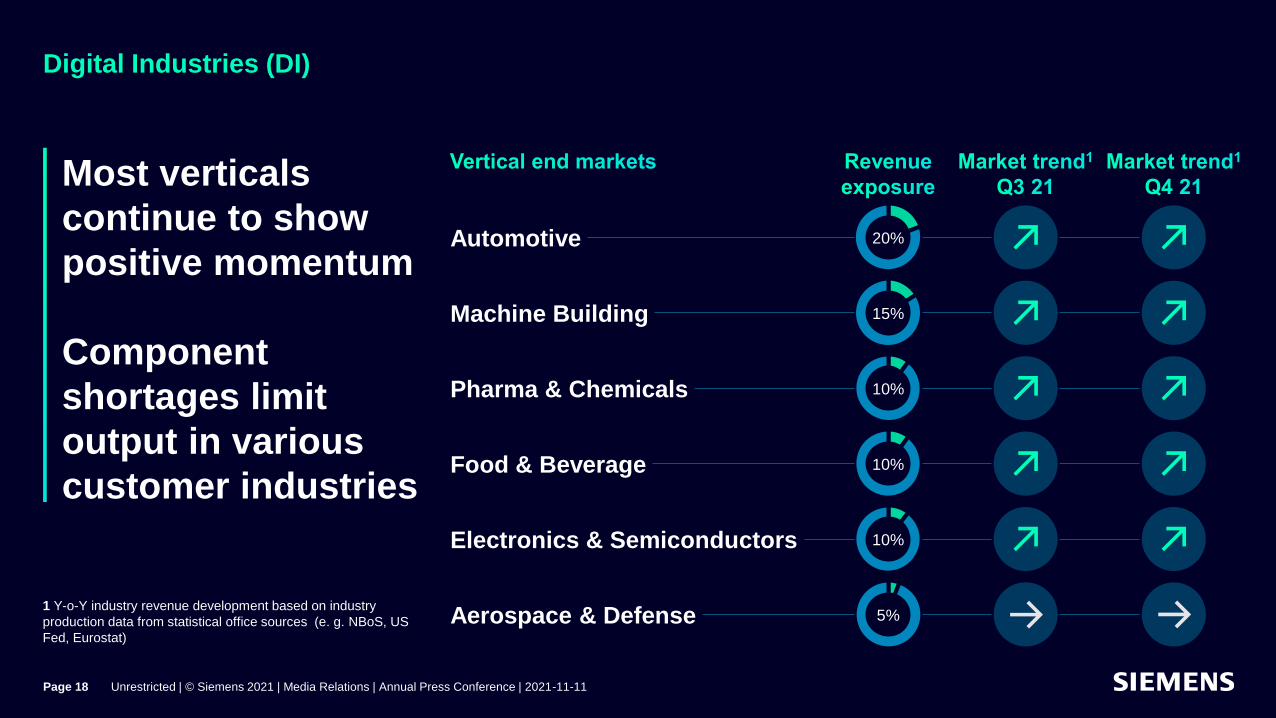
Digital Industries (DI)
Page 18
Most verticals
continue to show
positive momentum
Component
shortages limit
output in various
customer industries
Automotive
Machine Building
Food & Beverage
Pharma & Chemicals
Aerospace & Defense
Electronics & Semiconductors
20%
15%
10%
10%
5%
10%
1 Y-o-Y industry revenue development based on industry
production data from statistical office sources (e. g. NBoS, US
Fed, Eurostat)
Unrestricted | © Siemens 2021 | Media Relations | Annual Press Conference | 2021-11-11

Digital Industries (DI)
Page 19
Broad based
demand across
regions drove
strong topline finish
+61% +21%China
+49% +21%Germany
+42% +15%Italy
+27% +9%U.S.
+10%Global PLM and Mendix drive growth
Strong finish in both, Discrete and
Process
Remained strong on high previous
quarter level
Topline continued on high levels
especially in short-cycle business
Solid finish across businesses,
driven by Discrete
Unrestricted | © Siemens 2021 | Media Relations | Annual Press Conference | 2021-11-11

Smart Infrastructure (SI)Strong top-line, continuing margin improvement and outstanding cash conversion
Page 20
• Products and Systems
significantly up, driven by
industrial, data center and
semiconductor verticals
• Solutions and services stable
• Backlog ~€11bn
• Products 13% up, continue to
show strength
• Systems with clear growth
• Solutions and Services with
modest growth
• High capacity utilization
drives profit conversion
• Competitiveness program
delivers sustainable savings
• Rising raw material prices
and logistics cost
• Consistent stringent working
capital management
€bn (excl. disposal gain of 410bps in Q4 FY 20) €m
x.x1 Comparable, excl. FX and portfolio Adj. EBITA margin excl. severancex.x% Cash Conversion Ratex.xtherein Products
Q4 FY 21
3.8
Q4 FY 20
4.2
+9%1)
2.6
Q4 FY 20
2.5
1.4 1.6
Q4 FY 21
3.9 4.2
+7%1)
884 901
Q4 FY 20 Q4 FY 21
+2%
1.51 1.78
Q4 FY 20 Q4 FY 21
+100bps
12.1%12.4%
10-15%
11.0%12.0%
Unrestricted | © Siemens 2021 | Media Relations | Annual Press Conference | 2021-11-11
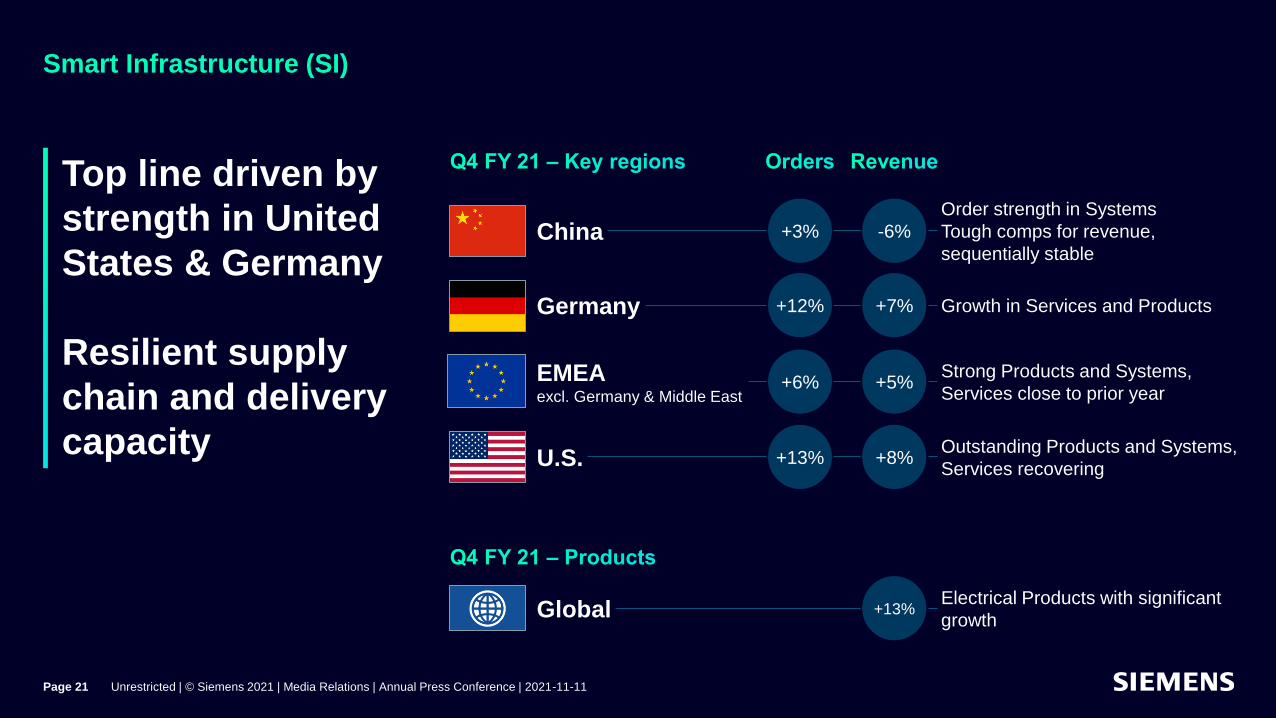
Smart Infrastructure (SI)
Page 21
Top line driven by
strength in United
States & Germany
Resilient supply
chain and delivery
capacity
+3% -6%China
+12% +7%Germany
+6% +5%EMEAexcl. Germany & Middle East
+13% +8%U.S.
+13%GlobalElectrical Products with significant
growth
Growth in Services and Products
Strong Products and Systems,
Services close to prior year
Order strength in Systems
Tough comps for revenue,
sequentially stable
Outstanding Products and Systems,
Services recovering
Unrestricted | © Siemens 2021 | Media Relations | Annual Press Conference | 2021-11-11

Smart Infrastructure (SI)Market recovery ongoing
• Building markets continue recovery – headwinds
from US non-residential construction market
• Electrification markets with solid growth – driven by
renewable integration trend and increasing
electricity needs
• Electrical Products markets with strong growth
throughout the year – driven by exceptional customer
demand
Portfolio mix1
27%Electrification
29%ElectricalProducts
44%Buildings
1) Portfolio mix split based on unconsolidated revenues
Page 22 Unrestricted | © Siemens 2021 | Media Relations | Annual Press Conference | 2021-11-11
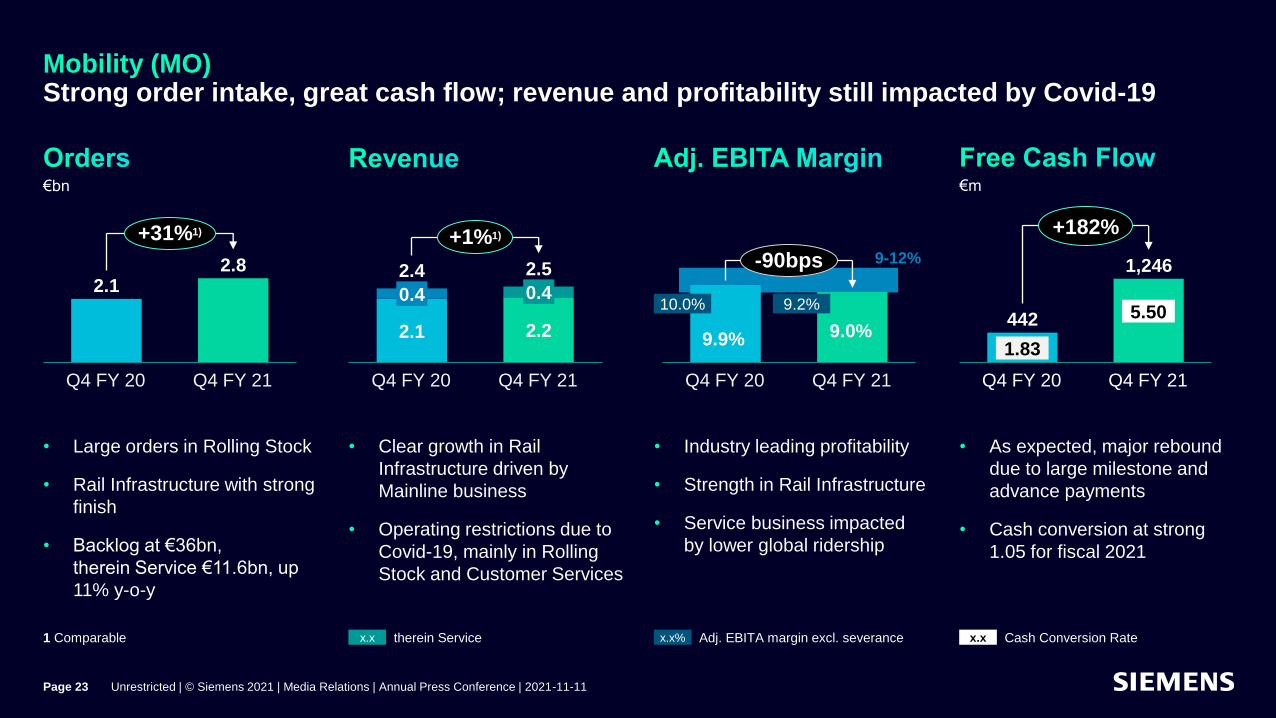
Mobility (MO)Strong order intake, great cash flow; revenue and profitability still impacted by Covid-19
Page 23
• Large orders in Rolling Stock
• Rail Infrastructure with strong
finish
• Backlog at €36bn,
therein Service €11.6bn, up
11% y-o-y
• Clear growth in Rail
Infrastructure driven by
Mainline business
• Operating restrictions due to
Covid-19, mainly in Rolling
Stock and Customer Services
• Industry leading profitability
• Strength in Rail Infrastructure
• Service business impacted
by lower global ridership
• As expected, major rebound
due to large milestone and
advance payments
• Cash conversion at strong
1.05 for fiscal 2021
€bn €m
x.x1 Comparable Adj. EBITA margin excl. severancex.x% Cash Conversion Ratex.xtherein Service
Q4 FY 20
2.1
Q4 FY 21
2.8
+31%1)
0.4
2.1
0.4
Q4 FY 20
2.2
Q4 FY 21
2.4 2.5
+1%1)
442
Q4 FY 20 Q4 FY 21
1,246
+182%
1.83
5.50
Q4 FY 21Q4 FY 20
-90bps
9.0%
10.0% 9.2%
9-12%
9.9%
Unrestricted | © Siemens 2021 | Media Relations | Annual Press Conference | 2021-11-11

12%Manufacturing5%
Healthcarenon-hospitals
4%Wholesale and
retail trade
6%Conventional power
6%Transmission and
distribution8%Transportation
11%Service
9%Healthcare hospitals
40%USA
4%Information andcommunication
61%Project and
structured debt
6%Equity business
32%Commercialfinance
18%Renewable
Financial Services (SFS)Significant improvement of profitability driven by Debt Business
Page 24
IndustryProduct
1%Other
17%Other
Region
4%China
15%Other investmentgrade countries
4%Other non-investment grade countries
11%Other EU
12%UK
3%Canada
4%France
6%Germany
Therein:Return on Equity
(after tax)
Earnings before
taxes (€m)
Total assets (€bn)
11.7% 15.4% 16.0%9.5% 20.4%27.3%
345120
512
FY20Q4 FY21
30.4
FY21
28.9 30.4
128
483279
28.5
Q4 FY21
27.0 28.5
FY20 FY21
1 82 49
1.81.7
Q4 FY21 FY20
1.7
FY21
Unrestricted | © Siemens 2021 | Media Relations | Annual Press Conference | 2021-11-11

Brilliant cash performance – Industrial Businesses close to €10bn
Page 25
€m
€m
• Strong finish in fourth quarter on stringent operating
working capital management
• All four businesses with cash conversion rate
clearly >1 in FY 2021 despite strong revenue growth
• Strong cash focus across all Siemens units yields
record high all-in free cash flow
• Continuing strong cash performance at Portfolio
Companies clear evidence for successful “PE-
approach”
Cash Conversion Ratex.x
Q2 FY 21FY 20 Q1 FY 21 Q3 FY 21 FY 21Q4 FY 21
7,142
2,4201,468 2,1443,816
9,847
+38%
0.94
0.69
1.12
1.03 1.04 1.68
972
FY 21FY 20 Q1 FY 21 Q2 FY 21 Q3 FY 21 Q4 FY 21
6,404
1,215 2,2743,776
8,237
+29%
1.52
0.65
1.23
0.51 1.54 2.84
Unrestricted | © Siemens 2021 | Media Relations | Annual Press Conference | 2021-11-11
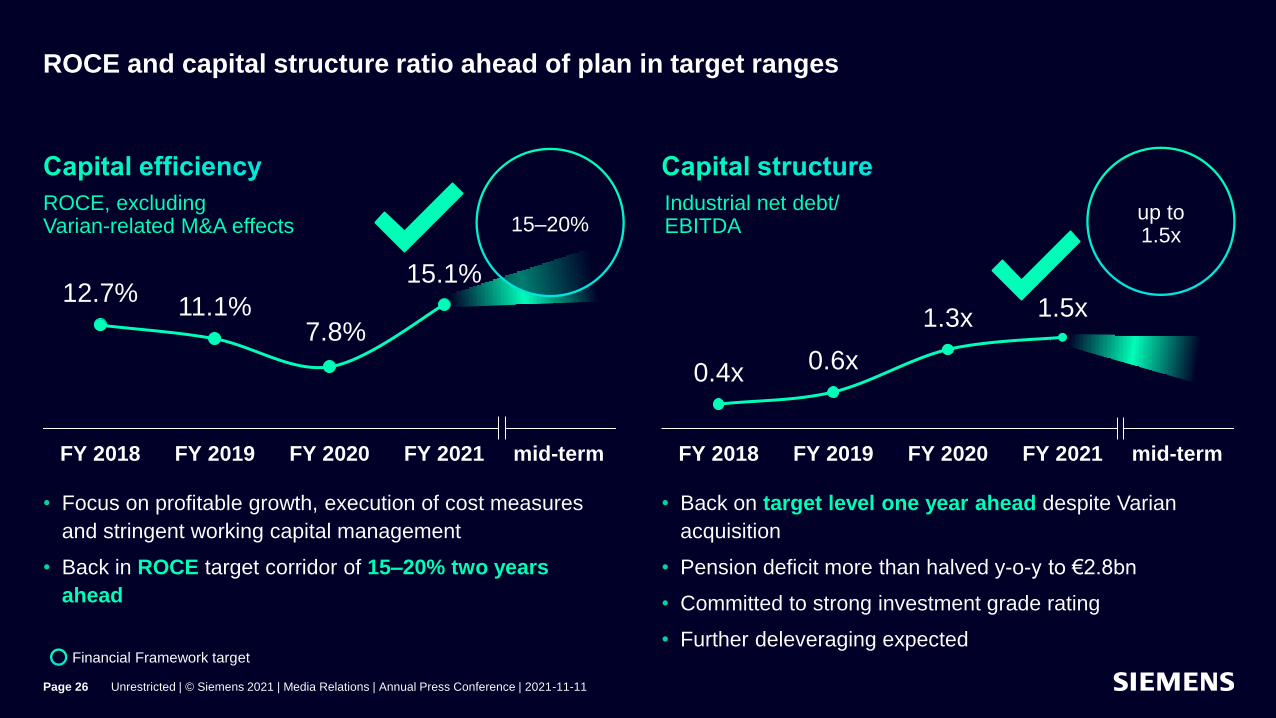
ROCE and capital structure ratio ahead of plan in target ranges
Page 26
12.7%11.1%
7.8%
15.1%
FY 2018 FY 2019 FY 2020 FY 2021 mid-term
ROCE, excluding Varian-related M&A effects 15–20%
0.4x 0.6x
1.3x 1.5x
FY 2018 FY 2019 FY 2020 FY 2021 mid-term
Industrial net debt/ EBITDA
up to1.5x
• Focus on profitable growth, execution of cost measures
and stringent working capital management
• Back in ROCE target corridor of 15–20% two years
ahead
• Back on target level one year ahead despite Varian
acquisition
• Pension deficit more than halved y-o-y to €2.8bn
• Committed to strong investment grade rating
• Further deleveraging expectedFinancial Framework target
Unrestricted | © Siemens 2021 | Media Relations | Annual Press Conference | 2021-11-11
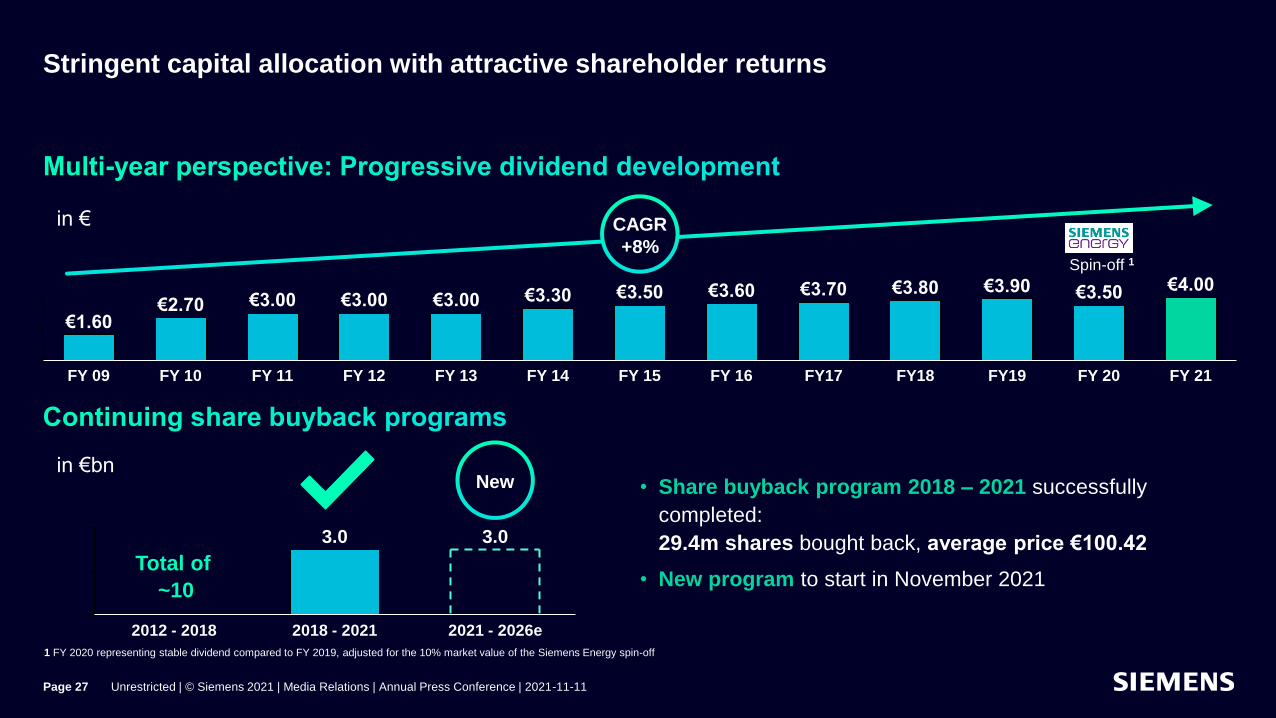
Stringent capital allocation with attractive shareholder returns
Page 27
FY 16FY 10 FY19FY 13
€1.60
FY 11FY 09 FY 12
€2.70
FY 21FY 14 FY 15 FY17 FY18
€3.00
FY 20
€3.00 €3.00 €3.30 €3.50 €3.60 €3.70 €3.80 €3.90 €3.50 €4.00
CAGR
+8%
2012 - 2018 2018 - 2021
3.0 3.0
2021 - 2026e
New
Total of
~10
• Share buyback program 2018 – 2021 successfully
completed:
29.4m shares bought back, average price €100.42
• New program to start in November 2021
Spin-off 1
in €
in €bn
1 FY 2020 representing stable dividend compared to FY 2019, adjusted for the 10% market value of the Siemens Energy spin-off
Unrestricted | © Siemens 2021 | Media Relations | Annual Press Conference | 2021-11-11
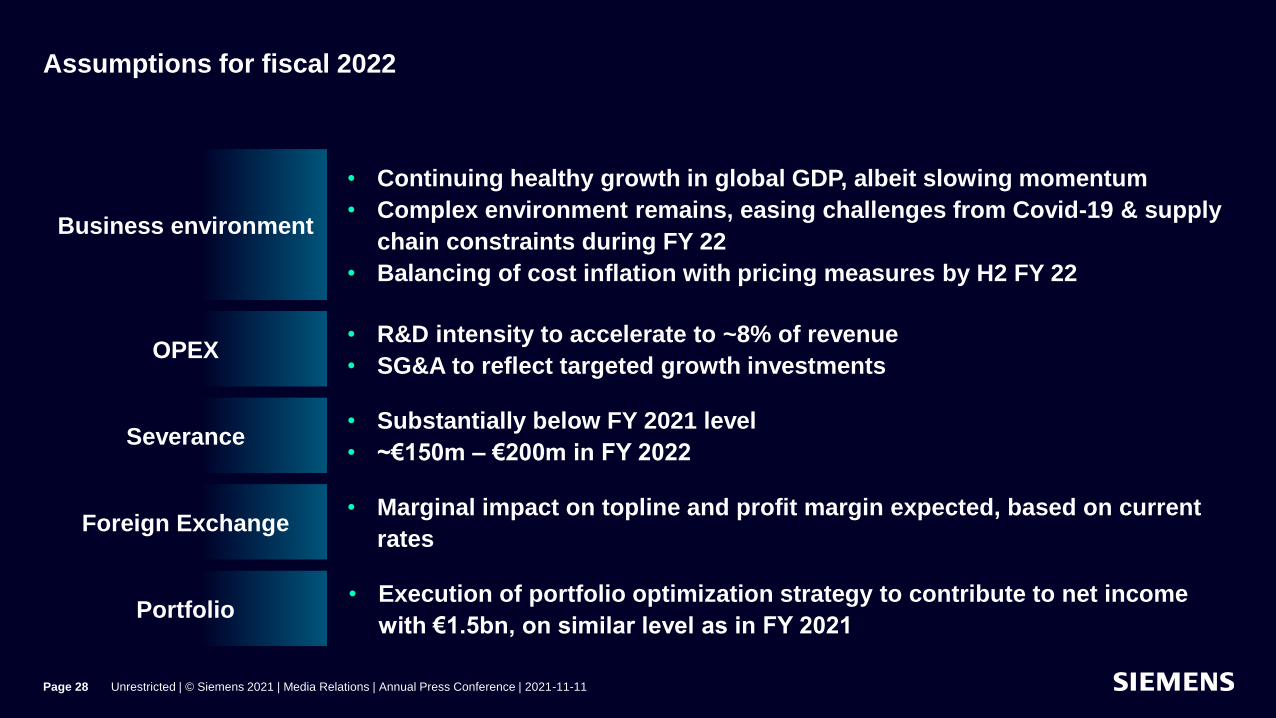
Assumptions for fiscal 2022
Page 28
Business environment
OPEX
Severance
Foreign Exchange
• Continuing healthy growth in global GDP, albeit slowing momentum
• Complex environment remains, easing challenges from Covid-19 & supply
chain constraints during FY 22
• Balancing of cost inflation with pricing measures by H2 FY 22
• R&D intensity to accelerate to ~8% of revenue
• SG&A to reflect targeted growth investments
• Substantially below FY 2021 level
• ~€150m – €200m in FY 2022
• Marginal impact on topline and profit margin expected, based on current
rates
Portfolio• Execution of portfolio optimization strategy to contribute to net income
with €1.5bn, on similar level as in FY 2021
Unrestricted | © Siemens 2021 | Media Relations | Annual Press Conference | 2021-11-11
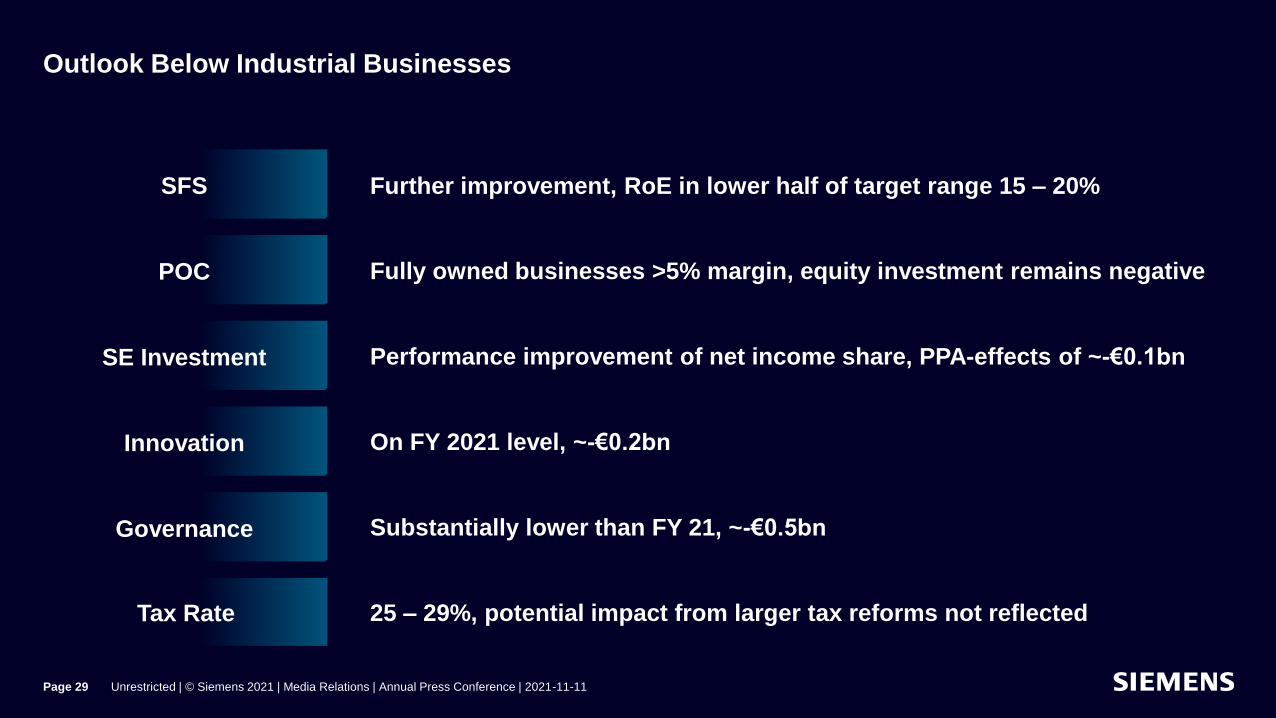
Outlook Below Industrial Businesses
Page 29
SFS
POC
SE Investment
Further improvement, RoE in lower half of target range 15 – 20%
Fully owned businesses >5% margin, equity investment remains negative
Performance improvement of net income share, PPA-effects of ~-€0.1bn
Tax Rate 25 – 29%, potential impact from larger tax reforms not reflected
Innovation On FY 2021 level, ~-€0.2bn
Governance1) Substantially lower than FY 21, ~-€0.5bn
SFS
POC
SE Investment
Innovation
Governance
Unrestricted | © Siemens 2021 | Media Relations | Annual Press Conference | 2021-11-11
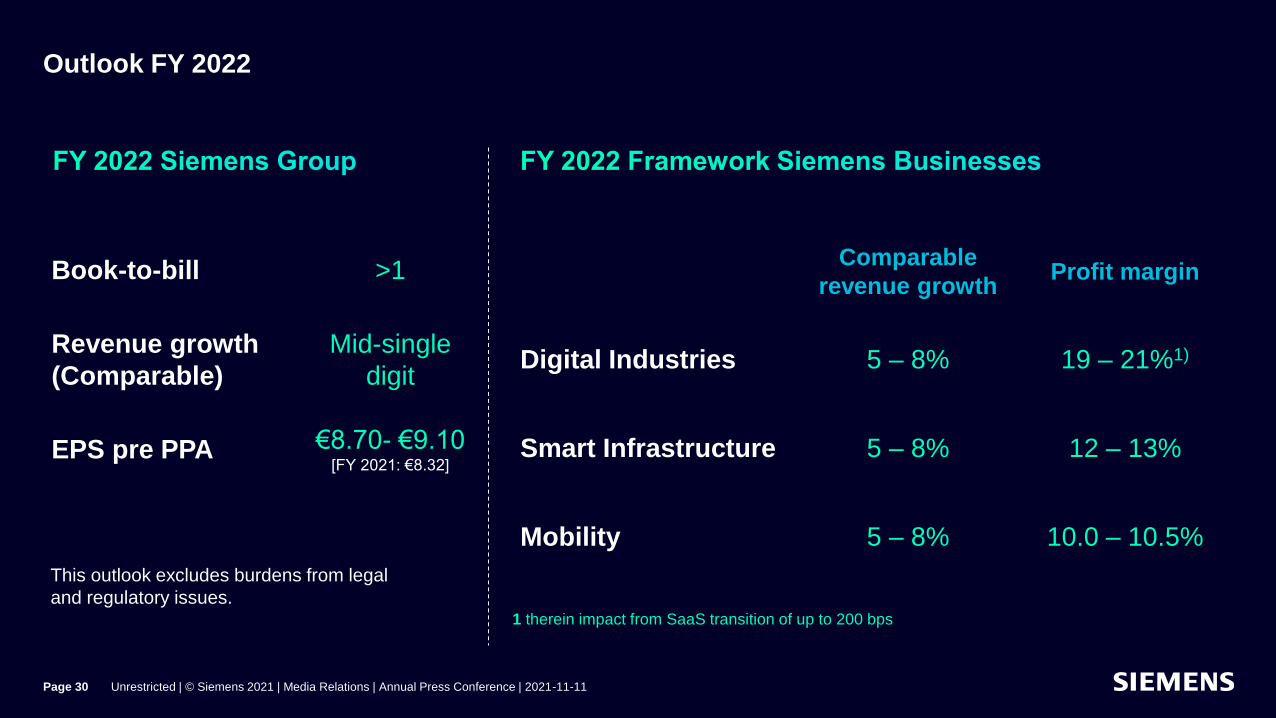
Outlook FY 2022
Comparable
revenue growthProfit margin
Digital Industries 5 – 8% 19 – 21%1)
Smart Infrastructure 5 – 8% 12 – 13%
Mobility 5 – 8% 10.0 – 10.5%
This outlook excludes burdens from legal
and regulatory issues.
Page 30
Book-to-bill >1
Revenue growth
(Comparable)
Mid-single
digit
EPS pre PPA €8.70- €9.10[FY 2021: €8.32]
1 therein impact from SaaS transition of up to 200 bps
Unrestricted | © Siemens 2021 | Media Relations | Annual Press Conference | 2021-11-11
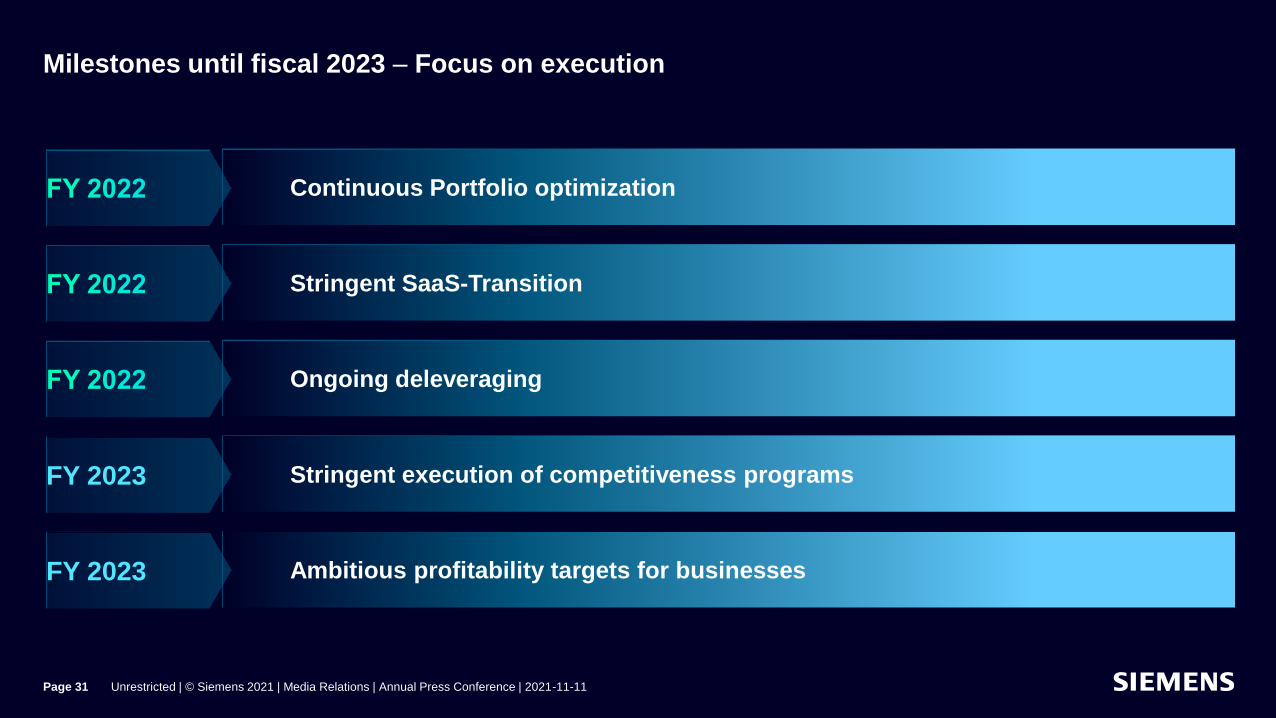
Milestones until fiscal 2023 – Focus on execution
Page 31
Continuous Portfolio optimization
Stringent SaaS-Transition
Ongoing deleveraging
Stringent execution of competitiveness programsFY 2023
Ambitious profitability targets for businessesFY 2023
Unrestricted | © Siemens 2021 | Media Relations | Annual Press Conference | 2021-11-11

Appendix
Page 32 Unrestricted | © Siemens 2021 | Media Relations | Annual Press Conference | 2021-11-11

Below Industrial BusinessesPortfolio Companies break even, significant Thoughtworks revaluation gain
€m
120 3
4
47
60
-195
-571
Elim., Corp.
Treasury,
Others
TaxCorp. Items,
Pensions
Inc. Cont.
Ops
PPA
1,167
Net Income
-224
SRESE
Investment
Disc. Ops.IB
-187
2,273
1,269 1,330
SFS POC
Therein:
+€260m
Revaluation gain
Thoughtworks
-€60m
Revised estimates
related to provisions
for legacy project
-€39m
Pensions
Minorities
€163m
Tax Rate
@ 31%
Page 33 Unrestricted | © Siemens 2021 | Media Relations | Annual Press Conference | 2021-11-11
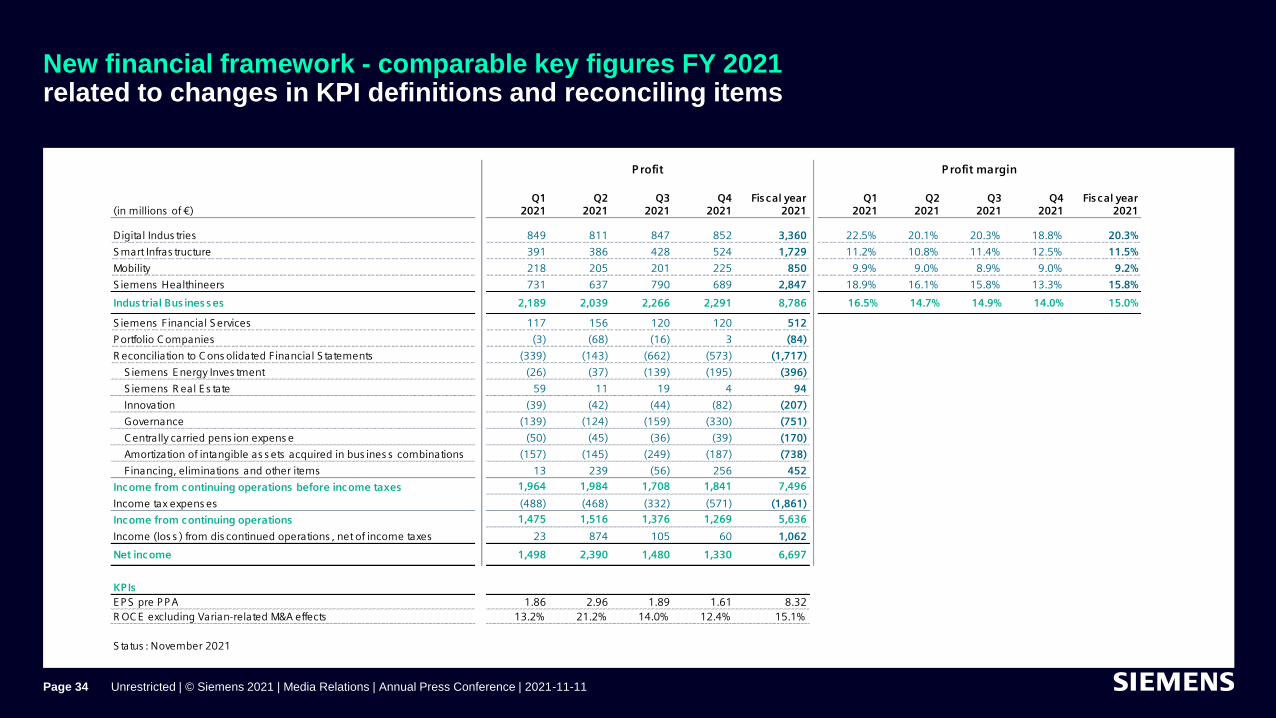
New financial framework - comparable key figures FY 2021related to changes in KPI definitions and reconciling items
Page 34
Q1 Q2 Q3 Q4 Fis cal year Q1 Q2 Q3 Q4 Fis cal year(in millions of €) 2021 2021 2021 2021 2021 2021 2021 2021 2021 2021
Digital Indus tries 849 811 847 852 3,360 22.5% 20.1% 20.3% 18.8% 20.3%
S mart Infras tructure 391 386 428 524 1,729 11.2% 10.8% 11.4% 12.5% 11.5%
Mobility 218 205 201 225 850 9.9% 9.0% 8.9% 9.0% 9.2%
S iemens Healthineers 731 637 790 689 2,847 18.9% 16.1% 15.8% 13.3% 15.8%
Indus trial Bus ines s es 2,189 2,039 2,266 2,291 8,786 16.5% 14.7% 14.9% 14.0% 15.0%
S iemens Financial S ervices 117 156 120 120 512
P ortfolio C ompanies (3) (68) (16) 3 (84)
R econciliation to C ons olidated Financial S tatements (339) (143) (662) (573) (1,717)
S iemens E nergy Inves tment (26) (37) (139) (195) (396)
S iemens R eal E s tate 59 11 19 4 94
Innovation (39) (42) (44) (82) (207)
Governance (139) (124) (159) (330) (751)
C entrally carried pens ion expens e (50) (45) (36) (39) (170)
Amortization of intangible as s ets acquired in bus ines s combinations (157) (145) (249) (187) (738)
Financing, eliminations and other items 13 239 (56) 256 452
Income from continuing operations before income taxes 1,964 1,984 1,708 1,841 7,496
Income tax expens es (488) (468) (332) (571) (1,861)
Income from continuing operations 1,475 1,516 1,376 1,269 5,636
Income (los s ) from dis continued operations , net of income taxes 23 874 105 60 1,062
Net income 1,498 2,390 1,480 1,330 6,697
KPIs
E P S pre P P A 1.86 2.96 1.89 1.61 8.32
R OC E excluding Varian-related M&A effects 13.2% 21.2% 14.0% 12.4% 15.1%
S tatus : November 2021
P rofit P rofit margin
Unrestricted | © Siemens 2021 | Media Relations | Annual Press Conference | 2021-11-11
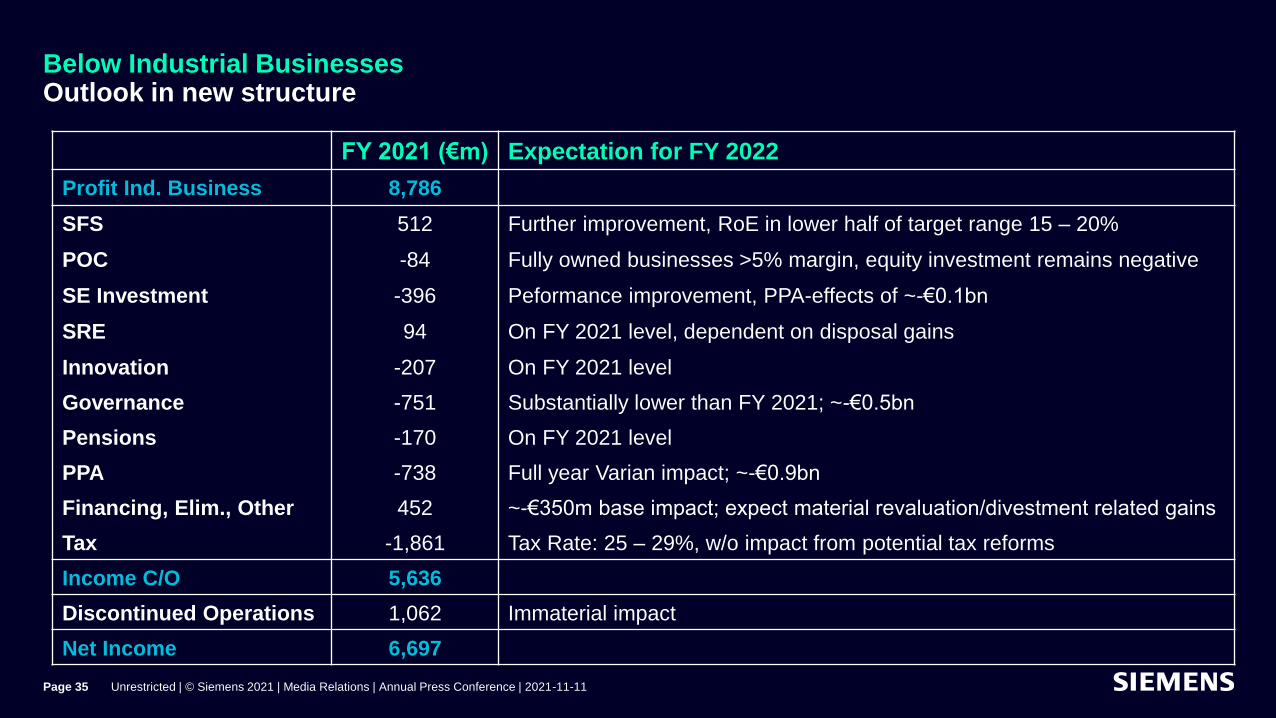
Below Industrial BusinessesOutlook in new structure
FY 2021 (€m) Expectation for FY 2022
Profit Ind. Business 8,786
SFS 512 Further improvement, RoE in lower half of target range 15 – 20%
POC -84 Fully owned businesses >5% margin, equity investment remains negative
SE Investment -396 Peformance improvement, PPA-effects of ~-€0.1bn
SRE 94 On FY 2021 level, dependent on disposal gains
Innovation -207 On FY 2021 level
Governance -751 Substantially lower than FY 2021; ~-€0.5bn
Pensions -170 On FY 2021 level
PPA -738 Full year Varian impact; ~-€0.9bn
Financing, Elim., Other 452 ~-€350m base impact; expect material revaluation/divestment related gains
Tax -1,861 Tax Rate: 25 – 29%, w/o impact from potential tax reforms
Income C/O 5,636
Discontinued Operations 1,062 Immaterial impact
Net Income 6,697
Page 35 Unrestricted | © Siemens 2021 | Media Relations | Annual Press Conference | 2021-11-11

Reconciliation FY 21 EPS to EPS pre PPA
Page 36
€m / per share amounts in € All in Attributable to
non-controlling
interests
Attributable to
shareholders of
Siemens AG
EPS / EPS
effect 4)
Net income / EPS (all-in) 6,697 537 6,161 7.68
PPA 1) 738 61 2) 677 0.84
Tax effect 3) -169 -0.21
EPS pre PPA 8.32
1 PPA on intangible assets; pre-tax
2 Based on Siemens Healthineers PPA of €259m and minority shareholding of 21% in H1 and 25% in H2
3 Tax effect on PPA add-back based on 25% tax rate
4 802m shares outstanding
Outlook FY 22: PPA adjustment net of taxes expected to increase by ~€0.10 vs prior year
Unrestricted | © Siemens 2021 | Media Relations | Annual Press Conference | 2021-11-11
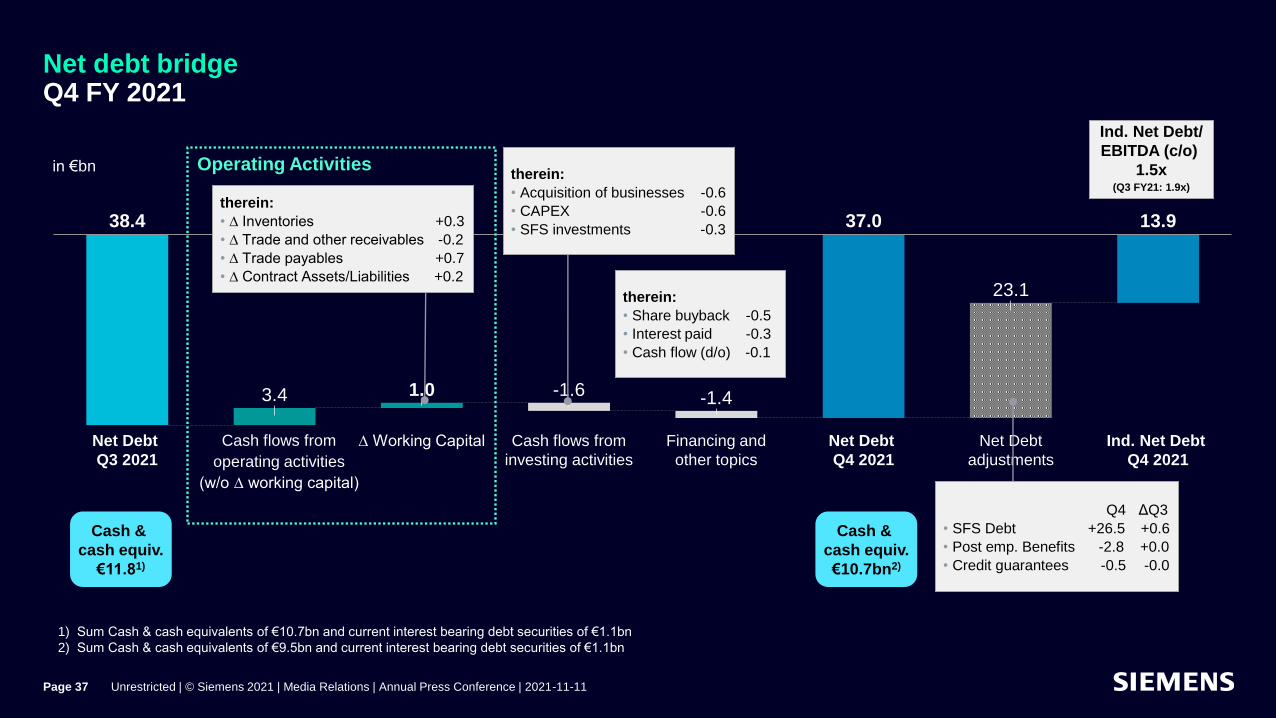
Net debt bridgeQ4 FY 2021
-1.4
∆ Working Capital Ind. Net Debt
Q4 2021
Net Debt
Q3 2021
3.4 1.0 -1.6
Cash flows from
investing activities
Financing and
other topics
Net Debt
Q4 2021
23.1
Net Debt
adjustments
38.4 37.0 13.9
Q4 ΔQ3
• SFS Debt +26.5 +0.6
• Post emp. Benefits -2.8 +0.0
• Credit guarantees -0.5 -0.0
Ind. Net Debt/
EBITDA (c/o)
1.5x(Q3 FY21: 1.9x)
Cash &
cash equiv.
€11.81)
Cash &
cash equiv.
€10.7bn2)
Operating Activitiesin €bn
Cash flows from
operating activities
(w/o ∆ working capital)
1) Sum Cash & cash equivalents of €10.7bn and current interest bearing debt securities of €1.1bn
2) Sum Cash & cash equivalents of €9.5bn and current interest bearing debt securities of €1.1bn
therein:
• Acquisition of businesses -0.6
• CAPEX -0.6
• SFS investments -0.3
therein:
• ∆ Inventories +0.3
• ∆ Trade and other receivables -0.2
• ∆ Trade payables +0.7
• ∆ Contract Assets/Liabilities +0.2
Page 37
therein:
• Share buyback -0.5
• Interest paid -0.3
• Cash flow (d/o) -0.1
Unrestricted | © Siemens 2021 | Media Relations | Annual Press Conference | 2021-11-11
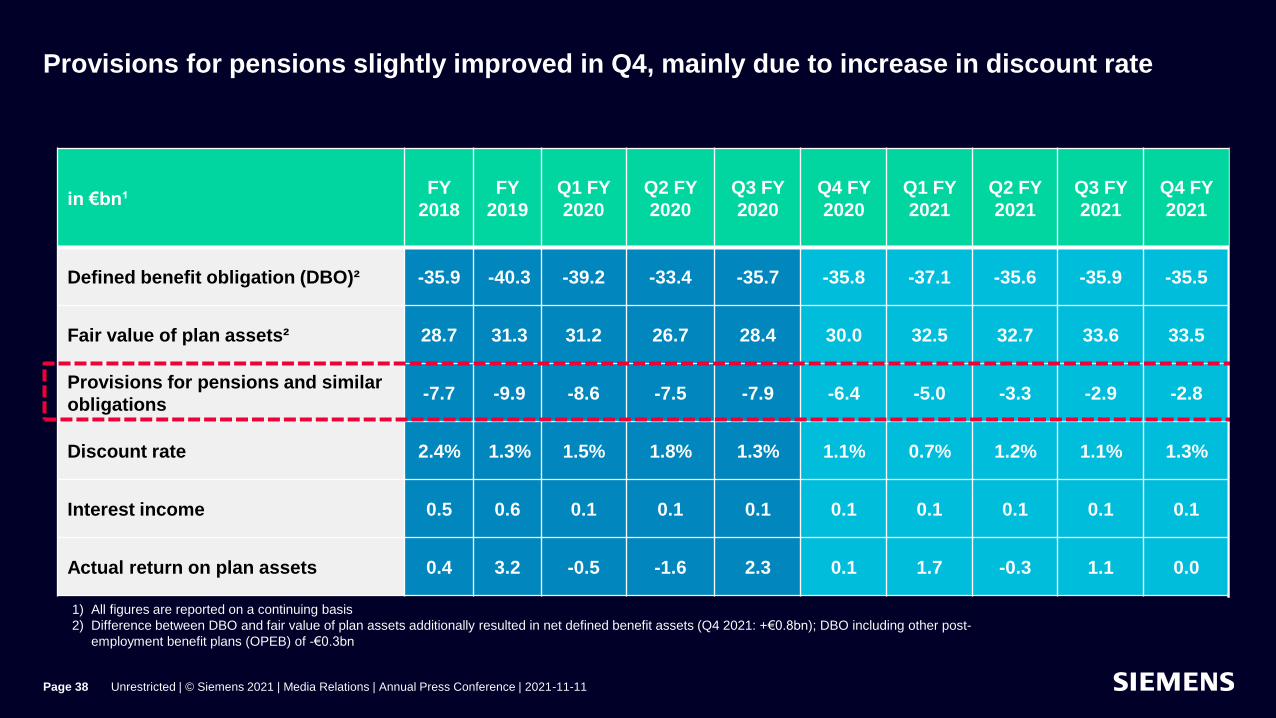
Provisions for pensions slightly improved in Q4, mainly due to increase in discount rate
Page 38
Q FY 2020 – Pensions and similar obligations
1) All figures are reported on a continuing basis
2) Difference between DBO and fair value of plan assets additionally resulted in net defined benefit assets (Q4 2021: +€0.8bn); DBO including other post-
employment benefit plans (OPEB) of -€0.3bn
in €bn¹FY
2018
FY
2019
Q1 FY
2020
Q2 FY
2020
Q3 FY
2020
Q4 FY
2020
Q1 FY
2021
Q2 FY
2021
Q3 FY
2021
Q4 FY
2021
Defined benefit obligation (DBO)² -35.9 -40.3 -39.2 -33.4 -35.7 -35.8 -37.1 -35.6 -35.9 -35.5
Fair value of plan assets² 28.7 31.3 31.2 26.7 28.4 30.0 32.5 32.7 33.6 33.5
Provisions for pensions and similar
obligations-7.7 -9.9 -8.6 -7.5 -7.9 -6.4 -5.0 -3.3 -2.9 -2.8
Discount rate 2.4% 1.3% 1.5% 1.8% 1.3% 1.1% 0.7% 1.2% 1.1% 1.3%
Interest income 0.5 0.6 0.1 0.1 0.1 0.1 0.1 0.1 0.1 0.1
Actual return on plan assets 0.4 3.2 -0.5 -1.6 2.3 0.1 1.7 -0.3 1.1 0.0
Unrestricted | © Siemens 2021 | Media Relations | Annual Press Conference | 2021-11-11

Profit Bridge from SHS disclosure to SAG disclosureDifferent profit definitions at SHS and SAG to be considered in models
Page 39
€m Q4 FY21 FY21
SHS EBIT (adjusted) 793 15.3% 3,142 17.4%
PPA (SHS logic)1 -141 -381
Transaction, Integration, Retention, carve-out cost -14 -123
Gains and losses from divestments +3 +3
Severance -19 -68
SHS EBIT (as-reported) 623 12.1% 2,573 14.3%
PPA (SAG logic)2 +65 +259
Financial Income -3 -0
Consolidation / Accounting Differences +2 +15
SAG adj. EBITA (as reported) 686 13.3% 2,847 15.8%
Severance +19 +68
SAG adj. EBITA (excl. severance) 705 13.6% 2,914 16.2%
1 PPA on intangible assets as well as other effects from IFRS 3 PPA adjustments
2 PPA on intangible assets
Unrestricted | © Siemens 2021 | Media Relations | Annual Press Conference | 2021-11-11

Page 40
Q4 FY2021Unrestricted © Siemens Healthineers AG, 2021 l 8
Outlook FY2022
Comparable revenue growth1, 2 Adj. basic earnings per share2
• Imaging growth at 5 to 8%
• Diagnostics growth down to mid-teens negative growth with antigen revenue assumed at €~200m in FY22, growth ex antigen at 2 to 4%
• Varian adjusted revenue3 at €2.9 to €3.1bn in FY22, growth1
at low teens, contributing to comparable growth in H2 only
• Advanced Therapies growth at 5 to 8%
• Imaging margin at 22 to 23%
• Diagnostics margin in the high-single digits, margin ex antigen in the mid- to high-single digits
• Varian margin at 15 to 17%
• Advanced Therapies margin at 14 to 17%
• Financial income, net at €-50m to €-70m
• Tax rate at 27 to 29%
2022E
~7.5%
2021
19.3%
2021
~€0.30
€2.03
2022E
1 Year-over-year on a comparable basis, excluding currency translation and portfolio effects as well as effects in line with revaluation of contract liabilities from IFRS 3 purchase price allocations | 2 The outlook is based on current foreign exchange rate assumptions and on the current portfolio | 3 Adjusted for effects in line with revaluation of contract liabilities from IFRS 3 PPA
€2.08 to €2.20
0 to 2%
Ex antigen: 5 to 7%
Growth ex antigen: 17 to 23%
Antigen accretion
Antigen accretion
Outlook FY 2022 as presented by Siemens
Healthineers on November 4, 2021
Unrestricted | © Siemens 2021 | Media Relations | Annual Press Conference | 2021-11-11
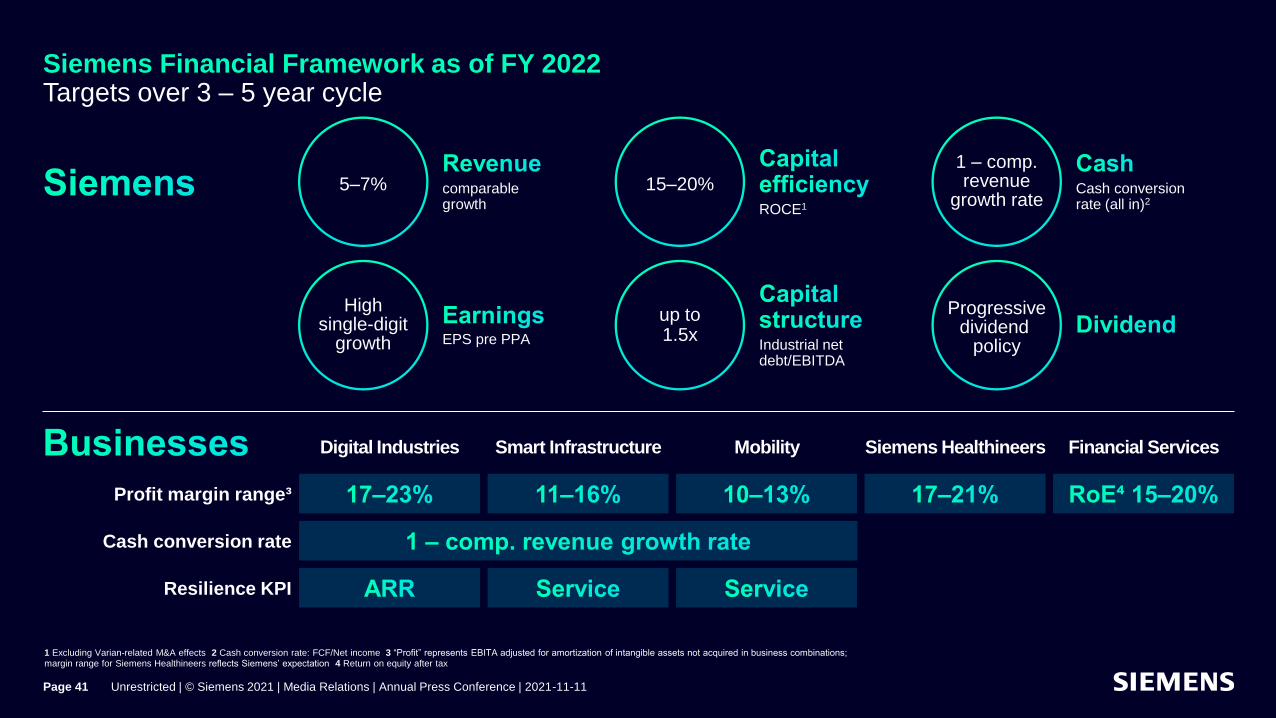
Siemens Financial Framework as of FY 2022Targets over 3 – 5 year cycle
Page 41
comparable growth ROCE1
Cash conversion rate (all in)2
EPS pre PPA Industrial net debt/EBITDA
5–7% 15–20%
1 – comp.revenue
growth rate
Highsingle-digit
growth
up to1.5x
Progressivedividend
policy
Digital Industries Smart Infrastructure Mobility Siemens Healthineers Financial Services
Profit margin range³
Cash conversion rate
Resilience KPI
1 Excluding Varian-related M&A effects 2 Cash conversion rate: FCF/Net income 3 “Profit” represents EBITA adjusted for amortization of intangible assets not acquired in business combinations; margin range for Siemens Healthineers reflects Siemens’ expectation 4 Return on equity after tax
Unrestricted | © Siemens 2021 | Media Relations | Annual Press Conference | 2021-11-11

Business and financial media
Florian Martens +49 162 230 6627
Simon Friedle +49 1525 215 9076
Daniela Markovic +49 172 699 8785
Internet siemens.com/press
Email [email protected]
Unrestricted | © Siemens 2021 | Media Relations |Annual Press Conference | 2021-11-11Page 42