stellar diamonds annual report 2011
DESCRIPTION
Stellar Diamonds Annual Report 2011TRANSCRIPT

STELLARDIAMONDS PLC
Building a leading diamond company in West Africa
ANNUAL REPORT & ACCOUNTS 2011

Stellar Diamonds plc (AIM:STEL) is focussed on developing significant diamondresources from two key kimberlite assets in West Africa. The Company iscurrently establishing maiden resource estimates on the Droujba kimberlitepipe in Guinea and the Tongo kimberlite dyke in Sierra Leone, with both thesekimberlites demonstrating multi-million carat potential. In addition, Stellar hasbeen mining diamonds on the Mandala and Bomboko projects in Guinea forover two years, with diamond production having exceeded 134,000 carats to date.
STELLARDIAMONDS PLC
CONTENTS
OVERVIEW01 Highlights02 At a Glance04 Chairman’s Statement
BUSINESS REVIEW06 Chief Executive’s Statement08 Diamond Market Outlook09 Corporate Social Responsibility10 Droujba12 Tongo14 Mandala16 Kono + Bouro17 Bomboko
GOVERNANCE18 Board of Directors20 Key Management22 Directors’ Report24 Statement of Directors’ Responsibilities
FINANCIAL STATEMENTS25 Independent Auditor’s report26 Consolidated Statement of
comprehensive income27 Consolidated statement of financial position28 Consolidated statement of changes in equity29 Consolidated statement of cash flow30 Notes to the consolidated financial statements
ANNUAL REPORT & ACCOUNTS 2011

OPERATIONAL HIGHLIGHTS
DROUJBA
Drilling has significantly increased size and depth extension
of kimberlite pipe
Significant tonnage potential and remains open at below 400m depth
Processing plant being established on site for bulk sampling
Maiden resource statement expected Q1-2012
TONGO
Bulk sampling yielded grade of 101cpht
High quality diamonds, parcel of 949 carats valued at $185 per carat
Resource drilling commenced
Maiden resource statement expected Q1-2012
PRODUCTION
42,000 carats produced from Mandala
1,000 carats produced from Bomboko
Bomboko closed and plant relocated to Droujba for resource
estimation
FINANCIAL
$10 million equity financing in March 2011
Stellar fully funded to complete resource estimation work on
Droujba and Tongo
Debt free
DROUJBARESOURCEestimation in progress
TONGORESOURCEestimation in progress
$10 MILLIONraised in March 2011 - fully funded
43,000 CARATSproduced in financial year
$1.5 MILLIONrevenue in financial year
HIGHLIGHTS
01
OVERVIEW
ANNUAL REPORT AND ACCOUNTS 2011 STELLAR DIAMONDS PLC

02
OVERVIEW
SIGNIFICANT DIAMOND RESOURCE ESTIMATESBEING ESTABLISHED
DROUJBA
Location: GuineaStatus: Resource estimation
Drilling has revealed the Droujbakimberlite pipe to be over three times theoriginal size estimate at 3-hectares andthe pipe remains open at depth below thedeepest intersection (to date) of 400m.Independent geological modellingestimates that the Droujba pipe hassignificant tonnage potential with over 15million tonnes so far drilled out to a depthof 350m (not yet a compliant resourcestatement). Historical mining indicates thatthe pipe is high grade (over 100cpht) andStellar is currently establishing a DMSprocessing plant on site and willcommence bulk sampling as part of the resource estimation programme.
TONGO
Location: Sierra LeoneStatus: Resource estimation
A 1,600 tonne bulk sample of the 2.5kmlong Dyke 1 kimberlite has been processedand yielded an average grade of 101cpht.A parcel of 948 carats exported toAntwerp was valued at an average of $185per carat per carat. This would suggestthat the in-situ value for the Dyke 1kimberlite approaching $200 per tonne.The kimberlite is currently being drilledout to over 200m in depth and furtherbulk samples are in the process of beingcollected and processed as part of themaiden resource estimate programme.
MANDALA
Location: GuineaStatus: Production
Mining of the established diamondresource has continued with productionnow exceeding 128,000 carats sincemining commenced in April 2009.Production for the current financial yearwas 42,000 carats at an average grade of23cpht. More recently however, gradesrunning consistently over 50cpht havebeen achieved as a new and previouslyinaccessible mining area was opened up.
Stellar has an advanced portfolio of diamondassets in Guinea and Sierra Leone, in the heartof the renowned diamond area of the ManCraton. These projects are the culmination of ten years of exploration, discovery anddevelopment in a region that still remainsvastly under-explored for diamonds.
The strategy of the Company is currently focussed ongenerating substantial diamond resources in the Droujbakimberlite pipe and Tongo kimberlite dyke swarm throughdetailed drilling and large scale bulk sampling. A significantamount of work has already been completed and maidenresource statements are expected in the first quarter of 2012.CAE Mining has been appointed as the independentconsultant and competent person to verify, establish, and sign off on the resource statements.
ANNUAL REPORT AND ACCOUNTS 2011STELLAR DIAMONDS PLC

03
KONO
Location: Sierra LeoneStatus: Trial mining (care and maintenance)
Trial mining at Kono has yet to re-commence. However the Company hasconducted further surface exploration andis in the process of collecting andprocessing a 300 tonne bulk sample fromthe Lion-5 kimberlite dyke which, fromprevious work undertaken by Stellar, has a grade of around 100cpht and highdiamond quality.
BOURO
Location: GuineaStatus: Bulk sampling
Previous work by De Beers andmicrodiamond analysis by Stellar suggestsa grade of over 400cpht for the 5km longBouro North dyke, however bulk samplingby Stellar from one centrally located sitehas returned an initial grade of 243cpht.The 550 carats produced are in Antwerpawaiting sale.
BOMBOKO
Location: GuineaStatus: Project closed
Trial mining at Bomboko was completed in early 2011 with disappointing results.Although the diamond value achieved wasin excess of $200 per carat the low graderendered the project uneconomic toadvance the project to full scale mining.The processing plant has recently beenrelocated to Droujba where it will processkimberlite as part of the resourceestimation programme.
ANNUAL REPORT AND ACCOUNTS 2011 STELLAR DIAMONDS PLC

04
Drilling at Droujba has rewarded us with a larger kimberlite than originallyenvisaged and independent geologicalmodelling of the pipe has demonstratedthat amulti-million tonne resource isevident. Considering that historicalmining of the pipe in the 1960’s yieldedhigh grades of over 100cpht, this isparticularly encouraging and reinforcesour belief that in Droujba we potentiallyhave an economic resource on our hands.
At Tongo we have continued to reportexciting bulk sampling grades comfortablyin excess of 100cpht with high diamondvalues evident. Drilling is now continuingto define the resource in the ground,which we hope to be sufficient for apositive economic scoping study once the resource has been confirmed.
Although we have continued to producediamonds at Mandala, we took thestrategic decision to cease trial mining atBomboko as the grades were insufficientto prove sustainably economic. Thisenabled us to relocate the many physicalassets and experienced personnel toDroujba where we are now in the processof establishing a fully functional DMSprocessing plant to undertake bulksampling of the Droujba pipe over thecoming months.
In March this year Stellar completed a $9.9 million (£6.2 million) equity financing,which at the time was heavilyoversubscribed. These funds have givenStellar the necessary financial means ofachieving its objective in delivering themaiden resource estimates for Tongo andDroujba as well as progressing our otherhigh interest kimberlite projects at Kono and Bouro.
For the year ended 30 June 2011, theGroup incurred an operating loss beforeinterest and tax of $6.25m (2010: $5.40m)before an impairment charge of $8.6million (2010: nil). The operating loss is inline with the Board’s expectations giventhe Group’s stage of development. Theimpairment charge is an accounting itemresulting from the Board’s decision to ceasemining at Bomboko and the reducedestimate of commercially minableresource at Mandala. At the balance sheetdate, the Group had net assets of $21.1million, including cash and cashequivalents of $6.5 million, and no debt.
CHAIRMAN’SSTATEMENT
Dear Shareholder,The past year has been a successful one for your company in that we have moved closer to our stated objective ofdeclaring significant diamond resources on our kimberliteassets. Considerable work has been completed and we areon track to deliver maiden resource estimates on Droujbaand Tongo during the first quarter of 2012.
OVERVIEW
ANNUAL REPORT AND ACCOUNTS 2011STELLAR DIAMONDS PLC

05
The diamond market has been very strongfor most of the year with many companiesreporting record prices for roughdiamonds. Whilst the longer term pricingoutlook remains very bullish, the recenteconomic volatility and worries aboutsovereign and bank debt have resulted in a retracement of rough and polisheddiamond prices from these record highs.However, there is still very strong diamonddemand in India and China which are themain growth areas and we expect this tocontinue. Therefore, we still believe thatalthough there will be periods of priceweakness, as currently being experienced,the longer term trend for diamond priceswill be upwards driven by strong consumerdemand and lack of new production.
Your Company continues to strive todeliver on its strategic objectives and themanagement and team on the groundhave achieved considerable success. I would personally like to thank everyonein the Stellar team for their dedication and hard work this past twelve months.With the continued support of the Boardand the shareholders I am certain that theywill realise further success and that we willbe able to announce positive resourcestatements in early 2012.
Finally I would like once again to thankshareholders for their continued support.In a market environment such as this werealise that your support can bechallenged when there is so muchvolatility and a loss of value. However, we believe that the quality of our diamondportfolio will ultimately unlock significantvalue and I can confirm that we are well on the way to achieving that.
The current year will therefore be pivotalfor Stellar as we announce what we hopeto be significant resources on Droujba andTongo and then take these projects to thenext level of development and hopefullyinto future production.
PETER DARESBURYNON-EXECUTIVE CHAIRMAN
Chairman Peter Daresbury and COO Rowan Carr
ANNUAL REPORT AND ACCOUNTS 2011 STELLAR DIAMONDS PLC

06
BUSINESS REVIEW
CEO’SSTATEMENT
As planned, Stellar has rapidly advanced work on the Droujba and Tongo kimberlite projects and in the processhas generated exceptional results. We are on track to delivermaiden resource statements on both projects in the firstquarter of 2012 and we expect that these will provide thecatalyst for significant value accretion.
Our strategic focus this past financial yearhas been on drilling and bulk sampling toestablish diamond content and value forour key kimberlite projects of Droujba, insoutheast Guinea and Tongo, in easternSierra Leone. We have achieved consider-able success on both these projects.
We have recently appointed CAE Mining toverify our past work and oversee theprogrammes going forward and in Dr.Matthew Field we have retained the skillsof one of the most renowned kimberliteresource geologists in the world toindependently sign off the resourcestatements as Competent Person.
At Droujba the model of the pipe, asreported by the Russian Aid Mission duringtheir mining in the 1960’s, suggested aresource body of less than 1 hectare insize which tapered out at a mere 20mbelow surface, the depth to which theRussians mined the pipe before exitingGuinea. We were never convinced of thisand our work has thoroughly disprovedthis theory. In fact we have far exceededexpectations and have proven thekimberlite to be three hectares in size onsurface. The pipe has so far been drilled toa depth of 388m below surface and itcertainly continues beyond that.
Independent geological modelling hasdefined 15 million tonnes of hypabyssaland kimberlite breccia in the Droujba pipeto a depth of 350m and we have everyintention of significantly increasing thisand converting it into a JORC compliantresource by early 2012. This will require usto bulk sample the pipe and recover astatistically representative diamond parcelfrom the pipe for grade and valuationestimation. We are currently in the processof building a modern DMS sampling planton site and should commence bulksampling towards the end of 2011.
At Tongo we have been bulk sampling the2.5km long Dyke 1 which has consistentlyyielded average diamond grades of over100cpht. Two parcels totalling almost 949carats have been exported to Antwerp andvalued at an average price of $185 percarat. At these grades and values we aredealing with kimberlite ore that ispotentially valued at upto $200 per tonne,which would make it one of the highestvalue kimberlite ores worldwide.
ANNUAL REPORT AND ACCOUNTS 2011STELLAR DIAMONDS PLC

07
Two drill rigs are now active at Tongo todrill out resource tonnes and bulksampling will continue so that we canestablish an initial resource estimate by thefirst quarter of 2012.
We believe that independent resourceestimates for Droujba and Tongo mayresult in a re-rating for Stellar andrecognition for the significant value wewill have created in the project. CAEMining will independently sign off on bothresources and will also undertake pre liminary economic scoping studies.This will form the basis of motivation forfuture work which would be to take bothprojects to the next level of resourcedevelopment and we hope eventually intocommercial production.
Concurrent with this work we havecontinued to mine at Mandala whereproduction has now exceeded 128,000carats sold at over $4 million. Productionwas erratic earlier in the year as adverseweather conditions forced mining intolower grade areas, but over the past fewmonths we have accessed the N’KeliyaniRiver resource area where average gradesof over 1 carat per cubic metre (55cpht)are being experienced. We will continue to mine this area as long as it remainsmodestly profitable.
Unfortunately our evaluation and trialmining at Bomboko was not successful.Although very well executed by ourgeological teams, the recovered gradeswere just too small to prove economic,even with a realised diamond value inexcess of $200 per carat. However, thisgave us the opportunity to re-allocate thesignificant amount of capital, plant,earthmoving equipment, campinfrastructure etc, to Droujba whichsignificantly reduced the capitalrequirement on that project. Oncerehabilitation of the Bomboko mined areasis completed the Company will return thelicences to the Government of Guinea.
We have also managed to undertake someexploration work on Bouro and Konothough this has not been significant.However, bulk sampling of Bouro wassuccessfully completed on one site where550 carats were produced giving a highdiamond grade of 243cpht for the 5kmlong Bouro North Dyke. At Kono,preparations have been made to collect a300 tonne bulk sample of the Lion-5 Dykewhich previously yielded excellent qualitydiamonds and a high grade from twosmall one tonne samples.
The acceleration of the work programmeswas made possible by a £6.2 millionfinancing in March and I would like tothank all shareholders for their support inthis successful fund raise. Current marketconditions remain volatile and uncertain,but Stellar has the necessary financialmeans to complete the resourceestimation work at Droujba and Tongo. Asfurther development of assets is warrantedon the basis of positive resource statementsand economic scoping studies, Stellar willrequire additional funding. However, thiswould be a very positive outcome and willessentially mean that there is clear eco-nomic potential at Droujba and/or Tongo.
The macro-outlook for the diamondsector remains very bullish as dwindlingsupplies and increased consumer demand,particularly from China and India, drivemarket forces. There will be times of priceweakness, as we are currentlyexperiencing, but Stellar takes a longerterm strategic view that the supply anddemand fundamentals remain in favour ofhigher diamond prices and consequentlydiamond producers.
Our strategy therefore remainsunchanged. Stellar intends to become a significant diamond producer within five years.
There are clearly inherent risks of doingbusiness in West Africa, such as a revisedmining code in Guinea, continued calls forresource nationalisation in some parts ofAfrica and the general logistical challengesthat present themselves on the ground.However, we believe that the quality ofour assets presently outweighs these ris ksand there is great opportunity in bothSierra Leone and Guinea. Stellar has beenat the forefront of diamond explorationand development in both these countriesfor a number of years and now it is clearthat this early risk taking is reaping therewards it deserves.
Your Stellar team has once again shownconsiderable dedication and resilience inadvancing its projects diligently,professionally and safely. Driven by theunending enthusiasm of COO RowanCarr, and with the support of the Boardand shareholders alike, I feel comfortablethat we will be able to deliver on ourstrategy to the benefit of all stakeholders.
My sincere thanks once againare extended to everyoneassociated with Stellar and I look forward to being able toreport on further success asthe current year progresses.
KARL SMITHSONCHIEF EXECUTIVE OFFICER
ANNUAL REPORT AND ACCOUNTS 2011 STELLAR DIAMONDS PLC
Chairman and CEO onsite at Kono
Management team in front of Droujba pit

DIAMOND MARKETOUTLOOK
08
BUSINESS REVIEW
The outlook for the rough and polisheddiamond markets remains extremelyrobust. Rough prices have returned to, orare now exceeding the pre-crisis levels of2008 with all major producers reportingrecord prices and gains in the first half of2011 of up to 50%. However, in Augustand September the market correctedsomewhat, mainly as a consequence ofbuyer resistance to elevated rough pricesand economic worries resurfacing. Thesector sees this correction as overdue and prices going forward are expected to stabilise with the rest of 2011 and 2012unlikely to repeat the gains of thepreceding 18 months.
In the longer term, however, the diamondmarket is still forecast to have a significantsupply deficit. Although annual productionincreased slightly in 2010 to 133 millioncarats and RBC Capital Markets forecastthis to increase to 140 million carats asnew production comes on line, this is stillwell below the peak of 160 million caratsseen earlier in the decade. With existingmines becoming depleted or goingunderground annual diamond productionis expected to flat line or reduce over thenext decade as the additional supply fromnew producing mines in Canada, Russiaand to a lesser extent Africa is notsufficient to meet the growing demand.
Although the United States is still thelargest consumer of polished diamonds at 35% to 40%, the main growth areas areChina and India, which together areforecast to account for 50% of the growthdemand over the next five to ten years. The middle class of these burgeoningeconomies is set to double over the nextfive years and De Beers indicate thatChinese and Indian diamond consumptionwill equal that of the United States by2015. With such strong consumptiongrowth De Beers further forecasts that thediamond industry as a whole needs todouble annual supply to meet this demand,something that is very unlikely to happen.
With the supply deficit notional value setto reach $1billion by 2022, as forecast byRBC Capital Markets, driven by strongconsumer growth, depleting resourcesand no new discoveries due to lack of exploration, the outlook for diamondsas a commodity remains very healthy.There will be periods of diamond priceconsolidation or even retracement in theshorter term, particularly as the worldeconomy remains volatile, however thelonger term outlook on pricing remainsvery bullish and companies in productionare positioned to significantly benefit frominevitable price appreciation.
Angola
Australia
Botswana
Canada
DRC
Namibia
Russia
South Africa
Zimbabwe
Other Countries
200
180
160
140
120
100
80
60
40
20
2005A 2006A 2007A 2008A 2009A 2010A 2011E 2012E 2013E 2014E 2015E 2016E 2017E
Million carats
Supply
Demand
National shortage
60,000
50,000
40,000
30,000
20,000
10,000
2008E 2010E2009E 2011E 2012E 2013E 2014E 2015E 2016E 2017E 2018E 2019E 2020E 2021E 2022E 2023E 2024E
$Million
Source: All figuresRBC Capital Markets estimates (includes Russia stockpile in supply)
ANNUAL REPORT AND ACCOUNTS 2011STELLAR DIAMONDS PLC
World Diamond Production
Diamond Supply and Demand

09
BUSINESS REVIEW
CORPORATE SOCIALRESPONSIBILITY
MANDALA MINING AND PROCESSINGStellar remains a strong supporter of communities within theareas of its operations. It is often difficult to manage localexpectations when there is a limited exploration budget, howevera number of initiatives have been completed in the year that havehad a direct benefit to the local populace. STAFFThe Company still has a strong policy of local recruitment asmuch as possible. The reliance on expatriate skills, althoughnecessary, is not at the detriment of developing local skills in theworkforce. Out of a total workforce of 299 only 12 are expatriate.There has also been significant transfer of skills during this periodrelated to operation of processing plants, rock drilling and blasting.
ROAD AND BRIDGE CONSTRUCTIONStellar continues to believe that one of the most effective ways of local upliftment is by improving the transport network andinfrastructure. New and existing roads covering a distance of180km in length have been both built or maintained in all projectareas. This opens up the interior of the country to commerce and general accessibility in areas often too remote or difficult to previously reach.
COMMUNITY DEVELOPMENT AGREEMENTSIn Sierra Leone Stellar has signed up to a communitydevelopment agreement with the Lower Bambara Chiefdomwhere annual fees are paid towards a number of localdevelopment initiatives as decided upon by an executivecommittee of the forum.
SIERRA LEONE INDEPENDENCE CELEBRATIONSThis year saw the 50 year independence celebrations in SierraLeone. Stellar chose to mark this important occasion bysponsoring two large festivals in both the Kono and Tongocommunities where large swathes of the community enjoyed thehospitality provided. This proved particularly popular with everyone.
20 40 60 80 100 120
Nationals
Expatriates
Droujba
Mandala
Bomboko
Tongo
Kono
Conakry
ANNUAL REPORT AND ACCOUNTS 2011 STELLAR DIAMONDS PLC
Tongo project manager Graham Radburnd and local community Road rehabilitation in Guinea
Staff Numbers

10
BUSINESS REVIEW
DROUJBA
Drilling of the Droujba kimberlite hasdelineated the pipe at three times the originallyreported surface area and made intersections atdepths of up to 400m, with the pipe still remainingopen at depth. The kimberlite has considerabletonnage potential and based on previouslyreported mining grades of over 100cpht asignificant carat resource is in the making.
LOCATION AND HISTORYThe Droujba kimberlite pipe is located some 60kms to the southeast of the Mandala mine in the diamond rich area of Bounundou.It was discovered in the early 1960’s by the Russian Aid Missionwhich delineated the pipe at 1 hectare in size. The Russians minedthe pipe down to a depth of 20m before the kimberlite becametoo hard to mine and process. Diamond grades around 100cpht,and in some samples as high as 200cpht, are reported.
Since the Russians abandoned Guinea in 1964 the Droujba pipehas remained unexploited and the old mine pit to 20m hasremained flooded. Diamond mining activity in the vicinity of thepipe has been restricted to alluvial mining by local artisanal minersand a 270-carat stone is reported to have been discovered in thealluvial gravels near to the pipe.
DRILL PROGRAMMECore drilling commenced in November 2010 with an initial3,000m drill programme aimed at delineating the pipe to 120mdepth. This programme was extended to 10,000m based on the very encouraging intersections achieved which basicallyconfirmed the pipe to have a surface area of 3 hectares and a vertical continuity to 400m and beyond.
By the end of August some 6,424m had been drilled from 33holes. Most of these holes were focussed on drilling of theDroujba pipe (5,391m), however, some holes were drilled into theKatcha kimberlite dyke that runs in proximity to the pipe (1,033m).
These holes drilled into Droujba were primarily located on theedge of the flooded pit and drilled at varying angles in order to intersect the kimberlite pipe at various depths. The deepestintersection made to date is 383m vertically below surface and the pipe remains open at depth.
The drilling to the end of 2011 will focus on more accuratedelineation of the pipe at between the 250m and 400m depthlevels in order that a robust geological model, with accuratelydetermined volumes and tonnages, can be determined as part of the initial resource estimation programme.
GEOLOGICAL MODELThe detailed logging andinterpretation of the drill core from Droujba has ledto the identification of threemain geological units, beingone hypabyssal and twobreccia units.
The core of the pipe iscomprised of two vents ofhypabyssal kimberlite thatare separated near to surfaceby a short distance but whichcoalesce at depth. One ofthese hypabyssal vents didnot break through to surface,whereas the other vent didand became the pipe thatwas mined in the 1960’s to adepth of 20m from surface.
The core of hypabyssal kimberlite is surrounded close to its contactwith country rock granite by two brecciated units that are potentiallyvolumetrically significant. The difference between these respectivebreccias is based on the percentage of kimberlite in the matrix.
Based on the country rock dilution it is clear that the diamondgrade of the breccia will be lower than that of the hypabyssalkimberlite which was previously mined. This has been confirmedfrom the microdiamond analysis so far undertaken, and theplanned bulk sampling from the base of the old mined out pit will independently test the units for diamond grade and quality.
ANNUAL REPORT AND ACCOUNTS 2011STELLAR DIAMONDS PLC
Droujba Kimberlite
3D Model of Droujba pipe

11
FUTURE WORKThe drilling and bulk sampling will continue into Q1-12 when theresource estimate will be calculated and published. This will befollowed by a preliminary economic scoping study which will lookat various economic scenarios and valuations on the basis of theresource generated. Should the results prove encouraging theDroujba pipe will be subjected to large diameter drilling (17-inch) todepth in order to convert the inferred resource to indicated status.
MICRODIAMOND ANALYSISSome five separate samples have been analysed for microdiamond content at the Saskatchewan Research Council Laboratory inCanada. These samples were collected on the basis of their geology and separated into hypabyssal and kimberlite breccia samples. It is clear from the table that the diamond content of the hypabyssal kimberlite is significantly higher than the breccia. The diamondcounts for all samples are considered highly encouraging and consistent with the reported high grade of the kimberlite pipe.
BULK SAMPLING PROGRAMMEA processing plant is currently being established at the Droujba kimberlite site through which representative bulk samples will beprocessed in order to determine the individual diamond grade and values for the hypabyssal and kimberlite breccia units. The plant is comprised of a 5 ton per hour DMS unit with diamond recovery by X-Ray Flowsort and grease table back up. The front end crushingcircuit is being manufactured in South Africa and should be on site in late October. Processing of the bulk samples is expected tocommence in November and the results will be available in the first quarter of 2012.
RESOURCE ESTIMATEThe objective of the drilling and bulk sampling is to compile a maiden resource estimate to JORC (or equivalent) standards by the end of Q1-12. CAE Mining has been appointed as independent consultants and Dr. Matthew Field, a world renowned kimberlite resourcegeologist, has been appointed as the competent person overseeing the programme and signing off on the resource. The initial resourceestimate will be mainly of an inferred nature to 350m depth, though some of the resource will qualify for an indicated category.
Preliminary volume and tonnage estimations have been undertaken on the basis of the geological model to a depth of 350m below the surface. Whilst these are not yet classified as resources the indication is that to a depth of 350m there is approximately 5.2 milliontonnes of hypabyssal kimberlite and 9.9 million tonnes of diamondiferous kimberlite breccia. Clearly the kimberlite does extend beyondthe 350m depth and this further demonstrates the significant tonnage potential of the Droujba kimberlite pipe.
DROUJBA TONNAGE MODEL TO 350M BELOW SURFACE
Sample Number Kimberlite FaciesSampleWeight (kg)
+0.075+0.106-0.150
+0.150-0.212
+0.212-0.300
+0.300-0.425
+0.425-0.600
+0.600-0.850
+0.850-1.180
+1.180-1.700
+1.700-2.360
+2.360-3.350
Total Diamonds
Carats+0.85
GN04-2010-02 Hypabyssal 196.72 178 135 69 53 36 7 9 1 2 0 0 490 0.0647
GN04-2011-01 Hypabyssal 67.6 37 33 17 14 7 6 2 0 0 0 0 116 0
GN04-2010-02 Hypabyssal 136.55 115 110 49 40 19 8 2 2 0 1 0 346 0.1401
Totals 400.87 330 278 135 107 62 21 13 3 2 1 0 952 0.2048
Sample Number Kimberlite FaciesSampleWeight (kg)
+0.075+0.106-0.150
+0.150-0.212
+0.212-0.300
+0.300-0.425
+0.425-0.600
+0.600-0.850
+0.850-1.180
+1.180-1.700
+1.700-2.360
+2.360-3.350
Total Diamonds
Carats+0.85
GN04-2010-03 Kimberlite Breccia 94.54 10 14 9 7 3 2 1 1 0 0 1 48 0.1940
GN04-2011-03 Kimberlite Breccia 268.24 14 8 13 5 7 5 0 0 0 0 0 52 0
Totals 362.78 24 22 22 12 10 7 1 1 0 0 1 100 0.1940
Depth fromSurface
Kimberlite Breccia (t)
Hypabssal Kimberlite (t) Total Tonnes
0-50m 1,907,972 583,181 2,491,153
50-100m 1,552,953 694,360 2,247,313
100-150m 1,312,824 763,172 2,075,996
150-200m 1,400,907 698,234 2,099,141
200-250m 1,580,197 819,124 2,399,321
250-300m 1,070,681 913,176 1,983,857
300-350m 1,101,430 761,114 1,862,544
Total Tonnage 9,926,964 5,232,361 15,159,325
ANNUAL REPORT AND ACCOUNTS 2011 STELLAR DIAMONDS PLC
Drilling at Droujba
DROUJBA KIMBERLITE TONNAGE CALCULATIONS
Note: Determined from Datamine Geological Model, not yet JORC complient
NUMBER OF DIAMONDS ACCORDING TO SIEVE SIZE FRACTION (mm)
NUMBER OF DIAMONDS ACCORDING TO SIEVE SIZE FRACTION (mm)
12
BUSINESS REVIEW
TONGO
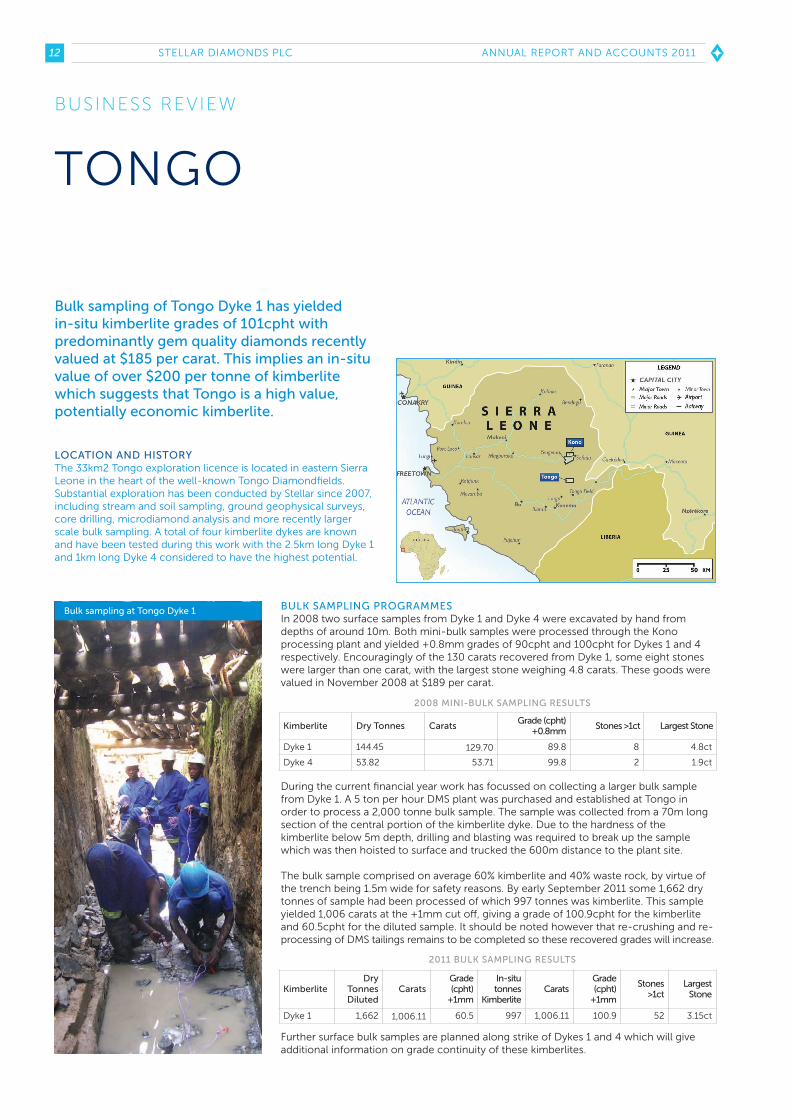
Bulk sampling of Tongo Dyke 1 has yielded in-situ kimberlite grades of 101cpht withpredominantly gem quality diamonds recentlyvalued at $185 per carat. This implies an in-situvalue of over $200 per tonne of kimberlitewhich suggests that Tongo is a high value,potentially economic kimberlite.
BULK SAMPLING PROGRAMMESIn 2008 two surface samples from Dyke 1 and Dyke 4 were excavated by hand fromdepths of around 10m. Both mini-bulk samples were processed through the Konoprocessing plant and yielded +0.8mm grades of 90cpht and 100cpht for Dykes 1 and 4respectively. Encouragingly of the 130 carats recovered from Dyke 1, some eight stoneswere larger than one carat, with the largest stone weighing 4.8 carats. These goods werevalued in November 2008 at $189 per carat.
During the current financial year work has focussed on collecting a larger bulk samplefrom Dyke 1. A 5 ton per hour DMS plant was purchased and established at Tongo inorder to process a 2,000 tonne bulk sample. The sample was collected from a 70m longsection of the central portion of the kimberlite dyke. Due to the hardness of thekimberlite below 5m depth, drilling and blasting was required to break up the samplewhich was then hoisted to surface and trucked the 600m distance to the plant site.
The bulk sample comprised on average 60% kimberlite and 40% waste rock, by virtue ofthe trench being 1.5m wide for safety reasons. By early September 2011 some 1,662 drytonnes of sample had been processed of which 997 tonnes was kimberlite. This sampleyielded 1,006 carats at the +1mm cut off, giving a grade of 100.9cpht for the kimberliteand 60.5cpht for the diluted sample. It should be noted however that re-crushing and re-processing of DMS tailings remains to be completed so these recovered grades will increase.
Further surface bulk samples are planned along strike of Dykes 1 and 4 which will giveadditional information on grade continuity of these kimberlites.
LOCATION AND HISTORYThe 33km2 Tongo exploration licence is located in eastern SierraLeone in the heart of the well-known Tongo Diamondfields.Substantial exploration has been conducted by Stellar since 2007,including stream and soil sampling, ground geophysical surveys,core drilling, microdiamond analysis and more recently largerscale bulk sampling. A total of four kimberlite dykes are knownand have been tested during this work with the 2.5km long Dyke 1and 1km long Dyke 4 considered to have the highest potential.
ANNUAL REPORT AND ACCOUNTS 2011STELLAR DIAMONDS PLC
Kimberlite Dry Tonnes CaratsGrade (cpht)
+0.8mmStones >1ct Largest Stone
Dyke 1 144.45 129.70 89.8 8 4.8ct
Dyke 4 53.82 53.71 99.8 2 1.9ct
KimberliteDry
TonnesDiluted
Carats Grade(cpht)
+1mm
In-situtonnes
KimberliteCarats
Grade(cpht)
+1mm
Stones >1ct
LargestStone
Dyke 1 1,662 1,006.11 60.5 997 1,006.11 100.9 52 3.15ct
Bulk sampling at Tongo Dyke 1
2008 MINI-BULK SAMPLING RESULTS
2011 BULK SAMPLING RESULTS

13
DIAMOND VALUATIONTwo diamond parcels comprising some948 carats have been exported to Antwerpfor valuation. The first parcel of 638.74carats was valued at $191 per carat inAugust 2011. However, the second parcelof 309.94 carats realised a lower value of$176 per carat in September due to marketweakness as a consequence of worldwideeconomic concerns. The overall averagevalue for the 949 carats exported wastherefore $186.10 per carat.
The Tongo diamonds are primarily of gemquality with a large percentage of crystalsand sawable goods which drives apremium on price. It is important to notethat the exports valued to date did notcontain any “special” stones and thereforethe Company considers this value to be arun of mine which can be considerablyenhanced by the presence of larger stonesin a production scenario.
CORE DRILLINGTwo rigs are currently active on the Tongoproject. An initial 6,000m to 10,000mprogramme is planned to drill outresources on Dykes 1 and 4 to a minimumof 200m depth. The drilling commenced inAugust and by early Setember some eightholes totalling 506m had been drilled. At each collar position, three holes atvarying angles are being drilled so thatintersections of the kimberlite can bemade at approximately 50m, 100m and200m vertical depth from surface.
The drill core is logged and holes surveyedfor any apparent deviation. This data iscompiled into Datamine and modelled aspart of the resource estimation exercise.
Selections of samples will be consigned forpetrographic and microdiamond analysisso that geological continuity and hencediamond grade continuity can be inferredacross the resource.
RESOURCE ESTIMATECAE Mining has been appointed asindependent consultant, with Dr. MatthewField as competent person to establishmaiden diamond resource estimates forthe Tongo project. All previous work will be verified and the future work monitoredto best international standards by theconsultants. The objective is to establishan initial inferred resource to 200m depthand be independently signed off by theConsultants during the first quarter of2012. Simultaneously, CAE Mining willdeliver a preliminary economic scopingstudy on Tongo with a range of economicscenarios and valuations.
FUTURE WORKThe next six months will see an aggressivedrilling and bulk sampling programme onthe Dyke 1 and Dyke 4 bodies. This willyield the required information on resourcetonnage, diamond grade and diamondvalue for these kimberlites on which thebase the resource estimation. The programme is on track to becompleted during Q1-12.
Subject to positive economic scopingstudies shaft sinking will commence onDyke 1 and 4 with a view to commencingunderground trial stope mining andfeasibility studies in the latter part of 2012and into 2013.
ANNUAL REPORT AND ACCOUNTS 2011 STELLAR DIAMONDS PLC
Date Carats Valuation US $
Export-1 Jun-11 638.74 $191.11/ct
Export-2 Aug-11 309.94 $176.10/ct
Total 948.68 $186.10/ct
Tongo 5tph DMS processing plant
Tongo diamonds
TONGO DIAMOND VALUATIONS

14
BUSINESS REVIEW
MANDALA
Mining at Mandala continued with the production of a further41,723 carats of diamonds in the period. This brings the totalproduction at Mandala since mining commenced in April 2009to 128,000 carats with a realised gross revenue of $4 million.
MANDALA MINING AND PROCESSINGThe Mandala mining licence covers anarea of 14km2 in the Macenta andKerouane districts of south east of Guinea.Production commenced in late April 2009after a 100tph DMS processing plant wasconstructed and a 60km stretch of roadfully rehabilitated. The diamonds beingmined are hosted in unconsolidatedgravels that are overlain by some 4m to5m of sandy overburden. The miningprocedure is simple, with the barren sandbeing stripped and the diamond bearinggravel extracted by CAT and Volvoexcavators. The gravel is then loaded ontohaul trucks and carried to the processingplant where it is stockpiled.
The processing is carried out through a100 ton per hour dense media separationplant (DMS) which has a 1.8mm bottomcut off. After the material has been fed tothe plant and passed through the scrubberand prep-screens the +1.8mm to -25mmsize fraction goes into the DMS, with threeconcentrate fractions being passed to theX-Ray flow sort for diamond recovery.The Flowsort tailings are also passed overgrease to scavenge any diamonds missedby the first pass.
Diamond recovery is done under strictsecurity conditions, with a Governmentmines monitor being present at all times.The diamonds are classified, weighed andplaced in a safe until exported to Conakryfor valuation before royalties are paid andthe Kimberley Process Certificate issuedprior to final export to Antwerp for sale.
ANNUAL REPORT AND ACCOUNTS 2011
Night mining at MandalaLamine Thiam grading Mandala diamondsMandala diamond
Senior Geologist Abdulaye Diallo at Mandala
STELLAR DIAMONDS PLC

MANDALA PRODUCTIONAlthough processing of gravel increased in the 2011 financial year(185,380t) compared to 2010 (179,747t) carat production waslower at 41,727cts versus 2010 (63,721cts) due to a prolongedrainy season which flooded the river valley where the mainMandala resource is located. As a consequence mining wasforced to higher terrace areas where recovered grades werelower, at an average of 22.5cpht compared 2010 grades of 35cpht.
Towards the end of the financial year, however the Companymade the decision to open up access to the N’Keliyani River areawhich is a tributary to the main Mandala River channel. Historicalexploration had indicated that this area yielded high diamondgrades and due to the thick overburden was relatively intact fromlocal artisanal diggings.
Mining subsequently confirmed higher grades and this area thenbecame the focus of activity, with grades consistently over50cpht, and sometimes over 100cpht, being recorded. For themonths of July and August some 3,429 carats were yielded from6,758 tonnes of gravel for a grade of just under 51cpht.
Mining ceased in mid-August for the height of the rainy seasonand is scheduled to resume in October. This area of the N’Keliyaniwill be the focus of mining over the coming months and willcontinue as long as it remains profitable.
MANDALA DIAMOND SALESDiamond sales for the financial year of 2011 were lower than 2010at $1.6million on the basis of fewer carats being produced.Although the average price per carat was similar over the past twoyears this does not truly reflect the appreciation in prices in thelatter part of Q2-11 where there was a significant increase inprices realised.
The Mandala goods are generally of low average quality,comprising approximately 80% industrial diamonds. However, the N’Keliyani goods are noticeably better when compared to theMandala goods and going forward, assuming consistent marketconditions, there should be an increase in the average price realised.
OUTLOOK FOR MANDALABased on the mining of higher grade areas at the N’Keliyaniresource area the Mandala project has returned to modestprofitability. However, close control on costs and efficient mining arecontinually required to ensure the project remains cash flow positive.
Although Mandala is not the key strategic focus, it is felt importantto remain in production as Stellar is the only commercial diamondproducing Company in Guinea. This brings recognition from theGuinean Government and raises the Company profile in a sectorthat is undeveloped and where Stellar is in the process ofhopefully developing a substantial diamond resource at Droujba.
15ANNUAL REPORT AND ACCOUNTS 2011 STELLAR DIAMONDS PLC
Tonnes Carats Grade (cpht)+1.8mm
2009 FY 37,578 19,115 50.87
2010 FY 179,747 63,721 35.45
2011 FY 185,380 41,723 22.51
2012 FY (Jul-Aug-11) 6,758 3,429 50.74
Total 409,463 127,988 31.26
Carats Sales US$ $ per carat
2009 FY 7,453 203,144 27.26
2010 FY 67,342 2,109,677 31.33
2011 FY* 53,157 1,618,304 30.44
Total 127,952 3,931,125 30.72
Mandala 100tph processing plant
MANDALA PRODUCTION
MANDALA PRODUCTION
Note: * Some diamonds in stock

16
BUSINESS REVIEW
KONO
Work during the period has focussed on surface explorationof high-interest kimberlites that have not previously beensubjected to any significant amount of test work. One suchkimberlite, designated Lion-5, is located in the easternextreme of the licence area and has been mapped over adistance of 5 kilometres.
The Lion-5 kimberlite runs into the adjacent mining licenceheld by Koidu Holdings, which is currently embarking on areported $150m capital development programme on itskimberlite property.
Previous testing of Lion-5 by Stellar, from two small 1,000kgsamples, indicated a diamond grade of around 100cpht withhigh quality diamonds. The Company therefore decided tocollect a 300 ton bulk sample from the kimberlite to ascertainthe diamond grade and value with more confidence.
In recent months Stellar has accessed the kimberlite and hasstripped the overburden, exposing the body over a length of30m at a depth of 4m. The width of the dyke is up to 1.8mand is very hard. The kimberlite will now be drilled and blastedand the ore hauled to the DMS processing plant at Tongo fordiamond recovery.
Based upon the results, further bulk sampling may be targetedor consideration be given to sinking a shaft from whichunderground trial mining can be conducted.
The previous shaft sites at Pol-K and Bardu remain on care andmaintenance and the Company is assessing means of resumingunderground trial mining, which will be subject to eitherfinancing or securing an appropriate joint venture partner.
BOURO
Bulk sampling of the Bouro North dyke was accomplished in the period under review, with an exceptionally high grade of 243cpht being realised.
The kimberlite was firstly mapped in detail along its entire 5kmlength and this revealed a complex series of en-echelondykes that had mostly been exploited by artisanal diggingsover the years. A suitable sample site in the centre of the dykelength was selected for the bulk sample site and over 15m ofoverburden was stripped (the depth to which the local diggershad penetrated).
The kimberlite was then opened up over a 70m length wherethe width varied considerably from closely spaced stringers ofa few centimetres to 70cm over a zone of approximately 2m.As such the sample was heavily diluted and this was taken intoconsideration when calculating the final kimberlite grade.
Detailed measurements of the kimberlite widths along the70m long trench were made and since the kimberlite washeavily decomposed the moisture content was calculated, ineffect giving a wet and dry weight figure for the sample.
Overall a total of 337t (wet) and 233t (dry) of kimberlite wereextracted as the bulk sample. This was trucked the 1kmdistance to the Mandala DMS plant where it was processed.Due to the decomposed nature of the kimberlite no crushingwas required at the plant.
A total of 565.2 carats of diamond were recovered at a+1.8mm cut off, giving an in-situ kimberlite grade of242.7cpht. The largest diamond recovered weighed 3.67carats and the average stone size was 0.15/ct. The diamondsare mainly of industrial quality and the parcel is currently inAntwerp awaiting sale.
A further two bulk samples were selected for excavation, buton the basis of narrow kimberlite width and very thickoverburden these were unsuccessful.
The Company therefore decided to postpone further work onBouro until the diamond parcel was sold in Antwerp and thenmake a decision on the future programme. This may includefurther attempts at bulk sampling and/or drilling.
ANNUAL REPORT AND ACCOUNTS 2011
WetTons
MoistureContent
DryTons
Carats Recovered
Gradecpht
(+1.8mm)
Number Diamonds
AverageStoneSize/ct
LargestStone
337.4 31% 232.8 565.2 242.7 3,767 0.15 3.67ct
Bulk sampling at Lion 5 Dyke
BOURO NORTH BULK SAMPLE
STELLAR DIAMONDS PLC
BOMBOKO
17
BUSINESS REVIEW
During the year detailed evaluation andresource mapping continued within the 28km2licence area. This work focussed on thedownstream reaches of the Bomboko Riverthat were previously inaccessible and underexplored. The objective was to define newresource areas that could be mined profitably.
BOMBOKO EXPLORATIONGeological mapping was conducted over a 3km area downstreamof the existing Bomboko trial mining operations, with areas beingdefined for bulk sample testing. A total of 31 samples ofapproximately 300 cubic metres of gravel were collected andprocessed via the Bomboko plant.
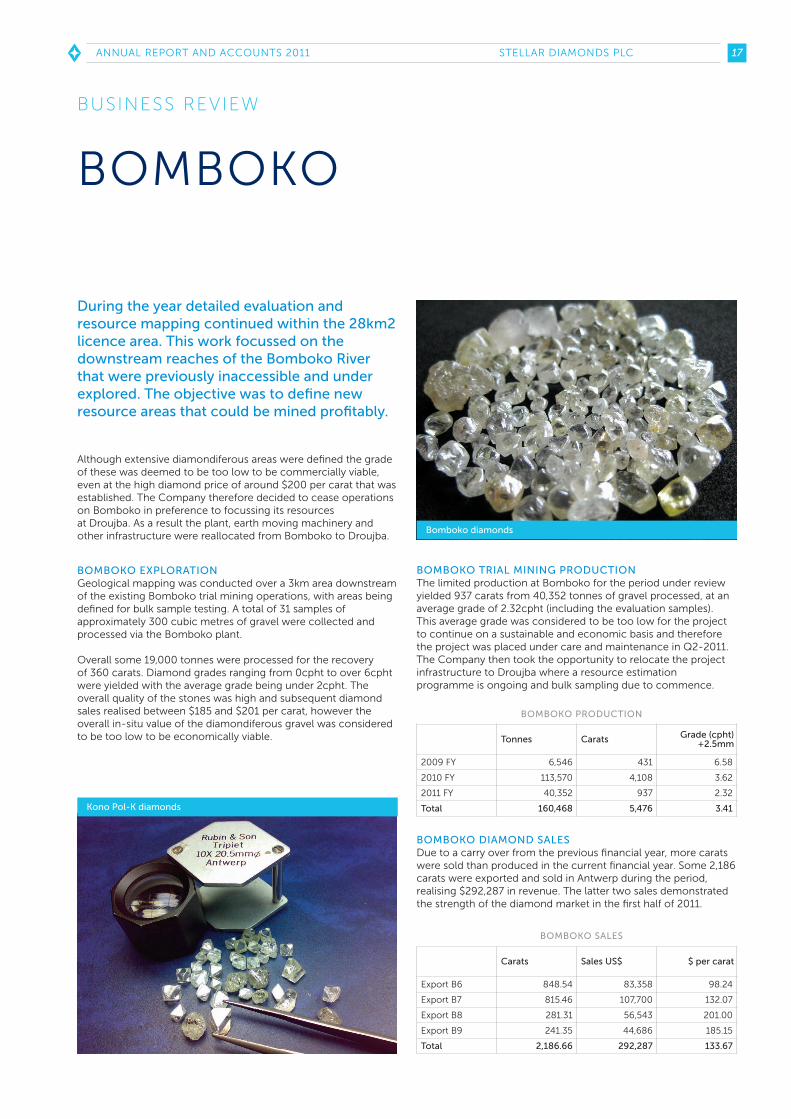
Overall some 19,000 tonnes were processed for the recovery of 360 carats. Diamond grades ranging from 0cpht to over 6cphtwere yielded with the average grade being under 2cpht. Theoverall quality of the stones was high and subsequent diamondsales realised between $185 and $201 per carat, however theoverall in-situ value of the diamondiferous gravel was consideredto be too low to be economically viable.
Although extensive diamondiferous areas were defined the gradeof these was deemed to be too low to be commercially viable,even at the high diamond price of around $200 per carat that wasestablished. The Company therefore decided to cease operationson Bomboko in preference to focussing its resources at Droujba. As a result the plant, earth moving machinery andother infrastructure were reallocated from Bomboko to Droujba.
BOMBOKO TRIAL MINING PRODUCTIONThe limited production at Bomboko for the period under reviewyielded 937 carats from 40,352 tonnes of gravel processed, at anaverage grade of 2.32cpht (including the evaluation samples).This average grade was considered to be too low for the projectto continue on a sustainable and economic basis and thereforethe project was placed under care and maintenance in Q2-2011.The Company then took the opportunity to relocate the projectinfrastructure to Droujba where a resource estimationprogramme is ongoing and bulk sampling due to commence.
BOMBOKO DIAMOND SALESDue to a carry over from the previous financial year, more caratswere sold than produced in the current financial year. Some 2,186carats were exported and sold in Antwerp during the period,realising $292,287 in revenue. The latter two sales demonstratedthe strength of the diamond market in the first half of 2011.
ANNUAL REPORT AND ACCOUNTS 2011 STELLAR DIAMONDS PLC
Tonnes Carats Grade (cpht)+2.5mm
2009 FY 6,546 431 6.58
2010 FY 113,570 4,108 3.62
2011 FY 40,352 937 2.32
Total 160,468 5,476 3.41
Carats Sales US$ $ per carat
Export B6 848.54 83,358 98.24
Export B7 815.46 107,700 132.07
Export B8 281.31 56,543 201.00
Export B9 241.35 44,686 185.15
Total 2,186.66 292,287 133.67
Bomboko diamonds
Kono Pol-K diamonds
BOMBOKO PRODUCTION
BOMBOKO SALES

18
GOVERNANCE
BOARD OF DIRECTORS
ANNUAL REPORT AND ACCOUNTS 2011
LORD DARESBURY . NON-EXECUTIVE CHAIRMANPeter Daresbury has held numerous executive positions, including CEO from1997 to 2000 of the Greenalls Group, which had an annual turnover of £983million and a FTSE 100 market capitalisation of £1.7 billion. In 2000, thecompany was re-named The De Vere Group plc, and Peter Daresbury becameNon-Executive Chairman until he stood down in 2006. Peter Daresbury hasalso served as Non-Executive Chairman of Kazakhgold Group Ltd from 2005 to 2007 and Executive Chairman of Highland Gold from 2002 to 2004. Peter is currently Chairman of AIM quoted Nasstar plc, Aintree Racecourse CompanyLtd, Mallett plc and North West Business Finance Ltd, a new Private VentureCapital and Loan Fund (VCLF) for the Northwest.
Current directorships include Bespoke Hotels Ltd, Rusant Ltd and in addition,since 2005, Peter has been a member of the Fleming Family and PartnersPrivate Equity Investment Committee.
KARL SMITHSON . CHIEF EXECUTIVE OFFICERKarl Smithson was appointed as Stellar's Chief Executive Officer with effectfrom 1 January 2007, having built the portfolio of Stellar’s assets within ManoRiver Resources since 2000. He led the listing of Stellar on AIM through areverse takeover of West African Diamonds and has over the years successfullyraised over £15million in equity funding for Stellar.
Karl has 23 years of resource sector experience gained with a number ofcompanies in senior management positions, including De Beers (10 years),SouthernEra Diamonds (2 years) and Mano River/Stellar (11 years). Karl's working career has been focussed on diamond exploration anddevelopment in Africa and he has been responsible for a number of newdiamond discoveries in Botswana, Zimbabwe, Sierra Leone and Liberia. Karl is a geology graduate of Kingston University in the UK. He completed hisMBA with distinction in 2006 at the Graduate School of Business in Cape Town,South Africa and was awarded with the Old Mutual Gold Medal.
STELLAR DIAMONDS PLC

19ANNUAL REPORT AND ACCOUNTS 2011 STELLAR DIAMONDS PLC
LUIS DA SILVA . NON-EXECUTIVE DIRECTORLuis is CEO of TSXV/AIM listed Afferro Mining Inc (TSXV/LSE: AFF), an iron ore explorer/developer in Liberia and Cameroon. He gained his extensiveinternational experience with multinationals Lafarge S.A. and Blue CircleIndustries Plc before joining the current Company in 2007. Luis is a graduateMining Engineer from Camborne School of Mines and read for his MBA at theCranfield School of Management. Additionally, Luis serves as a Non-ExecutiveDirector of Aureus Mining Inc. (TSX/LSE: AUE), a gold development company in west Africa born out of the African Aura split in April 2011.
JAMES CAMPBELL . NON-EXECUTIVE DIRECTORJames Campbell is currently Chief Executive Officer and President of RockwellDiamonds Inc. Prior to this he was Vice President - New Business for LucaraDiamond Corp, following Lucara’s acquisition of African Diamonds plc, wherehe was Managing Director for four years.
Preceding this, James was with De Beers for over twenty years, culminating inbeing General Manager responsible for advanced exploration and resourcedelivery in the Global Mining and Exploration group. During his career with DeBeers he also led a number of diamond exploration and evaluation programmesand small-scale mine development as well as being involved in corporate andstrategic management and being Nicky Oppenheimer's Personal Assistant.
James holds a degree in Mining & Exploration Geology from the Royal School ofMines (Imperial College, London University) and an MBA with distinction fromDurham University. James is a Fellow of the Institute of Mining, Metallurgy &Materials, Chartered Engineer (UK), Chartered Scientist (UK), a ProfessionalNatural Scientist (RSA) and a member of the Institute of Directors of South Africa.He is also a director of Bugeco sa, and Swala Resources plc.
STEVEN POULTON . NON-EXECUTIVE DIRECTORSteven Poulton holds an Honours degree in Geology from the University of Southampton (1997) and a Masters degree in Mining Geology from theCamborne School of Mines (1998). He is the Chief Executive and co-founder(2007) of Altus Strategies Ltd, a private natural resource company and adirector of its subsidiaries Altus Capital Ltd (the investment manager of AltusResource Capital Ltd [LSE:ARCL]), Arabian Gold Corporation plc, Aluvance plcand Altau Gold plc. Steven was a co-founder and director of African AuraMining Inc, which in 2011 de-merged its assets to create Aureus Mining Inc[AIM / TSX: AUE] and Afferro Mining Inc [AIM / TSX-V: AFF]. Steven is a fellow of the Geological Society of London and a fellow of the Institute of Materials,Minerals and Mining.

20
KEYMANAGEMENT
ROWAN CARR . CHIEF OPERATIONS OFFICERRowan graduated with a Masters in Mineral Exploration from Imperial College Londonand has 23 years of diamond industry experience throughout Africa. He spent 20 yearsworking for De Beers in senior management positions heading up exploration efforts in Botswana, South Africa, Angola, DR Congo, Guinea and the Central African Republic.Rowan joined Stellar in 2007 and has been at the forefront of project exploration and development on the ground.
PHILIP KNOWLES . FINANCIAL CONTROLLERPhilip joined Stellar in June 2011 as Financial Controller. He is a qualified accountanthaving gained membership to the ACCA in 2004 and holds a BA (Hons) in Accountingand Finance from Exeter University. Philip has over 10 years of accountancy experienceworking for a wide range of businesses while in practice and most recently was GroupFinancial Controller for Firestone Diamonds plc and for Kopane Diamonds plc, prior toFirestone’s takeover of Kopane, and brings with him strong experience of working forgrowing diamond mining companies. Philip is based in our London office but travelsregularly to the company’s assets in Guinea and Sierra Leone.
JOHN PEARTREE . LOGISTICS MANAGER, SIERRA LEONEJohn Peartree joined Stellar Diamonds in July 2011 and brings with him over 17 years of logistics and supply chain management experience. After completing 12 years in theBritish military (Royal Logistics Corps) John spent time in many and varied industriesincluding Banking, Financial Services, Bio Energy, before returning to the Logistics andSupply Chain industry most recently in Ghana and Nigeria, West Africa.
ALKALY YANSANE . COUNTRY REPRESENTATIVE, GUINEAAlkaly Yansane is a Guinean national with a USA university degree in geology. He was the Director of the CPDM in Conakry for a number of years, responsible for many aspects of the mineral sector. Yansane has also worked for 16 years in the private sector of theexploration and mining industry with Rio Tinto, West African Diamonds and now StellarDiamonds, where he holds the position of Company representative in Conakry.
WAYNE LAMBINON . LOGISTICS MANAGER, GUINEAWayne joined Stellar Diamonds in April 2010 as office and logistics manager in Conakry.After a long career in the military, French Foreign Legion as a Paramedic, Wayne hasspent the last eight years in the mining industry as office, logistics and security managerfor Anglo Gold Ashanti, Banro Corporation, Uramin and now Stellar Diamonds. He hasworked in many Africa countries including the DR Congo, Niger, Zambia and Guinea.
ANNUAL REPORT AND ACCOUNTS 2011
GOVERNANCE
STELLAR DIAMONDS PLC

21
KASSIM MANSARAY . SENIOR GEOLOGIST, SIERRA LEONEKassim is a qualified geologist with a Masters from Moscow, Russia. Kassim has over 30years of industrial experience, having started work in the Geological Survey of SierraLeone and working on a number of project evaluations in the country. He brings a vastwealth of multi-commodity experience having worked in Sierra Leone, Liberia, Guinea,Gabon and the Central African Republic, having spent the past 15 years with the ManoRiver-Stellar Diamonds group of companies.
GRAHAM RADBURND . TONGO PROJECT MANAGERGraham’s early career was focused in the civil construction sector in Africa and theMiddle East. He also brings 13 years of diamond industry experience in both productionand management roles in Angola, DR Congo, Russia, Guinea and Sierra Leone. Grahamhas been managing a number of Stellar’s mining and development projects since joiningthe Company in 2008.
FODÉ CAMARA . MANDALA PROJECT MANAGERFodé is a Guinean national with a degree in geology from the University of Conakry. He has 16 years diamond industry experience, 12 of which was with De Beers in seniorpositions in Guinea, South Africa, Botswana, Zimbabwe, Madagascar, Gabon and DRCongo. Fodé joined Stellar in 2008 and is currently project manager at the Mandala mine.
ABDULAYE DIALLO . SENIOR GEOLOGIST, DROUJBA PROJECTAbdulaye is a Guinean national with a degree in mining geology from the University ofBoke. After an early career in construction he joined Mano River Resources as projectgeologist exploring for gold and diamonds in Guinea, Sierra Leone and Liberia. Abdulayecontinued this work with Stellar Diamonds from 2007 and is currently responsible for thedrilling project at Droujba.
SULAIMAN SWARAY . PROJECT GEOLOGIST, TONGO PROJECTSulaiman is a Sierra Leone national with a degree in Geology from Fourah Bay Universityin Freetown. After two years in the National Statistics Office he joined Stellar in 2004 andwas project geologist in a regional diamond exploration joint venture with BHP Billiton.This led to the discovery and development of the Tongo kimberlites where Sulaiman isnow project geologist for the resource estimation programme.
ANNUAL REPORT AND ACCOUNTS 2011 STELLAR DIAMONDS PLC

22 ANNUAL REPORT AND ACCOUNTS 2011STELLAR DIAMONDS PLC
DIRECTORS’REPORT
GOVERNANCE
The directors submit their report and the consolidated financial statements for Stellar Diamonds plc. (the “Company” or “Stellar” or on a consolidated basis the “Group”), for the year ended 30 June 2011.
PRINCIPAL ACTIVITIES, BUSINESS REVIEW AND FUTURE DEVELOPMENTSThe principal activity of the Company is that of diamond production and development in West Africa.
No dividends have been paid or are proposed for the period (2010: nil).
A detailed review of the significant developments and operating results of the Group, as well as the business environment, futureprospects and the main trends and factors that are likely to affect the future development, performance and position of the Group’sbusiness are contained in the Chairman’s Statement.
KEY PERFORMANCE INDICATORSGiven the early stage nature of the Group’s kimberlite portfolio, the Directors are of the opinion that analysis using financial KPIs is not appropriate for an understanding of the development, performance or position of the business at this time.
However, the Directors constantly review the planned exploration and evaluation expenditure and general operating costs to ensurethat cash resources are available prior to commitment to this expenditure.
In addition to the above, the Board also considers non-financial factors such as the Group’s compliance with Corporate GovernanceStandards and compliance with environmental, rehabilitation and other legislation within the Group’s areas of operations.
SHARE CAPITALOn 12 October 2010, a total of 38,000,000 ordinary shares of 5p each were allotted and issued for gross proceeds of $3,078,603.
On 29 March 2011, a total of 77,500,000 ordinary shares of 5p each were allotted and issued for gross proceeds of $9,922,891.
GOING CONCERNAs discussed in the Chairman’s Statement, the Company is focusing on advancing its kimberlite projects towards production. In March2011 the Company raised $9.9m (£6.2m) from an equity placing and at the balance sheet date had cash of $6.5m. Given the positiveresults being produced at both Tongo and Droujba and the stage of development of both projects, the directors believe that theCompany will continue to have the ability to access sufficient levels of finance to continue the Group’s projects for the foreseeablefuture. On that basis, the directors continue to adopt the going concern basis in preparing these financial statements.
CHARITABLE AND POLITICAL CONTRIBUTIONSThe Group made no political or charitable contributions during the year.
DIRECTORSDuring the year under review, the following directors held office:
Lord Daresbury Non-Executive ChairmanN. Karl Smithson Chief Executive Officer & Company SecretaryAngus Ogilvie Financial Director & Company Secretary (resigned 30/04/2011)James Campbell Non-Executive DirectorLuis Guilherme Cabrita da Silva Non-Executive DirectorSteven J. Poulton Non-Executive Director
DIRECTORS’ INTERESTSThe directors’ interests in the ordinary shares of the Company as of 30 June 2011 are disclosed in note 17 of the consolidated Financial Statements.
SUBSTANTIAL SHAREHOLDINGSAt 30 September 2011 so far as the Company is aware, the only holdings of 3% or more in the issued share capital are:
SUPPLIER PAYMENT POLICYThe Group’s policy is to settle terms of payment with suppliers when agreeing the terms of each transaction, ensure that suppliers aremade aware of the terms of payment and abide by the terms of payment. Trade creditors of the Group at 30 June 2011 were equivalentto 15 (2010: 17) days purchases.
PROPERTY PLANT AND EQUIPMENTDetails of the Group’s property plant and equipment is set out in Note 9 to the Group Financial Statements.
EMPLOYEE CONSULTATIONThe Group places considerable value on the involvement of its employees and has continued to keep them informed on mattersaffecting them as employees and on the various factors affecting the performance of the Group. This is achieved through formal and informal meetings.
FINANCIAL RISK MANAGEMENTDetails of the Group’s financial risk management policies are set out in Note 18 to the Group Financial Statements.
SUBSEQUENT EVENTSDetails of significant post balance sheet events affecting the Group and Company are set out in Note 19 to the Group FinancialStatements and Note 11 to the Company Financial Statements.
AUDITORSEach of the persons who is a director at the date of approval of this report confirms that:
1) so far as the director is aware, there is no relevant audit information of which the company’s auditors are unaware; and2) the director has taken all the steps that he/she ought to have taken as a director in order to make himself/herself aware of anyrelevant audit information and to establish that the company’s auditors are aware of that information.
This confirmation is given and should be interpreted in accordance with the provisions of s418 of the Companies Act, 2006.
A resolution to re-appoint Deloitte & Touche will be proposed at the forthcoming Annual General Meeting.
Approved by the Board and signed on its behalf by:
23ANNUAL REPORT AND ACCOUNTS 2011 STELLAR DIAMONDS PLC
Mano Diamonds Limited 14.2%
Richmond Partners Master Limited 8.1%
Blackrock Investment Management (UK) Limited 5.5%
Blackrock Smaller Companies Trust PLC 3.6%
Barclayshare Nominees Limited 3.4%
N. KARL SMITHSON LORD DARESBURY
24 ANNUAL REPORT AND ACCOUNTS 2011STELLAR DIAMONDS PLC
STATEMENT OFDIRECTORS’ RESPONSIBILITY
GOVERNANCE
The directors are responsible for preparing the Annual Report and the financial statements in accordance with applicable law and regulations.
Company Law requires the directors to prepare financial statements for each financial year. The directors are required to prepare thefinancial statements in accordance with International Financial Reporting Standards (IFRSs) as adopted by the European Union. Undercompany law the directors must not approve the financial statements unless they are satisfied that they give a true and fair view of thestate of affairs of the company and of the profit or loss of the company for that period. In preparing these financial statements,International Accounting Standard 1 requires that directors:
• properly select and apply accounting policies;• present information, including accounting policies in a manner that provides relevant, reliable, comparable and understandable
information;• provide additional disclosures when compliance with the specific requirements in IFRSs are insufficient to enable users to • understand the impact of particular transactions, other events and conditions on the entity’s financial position and financial
performance; and• make an assessment of the company’s ability to continue as a going concern.
The directors are responsible for keeping adequate accounting records that are sufficient to show and explain the company’stransactions and disclose with reasonable accuracy at any time the financial position of the company and enable them to ensure thatthe financial statements comply with the Companies Act 2006. They are also responsible for safeguarding the assets of the companyand hence for taking reasonable steps for the prevention and detection of fraud and other irregularities.
The directors are responsible for the maintenance and integrity of the corporate and financial information included on the company’swebsite. Legislation in the United Kingdom governing the preparation and dissemination of financial statements may differ fromlegislation in other jurisdictions.

25ANNUAL REPORT AND ACCOUNTS 2011 STELLAR DIAMONDS PLC
INDEPENDANT AUDITOR’S REPORT TO THE SHAREHOLDERS OF STELLAR DIAMONDS PLC
FINANCIAL STATEMENTS
We have audited the group financial statements of Stellar Diamonds plc. for the year ended 30 June 2011 which comprise theconsolidated statement of comprehensive income, the consolidated statement of financial position, the consolidated statement ofchanges in equity, the consolidated statement of cash flows and the related notes 1 to 19 and the parent company financial statementsof Stellar Diamonds plc. for the year ended 30 June 2011 which comprise the company statement of financial position, the companystatement of changes in equity, the company statement of cash flows and the related notes 1 to 11. The financial reporting frameworkthat has been applied in their preparation is applicable law and International Financial Reporting Standards (IFRSs) as adopted by theEuropean Union and as applied in accordance with the provisions of the Companies Act 2006.
This report is made solely to the company’s members, as a body, in accordance with Chapter 3 of Part 16 of the Companies Act 2006.Our audit work has been undertaken so that we might state to the company’s members those matters we are required to state to them inan auditors’ report and for no other purpose. To the fullest extent permitted by law, we do not accept or assume responsibility to anyoneother than the company and the company’s members as a body, for our audit work, for this report, or for the opinions we have formed.
RESPECTIVE RESPONSIBILITIES OF DIRECTORS AND AUDITORSAs explained more fully in the Statement of Directors’ Responsibilities, the directors are responsible for the preparation of the financialstatements and for being satisfied that they give a true and fair view. Our responsibility is to audit the financial statements in accordancewith applicable law and International Standards on Auditing (UK and Ireland). Those standards require us to comply with the AuditingPractices Board’s (APB’s) Ethical Standards for Auditors.
SCOPE OF THE AUDIT OF THE FINANCIAL STATEMENTSAn audit involves obtaining evidence about the amounts and disclosures in the financial statements sufficient to give reasonable assurance thatthe financial statements are free from material misstatement, whether caused by fraud or error. This includes an assessment of: whether theaccounting policies are appropriate to the group’s and the parent company’s circumstances and have been consistently applied and adequatelydisclosed; the reasonableness of significant accounting estimates made by the directors; and the overall presentation of the financial statements.
OPINION ON FINANCIAL STATEMENTSIn our opinion:
• the financial statements give a true and fair view of the state of the group’s and the parent company’s affairs as at 30 June 2011 and of the group’s loss for the year then ended;
• the group financial statements have been properly prepared in accordance with IFRSs as adopted by the European Union;• the parent company financial statements have been properly prepared in accordance with IFRSs as adopted by the European Union
and as applied in accordance with the provisions of the Companies Act 2006; and• the financial statements have been prepared in accordance with the requirements of the Companies Act 2006.
EMPHASIS OF MATTERWithout qualifying our opinion, we draw your attention to notes 8 and 9 to the group financial statements and notes 3, 4 and 5 to theparent company financial statements concerning the valuation of intangible and tangible assets, the recoverability of amounts due fromsubsidiaries and the recoverability of investments in subsidiaries. The realisation of intangible assets of $7,168,005 and tangible assets of$7,150,956 included in the consolidated statement of financial position and intangible assets of $1,302,561, investment in subsidiaries of$4,157,484 and amounts due from subsidiaries of $15,787,711 included in the company statement of financial position are dependent onthe discovery and successful development of economic mineral reserves including the group's ability to raise sufficient finance todevelop the projects. The financial statements do not include any adjustments relating to these uncertainties and the ultimate outcomecannot, at present, be determined.
SEPARATE OPINION IN RELATION TO IFRSS AS ISSUED BY THE IASBAs explained in note 1 to the financial statements, the group in addition to complying with its legal obligation to apply IFRSs as adoptedby the European Union, has also applied IFRSs as issued by the International Accounting Standards Board (IASB). In our opinion thegroup financial statements comply with IFRSs as issued by the IASB.
OPINION ON OTHER MATTER PRESCRIBED BY THE COMPANIES ACT 2006In our opinion the information given in the Directors’ Report for the financial year for which the financial statements are prepared is consistent with the financial statements.
MATTERS ON WHICH WE ARE REQUIRED TO REPORT BY EXCEPTIONWe have nothing to report in respect of the following matters where the Companies Act2006 requires us to report to you if, in our opinion:
• adequate accounting records have not been kept by the parent company, or returns adequate for our audit have not been received from branches not visited by us; or
• the parent company financial statements are not in agreement with the accounting records and returns; or
• certain disclosures of directors’ remuneration specified by law are not made; or• we have not received all the information and explanations we require for our audit.
KEVIN SHEEHAN(Senior Statutory Auditor)for and on behalf of Deloitte & ToucheChartered Accountants and Statutory Auditors Deloitte & Touche HouseEarlsfort Terrace, Dublin 2, Ireland5 October 2011

26 ANNUAL REPORT AND ACCOUNTS 2011STELLAR DIAMONDS PLC
CONSOLIDATED STATEMENT OFCOMPREHENSIVE INCOMEFOR THE YEAR ENDED 30 JUNE 2011 (STATED IN U.S. DOLLARS)
FINANCIAL STATEMENTS
Year ended Nine months ended
Notes 30 June 2011 30 June 2011
Revenue 3 1,518,002 2,032,762
Cost of sales (4,067,699) (4,233,730)
Gross loss (2,549,697) (2,200,968)
Impairment of tangible assets 9 (8,643,201) -
Administrative expenses (3,705,610) (3,201,700)
(12,348,811) (3,201,700)
Finance income - 317
Finance costs (35,488) (168,080)
Loss before tax (14,933,996) (5,570,431)
Income tax expense 6 - -
Loss after tax attributable to equity holders of the parent 4 (14,933,996) (5,570,431)
Total comprehensive income for the year/ period attributable to equity holders of the parent
(14,933,996) (5,570,431)
Weighted average number of shares 145,962,871 64,451,236
Basic and diluted loss per share 7 (0.10) (0.09)

30 June 30 June
Notes 2011 2010
Assets
Non-current assets
Intangible assets 8 7,168,005 4,943,544
Property, plant and equipment 9 7,150,956 17,057,939
Total non-current assets 14,318,961 22,001,483
Current assets
Inventories 10 507,242 357,499
Trade and other receivables 11 194,487 841,868
Cash and cash equivalents 6,518,640 689,650
Total current assets 7,220,369 1,889,017
Total assets 21,539,330 23,890,500
Equity and liabilities
Capital and reserves
Share capital 12 17,161,566 7,875,264
Share premium 12 25,055,393 22,023,543
Reverse acquisition reserve 2 17,073,279 17,073,279
Warrant reserve 12 155,235 143,024
Share option reserve 13 4,177,000 3,610,185
Convertible loan reserve 14 - 87,853
Accumulated loss (42,503,397) (27,712,425)
Total equity 21,119,076 23,100,723
Non-current liabilities
Convertible loan 14 - 397,209
Provision 15 104,369 54,369
Total non-current liabilities 104,369 451,578
Current liabilities
Trade and other payables 16 315,885 338,199
Total current liabilities 315,885 338,199
Total liabilities 420,254 789,777
Total equity and liabilities 21,539,330 23,890,500
27ANNUAL REPORT AND ACCOUNTS 2011 STELLAR DIAMONDS PLC
CONSOLIDATED STATEMENT OFFINANCIAL POSITION AS AT 30 JUNE 2011 (STATED IN U.S. DOLLARS)
FINANCIAL STATEMENTS
The financial statements of Stellar Diamonds plc, registered number: 5424214 were approved by the Board of Directors and authorisedfor issue on. They were signed on its behalf by:
N. KARL SMITHSON LORD DARESBURY

28 ANNUAL REPORT AND ACCOUNTS 2011STELLAR DIAMONDS PLC
CONSOLIDATED STATEMENT OFCHANGES IN EQUITYFOR THE YEAR ENDED 30 JUNE 2011 (STATED IN U.S. DOLLARS)
FINANCIAL STATEMENTS
Share capital
(note 12)
Sharepremium(note 12)
Warrantreserve
(note 12)
Share option
reserve(note 13)
Convertibleloan reserve
(note 14)
Reverse acquisition
reserve(note 2)
Accumulatedloss
Totalequity
Balance at 30 September 2009 956,474 31,272,947 269,801 2,709,261 87,853 166,672 (22,411,795) 13,051,213
Total comprehensive income for the period
- - - - - - (5,570,431) (5,570,431)
Issue of shares to directors (note 12)
335 33,131 - - - - - 33,466
Conversion of debt to equity (note 12)
9,049 895,868 - - - - - 904,917
Reverse acquisition adjustment (note 12)
4,623,043 (16,443,279) - 639,292 - 16,906,607 - 5,725,663
Issue of placing shares (note 12)
1,951,938 5,784,958 - - - - 7,736,896
Share warrants issued (note 12)
- (143,024) 143,024 - - - - -
Share issue costs (note 12)
- (380,023) - - - - - (380,023)
Re-pricing of Stellar Diamonds Limited share options (notes 2 and 12)
- - - 261,632 - - - 261,632
Shares issued to directors on admission to AIM (note 12)
8,784 26,044 - - - - - 34,828
Other shares issued (note 12)
325,641 976,921 - - - - - 1,302,562
Expired warrants - - (269,801) - - - 269,801 -
Balance at 30 June 2010 7,875,264 22,023,543 143,024 3,610,185 87,853 17,073,279 (27,712,425) 23,100,723
Total comprehensive income for the year
- - - - - - (14,933,996) (14,933,996)
Repayment of convertible loan (note 14)
- - - - (87,853) - - (87,853)
Issue of placing shares (note 12)
9,280,410 3,721,084 - - - - - 13,001,494
Share warrants issued (note 12) - (155,235) 155,235 - - - - -
Share issue costs (note 12) - (539,757) - - - - - (539,757)
Warrants expired (note 12) - - (143,024) - - - 143,024 -
Other shares issued (note 12) 5,892 5,758 - - - - - 11,650
Share options issued (note 13) - - - 566,815 - - - 566,815
Balance at 30 June 2011 17,161,566 25,055,393 155,235 4,177,000 - 17,073,279 (42,503,397) 21,119,076

29ANNUAL REPORT AND ACCOUNTS 2011 STELLAR DIAMONDS PLC
CONSOLIDATED STATEMENT OF CASH FLOWS FOR THE YEAR ENDED 30 JUNE 2011 (STATED IN U.S. DOLLARS)
FINANCIAL STATEMENTS
Year ended Nine months ended
30 June 2011 30 June 2010
Cash flows from operating activities:
Net loss for the year/period (14,933,996) (5,570,431)
Adjustments for:
- Depreciation of property, plant and equipment 1,638,860 1,563,844
- Impairment of property, plant and equipment 8,643,201 -
- Share-based payment expense 566,815 261,632
- Shares issued to directors in lieu of fees 234,863 34,828
- Interest income - (317)
- Interest expense 35,488 168,080
- Net foreign exchange (gain)/loss (41,184) 79,606
Change in working capital items:
- Decrease/(Increase) in receivables 647,381 (200,327)
- (Increase)/Decrease in stock (149,743) 204,983
- Increase/(Decrease) in trade and other payables 87,381 (203,260)
Net cash used in operations (3,270,934) (3,661,362)
Cash flows from investing activities
- Acquisition of subsidiary - 11,384
- Purchases of property, plant and equipment (403,398) (2,002,708)
- Payments to acquire intangible assets (2,196,141) (460,541)
- Interest received - 317
- Repayment of other liabilities - (715,478)
Net cash used in investing activities (2,599,539) (3,167,026)
Cash flows from financing activities
- Repayment of convertible loans (485,062) (100,000)
- Proceeds from issue of share capital, net of costs 12,238,524 7,356,873
- Interest paid (95,183) (52,195)
Net cash generated by financing activities 11,658,279 7,204,678
Net increase in cash and cash equivalents 5,787,806 376,290
Cash and cash equivalents, beginning of year 689,650 418,981
Effect of foreign exchange rate changes 41,184 (105,621)
Cash and cash equivalents, end of year 6,518,640 689,650

30 ANNUAL REPORT AND ACCOUNTS 2011STELLAR DIAMONDS PLC
NOTES TO THE CONSOLIDATEDFINANCIAL STATEMENTSFOR THE YEAR ENDED 30 JUNE 2011 (STATED IN U.S. DOLLARS)
FINANCIAL STATEMENTS
1. BASIS OF PREPARATION1.1 Basis of accountingStellar Diamonds plc is presenting audited financial statements as of and for the year ended 30 June 2011. The comparative periodpresented is audited financial statements as of and for the nine months ended 30 June 2010 of Stellar Diamonds plc and therefore is not entirely comparable with the current year.
The financial statements have been prepared in accordance with International Financial Reporting Standards (“IFRS”). The financialstatements have also been prepared in accordance with IFRSs as adopted by the European Union. They also have been prepared inaccordance with the Companies Act 2006. The consolidated financial statements have been prepared on an historical cost basis, as adjusted for certain financial instruments carried at fair value.
1.2 Going concernThe Company’s business activities, together with the factors likely to affect its future development, and performance are set out in theChairman’s Statement. As discussed in the Chairman’s Statement the Company is focusing on advancing its kimberlite projects towardsproduction. In March 2011 the Company raised $9.9m (£6.2m) from an equity placing and at the balance sheet date had cash of $6.5m.Given the positive results being produced at both Tongo and Droujba and the stage of development of both projects, the directorsbelieve that the Company will continue to have the ability to access sufficient levels of finance to continue the Group’s projects for the foreseeable future. On that basis the directors continue to adopt the going concern basis in preparing these financial statements.
1.3 Standards adopted during the periodThe Company has adopted the following standards which are effective for the first time this year.
• Improvements to IFRSs 2009 (effective 1 January 2010)• Amendment to IAS 32 Classification of Rights Issues (effective 1 February 2010)• Amendment to IFRS 2 Group Cash-settled Share-based Payment Transactions (effective 1 January 2010)• Amendments to IFRS 1 Additional Exemptions for First-time Adopters (effective 1 January 2010)• Amendment to IFRIC 14 Prepayments of a Minimum Funding Requirement (effective 1 January 2011)• IFRIC 17 Distributions of Non-Cash Assets to Owners Estate (effective 1 July 2010)• IFRIC 18 Transfer of Assets from Customers (effective 1 November 2009)• IFRIC 19 Extinguishing Financial Liabilities with Equity Instruments (effective 1 July 2010)
The adoption of these standards and interpretations did not have a material impact to the consolidated financial statements.
1.4 Standards in issue but not yet effectiveThe following standards and interpretations which have been recently issued or revised have not been adopted early.
• Amendments to IAS 1 Presentation of Items of Other Comprehensive Income (1 July 2012)• IAS 19 (revised June 2011) Employee Benefits (1 January 2013)• IFRS 13 Fair Value Measurement (1 January 2013)• IFRS 12 Disclosure of Interests in Other Entities (1 January 2013)• IFRS 11 Joint Arrangements (1 January 2013)• IFRS 10 Consolidated Financial Statements (1 January 2013)• IAS 28 Investments in Associates and Joint Ventures (1 January 2013)• IAS 27 Separate Financial Statements (1 January 2013)• Amendments to IAS 12 Deferred Tax: Recovery of Underlying Assets (1 January 2012)• Amendments to IFRS 1 Severe Hyperinflation and Removal of Fixed Dates for First-time Adopters (1 January 2011)• Amendments to IFRS 7 Disclosures – Transfers of Financial Assets (1 July 2011)• Improvements to IFRSs 2010 (1 January 2011)• Amendment to IFRS 1 Limited Exemption from Comparative IFRS 7 Disclosures for First-time Adopters (1 July 2010)• IFRS 9 Financial Instruments (1 January 2013)• IAS 24 Related Party Disclosures (1 January 2011)• IAS 32 Classification of Rights Issues (1 February 2010)• Amendments to IFRS 1 Additional Exemptions for First-time Adopters (1 January 2010)• Revised IAS 24 Related Party Disclosures (effective 1 January 2011)
The directors anticipate that the adoption of these standards and interpretations in future years will have no material impact on the financial statements.

31ANNUAL REPORT AND ACCOUNTS 2011 STELLAR DIAMONDS PLC
2. SIGNIFICANT ACCOUNTING POLICIESThe accounting policies set out below have been applied consistently in these financial statements, unless otherwise stated.
2.1 Basis of consolidation 2.1.1 Business combinationsThe acquisition of subsidiaries is accounted for using the acquisition method. The cost of acquisition is measured at the aggregate ofthe fair values, at the date of exchange, of assets given, liabilities incurred or assumed, and equity instruments issued by the Group inexchange for control of the acquiree. The acquiree’s identifiable assets, liabilities and contingent liabilities that meet the conditions for recognition under IFRS 3 are recognised at their fair value at the acquisition date.
2.1.2 Reverse acquisitionStellar Diamonds Limited completed its reverse acquisition of West African Diamonds plc (WAD) in February 2010. A reverse acquisitionoccurs when the company that issues equity securities (the legal acquirer) is identified as the acquiree for accounting purposes. The entity whose equity interests are acquired (the legal acquiree) is treated as the acquirer for accounting purposes.
In a reverse acquisition, the accounting acquirer usually issues no consideration for the acquiree. Instead, the accounting acquireeusually issues its equity shares to the owners of the accounting acquirer. Accordingly, the acquisition-date fair value of the considerationtransferred by the accounting acquirer for its interest in the accounting acquiree is based on the number of equity interests the legalsubsidiary would have had to issue to give the owners of the legal parent the same percentage equity interest in the combined entitythat results from the reverse acquisition.
Consolidated financial statements prepared following a reverse acquisition are issued under the name of the legal parent (accountingacquiree) but described in the notes as a continuation of the financial statements of the legal subsidiary (accounting acquirer), with oneadjustment, which is to adjust retroactively the accounting acquirer’s legal capital to reflect the legal capital of the accounting acquiree.That adjustment is required to reflect the capital of the legal parent (the accounting acquiree). Comparative information presented in theconsolidated financial statements also is retroactively adjusted to reflect the legal capital of the legal parent (accounting acquiree).
Because the consolidated financial statements represent the continuation of the financial statements of the legal subsidiary except for its capital structure, the consolidated financial statements on the date of acquisition reflect:
(a) the assets and liabilities of the legal subsidiary (the accounting acquirer) recognised and measured at their pre-combination carrying amounts;(b) the assets and liabilities of the legal parent (the accounting acquiree) recognised and measured in accordance with IFRS 3;(c) the retained earnings and other equity balances of the legal subsidiary(accounting acquirer) before the business combination.(d) the amount recognised as issued equity interests in the consolidated financial statements determined by adding the issued equityinterest of the legal subsidiary (the accounting acquirer) outstanding immediately before the business combination to the fair value ofthe legal parent (accounting acquiree) determined in accordance with this IFRS. However, the equity structure (ie the number and typeof equity interests issued) reflects the equity structure of the legal parent (the accounting acquiree), including the equity interests thelegal parent issued to effect the combination. Accordingly, the equity structure of the legal subsidiary (the accounting acquirer) isrestated using the exchange ratio established in the acquisition agreement to reflect the number of shares of the legal parent (the accounting acquiree) issued in the reverse acquisition.
2.1.3 Subsidiaries Subsidiaries are entities controlled by the Company. Control exists when the Company has the power, directly or indirectly, to governthe financial and operating policies of an entity so as to obtain benefits from its activities. In assessing control, potential voting rightsthat presently are exercisable or convertible are taken into account. The financial statements of subsidiaries are included in theconsolidated financial statements from the date that control commences until the date that control ceases.
2.1.4 Transactions eliminated on consolidation Intra-group balances and any unrealized gains and losses or income and expenses arising from intra-group transactions, are eliminatedin preparing the consolidated financial statements.

32 ANNUAL REPORT AND ACCOUNTS 2011STELLAR DIAMONDS PLC
NOTES TO THE CONSOLIDATEDFINANCIAL STATEMENTS (CONTINUED)FOR THE YEAR ENDED 30 JUNE 2011 (STATED IN U.S. DOLLARS)
FINANCIAL STATEMENTS
2. SIGNIFICANT ACCOUNTING POLICIES (CONTINUED)2.2 Foreign currency translation2.2.1 Functional and presentation currencyItems included in the financial statements of each of the Group’s entities are measured using the currency of the primary economicenvironment in which the entity operates (“the functional currency”). The consolidated financial statements are presented in U.S. dollars(“$”), which is the functional and presentation currency for all the group’s operations.
2.2.2 Foreign currency transactionsForeign currency transactions are translated into the functional currency using the exchange rates prevailing at the dates of thetransactions. Foreign exchange gains and losses resulting from the settlement of such transactions and from the translation at period-end exchange rates of monetary assets and liabilities denominated in foreign currencies are recognised in the consolidatedstatement of comprehensive income.
2.3 Property, plant and equipmentAll property, plant and equipment are stated at historical cost less depreciation. Historical cost includes expenditures that are directlyattributable to the acquisition of the items. Subsequent costs are included in the asset’s carrying amount or recognized as a separateasset, as appropriate, only when it is probable that future economic benefits associated with the item will flow to the group and the costof the item can be measured reliably. The carrying amounts of any replaced parts are derecognized. All other repairs and maintenanceare charged to the consolidated statement of comprehensive income during the financial period in which they are incurred.
Mining assets, which include evaluation and development costs capitalised prior to commencement of production, are depreciatedusing a unit of production method based on the quantity of carats produced over the estimated economically recoverable reserves.
Machinery and equipment, which is comprised of office furniture, automobiles and other equipment, are depreciated at 30% per annumon a reducing balance basis.
Assets in the course of construction are carried at cost less any recognised impairment loss. Depreciation of these assets commenceswhen the assets are ready for their intended use.
The assets’ residual values and useful lives are reviewed, and adjusted if appropriate, at each balance sheet date. An asset’s carrying amountis written down immediately to its recoverable amount if the asset’s carrying amount is greater than its estimated recoverable amount.
2.4 Intangible Assets - Exploration and evaluation expenditureThe Group follows the method of accounting for its mineral properties whereby all costs related to acquisition, exploration andevaluation are capitalized pending determination of the feasibility of the project. These assets are not depreciated.
Exploration and evaluation assets are assessed for impairment when facts and circumstances suggest that the carrying amount of anexploration and evaluation asset may exceed its recoverable amount. When facts and circumstances suggest that the carrying amountexceeds the recoverable amount, the Group measures, presents and discloses any resulting impairment loss in the consolidatedstatement of comprehensive income.
The facts and circumstances indicating impairment include the following:• the period for which the Group has a right to explore in the specific area has expired or is expected to expire;• the exploration and evaluation has not led to the discovery of economic reserves;• the development of the reserves is not economically or commercially viable; and• the exploration is located in an area that has become politically unstable.
Exploration costs are capitalised as an intangible asset until technical feasibility and commercial viability of extraction of reserves are demonstrable, when the capitalised exploration costs are re-classed to property, plant and equipment. Exploration costs include an allocation of administration and salary costs (including share based payments) as determined by management. Prior to reclassification to property, plant and equipment, exploration and evaluation assets are assessed for impairment and any impairment loss recognised immediately in the statement of comprehensive income.

33ANNUAL REPORT AND ACCOUNTS 2011 STELLAR DIAMONDS PLC
2. SIGNIFICANT ACCOUNTING POLICIES (CONTINUED)2.5 Impairment At each balance sheet date, the Group reviews the carrying amounts of its non-current assets to determine whether there is anyindication that those assets have suffered an impairment loss. If any such indication exists, the recoverable amount of the asset isestimated in order to determine the extent of the impairment loss (if any). Where the asset does not generate cash flows that areindependent from other assets, the group estimates the recoverable amount of the cash-generating unit to which the asset belongs.
Recoverable amount is the higher of fair value less costs to sell and value in use. In assessing value in use, the estimated future cashflows are discounted to their present value using a pre-tax discount rate that reflects current market assessments of the time value of money and the risks specific to the asset for which the estimates of future cash flows have not been adjusted.
If the recoverable amount of an asset (or cash-generating unit) is estimated to be less than its carrying amount, the carrying amount of the asset (cash-generating unit) is reduced to its recoverable amount. An impairment loss is recognised as an expense immediately.
Where an impairment loss subsequently reverses, the carrying amount of the asset (cash-generating unit) is increased to the revisedestimate of its recoverable amount, but so that the increased carrying amount does not exceed the carrying amount that would havebeen determined had no impairment loss been recognised for the asset (cash-generating unit) in prior periods. A reversal of animpairment loss is recognised as income immediately.
2.6 InventoriesInventories are stated at the lower of cost and net realisable value. Cost of production includes an appropriate portion of productionoverheads. Net realisable value represents the estimated selling price in the ordinary course of business less the estimated costs ofcompletion and the estimated costs necessary to make the sale.
2.7 ProvisionsProvisions are recognised when the Group has a present obligation as a result of a past event, it is probable that the Group will berequired to settle the obligation and a reliable estimate can be made of the amount of obligation. Where the effect of discounting ismaterial, provisions are discounted. The discount rate used is a pre-tax rate that reflects current market assessment of the time value of money and, where appropriate, the risks specific to the liability.
2.8 Decommissioning, mine closure and environmental rehabilitationThe estimated cost of decommissioning, mine closure and environmental rehabilitation is based on current legal requirements andexisting technology. A provision is raised based on the present value of the estimated costs. These costs are included in the cost of the related asset. The capitalised assets are depreciated in accordance with the accounting policy for property, plant and equipment.
2.9 Financial instrumentsLoans and receivablesTrade receivables, loans and other receivables that have fixed and determinable payments that are not quoted in an active market areclassified as loans and receivables. Loans and receivables are initially measured at fair value and subsequently measured at amortisedcost using the effective interest method. Interest income is recognised by applying the effective interest rate, except for short-termreceivables when the recognition of interest would be immaterial.
Impairment of financial assets at amortised costFinancial assets that are measured at amortised cost are assessed for indicators of impairment at the end of each reporting period.Financial assets are considered to be impaired when there is objective evidence that, as a result of one or more events that occurredafter the initial recognition of the financial asset, the estimated future cash flows of the financial asset have been affected.
Derecognition of financial assetsThe Group derecognises a financial asset only when the contractual rights to the cash flows from the asset expire; or it transfers thefinancial asset and substantially all the risks and rewards of ownership of the asset to another entity. If the Group neither transfers norretains substantially all the risks and rewards of ownership and continues to control the transferred asset, the Group recognises itsretained interest in the asset and an associated liability for amounts it may have to pay. If the Group retains substantially all the risks and rewards of ownership of a transferred financial asset, the Group continues to recognise the financial asset and also recognises a collateralised borrowing for the proceeds received.

34 ANNUAL REPORT AND ACCOUNTS 2011STELLAR DIAMONDS PLC
FINANCIAL STATEMENTS
NOTES TO THE CONSOLIDATEDFINANCIAL STATEMENTS (CONTINUED)FOR THE YEAR ENDED 30 JUNE 2011 (STATED IN U.S. DOLLARS)
2. SIGNIFICANT ACCOUNTING POLICIES (CONTINUED)Cash and cash equivalentsCash and cash equivalents comprise cash on hand and demand deposits, and other short-term highly liquid investments that are readilyconvertible to a known amount of cash and are subject to an insignificant risk of changes in value.
Financial liabilities and equityFinancial liabilities and equity instruments are classified according to the substance of the contractual arrangements entered into.
Equity instrumentsAn equity instrument is any contract that evidences a residual interest in the assets of the group after deducting all of its liabilities. Equity instruments issued by the Group are recorded at the proceeds received, net of direct issue costs.
Compound instrumentsThe component parts of compound instruments issued by the Group are classified separately as financial liabilities and equity inaccordance with the substance of the contractual arrangement. At the date of issue, in the case of a convertible bond denominated inthe functional currency of the issuer that may be converted into a fixed number of equity shares, the fair value of the liability componentis estimated using the prevailing market interest rate for a similar non-convertible instrument. This amount is recorded as a liability on anamortised cost basis using the effective interest method until extinguished upon conversion or at the instrument’s maturity date. Theequity component is determined by deducting the amount of the liability component from the fair value of the compound instrumentas a whole. This is recognised and included in equity, net of income tax effects, and is not subsequently remeasured.
Issue costs are apportioned between the liability and equity components of the convertible loan notes based on their relative carryingamounts at the date of issue. The portion relating to the equity component is charged directly against equity.
Financial liabilities Financial liabilities are classified as either financial liabilities ‘at FVTPL’ or ‘other financial liabilities’.
Financial liabilities at FVTPL Financial liabilities are classified as at FVTPL where the financial liability is either held for trading or it is designated as at FVTPL.
A financial liability is classified as held for trading if:• it has been incurred principally for the purpose of disposal in the near future; or• it is a part of an identified portfolio of financial instruments that the Group manages together and has a recent actual pattern
of short-term profit-taking; or • it is a derivative that is not designated and effective as a hedging instrument.
A financial liability other than a financial liability held for trading may be designated as at FVTPL upon initial recognition if:• such designation eliminates or significantly reduces a measurement or recognition inconsistency that would otherwise arise; or • the financial liability forms part of a group of financial assets or financial liabilities or both, which is managed and its performance
is evaluated on a fair value basis, in accordance with the Group's documented risk management or investment strategy, and information about the Group is provided internally on that basis; or
• it forms part of a contract containing one or more embedded derivatives, and IAS 39 Financial Instruments: Recognition and Measurement permits the entire combined contract (asset or liability) to be designated as at FVTPL.
Financial liabilities at FVTPL are stated at fair value, with any resultant gain or loss recognised in the consolidated statement ofcomprehensive income as the Group chooses not to disclose the effective interest rate for debt instruments that are classified as at fairvalue through profit or loss. The net gain or loss recognised in the consolidated statement of comprehensive income incorporates anyinterest paid on the financial liability.
Other financial liabilities Other financial liabilities, including borrowings, are initially measured at fair value, net of transaction costs. Other financial liabilities aresubsequently measured at amortised cost using the effective interest method, with interest expense recognised on an effective yieldbasis. The effective interest method is a method of calculating the amortised cost of a financial liability and of allocating interestexpense over the relevant period. The effective interest rate is the rate that exactly discounts estimated future cash payments throughthe expected life of the financial liability, or, where appropriate, a shorter period.
2. SIGNIFICANT ACCOUNTING POLICIES (CONTINUED)

35ANNUAL REPORT AND ACCOUNTS 2011 STELLAR DIAMONDS PLC
Derecognition of financial liabilitiesThe Group derecognises financial liabilities when, and only when, the Group’s obligations are discharged, cancelled or they expire.
Embedded derivativesDerivatives embedded in other financial instruments or other host contracts are treated as separate derivatives when their risks and characteristics are not closely related to those of the host contracts and the host contracts are not measured at fair value throughprofit or loss.
An embedded derivative is presented as a non-current asset or a non-current liability if the remaining maturity of the hybrid instrumentto which the embedded derivatives relates to is more than 12 months and is not expected to be realised or settled within 12 months.
2.10 Income tax The current income tax charge is calculated on the basis of the tax laws enacted or substantively enacted at the balance sheet date in the countries where the company’s subsidiaries operate and generate taxable income. Management periodically evaluate positionstaken in tax returns with respect to situations in which applicable tax regulation is subject to interpretation and establishes provisionswhere appropriate on the basis of amounts expected to be paid to the tax authorities.
Deferred tax is provided in full, using the liability method, on temporary differences arising between the tax bases of assets and liabilitiesand their carrying amounts in the consolidated financial statements. However, the deferred tax is not accounted for if it arises frominitial recognition of an asset or liability in a transaction other than a business combination that at the time of the transaction affectsneither accounting nor taxable profit or loss. Deferred tax is determined using tax rates (and laws) that have been enacted orsubstantively enacted by the balance sheet date and are expected to apply when the related deferred tax asset is realised or the deferredtax liability is settled.
Deferred tax assets are recognised to the extent that it is probable that future taxable profit will be available against which the temporarydifferences can be utilised.
Deferred tax is provided on temporary differences arising on investments in subsidiaries and associates, except where the timing of the reversal of the temporary difference is controlled by the Company and it is probable that the temporary difference will not reverse in the foreseeable future.
2.11 Share-based paymentsEquity-settled share-based payments to employees and others providing similar services are measured at the fair value of the equityinstruments at the grant date. Fair value is measured by use of a Black-Scholes model. The expected life used in the model has beenadjusted, based on management’s best estimate, for the effects of non-transferability, exercise restrictions and behaviouralconsiderations.
Equity-settled share options granted to employees vest immediately and therefore the charge is recognised in the consolidatedstatement of comprehensive income at the grant date.
Equity-settled share-based payment transactions with other parties are measured at the fair value of the goods and services received,except where the fair value cannot be estimated reliably, in which case they are measured at the fair value of the equity instrumentsgranted, measured at the date the entity obtains the goods or the counterparty renders the service.
2.12 Revenue recognitionRevenue relating to sale of diamonds is measured at the fair value of the consideration received or receivable. Revenue is recognisedwhen the following conditions are satisfied:
• the Group has transferred to the buyer the significant risks and rewards of ownership of the goods;• the Group retains neither the continuing managerial involvement to the degree usually associated with ownership nor effective
control over the goods sold;• the amount of revenue can be measured reliably;• it is probable that the economic benefits associated with the transaction will flow to the Group; and• the costs incurred or to be incurred in respect of the transaction can be measured reliably.
2. SIGNIFICANT ACCOUNTING POLICIES (CONTINUED)

ANNUAL REPORT AND ACCOUNTS 2011STELLAR DIAMONDS PLC
FINANCIAL STATEMENTS
NOTES TO THE CONSOLIDATEDFINANCIAL STATEMENTS (CONTINUED)FOR THE YEAR ENDED 30 JUNE 2011 (STATED IN U.S. DOLLARS)
2.13 Critical accounting judgements and sources of estimation uncertaintyIn the application of the Group’s accounting policies, the directors are required to make judgements, estimates and assumptions aboutthe carrying amounts of assets and liabilities that are not readily apparent from other sources. The estimates and associated assumptionsare based on historical experience and other factors that are considered to be relevant. Actual results may differ from these estimates.
The estimates and underlying assumptions are reviewed on an ongoing basis. Revisions to accounting estimates are recognised in theperiod in which the estimate is revised if the revision affects only that period, or in the period of the revision and future periods if therevision affects both current and future periods.
Key sources of estimation uncertainty and judgements made in applying specific accounting policies are as follows:
Share based paymentsIn determining the fair value of share-based payments made during the period to employees and those parties providing services of a similar nature, a number of assumptions have been made by management. The details of these assumptions are reflected in note 13.
Carrying value of non-current assetsThe continuing production from the Mandala mine and the outcome of ongoing exploration, and therefore whether the carrying valueof the mining assets, machinery and equipment and exploration and evaluation expenditures will ultimately be recovered, is inherently uncertain.
The ability of the Company to realise the carrying values of these assets is contingent upon production or discovery of economicallyrecoverable mineral reserves, the on-going title to the resource properties, the ability of the Company to finance the development of the properties and on the future profitable production or proceeds from the property. The success of the Company’s mineralexploration properties is also influenced by significant risks, legal and political risks and future diamond prices.
The directors make the judgements necessary to implement the Group’s policy with respect to capitalisation of these assets andconsider them for impairment at least annually with reference to indicators in IAS 36 and IFRS 6. If an indication exists, an assessment is made of the recoverable amount. The recoverable amount is the higher of value in use (being the net present value of expectedfuture cash flows) and fair value less costs to sell. Value in use is estimated based on operational forecasts for advanced stage projectswith key inputs that include diamond resources, diamond prices, production levels including grade and tonnes processed, productioncosts and capital expenditure. However, because of the above-mentioned uncertainties, actual future cash flows could materially differfrom those estimated.
The carrying value of mining assets, resource properties and deferred exploration costs are set out in notes 8 and 9.
ProvisionsEstimates and assumptions are made in determining the amount attributable to rehabilitation provision. These deal with uncertaintiessuch as legal and regulatory framework, timing and future costs. The carrying value of rehabilitation provision is disclosed in note 15.
Depreciation of mining assetsIn order to calculate depreciation on mining assets, the Group estimates commercially recoverable reserves based on an independentreport prepared by a competent person in accordance with June 2009 Note for Mining, Oil and Gas Companies issued by the LondonStock Exchange plc, Alternative Investment Market.
36

37STELLAR DIAMONDS PLCANNUAL REPORT AND ACCOUNTS 2011
3. SEGMENTSThe Company is engaged in the acquisition, exploration, development and production of diamond properties in the West Africancountries of Sierra Leone and Guinea. Information presented to the Chief Executive Officer for the purposes of resource allocation and assessment of segment performance is focused on the individual projects in geographical locations. The reportable segmentsunder IFRS 8 are therefore as follows:
• Mandala (Guinea);• Bomboko (Guinea);• Kono (Sierra Leone);• Tongo (Sierra Leone);• Droujba (Guinea)• Other exploration• Corporate activities in the United Kingdom;
Following is an analysis of the Group’s revenue, results, assets and liabilities by reportable segment for the year ended 30 June 2011:
During the year ended 30 June 2011 sales made to three customer accounted for 99% of total revenues (nine months ended 30 June2010: 95% to two customers).
Mandala Bomboko Kono Tongo DroujbaOther
explorationCorporate Total
$ $ $ $ $ $ $ $
Revenue – sale of diamonds 1,265,808 252,194 - - - - - 1,518,002
Segment result (8,030,976) (4,711,580) (4,684) 1,313 (284) - (2,152,297) (14,898,508)
Finance costs (35,488)
Loss before tax (14,933,996)
Income tax expense -
Loss after tax (14,933,996)
Segment assets 5,352,041 1,874,686 3,984,679 1,808,565 1,338,201 203,887 6,977,271 21,539,330
Segment liabilities (74,369) (30,000) - - - - (315,885) (420,254)
Share based payment expense - - - - - (566,815) (566,815)
Net book value of intangible assets
- - 3,919,049 1,384,038 1,259,190 191,119 414,609 7,168,005
Net book value of property, plant and equipment
4,838,526 1,834,534 14,975 373,116 78,593 10,846 366 7,150,956
Capital additions
- property, plant and equipment 25,108 40,168 14,975 244,554 78,593 - - 403,398
- intangible assets - - 446,630 667,861 1,109,970 - - 2,224,461
Depreciation of property, plantand equipment
599,171 1,037,517 - 28,320 - - 2,172 1,667,180
Impairment of property, plantand equipment
5,255,868 3,387,333 - - - - - 8,643,201

38 ANNUAL REPORT AND ACCOUNTS 2011STELLAR DIAMONDS PLC
FINANCIAL STATEMENTSFINANCIAL STATEMENTS
NOTES TO THE CONSOLIDATEDFINANCIAL STATEMENTS (CONTINUED)FOR THE YEAR ENDED 30 JUNE 2011 (STATED IN U.S. DOLLARS)
4. LOSS FOR THE YEARLoss for the year has been arrived at after charging/(crediting):
'$28,320 of depreciation charges were capitalised as exploration and evaluation expenditure during the year and consequently are notincluded in the Statement of Comprehensive Income.'
Year ended Nine months ended
30 June 2011 30 June 2010
$ $
Fees payable to the company’s auditors for the audit of the group’s accounts:
- audit services current year/period 40,700 36,600
- audit services prior period under provision 26,900 -
Net foreign exchange (gain)/loss (41,192) 79,606
Depreciation of property, plant and equipment 1,638,860 1,563,844
Impairment of Property, Plant and Equipment 8,643,201 -
Share-based payments 566,815 261,632
Impairment loss on receivables - 203,506
3. SEGMENTS (CONTINUED)Following is an analysis of the Group’s revenue and results by reportable segment for the nine months ended 30 June 2010:
Mandala Bomboko Kono TongoOther
explorationCorporate Total
$ $ $ $ $ $ $
Revenue – sale of diamonds 1,847,689 185,073 - - - - 2,032,762
Segment result (2,283,110) (645,948) (15,818) (6,072) (2,554) (2,449,166) (5,402,668)
Finance income 317
Finance costs (168,080)
Loss before tax (5,570,431)
Income tax expense -
Loss after tax (5,570,431)
Segment assets 11,224,021 6,330,006 3,478,508 853,665 698,105 1,306,195 23,890,500
Segment liabilities (73,141) - (354) (795) - (715,487) (789,777)
Share based payment expense - - - - - (261,632) (261,632)
Depreciation of property, plant and equipment
1,102,565 442,899 - 6,041 - 12,339 1,563,844
Capital additions
- property, plant and equipment 810,096 6,698,219 - 138,959 - 929 7,648,203
- intangible assets - - 1,566,733 14,291 581,412 - 2,162,436

39ANNUAL REPORT AND ACCOUNTS 2011 STELLAR DIAMONDS PLC
6. INCOME TAX EXPENSE
5. STAFF COSTS
The average monthly number of employees (including executive directors) was 217 (30 June 2010: 232). The remuneration of key management personnel is further disclosed in note 17.
The analysis of the group’s taxation charge for the year based on the company’s statutory tax rate of 28% as follows:
A deferred taxation asset is not recognised in respect of carried forward losses due to uncertainty over the utilisation of the losses. The unrecognised deferred taxation asset is $3,156,062 (30 June 2010: $1,662,270) based on carried forward tax losses of $8,796,799(30 June 2010: of $4,208,136) which expire 10 years from the date these were incurred.
Year ended Nine months ended
30 June 2011 30 June 2010
$ $
Wages and salaries 1,685,057 1,203,348
Social security costs 223,906 175,193
Share-based payments 566,815 261,632
2,475,778 1,640,173
Year ended Nine months ended
30 June 2011 30 June 2011
$ $
Loss for the year/period (14,933,996) (5,570,431)
Tax at the UK corporation tax rate of 28% (2010: 28%) (4,181,519) (1,559,721)
Effect of different tax rates of subsideries operating in other jurisdications (280,255) 482,933
Impairment not deductible for taxation purposes 2,420,096 -
Tax losses not utilised and carried forward 1,493,792 676,349
Depreciation in excess of capital allowances 547,886 400,439
- -
Year ended Nine months ended
30 June 2011 30 June 2010
$ $
Current taxation - -
Deferred taxation - -
- -
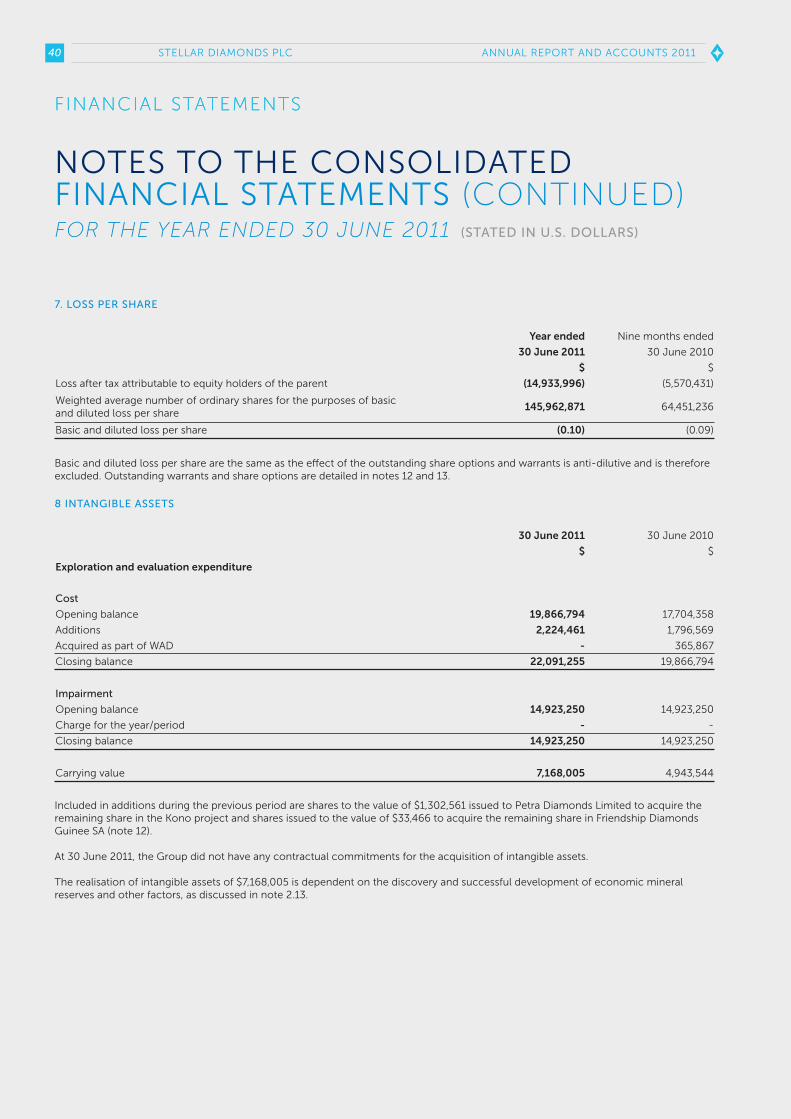
40 ANNUAL REPORT AND ACCOUNTS 2011STELLAR DIAMONDS PLC
FINANCIAL STATEMENTSFINANCIAL STATEMENTS
NOTES TO THE CONSOLIDATEDFINANCIAL STATEMENTS (CONTINUED)FOR THE YEAR ENDED 30 JUNE 2011 (STATED IN U.S. DOLLARS)
7. LOSS PER SHARE
8 INTANGIBLE ASSETS
Year ended Nine months ended
30 June 2011 30 June 2010
$ $
Loss after tax attributable to equity holders of the parent (14,933,996) (5,570,431)
Weighted average number of ordinary shares for the purposes of basicand diluted loss per share
145,962,871 64,451,236
Basic and diluted loss per share (0.10) (0.09)
Basic and diluted loss per share are the same as the effect of the outstanding share options and warrants is anti-dilutive and is thereforeexcluded. Outstanding warrants and share options are detailed in notes 12 and 13.
Included in additions during the previous period are shares to the value of $1,302,561 issued to Petra Diamonds Limited to acquire theremaining share in the Kono project and shares issued to the value of $33,466 to acquire the remaining share in Friendship DiamondsGuinee SA (note 12).
At 30 June 2011, the Group did not have any contractual commitments for the acquisition of intangible assets.
The realisation of intangible assets of $7,168,005 is dependent on the discovery and successful development of economic mineralreserves and other factors, as discussed in note 2.13.
30 June 2011 30 June 2010
$ $
Exploration and evaluation expenditure
Cost
Opening balance 19,866,794 17,704,358
Additions 2,224,461 1,796,569
Acquired as part of WAD - 365,867
Closing balance 22,091,255 19,866,794
Impairment
Opening balance 14,923,250 14,923,250
Charge for the year/period - -
Closing balance 14,923,250 14,923,250
Carrying value 7,168,005 4,943,544

41ANNUAL REPORT AND ACCOUNTS 2011 STELLAR DIAMONDS PLC
9. PROPERTY, PLANT AND EQUIPMENT
Included within mining assets is the rehabilitation provision for Mandala and Bomboko of $104,369 (30 June 2010: $54,369).
In accordance with the accounting policy stated in note 2.5, the Group tests property, plant and equipment for impairment when anindication of impairment exists. The recoverable amount of cash generating units is determined based on value-in-use calculations,which require the use of estimates. The estimated cash flows from the mining assets and the adjacent exploration projects producednet present values well in excess of their carrying values and are based on the following assumptions:
• economically recoverable reserves and resources are based on management’s expectations based on availability of reserves at mine sites and technical studies undertaken internally and by a Competent Person, where available;
• diamond prices for the remainder of 2011 are based on the average realised prices from January to June 2011 and an annual increase of 7% thereafter;
• discount rate of 8%; • inflation rate of 2.2%;and • The remaining useful life.
Bomboko ceased production in the year and plant and equipment was transferred to other group projects. The remaining Mining Assetsbeing previously capitalised exploration costs have been fully impaired during the year, resulting in an impairment charge of $3,387,333being charged to the statement of comprehensive income.
An additional impairment charge of $5,255,868 was charged to the statement of comprehensive income in relation to previouslycapitalised exploration costs at Mandala, following a review of commercially minable reserves at 30 June 2011.
The Group did not have any further contractually committed costs for the acquisition of property, plant and equipment at 30 June 2011.
The realisation of tangible assets of $7,150,956 is dependent on the discovery and successful development of economic mineralreserves and other factors, as discussed in note 2.13.
Mining assetsMachinery and
equipmentTotal
$ $ $
Cost
At 1 October 2009 10,692,283 1,321,648 12,013,931
Additions 212,845 1,789,863 2,002,708
Acquired as part of WAD 3,911,750 1,733,745 5,645,495
At 30 June 2010 14,816,878 4,845,256 19,662,134
Additions - 403,398 403,398
At 30 June 2011 14,816,878 5,243,654 20,065,532
Depreciation
At 1 October 2009 524,776 515,575 1,040,351
Charge for the period 978,010 585,834 1,563,844
At 30 June 2010 1,502,786 1,101,409 2,604,195
Charge for the year 535,424 1,131,756 1,667,180
Impairment 8,643,201 - 8,643,201
At 30 June 2011 10,681,411 2,233,165 12,914,576
Carrying value
At 30 June 2011 4,135,467 3,015,488 7,150,956
At 30 June 2010 13,314,092 3,743,847 17,057,939

42 ANNUAL REPORT AND ACCOUNTS 2011STELLAR DIAMONDS PLC
FINANCIAL STATEMENTSFINANCIAL STATEMENTS
NOTES TO THE CONSOLIDATEDFINANCIAL STATEMENTS (CONTINUED)FOR THE YEAR ENDED 30 JUNE 2011 (STATED IN U.S. DOLLARS)
10. INVENTORIES
11. TRADE AND OTHER RECEIVABLES
30 June 2011 30 June 2010
$ $
Diamonds 507,242 331,745
Consumables - 25,754
507,242 357,499
30 June 2011 30 June 2010
$ $
Trade receivable - 103,519
Amounts due from non-executive directors (note 17) - 15,275
Amounts due from shareholder (note 17) - 580,923
VAT 44,999 100,431
Prepayments and other receivables 149,488 41,720
194,487 841,868
30 June 2011 30 June 2010
$ $
Less than 30 days - 103,519
30-60 days - 15,275
More than 60 days - 580,923
- 699,717
The ageing of past due but not impaired receivables follows:
The directors consider the carrying amount of trade and other receivables to be approximately equal to their fair value.

43ANNUAL REPORT AND ACCOUNTS 2011 STELLAR DIAMONDS PLC
12. SHARE CAPITAL, SHARE PREMIUM AND WARRANT RESERVEShare capital
As part of the reverse acquisition in the previous period, Stellar Diamonds plc, the legal parent, performed a 5 for 1 share consolidation.The number of shares stated above has been restated for the 5 for 1 share consolidation.
Prior to the completion of the reverse acquisition, convertible loans and accrued interest of $546,241 (note 14), unpaid directors’ feesfrom 1 January 2009 of $208,676 (note 17) and African Aura Mining Inc.’s management fee charge for 2009 to Stellar Diamonds Limitedof $150,000 (note 17) were converted into new Stellar Diamonds Limited shares.
The equity structure appearing in the consolidated financial statements reflects the equity structure of the legal parent, including theequity instruments issued under the share for share exchange to effect the transaction. The effect of using the equity structure of the legal parent gives rise to an adjustment to the Group’s issued equity capital in the form of a reverse acquisition reserve.
On 23 February 2010, a total of 112,500 ordinary shares of 5p each ("bonus shares") were allotted and issued to Karl Smithson, ChiefExecutive Officer, and Angus Ogilvie, Finance Director. These allotments are in satisfaction of half of their respective listing bonuses of£30,000 and £15,000 following the successful admission of the Company on AIM (as set out in the Company's Admission Document).
On 24 May 2010, the Company announced the completion of the share purchase agreement with Petra Diamonds Limited in respect of the acquisition of the remaining 51% of the Kono kimberlite project in Sierra Leone in exchange for the issuance of 4,500,000 newordinary shares to Petra Diamonds Limited as consideration for the agreed purchase price of £900,000, at a price of 20 pence per share.
On 12 October 2010, a total of 38,000,000 ordinary shares of 5p each were allotted and issued for gross proceeds of $3,078,603.Transaction costs of $164,009 were netted against proceeds.
On 29 March 2011, a total of 77,500,000 ordinary shares of 5p each were allotted and issued for gross proceeds of $9,922,891.Transaction costs of $375,748 were netted against proceeds.
Authorised
Unlimited number of ordinary shares of 5p each.
Number Share capital $ Share premium $
Alloted called-up and fully paid
Balance as at 1 October 2009 50,037,254 956,474 31,272,947
Issue of shares (note 8) 167,330 335 33,131
Conversion of debt to equity 2,778,678 9,049 895,868
WAD shares acquired 52,983,262 965,858 32,201,946
Reverse acquisition adjustment 18,598,170 4,623,043 (16,443,279)
Balance on completion of reverse acquisition 71,581,432 5,588,901 15,758,667
Shares issued on share placing 25,000,000 1,951,938 5,784,958
Share warrants issued - - (143,024)
Share issue costs - - (380,023)
Bonus shares issued to directors 112,500 8,784 26,044
Other shares issued (note 8) 4,500,000 325,641 976,921
Balance as at 30 June 2010 101,193,932 7,875,264 22,023,543
Shares issued on share placing 115,500,000 9,280,410 3,721,084
Share warrants issued - - (155,235)
Share issue costs - - (539,757)
Other shares issued 72,727 5,892 5,758
Balance as at 30 June 2011 216,766,659 17,161,566 25,055,393

44 ANNUAL REPORT AND ACCOUNTS 2011STELLAR DIAMONDS PLC
FINANCIAL STATEMENTSFINANCIAL STATEMENTS
NOTES TO THE CONSOLIDATEDFINANCIAL STATEMENTS (CONTINUED)FOR THE YEAR ENDED 30 JUNE 2011 (STATED IN U.S. DOLLARS)
12. SHARE CAPITAL, SHARE PREMIUM AND WARRANT RESERVE (CONTINUED)Share warrantsThe warrants reserve represents the value of the warrants issued by the Company to subscribe for shares in the Company.
On 12 October 2010 23,064,383 warrants to subscribe to 23,064,383 ordinary shares of 5p each for a price of 12p per share warrantwere issued in relation to the placing of 38,000,000 ordinary shares in the Company. The warrants issued had a grant date fair value of$155,235 using the Black-Scholes option pricing model and the following assumptions: nil dividend yield, a weighted average expectedvolatility of the Company’s share price of 50%, a weighted annual risk free rate of 1.73% and life of one and a half years.
In the previous period, the Company granted 1,190,125 warrants to the Company’s broker for the Placing to subscribe for up to1,190,125 ordinary shares of 5p each in the Company exercisable for a price of 20p per share warrant. The warrants issued had a grantdate value of $143,024 using the Black-Scholes option pricing model and the following assumptions: nil dividend yield, a weightedaverage expected volatility of the Company’s share price of 67%, a weighted average annual risk free rate of 2.76% and a life of two years.
Number of warrants Warrant reserve $
At 1 October 2009 18,682,951 269,801
Cancellation of Stellar Diamonds Limited warrants on acquisition (18,682,951) -
Replacement for Stellar Diamonds Limited warrants on acquisition 18,776,363 -
Share warrants issued 1,190,125 143,024
Expired warrants (18,776,363) (269,801)
At 30 June 2010 1,190,125 143,024
Share warrants issued 23,064,383 155,235
Share warrants expired (1,190,125) (143,024)
At 30 June 2011 23,064,383 155,235
13. SHARE OPTIONSThe share option reserve represents the value of the share options issued to the Group’s directors and employees under the Group’sshare option scheme.
On 10 August 2010 the Company issued a total of 2,950,000 share options at an exercise price of 11p. The options issued have resultedin a charge of $148,275 based on the Black-Scholes option pricing model and the following assumptions: : nil dividend yield, a weightedaverage expected volatility of the Company’s share price of 34%, a weighted average annual risk free rate of 2.17% and an expected lifeof five years.
On 31 May 2011 the Company issued a total of 8,150,000 share options at an exercise price of 8p. The options issued have resulted in a charge of $418,540 based on the Black-Scholes option pricing model and the following assumptions: : nil dividend yield, a weightedaverage expected volatility of the Company’s share price of 67%, a weighted average annual risk free rate of 2.25% and an expected lifeof five years.
On 22 February 2010, 3,992,000 Stellar Diamonds Limited options were surrendered in exchange for the issuance of 4,012,000 newoptions of the Company. The number of replacement options issued was determined by the exchange ratio of 1.005 used in theacquisition. The exercise price of 3,482,325 replacement options was modified from £0.225 to £0.20 per share. The terms andconditions of 530,138 replacement options were unchanged.
The replacement of the share options in Stellar Diamonds Limited has been treated as a modification of the existing share options andhas resulted in an incremental increase in the fair value of the options of $261,632, which has been recognised as an expense for thecurrent period. The incremental increase was calculated as the difference between the fair value of the replacement share options andthe net fair value of the cancelled share options immediately before cancellation on 22 February 2010. The fair values were calculatedusing the Black-Scholes option pricing model and the following assumptions: nil dividend yield, a weighted average expected volatilityof the Company’s share price of 67%, a weighted average annual risk free rate of 2.76% and an expected life of seven years.
On 22 February 2010, WAD had 1,420,000 outstanding share options issued in prior periods to employees and consultants in exchangefor services provided. They vested immediately on issue. There were no changes to the terms and conditions of these options under theterms of the acquisition. The outstanding share options had an IFRS 2 measured value on date of issue of $639,292 which was assumedby the Group on reverse acquisition of Stellar Diamonds Limited.

45ANNUAL REPORT AND ACCOUNTS 2011 STELLAR DIAMONDS PLC
13. SHARE OPTIONS (CONTINUED)The following is a summary of the share options outstanding and exercisable as at 30 June 2011 and 30 June 2010 and changes during the year:
As at 30 June 2011 the following stock options were outstanding and exercisable:
30 June 2011 30 June 2010
Number of options
Weighted averageexercise price
Number of options
Weighted averageexercise price
GBP£ GBP£
Outstanding and exercisable, beginning of year/period 5,432,463 0.388 3,992,500 0.310
Cancellation of Stellar Diamonds Limited options on acquisition
- - (3,992,500) (0.310)
Replacement for Stellar Diamonds Limited options on acquisition (re-priced)
- - 3,482,325 0.200
Replacement for Stellar Diamonds Limited options on acquisition (not re-priced)
- - 530,138 0.871
Options assumed on acquisition - - 1,420,000 0.655
Options granted 11,100,000 0.088 - -
Options expired (437,788) 0.827
Outstanding and exercisable, end of year/period 16,094,675 0.169 5,432,463 0.388
Number of stock options outstanding Exercise price per share GBP£ Expiry date
400,000 1.000 15-Sep-13
100,000 1.000 02-Dec-13
20,000 1.000 08-Feb-14
20,000 1.175 10-Apr-14
500,000 0.150 23-Jul-16
507,525 0.871 26-Mar-13
3,447,150 0.200 22-Apr-15
2,950,000 0.110 10-Aug-15
8,150,000 0.080 31-May-16
16,094,675
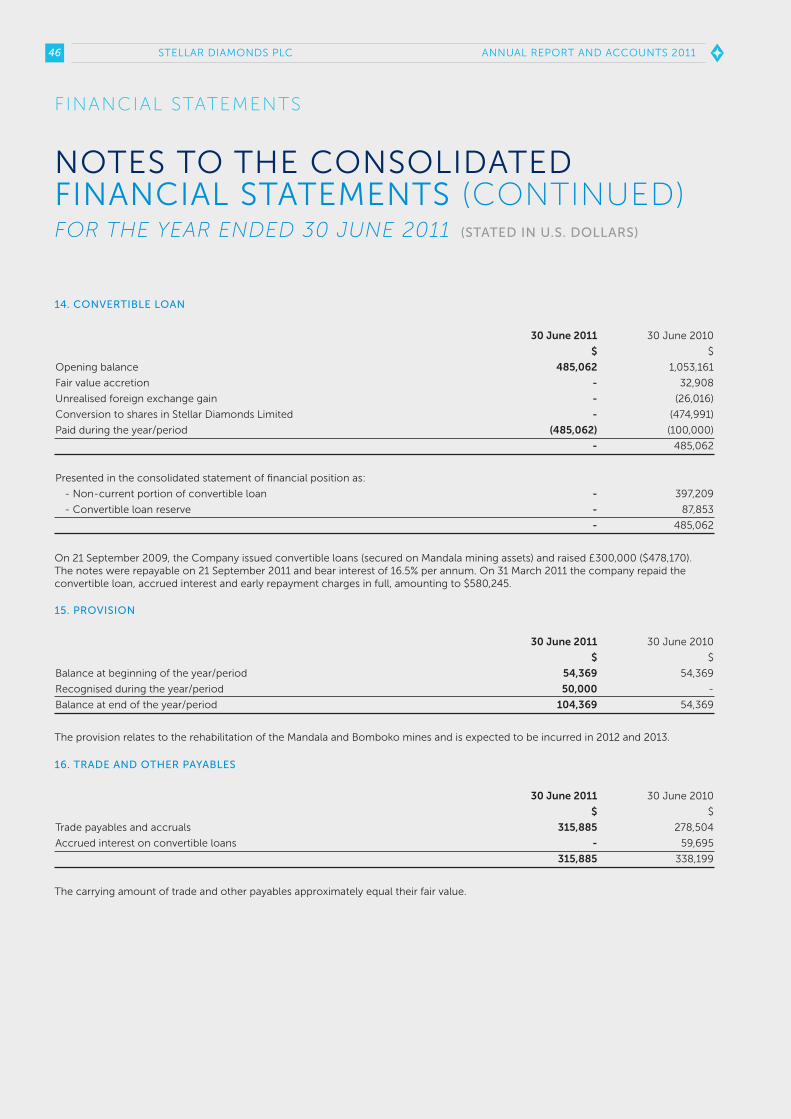
46 ANNUAL REPORT AND ACCOUNTS 2011STELLAR DIAMONDS PLC
FINANCIAL STATEMENTS
NOTES TO THE CONSOLIDATEDFINANCIAL STATEMENTS (CONTINUED)FOR THE YEAR ENDED 30 JUNE 2011 (STATED IN U.S. DOLLARS)
14. CONVERTIBLE LOAN
16. TRADE AND OTHER PAYABLES
15. PROVISION
30 June 2011 30 June 2010
$ $
Opening balance 485,062 1,053,161
Fair value accretion - 32,908
Unrealised foreign exchange gain - (26,016)
Conversion to shares in Stellar Diamonds Limited - (474,991)
Paid during the year/period (485,062) (100,000)
- 485,062
Presented in the consolidated statement of financial position as:
- Non-current portion of convertible loan - 397,209
- Convertible loan reserve - 87,853
- 485,062
30 June 2011 30 June 2010
$ $
Balance at beginning of the year/period 54,369 54,369
Recognised during the year/period 50,000 -
Balance at end of the year/period 104,369 54,369
30 June 2011 30 June 2010
$ $
Trade payables and accruals 315,885 278,504
Accrued interest on convertible loans - 59,695
315,885 338,199
On 21 September 2009, the Company issued convertible loans (secured on Mandala mining assets) and raised £300,000 ($478,170). The notes were repayable on 21 September 2011 and bear interest of 16.5% per annum. On 31 March 2011 the company repaid theconvertible loan, accrued interest and early repayment charges in full, amounting to $580,245.
The provision relates to the rehabilitation of the Mandala and Bomboko mines and is expected to be incurred in 2012 and 2013.
The carrying amount of trade and other payables approximately equal their fair value.

47ANNUAL REPORT AND ACCOUNTS 2011 STELLAR DIAMONDS PLC
17 RELATED PARTIESThe ultimate parent company and controlling party of Stellar Diamonds Limited prior to the reverse acquisition was African Aura MiningInc. (AAM). Subsequent to the reverse acquisition African Aura Mining Inc. (AAM) remained a shareholder of Stellar Diamonds plc. In April 2011 AAM demerged assets, including its investment in Stellar Diamonds plc. to Aureus Mining Inc. AAM was renamed AfferroMining Inc. During the year, the Company and its subsidiaries, in the ordinary course of business, entered into various transactions withAfferro Mining Inc. These transactions occurred under terms and conditions that are no less favourable than those arranged with thirdparties.
The following table summarises the related party transactions:
The convertible loan and the accrued interest repaid in the year as disclosed in note 14 were owed to Altus Resource Capital. Steven Poulton, Non-Executive Director, is a Director of Altus Asset Management, the manager for Altus Resource Capital.
The directors are considered the Company’s key management personnel. The remuneration earned in respect of the financial year by each director is as follows:
Year ended 30 June 2011
Nine months ended30 June 2010
$ $
Afferro Mining Inc., shareholder
- management fees charged 108,768 91,884
- management fees paid 108,768 -
- net (repayment)/proceeds of loans from Afferro Mining Inc. - (400,000)
- repayment of amount due from Afferro Mining Inc. 580,923 -
- conversion of convertible loans into shares - 200,000
- conversion of accrued interest on convertible loans into shares - 30,000
- conversion of unpaid 2009 management fee into shares in Stellar Diamonds Limited - 150,000
Year ended 30 June 2011
Nine months ended30 June 2010
$ $
Directors
- shares issued on successful admission of the Company on AIM in lieu of bonus payment (note 12)
- 34,828
- shares issued in lieu of accrued directors’ fees 234,863 208,676
- payments made on behalf of the directors to acquire shares in the Company - 14,820
- social security payments made on behalf of the directors - 29,004
Salary or feesBonus
paid in cashBonus
paid in sharesShare based
paymentsYear ended
30 June 2011
Fourteen monthsended 30 June
2010
$ $ $ $ $ $
Lord Daresbury 93,851 - - 66,433 160,284 68,182
N. Karl Smithson 214,745 - 82,716 137,893 435,354 180,087
Angus Ogilvie 116,651 - 51,857 25,131 193,639 122,481
Luis da Silva 25,451 - - 38,352 63,803 18,490
Steven J. Poulton 39,767 - - 53,649 93,416 28,891
James Campbell 25,451 - - 38,352 63,803 6,027
515,916 - 134,573 359,810 1,010,299 424,158

48 ANNUAL REPORT AND ACCOUNTS 2011STELLAR DIAMONDS PLC
FINANCIAL STATEMENTS
NOTES TO THE CONSOLIDATEDFINANCIAL STATEMENTS (CONTINUED)FOR THE YEAR ENDED 30 JUNE 2011 (STATED IN U.S. DOLLARS)
17. RELATED PARTIES (CONTINUED)
18. FINANCIAL INSTRUMENTS
30 June 2011 30 June 2010
Ordinary shares Share options Ordinary shares Share options
Lord Daresbury 3,822,831 1,702,000 2,650,456 402,000
N. Karl Smithson 1,525,757 4,006,500 515,757 1,306,500
Luis da Silva 320,689 1,353,000 166,439 603,000
Steven J. Poulton 669,576 1,452,000 286,601 402,000
James Campbell 190,430 970,000 60,430 220,000
6,529,283 9,483,500 3,679,683 2,933,500
The number of directors to whom retirement benefits are accruing is nil (2010: nil). All remuneration related to short term employee benefits.
At the end of the year, the amounts receivable from related parties (note 11) are as follows:
In the normal course of its operations, the Group is exposed to commodity prices, currency, interest rate, liquidity and credit risk.
The fair value of a financial instrument is defined as the amount at which the instrument could be exchanged in a current transactionbetween willing parties, other than in a forced or liquidation sale. The fair values of these financial instruments are estimated toapproximate their carrying values due to their immediate or short-term nature.
The Company’s financial instruments are:• Cash and cash equivalents • Receivables• Trade and other payables • Convertible loans• Embedded derivative
The carrying amounts for the financial instruments are as follows:
30 June 2011 30 June 2010
$ $
Non-executive directors - 15,275
African Aura Mining Inc. - 580,923
30 June 2011 30 June 2010
$ $
Financial assets
Loans and receivables, measured at amortised cost
- Cash and cash equivalents 6,518,640 689,650
- Receivables 194,487 699,717
6,713,127 1,389,367
Financial liabilities
Other liabilities, measured at amortised cost
- Trade and other payables 315,885 338,199
- Convertible loan - 397,209
315,885 735,408

49ANNUAL REPORT AND ACCOUNTS 2011 STELLAR DIAMONDS PLC
18. FINANCIAL INSTRUMENTS (CONTINUED)Foreign currency riskIn the normal course of business, the Company enters into transactions denominated in foreign currencies (primarily Pound Sterling). As a result, the Company is subject to exposure from fluctuations in foreign currency exchange rates. In general, the Company does not enter into derivatives to manage these currency risks. The Company attempts to reduce its exposure to currency risk by enteringinto contracts denominated in US Dollars whenever possible. The Company has taken no other action to reduce its exposure to foreigncurrency risk during the year.
The sensitivities set out below are based on financial assets and liabilities held at 30 June 2011 where balances were not denominated inthe functional currency of the Company. The sensitivities do not take into account the Company’s income and expenses and the resultsof the sensitivities could change due to other factors such as changes in the value of financial assets and liabilities as a result of non-foreign exchange influenced factors.
Interest rate and liquidity riskFluctuations in interest rates impact on the value of short term cash investments and interest payable on financing activities (includinglong term loans), giving rise to interest rate risk. The Company has in the past been able to source financing through private offerings.This cash is managed to ensure surplus funds are invested in a manner to achieve maximum returns while minimising risks. In theordinary course of business, the Company is required to fund working capital and capital expenditure requirements. The Companytypically holds financial assets with a maturity of less than 30 days to ensure adequate liquidity and flexibility.
Due to the short maturity of the financial assets, if interest rates were to double, it would have an insignificant impact on the Company’sfinancial performance.
The Company manages its liquidity risk associated with its financial liabilities through the issuance of additional equity and continuouslymonitoring forecast and actual cash flows, as required to meet the capital requirements of maturing liabilities.
The following table details the Group’s remaining contractual maturity for its non-derivative financial liabilities. The table has beendrawn up based on the undiscounted cash flows of financial liabilities based on the earliest date on which the Group is required to pay.The table includes both interest and principal cash flows.
30 June 2011 30 June 2010
$ $
Carrying value of foreign currency balances
Cash and cash equivalents include balances denominated in:
- Pound Sterling (GBP) 5,919,415 86,698
Receivables include balances denominated in:
- Pound Sterling (GBP) 44,999 157,406
Trade and other payables include balances denominated in:
- Pound Sterling (GBP) 124,577 90,421
Closing exchange rate
Effect on result of GBP strengthening/weakening 10%
$
At 30 June 2011 1.602 +/- 583,984
Weighted averageeffective interest rate
Less than12 months
1 to 5 years
30 June 2011
Trade and other payables - 315,885 -
- 315,885 -
30 June 2010
Trade and other payables - 338,199 -
Convertible loan 31.4% - 478,170
338,199 478,170
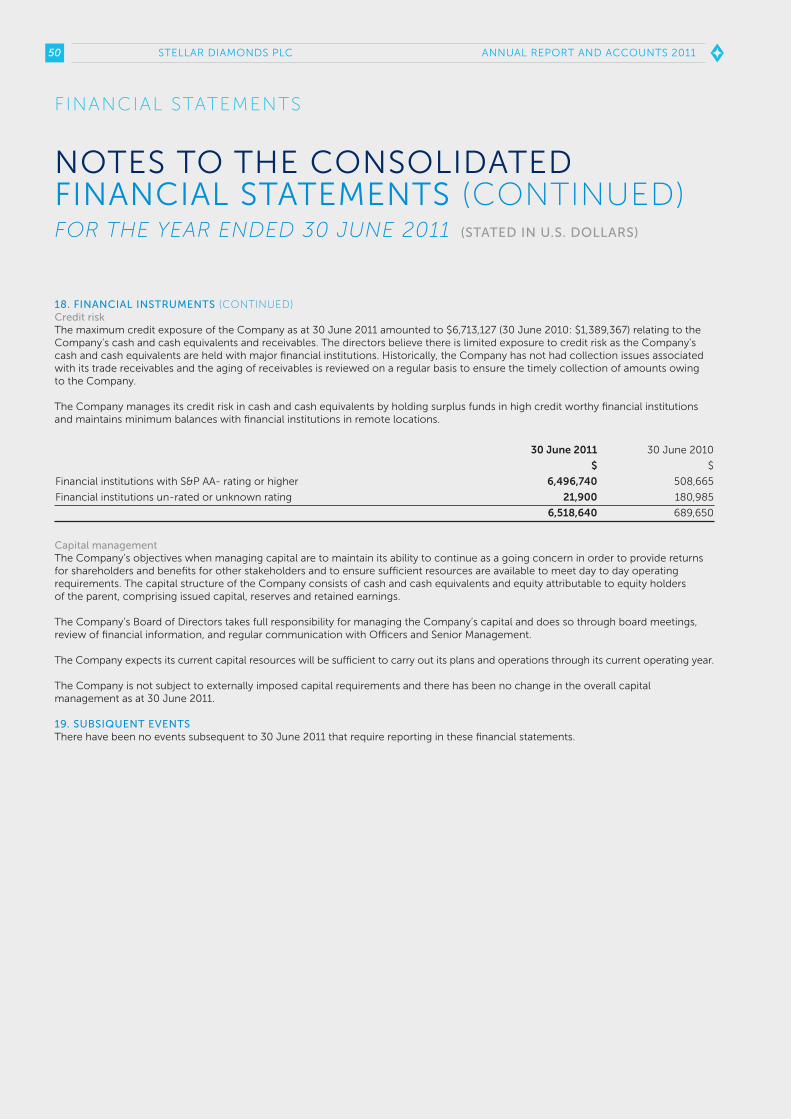
50 ANNUAL REPORT AND ACCOUNTS 2011STELLAR DIAMONDS PLC
FINANCIAL STATEMENTS
NOTES TO THE CONSOLIDATEDFINANCIAL STATEMENTS (CONTINUED)FOR THE YEAR ENDED 30 JUNE 2011 (STATED IN U.S. DOLLARS)
18. FINANCIAL INSTRUMENTS (CONTINUED)Credit riskThe maximum credit exposure of the Company as at 30 June 2011 amounted to $6,713,127 (30 June 2010: $1,389,367) relating to theCompany’s cash and cash equivalents and receivables. The directors believe there is limited exposure to credit risk as the Company’scash and cash equivalents are held with major financial institutions. Historically, the Company has not had collection issues associatedwith its trade receivables and the aging of receivables is reviewed on a regular basis to ensure the timely collection of amounts owing to the Company.
The Company manages its credit risk in cash and cash equivalents by holding surplus funds in high credit worthy financial institutionsand maintains minimum balances with financial institutions in remote locations.
Capital managementThe Company’s objectives when managing capital are to maintain its ability to continue as a going concern in order to provide returnsfor shareholders and benefits for other stakeholders and to ensure sufficient resources are available to meet day to day operatingrequirements. The capital structure of the Company consists of cash and cash equivalents and equity attributable to equity holders of the parent, comprising issued capital, reserves and retained earnings.
The Company’s Board of Directors takes full responsibility for managing the Company’s capital and does so through board meetings,review of financial information, and regular communication with Officers and Senior Management.
The Company expects its current capital resources will be sufficient to carry out its plans and operations through its current operating year.
The Company is not subject to externally imposed capital requirements and there has been no change in the overall capitalmanagement as at 30 June 2011.
19. SUBSIQUENT EVENTSThere have been no events subsequent to 30 June 2011 that require reporting in these financial statements.
30 June 2011 30 June 2010
$ $
Financial institutions with S&P AA- rating or higher 6,496,740 508,665
Financial institutions un-rated or unknown rating 21,900 180,985
6,518,640 689,650

51ANNUAL REPORT AND ACCOUNTS 2011 STELLAR DIAMONDS PLC
30 June 30 June
Notes 2011 2010
Assets
Non-current assets
Intangible assets 3 1,302,561 1,302,561
Property, plant and equipment 4 4,157,484 4,157,484
Total non-current assets 5,460,045 5,460,045
Current assets
Trade and other receivables 5 15,832,710 7,836,186
Cash and cash equivalents 142,406 -
Total current assets 15,975,116 7,836,186
Total assets 21,435,161 13,296,231
Equity and liabilities
Capital and reserves
Share capital 6 17,161,566 7,875,264
Share premium 6 25,055,393 22,023,543
Warrant reserve 6 155,235 143,024
Share option reserve 7 1,843,082 1,276,267
Foreign currency translation reserve (773,363) (773,363)
Accumulated loss (22,322,837) (17,288,473)
Total equity 21,119,076 13,256,262
Current liabilities
Trade and other payables 8 316,085 39,969
Total current liabilities 316,085 39,969
Total liabilities 316,085 39,969
Total equity and liabilities 21,435,161 13,296,231
COMPANY STATEMENT OF FINANCIAL POSITION AS AT 30 JUNE 2011 (STATED IN U.S. DOLLARS)
FINANCIAL STATEMENTS
The financial statements of Stellar Diamonds plc, registered number: 5424214 were approved by the Board of Directors and authorisedfor issue on 5 October 2011. They were signed on its behalf by:
N. KARL SMITHSON LORD DARESBURY

52 ANNUAL REPORT AND ACCOUNTS 2011STELLAR DIAMONDS PLC
COMPANY STATEMENT OF CHANGES IN EQUITYFOR THE YEAR ENDED 30 JUNE 2011 (STATED IN U.S. DOLLARS)
FINANCIAL STATEMENTS
Share capital
(note 6)
Sharepremium
(note 6)
Warrantreserve(note 6)
Share option
reserve(note 7)
Foreign currency
translationreserve
(note 1.3)
Accumulatedloss
Totalequity
Balance at 30 April 2009 1,004,699 14,170,930 - 522,937 - (1,614,908) 14,083,658
Issue of shares 367,604 694,486 - - - - 1,062,090
Share options issued - - - 89,077 - - 89,077
Conversion of debt to equity 26,840 80,521 - - - - 107,361
Exchange difference arising onchange in functional currency
32,274 812,730 - 27,278 (773,363) (98,919) -
Total comprehensive income for the period
- - - - - (15,574,646) (15,574,646)
Issue of shares on acquisition of Stellar Diamonds Limited
4,157,484 - - - - - 4,157,484
Issue of placing shares 1,951,938 5,784,958 - - - - 7,736,896
Share issue costs - (380,023) - - - - (380,023)
Share warrants issued - (143,024) 143,024 - - - -
Share options issued on acquisition of Stellar Diamonds Limited
- - - 636,975 - - 636,975
Shares issued to directors on re-admission to AIM
8,784 26,044 - - - - 34,828
Issue of shares on acquisition of Basama Diamonds Limited
325,641 976,921 - - - - 1,302,562
Balance at 30 June 2010 7,875,264 22,023,543 143,024 1,276,267 (773,363) (17,288,473) 13,256,262
Total comprehensive income for the year
- - - - - (5,177,388) (5,177,388)
Issue of placing shares 9,280,410 3,721,084 - - - - 13,001,494
Share warrants issued - (155,235) 155,235 - - - -
Share issue costs - (539,757) - - - - (539,757)
Warrants expired - - (143,024) - - 143,024 -
Other shares issued 5,892 5,758 - - - - 11,650
Share options issued - - - 566,815 - - 566,815
Balance at 30 June 2011 17,161,566 25,055,393 155,235 1,843,082 (773,363) (22,322,837) 21,119,076

53ANNUAL REPORT AND ACCOUNTS 2011 STELLAR DIAMONDS PLC
COMPANY STATEMENT OF CASH FLOWSFOR THE YEAR ENDED 30 JUNE 2011 (STATED IN U.S. DOLLARS)
FINANCIAL STATEMENTS
Year endedFourteen
months ended
30 June 2011 30 June 2010
Cash flows from operating activities
Net loss for the year/period (5,177,388) (15,574,646)
Adjustments for:
- Impairment of intangible assets - 3,105,766
- Impairment of investment in subsidiary - 3
- Exchange movements 13,456 -
- Share-based payment expense 566,815 726,052
- Shares issued to directors in lieu of fees 234,863 34,828
- Finance cost - -
Change in working capital items:
- (Increase)/Decrease in receivables (7,996,524) 3,260,422
- Increase/(Decrease) in trade and trade and other payables 276,115 (87,847)
Cash used by operations (12,082,662) (8,535,422)
- Finance cost - -
- Investment revenue - -
Net cash used in operations (12,082,662) (8,535,422)
Cash flows from investing activities
- Payments to acquire intangible assets - (111,540)
Net cash used in investing activities - (111,540)
Cash flows from financing activities
- Proceeds from share placing, net of costs 12,238,524 7,356,873
- Proceeds from other issue of share capital, net of costs - 1,062,090
- Net cash generated by financing activities 12,238,524 8,418,963
Net increase/(decrease) in cash and cash equivalents 155,862 (227,999)
- Cash and cash equivalents, beginning of year/period - 227,999
- Effect of foreign exchange rate changes (13,456) -
Cash and cash equivalents, end of year/period 142,406 -

54 ANNUAL REPORT AND ACCOUNTS 2011STELLAR DIAMONDS PLC
NOTES TO THE COMPANY FINANCIAL STATEMENTSFOR THE YEAR ENDED 30 JUNE 2011 (STATED IN U.S. DOLLARS)
FINANCIAL STATEMENTS
1. BASIS OF PREPARATION1.1 Stellar Diamonds plcOn 22 February 2010, the Company completed its acquisition of Stellar Diamonds Limited in a share for share exchange.
Under the terms of the acquisition agreement, the Company agreed to acquire the entire issued share capital of Stellar DiamondsLimited for a consideration equating to approximately three times the value of West African Diamonds plc. (“WAD”), represented by anapproximate 75:25 split of the share capital in the enlarged group prior to the issue of Placing shares - 75 per cent being attributable to consideration shares to be allotted to Stellar Diamonds Limited shareholders and 25 per cent being attributable to ordinary sharesheld by WAD plc. shareholders. Subsequent to the acquisition WAD plc changed its name to Stellar Diamonds plc.
1.2 Basis of accountingStellar Diamonds plc is presenting audited financial statements as of and for the year ended 30 June 2011. The comparative periodpresented is audited financial statements as of and for the fourteen month period ended 30 June 2010 and is therefore not entirelycomparable with the current year.
The financial statements have been prepared in accordance with International Financial Reporting Standards (“IFRS”). The financialstatements have also been prepared in accordance with IFRSs as adopted by the European Union. They also have been prepared inaccordance with the Companies Act 2006. The financial statements have been prepared on an historical cost basis, as adjusted forcertain financial instruments carried at fair value.
1.3 Functional and presentational currencyThe functional and presentational currency of the Company changed from pound sterling to US dollars during the comparative period.The Company invested in Stellar Diamonds Limited on 22 February 2010, which resulted in increasing sales of diamonds and purchasesof services and goods being denominated in US dollars and represents significant change in the underlying events and circumstances ofthe Company. The Company primarily became the holding company, therefore it resulted in a change in functional currency effectiveas at the same date and with a prospective effect.
In accordance with IAS 21, this change in functional currency in the Company was accounted for by translating items in theconsolidated income statement at the average USD/GBP exchange rate from 1 May 2009 to 22 February 2010 of $1.61722. Items in the consolidated balance sheet and reserves were translated at the exchange spot rate on 22 February 2010 of $1.56155.
The exchange difference arising on change in presentation currency in the comparative period is recognised as a foreign currencytranslation reserve.
1.4 Standards adopted during the period• The Company has adopted the following standards which are effective for the first time this year. • Improvements to IFRSs 2009 (effective 1 January 2010)• Amendment to IAS 32 Classification of Rights Issues (effective 1 February 2010)• Amendment to IFRS 2 Group Cash-settled Share-based Payment Transactions (effective 1 January 2010)• Amendments to IFRS 1 Additional Exemptions for First-time Adopters (effective 1 January 2010)• Amendment to IFRIC 14 Prepayments of a Minimum Funding Requirement (effective 1 January 2011)• IFRIC 17 Distributions of Non-Cash Assets to Owners Estate (effective 1 July 2010)• IFRIC 18 Transfer of Assets from Customers (effective 1 November 2009)• IFRIC 19 Extinguishing Financial Liabilities with Equity Instruments (effective 1 July 2010)
The adoption of these standards and interpretations did not have a material impact to the consolidated financial statements.
1.5 Standards in issue but not yet effectiveThe following standards and interpretations which have been recently issued or revised have not been adopted early.
• Amendments to IAS 1 Presentation of Items of Other Comprehensive Income (1 July 2012)• IAS 19 (revised June 2011) Employee Benefits (1 January 2013)• IFRS 13 Fair Value Measurement (1 January 2013)• IFRS 12 Disclosure of Interests in Other Entities (1 January 2013)• IFRS 11 Joint Arrangements (1 January 2013)• IFRS 10 Consolidated Financial Statements (1 January 2013)• IAS 28 Investments in Associates and Joint Ventures (1 January 2013)• IAS 27 Separate Financial Statements (1 January 2013)• Amendments to IAS 12 Deferred Tax: Recovery of Underlying Assets (1 January 2012)• Amendments to IFRS 1 Severe Hyperinflation and Removal of Fixed Dates for First-time Adopters(1 January 2011)

55ANNUAL REPORT AND ACCOUNTS 2011 STELLAR DIAMONDS PLC
1. BASIS OF PREPARATION (CONTINUED)• Amendments to IFRS 7 Disclosures – Transfers of Financial Assets (1 July 2011)• Improvements to IFRSs 2010 (1 January 2011)• Amendment to IFRS 1 Limited Exemption from Comparative IFRS 7 Disclosures for First-time Adopters (1 July 2010)• IFRS 9 Financial Instruments (1 January 2013)• IAS 24 Related Party Disclosures (1 January 2011)• IAS 32 Classification of Rights Issues (1 February 2010)• Amendments to IFRS 1 Additional Exemptions for First-time Adopters (1 January 2010)• Revised IAS 24 Related Party Disclosures (effective 1 January 2011)
The directors anticipate that the adoption of these standards and interpretations in future years will have no material impact on thefinancial statements.
2. SIGNIFICANT ACCOUNTING POLICIESThe accounting policies set out below have been applied consistently in these financial statements, unless otherwise stated.
2.1 Foreign currency translation2.1.1 Functional and presentation currencyItems included in the financial statements of the Company are measured using the currency of the primary economic environment inwhich the Company operates (“the functional currency”). As discussed in note 1.3, the financial statements are presented in U.S. dollars(“$”), which is the functional and presentation currency for the Company.
2.1.2 Foreign currency transactionsForeign currency transactions are translated into the functional currency using the exchange rates prevailing at the dates of thetransactions. Foreign exchange gains and losses resulting from the settlement of such transactions and from the translation at period-end exchange rates of monetary assets and liabilities denominated in foreign currencies are recognised in the statement of comprehensive income.
2.2 Exploration and evaluation expenditureThe Company follows the method of accounting for its mineral properties whereby all costs related to acquisition, exploration andevaluation are capitalized by property pending determination of the feasibility of the project. These assets are not depreciated. Exploration and evaluation assets are assessed for impairment when facts and circumstances suggest that the carrying amount of anexploration and evaluation asset may exceed its recoverable amount. When facts and circumstances suggest that the carrying amountexceeds the recoverable amount, the Company measures, presents and discloses any resulting impairment loss in the statement ofcomprehensive income.
The facts and circumstances indicating impairment include the following:• the period for which the company has a right to explore in the specific area has expired or is expected to expire;• the exploration and evaluation has not led to the discovery of economic reserves;• the development of the reserves is not economically or commercially viable; and• the exploration is located in an area that has become politically unstable.
Exploration costs are capitalised as an intangible asset until technical feasibility and commercial viability of extraction of reserves aredemonstrable, when the capitalised exploration costs are re-classed to property, plant and equipment. Exploration costs include anallocation of administration and salary costs (including share based payments) as determined by management. Prior to reclassificationto property, plant and equipment, exploration and evaluation assets are assessed for impairment and any impairment loss recognisedimmediately in the statement of comprehensive income
2.3 Financial instrumentsLoans and receivablesTrade receivables, loans and other receivables that have fixed and determinable payments that are not quoted in an active market areclassified as loans and receivables. Loans and receivables are initially measured at fair value and subsequently measured at amortisedcost using the effective interest method. Interest income is recognised by applying the effective interest rate, except for short-termreceivables when the recognition of interest would be immaterial.
Impairment of financial assets at amortised costFinancial assets that are measured at amortised cost are assessed for indicators of impairment at the end of each reporting period.Financial assets are considered to be impaired when there is objective evidence that, as a result of one or more events that occurredafter the initial recognition of the financial asset, the estimated future cash flows of the financial asset have been affected.

56 ANNUAL REPORT AND ACCOUNTS 2011STELLAR DIAMONDS PLC
NOTES TO THE COMPANY FINANCIAL STATEMENTS (CONTINUED)FOR THE YEAR ENDED 30 JUNE 2011 (STATED IN U.S. DOLLARS)
FINANCIAL STATEMENTS
2. SIGNIFICANT ACCOUNTING POLICIES (CONTINUED)Cash and cash equivalentsCash and cash equivalents comprise cash on hand and demand deposits, and other short-term highly liquid investments that are readilyconvertible to a known amount of cash and are subject to an insignificant risk of changes in value.
Derecognition of financial assetsThe Company derecognises a financial asset only when the contractual rights to the cash flows from the asset expire; or it transfers thefinancial asset and substantially all the risks and rewards of ownership of the asset to another entity. If the Group neither transfers norretains substantially all the risks and rewards of ownership and continues to control the transferred asset, the Group recognises itsretained interest in the asset and an associated liability for amounts it may have to pay. If the Group retains substantially all the risks and rewards of ownership of a transferred financial asset, the Company continues to recognise the financial asset and also recognises a collateralised borrowing for the proceeds received.
Financial liabilities and equityFinancial liabilities and equity instruments are classified according to the substance of the contractual arrangements entered into.
Equity instrumentsAn equity instrument is any contract that evidences a residual interest in the assets of the company after deducting all of its liabilities.Equity instruments issued by the Company are recorded at the proceeds received, net of direct issue costs.
Financial liabilities Financial liabilities are classified as either financial liabilities ‘at FVTPL’ or ‘other financial liabilities’.
Financial liabilities at FVTPL Financial liabilities are classified as at FVTPL where the financial liability is either held for trading or it is designated as at FVTPL.
A financial liability is classified as held for trading if:• it has been incurred principally for the purpose of disposal in the near future; or• it is a part of an identified portfolio of financial instruments that the Company manages together and has a recent actual pattern
of short-term profit-taking; or • it is a derivative that is not designated and effective as a hedging instrument.
A financial liability other than a financial liability held for trading may be designated as at FVTPL upon initial recognition if:• such designation eliminates or significantly reduces a measurement or recognition inconsistency that would otherwise arise; or • the financial liability forms part of a group of financial assets or financial liabilities or both, which is managed and its performance
is evaluated on a fair value basis, in accordance with the Company's documented risk management or investment strategy, and information about the Company is provided internally on that basis; or
• it forms part of a contract containing one or more embedded derivatives, and IAS 39 Financial Instruments: Recognition and Measurement permits the entire combined contract (asset or liability) to be designated as at FVTPL.
Financial liabilities at FVTPL are stated at fair value, with any resultant gain or loss recognised in the statement of comprehensive incomeas the Company chooses not to disclose the effective interest rate for debt instruments that are classified as at fair value through profitor loss. The net gain or loss recognised in profit or loss incorporates any interest paid on the financial liability.
Other financial liabilitiesOther financial liabilities, including borrowings, are initially measured at fair value, net of transaction costs. Other financial liabilities aresubsequently measured at amortised cost using the effective interest method, with interest expense recognised on an effective yieldbasis. The effective interest method is a method of calculating the amortised cost of a financial liability and of allocating interestexpense over the relevant period. The effective interest rate is the rate that exactly discounts estimated future cash payments throughthe expected life of the financial liability, or, where appropriate, a shorter period.Derecognition of financial liabilities
The Company derecognises financial liabilities when, and only when, the Company’s obligations are discharged, cancelled or they expire.
2.4 Income taxThe current income tax charge is calculated on the basis of the tax laws enacted or substantively enacted at the balance sheet date inthe countries where the company’s subsidiaries operate and generate taxable income. Management periodically evaluate positionstaken in tax returns with respect to situations in which applicable tax regulation is subject to interpretation and establishes provisionswhere appropriate on the basis of amounts expected to be paid to the tax authorities.

57ANNUAL REPORT AND ACCOUNTS 2011 STELLAR DIAMONDS PLC
2. SIGNIFICANT ACCOUNTING POLICIES (CONTINUED)Deferred tax is provided in full, using the liability method, on temporary differences arising between the tax bases of assets and liabilitiesand their carrying amounts in the financial statements. However, the deferred tax is not accounted for if it arises from initial recognitionof an asset or liability in a transaction other than a business combination that at the time of the transaction affects neither accountingnor taxable profit or loss. Deferred tax is determined using tax rates (and laws) that have been enacted or substantively enacted by thebalance sheet date and are expected to apply when the related deferred tax asset is realised or the deferred tax liability is settled.
Deferred tax assets are recognised to the extent that it is probable that future taxable profit will be available against which the temporarydifferences can be utilised.
Deferred tax is provided on temporary differences arising on investments in subsidiaries and associates, except where the timing of thereversal of the temporary difference is controlled by the Company and it is probable that the temporary difference will not reverse in theforeseeable future.
2.5 Share-based paymentsEquity-settled share-based payments to employees and others providing similar services are measured at the fair value of the equityinstruments at the grant date. Fair value is measured by use of a Black-Scholes model. The expected life used in the model has beenadjusted, based on management’s best estimate, for the effects of non-transferability, exercise restrictions and behavioural considerations.
Equity-settled share options granted to employees vest immediately and therefore the charge is recognised in the statement of comprehensive income at the grant date.
Equity-settled share-based payment transactions with other parties are measured at the fair value of the goods and services received,except where the fair value cannot be estimated reliably, in which case they are measured at the fair value of the equity instrumentsgranted, measured at the date the entity obtains the goods or the counterparty renders the service.
2.6 Revenue recognitionRevenue relating to sale of diamonds is measured at the fair value of the consideration received or receivable. Revenue is recognisedwhen the following conditions are satisfied:the Company has transferred to the buyer the significant risks and rewards of ownership of the goods;the Company retains neither the continuing managerial involvement to the degree usually associated with ownership nor effectivecontrol over the goods sold;the amount of revenue can be measured reliably;it is probable that the economic benefits associated with the transaction will flow to the Company; andthe costs incurred or to be incurred in respect of the transaction can be measured reliably.
2.7 Critical accounting judgements and sources of estimation uncertaintyIn the application of the Company’s accounting policies, the directors are required to make judgements, estimates and assumptionsabout the carrying amounts of assets and liabilities that are not readily apparent from other sources. The estimates and associatedassumptions are based on historical experience and other factors that are considered to be relevant. Actual results may differ from these estimates.
The estimates and underlying assumptions are reviewed on an ongoing basis. Revisions to accounting estimates are recognised in theperiod in which the estimate is revised if the revision affects only that period, or in the period of the revision and future periods if therevision affects both current and future periods.
Key sources of estimation uncertainty and judgements made in applying specific accounting policies are as follows:
Share based paymentsIn determining the fair value of share-based payments made during the period to employees and those parties providing services of a similar nature, a number of assumptions have been made by management. The details of these assumptions are reflected in note 7.
Carrying value of non-current assetsThe continuing production from the Mandala mine and the outcome of ongoing exploration, and therefore whether the carrying valueof the mining assets, machinery and equipment and exploration and evaluation expenditures will ultimately be recovered, is inherentlyuncertain. The ability of the Company to realise the carrying values of these assets is contingent upon production or discovery ofeconomically recoverable mineral reserves, the on-going title to the resource properties, the ability of the Company to finance thedevelopment of the properties and on the future profitable production or proceeds from the property. The success of the Company’smineral exploration properties is also influenced by significant risks, legal and political risks and future diamond prices.

58 ANNUAL REPORT AND ACCOUNTS 2011STELLAR DIAMONDS PLC
NOTES TO THE COMPANY FINANCIAL STATEMENTS (CONTINUED)FOR THE YEAR ENDED 30 JUNE 2011 (STATED IN U.S. DOLLARS)
FINANCIAL STATEMENTS
2. SIGNIFICANT ACCOUNTING POLICIES (CONTINUED)The directors make the judgements necessary to implement the Group’s policy with respect to capitalisation of these assets andconsider them for impairment at least annually with reference to indicators in IAS 36 and IFRS 6. If an indication exists, an assessment ismade of the recoverable amount. The recoverable amount is the higher of value in use (being the net present value of expected futurecash flows) and fair value less costs to sell. Value in use is estimated based on operational forecasts for advanced stage projects with keyinputs that include diamond resources, diamond prices, production levels including grade and tonnes processed, production costs andcapital expenditure. However, because of the above-mentioned uncertainties, actual future cash flows could materially differ fromthose estimated.
The carrying value of exploration and evaluation expenditures and investments in subsidiaries are set out in notes 3 and 4.
2.8 Investment in SubsidiariesInvestments in subsidiaries are stated at cost less any provision for impairment.
Additions during the comparative period include $1,302,561 relating to shares issued to Petra Diamonds Limited to acquire theremaining share in the Kono project. During the comparative period, the Company transferred the evaluation and explorationexpenditure in relation to the Bomboko project to West African Diamonds plc SARL, the company that holds the Bomboko licence. The exploration and evaluation asset at 30 June 2011 relates to the Kono project.
The realisation of intangible assets of $1,302,561 is dependent on the discovery and successful development of economic mineralreserves and other factors, as discussed in note 2.7.
3. INTANGIBLE ASSETS
4. INVESTMENT IN SUBSIDIARIESOn 22 February 2010, the Company completed its acquisition of Stellar Diamonds Limited by issuing 53,248,164 new ordinary shareswith a value of $4,157,481.
The movement in the investment in subsidiaries during the year is summarised below:
30 June 2011 30 June 2010
$ $
Exploration and evaluation expenditure
Cost
Opening balance 4,408,327 3,756,106
Additions - 1,414,101
Transfer to a subsidiary - (761,880)
Closing balance 4,408,327 4,408,327
Impairment
Opening balance 3,105,766 -
Charge for the year/period - 3,105,766
Closing balance 3,105,766 3,105,766
Carrying value 1,302,561 1,302,561
Year ended Nine months ended
30 June 2011 30 June 2011
$ $
At cost, unlisted
- Opening balance 4,157,484 6
- Investments during the year/period - 4,157,481
- Written off - (3)
Closing Balance 4,157,484 4,157,484

59ANNUAL REPORT AND ACCOUNTS 2011 STELLAR DIAMONDS PLC
The realisation of investments in subsidiaries of $4,157,484 is dependent on the discovery and successful development of economicmineral reserves and other factors, as discussed in note 2.7.
The realisation of amounts due from subsidiaries is dependent on the discovery and successful development of economic mineralreserves and other factors as discussed in note 2.7.
Credit riskThe maximum credit exposure of the Company as at 30 June 2011 amounted to $15,936,879 (30 June 2010: $7,836,186) relating to theCompany’s cash and cash equivalents and receivables. The directors believe there is limited exposure to credit risk as the Company’scash and cash equivalents are held with major financial institutions. The company’s receivables are amounts due from subsidiaries andthe directors are satisfied that the carrying value approximates to fair value.
4. INVESTMENT IN SUBSIDIARIES (CONTINUED)The wholly-owned subsidiaries of the Company at 30 June 2011 are:
5. TRADE AND OTHER RECEIVABLES
Company Country of incorporation Nature of business
Stellar Diamonds Limited Guernsey Holding company
West African Diamonds SARL Guinea Diamond producer
Castlebay Resources Limited Scotland Prospecting and exploration of diamonds
Basama Diamonds Ltd. and its branch: Republic of Seychelles Prospecting and exploration of diamonds
- Basama Diamond Ltd. (Sierra Leone Branch) Sierra Leone Prospecting and exploration of diamonds
Sierra Diamonds Limited and its branch: British Virgin Islands Prospecting and exploration of diamonds
Sierra Leone Diamonds Limited (Sierra Leone Branch) Sierra Leone Prospecting and exploration of diamonds
Guinean Diamond Corporation Ltd. and its subsidiaries Republic of Seychelles Holding company
- Mano River Diamants Guinee SA Guinea Prospecting and exploration of diamonds
- Ressources Mandala Guinée SARL Guinea Diamond producer
Friendship Diamonds Guinee SA Guinea Prospecting and exploration of diamonds
30 June 2011 30 June 2010
$ $
Amounts due within one year:
VAT 44,999 11,033
Amounts due after one year:
Amounts due from subsidiaries 15,787,711 7,825,153
15,832,710 7,836,186
Amounts due from subsidiaries comprises of:
Stellar Diamonds Limited 14,635,549 7,017,948
West African Diamonds SARL 807,205 807,205
Friendship Diamonds Guinee SA 277,068 -
Sierra Diamonds Limited 55,830 -
Basama Diamonds Ltd 12,059 -
15,787,711 7,825,153

60 ANNUAL REPORT AND ACCOUNTS 2011STELLAR DIAMONDS PLC
NOTES TO THE COMPANY FINANCIAL STATEMENTS (CONTINUED)FOR THE YEAR ENDED 30 JUNE 2011 (STATED IN U.S. DOLLARS)
FINANCIAL STATEMENTS
6. SHARE CAPITAL, SHARE PREMIUM AND WARRANT RESERVEShare capital
Authorised:
Unlimited number of ordinary shares of 5p each.
Number Share capital $ Share premium $
Alloted called-up and fully paid
Balance as at 30 April 2009 13,656,169 1,004,699 14,170,930
Issue of shares 4,333,335 367,604 694,486
Conversion of debt to equity 343,764 26,840 80,521
Exchange difference arising on change in functional currency - 32,274 812,730
Issue of shares on acquisition of Stellar 53,248,164 4,157,484 -
Issue of placing shares 25,000,000 1,951,938 5,784,958
Share issue costs - - (380,023)
Share warrants issued - - (143,024)
Bonus shares issued to directors 112,500 8,784 26,044
Other shares issued 4,500,000 325,641 976,921
Balance as at 30 June 2010 101,193,932 7,875,264 22,023,543
Shares issued on placing 115,500,000 9,280,410 3,721,084
Share warrants issued - - (155,235)
Share issue costs - - (539,757)
Other shares issued 72,727 5,892 5,758
Balance as at 30 June 2011 216,766,659 17,161,566 25,055,393
As part of the reverse acquisition in the previous period, Stellar Diamonds plc, the legal parent, performed a 5 for 1 share consolidation.The number of shares stated above has been restated for the 5 for 1 share consolidation.
Prior to the completion of the reverse acquisition, convertible loans and accrued interest of $546,241 (note 14), unpaid directors’ feesfrom 1 January 2009 of $208,676 (note 17) and African Aura Mining Inc.’s management fee charge for 2009 to Stellar Diamonds Limitedof $150,000 (note 17) were converted into new Stellar Diamonds Limited shares.
The equity structure appearing in the consolidated financial statements reflects the equity structure of the legal parent, including theequity instruments issued under the share for share exchange to effect the transaction. The effect of using the equity structure of thelegal parent gives rise to an adjustment to the Group’s issued equity capital in the form of a reverse acquisition reserve.
On 23 February 2010, a total of 112,500 ordinary shares of 5p each ("bonus shares") were allotted and issued to Karl Smithson, ChiefExecutive Officer, and Angus Ogilvie, Finance Director. These allotments are in satisfaction of half of their respective listing bonuses of£30,000 and £15,000 following the successful admission of the Company on AIM (as set out in the Company's Admission Document).
On 24 May 2010, the Company announced the completion of the share purchase agreement with Petra Diamonds Limited in respect of the acquisition of the remaining 51% of the Kono kimberlite project in Sierra Leone in exchange for the issuance of 4,500,000 newordinary shares to Petra Diamonds Limited as consideration for the agreed purchase price of £900,000, at a price of 20 pence per share.
On 12 October 2010, a total of 38,000,000 ordinary shares of 5p each were allotted and issued for gross proceeds of $3,078,603.Transaction costs of $164,009 were netted against proceeds.
On 29 March 2011, a total of 77,500,000 ordinary shares of 5p each were allotted and issued for gross proceeds of $9,922,891.Transaction costs of $375,748 were netted against proceeds.

61ANNUAL REPORT AND ACCOUNTS 2011 STELLAR DIAMONDS PLC
7. SHARE OPTIONSThe share option reserve represents the value of the share options issued to the Company’s directors and employees under theCompany’s share option scheme.
As part of the acquisition of Stellar Diamonds Limited, the Company performed a 5 for 1 share consolidation. The number of shareoptions stated from 1 May 2008 to 30 April 2009 has been restated for the 5 for 1 share consolidation.
On 10 August 2010 the Company issued a total of 2,950,000 share options at an exercise price of 11p. The options issued have resultedin a charge of $148,276 based on the Black-Scholes option pricing model and the following assumptions nil dividend yield, a weightedaverage expected volatility of the Company’s share price of 34%, a weighted average annual risk free rate of 2.17% and an expected lifeof five years.
On 31 May 2011 the Company issued a total of 8,150,000 share options at an exercise price of 8p. The options issued have resulted in acharge of $418,539 based on the Black-Scholes option pricing model and the following assumptions nil dividend yield, a weightedaverage expected volatility of the Company’s share price of 67%, a weighted average annual risk free rate of 2.25% and an expected life of five years.
On 23 July 2009, the Company issued 600,000 share options to directors and employees. The fair value of $89,077 was calculatedusing the Black-Scholes option pricing model and the following assumptions: nil dividend yield, a weighted average expected volatilityof the Company’s share price of 63.8%, a weighted average annual risk free rate of 0.5% and an expected life of seven years.
As part of the acquisition on 22 February 2010, 3,992,000 Stellar Diamonds Limited options were surrendered in exchange for theissuance of 4,012,463 new options in the Company. The number of replacement options issued was determined by the exchange ratio used in the acquisition of 1.005.
The exercise price of 3,482,325 replacement options was modified from £0.225 to £0.20 per share. The terms and conditions of 530,138replacement options were the same as before.
The replacement share options were measured and recorded at their fair value of $636,974 on the date of issuance, using the Black-Scholes option pricing model and the following assumptions: nil dividend yield, a weighted average expected volatility of the Company’s share price of 67%, a weighted average annual risk free rate of 2.76% and an expected life of seven years.
6. SHARE CAPITAL, SHARE PREMIUM AND WARRANT RESERVE (CONTINUED)Share warrantsThe warrants reserve represents the value of the warrants issued by the Company to subscribe for shares in the Company.
On 12 October 2010 23,064,383 warrants to subscribe to 23,064,383 ordinary shares of 5p each for a price of 12p per share warrantwere issued in relation to the placing of 38,000,000 ordinary shares in the Company. The warrants issued have resulted in a charge of$155,235 using the Black-Scholes option pricing model and the following assumptions: nil dividend yield, a weighted average expectedvolatility of the Company’s share price of 50%, a weighted annual risk free rate of 1.73% and an expected life of one and a half years.
In the previous period, the Company granted 1,190,125 warrants to the Company’s broker for the Placing to subscribe for up to1,190,125 ordinary shares of 5p each in the Company exercisable for a price of 20p per share warrant. The warrants issued have resultedin a charge to the share premium of $143,024 using the Black-Scholes option pricing model and the following assumptions: nil dividendyield, a weighted average expected volatility of the Company’s share price of 67%, a weighted average annual risk free rate of 2.76% andan expected life of two years.
Number of Warrant
Warrants Reserve $
At 1 July 2010 1,190,125 143,024
Share warrants issued on placing of new shares 23,064,383 155,235
Share warrants expired (1,190,125) (143,024)
At 30 June 2011 23,064,383 155,235
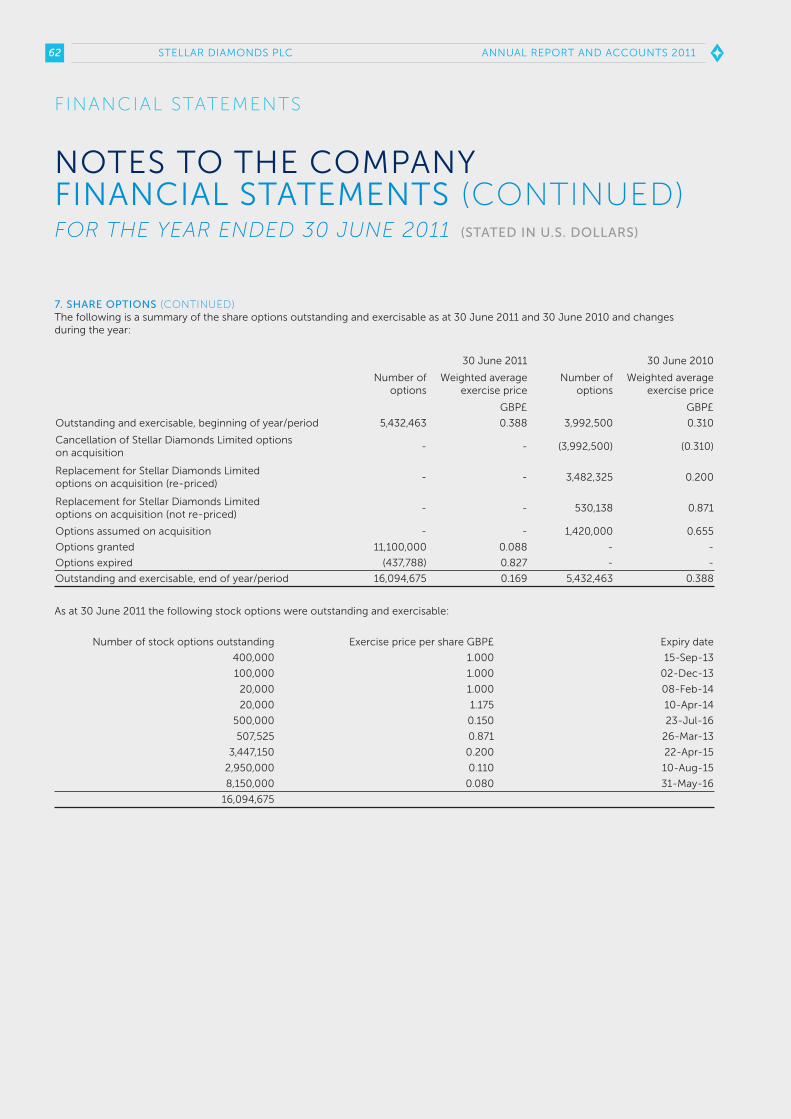
62 ANNUAL REPORT AND ACCOUNTS 2011STELLAR DIAMONDS PLC
FINANCIAL STATEMENTS
NOTES TO THE COMPANY FINANCIAL STATEMENTS (CONTINUED)FOR THE YEAR ENDED 30 JUNE 2011 (STATED IN U.S. DOLLARS)
7. SHARE OPTIONS (CONTINUED)The following is a summary of the share options outstanding and exercisable as at 30 June 2011 and 30 June 2010 and changes during the year:
As at 30 June 2011 the following stock options were outstanding and exercisable:
30 June 2011 30 June 2010
Number of options
Weighted averageexercise price
Number of options
Weighted averageexercise price
GBP£ GBP£
Outstanding and exercisable, beginning of year/period 5,432,463 0.388 3,992,500 0.310
Cancellation of Stellar Diamonds Limited options on acquisition
- - (3,992,500) (0.310)
Replacement for Stellar Diamonds Limited options on acquisition (re-priced)
- - 3,482,325 0.200
Replacement for Stellar Diamonds Limited options on acquisition (not re-priced)
- - 530,138 0.871
Options assumed on acquisition - - 1,420,000 0.655
Options granted 11,100,000 0.088 - -
Options expired (437,788) 0.827 - -
Outstanding and exercisable, end of year/period 16,094,675 0.169 5,432,463 0.388
Number of stock options outstanding Exercise price per share GBP£ Expiry date
400,000 1.000 15-Sep-13
100,000 1.000 02-Dec-13
20,000 1.000 08-Feb-14
20,000 1.175 10-Apr-14
500,000 0.150 23-Jul-16
507,525 0.871 26-Mar-13
3,447,150 0.200 22-Apr-15
2,950,000 0.110 10-Aug-15
8,150,000 0.080 31-May-16
16,094,675

63ANNUAL REPORT AND ACCOUNTS 2011 STELLAR DIAMONDS PLC
8. TRADE AND OTHER PAYABLES
9. RELATED PARTY AND OTHER TRANSACTIONSAmounts due from subsidiaries at 30 June 2011 are disclosed in note 5.
The remuneration of the directors paid by and on behalf of the Company, who are considered to be the key management personnel,are as follows:
10. PARENT COMPANY INCOME STATEMENTAs permitted by Section 408 of the Companies Act 2006 the parent company’s income statement has not been presented in thesefinancial statements. The loss after taxation for the parent company for the year ended 30 June 2011 is $5,177,388 (fourteen monthsended 30 June 2010: $15,574,646).
11. SUBSEQUENT EVENTSThere have been no events subsequent to 30 June 2011 that require reporting in these financial statements.
The directors consider the carrying amount of trade and other payables is approximately equal to their fair value.
30 June 2011 30 June 2010
$ $
Amounts due within one year:
- Trade creditors and accruals 316,085 39,969
316,085 39,969
Salary or feesBonus
paid in cashBonus
paid in sharesShare based
paymentsYear ended
30 June 2011
Fourteen monthsended 30 June
2010
$ $ $ $ $ $
Lord Daresbury 93,851 - - 66,433 160,284 19,667
N. Karl Smithson 214,745 - 82,716 137,893 435,354 123,380
Angus Ogilvie 116,651 - 51,857 25,131 201,593 67,817
Luis da Silva 25,451 - - 38,352 63,803 5,333
Steven J. Poulton 39,767 - - 53,649 93,416 8,333
James Campbell 25,451 - - 38,352 63,803 67,384
Alex Van Zyl - - - - - 26,954
John Teeling - - - - - 53,907
James Finn - - - - - 26,954
515,916 - 134,573 359,810 1,018,253 399,729

64 ANNUAL REPORT AND ACCOUNTS 2011STELLAR DIAMONDS PLC
SHAREHOLDERINFORMATION
REGISTERED OFFICE20 Southampton StreetWC2E 9QHT: +44 (0) 207 257 2930F: +44 (0) 207 257 2939E-mail: [email protected]
CHIEF EXECUTIVE OFFICERKarl SmithsonT: +44 (0) 207 257 2930E-mail: [email protected]
COMPANY SECRETARYNarjess NaouarT: +44 (0) 207 257 2930
NOMINATED ADVISER AND BROKERNorthland Capital Partners Limited60 Gresham StreetLondonEC2V 7BBT: +44 (0) 207 796 8800F: +44 (0) 207 796 8803E-mail: [email protected]
JOINT BROKERDaniel Stewart & Company PlcBecket House, 36 Old Jewry, London EC2R 8DDT: +44 (0) 207 776 6550F: +44 (0) 207 796 4648E-mail: [email protected]
SOLICITORSCobbetts LLPOne Colmore SquareBirminghamB4 6AJT: 0845 404 2404F: 0845 404 4144E-mail: [email protected]
AUDITORSDeloitte & ToucheDeloitte & Touche HouseEarlsfort TerraceDublin 2IrelandT: +353 (0)1 417 2200F: +353 (1)1 417 2300
REGISTRARSComputershare Services (Ireland) LimitedHeron HouseCorrig RoadSandyford Industrial EstateDublin 18

65ANNUAL REPORT AND ACCOUNTS 2011 STELLAR DIAMONDS PLC
NOTES

66 ANNUAL REPORT AND ACCOUNTS 2011STELLAR DIAMONDS PLC
NOTES

DESIGNED AND PRODUCED BY CENTONEX LTD0808 131 2862 | www.centonex.com
PRINTED USING VEGETABLE BASED INKSON SUSTAINABLY SOURCED MATERIALS

STELL AR DIAMONDS PLC
20 Southampton StreetLondonWC2E 7QHT: +44 (0) 20 7257 2930F: +44 (0) 20 7257 2939E: [email protected]
www.stellar-diamonds.com