stefanutti stocks group consolidated annual financial `21
TRANSCRIPT

STEFANUTTI STOCKS GROUP
Consolidated Annual Financial Statements
`21

Simplified group organogram 1
Group structure 2
Audit, governance and risk committee report 3
Directors’ report 6
Independent auditor’s report 9
Consolidated statement of profit or loss and other comprehensive income 12
Consolidated statement of financial position 13
Consolidated statement of changes in equity 14
Consolidated statement of cash flows 15
Notes to the annual financial statements 16
Accounting policies 79
Shareholder analysis 93
Abbreviations and definitions 94
Corporate information IBC
Our business unitsThe Stefanutti Stocks Integrated Annual Report 2021 continues using an icon system to represent its three business units.
These icons represent:
CONSTRUCTION & MINING
BUILDING MECHANICAL & ELECTRICAL
The iconography family is informed by the basic principles of building blocks — with the specific silhouette for each icon broadly alluding to the particular focus of each business unit.
Preparation of annual financial statementsThe consolidated annual financial statements contained in this report, have been prepared under the supervision of the acting Chief Financial Officer, Y du Plessis, CA(SA). The consolidated annual financial statements have been audited in compliance with the applicable requirements of the Companies Act, No. 71 of 2008 (The Companies Act).
Y du Plessis
Acting Chief Financial Officer
21 June 2021
CEO and CFO responsibility statement on internal financial controlsThe CEO and CFO hereby confirm that:
› the separate and group consolidated annual financial statements, which can be found on the website, fairly present in all material respects the financial position, financial performance and cash flow of the company in terms of IFRS;
› no facts have been omitted or untrue statements made that would make the annual financial statements false or misleading;
› internal financial controls have been put in place to ensure that material information relating to the company and its subsidiaries have been provided to effectively prepare the financial statements; and
› the internal financial controls are adequate and effective and can be relied upon in compiling the annual financial statements, having fulfilled their role and function within the combined assurance model pursuant to Principle 15 of King IV.
Where the CEO and CFO are not satisfied, they have disclosed to the audit committee and the external auditors, the deficiencies in design and operational effectiveness of the internal financial controls and any fraud that involves directors, and have taken the necessary remedial action.
Russell Crawford
Chief Executive Officer
Y du Plessis
Acting Chief Financial Officer
21 June 2021
Kempton Park
Certificate by the Company SecretaryIn terms of section 88(2)(e) of the Companies Act, I certify that, to the best of my knowledge and belief, Stefanutti Stocks Holdings Limited has, in respect of the financial year ended 28 February 2021, lodged with the Companies and Intellectual Property Commission all returns and notices required of a public company in terms of the Companies Act and that all such returns and notices are true, correct and up to date.
William Somerville
Company Secretary
21 June 2021
CONTENTS

Simplified group organogram
Insert as per prior year
Stefanutti Stocks Holdings Limited1996/003767/06
Stefanutti StocksInternationalHoldingsProprietary Limited(South Africa)2005/015885/07
Stefanutti StocksProprietary Limited(South Africa)2003/022221/07
Stefanutti StocksInvestmentsProprietary Limited(South Africa)1997/005231/07
Cross-border operational subsidiaries
Operational subsidiaries
AssociatesJOINT VENTURE Al Tayer Stocks LLC (United Arab Emirates)(Non-current Asset Held for Sale)
Joint operations
Consolidated annual financial statements 2021 STEFANUTTI STOCKS GROUP 1
SIMPLIFIED GROUP ORGANOGRAM

The group operates throughout South Africa, Sub-Saharan Africa and in the United Arab Emirates through three business units: Construction & Mining, Building, and Mechanical & Electrical.
STEFANUTTI STOCKS GROUP Consolidated annual financial statements 20212
GROUP STRUCTURE

The Audit, Governance and Risk Committee (ARCO or the committee), appointed in respect of the 2021 financial year of Stefanutti Stocks Holdings Limited, provides this report in compliance with section 94(7)(f) of the Companies Act, the principles of King IV and other regulatory requirements.
The ARCOBesides the specific Companies Act statutory responsibilities bestowed upon it, the committee advises and submits recommendations to the board on the group’s financial reporting, internal financial controls, legislative and regulatory compliance as well as the external and internal audit functions.
Terms of referenceThe formal terms of reference that have been approved and adopted by the board have been guided by the Companies Act and King IV. No changes were made to the terms of reference after the annual review process. The committee confirms that it has executed its duties during the past financial year in accordance with these terms of reference. A discussion of how the 16 principles of King IV have been applied is set out on pages 42 to 50 of the Integrated Annual Report.
CompositionThe board nominated the members of the committee in respect of the 2021 financial year and shareholders appointed its members at the AGM, which was held on 9 October 2020. Shareholders will be requested to approve the appointment of the committee members for the 2022 financial year at the AGM that is scheduled for 6 August 2021.
Dermot Quinn, an independent non-executive director, chairs the committee which comprises a further three independent non-executive directors, namely, Bharti Harie, Busisiwe Silwanyana and John Poluta (alternate to Independent Non-executive Director Busisiwe Silwanyana). Dermot will retire as a board member and ARCO chairman at the company’s annual general meeting on 6 August 2021 and will not offer himself for re-election.
The board Chairman, CEO, CFO, Group Risk Officer, Group Financial Manager, external and internal auditors attend the meeting as invitees. The company secretary acts as secretary to the committee.
› Reviewed the company’s ongoing solvency, liquidity and going concern status;
› Reviewed, together with the external auditors, the conformity of the audited financial statements and related schedules with International Financial Reporting Standards (IFRS) and the company’s accounting policies;
› Reviewed the audit plan, strategy and audit fees payable for FYE 2021 to the external auditors;
› Reviewed internal audit policies, plans, budgets, reports and findings and noted the independence of the internal audit function;
› Approved the audit fee for FYE 2021;
› Monitored compliance with the Code of Business Conduct and Ethics of the company in liaison with the S&E Committee;
› Monitored compliance with applicable laws and regulations;
› Monitored reports from the company’s Ethics Hotline;
› Oversaw the process of sustainability reporting and considered the findings and recommendations of the S&E Committee;
› Assessed key risk areas facing the group, IT risks, the risk register and recommended risk mitigation measures;
› Considered the tax risk report and significant tax matters;
› Oversaw insurance arrangements;
› Considered internal reports on major contracts;
› Oversaw IT governance;
› Advised and updated the board on issues ranging from accounting standards to published financial information;
› Nominated the external auditors and the designated audit partner for reappointment by shareholders at the AGM, as required by the Companies Act and the JSE Listings Requirements;
› Evaluated the finance function and expertise and experience of the CFO;
› Ensured that access to all financial information, and appropriate financial reporting procedures exist, for all entities included in the consolidated financial statements;
› Performed an internal effectiveness review of the ARCO;
› Approved materiality for the group consolidated financial statements in terms of IFRS Practice Statement 2 — Making Materiality Judgements;
› Updated the board on the latest changes to the JSE Listings Requirements, Proactive Monitoring results, COVID-19 Effective Communications with Investors and categorisation on disposal of assets;
The board has satisfied itself that the committee members are suitably skilled, have the correct expertise and experience, are independent and are qualified to fulfil their duties. Abridged biographies of the members are published in the Integrated Annual Report 2021 on page 39.
MeetingsThe committee held four meetings during the year. The table on page 46 of the corporate governance report included in the integrated annual report sets out attendance at these meetings. During the year, the committee met in private with the external auditors.
Execution of dutiesDuring the year the committee:
› Identified specific focus areas, as set out on page 5;
› Evaluated the independence of the external auditors with regards to tenure, individual partner rotation as well as their performance, and recommended their reappointment, to the board;
› Reviewed the quality of the external audit function with regards to audit quality indicators as indicated in reports by external regulators;
› Reviewed the quality of the internal audit function with reference to the findings from their independent internal review processes;
› Noted the JSE requirements regarding mandatory audit firm rotation (MAFR) and partner rotation;
› Confirmed the accreditation of the external auditors and the audit partner with the JSE with regards to tenure as well as individual partner rotation;
› The committee has considered and evaluated the key audit matters as set out in the external auditor’s report and is satisfied that the matters have been correctly disclosed in the integrated report and consolidated annual financial statements;
› The committee reviewed the areas identified by the external auditors as being of significant risk and their approach to auditing these;
› Reviewed the external audit findings and reports;
› Approved any non-audit services performed by the external auditors and the policy in this regard;
› Reviewed the draft audited financial statements and integrated report, the preliminary announcement and interim statements;
› Reviewed the company’s Funding Plan and Restructuring Plan with their underlying assumptions, more fully discussed on page 19;
Consolidated annual financial statements 2021 STEFANUTTI STOCKS GROUP 3
AUDIT, GOVERNANCE AND RISK COMMITTEE REPORT

› Ensured ongoing company compliance with the JSE checklist;
› Considered the potential impact of COVID-19 on the company’s business, operations and going concern status. Based on reports and assurances provided by management, the ARCO was satisfied with the overall approach being followed to mitigate this risk, and comply with laid down regulations;
› Received feedback from the JSE regarding the impact of COVID-19 on
» extension to financial reporting periods;
» capital raising measures;
» full disclosure on impact on financial results in terms of IFRS;
» share repurchases; and
» physical shareholders meetings.
› Reviewed the notice from the B-BBEE commission regarding extension of the times for submission of reports, and filing of correspondence and documents, arising from the impact of COVID-19;
› Monitored the ongoing interaction between the Lender Group, Chief Restructuring Officer (CRO) and the Restructuring Implementation Team (RIT).
Internal financial controlsThe committee’s areas of focus, for the year under review, were to:
› Evaluate the effectiveness of the group’s system of internal financial controls including receiving assurance from management, internal audit and external audit;
› Review matters presented in the external auditor’s reports; and
› Assess the various policies and procedures in place for the prevention and detection of fraud.
The committee believes, based on the processes and assurances obtained, that the significant internal financial controls are effective.
In addition, refer to the contents page of this report dealing with the responsibility statement by the CEO and CFO on financial controls as required by the JSE Listings Requirements.
Regulatory complianceCompliance with applicable laws and regulations is monitored by a combination of management controls, internal audit, external audit, the sponsors and the company secretary. There is no dedicated in-house compliance function given the company’s size and structure. However, compliance is a standard agenda item covered by the Group Risk Officer at ARCO meetings. Compliance with the MOI is overseen by the company secretary. The corporate governance report contains a more detailed discussion on regulatory compliance commencing on page 48 of the Integrated Annual Report.
In addition, refer to page 3 of the Integrated Annual Report on the statement of compliance with the Companies Act and the Memorandum of Incorporation.
Oversight of risk managementThe committee oversees the risk management process. The Group Risk Officer and the Internal Audit Manager report directly to the committee and address all risk identification, measurement and management through these channels. The committee confirmed the independence of the Internal Audit function.
In the year under review a risk management framework, risk policy and risk register were presented for consideration to the committee. The committee has confirmed that the following focus areas below have been attended to:
› Financial reporting risks;
› Funding risks with the Lender Group;
› SSBR contract risks;
› Internal financial controls;
› Fraud risks;
› IT risks; and
› Reviewed technology risks, in particular how they are managed.
For a full discussion on risk management please refer to page 11 of the Integrated Annual Report.
Independence of external auditorsAs part of its responsibilities, the committee assesses the external auditors’ independence and effectiveness annually as required in terms of Section 22.15(h) of the JSE Listings Requirements. A non-audit services policy exists, which the committee reviews on an annual basis. This policy allows the committee to consider whether the external auditors’ independence is materially impaired by any non-audit services rendered. While the external auditors rendered certain non-audit services during the reporting period, their fees were deemed immaterial. The non-audit service rendered includes among other things a factual findings report in respect of B-BBEE verification, auditing of Circulars issued during the year and certain other agreed upon procedures.
Based on enquiries made by the committee and assurances given by the auditors, the committee is satisfied with the external auditors’ independence. The committee has thus recommended to the board and to the shareholders, the reappointment of Mazars as the independent registered audit firm and Susan Truter as the individual registered auditor.
Internal auditThe internal audit charter guides and sets out internal audit’s purpose and scope, responsibilities and duties, independence and ethics. The group’s exposure to risk is monitored by the internal audit function, which assesses the reliability and effectiveness of risk management processes and controls.
The Internal Audit Manager reports to the Group Risk Officer on an administrative basis. The Internal Audit Manager who has unfettered access to the CEO, Chairman of the board, and the chairperson of the ARCO in order to perform his duties and meet his responsibilities reports to the committee on a functional basis.
STEFANUTTI STOCKS GROUP Consolidated annual financial statements 20214
AUDIT, GOVERNANCE AND RISK COMMITTEE REPORT continued

The policies and procedures that guide the internal audit function are aligned to the International Professional Practice Framework (IPPF) as prescribed by the Institute of Internal Auditors. The amended IPPF includes the core principles within the mandatory section, which also incorporates the definition of internal auditing, the code of ethics as well as the standards for an internal audit function. These core principles, reviewed in their entirety, articulate internal audit effectiveness, namely, the internal audit function must:
› Demonstrate integrity;
› Demonstrate competence and due professional care;
› Be objective and free from undue influence (independent);
› Align with the strategies, objectives and risks of the organisation;
› Be appropriately positioned and adequately resourced;
› Demonstrate quality and continuous improvement;
› Communicate effectively;
› Provide risk-based assurance;
› Be insightful, proactive and future-focused; and
› Promote organisational improvement.
The internal audit function is also tasked with monitoring and assessing the group’s corporate governance particularly pertaining to the various delegation of authority frameworks applicable across the group.
The numerous management levels within the group are however responsible for designing, implementing and evaluating the risk management plans and must ensure their sustainability in all aspects of the business.
The committee directs the risk-based internal audit plan which is based on the key risks identified by executive management and confirmed by the committee. The internal audit plan was presented to the committee for annual review and approval at the commencement of the year under review. The following processes were dealt with in the approved internal audit plan:
› Tender and estimating;
› Purchases and payables;
› Subcontractor payments;
› Payroll salaries and wages;
› Financial discipline;
CFOAs required in terms of the JSE Listings Requirements, the annual evaluation of the finance function and the CFO was duly undertaken, and the committee is satisfied that the acting CFO, Y du Plessis, has the appropriate qualifications, expertise, skills and experience to meet the responsibilities as CFO.
The committee has also satisfied itself that the resources within the finance function are appropriate to provide the CFO with the necessary support to properly fulfill her function. The committee considered the matters raised from the external auditors when making its evaluation.
Annual financial statements and integrated annual reportFollowing the review by the committee of the separate and consolidated annual financial statements of Stefanutti Stocks Holdings Limited for the year ended 28 February 2021, the committee is of the view that in all material respects they comply with the relevant provisions of the Companies Act, IFRS, the JSE Listings Requirements, the SAICA Financial Reporting Guides (as issued by the Accounting Practices Committee) as well as the Financial Reporting Pronouncements (as issued by the Financial Reporting Standards Council) and fairly present the consolidated and separate financial position as at 28 February 2021, and its financial performance, the statement of changes in equity and cash flows for the financial year ended. These are available on the company’s website.
The committee has also satisfied itself as to the integrity of the remainder of the integrated annual report, including the sustainability report, and accordingly has recommended the integrated report for the year ended 28 February 2021 for approval to the Stefanutti Stocks board. The board has approved the report, which will be open for presentation at the forthcoming AGM.
On behalf of the ARCO
Dermot Quinn
Chairman
21 June 2021
› IT general computer controls, system development life cycle, cyber attack defences, change management and backup and disaster recovery; and
› Contract (site) reports and reviews.
All findings were communicated to management who reinforced the existing control or implemented new controls and processes to minimise the risk identified to an acceptable level, comparing the advantages gained with the cost of the control.
The group’s internal audit function also appraises the group’s risk management, corporate governance processes and internal controls and submits its assessment of these to the committee annually.
As required by the International Standards of Internal Auditing, an external assessment of the internal audit function will be conducted during the 2022 financial year.
Committee focus areasThe focus areas for the year under review were to:
› Monitor the group’s going concern, solvency and liquidity, specifically given the liquidity shortage experienced by the group during the financial year;
› Review funding required for the future sustainability of the group;
› Consider and review material contracts, outstanding debtors, the recovery of such debts; and
› Consider and review possible asset impairments;
› COVID-19 and the effect on the sustainability of the group.
The focus areas for the coming year include:
› Ongoing monitoring of the Restructuring Plan and the Funding Plan covering:
» Going concern;
» Solvency and liquidity;
» Funding requirements and repayments;
» Asset disposals;
» Debtors recoverability;
» Material contracts; and
» Working capital requirements and movement.
› COVID-19 and the impact on the group;
› Receiving feedback from the CRO and RIT.
Consolidated annual financial statements 2021 STEFANUTTI STOCKS GROUP 5
AUDIT, GOVERNANCE AND RISK COMMITTEE REPORT continued

Nature of businessStefanutti Stocks Holdings Limited (Registration No. 1996/003767/06) (the company, the group or Stefanutti Stocks) is a public company incorporated and domiciled in the Republic of South Africa and is listed on the JSE Main Board in the “Construction and Materials — Construction” sector.
Stefanutti Stocks, a construction company operates throughout South Africa, Sub-Saharan Africa and the United Arab Emirates with multidisciplinary expertise including concrete structures, marine construction, piling and geotechnical services, roads and earthworks, bulk pipelines, surface mining related services, all forms of building works including affordable housing, mechanical and electrical installation and construction.
A simplified group organogram has been provided, additional information on the group’s operating entities is available on request. Please refer to page 1.
COVID-19Stefanutti Stocks’ priority continues to be the health and safety of its employees. The management of the group remains committed to supporting the initiatives that the governments have implemented in the various countries in which the group operates. Importantly, Stefanutti Stocks continues to adhere to the required protocols and maintains a close working relationship with clients and key stakeholders to mitigate the extensive impact of COVID-19 and reduce the long-term effects on its business.
Restructuring plan updateThe group hereby provides shareholders with an update on the Restructuring Plan as reported in the Unaudited Condensed Consolidated Results of Stefanutti Stocks for the six months ended 31 August 2020 issued on 26 November 2020, subsequent disposal of properties announcement issued on 21 October 2020, the disposal of the mining services division announcement issued on 28 April 2021 as well as the Reviewed Condensed Results for the 12 months ended 28 February 2021 issued on 27 May 2021.
As previously reported, the Restructuring Plan has been approved by both the company’s board of directors and the Lenders and envisages, inter alia:
› the sale of non-core assets;
› the sale of underutilised plant and equipment;
› the sale of certain operations;
› internal restructuring initiatives required to restore optimal operational and financial performance;
Going concernThe funding provided by the Lenders has assisted in relieving the group’s liquidity pressures even though current liabilities exceed current assets at 28 February 2021. In addition thereto, uncertainties surrounding the COVID-19 pandemic and contingent liabilities as noted in note 26 of these Consolidated Annual Financial Statements for the year ended 28 February 2021, continue to indicate that a material uncertainty exists that may cast doubt on the group’s ability to continue as a going concern in the short term. However, having converted the short-term funding agreement with the Lenders to a term loan and on the basis of successfully implementing the Restructuring Plan, the directors consider it appropriate that the group’s results for the reporting period be prepared on the going-concern basis.
Eskom — Kusile Power ProjectsAs previously highlighted to shareholders in various announcements and updates since late 2018, the group continues to pursue a number of contractual claims and compensation events on the Kusile power project. Due to the complexity of the claims, the processes remain ongoing. No further details of the claims have been disclosed on the basis that it may prejudice the group’s position in defending the claims brought against it and in pursuing those claims brought against Eskom by the group.
Refer to note 26.
Non-current assets held for sale and discontinued operationsAs a consequence of the implementation of the Restructuring Plan, a number of non-core assets, underutilised plant and equipment and identified operations earmarked for sale have been reclassified in terms of IFRS 5: Non-current Assets Held for Sale and Discontinued Operations.
The carrying value of the investment relating to the equity-accounted United Arab Emirates Joint Venture of R268 million, has also been re-classified to non-current assets held for sale. Negotiations with respect to the sale of this entity remain ongoing. Once agreement has been reached shareholders will be advised as to the terms which could impact on the fair value of the investment. Refer to note 30.
In line with the Restructuring Plan, the group has initiated a disposal programme to sell certain operations which have accordingly been classified as discontinued operations effective 1 July 2020 and 28 February 2021. These disposals, including certain foreign operations, are expected to be concluded within the next 12 months and include the disposal of the Mining Services division as contemplated in the Circular sent to Shareholders on 28 April 2021.
› the securing of additional short-term funding of R430 million, of which R270 million related to the negative effects of the national lockdown in March/April 2020;
› a favourable outcome from the processes relating to the contractual claims and compensation events on the Kusile power project;
› the restructuring of the short-term funding received to date from the Lenders into a term loan; and
› evaluation of an optimal business model going forward and associated capital structure analysis including the potential of raising new equity.
In accordance with the Restructuring Plan, the Lenders had provided the requisite funding and converted the short-term funding agreement into a term loan on 1 July 2020, which loan terminates on 28 February 2022. The loan bears interest at prime plus 5,4%, including arranging and facility fees, and is secured by special and general notarial bonds over movable assets, continuous covering mortgage bonds over immovable assets and various cessions. Shareholders are further advised that the group, on 25 May 2021, reached an agreement with the Lenders to extend the current capital repayment profile of the loan. The capital portion of the loan repayments are envisaged to commence in July 2021 with a residual loan balance at 28 February 2022 of approximately R420 million. The resolution of contractual claims and compensation events on the Kusile power project is taking longer than anticipated due to the complex nature thereof.
The Lenders have agreed to provide continued guarantee support for current and future projects being undertaken by the group.
Management has made considerable progress in reconfiguring the group’s organisational structure to improve operational performance and decrease overhead costs, including the reduction of the group’s overall headcount. This is an ongoing process which continues as the aspects of the Restructuring Plan are being implemented in this uncertain environment.
The purpose of the Restructuring Plan is to put in place an optimal capital structure and access to liquidity to position the group for long-term growth.
The Restructuring Plan is anticipated to be implemented over the financial year ending February 2022 and, to the extent required, shareholder approval will be sought for certain aspects of the Restructuring Plan. Stefanutti Stocks will continue to update shareholders on the progress of the various aspects of the Restructuring Plan.
STEFANUTTI STOCKS GROUP Consolidated annual financial statements 20216
DIRECTORS’ REPORT

The financial performance, reportable assets and reportable liabilities are presented within the Construction & Mining and Building business units.
Further information relating to the discontinued operations can be found in note 7.
Financial results and year under reviewThe consolidated annual financial statements of Stefanutti Stocks Holdings Limited and its subsidiaries, joint operations and equity-accounted investees (collectively the group) for the year ended 28 February 2021 are set out in the annual financial statements presented on pages 12 to 92.
The consolidated annual financial statements for the group (results for the year) have been prepared in accordance with International Financial Reporting Standards (IFRS), SAICA Financial Reporting Guides (as issued by the Accounting Practices Committee) and the Financial Reporting Pronouncements as issued by the Financial Reporting Standards Council. The report is compliant with the relevant provisions of the Companies Act No 71 of 2008 and the JSE Listings Requirements.
The accounting policies as well as the methods of computation used in the preparation of the results for the year ended 28 February 2021 are in terms of IFRS and are consistent with those applied in the audited annual financial statements for the year ended 29 February 2020.
The continued adverse market conditions, as well as the substantial impact of COVID-19, has reduced contract revenue from continuing operations to R5,0 billion (restated Feb 2020: R7,2 billion) with an operating loss of R111 million (restated Feb 2020:R1 022 million). On 30 October 2020 the group ceased marketing the Mechanical & Electrical business unit, which is now classified as part of continuing operations.
The effect of the weakening Rand on the translation of certain foreign operations resulted in R62 million loss (Feb 2020: R52 million profit) being recognised in other comprehensive income.
Contingent liabilities With respect to the civil claim received from the City of Cape Town (Green Point Stadium), the arbitration date has been set for September 2021. The group remains confident it can defend this claim.
With respect to two contract mining project terminations, the arbitration matters remain ongoing. The group is confident that the terminations were lawful and therefore no provision has been made for these. Both arbitrations are expected to be completed by February 2022.
The arbitration matter relating to the cancellation of a petrochemical contract had to be postponed due to a fundamental change in the client’s defence. A date for the arbitration is yet to be set. At this stage the financial impact thereof cannot be quantified.
During the reporting period, Stefanutti Stocks terminated a mechanical project. The client is disputing the termination, which has now been referred to arbitration. The arbitration process is expected to be completed by February 2022. The group is confident that the termination was lawful and therefore no provision has been made against this.
Group entities operating in foreign jurisdictions are continuously subjected to tax audits by local revenue authorities as part of their enforcement processes. The Kenyan Revenue Authority performed an audit on Stefanutti Stocks Kenya Limited for the years 2013 to 2018 and assessments have been issued. Currently these are in process of dispute and appeals.
Refer to note 26.
The United Arab Emirates operation, included in the share of profits of equity-accounted investees, reported a profit of R6 million for the period to June 2020 (Feb: 2020 profit of R48 million). From July 2020, the operation has been classified as held for sale and carried at fair value.
The group has not provided for a deferred tax asset on the losses pertaining to the South African trading entity. Furthermore, the tax charge is impacted by the profitability of the cross-border operations at their varying tax rates.
The after tax loss for the period for continuing operations is R311 million (restated Feb 2020: R1 107 million) and for discontinued operations a profit after tax of R21 million (restated Feb 2020: R35 million).
Earnings and headline earnings per share for total operations are reported as a loss of 171,62 cents (Feb 2020: 640,35 cents) and a loss of 155,13 cents (Feb 2020: 622,48 cents) respectively.
The group’s order book for continuing operations is currently R5,5 billion of which R2,1 billion arises from work beyond South Africa’s borders.
Finance costs increased to R134 million (restated Feb 2020: R115 million) as a result of the extended funding made available from the Lenders. Total interest-bearing liabilities have remained relatively consistent at R1 553 million (Feb 2020: R1 510 million).
The impact of COVID-19 and current dispute resolution processes have contributed negatively on cash consumed by operations of R209 million (Restated Feb 2020: R674 million). The group’s total cash position has increased to R847 million (Feb 2020: R741 million). Should the discontinued operations be excluded, the cash position is R756 million (Feb 2020: R741 million).
SUMMARISED GROUP RESULTS2021
R’0002020R’000 Commentary on the year-on-year movements
Contract Revenue (note 3) 5 040 586 7 227 036 The continued adverse market conditions, as well as the substantial impact of COVID-19
Operating loss before investment income (111 419) (1 022 268) The continued adverse market conditions, as well as the substantial impact of COVID-19
Property, plant and equipment (note 9) 608 411 1 591 318 Disposal of a number of non-core assets, underutilised plant and equipment as well as re-classification of certain operations earmarked for sale as non-current assets held for sale
Financial liabilities (note 20) 1 536 188 1 500 282 Total interest-bearing liabilities have increased slightly, majority being the movement in the term loan relating to advances received and the settlement of other financial liabilities
Trade and other receivables (note 16) 1 614 844 2 354 560 There has been a 31% decrease in trade and other receivables, however debtors days has decreased from 99 days at February 2020 to 95 days
Trade and other payables (note 21) 1 297 983 1 965 066 Trade and other payables decreased with 34 % in line with the reduction of trade and other receivables
Earnings per share (cents) (note 8) (171,62) (640,35) Earnings per share decreased as a direct result of the movement in the statement of profit and loss as discussed above
Headline earnings per share (cents) (note 8) (155,13) (622,48) Refer to note 8 on calculation of headline earnings per share
Consolidated annual financial statements 2021 STEFANUTTI STOCKS GROUP 7
DIRECTORS’ REPORT continued

SafetyManagement and staff remain committed to enhanced health and safety policies and procedures, and together strive to constantly improve the group’s safety performance. The group’s Lost Time Injury Frequency Rate (LTIFR) at February 2021 was 0,03 (Feb 2020: 0,02) and the Recordable Case Rate (RCR) was 0,35 (Feb 2020: 0,29).
Broad-Based Black Economic Empowerment (B-BBEE)The group is a level 1 B-BBEE contributor measured in terms of the Construction Sector scorecard with a Black Economic Interest score of 81,3%.
Dividend declarationNotice is hereby given that no dividend will be declared (Feb 2020: Nil).
Subsequent eventsOther than the matters noted herein, there were no other material reportable events which occurred between the reporting date and the date of these consolidated annual financial statements.
Disposal of Al Tayer StocksPlease refer to note 30 on page 76 for a detail discussion on the potential impact that the disposal of Al Tayer Stocks could have on the groups annual financial statements.
DirectorateThe names of the directors who currently hold office are set out in the Corporate Information section.
ResolutionsAt the 2020 annual general meeting, the shareholders of the company passed the following special resolutions:
› Approval of non-executive directors’ fees.
› Authorisation to provide financial assistance to present or future subsidiaries.
› Approval to repurchase shares — the company and/or its subsidiaries are authorised by way of general authority to acquire ordinary shares issued by the company within the limits set out by the resolution.
ApprovalThe group annual financial statements, which appear on pages 12 to 92, were approved by the board of directors and are signed by:
Russell Crawford
Chief Executive Officer
Y du Plessis
Acting Chief Financial Officer
21 June 2021
Kempton Park
Changes and proposed changes to the board of directors In accordance with paragraph 3.59 of the Listings Requirements of the JSE Limited, shareholders are advised of the following changes to the board:
Dermot Quinn has informed the Board of his intention to retire from the Board at the Company’s 2021 Annual General Meeting. Dermot has served on the board since 2007 as the Chief Financial Officer and thereafter as a non-executive director. John Poluta, currently alternate non-executive director to Busisiwe Silwanyana, will be appointed as a non-executive director. John has been on the Board as an alternate non-executive director since 2017.
The Board expresses its appreciation to Dermot for his valued past contributions and guidance over the years and wishes him all the best for the future.
Given the critical importance of the ongoing implementation of the Restructuring Plan, and in order to devote the required time and resource to this process, Antonio Cocciante will step down from his role as Chief Financial Officer and executive director, effective 31 May 2021 until such time that the plan has been fully implemented. During this implementation period, Yolanda du Plessis will be appointed as acting Chief Financial Officer and executive director with effect from 1 June 2021. Yolanda has been with the group since 2008 and has worked closely with both Dermot and Antonio over the years. Yolanda’s appointment has the support of the Board. Her detailed CV can be found on page 39 of the integrated annual report.
STEFANUTTI STOCKS GROUP Consolidated annual financial statements 20218
DIRECTORS’ REPORT continued

To the Shareholders of Stefanutti Stocks Holdings Limited
OpinionWe have audited the consolidated financial statements of Stefanutti Stocks Holdings Limited and its subsidiaries (the group) set out on pages 12 to 92, which comprise the consolidated statement of financial position as at 28 February 2021, and the consolidated statement of profit or loss and other comprehensive income, the consolidated statement of changes in equity and the consolidated statement of cash flows for the year then ended, and notes to the consolidated financial statements, including a summary of significant accounting policies.
In our opinion, the consolidated financial statements present fairly, in all material respects, the consolidated financial position of Stefanutti Stocks Holdings Limited and its subsidiaries as at 28 February 2021, and its consolidated financial performance and consolidated cash flows for the year then ended in accordance with International Financial Reporting Standards and the requirements of the Companies Act of South Africa.
Material uncertainty related to going concernWe draw attention to the consolidated statement of profit or loss and other comprehensive income, statement of financial position as well as note 2 of the financial statements, which indicates that the group incurred a net loss of R290 million for the year ended 28 February 2021 and, as of that date, the group’s current liabilities exceeded its current assets by R1 358 million. As stated in Note 2 these events and conditions, along with other matters as noted, including the uncertainties surrounding the COVID-19 pandemic and contingent liabilities as disclosed in note 26, indicate that a material uncertainty exists that may cast significant doubt on the group’s ability to continue as a going concern. The financial statements do not include any adjustments that might result from the outcome of this uncertainty. Our opinion is not modified in respect of this matter.
Basis for opinionWe conducted our audit in accordance with International Standards on Auditing (ISAs). Our responsibilities under those standards are further described in the Auditor’s Responsibilities for the Audit of the Consolidated Financial Statements section of our report. We are independent of the group in accordance with the Independent Regulatory Board for Auditors’ Code of Professional Conduct for Registered Auditors (IRBA Code) and other independence requirements applicable to performing audits of financial statements in South Africa. We have fulfilled our other ethical responsibilities in accordance with the IRBA Code and in accordance with other ethical requirements applicable to performing audits in South Africa. The IRBA Code is consistent with the corresponding sections of the International Ethics Standards Board for Accountants’ International Code of Ethics for Professional Accountants (including International Independence Standards). We believe that the audit evidence we have obtained is sufficient and appropriate to provide a basis for our opinion.
Key audit mattersKey audit matters are those matters that, in our professional judgement, were of most significance in our audit of the consolidated financial statements of the current period. These matters were addressed in the context of our audit of the consolidated financial statements as a whole, and in forming our opinion thereon, and we do not provide a separate opinion on these matters.
MATTER HOW OUR AUDIT ADDRESSED THE KEY AUDIT MATTER
Valuation of goodwill (note 12)
Goodwill comprises 6.38% (2020: 6%) of total assets of the group.
As required by the applicable accounting standards, senior management conduct annual impairment tests to assess the recoverability of the carrying value of goodwill.
This is performed using discounted cash flow models.
There are a number of key areas of estimation and judgement made in determining inputs into these models which include:
› Future revenue
› Operating margins
› Interest rates
› Discount rates applied to projected future cash flows
› Adequacy of budgeting techniques
The impairment tests performed on goodwill is considered to be a key audit matter due to the extent of judgement and estimation involved.
Our audit approach involved critical assessment, with the assistance of our valuation experts, as to whether the model used by management to calculate the value in use of the individual cash generating units complies with the requirements of IAS 36 — Impairment of Assets.
As part of our assessment we performed the following substantive procedures:
› analysing the future projected cash flows used in models to determine the reasonability and attainability given the current macro-economic climate and expected future performance of cash generating units;
› subjecting key assumptions to sensitivity analyses;
› assessing the reasonability of forecast assumptions through, comparing actual results for 2021 to budgets;
› discussing with management as to reasons for deviations;
› corroborating explanations obtained from management above with supporting documentation where appropriate;
› assessing the adequacy and reliability of budgeting techniques; and
› reviewing the adequacy of disclosure as required in terms of IAS 36.
Recognition of contract revenue, costs, related receivables and liabilities including the valuation of contracts in progress, excess billings over work done and contract provisions (note 3 and 15)
The industry in which the group operates is characterised by contract risk with significant judgements involved in the assessment of both current and future financial performance. Contracting, by its nature, requires a significant amount of management estimation and judgement in order to report the performance of the contract for the period accurately.
Our testing included a combination of substantive procedures (tests of detail and analytical reviews) as well as test of controls and included but was not limited to:
› considering the appropriateness of the group’s revenue recognition policy including the adequacy of the disclosures relating to contracts;
› assessment of the design and implementation of key controls over recognition of contract revenue and margin including tests to determine whether these controls were operating effectively throughout the period, regardless of whether these controls were ultimately relied upon;
Consolidated annual financial statements 2021 STEFANUTTI STOCKS GROUP 9
INDEPENDENT AUDITOR’S REPORT

MATTER HOW OUR AUDIT ADDRESSED THE KEY AUDIT MATTER
Revenue and costs are recognised based on the stage of completion of individual contracts, calculated as the proportion of total costs at reporting date compared to the estimated total costs of contracts. Anticipated losses to completion are immediately recognised as an expense in contract costs.
Revenue relating to contracts comprises 90% (2020: 99,7%) of the group’s revenue.
Excess billings over work done comprises 26% (2020: 22,7%) of total liabilities.
Contracts in progress comprise 11% (2020: 10%) of total assets.
Contracts in progress consist of costs incurred plus profit recognised to date less cash received or receivables less any provisions or losses.
The status of contracts is updated on a regular basis. In doing so the directors are required to exercise judgement in their assessment of the valuation of contract variations and claims and liquidated damages as well as the completeness and accuracy of forecasted costs to complete and the ability to deliver contracts within forecasted timescales.
Judgement is also applied with respect to the recognition and measurement of contracts in progress and excess billings over work done.
The potential final contract values can cover a wide range of outcomes.
As a result, this is considered a key audit matter.
› verifying the completeness of revenue, for a sample of contracts, by inspecting signed Quantity Surveyor Certificates and agreeing differences to source documents;
› assessing the Quantity Surveyors’ expertise, skills, competence and objectivity, (for a sample of contracts) as required by ISA 540 and ISA 500;
› testing and recalculating the reasonability of the stage of completion calculation based on revenue and costs incurred to date in relation to the signed contract, which include the following: Costs incurred to date less prior year costs incurred to date/Total revised expected costs for contract;
› analysing estimates for total forecast revenue, costs and profit to complete through inspection of contract documentation, including taking into account historical accuracy of such estimates to perform reasonability of the stage of completion of contracts;
› recalculating the reasonability of the stage of completion calculation based on the revenue and costs incurred to date in relation to the signed contract that has been verified;
› agreeing balances relating to contracts in progress (as recalculated above) and excess billings over work done to the general ledger and accounting packs;
› reviewing the recoverability and completeness of contracts in progress and excess billings over work done with reference to events subsequent to year-end;
› assessing recoverability of related receivables, including testing of post period end cash receipts; › attending cost meetings (contract review meetings) where contract performance for the year was discussed. This enabled us to gain assurance over discussions held by the contract directors to identify risky contracts for the year and to oversee management exercising control over the contracts under discussion;
› inspecting site ledger reconciliations to ensure that contract costs were complete and accounted for in the correct time period; › understanding the performance and status of contracts through enquiries with management and contract directors having oversight over various contracts;
› reviewing legal and contracting experts’ reports received on contentious matters (including reviewing the expertise, skills, competence and objectivity of mentioned management experts as required by ISA 540 and ISA 500); and
› assessing the reasonability of the contract cost provisions and onerous contract provisions by critically evaluating management’s calculations.
Valuation of non-current assets held for sale and the classification in terms of IFRS 5 (note 7)
The non-current assets held for sale comprises 19,45% (2020: 0%) of total assets of the group.
The Restructuring Plan of the group has been fully developed and has been approved by both the Stefanutti Stocks Holdings Board and the group’s primary banker and guarantee providers (“the Lenders”).
This plan envisages, inter alia:
› the sale of non-core assets; › the sale of underutilised plant and equipment; and › the sale of certain divisions/subsidiaries within the group.
The items that have been identified for sale span across all business units within the group.
Further information with regards to the funding and restructuring plan can be found in note 2 of the Group Annual Financial Statements.
Due to the complexity surrounding the valuation and classification of the Non-Current Assets Held for sale and the extent of specialised skill and knowledge that was utilised in the testing thereof, the Non-current assets held for sale is considered to be a key audit matter.
Our audit procedures included the following:
› evaluating the appropriateness of the classification of the discontinued operations, disposal groups and non-core assets in terms of the requirements of IFRS 5;
› assessing that the disposal groups and non-core assets were valued correctly in terms of their own accounting standard before being reclassified to Non-Current Assets held for sale in terms of IFRS 5;.
› testing the valuation of the disposal groups, and non-core assets and confirming that they are measured at the lower of carrying value and fair value less costs to sell;
› inspecting that the depreciation was stopped for non-core assets held for sale at classification date in terms of IFRS 5; and
› reviewing the presentation and disclosure of the transactions within the consolidated financial statements to confirm that it is line with the requirements of IFRS 5.
The impact of the outbreak of COVID-19 on the financial statements (note 29)
This nationwide lockdown brought severe restrictions on businesses, affecting Stefanutti Stocks’ construction work, as well as travel and movement. Subsequently, under the revised level 2 restrictions, the group’s businesses are now operating within the required protocols.
However, the challenges that the group faces from the Covid-19 pandemic are complex and unpredictable and as such, quantifying the impact presents an area of great judgement, estimation uncertainty and assumption.
The unknown future impact of the COVID-19 pandemic, together with the various protocols available to governments, has created an unpredictable business environment. It is, therefore, difficult to obtain an accurate assessment of the future impact this will have on the group and its markets going forward.
Specific attention and additional procedures needed to be performed in certain aspects of the audit to determine the impact of the COVID-19. As a result, this is considered a key audit matter.
Our audit procedures included the following:
› reviewing the reasonability of managements assessment of the negative impact of the COVID-19 lockdown on the group`s cash flow forecasts;
› assessing the reasonability of management`s assessment of the future financial effects of the COVID-19 pandemic on each of the significant items on its financial position, performance and risk management;
› recalculating key ratios, including the current ratio and acid test ratio;
› assessing the impact of COVID-19 on the IFRS 9 expected credit loss (ECL) allowance;
› evaluating the impairment considerations relating to assets contained in the company; and
› assessing the adequacy of the disclosures about the goodwill held in the consolidated financial statements.
STEFANUTTI STOCKS GROUP Consolidated annual financial statements 202110
INDEPENDENT AUDITOR’S REPORT continued

Other informationThe directors are responsible for the other information. The other information comprises the information included in the document titled “Stefanutti Stocks Holdings Limited Integrated Report 2021” and in the document titled “Stefanutti Stocks Holdings Limited Separate Financial Statements for the year ended 28 February 2021”, which includes the Directors’ Report, the Audit Committee’s Report, the Company Secretary’s Certificate and the Social and Ethics Committee’s Report as required by the Companies Act of South Africa. The other information does not include the consolidated or the separate financial statements and our auditor’s reports thereon.
Our opinion on the consolidated financial statements does not cover the other information and we do not express an audit opinion or any form of assurance conclusion thereon.
In connection with our audit of the consolidated financial statements, our responsibility is to read the other information and, in doing so, consider whether the other information is materially inconsistent with the consolidated financial statements or our knowledge obtained in the audit, or otherwise appears to be materially misstated. If, based on the work we have performed, on the other information obtained prior to the date of this auditor’s report, we conclude that there is a material misstatement of this other information, we are required to report that fact. We have nothing to report in this regard.
Responsibilities of the directors for the consolidated financial statementsThe directors are responsible for the preparation and fair presentation of the consolidated financial statements in accordance with International Financial Reporting Standards and the requirements of the Companies Act of South Africa, and for such internal control as the directors determine is necessary to enable the preparation of consolidated financial statements that are free from material misstatement, whether due to fraud or error.
In preparing the consolidated financial statements, the directors are responsible for assessing the group’s ability to continue as a going concern, disclosing, as applicable, matters related to going concern and using the going concern basis of accounting unless the directors either intend to liquidate the group or to cease operations, or have no realistic alternative but to do so.
› Evaluate the overall presentation, structure and content of the financial statements, including the disclosures, and whether the financial statements represent the underlying transactions and events in a manner that achieves fair presentation.
› Obtain sufficient appropriate audit evidence regarding the financial information of the entities or business activities within the group to express an opinion on the consolidated financial statements. We are responsible for the direction, supervision and performance of the group audit. We remain solely responsible for our audit opinion.
We communicate with the directors regarding, among other matters, the planned scope and timing of the audit and significant audit findings, including any significant deficiencies in internal control that we identify during our audit.
We also provide the directors with a statement that we have complied with relevant ethical requirements regarding independence, and to communicate with them all relationships and other matters that may reasonably be thought to bear on our independence, and where applicable, actions taken to eliminate threats or safeguards applied.
From the matters communicated with the directors, we determine those matters that were of most significance in the audit of the consolidated financial statements of the current period and are therefore the key audit matters. We describe these matters in our auditor’s report unless law or regulation precludes public disclosure about the matter or when, in extremely rare circumstances, we determine that a matter should not be communicated in our report because the adverse consequences of doing so would reasonably be expected to outweigh the public interest benefits of such communication.
REPORT ON OTHER LEGAL AND REGULATORY REQUIREMENTSIn terms of the IRBA Rule published in Government Gazette Number 39475 dated 4 December 2015, we report that Mazars has been the auditor of Stefanutti Stocks Holdings Limited for 15 years.
Mazars
Registered Auditors
Partner: Susan Truter
Registered Auditor
21 June 2021
Johannesburg
Auditor’s responsibilities for the audit of the consolidated financial statementsOur objectives are to obtain reasonable assurance about whether the financial statements as a whole are free from material misstatement, whether due to fraud or error, and to issue an auditor’s report that includes our opinion. Reasonable assurance is a high level of assurance, but is not a guarantee that an audit conducted in accordance with ISAs will always detect a material misstatement when it exists. Misstatements can arise from fraud or error and are considered material if, individually or in the aggregate, they could reasonably be expected to influence the economic decisions of users taken on the basis of these financial statements.
As part of an audit in accordance with ISAs, we exercise professional judgement and maintain professional scepticism throughout the audit. We also:
› Identify and assess the risks of material misstatement of the financial statements, whether due to fraud or error, design and perform audit procedures responsive to those risks, and obtain audit evidence that is sufficient and appropriate to provide a basis for our opinion. The risk of not detecting a material misstatement resulting from fraud is higher than for one resulting from error, as fraud may involve collusion, forgery, intentional omissions, misrepresentations, or the override of internal control.
› Obtain an understanding of internal control relevant to the audit in order to design audit procedures that are appropriate in the circumstances, but not for the purpose of expressing an opinion on the effectiveness of the company’s internal control.
› Evaluate the appropriateness of accounting policies used and the reasonableness of accounting estimates and related disclosures made by the directors.
› Conclude on the appropriateness of the directors’ use of the going concern basis of accounting and based on the audit evidence obtained, whether a material uncertainty exists related to events or conditions that may cast significant doubt on the company’s ability to continue as a going concern. If we conclude that a material uncertainty exists, we are required to draw attention in our auditor’s report to the related disclosures in the financial statements or, if such disclosures are inadequate, to modify our opinion. Our conclusions are based on the audit evidence obtained up to the date of our auditor’s report. However, future events or conditions may cause the company to cease to continue as a going concern.
Consolidated annual financial statements 2021 STEFANUTTI STOCKS GROUP 11
INDEPENDENT AUDITOR’S REPORT continued
Notes28 February 2021
R’000
Restated29 February 2020
R’000
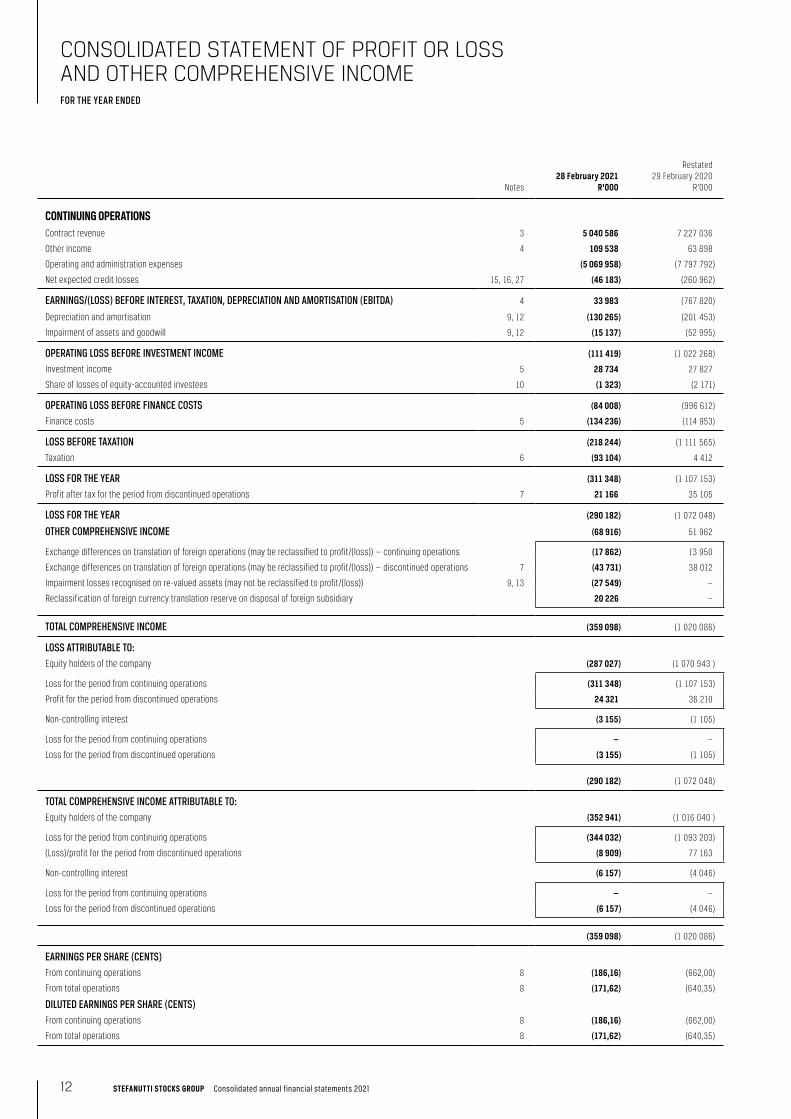
CONTINUING OPERATIONSContract revenue 3 5 040 586 7 227 036
Other income 4 109 538 63 898
Operating and administration expenses (5 069 958) (7 797 792)
Net expected credit losses 15, 16, 27 (46 183) (260 962)
EARNINGS/(LOSS) BEFORE INTEREST, TAXATION, DEPRECIATION AND AMORTISATION (EBITDA) 4 33 983 (767 820)
Depreciation and amortisation 9, 12 (130 265) (201 453)
Impairment of assets and goodwill 9, 12 (15 137) (52 995)
OPERATING LOSS BEFORE INVESTMENT INCOME (111 419) (1 022 268)
Investment income 5 28 734 27 827
Share of losses of equity-accounted investees 10 (1 323) (2 171)
OPERATING LOSS BEFORE FINANCE COSTS (84 008) (996 612)
Finance costs 5 (134 236) (114 953)
LOSS BEFORE TAXATION (218 244) (1 111 565)
Taxation 6 (93 104) 4 412
LOSS FOR THE YEAR (311 348) (1 107 153)
Profit after tax for the period from discontinued operations 7 21 166 35 105
LOSS FOR THE YEAR (290 182) (1 072 048)
OTHER COMPREHENSIVE INCOME (68 916) 51 962
Exchange differences on translation of foreign operations (may be reclassified to profit/(loss)) — continuing operations (17 862) 13 950
Exchange differences on translation of foreign operations (may be reclassified to profit/(loss)) — discontinued operations 7 (43 731) 38 012
Impairment losses recognised on re-valued assets (may not be reclassified to profit/(loss)) 9, 13 (27 549) —
Reclassification of foreign currency translation reserve on disposal of foreign subsidiary 20 226 —
TOTAL COMPREHENSIVE INCOME (359 098) (1 020 086)
LOSS ATTRIBUTABLE TO:Equity holders of the company (287 027) (1 070 943 )
Loss for the period from continuing operations (311 348) (1 107 153)
Profit for the period from discontinued operations 24 321 36 210
Non-controlling interest (3 155) (1 105)
Loss for the period from continuing operations — —
Loss for the period from discontinued operations (3 155) (1 105)
(290 182) (1 072 048)
TOTAL COMPREHENSIVE INCOME ATTRIBUTABLE TO:Equity holders of the company (352 941) (1 016 040 )
Loss for the period from continuing operations (344 032) (1 093 203)
(Loss)/profit for the period from discontinued operations (8 909) 77 163
Non-controlling interest (6 157) (4 046)
Loss for the period from continuing operations — —
Loss for the period from discontinued operations (6 157) (4 046)
(359 098) (1 020 086)
EARNINGS PER SHARE (CENTS)From continuing operations 8 (186,16) (662,00)
From total operations 8 (171,62) (640,35)
DILUTED EARNINGS PER SHARE (CENTS)From continuing operations 8 (186,16) (662,00)
From total operations 8 (171,62) (640,35)
STEFANUTTI STOCKS GROUP Consolidated annual financial statements 202112
CONSOLIDATED STATEMENT OF PROFIT OR LOSS AND OTHER COMPREHENSIVE INCOMEFOR THE YEAR ENDED

Notes28 February 2021
R’00029 February 2020
R’000
ASSETSNON-CURRENT ASSETS 1 211 650 2 606 385
Property, plant and equipment 9 608 411 1 591 318
Equity-accounted investees 10 25 703 342 361
Goodwill and intangible assets 12 345 664 405 930
Deferred tax assets 13 231 872 266 776
CURRENT ASSETS 3 148 139 4 038 663
Inventories 14 59 594 192 049
Contracts in progress 15 610 758 639 545
Trade and other receivables 16 1 614 844 2 354 560
Taxation 89 171 79 620
Bank balances 17 773 772 772 889
Non-current assets held for sale 7 1 053 068 —
TOTAL ASSETS 5 412 857 6 645 048
EQUITY AND LIABILITIESCAPITAL AND RESERVES 352 568 711 666
Share capital and premium 18 1 007 718 1 007 718
Other reserves 48 874 228 435
Reserves of disposal group 105 324 —
Accumulated loss (809 348) (506 249)
Equity holders of the company 352 568 729 904
Non-controlling interest — (18 238)
NON-CURRENT LIABILITIES 269 703 896 398
Financial liabilities 20 182 821 479 627
Excess billings over work done 15 46 506 294 823
Provisions 22 40 376 121 948
CURRENT LIABILITIES 4 505 859 5 036 984
Financial liabilities 20 1 353 367 1 020 655
Trade and other payables 21 1 297 983 1 965 066
Excess billings over work done 15 1 205 771 1 053 733
Provisions 22 551 512 885 103
Taxation 79 092 80 051
Bank overdraft 17 18 134 32 376
Liabilities associated with disposal group held for sale 7 284 727 —
TOTAL EQUITY AND LIABILITIES 5 412 857 6 645 048
Consolidated annual financial statements 2021 STEFANUTTI STOCKS GROUP 13
CONSOLIDATED STATEMENT OF FINANCIAL POSITIONAS AT

Other reserves
Sharecapital
andpremium
R’000
Foreigncurrency
translationreserve
R’000
Revaluationsurplusreserve
R’000
Legalreserve
R’000
Reserves ofdisposal
groupsR’000
Accumulatedloss
R’000
Attributableto equity
holders ofthe company
R’000
Non-controlling
interestR’000
TotalequityR’000
BALANCE AT 28 FEBRUARY 2019 1 007 718 59 829 118 961 — — 559 436 1 745 944 (14 192) 1 731 752
Realisation of revaluation reserves on sale of land and buildings — — (6 022) — — 6 022 — — —
Total comprehensive income — 54 903 — — — (1 070 943) (1 016 040) (4 046) (1 020 086)
Loss for the year — — — — — (1 070 943) (1 070 943) (1 105) (1 072 048)
Other comprehensive income — 54 903 — — — — 54 903 (2 941) 51 962
Recognition of reserve — — — 764 — (764) — — —
BALANCE AT 29 FEBRUARY 2020 1 007 718 114 732 112 939 764 — (506 249) 729 904 (18 238) 711 666
Realisation of revaluation reserves on sale of land and buildings — — (8 323) — — 8 323 — — —
Total comprehensive income — (5 135) (27 549) — (33 230) (287 027) (352 941) (6 157) (359 098)
Loss for the year — — — — — (287 027) (287 027) (3 155) (290 182)
Other comprehensive income — (5 135) (27 549) — (33 230) — (65 914) (3 002) (68 916)
Discontinued operations — (82 107) (56 447) — 138 554 — — — —
Disposal of non-controlling interest — — — — — (24 395) (24 395) 24 395 —
BALANCE AT 28 FEBRUARY 2021 1 007 718 27 490 20 620 764 105 324 (809 348) 352 568 — 352 568
Note 18
STEFANUTTI STOCKS GROUP Consolidated annual financial statements 202114
CONSOLIDATED STATEMENT OF CHANGES IN EQUITYFOR THE YEAR ENDED

Note28 February 2021
R’000
Restated29 February 2020
R’000
CASH FLOWS FROM OPERATING ACTIVITIES (363 445) (750 718)
Cash consumed by operations 23 (209 145) (674 090)
Investment income 5, 7 31 718 29 740
Finance costs 5, 7 (117 711) (76 011)
Dividends received 10 1 565 29 952
Taxation paid 23 (69 872) (60 309)
CASH FLOWS FROM INVESTING ACTIVITIES 256 100 120 385
Property, plant and equipment acquired — expansion 9 (4 252) (28 367)
Property, plant and equipment acquired — maintaining 9 (18 653) (13 847)
Proceeds on disposals of property, plant and equipment 7, 9 153 937 103 276
Repayment of associate 10 4 448 12 993
Disposal of joint operation 23 126 805 —
Disposal of subsidiaries 23 (2 998) —
Net cash (outflow)/inflow due to business combinations 28 (3 187) 46 330
CASH FLOWS FROM FINANCING ACTIVITIES 230 161 463 961
Proceeds from long-term financing 20, 23 5 000 120 000
Proceeds from short-term financing 20, 23 510 014 701 603
Repayment of long-term financing 20, 23 (213 585) (335 850)
Repayment of short-term financing 20, 23 (71 268) (21 792)
NET MOVEMENT IN CASH AND CASH EQUIVALENTS 122 816 (166 372)
CASH AND CASH EQUIVALENTS AT THE BEGINNING OF THE YEAR 740 513 880 771
EFFECT OF EXCHANGE RATE CHANGES ON CASH AND CASH EQUIVALENTS (16 063) 26 114
CASH AND CASH EQUIVALENTS AT YEAR-END — DISCONTINUED OPERATIONS 7 (91 628) —
CASH AND CASH EQUIVALENTS AT YEAR-END 17 755 638 740 513
Consolidated annual financial statements 2021 STEFANUTTI STOCKS GROUP 15
CONSOLIDATED STATEMENT OF CASH FLOWSFOR THE YEAR ENDED

1. CRITICAL ACCOUNTING ESTIMATES, JUDGEMENTS AND ASSUMPTIONSThe preparation of consolidated annual financial statements requires management to make judgements, estimates and assumptions that affect the reported amounts of revenues, expenses, assets and liabilities and the accompanying disclosures and the disclosure of contingent liabilities. Estimates and judgements are continually evaluated and are based on historical experience and other factors, including expectations of future events and are believed to be reasonable under the circumstances. Actual results may differ from the estimates made by management.
MATERIALITY STATEMENTThe group prepared a materiality statement as guided by IFRS Practice Statement 2 — Making Materiality Judgements which was approved by the ARCO. This document guided the preparers in assessing materiality when preparing the annual financial statements and applying judgement. The materiality statement covered both quantitative and qualitative factors such as the impact of COVID-19, new accounting standards, industry conditions and disruptive events and items regulated by statutory requirements.
IN THE PROCESS OF APPLYING THE GROUP’S ACCOUNTING POLICIES, THE DIRECTORS HAVE MADE THE FOLLOWING ESTIMATES AND JUDGEMENTS THAT HAVE THE MOST SIGNIFICANT EFFECTS ON THE AMOUNTS RECOGNISED AND DISCLOSED IN THE ANNUAL FINANCIAL STATEMENTS:
REVENUE FROM CONTRACTS WITH CUSTOMERS (NOTE 3)Revenue is recognised over time as the group transfers control of goods and services to the customer whilst enhancing an asset controlled by the customer. The output method is followed in measuring the progress towards satisfaction of the performance obligations. Revenue is measured with reference to surveys of work performed. When the surveys of work performed cannot be determined reliably, revenue is recognised only to the extent of the expenses recognised that are recoverable. Surveys of work performed are deemed to be the best output method, as these surveys are firstly performed internally and then approved and re-performed by an external surveyor of the client. When management estimates, based on the cost of work performed to date in relation to the total work to be performed, that the total costs to be incurred to complete a contract will be in excess of the estimated total revenue from the contract, the full expected loss to be incurred is recognised immediately or any penalties arising from failure to fulfil it, whichever is the least net cost.
Certain contracts include penalty provisions, claims and a change of scope of work to be performed which constitutes variable consideration. Variable consideration is measured either at the most likely outcome method or expected value method and is considered at each reporting date. The most appropriate method is selected for each contract and applied consistently throughout the contract term. In most instances the most likely outcome method is used as there are only a few possible outcomes.
In certain instances, the group receives advance payments when starting on a contract as part of the negotiated price. The group concluded that there is a significant financing component for those contracts where the client elects to pay in advance, other than advance payments received and utilised within 12 months. The financing component is calculated based on the length of time between the client’s payment and the transfer of goods and services over time, relating to the advance payment received. This financing component is recognised in profit or loss as finance costs (note 5) as it is incurred. An appropriate interest rate is applied, which reflects the separate financing transaction between the group and the client.
NON-CURRENT ASSETS HELD FOR SALE AND DISCONTINUED OPERATIONS (NOTE 7)During the year, the group announced its intention to sell a number of non-core assets, underutilised plant and equipment and certain operations. The group had to apply judgment in assessing whether the assets and discontinued operations meet the criteria to be classified as held for sale at reporting date. The below was considered:
› Whether the assets and operations were available for immediate sale and can be sold to a buyer in their current condition
› Whether the actions to complete the sale were initiated and expected to be completed within one year from the date of initial classification
› Whether a potential buyer has been identified and negotiations as at the reporting date are at an advanced stage
› Whether shareholder approval was obtained
VALUATIONS
Non-current assets held for sale and discontinued operations are measured at the lower of their carrying amounts and fair value less costs to sell at the time of the reclassification and at each reporting period. The group uses judgement to determine the fair value hierarchy of classes of assets and liabilities and in selecting the most appropriate valuation methods. The group takes into consideration the circumstances under which valuations are performed and for which sufficient data is available to measure fair value, maximising the use of relevant observable inputs and minimising the use of unobservable inputs.
For non-current assets held for sale, the fair value for land and buildings was determined using the Income Capitalisation Method or the Direct Comparable Sales Method. These entail the use of a range of market capitalisation rates and income/expenditure ratios. The fair value for plant and equipment and transport and motor vehicles was determined using the comparable sales method. This entails the use of quoted prices for identical or similar assets in the market. This method of valuation is best suited for these types of assets. Refer to note 7.2
For discontinued operations, the group is responsible for identifying, assessing and selecting an appropriate independent valuation method to determine the fair value of the operations. This valuation involves a combination of asset-based, comparable company and transaction analysis and present value techniques. This includes an assessment of the underlying assets and liabilities, comparing the performance of the respective businesses relative to their peers and other transactions completed in the market to determine the current state of the market, and an estimate of future cash flows discounted at an appropriate discount rate. These estimates are adjusted based on assumptions about possible variations in the amount and timing of the cash flows, a risk premium for uncertainty inherent in the cash flows and other factors. Refer to note 7.1.
For more details on the non-current assets held for sale and discontinued operations, refer to note 7.
STEFANUTTI STOCKS GROUP Consolidated annual financial statements 202116
NOTES TO THE ANNUAL FINANCIAL STATEMENTSFOR THE YEAR ENDED 28 FEBRUARY

1. CRITICAL ACCOUNTING ESTIMATES, JUDGEMENTS AND ASSUMPTIONS continued
OPERATING ASSETS
PROPERTY, PLANT AND EQUIPMENT (NOTE 9)
Valuations
Valuations are performed generally every five years to ensure that the fair value of a revalued asset does not differ materially from its carrying amount.
A valuation was performed on 28 February 2017 by an accredited independent valuer. Properties were valued by either applying the Comparable Sales Method or Income Capitalisation Method. To determine which method would be the most appropriate for each property, cognisance was taken of the following relevant to each property: Each property’s general uniqueness, durability, proximity of location, relatively “limited” supply, and the specific utility of a given site.
The Income Capitalisation Method of valuation entails the determination of the Net Annual Income for the property, which is then capitalised at an appropriate market related capitalisation rate. This method of valuation is best suited for income-producing properties.
The Comparable Sales Method approach entails the identification, analysis and application of recent comparable sales involving physically and legally similar units in the general proximity of the property to be valued. This method of valuation is best suited for non-income producing properties. This valuation included a review of title deed information, town planning conditions, property descriptions and improvements as well as locality. Market conditions and demand, comparable sales and vacant land values were also taken into consideration. Refer note 27.
Useful lives
The useful life of an asset is the period over which the group expects to utilise the benefits embodied in the assets, and not necessarily the asset’s economic life. Useful lives of assets are reviewed annually. The group uses the following indicators to determine useful life:
› Expected usage of assets
› Expected physical wear and tear
› Technical and commercial obsolescence
The estimated useful lives assigned to the categories of Property, Plant and Equipment (owned and instalment sales) are as follows:
› Buildings: 50 years
› Plant and equipment: 5 – 10 years
› Transport and motor vehicles: 3 – 10 years
› Furniture, fittings, office and computer equipment: 3 – 8 years
The useful lives for right-of-use assets — other are the shorter of the lease term or the useful life of the leased asset. Generally, lease terms are between one and five years.
RESIDUAL VALUESAn estimate is made of the amount the group would expect to receive currently for the asset, if the asset was already of the age and condition expected at the end of its useful life. These residual values of property, plant and equipment are reviewed annually, by comparing it to the disposal value of comparative assets in the market.
IMPAIRMENT OF ASSETS
PROPERTY, PLANT AND EQUIPMENT (NOTE 9)
Management assesses changes in interest rates, currency exchange rates as well as the state of affairs in the construction sector, as indicators that impairment testing may need to be performed.
GOODWILL (NOTE 12)
Goodwill is assessed for impairment annually or more frequently if events or changes in circumstances indicate that the carrying amount may be impaired. Impairment is determined by assessing the recoverable amount of the cash-generating unit to which goodwill relates. The recoverable amount is determined as the value in use of each cash-generating unit by estimating the expected future cash flows in each unit and determining a suitable discount rate in order to calculate the present value of those cash flows.
Each year, management employs a rigorous process in assessing the recoverability of goodwill, which begins with the budgeting process as one of its base inputs. The budgets, upon which the impairment tests are based, go through an internal vetting and approval process which covers the budget and strategic planning process for the coming four years.
Budgets are zero based each year, and through the vetting process are tested for sensibility given the strategic intent and capabilities of the operations within the group. The Executive Committee and Board are part of this process, who ultimately approve these budgets.
Management believes the zero-based budgeting process is best suited to the assessment of the recoverability of goodwill as it addresses the complexities of the construction environment, such as the fact that the construction industry is not static, nor is it repetitive.
NOTES TO THE ANNUAL FINANCIAL STATEMENTS continued
FOR THE YEAR ENDED 28 FEBRUARY
Consolidated annual financial statements 2021 STEFANUTTI STOCKS GROUP 17

1. CRITICAL ACCOUNTING ESTIMATES, JUDGEMENTS AND ASSUMPTIONS continued
The varying industry disciplines within the group which differ in nature, as well as in contract execution, adds to this complexity. During the approval process the past experience and knowledge of the Executive Committee and board are applied to further temper the budgets and inputs to the process. Refer to note 12.
The impact of COVID-9 was considered on assets where valuations were based on the value-in-use method (note 12).
PROVISION FOR EXPECTED CREDIT LOSSES (ECLs) OF CONTRACTS IN PROGRESS AND TRADE AND OTHER RECEIVABLES (NOTE 15, 16)
The loss allowances for financial assets are based on assumptions about risk of default and expected loss rates. The group uses judgement in making these assumptions and selecting the inputs to the impairment calculation, based on the group’s past history, existing market conditions as well as forward-looking estimates at the end of each reporting period. Details of the key assumptions and inputs used are disclosed in note 27.
Included within the loss allowance is specific provisions which relates to specific clients who are showing signs of default, such as delayed payments and liquidity pressures.
JOINT OPERATIONS AND JOINT VENTURES (NOTE 10, 11)
Management assesses whether a joint arrangement must be classified as a joint operation or joint venture. This assessment depends on whether the joint arrangement has rights to the assets, and obligations for the liabilities, relating to the arrangement. The group recognises its investments as joint operations when the operations are performed through unincorporated arrangements such as partnerships and contracts, and the group has rights to the assets, and obligations for the liabilities. In determining the classification of joint arrangements, management considered the contractual agreements with respect to sharing control and whether parties are jointly and severally liable for the joint arrangement’s rights and obligations. Other investments are recognised as joint ventures when the group only has rights to the net assets of the arrangement.
TAXATION (NOTE 6, 13)Management assesses the extent to which it is probable that taxable profit will be available against which deductible temporary differences can be utilised. All companies with deferred tax asset balances are currently trading and are expected to make profits which will enable them to recover the deferred tax assets. The South African trading entity will further recover its deferred tax asset by the implementation of the Restructuring Plan, which will include the sale of non-core assets and the sale of certain divisions within the trading entity.
The group is subject to income taxes in numerous jurisdictions and the calculation of the group’s tax charge and worldwide provisions for income taxes naturally involves a degree of estimation and judgement. There are transactions and tax computations for which the ultimate tax treatment or result is uncertain, or in respect of which the relevant tax authorities may or could indicate disagreement with the group’s treatment and accordingly the final tax charge cannot be determined until resolution has been reached with the relevant tax authority.
The group applies judgements in identifying uncertainties with regards to income tax treatments. The group is of the opinion that it is more probable than not that the treatment of its taxes will be accepted by the relevant tax authorities. The group recognises liabilities for tax based on estimates of whether additional taxes will be due after taking into account external advice where appropriate. Where the final tax outcome of these matters is different from the amounts that were initially recorded, such differences will impact the current and deferred income tax assets and liabilities in the reporting period in which such determination is made.
The effect of COVID-19 has not impacted the recoverability of the deferred tax assets.
USE AND SALES RATE
The deferred tax rate applied to assets is determined by the expected manner of recovery. Where the expected recovery of the asset is through sale, the capital gains tax rate of 22,4% (21,6% for tax year ending 28 February 2024) (2020: 22,4%) is used for South African assets, and foreign tax rates for foreign entities.
If the expected manner of recovery is through use, the normal tax rate of 28,00% (2020: 28,00%) is applied for South African assets and foreign tax rates for foreign entities.
If the manner of recovery is partly through use and partly through sale, a combination of capital gains tax rate and normal tax rate is used.
The effects of the tax rate change in South Africa from 28% to 27% effective for tax year ended 28 February 2024, has been considered and at this stage not been deemed material.
NOTES TO THE ANNUAL FINANCIAL STATEMENTS continued
FOR THE YEAR ENDED 28 FEBRUARY
STEFANUTTI STOCKS GROUP Consolidated annual financial statements 202118

1. CRITICAL ACCOUNTING ESTIMATES, JUDGEMENTS AND ASSUMPTIONS continued
PROVISIONS (NOTE 22)Provisions are raised when deemed necessary by management and an estimate of expected outflows is made based on the information available at the time.
Warranty provisions Warranty provisions are recognised for expected warranty claims, based on past experience. Estimates are made of the anticipated time, materials and sub-contractor involvement required to honour the warranty.
Contract-related provisions Contract-related provisions represent the estimated amounts relating to incurred obligations to third party suppliers. Management estimates these amounts based on the expected cash outflows required to settle its obligations to suppliers.
Onerous contractsA specific provision made for onerous contracts, in instances in which the unavoidable costs of meeting obligations under the contract exceed the economic benefits expected to be received under it. The present obligation under the contract is recognised and measured as a provision.
Severance provisions Severance provisions relate to obligations arising from the Restructuring Plan, and include severance benefits and other costs which will be paid in line with employment agreements.
OPERATING SEGMENTS (NOTE 24)The group uses judgement in applying the aggregation criteria for purposes of identifying its operating segments. Segment reporting is done in a manner consistent with the internal reporting provided to the chief operating decision maker being the Executive Committee, with reportable operating segments being reported at business unit level. Segments are managed at business unit level and can be further broken down into divisions. Divisions which are similar in nature and function are aggregated and managed by the same managing director to form these business units.
CONTINGENT LIABILITIES (NOTE 26)Management may assess and determine, based on expert advice received from time to time, whether an item is a contingent or actual liability. For legal activities where no legal action has been taken/made, management has assessed the likelihood of a future outflow to be remote and no contingent liabilities have been recognised. For further detail relating to contingent liabilities refer to note 26.
2. GOING CONCERN
RESTRUCTURING PLAN UPDATEThe group hereby provides shareholders with an update on the Restructuring Plan as reported in the Unaudited Condensed Consolidated Results of Stefanutti Stocks for the six months ended 31 August 2020 issued on 26 November 2020, subsequent disposal of properties announcement issued on 21 October 2020, the disposal of the mining services division announcement issued on 28 April 2021 as well as the Reviewed Condensed Consolidated Results for the 12 months ended 28 February 2021 issued on 27 May 2021.
As previously reported, the Restructuring Plan has been approved by both the company’s board of directors and the Lenders and envisages, inter alia:
› the sale of non-core assets;
› the sale of underutilised plant and equipment;
› the sale of certain operations;
› internal restructuring initiatives required to restore optimal operational and financial performance;
› the securing of additional short-term funding of R430 million, of which R270 million related to the negative effects of the national lockdown in March/April 2020;
› a favourable outcome from the processes relating to the contractual claims and compensation events on the Kusile power project;
› the restructuring of the short-term funding received to date from the Lenders into a term loan; and
› evaluation of an optimal business model going forward and associated capital structure analysis including the potential of raising new equity.
In accordance with the Restructuring Plan, the Lenders had provided the requisite funding and converted the short-term funding agreement into a term loan on 1 July 2020, which loan terminates on 28 February 2022. The loan bears interest at prime plus 5,4%, including arranging and facility fees, and is secured by special and general notarial bonds over movable assets, continuous covering mortgage bonds over immovable assets and various cessions. Shareholders are further advised that the group, on 25 May 2021, reached an agreement with the Lenders to extend the current capital repayment profile of the loan. The capital portion of the loan repayments are envisaged to commence in July 2021 with a residual loan balance at 28 February 2022 of approximately R420 million. The resolution of contractual claims and compensation events on the Kusile power project is taking longer than anticipated due to the complex nature thereof.
NOTES TO THE ANNUAL FINANCIAL STATEMENTS continued
FOR THE YEAR ENDED 28 FEBRUARY
Consolidated annual financial statements 2021 STEFANUTTI STOCKS GROUP 19

2. GOING CONCERN CONTINUED
The Lenders have agreed to provide continued guarantee support for current and future projects being undertaken by the group.
Management has made considerable progress in reconfiguring the group’s organisational structure to improve operational performance and decrease overhead costs, including the reduction of the group’s overall headcount. This is an ongoing process which continues as the aspects of the Restructuring Plan are being implemented in this uncertain environment.
The purpose of the Restructuring Plan is to put in place an optimal capital structure and access to liquidity to position the group for long-term growth.
The Restructuring Plan is anticipated to be implemented over the financial year ending February 2022 and, to the extent required, shareholder approval will be sought for certain aspects of the Restructuring Plan. Stefanutti Stocks will continue to update shareholders on the progress of the various aspects of the Restructuring Plan.
GOING CONCERNThe funding provided by the Lenders has assisted in relieving the group’s liquidity pressures even though current liabilities exceed current assets at 28 February 2021. In addition thereto, uncertainties surrounding the COVID-19 pandemic and contingent liabilities as noted in note 26 of the group’s Consolidated Annual Financial Statements for the year ended 28 February 2021, continue to indicate that a material uncertainty exists that may cast doubt on the group’s ability to continue as a going concern in the short term. However, having converted the short-term funding agreement with the Lenders to a term loan and on the basis of successfully implementing the Restructuring Plan, the directors consider it appropriate that the group’s results for the reporting period be prepared on the going-concern basis.
3. REVENUE FROM CONTRACTS WITH CUSTOMERS
3.1 RECONCILIATION OF CONTRACT REVENUE
28 February 2021R’000
Restated29 February 2020
R’000
CONTRACT REVENUE
Within South Africa 3 525 650 6 102 372
Outside South Africa 1 514 936 1 124 664
TOTAL REVENUE 5 040 586 7 227 036
3.2 DISAGGREGATED CONTRACT REVENUE
Revenue from contracts with customers can be further disaggregated as follows:
Construction& Mining
R’000Building
R’000
Mechanical& Electrical
R’000Total
R’000
28 FEBRUARY 2021Within South Africa 2 233 275 1 022 589 269 786 3 525 650
Outside South Africa 1 431 663 83 273 — 1 514 936
3 664 938 1 105 862 269 786 5 040 586
Private 1 997 572 975 491 240 786 3 213 849
Public 1 667 366 130 371 29 000 1 826 737
3 664 938 1 105 862 269 786 5 040 586
29 FEBRUARY 2020 (RESTATED)Within South Africa 3 666 846 1 620 689 814 837 6 102 372
Outside South Africa 1 012 614 29 696 82 354 1 124 664
4 679 460 1 650 385 897 191 7 227 036
Private 2 649 767 1 358 793 897 191 4 905 751
Public 2 029 693 291 592 — 2 321 285
4 679 460 1 650 385 897 191 7 227 036
Revenue recognised at a point in time is not material and therefore revenue has not been further disaggregated.
NOTES TO THE ANNUAL FINANCIAL STATEMENTS continued
FOR THE YEAR ENDED 28 FEBRUARY
STEFANUTTI STOCKS GROUP Consolidated annual financial statements 202120

3. REVENUE FROM CONTRACTS WITH CUSTOMERS CONTINUED
28 February 2021Restated
29 February 2020
Construction& Mining
R’000
Mechanical& Electrical
R’000Total
R’000
Construction& Mining
R’000
Mechanical& Electrical
R’000Total
R’000
Roads and bridges 402 235 — 402 235 480 293 — 480 293
Dam, water and sanitation 405 492 — 405 492 498 672 — 498 672
Pipelines 141 811 — 141 811 — — —
Bulk earthworks and geotechnical services 378 643 — 378 643 579 701 — 579 701
Power stations and transmission infrastructure 166 827 — 166 827 479 424 — 479 424
Airports 108 779 — 108 779 78 855 — 78 855
Marine infrastructure 116 486 — 116 486 27 455 — 27 455
Rail infrastructure 856 232 — 856 232 761 729 — 761 729
Mines 842 461 87 900 930 361 1 318 521 467 594 1 786 115
Industrial process plants 166 521 16 515 183 036 311 540 — 311 540
Oil and gas 79 451 165 371 244 822 143 270 429 597 572 867
3 664 938 269 786 3 934 724 4 679 460 897 191 5 576 651
28 February 2021Restated
29 February 2020
Building R’000
Building R’000
Residential 118 278 318 925
Low cost housing 63 299 159 010
Medium and high-end housing 21 066 —
Apartment blocks and high-rise flats 33 913 159 915
Non-residential 987 584 1 331 460
Office & commercial space 199 414 629 949
Shopping and retail space 251 193 97 101
Hospitals and medical centres 21 041 —
Education institutions — 297
Tourism and leisure facilities 135 625 16 071
Factories and warehouses 358 754 550 942
Airports — 602
Mines 1 167 21 080
Power stations and transmission infrastructure 20 390 15 418
1 105 862 1 650 385
NOTES TO THE ANNUAL FINANCIAL STATEMENTS continued
FOR THE YEAR ENDED 28 FEBRUARY
Consolidated annual financial statements 2021 STEFANUTTI STOCKS GROUP 21

3. REVENUE FROM CONTRACTS WITH CUSTOMERS CONTINUED
3.3 TRANSACTION PRICE ALLOCATED TO REMAINING PERFORMANCE OBLIGATIONS
The transaction price allocated to the remaining performance obligations (unsatisfied or partially unsatisfied) are as follows:
Construction& Mining
R’000Building
R’000
Mechanical& Electrical
R’000Total
R’000
28 FEBRUARY 2021
Shorter than 12 months 2 894 844 1 575 062 136 116 4 606 022
Longer than 12 months 635 405 177 326 — 812 731
3 530 249 1 752 388 136 116 5 418 753
29 FEBRUARY 2020 (RESTATED)
Shorter than 12 months 3 103 585 1 299 896 327 591 4 731 072
Longer than 12 months 1 047 744 360 237 — 1 407 981
4 151 329 1 660 133 327 591 6 139 053
The remaining performance obligations are expected to realise as indicated. Performance obligations longer than 12 months mostly relate to long-term contracts (that stretch between one to two years) in the Construction & Mining and Building business units.
Significant long-term contracts include the Mosi-oa-Tunya Hotel and Resort in Zambia, the Bank of Botswana in Botswana and the Data Centres in the Western Cape.
3.4 CONTRACT BALANCES28 February 2021
R’00029 February 2020
R’000
Contracts in progress (note 15) 610 758 639 545
Excess billings over work done (note 15) 1 252 277 1 348 556
Trade receivables (note 16) 1 106 091 1 756 495
Excess billings over work done include long and short-term advances received from clients to deliver construction related services. The movement in this value is dependent on the terms of contracts agreed with clients. Interest of RNIL million (Feb 2020: R6 million) (note 5) was recognised on long-term advances, as the value of these long-term advances substantially decreased during the year.
Contracts in progress are recognised for revenue earned from construction related services and is conditional on certification and invoicing of work performed. Upon certification and invoicing, the amounts recognised as contracts in progress are reclassified to trade receivables. The decrease in contracts in progress relates to an improved cycle in converting items from contracts in progress to trade receivables. The balance of expected credit losses provided for on contracts in progress amounted to R0,6 million (Feb 2020: R1 million) (note 15).
Trade receivables are generally on terms of 60 days and interest is charged as per agreements with individual clients. The reduction in trade receivables is mainly due to a reduction in revenue caused by inactivity during the national lockdown as well as the phased approach that had to be followed to return to work. The balance of expected credit losses provided for on trade receivables amounted to R324 million (Feb 2020: R400 million) (note 16).
4. OTHER INCOME AND EBITDA
4.1 OTHER INCOME
28 February 2021R’000
Restated29 February 2020
R’000
Net profit on disposal of property, plant and equipment (note 9) 24 737 11 887
Net profit on foreign exchange rate movements 9 169 5 766
Other income 372 2 673
Net gain on disposal of non-current assets held for sale 8 148 —
Profit on sale of joint operation (note 23) 53 887 —
Profit on sale of subsidiary (note 23) 507 —
Bargain purchase gain (note 28) — 15 169
Project management fee and rental income from short-term leases 12 718 28 403
109 538 63 898
NOTES TO THE ANNUAL FINANCIAL STATEMENTS continued
FOR THE YEAR ENDED 28 FEBRUARY
STEFANUTTI STOCKS GROUP Consolidated annual financial statements 202122

4. OTHER INCOME AND EBITDA CONTINUED
4.2 EBITDA
28 February 2021R’000
Restated29 February 2020
R’000
Included in these expenses are:
Auditors remuneration 12 290 8 636
Employee costs 1 629 457 2 240 734
— Short-term employee benefit costs 1 482 702 2 112 381
— Post-employment benefit costs 91 871 126 759
— Retrenchment cost 54 353 —
— Long-term employment benefits (note 19) 531 1 594
Expenses relating to leases 587 423 325 258
— Short-term lease (leases less than 12 months) 585 891 323 573
— Low value assets (assets with a new cost of R250 000 and less) 1 453 1 685
— Variable lease payments 79 —
Onerous contract provision — SSBR (note 22, 26) — 461 762
Impairment of equity-accounted investees (note 10) 58 533 —
Impairment of assets (note 9) 15 137 —
Impairment of goodwill (note 12) — 52 995
5. INVESTMENT INCOME AND FINANCE COSTS
5.1 INVESTMENT INCOME
28 February 2021R’000
Restated29 February 2020
R’000
Investment income from financial instruments held at amortised cost:
— Bank accounts 19 665 24 519
— Trade receivables and loans 8 719 1 288
— Joint operations 313 978
— Equity-accounted investees — 963
Other interest — South African Revenue Services 37 79
28 734 27 827
5.2 FINANCE COSTSFinance costs from financial instruments held at amortised cost:
— Bank overdrafts and bonds 3 009 5 973
— Lease liabilities 22 451 41 100
— Financing agreements (insurance, etc.) 1 663 1 491
— Joint operations 2 101 10 169
— Voluntary Rebuild Programme (deemed interest) 7 279 6 784
— Term Loan 91 663 24 298
— Trade payables 791 1 868
— Contract revenue — significant financing component (note 3) — 5 917
Other interest — South African Revenue Services & Kenya Revenue Authority 5 279 17 353
134 236 114 953
NOTES TO THE ANNUAL FINANCIAL STATEMENTS continued
FOR THE YEAR ENDED 28 FEBRUARY
Consolidated annual financial statements 2021 STEFANUTTI STOCKS GROUP 23

6. TAXATION
6.1 TAXATION
28 February 2021Restated
29 February 2020
Local R’000
Foreign R’000
Total R’000
Local R’000
Foreign R’000
Total R’000
CURRENT TAX 1 915 61 648 63 563 (17 483) 48 621 31 138
— Current year 64 43 233 43 297 112 22 736 22 848
— Under provision previous year 1 851 18 415 20 266 (17 595) 25 885 8 290
DEFERRED TAX 55 334 (27 397) 27 937 (46 254) 9 970 (36 284)
— Current year 66 052 (10 267) 55 785 (66 828) 7 416 (59 412)
— (Over)/under provision previous year (10 718) (17 130) (27 848) 20 574 2 554 23 128
WITHHOLDING TAX — 1 604 1 604 — 734 734
Taxation 57 249 35 855 93 104 (63 737) 59 325 (4 412)
6.2 RECONCILIATION OF TAX CHARGE
28 February 2021R’000
Restated29 February 2020
R’000
TAX AT 28% ON LOSS BEFORE TAXATION (61 108) (311 238)
Adjusted for:
Tax relating to discontinued operations 12 057 24 081
DISALLOWABLE EXPENDITURE:
— Goodwill impaired — 14 839
— Deemed interest — Voluntary Rebuild Programme 2 038 1 899
— Professional fees 372 3 949
— Impairments 12 001 —
— Penalties and interest (Kenya) — 6 561
— Legal fees 2 051 1 114
— Other (overseas travel, fines, etc.) 2 164 1 868
— Losses from equity-accounted investees 2 373 920
EXEMPT INCOME:
— Bargain purchase gain (note 28) — (4 247)
— Unrealised foreign exchange transactions (744) —
— Other (share of profits of equity-accounted investees, etc.) (2 646) (206)
— Profit on disposal of subsidiary (1 232) —
OTHER:
Deferred tax assets not raised on losses 136 883 250 125
Foreign tax rate differential 3 248 (11 998)
Special and future allowances (388) (1 460)
Capital Gains Tax differential 5 155 (2 126)
Underprovision previous year (7 582) 31 418
Tax losses utilised (13 142) (10 645)
Withholding taxes 1 604 734
Effective tax 93 104 (4 412)
The effects of the tax rate change in South Africa from 28% to 27%, effective for tax year ended 28 February 2024, has been considered and at this stage has not been deemed material.
NOTES TO THE ANNUAL FINANCIAL STATEMENTS continued
FOR THE YEAR ENDED 28 FEBRUARY
STEFANUTTI STOCKS GROUP Consolidated annual financial statements 202124

7. NON-CURRENT ASSETS HELD FOR SALE AND DISCONTINUED OPERATIONS
7.1 DISCONTINUED OPERATIONSIn line with the Restructuring Plan, as discussed in detail in note 2, the group has initiated a disposal programme to sell certain operations which have accordingly been classified as discontinued operations effective 1 July 2020 and 28 February 2021. These disposals, including certain foreign operations, are expected to be concluded within the next 12 months and include the disposal of the Mining Services division as contemplated in the Circular sent to Shareholders on 28 April 2021. The financial performance, reportable assets and reportable liabilities are presented within the Construction & Mining and Building business units.
Financial information relating to the discontinued operations is set out in the tables below:
STATEMENT OF PROFIT OR LOSS AND OTHER COMPREHENSIVE INCOME28 February 2021
R’00029 February 2020
R’000
Contract revenue 866 770 1 358 890
Earnings before interest, taxation, depreciation and amortisation (EBITDA) 54 038 6 825
Depreciation and amortisation (note 9, 12) (4 779) (17 470)
Fair value adjustments — property, plant and equipment (5 926) —
Loss on re-measurement to fair value less costs to sell of disposal group (26 103) —
Operating profit/(loss) before investment income 17 230 (10 645)
Investment income 3 649 2 479
Share of profit of equity-accounted investees 5 707 48 367
Operating profit before finance costs 26 586 40 201
Finance costs (2 475) (11 114)
Profit before taxation 24 111 29 087
Taxation (2 945) 6 018
Profit for the period 21 166 35 105
Other comprehensive income (36 232) 38 012
Exchange differences on translation of foreign operations (may be reclassified to profit/(loss)) (43 731) 38 012
Reclassification of foreign currency translation reserve on disposal of foreign subsidiary 7 499 —
Total comprehensive income (15 066) 73 117
Profit attributable to: 21 166 35 105
Equity holders of the company 24 321 36 210
Non-controlling interest (3 155) (1 105)
Total comprehensive income attributable to: (15 066) 73 117
Equity holders of the company (8 909) 77 163
Non-controlling interest (6 157) (4 046)
Earnings per share (cents) 14.54 21.65
Diluted earnings per share (cents) 14.54 21.65
Headline earnings per share (cents) 33.26 21.62
Diluted headline earnings per share (cents) 33.26 21.62
The profit is arrived after taking into account the following:
Amortisation (note 12) 339 —
Depreciation (note 9) 4 440 17 470
Employee benefits 278 076 310 110
Net expected credit losses (3 006) 84 726
Profit on disposal of plant and equipment 1 551 59
NOTES TO THE ANNUAL FINANCIAL STATEMENTS continued
FOR THE YEAR ENDED 28 FEBRUARY
Consolidated annual financial statements 2021 STEFANUTTI STOCKS GROUP 25

7. NON-CURRENT ASSETS HELD FOR SALE AND DISCONTINUED OPERATIONS CONTINUED
STATEMENT OF FINANCIAL POSITIONWithin SA
February 2021R’000
Outside SAFebruary 2021
R’000
TotalFebruary 2021
R’000
Non-current assets 43 587 245 549 289 136
Property, plant and equipment (note 9) 10 764 233 946 244 710
Goodwill (note 12) 32 823 — 32 823
Deferred tax assets (note 13) — 11 603 11 603
Current assets 56 802 251 533 308 335
Inventories 430 86 385 86 815
Contracts in progress 625 4 950 5 575
Trade and other receivables 46 431 77 483 123 914
Taxation — 403 403
Bank balances 9 316 82 312 91 628
100 389 497 082 597 471
Non-current liabilities — 386 386
Financial liabilities — 386 386
Current liabilities 43 066 209 455 252 521
Financial liabilities 408 306 714
Trade and other payables 39 944 147 873 187 817
Excess billings over work done — 53 409 53 409
Provisions 2 714 7 867 10 581
43 066 209 841 252 907
NET CASH FLOWS FROM DISCONTINUED OPERATIONS28 February 2021
R’00029 February 2020
R’000
Net cash movement from operating activities 134 473 (240 995)
Net cash movement from investing activities 97 146 (53 695)
Net cash movement from financing activities (178 899) 13 994
Effects of exchange rate changes on cash and cash equivalents 6 469 1 890
Net movement in cash 59 189 (278 806)
HEADLINE EARNINGS RECONCILIATIONDiscontinued operations
28 February 2021R’000
29 February 2020R’000
Profit after taxation attributable to equity holders of the company 24 321 36 210
Adjusted for:
Profit on disposal of plant and equipment (1 551) (59)
Tax effect 433 (1)
Fair value adjustments — property, plant and equipment 5 926 —
Tax effect (1 815) —
Loss on sale of subsidiary 2 200 —
Loss on re-measurement of disposal group 26 103 —
Headline earnings 55 617 36 150
Number of weighted average shares in issue 167 243 684 167 243 684
Number of diluted weighted average shares in issue 167 243 684 167 243 684
NOTES TO THE ANNUAL FINANCIAL STATEMENTS continued
FOR THE YEAR ENDED 28 FEBRUARY
STEFANUTTI STOCKS GROUP Consolidated annual financial statements 202126

7. NON-CURRENT ASSETS HELD FOR SALE AND DISCONTINUED OPERATIONS CONTINUED
DISAGGREGATION OF CONTRACT REVENUE
Revenue from discontinued operations can be further disaggregated as follows:28 February 2021
R’00029 February 2020
R’000
Within South Africa 345 688 388 912
Construction & Mining 345 688 388 912
Outside South Africa 521 082 969 978
Construction & Mining 35 232 59 547
Building 485 850 910 431
Total 866 770 1 358 890
Private 849 442 1 298 356
Construction & Mining 363 592 387 925
Building 485 850 910 431
Public 17 328 60 534
Construction & Mining 17 328 60 534
Total 866 770 1 358 890
28 February 2021R’000
29 February 2020R’000
CONSTRUCTION & MINING
Roads and bridges 17 329 59 139
Marine infrastructure 14 283 —
Mines 346 067 389 320
Oil and gas 3 241 —
380 920 448 459
BUILDING
Non-residential
Office and commercial space 306 202 178 129
Education institutions 176 293
Tourism and leisure facilities 3 969 —
Factories and warehouses 152 730 732 009
Mines 22 773 —
485 850 910 431
TOTAL CONTRACT REVENUE 866 770 1 358 890
NOTES TO THE ANNUAL FINANCIAL STATEMENTS continued
FOR THE YEAR ENDED 28 FEBRUARY
Consolidated annual financial statements 2021 STEFANUTTI STOCKS GROUP 27

7. NON-CURRENT ASSETS HELD FOR SALE AND DISCONTINUED OPERATIONS CONTINUED
SEGMENT INFORMATIONConstruction
& MiningR’000
BuildingR’000
TotalR’000
28 FEBRUARY 2021Contract revenue 380 920 485 850 866 770
Depreciation and amortisation (1 752) (3 027) (4 779)
Net expected credit loss on financial assets 2 750 256 3 006
Reportable segment operating profit 8 839 8 391 17 230
Investment income 294 3 355 3 649
Finance cost (657) (1 818) (2 475)
Share of profits of equity-accounted investees — 5 707 5 707
Taxation (2 376) (569) (2 945)
Reportable segment profit 6 101 15 065 21 166
Reportable segment assets 96 080 501 391 597 471
Reportable segment liabilities 33 908 218 999 252 907
29 FEBRUARY 2020Contract revenue 448 459 910 431 1 358 890
Intersegment contract revenue — 7 7
Depreciation and amortisation (8 599) (8 871) (17 470)
Net expected credit loss on financial assets (84 639) (87) (84 726)
Reportable segment operating (loss)/profit (35 081) 24 436 (10 645)
Investment income — 2 479 2 479
Finance cost (670) (10 444) (11 114)
Share of profits of equity-accounted investees — 48 367 48 367
Taxation (4 677) 10 695 6 018
Reportable segment (loss)/profit (40 428) 75 533 35 105
7.2 NON-CURRENT ASSETS HELD FOR SALEThe following items of property, plant and equipment were reclassified as held for sale as the group is actively marketing these assets and is expected to dispose of these within a year:
PROPERTY, PLANT AND EQUIPMENT
Business unit
Non-current assetsheld for sale
R’000
Liabilities directly associated withnon-current assets held for sale
R’000
Land and buildings Construction & Mining and M&E 47 435 8 190
Transport and motor vehicles Construction & Mining 138 —
Plant and equipment Construction & Mining and Building 140 335 23 630
187 908 31 820
In line with the restructuring plan and as discussed in detail in note 2, the carrying value of the investment relating to the equity-accounted United Arab Emirates Joint Venture of R268 million, has also been re-classified to non-current assets held for sale. Negotiations with respect to the sale of this entity remain ongoing. Once agreement has been reached shareholders will be advised as to the terms which could impact on the fair value of the investment.
Also refer to note 30.
NOTES TO THE ANNUAL FINANCIAL STATEMENTS continued
FOR THE YEAR ENDED 28 FEBRUARY
STEFANUTTI STOCKS GROUP Consolidated annual financial statements 202128

7. NON-CURRENT ASSETS HELD FOR SALE AND DISCONTINUED OPERATIONS CONTINUED
7.3 RECONCILIATION OF THE CARRYING VALUE OF NON-CURRENT ASSETS HELD FOR SALEReconciliation of the carrying value of non-current assets held for sale:
28 February 2021R’000
29 February 2020R’000
Transfer into non-current assets held for sale:
— Property, plant and equipment 187 908 —
Transfer from property, plant and equipment (note 9) 218 985 —
Disposal of property, plant and equipment (31 077) —
— Equity-accounted investee (note 10) 267 689 —
— Disposal groups (note 7.1) 597 471 —
Total discontinued operations and non-current assets held for sale 1 053 068 —
Comprising:
Disposal groups (note 7.1) 597 471 —
Property, plant and equipment 187 908 —
Equity-accounted investee (note 10) 267 689 —
1 053 068 —
Liabilities directly associated with non-current assets held for sale
Disposal groups (note 7.1) 252 907 —
Financial liabilities — secured borrowings (note 7.2) 8 190 —
Financial liabilities — lease liabilities (note 7.2) 23 630 —
284 727 —
8. EARNINGS, HEADLINE EARNINGS AND NET ASSET VALUE PER SHARETotal operations Continuing operations
Cents per share 28 February 2021 29 February 2020 28 February 2021 29 February 2020
EPS — Basic (171,62) (640,35) (186,16) (662,00)
EPS — Diluted (171.62) (640,35) (186,16) (662,00)
HEPS — Basic (155,13) (622,48) (188,39) (644,10)
HEPS — Diluted (155,13) (622,48) (188,39) (644,10)
Net asset value per ordinary share 210,81 436,43
Diluted net asset value per ordinary share 210,81 436,43
Net tangible asset value per ordinary share 4,13 193,71
Diluted net tangible asset value per ordinary share 4,13 193,71
28 February 2021R’000
29 February 2020R’000
LOSS/ASSET VALUES ATTRIBUTABLE TO:
EPS — Basic and diluted — Total operations (287 027) (1 070 943)
HEPS — Basic and diluted — Total operations (259 450) (1 041 065)
EPS — Basic and diluted — Continuing operations (311 348) (1 107 153)
HEPS — Basic and diluted — Continuing operations (315 067) (1 077 215)
EPS — Basic and diluted — Discontinued operations 24 321 36 210
HEPS — Basic and diluted — Discontinued operations 55 617 36 150
Net asset value 352 568 729 904
Net tangible value 6 904 323 974
NOTES TO THE ANNUAL FINANCIAL STATEMENTS continued
FOR THE YEAR ENDED 28 FEBRUARY
Consolidated annual financial statements 2021 STEFANUTTI STOCKS GROUP 29

8. EARNINGS, HEADLINE EARNINGS AND NET ASSET VALUE PER SHARE CONTINUED
Weighted average shares As at February
HEPS and EPS28 February 2021
HEPS and EPS29 February 2020
NAV28 February 2021
NAV 29 February 2020
SHARES USED FOR EPS, HEPS AND NAV
Basic 167 243 684 167 243 684 167 243 684 167 243 684
Diluted 167 243 684 167 243 684 167 243 684 167 243 684
Reconciliation of number of shares
Issued ordinary shares — at the beginning of the year 188 080 746 188 080 746 188 080 746 188 080 746
Effect of treasury shares held in share trusts (6 429 930) (6 429 930) (6 429 930) (6 429 930)
Effect of treasury shares held in investment subsidiary (14 407 132) (14 407 132) (14 407 132) (14 407 132)
NUMBER OF SHARES USED FOR EPS, HEPS AND NAV 167 243 684 167 243 684 167 243 684 167 243 684
TOTAL OPERATIONS Gross amount
2021R’000
Net amount2021
R’000
Gross amount2020R’000
Net amount2020R’000
HEADLINE EARNINGS RECONCILIATION
Loss after taxation attributable to equity holders of the company (287 027) (1 070 943)
Adjusted for:
Profit on disposal of plant and equipment (note 4, 7) (26 288) (18 246) (11 946) (7 948)
Gain on disposal of non-current assets held for sale (note 4) (8 148) (5 867) —
Fair value adjustments (note 7) 5 926 4 111 —
Loss on re-measurement of disposal group (note 7) 26 103 —
Impairment of assets and goodwill (note 9 & 12) 15 137 52 995
Net loss on disposal of subsidiary (note 23) 1 693 —
Profit on sale of joint operation (note 23) (53 887) —
Impairment of equity-accounted investees (note 10) 58 533 —
Bargain purchase gain (note 28) — (15 169)
Headline earnings (259 450) (1 041 065)
CONTINUING OPERATIONS Gross amount
2021R’000
Net amount2021
R’000
Gross amount2020R’000
Net amount2020R’000
HEADLINE EARNINGS RECONCILIATION
Loss after taxation attributable to equity holders of the company (311 348) (1 107 153)
Adjusted for:
Profit on disposal of plant and equipment (note 4) (24 737) (17 128) (11 887) (7 888)
Gain on disposal of non-current assets held for sale (note 4) (8 148) (5 867) —
Impairment of assets and goodwill (note 9 & 12) 15 137 52 995
Impairment of equity-accounted investees (note 10) 58 533 —
Profit on disposal of subsidiary (note 23) (507) —
Profit on sale of joint operation (note 23) (53 887) —
Bargain purchase gain (note 28) — (15 169)
Headline earnings (315 067) (1 077 215)
NOTES TO THE ANNUAL FINANCIAL STATEMENTS continued
FOR THE YEAR ENDED 28 FEBRUARY
STEFANUTTI STOCKS GROUP Consolidated annual financial statements 202130

9. PROPERTY, PLANT AND EQUIPMENTProperty, plant and equipment comprise owned and leased assets that do not meet the definition of investment property.
28 February 2021R’000
29 February 2020R’000
9.1 Owned assets 493 290 987 403
9.2 Right-of-use assets 115 121 603 915
Instalment sales 61 492 302 520
Other 53 629 301 395
TOTAL 608 411 1 591 318
Mortgage bonds have been registered over certain properties and special notarial bonds over certain items of plant as security for the loans provided for the group as disclosed in note 20.
9.1 OWNED ASSETSRevalued Cost
Land and buildings
R’000
Transport and motor
vehicles R’000
Plant and equipment
R’000
Furniture, fittings,
office and computer
equipment R’000
Total R’000
28 FEBRUARY 2021Cost/valuation 207 201 72 884 940 086 77 117 1 297 288
Accumulated depreciation (695) (61 860) (670 584) (70 859) (803 998)
Carrying value at year-end 206 506 11 024 269 502 6 258 493 290
29 FEBRUARY 2020Cost/valuation 570 516 114 676 1 234 430 85 538 2 005 160
Accumulated depreciation (1 256) (94 790) (847 362) (74 349) (1 017 757)
Carrying value at year-end 569 260 19 886 387 068 11 189 987 403
NOTES TO THE ANNUAL FINANCIAL STATEMENTS continued
FOR THE YEAR ENDED 28 FEBRUARY
Consolidated annual financial statements 2021 STEFANUTTI STOCKS GROUP 31

9. PROPERTY, PLANT AND EQUIPMENT continued
Reconciliation of the carrying value of owned assets:
Land and buildings
R’000
Transport and motor
vehicles R’000
Plant and equipment
R’000
Furniture, fittings,
office and computer
equipment R’000
Total R’000
28 FEBRUARY 2021Carrying value at the beginning of the year 569 260 19 886 387 068 11 189 987 403
Additions 13 859 1 330 4 954 2 762 22 905
Disposals (40) (2 000) (86 097) (287) (88 424)
Disposal of subsidiary (note 23) — — (11 742) — (11 742)
Assets scrapped — — (5) — (5)
Depreciation (747) (3 402) (53 290) (6 366) (63 805)
Foreign exchange movement (40 958) (711) (5 086) (124) (46 879)
Transfer from right-of-use assets — 348 212 852 — 213 200
Transfer to inventories — — (363) — (363)
Impairment losses on remeasurement of non-current assets held for sale recognised against revaluation reserve (35 457) — — — (35 457)
Impairment loss on remeasurement of non-current assets held for sale recognised in the statement of profit or loss (note 4) (14 212) (10) (915) — (15 137)
Transfer to non-current assets held for sale (note 7) (68 667) (441) (149 877) — (218 985)
Transfer to disposal groups (note 7) (216 532) (3 976) (27 997) (916) (249 421)
Carrying value at the beginning of the year (256 956) (4 459) (40 449) (1 339) (303 203)
Additions (395) (500) (125) (18) (1 038)
Disposals 40 50 360 40 490
Disposal of subsidiary (note 23) — — 11 742 — 11 742
Depreciation 159 335 2 778 292 3 564
Foreign exchange movement 40 620 598 2 863 109 44 190
Transfer from right-of-use assets — — (5 166) — (5 166)
Carrying value at year-end 206 506 11 024 269 502 6 258 493 290
29 FEBRUARY 2020Carrying value at the beginning of the year 586 171 22 458 370 953 13 531 993 113
Additions 22 257 3 709 12 755 3 493 42 214
Additions due to business combinations (note 28) 3 572 — — — 3 572
Disposals (29 868) (399) (60 848) (215) (91 330)
Assets scrapped — (43) (296) (124) (463)
Depreciation (1 088) (6 220) (66 908) (8 331) (82 547)
Foreign exchange movement 18 175 228 2 183 133 20 719
Transfer from right-of-use assets — 153 129 229 2 702 132 084
Transfer to inventories (29 959) — — — (29 959)
Carrying value at year-end 569 260 19 886 387 068 11 189 987 403
Had land and buildings been carried at cost, the carrying value of land and buildings (including those held for sale) would have been R426 million (February 2020: R481 million).
All disposals of assets result from the sale, scrapping and replacement thereof in the normal course of business.
NOTES TO THE ANNUAL FINANCIAL STATEMENTS continued
FOR THE YEAR ENDED 28 FEBRUARY
STEFANUTTI STOCKS GROUP Consolidated annual financial statements 202132

9. PROPERTY, PLANT AND EQUIPMENT continued
9.2 RIGHT-OF-USE ASSETS
Land and buildings
R’000
Transport and motor
vehicles R’000
Plant and equipment
R’000
Furniture, fittings,
office and computer
equipment R’000
Total R’000
28 FEBRUARY 2021Cost 66 347 23 192 165 129 353 255 021
Instalment sales — 6 718 77 720 — 84 438
Other 66 347 16 474 87 409 353 170 583
Accumulated depreciation (13 403) (19 023) (107 280) (194) (139 900)
Instalment sales — (3 064) (19 882) — (22 946)
Other (13 403) (15 959) (87 398) (194) (116 954)
Carrying value at year-end 52 944 4 169 57 849 159 115 121
29 FEBRUARY 2020Cost 22 679 26 047 916 942 353 966 021
Instalment sales — 7 356 556 768 — 564 124
Other 22 679 18 691 360 174 353 401 897
Accumulated depreciation (17 363) (15 540) (329 079) (124) (362 106)
Instalment sales — (2 003) (259 601) — (261 604)
Other (17 363) (13 537) (69 478) (124) (100 502)
Carrying value at year-end 5 316 10 507 587 863 229 603 915
NOTES TO THE ANNUAL FINANCIAL STATEMENTS continued
FOR THE YEAR ENDED 28 FEBRUARY
Consolidated annual financial statements 2021 STEFANUTTI STOCKS GROUP 33

9. PROPERTY, PLANT AND EQUIPMENT continued
Reconciliation of the carrying value of right-of-use assets:
Land and buildings
R’000
Transport and motor
vehicles R’000
Plant and equipment
R’000
Furniture, fittings,
office and computer
equipment R’000
Total R’000
28 FEBRUARY 2021Carrying value at the beginning of the year 5 316 10 507 587 863 229 603 915
Instalment sales — 5 353 297 167 — 302 520
Other 5 316 5 154 290 696 229 301 395
Additions 54 869 63 11 669 — 66 601
Instalment sales — — 11 649 — 11 649
Other 54 869 63 20 — 54 952
Additions due to business combinations (note 28) 80 — — — 80
Other 80 — — — 80
Foreign exchange movement (63) — — — (63)
Other (63) — — — (63)
Modifications (174) — (272 237) — (272 411)
Other (174) — (272 237) — (272 411)
Depreciation (6 173) (6 053) (56 290) (70) (68 586)
Instalment sales — (1 351) (38 125) — (39 476)
Other (6 173) (4 702) (18 165) (70) (29 110)
Transfer to owned assets — (348) (212 852) — (213 200)
Transfer to disposal groups (note 7) (911) — (304) — (1 215)
Carrying value at the beginning of the year (1 838) — (5 635) — (7 473)
Depreciation 711 — 165 — 876
Foreign exchange movement 63 — — — 63
Modifications 153 — — — 153
Transfer to owned assets — — 5 166 — 5 166
Carrying value at year-end 52 944 4 169 57 849 159 115 121
NOTES TO THE ANNUAL FINANCIAL STATEMENTS continued
FOR THE YEAR ENDED 28 FEBRUARY
STEFANUTTI STOCKS GROUP Consolidated annual financial statements 202134

9. PROPERTY, PLANT AND EQUIPMENT continued
Land and buildings
R’000
Transport and motor
vehicles R’000
Plant and equipment
R’000
Furniture, fittings,
office and computer
equipment R’000
Total R’000
29 FEBRUARY 2020Carrying value at the beginning of the year 9 006 17 148 479 560 3 118 508 832
Instalment sales — 5 264 441 700 2 819 449 783
Other 9 006 11 884 37 860 299 59 049
Additions 6 990 2 631 352 729 — 362 350
Instalment sales — 1 671 55 722 — 57 393
Other 6 990 960 297 007 — 304 957
Depreciation (9 981) (9 119) (115 197) (187) (134 484)
Instalment sales — (1 429) (71 026) (117) (72 572)
Other (9 981) (7 690) (44 171) (70) (61 912)
Foreign exchange movement 123 — — — 123
Other 123 — — — 123
Modifications (changes in lease term) (822) — — — (822)
Other (822) — — — (822)
Transfer to owned assets — (153) (129 229) (2 702) (132 084)
Carrying value at year-end 5 316 10 507 587 863 229 603 915
NOTES TO THE ANNUAL FINANCIAL STATEMENTS continued
FOR THE YEAR ENDED 28 FEBRUARY
Consolidated annual financial statements 2021 STEFANUTTI STOCKS GROUP 35

10. EQUITY-ACCOUNTED INVESTEES
10.1 ANALYSIS OF THE CARRYING VALUE OF EQUITY-ACCOUNTED INVESTEESJoint venture Associates
28 February 2021R’000
29 February 2020 R’000
28 February 2021R’000
29 February 2020 R’000
Shares at cost less impairment — 3 832 1 192 5 602
Share of post-acquisition profits/(losses) — 269 673 5 708 (7 561)
Long-term borrowings — — 18 803 70 815
Carrying value of equity-accounted investees — 273 505 25 703 68 856
RECONCILIATION OF THE CARRYING VALUE OF EQUITY-ACCOUNTED INVESTEES:
Carrying value at the beginning of the year 273 505 226 842 68 856 53 607
Share of profit/(loss) of equity-accounted investments after tax 5 707 48 367 (1 323) (2 171)
Transactions relating to loans
— Repayments made — — (4 448) (12 993)
— Conversion into equity-accounted investments — — (47 045) —
Reclassification from trade creditors — — (776) (12 563)
Non-cash transactions (operating expenses) — — (286) 42 984
Conversion and acquisition of investments — — 71 045 —
Impairment of investments (note 4) — — (58 533) —
Exchange rate differences (11 523) 27 764 (222) 476
Dividends received — (29 468) (1 565) (484)
Transfer to non-current assets held for sale (note 7) * (267 689) — — —
Carrying value at year-end — 273 505 25 703 68 856
* In line with the Restructuring Plan, as discussed in detail in note 2, the joint venture — Al Tayer Stocks has been reclassified to non-current assets held for sale. Negotiations with respect to the sale of the entity remain ongoing.
Refer to note 30.
10.2 INFORMATION IN RESPECT OF MATERIAL JOINT VENTUREAl Tayer Stocks
28 February 2021R’000
29 February 2020 R’000
Nature of relationship Joint venture
Nature of joint venture Building
Place of business and country of incorporation United Arab Emirates
Currency United Arab Emirates Dirham
% Ownership 49 49
% Voting rights 50 50
Closing rate used for conversion (R) 4,11 4,27
SUMMARISED AMOUNTS IN THE STATEMENT OF PROFIT OR LOSS AND OTHER COMPREHENSIVE INCOME OF THE JOINT VENTURE
Dividends received — 29 468
Revenue — 3 471 286
Depreciation — 5 560
Interest income — 6 761
Profit from operations after taxation — 96 734
Other comprehensive income — foreign currency translation reserve — 55 529
Total comprehensive income — 152 263
The functional currency of Al Tayer Stocks is dirham.
NOTES TO THE ANNUAL FINANCIAL STATEMENTS continued
FOR THE YEAR ENDED 28 FEBRUARY
STEFANUTTI STOCKS GROUP Consolidated annual financial statements 202136

10. EQUITY-ACCOUNTED INVESTEES continued
Al Tayer Stocks
28 February 2021R’000
29 February 2020 R’000
TOTAL ASSETS
Non-current assets — 13 717
Current assets — 2 124 681
TOTAL LIABILITIES
Non-current liabilities — (276 166)
Current liabilities (consist of trade and other payables and provisions) — (1 315 222)
Net asset value — 547 010
Group’s share of net asset value — 273 505
Carrying value of investments — 273 505
INCLUDED IN TOTAL ASSETS, LIABILITIES AND COMPREHENSIVE INCOME:
Cash and cash equivalents — 69 403
10.3 INFORMATION OF NON-MATERIAL ASSOCIATES28 February 2021
R’00029 February 2020
R’000
Carrying amount 25 703 68 856
Group’s share of loss after taxation (1 323) (2 171)
Other comprehensive income — foreign currency translation reserve 223 2 063
Group’s share of total comprehensive income (1 100) (108)
Dividends received 1 565 484
NOTES TO THE ANNUAL FINANCIAL STATEMENTS continued
FOR THE YEAR ENDED 28 FEBRUARY
Consolidated annual financial statements 2021 STEFANUTTI STOCKS GROUP 37

11. JOINT OPERATIONSA portion of the group’s operations are performed through joint operations as unincorporated arrangements such as partnerships and contractual arrangements. Joint operations are dissolved at the end of a contract for which it was formed. A loss of interest is therefore in the ordinary course of business. New joint operations are formed when new contracts are awarded to ensure a contract can be executed effectively. Additional information relating to the group’s significant joint operations is provided below:
Nature of joint operations
Principal place of business
Group’s% interest
2021
Group’s% interest
2020
NAME OF JOINT OPERATIONS
SSAS — BRT Stations Construction & Mining Gauteng 70 70
SSAS 2 — BRT Stations Construction & Mining Gauteng 60 60
SS4P — PRASA Platforms Construction & Mining Gauteng 70 70
SAM — Zuikerbosch Sedimentation Construction & Mining Gauteng 80 80
Zuikerbosch Consortium — Zuikerbosch Sedimentation Construction & Mining Gauteng 56 56
SS Civeng GG66 — Exxaro Stockyard and Conveyors Construction & Mining Gauteng 80 80
SS Axsys GG6 — Substation Buildings Construction & Mining Gauteng 70 70
SS Mathebula Mokotong — Mathebula & Mokotong construction Construction & Mining Gauteng 70 70
BRT WP3 — BRT Stations Construction & Mining KwaZulu-Natal 60 60
SS Axsys Mpophomeni — Water treatment # (note 28) Construction & Mining KwaZulu-Natal — 75
Stefanutti Stocks Marine 6 Axsys Projects — reconstruction and deepening of Maydon Warf Berths Construction & Mining KwaZulu-Natal 74 74
Stefanutti Stocks Siyozimela — Crossroads extension Construction & Mining KwaZulu-Natal 60 60
Stefanutti Stocks Letsatsi — C25 Pipelines Construction & Mining KwaZulu-Natal 56 56
SSM — Medupi Pump Station Construction & Mining Limpopo 75 75
SS Ergoflex — Polokwane SO2 abatement project Construction & Mining Limpopo 70 70
Kusile Civils Works — Kusile Power Station Construction & Mining Mpumalanga 50 50
SS Axsys Klipspruit — Klipspruit extension WP16 Construction & Mining Mpumalanga 58 58
Stefanutti Stocks Axsys Mareesburg — Mareesburg Phase 2 Construction & Mining Mpumalanga 75 75
SSA–TNPA Saldana Scour Construction & Mining Western Cape 80 80
Stefanutti Stocks Khumani # (note 28) Construction & Mining Northern Cape — 49
Stefanutti Stocks Heinsite — Palapye Water Treatment Construction & Mining Botswana 70 70
Stefanutti Stocks Consolidated Contractors — Kalabo-Sikongo Road Project Construction & Mining Zambia 50 50
Stefanutti Stocks Botani/Axsys — Mercedes-Benz Logistics Building Building Eastern Cape 58 58
Stefanutti Stocks Axsys/Simunye — Mercedes Benz Bodyshop Building Eastern Cape 56 56
Stefstocks Axsys Projects — Substation South 32 Building Gauteng 50 50
Johannes Ranala Stefstocks — Gabonewe Housing Estate Development Phase 1 Building Gauteng 59 59
Stefanutti Masibone — Mapulaneng Hospital Phase 3C Building Gauteng 70 70
Stefanutti Stocks Building/AP Park Square — Park Square Building KwaZulu-Natal 80 80
KISS — International Convention Centre ̂ (note 23) Building Eswatini — 50
FISH — Five Star Hotel Building Eswatini 44 44
Sikhupe International Airport — Sikhupe International Airport Building Eswatini 40 40
Montys Eswatini — Plumbing on various building contracts Building Eswatini 50 50
Stefanutti Stocks VJ — Building tanks Mechanical & Electrical KwaZulu-Natal 50 50
# Acquired 100% share in joint operation hence ceased to account for this as a joint operation.
^ Disposed of full share in joint operation during the year.
NOTES TO THE ANNUAL FINANCIAL STATEMENTS continued
FOR THE YEAR ENDED 28 FEBRUARY
STEFANUTTI STOCKS GROUP Consolidated annual financial statements 202138

12. GOODWILL AND INTANGIBLE ASSETS28 February 2021 29 February 2020
Goodwill R’000
Intangible assets —customer related
R’000Total
R’000 Goodwill
R’000
Intangible assets —customer related
R’000Total
R’000
Cost 1 232 416 2 653 1 235 069 1 232 416 3 232 1 235 648
Accumulated impairment (827 826) — (827 826) (827 826) — (827 826)
Accumulated amortisation — (2 653) (2 653) — (1 892) (1 892)
Transfer to non-current assets held for sale (note 7) (58 926) — (58 926) — — —
Carrying value at year-end 345 664 — 345 664 404 590 1 340 405 930
Reconciliation of the carrying value of goodwill and intangible assets:
Carrying value at the beginning of the year 404 590 1 340 405 930 457 585 — 457 585
Additions due to business combinations (note 28) — 1 313 1 313 — 3 232 3 232
Impairment (note 4) — — — (52 995) — (52 995)
Amortisation — (2 314) (2 314) — (1 892) (1 892)
Amortisation — discontinued operations (note 7) — (339) (339) — — —
Transfer to non-current assets held for sale (note 7) (58 926) — (58 926) — — —
Carrying value at year-end 345 664 — 345 664 404 590 1 340 405 930
The intangible asset recognised relates to an increase of percentage holding in two non-material joint operations, is customer-related (refer to note 28) and has been amortised during this financial year.
IMPAIRMENT TESTING FOR CASH-GENERATING UNITS (CGU) CONTAINING GOODWILLFor purposes of impairment testing, goodwill is allocated to the group’s operating divisions which represent the lowest CGUs, where goodwill is monitored for internal management purposes.
The value in use of the different CGUs is determined by discounting the future cash flows generated from the continuing use of the CGUs and based on the following key assumptions:
Carrying values of goodwill per CGU Constant growth rate (A) AAARG % (B) Pre-tax WACC (C)
2021 R’000
2020 R’000
2021 %
2020 %
2021 %
2020 %
2021 %
2020 %
CASH-GENERATING UNITS
Stefanutti Stocks Coastal 50 704 50 704 2 2 10 4 12,7 13,4
Stefanutti Stocks Building (Stocks Building Africa (Pty) Ltd) 294 960 294 960 2 2 24 6 12,1 12,7
Stefanutti Stocks Mining Services — 58 926 — 3 — 2 — 12,9
345 664 404 590
These CGUs noted above cannot be directly linked to the operating segments as disclosed in the segment information in note 24, as the above CGUs are representative of acquisitions made whereas the operating segments represent the business units as a whole.
Discounted cash flow forecasts are prepared by management as the basis for determining the estimated recoverable amount. Appropriate growth and discount rates, given the industry and location of the CGUs and its operations, are applied in the forecast. The recoverable amount of each CGU was based on its value in use and was determined to be higher than the carrying amount.
In line with the Restructuring Plan, the group has initiated a disposal programme to sell certain operations which have accordingly been classified as discontinued operations. These disposals include the Mining Services division, and consequently the goodwill of R59 million associated with the Mining Services division have been transferred to non-current assets held for sale.
Cash flows are projected based on actual operating results and four-year forecasts. Cash flows have been prepared taking into account any potential effects relating to COVID-19, specifically additional costs incurred due to preventative measures and the implementation of required protocols as prescribed. Cash flows beyond this were extrapolated using a constant growth rate of (A) which does not exceed the long-term average growth rate for the industry. Appropriate growth and discount rates, given the industry and location of the CGUs and its operations, are applied to the forecast. The calculation of the weighted average cost of capital (WACC) (C) decreased due to a decrease in the beta from 0,28 to 0,18. The beta coefficient is a measure of the volatility, or systematic risk, of an individual stock in comparison to the unsystematic risk of the entire market. The risk-free rate of return (R186) remained stable at 9,10 % compared to 9,12% for the prior year.
NOTES TO THE ANNUAL FINANCIAL STATEMENTS continued
FOR THE YEAR ENDED 28 FEBRUARY
Consolidated annual financial statements 2021 STEFANUTTI STOCKS GROUP 39

12. GOODWILL AND INTANGIBLE ASSETS continued
Revenue forecasts were used as the basis for determining the value assigned to each CGU. The AAARG (B) included in the cash flow projections is an average for the years 2022 to 2025. The values assigned to the key assumptions represent management’s assessment of the CGUs and are based on both external and internal sources as well as past experience.
SENSITIVITY ANALYSIS FOR GOODWILLIf the growth rate and WACC are adjusted to the percentages as indicated, the corresponding effect on the recoverable amount of the CGUs is illustrated in the tables below.
STEFANUTTI STOCKS BUILDINGWACC
GROWTH RATE %11,1%R’000
13,1%R’000
1,0 9 305 (59 711)
3,0 89 206 (8 989)
STEFANUTTI STOCKS COASTALWACC
GROWTH RATE %11,7%R’000
13,7%R’000
1,0 6 064 (35 912)
3,0 52 384 (5 863)
13. DEFERRED TAX
13.1 DEFERRED TAX ASSETS28 February 2021
R’00029 February 2020
R’000
Includes:
Property, plant and equipment (129 613) (231 642)
Intangible assets — (375)
Provisions 183 661 284 776
Leases 15 315 84 169
Retentions 7 793 19 416
Expected credit loss (ECL) 48 264 45 126
Future allowances (102 418) (102 291)
Excess billings over work done 180 988 154 183
Work-in-progress (51 140) (61 189)
Prepaid expenses (1 230) (1 674)
Calculated losses 80 252 76 277
231 872 266 776
Carrying value at the beginning of the year 266 776 211 871
Temporary differences — continuing operations (27 937) 35 750
Temporary differences — discontinued operations (176) 2 210
Arising due to business combinations (note 28) (169) 18 182
Realisation of revaluation reserve (note 9) 7 908 —
Transfer to non-current assets held for sale (note 7) (11 603) —
Foreign exchange (2 927) (1 237)
Carrying value at year-end 231 872 266 776
Deferred tax assets have not been raised on tax losses amounting to R492 million (2020: R899 million).
NOTES TO THE ANNUAL FINANCIAL STATEMENTS continued
FOR THE YEAR ENDED 28 FEBRUARY
STEFANUTTI STOCKS GROUP Consolidated annual financial statements 202140

13. DEFERRED TAX CONTINUED
Tax losses for which no deferred tax asset has been raised can be summarised as follows:
Country Tax rate %28 February 2021
R’00029 February 2020
R’000 Expiry date
Eswatini 27,5 80 57 None
Nigeria 32 — 28 612 None
Kenya 30 8 000 10 880 Utilise within 10 years
Lesotho 25 556 438 None
Zambia 35 — 131 122 Utilise within 5 years
Namibia 32 492 1 180 None
Mauritius 15 3 373 11 068 Utilise within 5 years
South Africa 28 479 162 715 827 None
RECOVERABILITY OF DEFERRED TAX ASSETS
Management assesses the extent to which it is probable that taxable profit will be available against which deductible temporary differences can be utilised. All companies with deferred tax asset balances are currently trading and are expected to recover the deferred tax assets as follows:
› ongoing trading and expectation of creating profits;
› the sale of non-core assets;
› the sale of underutilised plant and equipment;
› the sale of certain divisions/subsidiaries.
The group considered the following criteria in assessing the probability that taxable profit will be available against which the unused tax losses can be utilised:
› Whether the entity has sufficient taxable temporary differences relating to the same taxation authority and the same taxable entity, which will result in taxable amounts against which the unused tax losses can be utilised;
› Whether it is probable that the entity will have taxable profits before the unused tax losses expire when operating in foreign jurisdictions (Kenya, Zambia, Mauritius); and
› Whether the unused tax losses result from identifiable causes which are unlikely to recur.
To the extent that it is not probable that taxable profit will be available against which the unused tax losses or unused tax credits can be utilised, the deferred tax asset is not recognised. To determine the probability that taxable profit will be available against which the unused tax losses can be utilised, the group has reviewed its budgets of taxable profits for the foreseeable future and compared that to its total tax losses, in conjunction with the restructuring plan. Refer to note 2.
The effects of the tax rate change in South Africa from 28% to 27%, effective for tax year ended 28 February 2024, has been considered and at this stage has not been deemed material.
13.2 DEFERRED TAX LIABILITIES28 February 2021
R’00029 February 2020
R’000
Carrying value at the beginning of the year — 534
Temporary differences — (534)
— —
14. INVENTORIES28 February 2021
R’00029 February 2020
R’000
Consumables 5 330 25 135
Operational inventory 35 766 44 262
Development property 18 498 122 652
59 594 192 049
Inventories expensed 42 015 50 553
Inventories written off 2 212 1 658
Reversal of inventories previously written off — 400
NOTES TO THE ANNUAL FINANCIAL STATEMENTS continued
FOR THE YEAR ENDED 28 FEBRUARY
Consolidated annual financial statements 2021 STEFANUTTI STOCKS GROUP 41

14. INVENTORIES CONTINUED
The development property relates to various properties in South Africa which are held while the development units are in the process of being built and will be realised when the properties are sold. None of the development property is pledged as security (2020: R26 million) as the related loan was settled during the current year.
Inventories are written down to their net realisable value based on expected wear and tear and factors that indicate that the costs exceeds the amount that could be recovered through use or sale. These write downs are recognised in cost of sales.
15. CONTRACT BALANCES
15.1 CONTRACTS IN PROGRESS Contract in progress relate to the group’s rights to consideration for work completed but not invoiced at the reporting date for construction services rendered.
28 February 2021R’000
29 February 2020R’000
Gross carrying value at beginning of the year 640 490 506 568
Revenue recognised from performance obligations satisfied in previous periods (447 821) (380 501)
Realisation of work in progress as contract cost (106 090) (106 133)
Contracts in progress recognised 542 030 617 620
Additions due to business combinations (note 28) 317 3 485
Foreign exchange (7 199) (549)
Transfer to disposal groups (note 7) (5 575) —
Disposal of subsidiary (note 23) (4 813) —
611 339 640 490
Expected credit loss (581) (945)
Carrying value at year-end 610 758 639 545
Current 610 758 639 545
SIMPLIFIED APPROACH — EXPECTED CREDIT LOSS (NOTE 27)
Opening balance (945) —
Changes due to credit risk movement — (945)
Amounts reversed 364 —
Closing balance (581) (945)
15.2 EXCESS BILLINGS OVER WORK DONE28 February 2021
R’00029 February 2020
R’000
Carrying value at beginning of the year 1 348 556 1 170 970
Revenue recognised which was included in the opening balance (472 646) (644 114)
Excess billings over work done recognised 514 347 742 654
Additions due to business combinations (note 28) 634 68 658
Foreign exchange (56 948) 10 388
Transfer to disposal groups (note 7) (53 409) —
Disposal of subsidiary (note 23) (28 257) —
Carrying value at year-end 1 252 277 1 348 556
Non-current 46 506 294 823
Current 1 205 771 1 053 733
NOTES TO THE ANNUAL FINANCIAL STATEMENTS continued
FOR THE YEAR ENDED 28 FEBRUARY
STEFANUTTI STOCKS GROUP Consolidated annual financial statements 202142

16. TRADE AND OTHER RECEIVABLES28 February 2021 29 February 2020
Gross R’000
ECL R’000
Net R’000
Gross R’000
ECL R’000
Net R’000
Contract receivables 1 430 543 (324 452) 1 106 091 2 156 589 (400 094) 1 756 495
Retention debtors 141 196 (151) 141 045 153 841 (137) 153 704
Other receivables 54 175 (2 044) 52 131 41 627 (30) 41 597
Amounts due by joint operations 186 366 (699) 185 667 242 695 (529) 242 166
Prepayments * 86 371 — 86 371 48 562 — 48 562
Value added tax * 43 539 — 43 539 112 036 — 112 036
1 942 190 (327 346) 1 614 844 2 755 350 (400 790) 2 354 560
* Non-financial assets.
Further information regarding business combinations can be found in note 28 and information about the credit exposure of trade receivables are disclosed in note 27.
Below table is a reconciliation of the expected credit losses:
Simplified approach28 February 2021
R’00029 February 2020
R’000
Opening balance (400 790) (66 699)
Changes due to credit risk movement — continuing operations (81 899) (350 651)
Changes due to credit risk movement — discontinued operations (note 7.1) 3 006 —
Amounts written off 18 366 —
Amounts recovered 16 986 5 908
Foreign currency translation 35 213 10 652
Disposal groups (note 7) 1 451 —
Disposal of subsidiary (note 23) 80 321 —
Carrying value at year-end (327 346) (400 790)
Individual expected credit loss (305 291) (376 974)
Collective expected credit loss (22 055) (23 816)
NOTES TO THE ANNUAL FINANCIAL STATEMENTS continued
FOR THE YEAR ENDED 28 FEBRUARY
Consolidated annual financial statements 2021 STEFANUTTI STOCKS GROUP 43

17. BANK BALANCESIncluded in the cash flow statement is cash and cash equivalents comprising:
28 February 2021R’000
29 February 2020R’000
Cash at banks and on hand 773 772 772 889
Less: Bank overdrafts (18 134) (32 376)
755 638 740 513
Bank balances at the end of the year included the following balances that are restricted from immediate use:
RESTRICTED CASH INCLUDED ABOVE
Group’s share of cash held by joint operations 104 341 185 112
Other restrictions (cash held as collateral and security for contract guarantees) 86 592 1 318
190 933 186 430
Cash held in joint operations is restricted as approval for cash movements is required by all joint operation participants.
18. SHARE CAPITAL AND PREMIUM28 February 2021
R’00029 February 2020
R’000
AUTHORISED
400 000 000 ordinary shares of 0,00025 cents each (2020: 400 000 000 ordinary shares of 0,00025 cents each) 1 1
ISSUED
188 080 746 ordinary shares of 0,00025 cents each (2020: 188 080 746 ordinary shares of 0,00025 cents each) * *
* Less than R1 000.
Number of shares
28 February 2021 29 February 2020
Details of treasury shares in issue
Treasury shares held by: 20 837 062 20 837 062
Subsidiary 14 407 132 14 407 132
Share trusts (note 19) 6 429 930 6 429 930
Reconciliation of shares:
Opening balance 20 837 062 20 837 062
Acquisition of treasury shares through subsidiary — —
Closing balance 20 837 062 20 837 062
28 February 2021R’000
29 February 2020R’000
SHARE PREMIUM
Carrying value at the beginning of the year 1 007 718 1 007 718
Effect of treasury shares acquired — —
Carrying value at year-end 1 007 718 1 007 718
NOTES TO THE ANNUAL FINANCIAL STATEMENTS continued
FOR THE YEAR ENDED 28 FEBRUARY
STEFANUTTI STOCKS GROUP Consolidated annual financial statements 202144

19. EMPLOYEE SHARE INCENTIVE SCHEMES
19.1 SHARE-BASED PAYMENTS RESERVE
THE STEFANUTTI & BRESSAN SHARE INCENTIVE TRUST
Options are granted to employees at a price based on the weighted average price at grant date. Vesting periods are as follows:
a) On the second anniversary of the grant date, one third of the options will immediately accrue to the employee;
b) On the third anniversary of the grant date, a further third of the options will immediately accrue; and
c) The final third of the options will immediately accrue on the fourth anniversary of the grant date.
Employees are permitted to exercise options four times per annum, on predetermined dates which do not fall within the company’s closed periods. Unexercised options expire after 10 years from the grant date. In the event of resignation, voluntary termination of employment or dismissal of the option holder, unexercised options will automatically expire and be cancelled. Upon the involuntary termination of employment of the option holder, the option granted and not vested will be deemed to automatically meet all vesting conditions and may be exercised immediately. Upon retirement of an employee who is an option holder, the retiree can retain the options granted. However, the same vesting periods will apply as when the options were granted. These options are equity-settled.
28 February 2021 29 February 2020
NUMBER OF SHARES HELD: 6 429 930 6 429 930
All share options expired on 26 July 2017. No new options were issued or exercised since the share options expired.
19.2 LONG-TERM EMPLOYMENT BENEFITSThe forfeitable share plan (FSP) is operated together with the existing schemes, complementing and enhancing the ability of the group to attract, retain and reward key staff. The FSP will include participation by executive directors and selected employees of the group. Directors participate in the group’s long-term incentive FSP and profit incentive schemes, which are designed to recognise the contribution that senior staff have made to the growth in the value of the group’s equity and to retain key employees. In terms of the FSP, a bonus amount is awarded to the directors in proportion to their contribution to the business, as reflected by a combination of their seniority and the company’s performance, within the limits imposed by the scheme. This bonus is used to buy shares in the open market, the ownership of such shares being restricted for a period of three years. The restriction on the ownership of the shares is lifted after a three-year period in terms of the scheme rules. Shares may not be disposed of or otherwise encumbered during the vesting period of three years. Resignation, voluntary termination of employment or dismissal before the vesting period has expired, will result in the forfeiture of entitlement to the shares. These amounts are included under long-term employee benefits in the executive directors’ annual remuneration.
28 February 2021Number
29 February 2020Number
NUMBER OF SHARES OUTSTANDING AT YEAR-END 2 218 392 2 218 392
CONTRACTUAL LIFE OF EACH AWARD 3 years 3 years
In fulfilment of the FSP obligations, the group purchases shares in the market. No shares have been granted for the past 2 years.
FSP COSTS
An expense of R0,5 million (2020: R1,6 million) which related to the FSP was recognised in the current year (note 4).
NOTES TO THE ANNUAL FINANCIAL STATEMENTS continued
FOR THE YEAR ENDED 28 FEBRUARY
Consolidated annual financial statements 2021 STEFANUTTI STOCKS GROUP 45

20. FINANCIAL LIABILITIES
20.1 NON-CURRENT AND CURRENT FINANCIAL LIABILITIES28 February 2021 29 February 2020
Non-currentR’000
Current R’000
Non-current R’000
Current R’000
Unsecured borrowings 3 909 8 610 26 26 860
Secured borrowings 53 636 1 278 719 131 977 754 148
Bonds and other 4 247 7 477 16 736 30 509
Term loan (note 20.3) — 1 205 390 — 707 156
Term loan 2 (note 20.3) 49 389 65 852 115 241 16 483
Lease liabilities (note 20.2) 55 776 24 788 270 402 213 397
Borrowings 113 321 1 312 117 402 405 994 405
Voluntary Rebuild Programme 69 500 41 250 77 222 26 250
Other financial liabilities 182 821 1 353 367 479 627 1 020 655
The Voluntary Rebuild Programme is contractually repaid annually over a period of 12 years, starting in 2016, with an annual instalment of R15 million, at an implied interest rate of 7,5%.
The funding loan has been converted form a short-term funding agreement into a term loan on 1 July 2020, which loan terminates on 28 February 2022. The loan bears interest at prime plus 5,4%, including arranging and facility fees, and is secured by special and general notarial bonds over movable assets, continuous covering mortgage bonds over immovable assets and various cessions. The group, on 25 May 2021, reached an agreement with the Lenders to extend the current capital repayment profile of the loan. The capital portion of the loan repayments are envisaged to commence in July 2021 with a residual loan balance at 28 February 2022 of approximately R420 million.
Refer to note 27 for further information regarding terms and conditions.
20.2 LEASE LIABILITIESa) Lease liabilities can be categorised as follows:
28 February 2021 29 February 2020
Non-currentR’000
Current R’000
Non-current R’000
Current R’000
Instalment sales agreements 5 067 20 802 42 304 141 036
Other (previously disclosed as operating leases) 50 709 3 986 228 098 72 361
55 776 24 788 270 402 213 397
b) Undiscounted cash flows28 February 2021
R’00029 February 2020
R’000
LESS THAN ONE YEAR 29 776 230 772
Instalment sales 22 092 134 248
Other 7 684 96 524
BETWEEN TWO AND FIVE YEARS 74 304 314 113
Instalment sales 4 573 44 634
Other 69 731 269 479
c) Cash outflow relating to leases were recognised as follows:
OPERATING ACTIVITIES 22 976 38 011
Instalment sales 18 855 27 952
Other 4 121 10 059
FINANCING ACTIVITIES 169 088 300 193
Instalment sales (note 23.5) 140 223 232 936
Other (note 23.5) 28 865 67 257
TOTAL CASH OUTFLOWS 192 064 338 204
NOTES TO THE ANNUAL FINANCIAL STATEMENTS continued
FOR THE YEAR ENDED 28 FEBRUARY
STEFANUTTI STOCKS GROUP Consolidated annual financial statements 202146
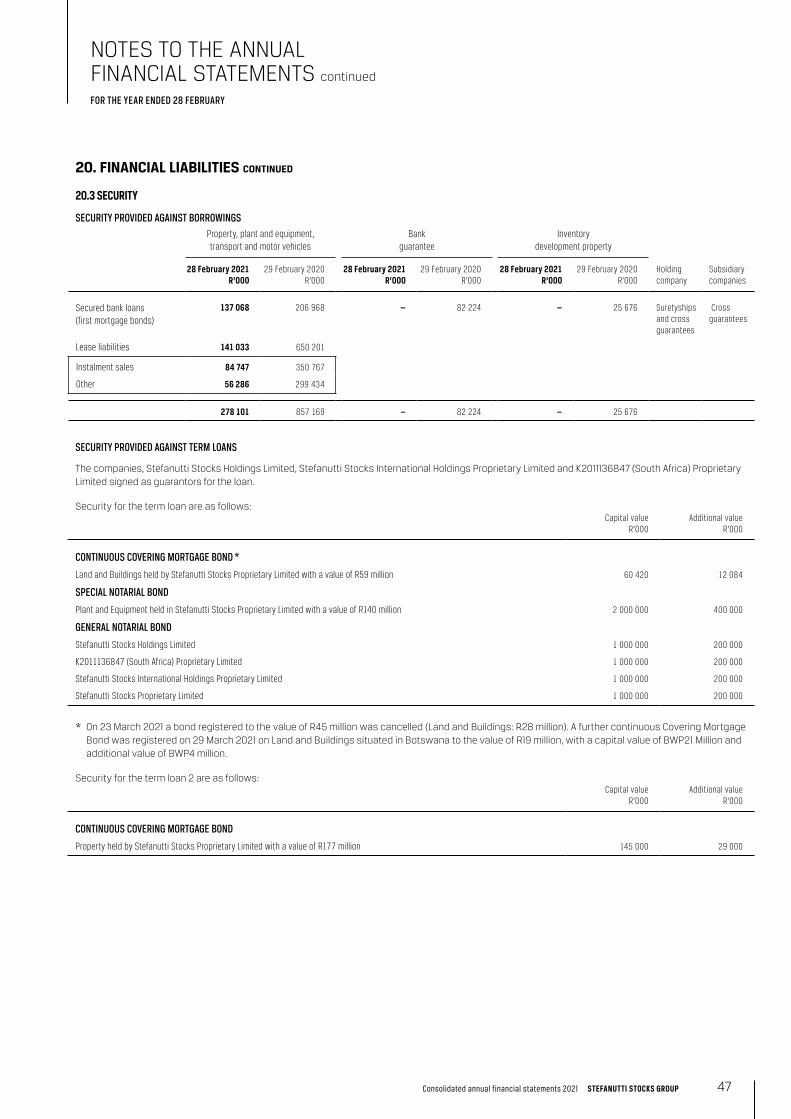
20. FINANCIAL LIABILITIES CONTINUED
20.3 SECURITY
SECURITY PROVIDED AGAINST BORROWINGSProperty, plant and equipment, transport and motor vehicles
Bank guarantee
Inventory development property
28 February 2021R’000
29 February 2020 R’000
28 February 2021R’000
29 February 2020 R’000
28 February 2021R’000
29 February 2020 R’000
Holding company
Subsidiary companies
Secured bank loans (first mortgage bonds)
137 068 206 968 — 82 224 — 25 676 Suretyships and cross guarantees
Cross guarantees
Lease liabilities 141 033 650 201
Instalment sales 84 747 350 767
Other 56 286 299 434
278 101 857 169 — 82 224 — 25 676
SECURITY PROVIDED AGAINST TERM LOANS
The companies, Stefanutti Stocks Holdings Limited, Stefanutti Stocks International Holdings Proprietary Limited and K2011136847 (South Africa) Proprietary Limited signed as guarantors for the loan.
Security for the term loan are as follows:Capital value
R’000Additional value
R’000
CONTINUOUS COVERING MORTGAGE BOND *
Land and Buildings held by Stefanutti Stocks Proprietary Limited with a value of R59 million 60 420 12 084
SPECIAL NOTARIAL BOND
Plant and Equipment held in Stefanutti Stocks Proprietary Limited with a value of R140 million 2 000 000 400 000
GENERAL NOTARIAL BOND
Stefanutti Stocks Holdings Limited 1 000 000 200 000
K2011136847 (South Africa) Proprietary Limited 1 000 000 200 000
Stefanutti Stocks International Holdings Proprietary Limited 1 000 000 200 000
Stefanutti Stocks Proprietary Limited 1 000 000 200 000
* On 23 March 2021 a bond registered to the value of R45 million was cancelled (Land and Buildings: R28 million). A further continuous Covering Mortgage Bond was registered on 29 March 2021 on Land and Buildings situated in Botswana to the value of R19 million, with a capital value of BWP21 Million and additional value of BWP4 million.
Security for the term loan 2 are as follows:Capital value
R’000Additional value
R’000
CONTINUOUS COVERING MORTGAGE BOND
Property held by Stefanutti Stocks Proprietary Limited with a value of R177 million 145 000 29 000
NOTES TO THE ANNUAL FINANCIAL STATEMENTS continued
FOR THE YEAR ENDED 28 FEBRUARY
Consolidated annual financial statements 2021 STEFANUTTI STOCKS GROUP 47

21. TRADE AND OTHER PAYABLES28 February 2021
R’00029 February 2020
R’000
Trade payables 428 743 734 107
Amounts due to joint operations 161 087 73 198
Retention creditors and subcontractors 146 820 213 387
Accrued expenses * 484 226 810 735
Value added tax and withholding taxes * 77 083 133 615
Unclaimed dividends * 24 24
1 297 983 1 965 066
* Non-financial liabilities.
Further information regarding business combinations can be found in note 28.
22. PROVISIONSBalance at the
beginning of the yearR’000
Additional provisions raised
R’000
Additions due tobusiness combinations
(note 28)R’000
Utilised/reversed during the year
R’000
Balance at the end of the year
R’000
NON-CURRENT
Contract-related provisions 121 948 40 376 — (121 948) 40 376
CURRENT
Warranty provisions 26 830 16 759 — (26 830) 16 759
Contract-related provisions 831 293 506 069 686 (831 293) 506 755
Severance provisions 26 980 27 998 — (26 980) 27 998
885 103 550 826 686 (885 103) 551 512
TOTAL PROVISIONS 1 007 051 591 202 686 (1 007 051) 591 888
Warranty provisions relate to obligations to rectify defects on projects already delivered to customers. These defect periods expire within 12 months.
Contract-related provisions represents the estimated amounts relating to incurred obligations to third party suppliers. As previously reported, Eskom has adopted an adverse approach to certification of applications for work done by the Stefanutti Stocks Basil Read JV (“SSBR”), which has required a substantial increase of internal funding for this project. This has increased the initial funding requirement of R400 million to approximately R986 million excluding the initial impact of COVID-19. Consequently, in addition to the provision of R263 million raised at February 2019 for the potential unrecoverable preliminary and general costs, the group raised a further provision in 2020 of R462 million for potential unrecoverable monthly measured works to complete the building works of the project.
Severance provisions relate to obligations arising from the Restructuring Plan which includes internal restructuring initiatives required to restore optimal operational and financial performance and the sale of certain divisions/subsidiaries. These will result in severance of employment for a number of employees within the affected divisions/subsidiaries, for which severance benefits and other associated costs will be paid in line with group policy and employment agreements.
NOTES TO THE ANNUAL FINANCIAL STATEMENTS continued
FOR THE YEAR ENDED 28 FEBRUARY
STEFANUTTI STOCKS GROUP Consolidated annual financial statements 202148

23. NOTES TO THE STATEMENT OF CASH FLOWS
23.1 CASH GENERATED FROM OPERATING ACTIVITIES
28 February 2021R’000
Restated29 February 2020
R’000
Net loss before taxation from continuing operations (218 244) (1 082 478)
Net profit before taxation from discontinued operations (note 7) 24 111 —
Adjusted for:
Net profit on foreign exchange (note 4) (9 169) (15 470)
Profit on disposals of property, plant and equipment (note 4) (24 737) (11 946)
Gain not previously recognised on disposal of non-current assets held for sale (note 4) (8 148) —
Profit on disposal of joint operation (note 23.4) (53 887) —
Investment income (note 5) (28 734) (30 306)
Finance costs (note 5) 134 236 126 067
Depreciation (note 9) 127 951 217 031
Assets scrapped (note 9) 5 463
Share of profit/(loss) of equity-accounted investees (note 10) 1 323 (46 196)
Profit on disposal of subsidiary (note 23.3) (507) —
Amortisation of intangibles (note 12) 2 314 1 892
Impairment of goodwill and intangible assets (note 12) — 52 995
Impairment of equity-accounted investments (note 10) 58 533 —
Impairment of property, plant and equipment (note 9) 15 137 —
Foreign exchange realised on winding up of subsidiary 12 727 —
Movement in provisions (note 22) (401 962) 236 251
Disposal of development units settled against liability — (18 117)
Net expected credit loss for trade and other receivables and work in progress (note 15, 16) 46 183 345 688
Bargain purchase gain (note 28) — (15 169)
Discontinued operations (note 7) 69 223 —
Amortisation of intangible assets (note 12) 339 —
Depreciation (note 9) 4 440 —
Fair value adjustments 5 926 —
Finance costs 2 475 —
Fair value adjustments on re-measurement of disposal group 26 103 —
Loss on disposal of subsidiary (note 23.3) 2 200 —
Foreign exchange realised on disposal of subsidiary 7 499 —
Net loss on foreign exchange 34 154 —
Net expected credit losses (3 006) —
Profit on disposals of property, plant and equipment (1 551) —
Investment income (3 649) —
Share of profits of equity-accounted investees (note 10) (5 707) —
Other non-cash items 36 925 2 445
Short-term insurance and other expenses financed 24 411 21 412
Guarantee and arranging fees 12 514 22 838
Other non-cash transactions — 1 179
Income recognised against loans — (42 984)
(216 720) (236 850)
NOTES TO THE ANNUAL FINANCIAL STATEMENTS continued
FOR THE YEAR ENDED 28 FEBRUARY
Consolidated annual financial statements 2021 STEFANUTTI STOCKS GROUP 49

23. NOTES TO THE STATEMENT OF CASH FLOWS CONTINUED
28 February 2021R’000
Restated29 February 2020
R’000
MOVEMENTS IN WORKING CAPITALChange in inventories 42 120 25 834
Change in contracts in progress 18 136 (130 438)
Change in trade and other receivables 248 907 (284 289)
Change in trade and other payables (308 144) (146 933)
Change in excess billings over work done 57 902 108 928
Effect of foreign exchange rate changes on working capital (51 346) (10 342)
Cash consumed by operations (209 145) (674 090)
23.2 RECONCILIATION OF TAXATION PAID DURING THE YEAR28 February 2021
R’00029 February 2020
R’000
Charge against profit — continuing operations 63 563 31 138
Charge against profit — discontinued operations 2 769 (3 808)
Withholding taxes 1 604 734
Effect of foreign exchange rate changes on taxation (5 923) 3 783
Other non-cash movements (provision for interest and penalties) 9 626 21 430
Disposal of subsidiary (note 23.3) (12 680) —
Transfer to non-current assets held for sale (note 7) 403 —
Movement in taxation balance 10 510 7 032
Payments made 69 872 60 309
23.3 DISPOSAL OF SUBSIDIARIESStefanutti StocksNigeria (Pty) Ltd
R’000Pacific Eagle (Pty) Ltd
R’000Total
R’000
Property, plant and equipment (note 9) 11 742 — 11 742
Inventories — 3 883 3 883
Contracts in progress (note 15) 4 813 — 4 813
Trade and other receivables 53 618 — 53 618
Bank balances 2 988 10 2 998
TOTAL ASSETS 73 161 3 893 77 054
Financial liabilities 26 — 26
Trade and other payables 29 998 — 29 998
Excess billings over work done (note 15) 28 257 — 28 257
Taxation (note 23.2) 12 680 — 12 680
TOTAL LIABILITIES 70 961 — 70 961
Net asset value 2 200 3 893 6 093
Disposal value — 4 400 4 400
(Loss)/profit on disposal of subsidiary (2 200) 507 (1 693)
Net cash outflow (2 988) (10) (2 998)
Stefanutti Stocks Nigeria (Pty) Ltd was disposed to a related party — a previous employee of the group.
NOTES TO THE ANNUAL FINANCIAL STATEMENTS continued
FOR THE YEAR ENDED 28 FEBRUARY
STEFANUTTI STOCKS GROUP Consolidated annual financial statements 202150
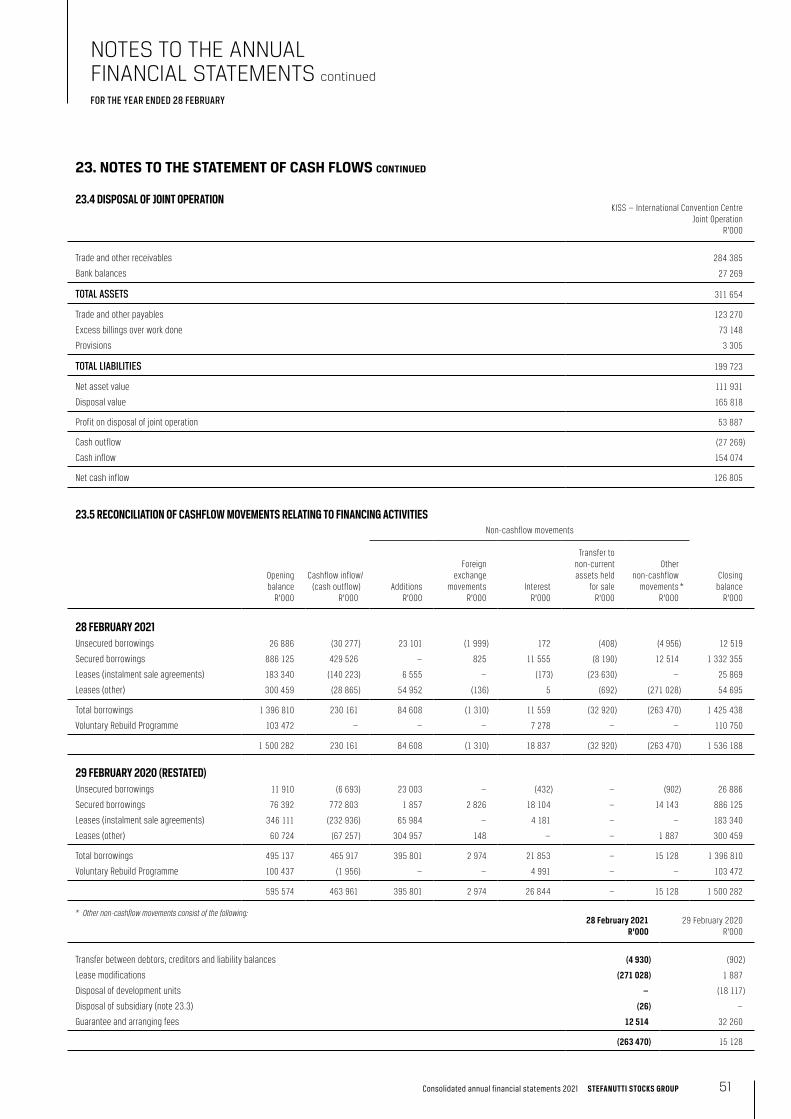
23. NOTES TO THE STATEMENT OF CASH FLOWS CONTINUED
23.4 DISPOSAL OF JOINT OPERATIONKISS — International Convention Centre
Joint OperationR’000
Trade and other receivables 284 385
Bank balances 27 269
TOTAL ASSETS 311 654
Trade and other payables 123 270
Excess billings over work done 73 148
Provisions 3 305
TOTAL LIABILITIES 199 723
Net asset value 111 931
Disposal value 165 818
Profit on disposal of joint operation 53 887
Cash outflow (27 269)
Cash inflow 154 074
Net cash inflow 126 805
23.5 RECONCILIATION OF CASHFLOW MOVEMENTS RELATING TO FINANCING ACTIVITIESNon-cashflow movements
Openingbalance
R’000
Cashflow inflow/(cash outflow)
R’000 Additions
R’000
Foreignexchange
movements R’000
Interest R’000
Transfer tonon-currentassets held
for saleR’000
Other non-cashflow
movements *R’000
Closingbalance
R’000
28 FEBRUARY 2021Unsecured borrowings 26 886 (30 277) 23 101 (1 999) 172 (408) (4 956) 12 519
Secured borrowings 886 125 429 526 — 825 11 555 (8 190) 12 514 1 332 355
Leases (instalment sale agreements) 183 340 (140 223) 6 555 — (173) (23 630) — 25 869
Leases (other) 300 459 (28 865) 54 952 (136) 5 (692) (271 028) 54 695
Total borrowings 1 396 810 230 161 84 608 (1 310) 11 559 (32 920) (263 470) 1 425 438
Voluntary Rebuild Programme 103 472 — — — 7 278 — — 110 750
1 500 282 230 161 84 608 (1 310) 18 837 (32 920) (263 470) 1 536 188
29 FEBRUARY 2020 (RESTATED)Unsecured borrowings 11 910 (6 693) 23 003 — (432) — (902) 26 886
Secured borrowings 76 392 772 803 1 857 2 826 18 104 — 14 143 886 125
Leases (instalment sale agreements) 346 111 (232 936) 65 984 — 4 181 — — 183 340
Leases (other) 60 724 (67 257) 304 957 148 — — 1 887 300 459
Total borrowings 495 137 465 917 395 801 2 974 21 853 — 15 128 1 396 810
Voluntary Rebuild Programme 100 437 (1 956) — — 4 991 — — 103 472
595 574 463 961 395 801 2 974 26 844 — 15 128 1 500 282
* Other non-cashflow movements consist of the following:28 February 2021
R’00029 February 2020
R’000
Transfer between debtors, creditors and liability balances (4 930) (902)
Lease modifications (271 028) 1 887
Disposal of development units — (18 117)
Disposal of subsidiary (note 23.3) (26) —
Guarantee and arranging fees 12 514 32 260
(263 470) 15 128
NOTES TO THE ANNUAL FINANCIAL STATEMENTS continued
FOR THE YEAR ENDED 28 FEBRUARY
Consolidated annual financial statements 2021 STEFANUTTI STOCKS GROUP 51

23. NOTES TO THE STATEMENT OF CASH FLOWS CONTINUED
23.6 RESTATEMENT OF PRIOR YEAR STATEMENT OF CASH FLOWSThe cashflow statement for the prior year has been restated to reflect cash payments for the principal portion of the lease liability within financing activities and the cash payments for the interest portion of the lease liability as part of operating activities as required by IFRS 16: paragraph 50. The table below reflects the effect of the reclassification for the year ended 29 February 2020 as well as the comparative period as IFRS 16 was early adopted effective 1 March 2018. Below is an extract of the lines affected by the reclassification:
Restated29 February 2020
R’000
Previously reported29 February 2020
R’000Change
R’000
Restated 28 February 2019
R’000
Previously reported28 February 2019
R’000Change
R’000
Lease payments — (77 316) 77 316 — (50 031) 50 031
CASH CONSUMED BY OPERATIONS (674 090) (751 406) 77 316 410 584 360 553 50 031
Finance costs (76 011) (65 952) (10 059) (100 755) (92 820) (7 935)
CASH FLOWS FROM OPERATING ACTIVITIES (750 718) (817 975) 67 257 295 918 253 822 42 096
CASH FLOWS FROM FINANCING ACTIVITIES 463 961 531 218 (67 257) (302 418) (260 322) (42 096)
24. SEGMENT INFORMATIONSegment reporting is done in a manner consistent with the internal reporting provided to the chief operating decision maker being the Executive Committee, with reportable operating segments being reported at business unit level. Individual members of the executive management team are responsible for the operating segments of these businesses noted below.
Below are the types of activities in which each business unit (operating segment) derives revenue:
BUSINESS UNIT DESCRIPTION OF SEGMENT
Construction & Mining Construction of roads, terraces for new developments, municipal services, mining infrastructure and rehabilitation, fibre optic cable trenching, bulk pipelines, mine residue disposal facilities, civil engineering, structural concrete, geotechnical and marine capabilities, which include general and specialised concrete construction for infrastructure, mining and industrial markets.
Building Full scope of building construction from commercial and industrial through to residential and leisure. This includes select residential developments for major mining and industrial clients as well as low-cost and affordable housing for the public sector.
Mechanical & Electrical Includes mechanical and electrical installation and construction.
Other Other segments comprise segments which do not represent more than 10% of combined revenue or combined reported profit/(loss) or combined assets of all operating segments. It also includes those operations that are primarily centralised in nature, i.e. it primarily applies to the group’s headquarters and are not allocated to any one particular segment.
Segments are managed at business unit level and can be further broken down into divisions. Divisions which are similar in nature and function are aggregated and managed by the same managing director to form business units.
Intersegment contract revenues are eliminated on consolidation. The performance of operating segments is assessed by management based on operating profit. Goodwill to the value of R346 million (Feb 2020: R405million) is included within reportable segment assets for other segments.
Construction& Mining
R’000Building
R’000
Mechanical& Electrical
R’000
Other segmentsand eliminations
R’000Total
R’000
28 FEBRUARY 2021Contract revenue 3 664 938 1 105 862 269 786 — 5 040 586
Intersegment contract revenue 37 440 6 213 18 242 — 61 895
Depreciation and amortisation (86 353) (9 038) (8 343) (26 531) (130 265)
Impairment of assets (4 048) (1 874) (7 594) (1 621) (15 137)
Net expected credit loss on financial assets (16 547) (28 633) (1 035) 32 (46 183)
Reportable segment operating profit/(loss) 70 705 (30 534) (64 168) (87 422) (111 419)
Investment income 23 043 1 448 505 3 738 28 734
Finance cost (28 420) (2 762) (861) (102 193) (134 236)
Share of (losses)/profits of equity-accounted investees — (10 793) 9 382 88 (1 323)
Taxation 21 199 (88 128) (24 938) (1 237) (93 104)
Reportable segment profit/(loss) 85 453 (130 769) (79 004) (187 028) (311 348)
Reportable segment assets 3 042 942 1 572 335 351 807 445 773 5 412 857
Equity-accounted investees — 21 475 — 4 228 25 703
Reportable segment liabilities 2 343 592 1 088 755 84 575 1 543 367 5 060 289
NOTES TO THE ANNUAL FINANCIAL STATEMENTS continued
FOR THE YEAR ENDED 28 FEBRUARY
STEFANUTTI STOCKS GROUP Consolidated annual financial statements 202152

24. SEGMENT INFORMATION CONTINUED
Construction& Mining
R’000Building
R’000
Mechanical& Electrical
R’000
Other segmentsand eliminations
R’000Total
R’000
29 FEBRUARY 2020 (RESTATED)Contract revenue 4 679 460 1 650 385 897 191 — 7 227 036
Intersegment contract revenue 66 475 35 637 44 635 — 146 747
Depreciation and amortisation (174 552) (12 350) (13 951) (600) (201 453)
Impairment of goodwill — — — (52 995) (52 995)
Net expected credit loss on financial assets (259 998) (586) (354) (24) (260 962)
Reportable segment operating profit/(loss) (382 499) (514 313) (25 062) (100 394) (1 022 268)
Investment income 19 941 3 947 2 061 1 878 27 827
Finance cost (58 155) (16 281) (2 104) (38 413) (114 953)
Share of (losses)/profits of equity-accounted investees — (1 783) (1 290) 902 (2 171)
Taxation (7 958) 32 287 (16 622) (3 295) 4 412
Reportable segment profit/(loss) (428 671) (496 144) (43 016) (139 322) (1 107 153)
Reportable segment assets 4 045 827 1 586 122 477 766 535 333 6 645 048
Equity-accounted investees — 314 026 22 408 5 927 342 361
Reportable segment liabilities 3 333 139 1 286 916 171 147 1 142 180 5 933 382
GEOGRAPHICAL AREASThe group operates mainly in the geographical areas of South Africa (local), Africa and the United Arab Emirates (foreign).
28 February 2021 Restated 29 February 2020
Local Foreign Local Foreign
Africa Africa UAE
R’000Eswatini
R’000Botswana
R’000Zambia
R’000Other *R’000 R’000
EswatiniR’000
BotswanaR’000
OtherR’000 R’000
Contract revenues from external customers 3 525 650 658 364 542 364 233 063 81 145 6 102 372 663 993 248 018 212 653 —
Non-current assets (excluding deferred tax) 831 897 71 130 24 105 2 505 50 141 1 677 079 58 367 38 308 292 350 273 505
* Included in other is mainly Tanzania and Namibia.
MAJOR CUSTOMERSRevenue generated from a single customer of the group amounted to approximately R291 million (2020: R691 million), of which the largest portion of this revenue was earned in Construction & Mining (Feb 2020 restated: Construction and Mining). The group is not reliant on any one major customer as its services span a varied number of industries and countries.
NOTES TO THE ANNUAL FINANCIAL STATEMENTS continued
FOR THE YEAR ENDED 28 FEBRUARY
Consolidated annual financial statements 2021 STEFANUTTI STOCKS GROUP 53

25. RELATED PARTIESStefanutti Stocks Holdings Limited is the holding company for the group.
Related parties are those who control or have a significant influence over the group and parties who are controlled or significantly influenced by the group (including subsidiaries, joint arrangements and associates). All related party transactions take place on terms equivalent to those that prevail on an arm’s length basis.
NATURE OF RELATIONSHIPS
SUBSIDIARIESEQUITY-ACCOUNTED INVESTEES (NOTE 10) JOINT OPERATIONS (NOTE 11) OTHER
Stefanutti Stocks Proprietary Limited
Trading company for operations based in South Africa, as well as some foreign operations
Stefanutti Stocks International Holdings Proprietary Limited
Holding company for subsidiaries based in foreign countries
Stefanutti Stocks Investments Proprietary Limited
Treasury company for the group
Joint Venture
Al Tayer Stocks LLC, an interior fit-out company based in the United Arab Emirates
This investment forms part of discontinued operations as at year-end.
Associates
Various individually immaterial associates
Various joint operations Consolidated Structured Entities
Stefanutti & Bressan Share Trust
Stefanutti Stocks Employee Participation Plan Trust
OUTSTANDING BALANCES
Note 10 Note 16
2021: R19 million receivable 2021: R186 million receivable
2020: R71 million receivable 2020: R242 million receivable
Note 21
2021: R161 million payable
2020: R73 million payable
PROVISION OF GUARANTEES (NOTE 26)
A full list of subsidiaries and joint arrangements is available on request.
During the year the group disposed of a subsidiary, Stefanutti Stocks Nigeria Proprietary Limited to a previous employee of the group. Refer to note 23.3.
NON-EXECUTIVE DIRECTORSNon-executive director remuneration is compared to the company’s peer group. Recommendations are made by the CFO and Human Resources Executive, to the Remuneration and Nominations Committee (REMCO), for onward review by the board and submission to shareholders. Non-executive directors are compensated based on attendance fees. The fees are based on the size and complexity of the group and also take into account market practices and fee surveys provided to the committee. No distinction is made between fees payable to independent non-executive directors and other non-executive directors, although the fees of the Chairman take her expanded role into account.
The total fees paid to non-executive directors are not limited to a maximum annual amount, irrespective of the number of meetings attended. Directors qualify for reimbursement of expenses incurred in performing their duties for and on behalf of the company.
Non-executive directors do not have service contracts. Instead, letters of appointment confirm their terms of engagement, and include matters such as fees, term of office, expected time commitment, share dealing and board performance assessments. The Chairman has a letter of appointment, which is specific to her role and function. This letter of appointment is in line with normal business terms.
The fees paid to non-executive directors, as well as the proposed fees for the next financial year, were approved by the REMCO, the board of directors and shareholders at the last annual general meeting.
There is no requirement for non-executive directors to be shareholders of the company and they do not qualify to participate in any incentive scheme that is operated by the group.
The company’s directors are appointed for a term of three years and are obliged to retire at the end of that period, but may offer themselves for re-election at the annual general meeting. A third retire by rotation annually.
NOTES TO THE ANNUAL FINANCIAL STATEMENTS continued
FOR THE YEAR ENDED 28 FEBRUARY
STEFANUTTI STOCKS GROUP Consolidated annual financial statements 202154

25. RELATED PARTIES continued
Short-term benefits
Attendancefees
R’000Annual fees
R’000
Total 2021
R’000
28 FEBRUARY 2021NON-EXECUTIVE DIRECTORS
ZJ Matlala — 880 880
JM Poluta (alternate to B Silwanyana) 441 — 441
DG Quinn 648 — 648
HJ Craig 488 — 488
B Silwanyana 472 — 472
B Harie 448 — 448
29 FEBRUARY 2020NON-EXECUTIVE DIRECTORS
KR Eborall (retired on 12 August 2019) — 431 431
ZJ Matlala (Chairman — appointed on 12 August 2019) 439 529 968
JM Poluta (alternate to B Silwanyana) 439 — 439
DG Quinn 549 — 549
HJ Craig 387 — 387
B Silwanyana 623 — 623
B Harie 556 — 556
Details of remuneration for executive directors, prescribed officers and key management personnel are as follows:
Basic salary R’000
Other benefits
(travelallowances)
R’000
Retentionbonus R’000
Short-termincentives
— relating toFeb 2020
R’000
Short-termincentives
— relating toFeb 2019
R’000
Terminationbenefits
R’000
Post-employment
benefits R’000
Total R’000
28 FEBRUARY 2021EXECUTIVE DIRECTORS
RW Crawford 3 582 232 2 150 — — — 309 6 273
AV Cocciante (resigned 31 May 2021) 3 182 32 1 837 — 140 — 264 5 455
PRESCRIBED OFFICERS *
S White 2 650 159 — 1 750 — — 230 4 789
HF Schwegmann 2 919 222 — 1 000 — — 256 4 397
DR Du Plessis 2 991 190 — 1 970 — — 258 5 409
VE Olley 2 050 48 — — — 792 145 3 035
EXECUTIVE KEY MANAGEMENT PERSONNEL 22 367 1 322 3 987 5 390 140 792 1 814 35 812
* Prescribed officers consist of executive officers and certain Executive Committee members who are not executive directors of the group.
NOTES TO THE ANNUAL FINANCIAL STATEMENTS continued
FOR THE YEAR ENDED 28 FEBRUARY
Consolidated annual financial statements 2021 STEFANUTTI STOCKS GROUP 55

25. RELATED PARTIES continued
Basic salary R’000
Other benefits
(travelallowances)
R’000
Short-term incentives
— relating to prior year
R’000
Short-term incentives
— relating to current year
R’000
Post-employment
benefits R’000
Total R’000
29 FEBRUARY 2020EXECUTIVE DIRECTORS
RW Crawford — CEO (appointed 12 August 2019) 2 086 130 — — 198 2 414
W Meyburgh — CEO (retired 12 August 2019) 2 679 333 — — 189 3 201
AV Cocciante — CFO 3 366 50 — — 309 3 725
PRESCRIBED OFFICERS *
RW Crawford (appointed as CEO on 12 August 2019) 1 712 98 1 695 — 163 3 668
V Olley 3 206 94 450 — 298 4 048
HF Schwegmann 3 098 231 910 — 300 4 539
DR du Plessis 3 172 216 1 772 — 302 5 462
EXECUTIVE KEY MANAGEMENT PERSONNEL # 24 361 1 462 5 496 — 2 154 33 473
* Prescribed officers consist of executive officers and certain Executive Committee members who are not executive directors of the group.# Key management personnel are defined as executive directors of the company and other members of the Executive Committee.
Short-term incentives are aligned with the group strategy, using both financial performance measures and personal objectives. Minimum targets are required to be met before respective bonus awards are earned. No long-term employee benefits have been awarded as the group has implemented a new scheme, which measures performance over a three-year period. Please refer to the remuneration report included within the integrated report of Stefanutti Stocks Holdings Limited for more detail.
DIRECTORS’ SERVICE CONTRACTSAll employment contracts of executive directors and senior management are in terms of the group’s standard employment terms and conditions.
The contracts of employment of executive directors or senior executives do not preclude the company from exercising its normal rights to terminate the contract in the event of misconduct or poor performance. Executive directors retire from their positions and from the board at their normal retirement date.
For further detail of executive directors and senior management remuneration practices refer to the remuneration report included in the integrated report.
DIRECTORS’ AND PRESCRIBED OFFICERS’ SHAREHOLDING28 February 2021 29 February 2020
Direct beneficial
%
Indirect beneficial
%Total
%Share-
holding
Direct beneficial
%
Indirect beneficial
%Total
%Share-
holding
PERCENTAGE OF FULLY-PAID SHARES HELD
DIRECTORS
DG Quinn — 0,37 0,37 700 000 — 0,37 0,37 700 000
JM Poluta — 0,08 0,08 150 612 — 0,08 0,08 150 612
RW Crawford (CEO) — — — 7 693 — — — 7 693
AV Cocciante (CFO) (resigned 31 May 2021) 0,34 0,15 0,49 925 001 0,34 0,15 0,49 925 001
PRESCRIBED OFFICERS
DR Du Plessis 0,01 — 0,01 14 864 0,01 — 0,01 14 864
HF Schwegmann 0,04 4,47 4,51 8 488 284 0,04 4,47 4,51 8 488 284
POST YEAR-END SHARE TRANSACTIONSThere were no transactions between the year-end date and the approval date of these annual financial statements.
NOTES TO THE ANNUAL FINANCIAL STATEMENTS continued
FOR THE YEAR ENDED 28 FEBRUARY
STEFANUTTI STOCKS GROUP Consolidated annual financial statements 202156

26. GUARANTEES AND CONTINGENT LIABILITIES28 February 2021
R’00029 February 2020
R’000
GUARANTEES
Total insurance policies ceded to third parties on behalf of the group to guarantee the full and due performance of works as set out in the contract or other related matters 4 037 192 3 702 920
Guarantees through certain banks for facilities to the value of R2,34 billion (Feb 2020: R1,8 billion) and other obligations 2 725 390 2 227 176
SURETYSHIPS
Suretyships through certain banks for facilities to the value of R 406 million (Feb 2020: R704 million) 553 450 1 582 055
Certain of the guarantees and suretyships are supported by cross suretyships from subsidiaries.
CONTINGENT LIABILITIESWith respect to the civil claim received from the City of Cape Town (Green Point Stadium), a trial date had been set for the first quarter of 2020, however, this has been postponed at the client’s request. The matter will now be dealt with in an arbitration of which the date has been set for September 2021. The group remains confident it can defend this claim and therefore no provision has been made.
With respect to the two contract mining project terminations, the arbitration matters remain ongoing. The group is confident that the terminations were lawful and therefore no provision has been made. Both arbitrations are expected to be completed by February 2022.
The arbitration matter relating to the cancellation of a petrochemical contract also had to be postponed due to a fundamental change in the client’s defence. A date for the arbitration is yet to be set. At this stage the financial impact thereof cannot be quantified.
During the reporting period, Stefanutti Stocks also terminated a mechanical project. The client is disputing the termination, which has been referred to arbitration. The arbitration process is expected to be completed by February 2022. The group is confident that the termination was lawful and therefore no provision has been made against this.
Group entities operating in foreign jurisdictions are continuously subjected to tax audits by local revenue authorities as part of their enforcement processes. The Kenyan Revenue Authority performed an audit on Stefanutti Stocks Kenya Limited for the years 2013 to 2018 and assessments have been issued. The process of disputing the assessments are ongoing and have not been finalised.
ESKOM — KUSILE POWER PROJECTAs reported in the February 2020 financial year, Eskom has adopted an adverse approach to certification of applications for work done by the Stefanutti Stocks Basil Read JV (“SSBR”), which has required a substantial increase of internal funding for this project. This has increased the initial funding requirement of R400 million to approximately R986 million excluding the initial impact of COVID-19. Consequently, in addition to the provision of R263 million raised at February 2019 for the potential unrecoverable preliminary and general costs, the group raised a further provision of R462 million in February 2020 for potential unrecoverable monthly measured works to complete the building works of the project.
As stated in the SENS announcement dated 8 July 2020, Stefanutti Stocks notes the release of the Eskom briefing document dated 10 June 2020 reflecting the “Kusile Contract Investigations Status” (“briefing document”) where it is stated, amongst other things, that Stefanutti Stocks has been overpaid by Eskom in relation to certain projects. Stefanutti Stocks has considered the briefing document and notes, for the benefit of shareholders in particular, that the investigations being carried out by and on behalf of Eskom are not complete. That said, Stefanutti Stocks disputes that it, or the joint operations in which it participates, have been overpaid.
As previously highlighted to shareholders in various announcements and updates since late 2018, the group is pursuing a number of contractual claims and compensation events on the Kusile power project, and due to the complexity of the claims, the processes remain ongoing. No further details of the claims have been disclosed on the basis that it may prejudice the group’s position in defending the claims brought against it and in pursuing those claims brought against Eskom by the group.
The group advises shareholders as follows in relation to the matters raised with respect to Stefanutti Stocks in the briefing document:
› During the period between 2015 to 2018, payments made by Eskom to SSBR on package 16 were all made consequent to certificates issued by the independent engineer. During that period, representatives of the engineer and Eskom carried out audits of SSBR records and the payment certificates were issued after they had satisfied themselves that the costs claimed were actually and validly incurred in the construction at Kusile.
› Stefanutti Stocks contends that SSBR is owed additional amounts in respect of work done since December 2018 and in respect of which payments have been withheld. SSBR and Eskom have both committed to a claims resolution process which involves the appointment of independent experts to evaluate the causes of delay and the quantum thereof. This process remains ongoing.
› In relation to Package 28, during February 2019, Eskom terminated the contract with Stefanutti Stocks Izazi JV (“SSI”) due to its inability to provide access to SSI to be able to complete the relevant works. Based on the works completed, as well as Eskom’s inability to provide access, Stefanutti Stocks contends that there are significant amounts due to it. SSI commenced an adjudication process to recover these material amounts in 2018.
› During August 2019 and April 2020, the engineer appointed by the client issued two negative final payment certificates, alleging overpayments had been made to the JV. This prompted the notification of many new disputes which were included in the adjudication process. Adjudication hearings were conducted during November 2020 and February 2021. It is highly probable that these disputes will be referred to arbitration. As several disputes relate to measurement of the works, all parties involved embarked on an independent expert process to resolve these disputes. The parties are still on track to substantially resolve the disputes by February 2022.
NOTES TO THE ANNUAL FINANCIAL STATEMENTS continued
FOR THE YEAR ENDED 28 FEBRUARY
Consolidated annual financial statements 2021 STEFANUTTI STOCKS GROUP 57

27. RISK MANAGEMENT, ACCOUNTING CLASSIFICATIONS AND FAIR VALUE
FAIR VALUE
MEASUREMENT OF FAIR VALUE — LAND AND BUILDINGS
The fair value measurement for land and buildings has been categorised as a Level 3 fair value based on the inputs to the valuation technique used.
VALUATION TECHNIQUE AND SIGNIFICANT UNOBSERVABLE INPUTSLand and Buildings are either measured using the Income Capitalisation Method or the Direct Comparable Sales Method.
Valuation technique Significant unobservable inputs Interrelationship between key unobservable inputs and fair value measurement
Income Capitalisation Method Land and Buildings — South Africa
Market capitalisation rate between 10,0% and 11,0% Income/Expenditure ratio between 21,38% and 30,7%
Land and Buildings — Mozambique
Market capitalisation rate between 5,0% and 11,5% Income/Expenditure ratio between 14,60% and 21,88%
Market capitalisation rate:
› Increase with 1% resulting in decrease in value of R20 million;
› Decrease with 1% resulting in increase in value of R17 million
Income/Expenditure ratio:
› Increase with 1% resulting in decrease in value of R5 million;
› Decrease with 1% resulting in increase in value of R0,05 million
Market capitalisation rate and Income/Expenditure ratio:
› Both increase with 1% resulting in decrease in value of R22 million;
› Both decrease with 1% resulting in increase in value of R23 million
› Income/Expenditure ratio increase with 1% and market capitalisation rate decrease with 1% resulting in increase of value of R17 million
› Income/Expenditure ratio decrease with 1% and market capitalisation rate increase with 1% resulting in decrease of value of R18 million
Above table has been adjusted from prior year to reflect the valuation effect of current Land and Buildings owned by the group.
MEASUREMENT OF FAIR VALUE — NON-CURRENT ASSETS HELD FOR SALE AND DISCONTINUED OPERATIONS
Non-current assets held for sale
Non-current assets held for sale consist of land and buildings, plant and equipment and transport and motor vehicles.
Land and buildings have been categorised as a Level 3 fair value based on the significant unobservable inputs to the valuation technique used. Land and Buildings are either measured using the Income Capitalisation Method or the Direct Comparable Sales Method. These entail the use of a range of market capitalisation rates and income/expenditure ratios.
Plant and equipment and transport and motor vehicles have been categorised as a Level 3 fair value based on significant observable inputs to the valuation technique used. These assets are measured using the comparable sales method. This entails the use of quoted prices for identical or similar assets in the market.
Refer to note 7.2
Discontinued operations
The fair value measurement for discontinued operations has been categorised as a Level 3 fair value based on the significant unobservable inputs to the valuation technique used. This valuation involves the use of a combination of asset-based, comparable company and transaction analyses and present value techniques. The present value technique includes the use of an appropriate discount rate, growth rate, risk premium and adjustments for other factors. Refer to note 7.1.
FINANCIAL INSTRUMENTSThe group’s principal financial liabilities comprise loans and borrowings, and trade and other payables. The main purpose of these liabilities is to finance the group’s operations. The principal financial assets include trade and other receivables, and cash and cash equivalents that is derived directly from the group’s operations.
ACCOUNTING CLASSIFICATIONS AND FAIR VALUE OF FINANCIAL INSTRUMENTSThe following table shows the carrying amounts of financial assets and financial liabilities.
The carrying amounts of bank balances, trade and other receivables and trade and other payables approximate their fair values due to the short-term maturity of these assets and liabilities. There is no significant difference between the carrying amounts of other financial assets and liabilities and their fair values due to the effective interest method used.
NOTES TO THE ANNUAL FINANCIAL STATEMENTS continued
FOR THE YEAR ENDED 28 FEBRUARY
STEFANUTTI STOCKS GROUP Consolidated annual financial statements 202158

27. RISK MANAGEMENT, ACCOUNTING CLASSIFICATIONS AND FAIR VALUE CONTINUED
28 February 2021R’000
29 February 2020R’000
FINANCIAL ASSETS, LOANS AND RECEIVABLES AT AMORTISED COST
Bank balances (note 17) 773 772 772 889
Trade and other receivables (note 16) 1 484 934 2 193 962
Equity-accounted investees — Loans — Associates (note 10) 18 803 70 815
FINANCIAL LIABILITIES AT AMORTISED COST
Bank balances (note 17) 18 134 32 376
Trade and other payables (note 21) 736 650 1 020 692
Excess billings over work done (note 15) 1 252 277 1 348 556
Financial liabilities (note 20) 1 536 188 1 500 282
CAPITAL RISK MANAGEMENT
The primary objective of the group’s capital management is to ensure that it maintains a strong credit rating and healthy capital ratios in order to support its business and maximise shareholder value.
The group manages its capital structure centrally and makes adjustments to it, in line with changes in economic conditions. To maintain or adjust the capital structure, the group may adjust the dividend payment to shareholders or issue new shares. No changes were made to the capital risk management objectives and policies during the current year. The group did however obtain additional short-term funding from the group’s primary banker and guarantee providers and converted this short-term funding into appropriate longer-term funding. Refer to note 2 for further detail, as well as the directors report on page 6.
In setting the ideal mix between debt and equity, the group seeks to optimise its returns on shareholders’ equity while maintaining prudent financial gearing. The group monitors capital using a gearing ratio which is net debt divided by total equity attributable to equity holders of the company. Generally, the objective is to operate at a gearing ratio of not greater than 35%. The group retains excess capital to fund future growth.
The group includes within net debt interest-bearing loans, borrowings and bank overdrafts.
Capital is considered to consist of share capital, share premium, retained earnings and other reserves. The group is subject to externally imposed capital requirements by certain of their bankers which, in the event of non-compliance may have an impact on the liquidity risk of the group. At year-end, all such requirements were met.
Gearing ratios at year-end were as follows:28 February 2021
R’00029 February 2020
R’000
Net debt 1 553 433 1 510 113
Interest-bearing liabilities 1 535 299 1 477 737
Bank overdrafts (note 17) 18 134 32 376
Total equity attributable to equity holders of the company 352 568 729 904
Gearing ratio (%) 440,6 206,9
The gearing ratio increased from 206,9% to 440,6%. This is mostly attributable to a reduction in equity as a result of a loss made to the value of R290 million, combined with additional interest-bearing liabilities incurred during the current year as part of the Funding Plan (note 2). Refer to the directors report on page 6.
The term and funding loans included within interest-bearing liabilities do not contain any financial covenants but rather impose certain information undertakings and general undertakings. Information undertakings include items such as submission of financial statements, operating budgets, fortnightly cash flow forecasts and various other undertakings. General undertakings consists mainly of compliance matters.
RISK MANAGEMENT FRAMEWORK
The group’s board of directors has overall responsibility for the establishment and oversight of the group’s risk management framework.
The group has exposure to the following risks arising from financial instruments:
› Credit risk
› Liquidity risk
› Market risk
CREDIT RISK
Credit risk is the risk of financial loss to the group if a customer or counterparty to a financial instrument fails to meet its contractual obligations and arises principally from the group’s receivables from customers.
NOTES TO THE ANNUAL FINANCIAL STATEMENTS continued
FOR THE YEAR ENDED 28 FEBRUARY
Consolidated annual financial statements 2021 STEFANUTTI STOCKS GROUP 59

27. RISK MANAGEMENT, ACCOUNTING CLASSIFICATIONS AND FAIR VALUE CONTINUED
The gross amounts of financial assets represent the maximum credit exposure and are as follows:28 February 2021
R’00029 February 2020
R’000
Contracts in progress (note 15) 611 339 640 490
Contract receivables (note 16) 1 430 543 2 156 589
Retention debtors (note 16) 141 196 153 841
Amounts due by joint operations (note 16) 186 366 242 695
Other receivables (note 16) 54 175 41 627
Total 2 423 619 3 235 242
The group’s exposure to credit risk is influenced mainly by the individual characteristics of each customer.
Management also considers the factors that may influence credit risk including the default risk of the industry and country in which customers operate. The credit granting policy is set on a group basis and managed at operating entity level. Each business unit in the group is responsible for the management of credit risk in receivables and does so through ongoing credit evaluations and credit control policies and procedures.
These receivables comprise of a widespread customer base, primarily in South Africa but also in the rest of Africa, mainly Eswatini, Botswana and Zambia. The majority of the customers are concentrated in the industrial public and private development sectors. Due to the diverse nature of the operations, management does not believe that the group is significantly exposed to a high concentration of credit risk. Any change in the credit quality of receivables is considered from the date credit was granted up to the reporting date. If customers are independently rated, these ratings are used. Otherwise, if there is no independent rating, risk control assesses the credit quality of the customer, considering its financial position, past experience and other factors.
Expected credit loss model
The group applied the simplified approach to determine the expected credit loss (ECL) for its trade receivables and contract assets, by calculating the lifetime ECLs for these receivables. The general approach is applied to determine the expected credit loss on other receivables by assessing, at each reporting period, whether there has been a significant increase in credit risk since initial recognition. Where there is no significant increase in credit risk, the group provides for a 12-month ECL. Where there is a significant increase in credit risk, a lifetime ECL is calculated. An impairment analysis is performed at each reporting date using a provision rate matrix. The provision rates are calculated based on defined credit risk grades and reflect a probability of default based on past events, current conditions and a forecast of future economic conditions. Forecast of future economic conditions incorporates the use of reliable default rate statistics from reputable credit risk rating agencies, which take into account forecast macroeconomic data, including financial and growth conditions of specific industry sectors. The provision rates are revised each year where there are changes in customer profiles and behaviours, new information and changes in forecasted economic conditions. Customers were classified into specific credit risk grades based on the following main criteria:
› Within South Africa or outside South Africa
› Private or public sector
› Days past due of outstanding debt
› Industry sector within which the customer operates
› Other factors specific to each customer where applicable
The provision rates applied ranged from 0,003% for the lowest risk category to 60,2% for the highest risk category (2020: 0,003% – 73,7%). In general, rates applied on collective expected credit losses were higher than prior year due to continued adverse market conditions which have been further strained by the pandemic and the unknown future impact thereof. The provision rate matrix was applied to all receivables as they are mainly from similar customers with similar risk profiles. Additional factors specific to each category of financial assets were also considered and rates were adjusted accordingly.
Covid-19
There was no material impact on the recovery of accounts receivable due to Covid-19. In general, default rates applied in calculating the expected credit losses were increased for certain industry sectors most impacted by Covid-19.
Trade receivables
Trade receivables represent invoiced amounts due from contract customers. The average credit period for trade receivables is 60 days. Interest is charged as per agreements reached with individual clients per signed contracts. The group has the right to waive interest as it deems necessary. Before accepting a new client, the group runs thorough credit and background checks in order to determine the potential customer’s creditworthiness. All contracts and clients’ creditworthiness are assessed on an individual basis.
NOTES TO THE ANNUAL FINANCIAL STATEMENTS continued
FOR THE YEAR ENDED 28 FEBRUARY
STEFANUTTI STOCKS GROUP Consolidated annual financial statements 202160
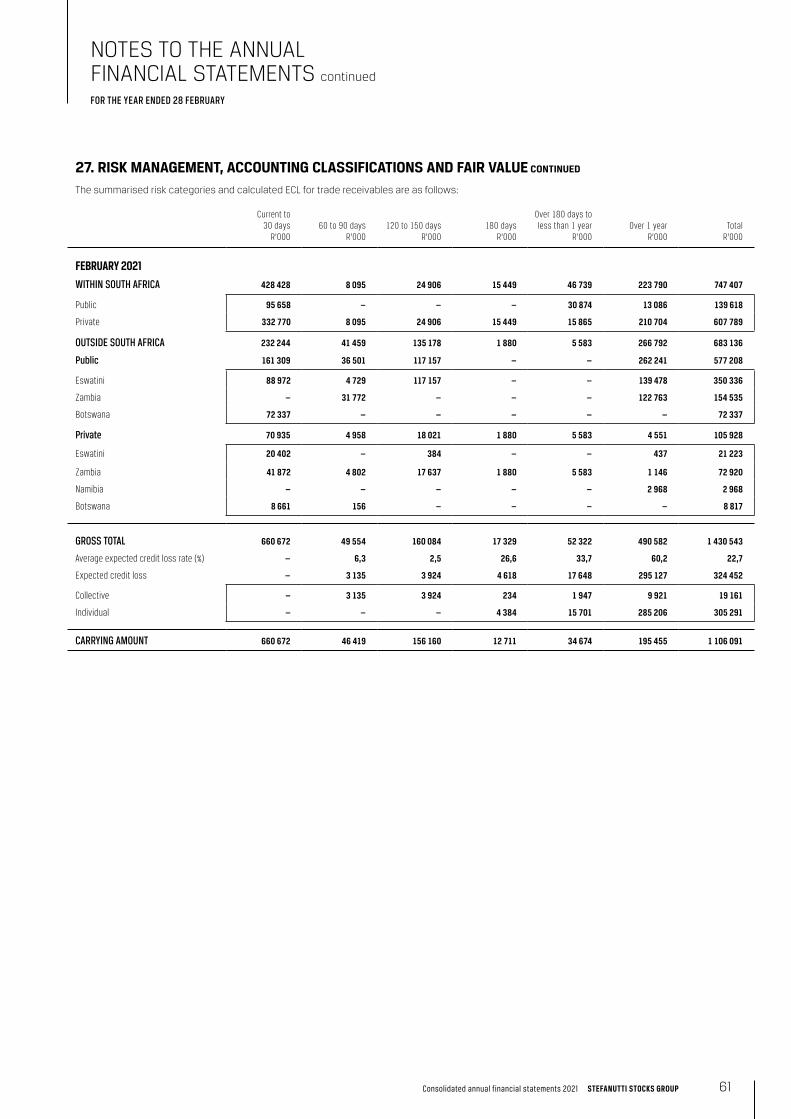
27. RISK MANAGEMENT, ACCOUNTING CLASSIFICATIONS AND FAIR VALUE CONTINUED
The summarised risk categories and calculated ECL for trade receivables are as follows:
Current to30 days
R’00060 to 90 days
R’000 120 to 150 days
R’000180 days
R’000
Over 180 days toless than 1 year
R’000Over 1 year
R’000Total
R’000
FEBRUARY 2021WITHIN SOUTH AFRICA 428 428 8 095 24 906 15 449 46 739 223 790 747 407
Public 95 658 — — — 30 874 13 086 139 618
Private 332 770 8 095 24 906 15 449 15 865 210 704 607 789
OUTSIDE SOUTH AFRICA 232 244 41 459 135 178 1 880 5 583 266 792 683 136
Public 161 309 36 501 117 157 — — 262 241 577 208
Eswatini 88 972 4 729 117 157 — — 139 478 350 336
Zambia — 31 772 — — — 122 763 154 535
Botswana 72 337 — — — — — 72 337
Private 70 935 4 958 18 021 1 880 5 583 4 551 105 928
Eswatini 20 402 — 384 — — 437 21 223
Zambia 41 872 4 802 17 637 1 880 5 583 1 146 72 920
Namibia — — — — — 2 968 2 968
Botswana 8 661 156 — — — — 8 817
GROSS TOTAL 660 672 49 554 160 084 17 329 52 322 490 582 1 430 543
Average expected credit loss rate (%) — 6,3 2,5 26,6 33,7 60,2 22,7
Expected credit loss — 3 135 3 924 4 618 17 648 295 127 324 452
Collective — 3 135 3 924 234 1 947 9 921 19 161
Individual — — — 4 384 15 701 285 206 305 291
CARRYING AMOUNT 660 672 46 419 156 160 12 711 34 674 195 455 1 106 091
NOTES TO THE ANNUAL FINANCIAL STATEMENTS continued
FOR THE YEAR ENDED 28 FEBRUARY
Consolidated annual financial statements 2021 STEFANUTTI STOCKS GROUP 61

27. RISK MANAGEMENT, ACCOUNTING CLASSIFICATIONS AND FAIR VALUE CONTINUED
Current to30 days
R’00060 to 90 days
R’000 120 to 150 days
R’000180 days
R’000
Over 180 days toless than 1 year
R’000Over 1 year
R’000Total
R’000
FEBRUARY 2020WITHIN SOUTH AFRICA 689 454 94 577 13 395 5 045 120 619 92 715 1 015 805
Public 104 622 49 365 — — 3 704 2 034 159 725
Private 584 832 45 212 13 395 5 045 116 915 90 681 856 080
OUTSIDE SOUTH AFRICA 352 417 112 957 344 949 17 485 18 481 294 495 1 140 784
Public 259 440 104 000 343 770 17 485 18 431 278 726 1 021 852
Eswatini 174 449 104 000 343 770 17 485 7 486 12 445 659 635
Mozambique 859 — — — — 286 1 145
Zambia — — — — 10 945 168 002 178 947
Nigeria 16 688 — — — — 97 603 114 291
Botswana 67 444 — — — — — 67 444
Lesotho — — — — — 390 390
Private 92 977 8 957 1 179 — 50 15 769 118 932
Eswatini 6 636 — — — — — 6 636
Zambia 19 185 7 893 1 179 — — 740 28 997
Namibia 1 834 — — — — 1 134 2 968
Mozambique 56 167 1 064 — — 50 13 895 71 176
Botswana 9 155 — — — — — 9 155
GROSS TOTAL 1 041 871 207 534 358 344 22 530 139 100 387 210 2 156 589
Average expected credit loss rate (%) 0,0 1,5 2,7 2,5 72,6 73,7 18,5
Expected credit loss 585 3 111 9 515 569 100 945 285 369 400 094
Collective 585 3 111 6 841 527 1 780 10 276 23 120
Individual — — 2 674 42 99 165 275 093 376 974
CARRYING AMOUNT 1 041 286 204 423 348 829 21 961 38 155 101 841 1 756 495
NOTES TO THE ANNUAL FINANCIAL STATEMENTS continued
FOR THE YEAR ENDED 28 FEBRUARY
STEFANUTTI STOCKS GROUP Consolidated annual financial statements 202162

27. RISK MANAGEMENT, ACCOUNTING CLASSIFICATIONS AND FAIR VALUE CONTINUED
In determining the expected credit loss, the following historical and forward-looking factors were considered:
Historical factors Forward-looking factors
› Payment history of the customer
› Consideration of reasons for delay in payments- whether they are indicative of liquidity/solvency issues
› Contractual recourse for non-payment of debtors
› Collateral/credit insurance available in case of default
Country specific factors considered for the Eswatini and Zambia debtors in particular due to materiality include:
› Zambia
» Regular formal interactions at ministerial level
» Ability to offset amounts due to and due from government (example VAT)
» Work suspended until payment is received
› Eswatini
» No history of bad debts
» Significant advance payments received
» Long outstanding due to the regulation that surrounds payments of government debtors
› Financial state of client and any indication of financial distress based on most recent information available and management discussions
› Commitments made for payment and whether they are realistic based on history, client relationship and progress of contract
› Political climate
› Potential roll-out of future projects
Country specific factors considered for the Eswatini and Zambia debtors in particular due to materiality include:
› Zambia
» Movements in copper price that influence the Zambia government
» List of new projects to be rolled out by the relevant departments of the Government in the short to medium term
» Willingness from Government to offset amounts due to and due from government
» GDP annual growth rates
› Eswatini
» Target of foreign funded projects with the same client (Government departments)
» Formal funding mechanisms in place for these projects
The individual expected credit loss relates to specific clients who are showing signs of default such as delayed payments and liquidity pressures in the below countries for which provisions have been raised:
February 2021 February 2020
Grosscarrying amount
R’000
Expectedcredit loss
R’000
Grosscarrying amount
R’000
Expectedcredit loss
R’000
Zambia 72 262 72 262 117 018 117 018
Mozambique — — 4 915 4 915
Nigeria — — 81 760 81 760
Eswatini 39 983 39 983 — —
Namibia 589 589 589 589
Within South Africa 205 150 192 457 172 822 172 692
TOTAL 317 984 305 291 377 104 376 974
The following contributed to the change in the collective expected credit loss from prior year:
› Overall reduction in trade debtors due to reduced activities caused by the national lockdown and reclassification of the Mozambique and some Mining debtors to discontinued operations.
› Changes in ageing of debtors: Despite the reduction in overall debt, the majority of the balances in 2020 were in the low risk categories (current — 90 days). Therefore, the reduction did not have a significant effect on the expected credit loss
CONTRACTS IN PROGRESSContracts in progress have been disaggregated into two main categories to assess credit risk: Work in progress and Materials on site.
Work in progress includes timing differences between measured work performed but not yet certified and invoiced, pending sign-off from clients’ quantity surveyors. Revenue is recognised based on measured work performed. Any work measured but not yet certified is treated as work in progress, until such time as it is certified and invoiced. Once invoiced, the balance is reclassified to trade receivables.
Materials on site includes costs incurred to complete the contract, but contractually cannot be billed at period end as it has not been used in measured work performed.
NOTES TO THE ANNUAL FINANCIAL STATEMENTS continued
FOR THE YEAR ENDED 28 FEBRUARY
Consolidated annual financial statements 2021 STEFANUTTI STOCKS GROUP 63

27. RISK MANAGEMENT, ACCOUNTING CLASSIFICATIONS AND FAIR VALUE CONTINUED
The summarised risk categories and calculated ECL for contracts in progress are as follows:
Work in progress Materials on site
PublicR’000
PrivateR’000
PublicR’000
PrivateR’000
TotalR’000
FEBRUARY 2021WITHIN SOUTH AFRICA 115 011 208 471 17 682 52 573 393 737
OUTSIDE SOUTH AFRICA 108 851 52 435 46 257 10 059 217 602
Zambia 8 297 43 846 — 10 059 62 202
Eswatini 63 392 6 089 — — 69 481
Botswana 37 162 2 500 46 257 — 85 919
GROSS TOTAL 223 862 260 906 63 939 62 632 611 339
Average expected credit loss rate (%) 0,1 0,1 0,1 0,1 0,1
Expected credit loss 283 151 59 88 581
CARRYING AMOUNT 223 579 260 755 63 880 62 544 610 758
FEBRUARY 2020WITHIN SOUTH AFRICA 97 194 177 930 23 865 71 088 370 077
OUTSIDE SOUTH AFRICA 187 912 70 634 11 295 572 270 413
Nigeria 43 433 — — — 43 433
Zambia 89 274 13 904 — — 103 178
Eswatini 29 523 1 903 — — 31 426
Mozambique 2 664 54 827 — 572 58 063
Lesotho — — 134 — 134
Botswana 23 018 — 11 161 — 34 179
GROSS TOTAL 285 106 248 564 35 160 71 660 640 490
Average expected credit loss rate (%) 0,2 0,1 0,0 0,0 0,1
Expected credit loss 653 269 3 20 945
CARRYING AMOUNT 284 453 248 295 35 157 71 640 639 545
In determining the expected credit loss, the following historical and forward-looking factors were considered:
Historical factors Forward-looking factors
› Contractual provisions for alternative recovery in case of disputes regarding work performed
› Majority of the contracts in progress balances are current and relate to work which will be certified within the next 12 months
› History of probability of work not being certified/disputes arising regarding work performed based on prior experience with clients
› Financial state of client and any indication of financial distress based on most recent information available
› Discussions between the group and the clients regarding recoverability of amounts outstanding and any probabilities of default
› The value of work certified after year-end in relation to the closing balances at period end
The following contributed to the change in the expected credit loss from prior year:
› Reclassification of certain operations to discontinued operations, causing a reduction of 20% in foreign balances, which attract a higher loss rate.
NOTES TO THE ANNUAL FINANCIAL STATEMENTS continued
FOR THE YEAR ENDED 28 FEBRUARY
STEFANUTTI STOCKS GROUP Consolidated annual financial statements 202164
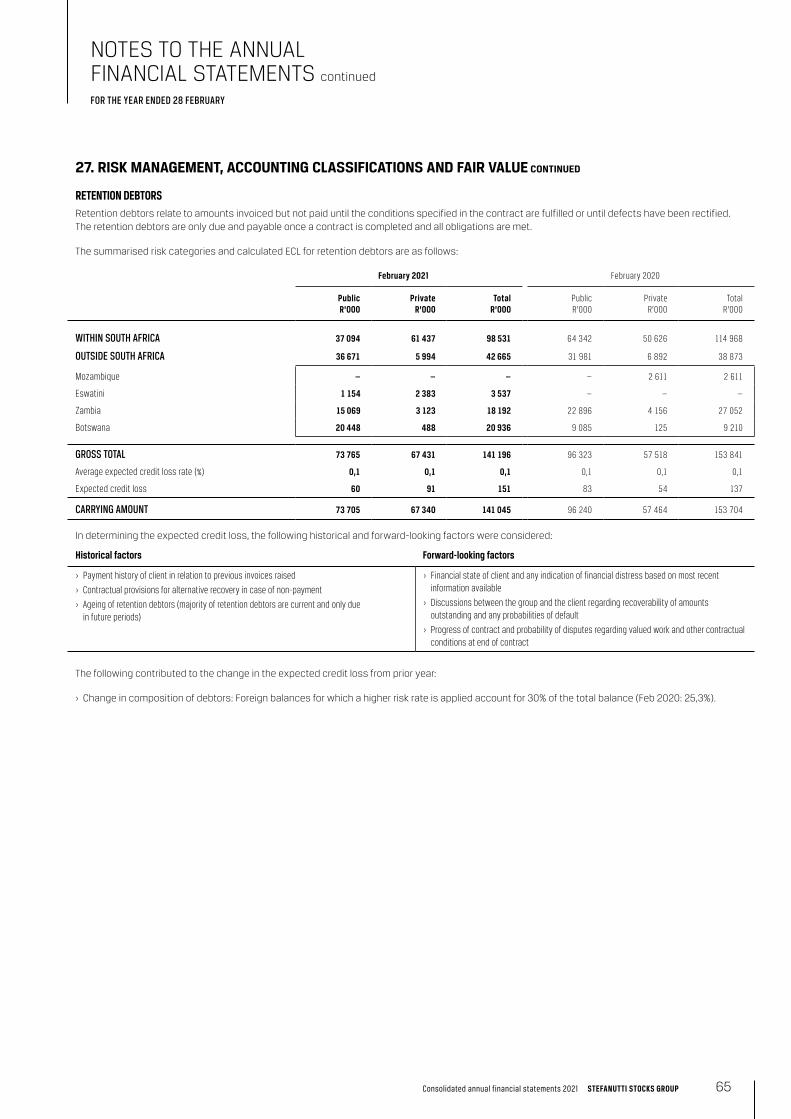
27. RISK MANAGEMENT, ACCOUNTING CLASSIFICATIONS AND FAIR VALUE CONTINUED
RETENTION DEBTORSRetention debtors relate to amounts invoiced but not paid until the conditions specified in the contract are fulfilled or until defects have been rectified. The retention debtors are only due and payable once a contract is completed and all obligations are met.
The summarised risk categories and calculated ECL for retention debtors are as follows:
February 2021 February 2020
PublicR’000
PrivateR’000
TotalR’000
PublicR’000
PrivateR’000
TotalR’000
WITHIN SOUTH AFRICA 37 094 61 437 98 531 64 342 50 626 114 968
OUTSIDE SOUTH AFRICA 36 671 5 994 42 665 31 981 6 892 38 873
Mozambique — — — — 2 611 2 611
Eswatini 1 154 2 383 3 537 — — —
Zambia 15 069 3 123 18 192 22 896 4 156 27 052
Botswana 20 448 488 20 936 9 085 125 9 210
GROSS TOTAL 73 765 67 431 141 196 96 323 57 518 153 841
Average expected credit loss rate (%) 0,1 0,1 0,1 0,1 0,1 0,1
Expected credit loss 60 91 151 83 54 137
CARRYING AMOUNT 73 705 67 340 141 045 96 240 57 464 153 704
In determining the expected credit loss, the following historical and forward-looking factors were considered:
Historical factors Forward-looking factors
› Payment history of client in relation to previous invoices raised
› Contractual provisions for alternative recovery in case of non-payment
› Ageing of retention debtors (majority of retention debtors are current and only due in future periods)
› Financial state of client and any indication of financial distress based on most recent information available
› Discussions between the group and the client regarding recoverability of amounts outstanding and any probabilities of default
› Progress of contract and probability of disputes regarding valued work and other contractual conditions at end of contract
The following contributed to the change in the expected credit loss from prior year:
› Change in composition of debtors: Foreign balances for which a higher risk rate is applied account for 30% of the total balance (Feb 2020: 25,3%).
NOTES TO THE ANNUAL FINANCIAL STATEMENTS continued
FOR THE YEAR ENDED 28 FEBRUARY
Consolidated annual financial statements 2021 STEFANUTTI STOCKS GROUP 65

27. RISK MANAGEMENT, ACCOUNTING CLASSIFICATIONS AND FAIR VALUE CONTINUED
RECEIVABLES FROM JOINT OPERATIONS Receivables from joint operations consist of either resource funding or cash advances. Resource funding relates to recoveries for expenses incurred on behalf of the joint operation by related parties which are settled in the normal course of business. Cash advances relate to contractual loans granted to alleviate temporary cash flow constraints of the operation.
The summarised risk categories and calculated ECL for receivables from joint operations are as follows:
Current to 30 days
R’000
60 to 90 days
R’000
120 to 150 days
R’000180 days
R’000
Over 180 days
— less than 1 yearR’000
Over 1 yearR’000
TotalR’000
Resource accounts
R’000
Cash advances/
otherR’000
FEBRUARY 2021WITHIN SOUTH AFRICA 31 262 2 855 403 1 019 2 241 9 598 47 378 21 378 26 000
Public 4 563 420 — 838 450 — 6 271 5 039 1 232
Private 26 699 2 435 403 181 1 791 9 598 41 107 16 339 24 768
OUTSIDE SOUTH AFRICA 1 500 — — — — 137 488 138 988 14 161 124 827
Public 1 500 — — — — 123 327 124 827 — 124 827
Eswatini 1 500 — — — — 123 327 124 827 — 124 827
Private — — — — — 14 161 14 161 14 161 —
Eswatini — — — — — 14 161 14 161 14 161 —
GROSS TOTAL 32 762 2 855 403 1 019 2 241 147 086 186 366 35 539 150 827
Average expected credit loss rate (%) 0,1 1,4 3,7 1,0 4,6 0,3 0,4
Expected credit loss 17 41 15 10 103 513 699
CARRYING AMOUNT 32 745 2 814 388 1 009 2 138 146 573 185 667
FEBRUARY 2020WITHIN SOUTH AFRICA 24 549 8 859 355 1 876 10 10 814 46 463 12 543 33 920
Public 5 228 281 355 1 836 10 5 638 13 348 6 579 6 769
Private 19 321 8 578 — 40 — 5 176 33 115 5 964 27 151
OUTSIDE SOUTH AFRICA 1 864 4 109 10 029 1 424 117 262 61 544 196 232 20 159 176 073
Public — — — — 113 726 49 998 163 724 — 163 724
Eswatini — — — — 113 726 49 998 163 724 — 163 724
Private 1 864 4 109 10 029 1 424 3 536 11 546 32 508 20 159 12 349
Eswatini 418 1 957 1 280 1 424 3 536 11 546 20 161 20 159 2
Zambia 1 446 2 152 8 749 — — — 12 347 — 12 347
GROSS TOTAL 26 413 12 968 10 384 3 300 117 272 72 358 242 695 32 702 209 993
Average Expected credit loss rate (%) 0,1 1,7 1,4 0,4 — 0,2 0,2
Expected credit loss 19 220 141 14 3 132 529
CARRYING AMOUNT 26 394 12 748 10 243 3 286 117 269 72 226 242 166
NOTES TO THE ANNUAL FINANCIAL STATEMENTS continued
FOR THE YEAR ENDED 28 FEBRUARY
STEFANUTTI STOCKS GROUP Consolidated annual financial statements 202166

27. RISK MANAGEMENT, ACCOUNTING CLASSIFICATIONS AND FAIR VALUE CONTINUED
In determining the expected credit loss, the following historical and forward-looking factors were considered:
Historical factors Forward-looking factors
› Past experience — these are normally settled in the normal course of business
› Joint operations are still trading, and, in most instances, we are the lead partner and administer and manage the cash therefore ensuring payment
› Cash flow projections prepared on a regular basis
› Ability of joint operation partners to fund cash flow requirements
› Joint operation relationships are governed by joint operation agreements and will exist until end of contract/project
› Future profitability of the project taking into consideration timing of profit distributions in terms of the joint operation agreement
The following contributed to the change in the expected credit loss from prior year:
› Increased loss rates in general due to continued adverse market conditions.
OTHER RECEIVABLESOther receivables consist mostly of deposits (mainly house rental deposits), interest accrued, sundry debtors and short-term loans repayable within one year. No ECL was calculated on interest accrued as these monies have already been credited to our bank account.
The summarised risk categories and calculated ECL for other receivables are as follows: 28 February 2021
R’00029 February 2020
R’000
WITHIN SOUTH AFRICA 50 467 34 972
OUTSIDE SOUTH AFRICA 3 708 6 655
Ghana — 2 162
Eswatini 2 598 1 570
Namibia 177 1 325
Mozambique — 289
Other: Nigeria, Guinea, Kenya, Zambia, Lesotho, Mauritius, Botswana 933 1 309
GROSS TOTAL 54 175 41 627
Average expected credit loss rate (%) 3,8 0,1
Expected credit loss 2 044 30
CARRYING AMOUNT 52 131 41 597
In determining the expected credit loss, the following historical and forward-looking factors were considered:
Historical factors Forward-looking factors
Deposits
› History of default by agents on repayment of deposits
› Materiality of deposit amounts that could affect ability of agent to re-pay
Deposits
› Whether deposits can be transferred to other properties under the same rental agent
Short-term loans
› Contractual provisions for alternative recovery in case of non-payment.
› Security against loans — in certain instances loans are secured by rights to plant and equipment
Short-term loans
› The fair value of the plant and equipment pledged as security where applicable
› Financial state of client and any indication of financial distress based on most recent information available
Sundry debtors
› Materiality of amounts due from the various sundry debtors
› Nature of the debtor (whether low credit-risk entities, e.g. banks, trusts)
Sundry debtors
› Financial state of the debtor and any indication of financial distress based on most recent information available
The following contributed to the change in the expected credit loss from prior year:
› Specific provision raised for a sundry loan due from a local debtor which has been outstanding for over a year.
NOTES TO THE ANNUAL FINANCIAL STATEMENTS continued
FOR THE YEAR ENDED 28 FEBRUARY
Consolidated annual financial statements 2021 STEFANUTTI STOCKS GROUP 67

27. RISK MANAGEMENT, ACCOUNTING CLASSIFICATIONS AND FAIR VALUE CONTINUED
Exposure to trade receivables is mitigated by the request for collateral.
COLLATERAL28 February 2021
R’00029 February 2020
R’000
Contract receivables for which guarantees are held 6 550 6 550
Collateral held in the form of:
Payment guarantee 6 459 6 549
Builder’s lien 60 288 —
Credit insurance 111 154 30 000
PAYMENT GUARANTEEGuarantees are received from clients on signing the construction contract when required. Payment guarantees can be called on when the client is in default of negotiated terms. Guarantees are issued for specified periods and expire on final completion of the contract.
BUILDER’S LIENThis is the right the contractor has over the construction (the building) if the client is in default on negotiated terms. The builder’s lien is not readily convertible into cash, because of the nature of the collateral. The group will hold the right until payment is received should there not be a market for disposing of such an asset.
CREDIT INSURANCEInsurance obtained in case of default of client.
BANK BALANCESThe group only deposits with major banks with high-quality ratings, the credit quality therefore is assessed as good.
LIQUIDITY RISKLiquidity risk is the risk that the group will encounter difficulty in meeting the obligations associated with its financial liabilities that are settled by delivering cash or another financial asset. The group manages liquidity risk through an ongoing review of future commitments and credit facilities and by ensuring that adequate unutilised borrowings facilities are maintained. This will ensure that the group will be in a position to meet its liabilities when they are due. The group also monitors on a monthly basis the level of expected cash inflows on trade and other receivables together with expected cash outflows to ensure all commitments are met. This excludes the potential impact of extreme circumstances that cannot reasonably be predicted.
The group maintains the following lines of credit:
› R1 556 million (Feb 2020: R1 305 million) which include mainly banking, guarantee and asset-based facilities.
As on 28 February 2021 the facilities used from the above credit lines are as follows:
LimitR’000
UtilisationR’000
AvailableR’000
FEBRUARY 2021Facility A 1 484 419 1 476 419 8 000
Facility B 2 108 2 108 —
Facility C 24 419 24 419 —
Facility D 44 888 22 825 22 063
1 555 834 1 525 771 30 063
NOTES TO THE ANNUAL FINANCIAL STATEMENTS continued
FOR THE YEAR ENDED 28 FEBRUARY
STEFANUTTI STOCKS GROUP Consolidated annual financial statements 202168

27. RISK MANAGEMENT, ACCOUNTING CLASSIFICATIONS AND FAIR VALUE CONTINUED
LimitR’000
UtilisationR’000
AvailableR’000
FEBRUARY 2020Facility A 1 118 723 1 105 530 13 193
Facility B 60 431 60 431 —
Facility C 50 310 50 310 —
Facility D 75 517 55 314 20 203
1 304 981 1 271 585 33 396
EXPOSURE TO LIQUIDITY RISKThe following are the remaining contractual maturities of financial instruments at the reporting date. The amounts are presented gross and undiscounted and include contractual interest payments.
Carryingamount
R’000Total
R’000
Ondemand
R’000
Less thanone year
R’000
Between twoand five years
R’000
More thanfive years
R’000
2021FINANCIAL ASSETS
Trade and other receivables 1 484 934 1 484 934 — 1 484 934 — —
1 484 934 1 484 934 — 1 484 934 — —
FINANCIAL LIABILITIES
Other financial liabilities * 1 536 188 1 768 417 588 1 486 035 167 537 114 257
Trade and other payables 736 650 736 650 — 736 650 — —
Bank balances 18 134 18 134 — 18 134 — —
2 290 972 2 523 201 588 2 240 819 167 537 114 257
2020FINANCIAL ASSETS
Trade and other receivables 2 193 962 2 193 962 — 2 193 962 — —
2 193 962 2 193 962 — 2 193 962 — —
FINANCIAL LIABILITIES
Other financial liabilities 1 500 282 1 615 395 853 1 054 432 513 672 46 438
Trade and other payables 1 020 692 1 020 692 — 1 020 692 — —
Bank balances 32 376 32 376 — 32 376 — —
2 553 350 2 668 463 853 2 107 500 513 672 46 438
* Other financial liabilities in the “less than one year” bracket mainly consist of term loans to the value of R1,43 billion. These term loans have varied repayment terms with R515 million payable within the first six month of the year and
R914 million in the last six months.
NOTES TO THE ANNUAL FINANCIAL STATEMENTS continued
FOR THE YEAR ENDED 28 FEBRUARY
Consolidated annual financial statements 2021 STEFANUTTI STOCKS GROUP 69

27. RISK MANAGEMENT, ACCOUNTING CLASSIFICATIONS AND FAIR VALUE CONTINUED
MARKET RISKMarket risk is the risk that changes in foreign exchange rates and interest rates, which affect the group’s income or the value of its holdings of financial instruments.
CURRENCY RISK
The group is exposed to currency risk to the extent that there is a mismatch between the currencies in which sales, purchases and bank balances are denominated and the respective functional currencies.
In addition to the above, the group also has certain investments in foreign operations, whose net assets are exposed to foreign currency translation risk. The presentation currency of the group is Rand. The currencies in which these transactions are primarily denominated are Zambian Kwacha (ZMW), Botswana Pula (BPW) and other African currencies.
2021 2020
BWPR’000
ZMWR’000
Other *R’000
TotalR’000
AEDR’000
ZMWR’000
MZNR’000
OtherR’000
TotalR’000
Profit/(loss) for the year after tax included 25 433 28 619 (4 026) 50 026 51 087 (109 088) (17 432) (93 786) (169 219)
Unhedged monetary assets 118 618 283 742 39 755 442 115 8 029 145 831 144 613 397 077 695 550
Trade receivables 80 982 149 199 2 361 232 542 — 90 926 67 188 113 591 271 705
Other receivables 32 591 33 110 30 836 96 537 448 47 774 40 273 104 061 192 556
Bank balances 5 045 101 433 6 558 113 036 7 581 7 131 37 152 179 425 231 289
Unhedged monetary liabilities 39 555 43 739 4 363 87 657 856 27 431 220 877 66 098 315 262
Trade payables 6 158 5 758 239 12 155 374 3 270 52 980 20 926 77 550
Other payables 33 397 37 981 4 124 75 502 482 24 161 153 492 45 172 223 307
Bank overdraft — — — — — — 14 405 — 14 405
The group trades in a number of currencies and certain currencies have been excluded where considered immaterial.
Other currencies include Kenya Schillings (KES), Namibian Dollar (NAD), Tanzanian Schilling (TZS), Ghanaian Cedi (GHC), Guinean Franc (GNF) and Mauritian Rupee (MUR).
Average rate Closing rate
2021 2020 2021 2020
THE FOLLOWING EXCHANGE RATES HAVE BEEN APPLIED
ZMW 0,8620 1,0984 0,6926 1,0424
BPW 1,4407 1,3493 1,3833 1,4072
MZN — 0,2326 — 0,2401
AED — 3,9724 — 4,2653
SENSITIVITY ANALYSIS
A reasonably possible strengthening/(weakening) of the following currencies at year-end would have affected the measurement of profit or loss after tax denominated in a foreign currency by the amounts shown below. The analysis assumes that all other variables, in particular interest rates, remain constant and ignores any impact of forecast sales and purchases.
Movement Strengthening/(weakening)
2021%
2020%
2021R’000
2020R’000
ZMW 22 12 6 157/(6 157) 13 091/(13 091)
BPW 7 — 1 722/(1 722) —
MZN — 4 — 697/(697)
AED — 8 — 4 087/(4 087)
NOTES TO THE ANNUAL FINANCIAL STATEMENTS continued
FOR THE YEAR ENDED 28 FEBRUARY
STEFANUTTI STOCKS GROUP Consolidated annual financial statements 202170

27. RISK MANAGEMENT, ACCOUNTING CLASSIFICATIONS AND FAIR VALUE CONTINUED
INTEREST RATE RISK
The group is exposed to interest rate risk through its cash and cash equivalents and interest-bearing, short- and long-term liabilities. Short-term interest rate exposure is monitored and managed by each business unit in the group. The majority of borrowings are obtained at variable rates exposing the group to cash flow interest rate risk.
The terms and conditions of outstanding interest-bearing loans are as follows:
Currency Nominal interest rate Year of maturity Carrying value
2021%
2020%
2021R’000
2020R’000
Unsecured borrowings ZAR 3,00 – 11,82 3,97 – 11,82 2021 – 2025 11 630 4 341
Secured borrowings ZAR 6,00 – 7,49 8,50 – 10,54 2022 1 330 643 865 369
Secured borrowings MZN — 5,45 — — 18 971
Secured borrowings SZL 9,00 9,00 2035 1 712 1 785
Lease liabilities (instalment sales agreements) ZAR 5,65 – 9,00 8,40 – 10,00 2021 – 2023 25 869 183 340
Lease liabilities (other) — local ZAR 7,00 – 9,75 9,50 2021 – 2030 54 695 298 337
Lease liabilities (other) — foreign USD/MZN — 7,90/23,25 — — 2 122
Voluntary Rebuild Programme ZAR 7,50 7,50 2027 110 750 103 472
1 535 299 1 477 737
SENSITIVITY ANALYSIS
A change of 275 basis points in interest rates (in line with the change in the South African prime rate since the beginning of the year) would have increased or decreased profit or loss by R57 million before tax (Feb 2020 restated: R43 million).
NOTES TO THE ANNUAL FINANCIAL STATEMENTS continued
FOR THE YEAR ENDED 28 FEBRUARY
Consolidated annual financial statements 2021 STEFANUTTI STOCKS GROUP 71

28. BUSINESS COMBINATIONS
2021The group increased its shareholding in two non-material joint operations (note 11) during the year due to operational requirements.
The fair value of assets and liabilities of the acquisitions are reflected in the note below:
Khumani— joint operation
Mpophomeni — joint operation
Effective date 1 November 2020 1 November 2020
Voting equity acquired 50,5% 25%
Khumani— joint operation
R’000
Mpophomeni — joint operation
R’000
AT ACQUISITION VALUES:NON-CURRENT ASSETS — 80
Property, plant and equipment (note 9) — 80
CURRENT ASSETS 5 022 2 775
Contracts in progress (note 15) — 317
Trade and other receivables 4 220 2 447
Bank balances 802 11
NON-CURRENT LIABILITIES — 169
Deferred taxation — 169
CURRENT LIABILITIES 2 361 2 660
Financial liabilities — 103
Trade and other payables 2 361 1 237
Excess billings over work done (note 15) — 634
Provisions (note 22) — 686
NET ASSET VALUE 2 661 26
Cost of acquisition 3 000 1 000
Cash paid 3 000 1 000
Intangible assets recognised on acquisition (note 12) 339 974
Revenue since acquisition included in results 11 941 5 747
Profit before tax since acquisition included in results 1 414 316
Revenue since the beginning of the year 33 479 50 455
Profit since the beginning of the year 6 128 1 516
Acquisition-related costs recognised within operating expenses — —
NET CASH FOR ACQUISITION OF JOINT OPERATIONSKhumani
— joint operationR’000
Mpophomeni— joint operation
R’000Total
R’000
Cash consideration paid (3 000) (1 000) (4 000)
Less: cash acquired 802 11 813
NET CASH OUTFLOW (2 198) (989) (3 187)
NOTES TO THE ANNUAL FINANCIAL STATEMENTS continued
FOR THE YEAR ENDED 28 FEBRUARY
STEFANUTTI STOCKS GROUP Consolidated annual financial statements 202172

28. BUSINESS COMBINATIONS CONTINUED
2020The exiting of Group Five Civil Engineering (Pty) Ltd and Basil Read (Pty) Ltd from the KCW JV operation necessitated the group to increase its shareholding from 25% to 50%. As the cost relating to the increase in shareholding is yet to be established, it has been based on the provisional net asset value including a settlement agreement and excluding the recognition of deferred tax at the effective date. The group further increased its shareholding in certain non-material joint operations and acquired 100% of EIS Properties (Pty) Ltd, due to operational requirements.
The fair value of assets and liabilities of the acquisitions are reflected in the note below:
KCW— joint operation
Stefanutti Stocks Izazi — joint operation
Stefanutti Stocks BMH — joint operation
EIS Properties (Pty) Ltd— subsidiary
Effective date 1 March 2019 1 March 2019 1 November 2019 1 July 2019
Voting equity acquired 25% 40% 50% 100%
KCW— joint operation
R’000
Stefanutti Stocks Izazi — joint operation
R’000
Stefanutti Stocks BMH — joint operation
R’000
EIS Properties (Pty) Ltd— subsidiary
R’000
AT ACQUISITION VALUES:NON-CURRENT ASSETS 13 543 3 243 1 396 3 572
Property, plant and equipment (note 9) — — — 3 572
Deferred tax assets 13 543 3 243 1 396 —
CURRENT ASSETS 88 989 25 634 25 415 —
Contracts in progress (note 15) 3 276 209 — —
Trade and other receivables 41 611 18 564 22 112 —
Bank balances 44 102 6 861 3 303 —
NON-CURRENT LIABILITIES — — — 1 857
Financial liabilities (note 23) — — — 1 857
CURRENT LIABILITIES 76 777 15 431 22 489 38
Trade and other payables 12 145 8 170 14 814 37
Excess billings over work done (note 15) 54 177 7 261 7 220 —
Provisions 10 455 — 455 —
Bank overdraft — — — 1
NET ASSET VALUE 25 755 13 446 4 322 1 677
Cost of acquisition 10 586 14 000 7 000 1 677
Cash paid — 14 000 7 000 1 677
Intangible assets recognised on acquisition — 554 2 678 —
Bargain purchase gain recognised within other income (note 4) 15 169 — — —
Revenue since acquisition included in results 218 997 64 562 50 241 245
Profit/(loss) before tax since acquisition included in results 56 333 52 734 6 042 (39)
Revenue since the beginning of the year 218 997 64 562 149 576 245
Profit/(loss) since the beginning of the year 56 333 52 734 7 698 (96)
Acquisition-related costs recognised within operating expenses — 45 — —
The benefits of a deferred tax asset recognised on acquisition together with a waiver of payment in terms of a settlement agreement resulted in a bargain purchase gain recognised.
NET CASH FOR ACQUISITION OF JOINT OPERATIONSKCW
— joint operationR’000
Stefanutti Stocks Izazi — joint operation
R’000
Stefanutti Stocks BMH — joint operation
R’000
EIS Properties (Pty) Ltd — subsidiary
R’000Total
R’000
Cash consideration paid - (14 000) (7 000) (1 677) (22 677)
Less: Cash acquired 44 102 20 620 4 286 (1) 69 007
NET CASH INFLOW 44 102 6 620 (2 714) (1 678) 46 330
NOTES TO THE ANNUAL FINANCIAL STATEMENTS continued
FOR THE YEAR ENDED 28 FEBRUARY
Consolidated annual financial statements 2021 STEFANUTTI STOCKS GROUP 73

29. IMPACT OF COVID-19
COVID-19The pandemic is considered to be an ongoing event and management is continuously assessing and monitoring developments with regard to its impact on the business, with a focus on the following three aspects:
1. GOING CONCERN
The outbreak of the pandemic in March 2020 occurred in the midst of the implementation of the group’s Restructuring Plan which was initiated to put in place the optimal capital structure and access to liquidity to position the group for long-term growth. Management has made considerable progress in reconfiguring the group’s organisational structure to improve operational performance and decrease overhead costs, including the reduction of the group’s overall headcount. This is an ongoing process which continues as the aspects of the Restructuring Plan are being implemented in this uncertain environment.
The group’s operations were impacted by the respective lockdowns during the first half of the financial year. However, a good recovery was made in the second half of the year with all three divisions returning to normal levels of efficiency. Below is a summary of the impact of the pandemic on the various business units within the group:
Construction & Mining
Amidst loss of revenue during the lockdown periods and increased costs and disruptions due to implementing the necessary COVID-19 protocols, some of the divisions within this unit also saw many tenders being cancelled or postponed, putting further strain on its future order book. However, two of the cross-border operations, namely the Eswatini and Zambia Divisions, managed to successfully deliver on all projects in spite of challenges posed by COVID-19. Construction & Mining’s contract revenue from continuing operations decreased to R3,7 billion (restated Feb 2020: R4,7 billion) with an operating profit of R71 million (restated Feb 2020: operating loss of R383 million). As the Government sees investment in infrastructure as an opportunity to drive the post COVID-19 economic recovery and some positive sentiments emerging with large infrastructure projects put out to tender, the unit’s prospects for the coming year are looking positive.
Building
COVID-19, the government lockdown and the pandemic’s general impact on the economy had a significant impact on the Building business units February 2021 financial result, with the business reporting contract revenue of R 1,1 billion (restated Feb 2020: R 1,7 billion) and an operating loss of R 31 million (Feb 2020: restated operating loss of R 514 million (including a provision of R462 million for Kusile)). The unit also experienced a delay and suspension of awards of several contracts in its Mozambique operations. As a result of COVID, businesses have changed the way they operate, staff is working from home, and online shopping has become more prevalent – both of these factors could result in a reduced demand for both offices and retail centres. On the positive side this may create opportunities for Data Centers and industrial warehousing facilities.
Mechanical & Electrical
Mechanical & Electricals’ contract revenue decreased to R270 million (Feb 2020: R897 million) with an operating loss of R64 million (Feb 2020: R25 million). This business unit has been severely impacted by the effects the COVID-19 pandemic has had on global commodity prices resulting in major plant maintenance and upgrade projects being put on hold. However, opportunities in the traditional petrochemical sector for the Oil & Gas division are showing signs of improvement.
Please also refer to the Operational reviews included in the 2021 Integrated Annual Report.
NOTES TO THE ANNUAL FINANCIAL STATEMENTS continued
FOR THE YEAR ENDED 28 FEBRUARY
STEFANUTTI STOCKS GROUP Consolidated annual financial statements 202174

29. IMPACT OF COVID-19 CONTINUED
The below graph shows the impact of Covid-19 on man-hours worked:
Mar 2020Level 5 * lockdown
Apr 2020Level 5
lockdown
May 2020Level 4
lockdown
Jun 2020Level 3
lockdown
Jul 2020Level 3
lockdown
Aug 2020Level 2
lockdown
Sep 2020Level 1
lockdown
Oct 2020Level 1
lockdown
Nov 2020Level 1
lockdown
Dec 2020Level 1
lockdown
Jan 2021Level 3 ** lockdown
Feb 2021Level 3
lockdown
YEAR-ON-YEAR COMPARISON OF HOURS WORKED (million)
2,O6 (21%)
(63%)
(51%)(31%)
(27%)(37%)
(33%)(37%)
(36%)
(33%)
(37%)
(37%)1,62
0,68
1,00
1,371,50
1,36 1,35 1,32 1,29
0,850,96
1,10
1,82
2,05 1,99 2,062,14
2,022,11
2,01
1,73
1,53
1,27
* Level 5 lockdown commenced on 27 March 2020. ** Level 3 lockdown implemented on 29 December 2020.
FY2020 FY2021
Although the uncertainties surrounding the COVID-19 pandemic and other factors affecting the group indicate that a material uncertainty exists that may cast significant doubt with respect to the group’s ability to continue as a going concern, the successful implementation of the restructuring plan continues to mitigate this uncertainty. Refer to note 2.
2. RECOVERABILITY AND IMPAIRMENT OF ASSETS
Goodwill
In assessing whether goodwill is impaired as at year-end, the value in use of the different CGUs was determined by discounting the future cash flows expected to be generated from the continuing use of the CGUs, based on certain key assumptions. A sensitivity analysis was also performed by adjusting the growth and discount rates in light of the current economic conditions and uncertainty regarding the future impact of the pandemic. These values are used to evaluate the potential impact on the carrying amounts of goodwill.
Financial assets
The group’s assessment of expected credit losses on its financial assets entails the use of global default rates forecasted by reliable, independent credit risk rating agencies. Default rates in 2020/21 were higher in sectors most exposed to pandemic-related risk. In general, default rates applied in the group’s calculation of ECL have been increased in line with these forecasted default rates for relevant industry sectors.
Deferred tax assets
The recoverability of deferred tax assets continues to be assessed considering the impact of COVID-19 on the group’s results. The group has not provided for a deferred tax asset on the losses pertaining to the South African trading entity.
3. FINANCIAL LIABILITIES, GUARANTEES AND CONTINGENT LIABILITIES
Management continues to assess the effects of the pandemic on the group’s liabilities, including the possibility of breach of debt covenants due to inability to settle capital and interest payments when they become due, the ability to obtain additional funding when necessary and whether material liabilities could arise from guarantees and contingent liabilities.
In accordance with the Restructuring Plan, the Lenders had provided the requisite funding and converted the short-term funding agreement into a term loan on 1 July 2020, which loan terminates on 28 February 2022. The loan bears interest at prime plus 5,4%, including arranging and facility fees, and is secured by special and general notarial bonds over movable assets, continuous covering mortgage bonds over immovable assets and various cessions. Additionally, the group, on 25 May 2021, reached an agreement with the Lenders to extend the current capital repayment profile of the loan. The capital portion of the loan repayments are envisaged to commence in July 2021 with a residual loan balance at 28 February 2022 of approximately R420 million.
The Lenders have agreed to provide continued guarantee support for current and future projects being undertaken by the group.
With regards to its contingent liabilities, the group is involved in a number of arbitration matters and based on management’s assessment, no further provisions need to be made. Refer to note 26.
Subsequent to year-end, there have been no significant changes in the Covid-19 pandemic restrictions impacting the group and therefore no adjustments have been made to the financial results reported as at year end.
NOTES TO THE ANNUAL FINANCIAL STATEMENTS continued
FOR THE YEAR ENDED 28 FEBRUARY
Consolidated annual financial statements 2021 STEFANUTTI STOCKS GROUP 75

30. SUBSEQUENT EVENTS Other than the matters noted herein, there were no other material reportable events which occurred between the reporting date and the date of these consolidated annual financial statements.
DISPOSAL OF AL TAYER STOCKS LLCAs noted in the Reviewed Condensed Consolidated Results for the twelve months ended 28 February 2021 published on 27 May 2021, the carrying value of the investment relating to the equity-accounted United Arab Emirates Joint Venture, Al Tayer Stocks LLC (ATS), of R268 million has been re-classified to non-current assets held for sale carried at fair value less costs to sell based on a potential sale that is under negotiation. Refer to note 7.
The group is currently in negotiations to dispose of its entire interest, representing 49% of the issued share capital in ATS (the Transaction).
Should these negotiations be successful, it is anticipated that the purchase consideration for the Transaction will be based on the Preliminary Equity Value of ATS less an Equity Value Adjustment and Retention Adjustment (Purchase Consideration).
The information noted below is based on a 100% value of ATS:
1. The Preliminary Equity Value of ATS is anticipated to be Emirati Dirham (AED) 131,8 million
2. The Equity Value Adjustment is anticipated to be AED34,1 million
3. The Retention Adjustment is anticipated to be AED52,1 million
As is customary in the construction industry, ATS is in the process of recovering costs and/or fees from its clients. The Equity Value Adjustment and Retention Adjustment, and consequently the Purchase Consideration, is calculated with reference to this recovery process. To the extent that these processes are resolved favourably, Stefanutti Stocks’ portion of the Equity Value Adjustment and Retention Adjustment may be paid to Stefanutti Stocks over a period of time. However, if these processes are resolved unfavourably, this may result in Stefanutti Stocks’ portion of the Equity Value Adjustment and Retention Adjustment not being payable thereby reducing the Purchase Consideration. The carrying value of the investment will be adjusted to reflect the Purchase Consideration.
A sensitivity analysis has been performed, disclosed in the table below, based on probabilities of potential recoveries of the Equity Value Adjustment and Retention Adjustment in determining the possible Purchase Consideration. The Purchase Consideration is used to determine the fair value of the investment.
The sensitivity analysis is based on the 28 February 2021 results, using a conversion rate of R4,10 for AED1,00. In performing the sensitivity analysis probabilities have been applied to the Equity Value Adjustment and Retention Adjustment to determine the Purchase Consideration and assess the impact on the financial statements.
NOTES TO THE ANNUAL FINANCIAL STATEMENTS continued
FOR THE YEAR ENDED 28 FEBRUARY
STEFANUTTI STOCKS GROUP Consolidated annual financial statements 202176

30. SUBSEQUENT EVENTS CONTINUED
SENSITIVITY ANALYSIS
IMPACT ON STATEMENT OF PROFIT OR LOSS AND OTHER COMPREHENSIVE INCOMEProposed
transactionAED’m
Conversionrate: R4,10
R’m R’m R’m
Probabilities of recovery of the equity vale adjustment and retention adjustment No recovery 50% 100% recovery
Preliminary equity value 131,8 540,4 540,4 540,4
Equity value adjustment (34,1) (139,8) (69,9) —
Retention adjustment (52,1) (213,6) (106,8) —
Fair value of investment after adjustments 45,6 187,0 363,7 540,4
50% value attributable to the group 93,5 181,9 270,2
Fair value of investment — 28 February 2021 267,7 267,7 267,7
Fair value adjustment (174,2) (85,8) 2,5
IMPACT ON STATEMENT OF FINANCIAL POSITIONFebruary 2021
R’000No recovery
R’m50%R’m
100% recoveryR’m
Non-current assets held for sale
Equity-accounted investee 267 689 93,5 181,9 270,2
Capital and reserves 352 568 178,4 266,8 355,1
IMPACT ON NET TANGIBLE ASSET VALUEFebruary 2021
R’000No recovery
R’m50%R’m
100% recoveryR’m
Capital and reserves as calculated above 352 568 178,4 266,8 355,1
Less: goodwill (345 664) (345,7) (345,7) (345,7)
Net tangible asset value 6 904 (167,3) (78,9) 9,4
The negative net tangible asset value caused by the fair value adjustment based on the assumptions used above, indicate that total liabilities will exceed total assets at a point in time. This would be viewed as technical insolvency which differs from commercial insolvency. Commercial insolvency assesses, irrespective of whether a company is technically solvent or not, the group’s ability to pay its ongoing obligations as and when they fall due. The group believes that it is still currently commercially solvent based on the cashflow projections included in the Restructuring Plan and on the basis of successfully implementing the Restructuring Plan. Refer to note 2.
CHANGES AND PROPOSED CHANGES TO THE BOARD OF DIRECTORS In accordance with paragraph 3.59 of the Listings Requirements of the JSE Limited, shareholders are advised of the following changes to the board:
Dermot Quinn has informed the Board of his intention to retire from the Board at the Company’s 2021 Annual General Meeting. Dermot has served on the board since 2007 as the Chief Financial Officer and thereafter as a non-executive director. John Poluta, currently alternate non-executive director to Busisiwe Silwanyana, will be appointed as a non-executive director. John has been on the Board as an alternate non-executive director since 2017.
The Board expresses its appreciation to Dermot for his valued past contributions and guidance over the years and wishes him all the best for the future.
Given the critical importance of the ongoing implementation of the Restructuring Plan, and in order to devote the required time and resource to this process, Antonio Cocciante will step down from his role as Chief Financial Officer and executive director, effective 31 May 2021 until such time that the plan has been fully implemented. During this implementation period, Yolanda du Plessis will be appointed as acting Chief Financial Officer and executive director with effect from 1 June 2021. Yolanda has been with the group since 2008 and has worked closely with both Dermot and Antonio over the years. Yolanda’s appointment has the support of the Board. Her detailed CV can be found on page 39 of the integrated annual report.
31. AVAILABILITY OF STEFANUTTI STOCKS SEPARATE ANNUAL FINANCIAL STATEMENTSThe Stefanutti Stocks Holdings Limited separate annual financial statements have been prepared and signed on 21 June 2021, and are available on the group’s website.
The Stefanutti Stocks separate annual financial statements have been prepared in accordance with the requirements of the Companies Act No 71 of 2008 and the company’s independent auditors, Mazars, has expressed an unqualified opinion with an emphasis of matter thereon.
NOTES TO THE ANNUAL FINANCIAL STATEMENTS continued
FOR THE YEAR ENDED 28 FEBRUARY
Consolidated annual financial statements 2021 STEFANUTTI STOCKS GROUP 77

BASIS OF PREPARATION
GOING CONCERN STATEMENTThe below should be read in conjunction with note 2.
The funding provided by the Lenders has assisted in relieving the group’s liquidity pressures even though current liabilities exceed current assets by R1 358 million at 28 February 2021. In addition thereto, uncertainties surrounding the COVID-19 pandemic and contingent liabilities as noted in note 26, continue to indicate that a material uncertainty exists that may cast doubt on the group’s ability to continue as a going concern in the short term. However, having converted the short-term funding agreement with the Lenders to a term loan and on the basis of successfully implementing the Restructuring Plan, the directors consider it appropriate that the group’s results for the year be prepared on the going-concern basis.
These annual financial statements have been prepared using a combination of the historical cost and, where indicated, fair value basis of accounting and are consistent with prior financial years.
PREPARED IN ACCORDANCE WITH
International Financial Reporting Standards (IFRS), Financial Reporting Pronouncements as issued by the Financial Reporting Standards Council.
JSE Listings Requirements Companies Act, No. 71 of 2008
Going-concern principles
FUNCTIONAL AND PRESENTATION CURRENCY
South African Rand
ROUNDING POLICY
R’000 (thousand)
FOREIGN CURRENCY TRANSACTIONS
PROCEDURES FOLLOWED TO TRANSLATE TO PRESENTATION CURRENCY
In the group annual financial statements, transactions are translated into the respective functional currencies of group companies applying the following principles:
› Monetary assets and liabilities for each statement of financial position presented are translated at the closing rate at reporting date.
› Non-monetary assets and liabilities that are measured at fair value in a foreign currency are translated into the functional currency at the exchange rate when the fair value was determined. Non-monetary items that are measured based on historical cost in a foreign currency are translated at the exchange rate at the date of the transaction. Foreign currency differences are generally recognised in profit or loss.
› Income and expenses for each statement of profit or loss and other comprehensive income are translated at exchange rates at the dates of the transactions or, where exchange differences did not fluctuate significantly, at the average exchange rates for the period.
NOTES TO THE ANNUAL FINANCIAL STATEMENTS continued
FOR THE YEAR ENDED 28 FEBRUARY
STEFANUTTI STOCKS GROUP Consolidated annual financial statements 202178

SIGNIFICANT ACCOUNTING POLICIESIncluded below is a summary of the significant accounting policies applicable to the group annual financial statements. These accounting policies include only the areas in IFRS where elections have been made or policy choices exercised (including the choice or election made) as well as measurement criteria applied. The accounting policies also include information where it will assist users in understanding how transactions, other events and conditions are reflected in reported financial performance and financial position and was included based on the materiality as determined by management.
REFERENCE TABLE BETWEEN SIGNIFICANT ACCOUNTING POLICIES AND NOTES
SIGNIFICANT ACCOUNTING POLICIES NOTES AND ACCOUNTING POLICY (AP)
Construction contracts AP 1
Revenue 3
Contract assets and liabilities 3, 15, 16
Provisions (including onerous contracts provisions) 22
Investment income 5
Other income and EBITDA 4
Employee benefits AP 2
Short-term benefits 4
Post-employment benefits 4
Long-term employment benefits 4, 19
Group and Company accounting AP 3
Translation of foreign operations Statement of changes in equity Statement of profit or loss and other comprehensive income
Subsidiaries —
Equity-accounted investees and joint operations 10, 11
Operating assets AP 4
Property, plant and equipment 9
Goodwill and intangible assets 12
Inventories 14
Lease liabilities 20
Financial instruments AP 5
Financial assets 15, 16, 17, 27
Impairment 15, 16, 27
Financial liabilities 15, 17, 20, 27
Non-current assets held for sale AP 6
Capital and reserves AP 7
Share capital 18
Reserves Statement of changes in equity
Treasury shares Statement of changes in equity, 8, 18
Consolidated annual financial statements 2021 STEFANUTTI STOCKS GROUP 79
ACCOUNTING POLICIESFOR THE YEAR ENDED 28 FEBRUARY

1. CONSTRUCTION CONTRACTS
CONTRACT REVENUE FROM CONTRACTS WITH CUSTOMERS
RECOGNITION MEASUREMENT
Con
trac
t re
venu
e
Within South Africa
South Africa Stage of completion based on surveys of measured work performed
When surveys of work performed cannot be determined reliably, revenue is recognised only to the extent of the expenses recognised that are recoverable
Based on:
› Transaction price received or receivable
› Including variations and claims
› Excluding Value added tax
Outside South Africa
Rest of Africa as well as United Arab Emirates
All transactions are concluded at arm’s length, therefore the transaction price is considered to reflect the fair value.
REVENUE TYPE INCLUDES RECOGNITION
TRANSFER OF CONTROL MEASUREMENT
DURATION OF CONTRACT
Con
stru
ctio
n &
Min
ing
Roads, earthworks and pipelines
› Bulk earthworks
› Road construction, maintenance and rehabilitations
› Crushing and screening
› Agricultural land preparation and infrastructural development
› Large diameter welded steel pipe installation
Stage of completion based on surveys of work performed — Measured work performed
Over time as the construction works progress and enhances the asset which is controlled by the customer
Transaction price
› Longer than 12 months
› Shorter than 12 months
Mining services › Bulk materials handling
› Design, construction, operations and maintenance of tailing storage facilities
› Hydraulic mining
Stage of completion based on surveys of work performed — Measured work performed
Over time as the construction works progress and enhances the asset which is controlled by the customer
Transaction price
› Longer than 12 months
Civil works › Caisson floating and installations
› Civils works, bridges and transport infrastructure
› Concrete rehabilitation
› Marine and shipyard infrastructure
Stage of completion based on surveys of work performed — Measured work performed
Over time as the construction works progress and enhances the asset which is controlled by the customer
Transaction price
› Longer than 12 months
› Shorter than 12 months
Geotechnical services
› Geotechnical construction piling and lateral support
› Rock anchors and shotcrete
Stage of completion based on surveys of work performed — Measured work performed
Over time as the construction works progress and enhances the asset which is controlled by the customer
Transaction price
› Shorter than 12 months
General contracting
› Dam construction
› Balance of plant infrastructure for renewable energy projects
Stage of completion based on surveys of work performed — Measured work performed
Over time as the construction works progress and enhances the asset which is controlled by the customer
Transaction price
› Longer than 12 months
› Shorter than 12 months
STEFANUTTI STOCKS GROUP Consolidated annual financial statements 202180
ACCOUNTING POLICIES continued
FOR THE YEAR ENDED 28 FEBRUARY

1. CONSTRUCTION CONTRACTS CONTINUED
REVENUE TYPE INCLUDES RECOGNITION
TRANSFER OF CONTROL MEASUREMENT
DURATION OF CONTRACT
Bui
ldin
g
Non-residential › Airport buildings
› Commercial buildings
› Education facilities
› Hospitals and medical facilities
› Industrial warehouses, factories and distribution centres
Stage of completion based on surveys of work performed — Measured work performed
Over time as the construction works progress and enhances the asset which is controlled by the customer
Transaction price
› Longer than 12 months
› Shorter than 12 months
Residential › Affordable housing
› Residential developments
Stage of completion based on surveys of work performed — Measured work performed
Over time if the group is not the developer and does not have the ownership of the development
Transaction price
› Longer than 12 months
› Shorter than 12 months
Transfer of control at end of period upon issue of completion certificate or registration if the group is the developer and owns the development
Mec
hani
cal &
El
ectr
ical
Mechanical Electrical Oil & Gas
› Control system installation
› Design and build high rate water clarifier plants
› Field instrumentation installation
› Pipe spool fabrication
› Petrochemical shutdown maintenance work
Stage of completion based on surveys of work performed — Measured work performed
Over time as the construction works progress and enhances the asset which is controlled by the customer
Transaction price
› Shorter than 12 months
Stefanutti Stocks is a construction group operating throughout South Africa and Sub-Saharan Africa and the United Arab Emirates with multi-disciplinary expertise including concrete structures, marine construction, piling and geotechnical services, roads and earthworks, bulk pipelines, surface mining related services, all forms of building works, including affordable housing, and mechanical and electrical installation and construction.
Revenue from contracts with customers is recognised when control of the goods or services are transferred to the customer at an amount that reflects the consideration to which the group expects to be entitled in exchange for those goods or services. Payment terms for services delivered are normally within 30 to 60 days.
Consolidated annual financial statements 2021 STEFANUTTI STOCKS GROUP 81
ACCOUNTING POLICIES continued
FOR THE YEAR ENDED 28 FEBRUARY

1. CONSTRUCTION CONTRACTS CONTINUED
COSTS VARIABLE CONSIDERATION
SIGNIFICANT FINANCING COMPONENT
SIGNIFICANT FINANCING COMPONENT
COSTS INCURRED SHORTER THAN 12 MONTHS LONGER THAN 12 MONTHS
All costs incurred to obtain a contract are expensed immediately and recognised in profit or loss as it is not recoverable.
COSTS TO FULFIL
When management estimates, based on the cost of work performed to date in relation to the total work to be performed, that the total costs to be incurred to complete a contract will be in excess of the estimated total revenue from the contract, the full expected loss to be incurred is recognised immediately or any penalties arising from failure to fulfil it, whichever is the least net cost.
The group estimates the amount of variable consideration, to which it would be entitled to. Variable consideration is constrained to the extent that it is highly probable that a significant reversal of revenue will not occur.
Certain contracts include penalty provisions, claims and a change of scope of work to be performed which constitutes variable consideration. Variable consideration is measured either at the most likely outcome method or expected value method and is considered at each reporting date. The most appropriate method is selected for each contract and applied consistently throughout the contract term. In most instances the most likely outcome method is used as there are only a few possible outcomes.
Advances received on contracts with customers are generally shorter than 12 months, and therefore the group does not adjust the consideration for the effects of a significant financing component, since the group applies the practical expedient.
In instances where advances received are utilised in a period longer than 12 months, the group adjusts the consideration for the effects of a significant financing component by using an applicable interest rate. Contract revenue is adjusted with this financing component and accounted for as finance costs paid.
WARRANTIES AND RELATED OBLIGATIONS
PERFORMANCE GUARANTEES
ADVANCE PAYMENT GUARANTEES
SUBCONTRACTOR RETENTIONS
DEFECTS LIABILITIES
TENDER GUARANTEES
Performance guarantees are issued to a client to guarantee the quality and performance of the construction services rendered in the event that there is default in terms of the contract.
Advance payment guarantees are issued in lieu of an advance received and reduces over the period of the contract as the advance payment is utilised.
Specific amounts are withheld on each payment made to subcontractors, and either repaid when the defects liability period comes to an end or when payment is received from the client.
Defects liabilities provide for warranties relating to defects arising subsequent to the completion of the contract.
Tender guarantees are issued as guarantee that should the project tendered for be awarded, the group would be in the position to execute the contract.
Performance guarantees are dependent on the nature, terms and timing of each specific contract.
Advance payment guarantees are dependent on the nature, terms and timing of each specific contract.
Retentions are dependent on the nature, terms and timing of each specific contract.
Defects liabilities are dependent on the nature, terms and timing of each specific contract.
Tender guarantees are dependent on the nature, terms and timing of each specific contract tendered on.
STEFANUTTI STOCKS GROUP Consolidated annual financial statements 202182
ACCOUNTING POLICIES continued
FOR THE YEAR ENDED 28 FEBRUARY

1. CONSTRUCTION CONTRACTS CONTINUED
CONTRACT ASSETS AND LIABILITIES
CONTRACT ASSETS MEASUREMENT
Contracts in progress Cost plus profit recognised to date less cash received or receivable less any provision for losses.
Impairment: refer to accounting policy 5: Financial Instruments
CONTRACT LIABILITIES MEASUREMENT
Excess billings over work done The amount by which progress billings exceed costs incurred plus recognised profit less recognised losses.
Provisions Estimates are made of the expected cash outflows relating to contracts.
Onerous contracts
In the instance where the group has a contract that is onerous, the present obligation under the contract is recognised and measured as a provision.
An onerous contract is a contract under which the unavoidable costs of meeting the obligations under the contract exceed the economic benefits expected to be received under it. The unavoidable costs under a contract reflect the least net cost of exiting from the contract, which is the lower of the cost of fulfilling it and any compensation or penalties arising from failure to fulfil it.
OTHER INCOME AND EBITDA
INCLUDES RECOGNITION MEASUREMENT
Other income Amounts both received and accrued
Over time as services are rendered Fair value
Management fee Amounts both received and accrued
Over time as the group provides the management services and the customer simultaneously consumes the benefit
Fair value
Rental income Amounts both received and accrued
Rental income from leases are recognised as operating leases
Over period of lease term on a straight-line basis
Fair value
EBITDAEBITDA comprises earnings before interest, share of profits of equity-accounted investees, taxation, depreciation, amortisation and impairment.
INVESTMENT INCOME
INCLUDES RECOGNITION MEASUREMENT
Investment income Amounts both received and accrued
Time proportion basis Effective interest method
2. EMPLOYEE BENEFITSStefanutti Stocks identifies three types of employee benefits which are accounted for in accordance with IAS 19.
SHORT-TERM BENEFITS
Includes Basic salary, paid vacation leave, sick leave, bonuses, medical aid, death and disability cover.
Accounting treatment The expected cost of bonus payments is recognised as an expense when there is a legal or constructive obligation to make such payments as a result of past performance.
The expected cost of accrued leave is recognised as the employees render services that increase their entitlement or, in the case of non-accumulating leave, when the absence occurs. Accrued leave is measured as the amount that the company expects to pay as a result of unused entitlement that has accumulated to the employees at the reporting date.
Consolidated annual financial statements 2021 STEFANUTTI STOCKS GROUP 83
ACCOUNTING POLICIES continued
FOR THE YEAR ENDED 28 FEBRUARY

2. EMPLOYEE BENEFITS CONTINUED
POST-EMPLOYMENT BENEFITS
Defined contribution plan The group contributes to a defined contribution plan. The group requires monthly-paid employees to partake in a group retirement fund and hourly-paid employees in the relevant industry funds. The group contributes a monthly contribution to these funds and does not bear any further responsibility thereafter. These funds are managed by various portfolio managers and are governed by the Pension Funds Act, No. 24 of 1956.
Accounting treatment The payments are charged as expenses when the related services are provided.
LONG-TERM EMPLOYMENT BENEFITS
Forfeitable share plan The group operates a profit-sharing bonus scheme whereby the consideration for services received from directors and senior employees is paid through a performance-based bonus that is used to purchase a variable number of shares in the open market. The shares may not be disposed of or otherwise encumbered during the vesting period of three years. All risks and benefits associated with the shares transfer to the employee on award of the bonus.
Accounting treatment The bonus cost is expensed over the vesting period in profit and loss.
3. GROUP AND COMPANY ACCOUNTING
TRANSLATION OF FOREIGN OPERATIONS
PROCEDURES FOLLOWED TO TRANSLATE TO PRESENTATION CURRENCY
The assets and liabilities of foreign operations, including goodwill and fair value adjustments arising on acquisition, are translated into Rand at the exchange rates at the reporting date. The income and expenses of foreign operations are translated into Rand at the exchange rates at the dates of the transactions.
The difference in translation between these rates is recognised in the foreign currency translation reserve.
SUBSIDIARIES
Subsidiaries are entities controlled by the group.
The group also considers the following facts and circumstances in assessing whether it has power over an entity:
a) Rights arising from contractual arrangements
b) The group’s voting rights and potential voting rights
c) Whether the group is exposed to or has rights to, variable returns from its involvement with the entity and has the ability to affect those returns through its power over the entity
RECOGNITION AND MEASUREMENT
Subsidiaries are consolidated from the date of acquisition, which is the date on which the group obtains control of the subsidiary and continue to be consolidated until the date that control ceases.
The annual financial statements of the subsidiaries are prepared using consistent accounting policies and prepared for the same reporting period as the parent company.
INTERCOMPANY TRANSACTIONS
All intergroup balances, transactions, income and expenses are eliminated in full in the consolidated annual financial statements.
CONSOLIDATED STRUCTURED ENTITIES
Consolidated structured entities include share incentive trusts set up for the benefit of the group’s employees. Such trusts are consolidated in the group results as the group effectively controls these trusts through the specific mechanisms that were established when the trusts were formed. Shares issued to or held by these trusts are treated as treasury shares until such time as participants pay for or take delivery of such shares.
STEFANUTTI STOCKS GROUP Consolidated annual financial statements 202184
ACCOUNTING POLICIES continued
FOR THE YEAR ENDED 28 FEBRUARY

3. GROUP ACCOUNTING CONTINUED
EQUITY-ACCOUNTED INVESTEES AND JOINT OPERATIONS
ASSOCIATES AND JOINT VENTURES JOINT OPERATIONS
INITIAL RECOGNITION AND MEASUREMENT
Associates are deemed to be material if the interest in the equity-accounted investee (cost and long-term loans) exceed 2,5% of the non-current asset value of the group.
Associates and joint ventures are accounted for using the equity method. Interest in equity-accounted investees are initially recognised at cost. Investor’s interest includes any equity contributions, which are made at the date of acquisition, equity- accounted losses which are recognised against the cost of the investment, as well as loans which will in all likelihood not be settled in the near future. Goodwill recognised on the acquisition of a joint venture and associate company is included in the cost of the investment. In instances where the year-ends of equity-accounted investees differ from that of the group, monthly management accounts are used to ensure information is reported coterminous with the group’s year-end.
Results of joint operations are included when two or more parties combine their operations, resources and expertise in order to manufacture/build a particular product.
DERECOGNITION
On the date that the equity-accounted investments are disposed of, the entity ceases to equity account the investments.
When the combined operation ceases, the group’s share of the assets and liabilities held jointly as well as its share of profits or losses is derecognised.
SUBSEQUENT MEASUREMENT
Subsequent to initial recognition, the group recognises its share of the profit or loss and other comprehensive income, until the date on which joint control ceases.
The group has rights to the assets and obligations for its liabilities in a joint operation, and therefore recognises in relation to its interest in a joint operation the following:
a) its assets, including its share of any assets held jointly;
b) its liabilities, including its share of any liabilities incurred jointly;
c) its share of the revenue from the sale of the output by the joint operation; and
d) its expenses, including its share of any expenses incurred jointly.
IMPAIRMENT
The group assesses whether there is any indication that an equity-accounted investee may be impaired and its value-in-use is less than the carrying amount at each reporting date. An impairment is recognised when there is objective evidence that the equity-accounted investment is impaired and its value-in-use is less than the carrying amount. Impairment losses are deducted from the carrying amount of these investments. Any impairment is calculated after application of the equity method.
Losses resulting from transactions with equity-accounted investees are recognised only to the extent of the investors’ interest which include cost plus loans which will in all likelihood not be settled in the near future.
IMPAIRMENT
Recognised assets are impaired in line with group policy for similar type of assets
Consolidated annual financial statements 2021 STEFANUTTI STOCKS GROUP 85
ACCOUNTING POLICIES continued
FOR THE YEAR ENDED 28 FEBRUARY

4. OPERATING ASSETS
PROPERTY, PLANT AND EQUIPMENT
OWNED ASSETS
CATEGORIESINITIAL MEASUREMENT
SUBSEQUENT MEASUREMENT
DEPRECIATION METHOD AND PERIOD IMPAIRMENT
Land and buildings Initially recognised at cost, plus any initial direct costs incurred and an estimate of costs to dismantle and remove the underlying asset or restore the underlying asset or the site on which it is located.
Carried at the revalued amount (fair value less depreciation and accumulated impairment losses).
Land is not depreciated, all other assets are depreciated on a straight-line basis over their useful life.
Assets are tested for impairment, when there is an indication that it may be impaired, by determining the recoverable amount of the assets either individually or at the cash generating unit level.Plant and equipment
Transport and motor vehicles
Furniture, fittings, office and computer equipment
Cost less accumulated depreciation and accumulated impairment losses.
The revaluation of Land and Buildings are recognised in other comprehensive income and against a revaluation reserve in the statement of changes in equity. The revaluation reserve is recycled to retained earnings upon disposal (but not annual usage) of the Land and Buildings to which the revaluation reserve pertains.
RIGHT-OF-USE ASSETS
CATEGORIESINITIAL MEASUREMENT
SUBSEQUENT MEASUREMENT
DEPRECIATION METHOD AND PERIOD
Land and buildings Right-of-use asset is initially measured at cost, which comprises the initial amount of the lease liability adjusted for any lease payments made at or before the commencement date, plus any initial direct costs incurred and an estimate of costs to dismantle and remove the underlying asset or restore the underlying asset or the site on which it is located, less any lease incentives received.
Cost less accumulated depreciation and accumulated impairment losses.
Right-of-use assets from instalment sales are depreciated over their expected useful lives on the same basis as owned assets.
Right-of-use assets from capitalised operating leases are depreciated over the useful life of the asset or term of lease, whichever is shorter.
Plant and equipment
Transport and motor vehicles
Furniture, fittings, office and computer equipment
GOODWILL AND INTANGIBLE ASSETS
INITIAL MEASUREMENT AND RECOGNITION
SUBSEQUENT MEASUREMENT
AMORTISATION METHOD AND PERIOD IMPAIRMENT
Goo
dw
ill
Measured at fair value
As at the date of the business combination
Measured at cost if the fair value at date of acquisition cannot be determined
Cost less accumulated impairment
Goodwill is not amortised but is assessed for impairment annually or more frequently if events or changes in circumstances indicate that the carrying amount may be impaired
Management uses the value-in-use method to determine the recoverable amount of goodwill and when there are impairment indicators for intangible assets as there is no active market for these assets
STEFANUTTI STOCKS GROUP Consolidated annual financial statements 202186
ACCOUNTING POLICIES continued
FOR THE YEAR ENDED 28 FEBRUARY

4. OPERATING ASSETS CONTINUED
INTANGIBLE ASSETS
INITIAL MEASUREMENT AND RECOGNITION
SUBSEQUENT MEASUREMENT
AMORTISATION METHOD AND PERIOD IMPAIRMENT
Cus
tom
er
rela
ted
Measured at cost including transaction cost
Cost less accumulated amortisation and impairment
Amortised on the straight-line method over the period of the contract.
Management uses the value-in-use method to determine when there are impairment indicators for intangible assets as there is no active market for these assets
INVENTORIES
INITIAL MEASUREMENT AND RECOGNITION
Inventories include consumables (such as fuel, tyres, spares and stationery) and operational inventory. Operational inventory is inventory that will be used in the normal operating cycle. Inventories are stated at the lower of cost and net realisable value. Cost is determined on a weighted average basis and comprises the cost to purchase, cost of conversion and other costs incurred in bringing the inventories to their present location and condition. Net realisable value is the estimated selling price in the ordinary course of business, less estimated costs of completion and the estimated costs necessary to make the sale.
LEASE LIABILITIES
INITIAL MEASUREMENT AND RECOGNITION SUBSEQUENT MEASUREMENT
Lease liabilities are initially measured at the present value of the lease payments that are due at the commencement date, discounted using the group’s incremental borrowing rate.
At amortised cost. It is remeasured when there is a change in future lease payments arising from a change in term or if the group changes its assessment on whether it will exercise a purchase, extension or termination option at the end of the contract.
When the lease liability is remeasured, a corresponding adjustment is made to the carrying amount of the right-of-use asset, or is recorded in profit or loss if the carrying amount of the right-of-use asset has been reduced to zero.
SHORT-TERM LEASES AND LEASES OF LOW-VALUE ASSETSINITIAL MEASUREMENT AND RECOGNITION
The group has elected not to recognise a right-of-use asset and corresponding lease liability for short-term leases that have a lease term of 12 months or less and leases of low-value assets. Low-value assets are defined as assets with a new cost of R250 000 and less. Lease payments associated are recognised in profit or loss on a straight-line basis over the term of the relevant lease.
5. FINANCIAL INSTRUMENTSFinancial assets, financial liabilities and equity instruments are recognised in the group’s statement of financial position when the group becomes a party to the controlled provisions of the instrument.
FINANCIAL ASSETS
CLASSIFICATIONINSTRUMENTS INCLUDED IN THE CLASSIFICATION
INITIAL MEASUREMENT
SUBSEQUENT MEASUREMENT
Amortised cost Trade and other receivables (excluding Value Added Tax and Prepayments) and cash and cash equivalents.
Trade receivables are measured at their transaction price if the trade receivables do not contain a significant financing component.
Other financials assets are measured at fair value plus direct transaction costs.
Amortised costs using the effective interest rate method, less expected credit loss.
Consolidated annual financial statements 2021 STEFANUTTI STOCKS GROUP 87
ACCOUNTING POLICIES continued
FOR THE YEAR ENDED 28 FEBRUARY

5. FINANCIAL INSTRUMENTS CONTINUED
IMPAIRMENT
Expected credit loss model
TRADE AND OTHER RECEIVABLES AND CONTRACT ASSETSThe group uses an allowance account to recognise credit losses on contract assets and trade and other receivables. The group applies its impairment model as follows:
EXPECTED CREDIT LOSS MODEL (ECL) — TRADE AND OTHER RECEIVABLES AND CONTRACT ASSETS
The group applies the simplified approach of recognising lifetime ECLs over the lifetime of the trade receivables and contract assets. The group applies a matrix in measuring the expected credit loss, based on general economic conditions and an assessment of both current and future conditions.
Trade receivables are written off when there is no reasonable expectation of recovery. Indicators that there is no reasonable expectation of recovery include, amongst others, the failure of a debtor to engage in a repayment plan with the entity, failure to make contractual payments for a period of greater than 120 days past due and when external information such as probable insolvency or significant difficulties indicates that it is unlikely to receive the outstanding contractual amounts in full. Any amount written off is only performed after considering any collateral held.
Financial assets written off may still be subject to enforcement activities under the group’s recovery procedures, taking into account legal advice where appropriate. Any recoveries made are recognised in profit or loss in operating expenses.
The group applies the general approach of recognising ECL’s on other receivables by assessing, at each reporting period, whether there has been a significant increase in credit risk since initial recognition. Where there is no significant increase in credit risk, the group provides for a 12-month ECL. Where there is a significant increase in credit risk, a lifetime ECL is calculated.
Impairment allowances are deducted from the carrying amounts of trade and other receivables and contract assets.
FINANCIAL LIABILITIES
CLASSIFICATIONINSTRUMENTS INCLUDED IN THE CLASSIFICATION INITIAL MEASUREMENT SUBSEQUENT MEASUREMENT
Amortised cost Other liabilities, trade and other payables, including retention creditors and subcontractors, excess billings over work done and bank overdrafts.
Fair value plus direct transaction costs. Amortised costs using the effective interest method.
6. NON-CURRENT ASSETS HELD FOR SALE AND DISCONTINUED OPERATIONSNon-current assets (or disposal groups) are classified as held for sale if their carrying amount will be recovered principally through a sale transaction rather than through continuing use and a sale is considered highly probable.
A discontinued operation is a component of the entity that has been disposed of or is classified as held for sale and that represents a separate major line of business or geographical area of operations, is part of a single co-ordinated plan to dispose of such a line of business or area of operations, or is a subsidiary acquired exclusively with a view to resale. The results of discontinued operations are presented separately in the statement of profit or loss and other comprehensive income.
Non-current assets classified as held for sale and the assets of a disposal group classified as held for sale are presented separately from the other assets in the statement of financial position. The liabilities of a disposal group classified as held for sale are presented separately from other liabilities in the statement of financial position.
INITIAL MEASUREMENT AND RECOGNITION DEPRECIATION AND AMORTISATION IMPAIRMENT/GAIN
Measured at the lower of carrying value and fair value less costs to sell, except for deferred tax assets, assets arising from employee benefits and financial assets.
Amortisation and depreciations ceases when an asset is classified as held for sale.
An impairment loss is recognised for any initial or subsequent write-down of the asset (or disposal group) to fair value less costs to sell. A gain is recognised for any subsequent increases in fair value less costs to sell of an asset (or disposal group), but not in excess of any cumulative impairment loss previously recognised.
STEFANUTTI STOCKS GROUP Consolidated annual financial statements 202188
ACCOUNTING POLICIES continued
FOR THE YEAR ENDED 28 FEBRUARY

7. CAPITAL AND RESERVES
SHARE CAPITAL
Share capital issued by the company is recorded at the proceeds received, net of issue costs.
RESERVES
Foreign currency translation reserve comprises the translation effect of foreign subsidiaries and joint arrangements to the reporting currency.
Revaluation surplus reserve comprises the revaluation of land and buildings.
Legal reserve comprise a percentage provided as per legislative requirements pertaining to a foreign subsidiary.
TREASURY SHARES
When shares are held in the group, through subsidiary companies, reducing the group’s share capital, those equity instruments, held at cost (treasury shares), are presented as a deduction against the group’s equity. No gain or loss is recognised in profit or loss. The share capital is reduced for the par value of the shares and the balance against the share premium.
Consolidated annual financial statements 2021 STEFANUTTI STOCKS GROUP 89
ACCOUNTING POLICIES continued
FOR THE YEAR ENDED 28 FEBRUARY

NEW ACCOUNTING PRONOUNCEMENTS
STANDARDS AND INTERPRETATIONS EFFECTIVE AND ADOPTED IN THE CURRENT YEARThe following standards became effective during the current year and have no effect on the financial statements of the company as at year-end:
› IFRS 3 Business Combinations — Amendments to definition of a business.
› The Conceptual Framework for Financial Reporting — the revised conceptual framework is not a standard, but provides updated concepts, definitions and recognition criteria for assets and liabilities and clarifies some important concepts.
› IAS 1 Presentation of Financial Statements and IAS 8 Accounting Policies, Changes in Accounting Estimates and Errors — clarifies definition of materiality.
› Interest Rate Benchmark reform — Phase 1 — Amendments to IFRS 9, IAS 39 and IFRS 7 — provides relief from the potential effects on hedge accounting due to the uncertainties caused by interest rate benchmark reform.
STANDARDS AND INTERPRETATIONS ISSUED AND NOT YET EFFECTIVEThe company has chosen not to early adopt the following Standards and Interpretations, which have been published and are mandatory for the group’s accounting periods beginning on or after 1 March 2021 or later periods.
ACCOUNTING STANDARD/INTERPRETATION TYPE
EFFECTIVE DATE
IMPACT ON THE FINANCIAL STATEMENTS
IFRS 16: LEASES COVID-19-RELATED RENT CONCESSIONSThis amendment affects lessees only and makes it easier to account for Covid-19-related rent concessions e.g. rent holidays and temporary rent reductions.
The amendment exempts lessees from having to consider individual lease contracts to determine whether rent concessions occurring as a direct consequence of the Covid-19 pandemic are lease modifications, allows lessees to account for such rent concessions as if they were not lease modifications and applies to Covid-19-related rent concessions that reduce lease payments due on or before 30 June 2021.
Amendment 1 June 2020 (can be applied immediately in financial statements — interim or annual — not yet authorised for issue)
No expected change as there were no rent concessions granted.
EXTENSION OF PRACTICAL EXPEDIENT (LESSEES ONLY)Extension of rental concession relief — relief will now extend to 30 June 2022.
Amendment 1 April 2021 No expected change as there were no rent concessions granted.
LEASE INCENTIVESRemoves the lessor’s reimbursement of leasehold improvements from the example to resolve any potential confusion regarding the treatment of lease incentives.
Amendment No effective date as it is an illustrative example
No expected change as there are no lease incentives for leasehold improvements.
INTEREST RATE BENCHMARK REFORM — PHASE 2 — AMENDMENTS TO IFRS 9, IAS 39, IFRS 7, IFRS 4 AND IFRS 16
INTEREST RATE BENCHMARKThis amendment provides temporary relief to address financial reporting effects when an interbank offered rate (IBOR) is replaced with an alternative nearly risk-free interest rate (RFR) (‘IBOR reform’) including:
› Contractual and cash flow changes — to be treated as changes due to a floating rate of interest.
› Changes to hedge designations and documentation — do not result in the discontinuation of the hedge relationship.
› The ‘separately identifiable’ requirement - not required when a RFR instrument is designated as a hedge of a risk component.
› Additional disclosures required.
Amendment 1 January 2021 No expected impact as there are no loans that are linked to interbank offered rate (IBOR).
STEFANUTTI STOCKS GROUP Consolidated annual financial statements 202190
ACCOUNTING POLICIES continued
FOR THE YEAR ENDED 28 FEBRUARY

ACCOUNTING STANDARD/INTERPRETATION TYPE
EFFECTIVE DATE
IMPACT ON THE FINANCIAL STATEMENTS
IFRS 3: BUSINESS COMBINATIONS
REFERENCE TO THE CONCEPTUAL FRAMEWORKThis amendment updates reference to the 2018 Conceptual Framework, adds a requirement that transactions and other events within the scope of IAS 37 or IFRIC 21 must be accounted for per IAS 37 and IFRIC 21 to identify the liabilities assumed in a business combination and adds an explicit statement that an acquirer does not recognise contingent assets acquired in a business combination.
Amendment 1 January 2022 No expected change as such transactions are unlikely to occur. Changes to be assessed as and when such transactions take place.
IFRS 1: FIRST-TIME ADOPTION OF INTERNATIONAL FINANCIAL REPORTING STANDARDS
SUBSIDIARY AS A FIRST-TIME ADOPTERThis amendment relates to a subsidiary as a first-time adopter. A subsidiary is permitted to measure cumulative translation differences at transition date using the amounts reported by its parent, based on the parent’s transition date.
Amendment 1 January 2022 Not applicable to the company but will be considered for subsidiaries.
IFRS 9: FINANCIAL INSTRUMENTS
FEES IN THE ‘10 PER CENT’ TEST FOR DERECOGNITION OF FINANCIAL LIABILITIESThe amendment clarifies which fees must be applied in the application of the ‘10 per cent’ test when assessing whether to derecognise a financial liability. It specifies that only fees paid or received between the borrower and the lender, including those paid or received on the other’s behalf are to be included.
Amendment 1 January 2022 The amendment will be assessed for all modifications or exchanges of financial liabilities at the effective date.
IAS 16: PROPERTY, PLANT AND EQUIPMENT
PROCEEDS BEFORE INTENDED USEThe amendment prohibits the deduction of proceeds from selling items produced while bringing an asset into use from the cost of that asset. The entity must recognise the proceeds from sale, and the cost of producing those items, in profit or loss.
Amendment 1 January 2022 No expected impact as no such instances exist.
IAS 37: PROVISIONS, CONTINGENT LIABILITIES AND CONTINGENT ASSETS
ONEROUS CONTRACTS — COST OF FULFILLING A CONTRACTThe amendment specifies that the ‘cost of fulfilling’ a contract comprises the ‘costs that relate directly to the contract’. Costs that relate directly to a contract can either be incremental costs of fulfilling that contract (examples would be direct labour, materials) or an allocation of other costs that relate directly to fulfilling contracts (an example would be the allocation of the depreciation charge for an item of property, plant and equipment used in fulfilling the contract).
Amendment 1 January 2022 No expected change as standard is currently appropriately applied.
Consolidated annual financial statements 2021 STEFANUTTI STOCKS GROUP 91
ACCOUNTING POLICIES continued
FOR THE YEAR ENDED 28 FEBRUARY
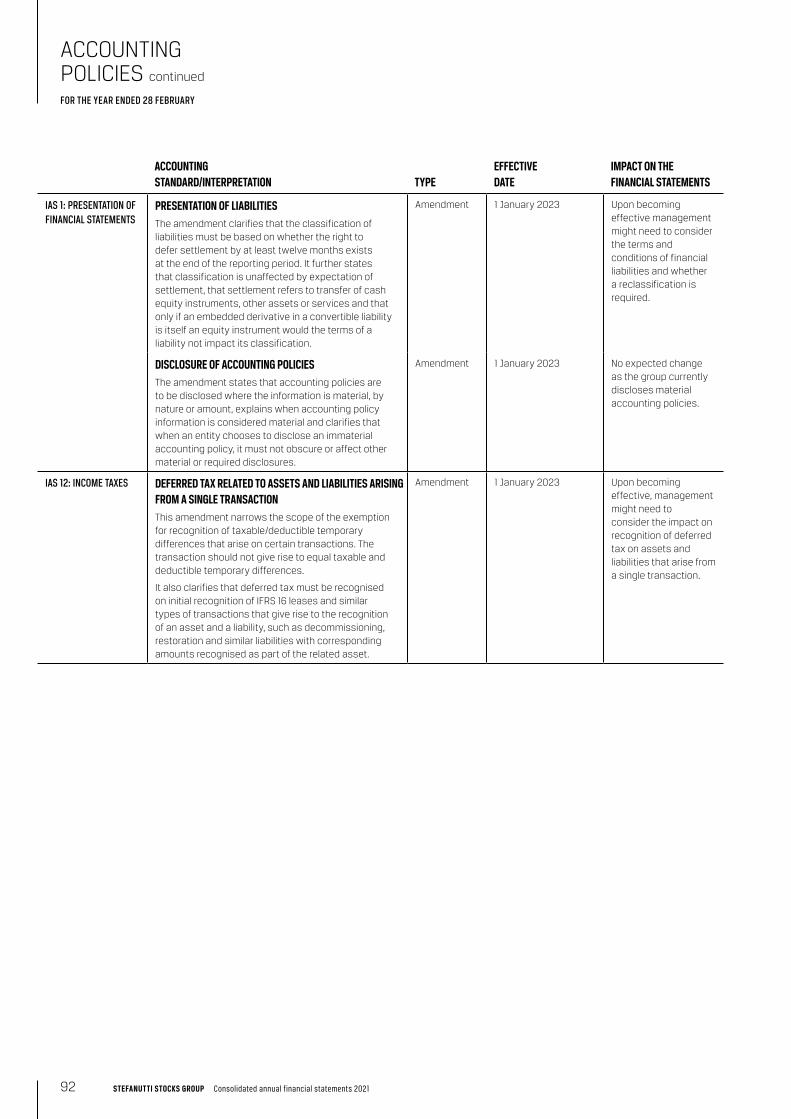
ACCOUNTING STANDARD/INTERPRETATION TYPE
EFFECTIVE DATE
IMPACT ON THE FINANCIAL STATEMENTS
IAS 1: PRESENTATION OF FINANCIAL STATEMENTS
PRESENTATION OF LIABILITIESThe amendment clarifies that the classification of liabilities must be based on whether the right to defer settlement by at least twelve months exists at the end of the reporting period. It further states that classification is unaffected by expectation of settlement, that settlement refers to transfer of cash equity instruments, other assets or services and that only if an embedded derivative in a convertible liability is itself an equity instrument would the terms of a liability not impact its classification.
Amendment 1 January 2023 Upon becoming effective management might need to consider the terms and conditions of financial liabilities and whether a reclassification is required.
DISCLOSURE OF ACCOUNTING POLICIESThe amendment states that accounting policies are to be disclosed where the information is material, by nature or amount, explains when accounting policy information is considered material and clarifies that when an entity chooses to disclose an immaterial accounting policy, it must not obscure or affect other material or required disclosures.
Amendment 1 January 2023 No expected change as the group currently discloses material accounting policies.
IAS 12: INCOME TAXES DEFERRED TAX RELATED TO ASSETS AND LIABILITIES ARISING FROM A SINGLE TRANSACTIONThis amendment narrows the scope of the exemption for recognition of taxable/deductible temporary differences that arise on certain transactions. The transaction should not give rise to equal taxable and deductible temporary differences.
It also clarifies that deferred tax must be recognised on initial recognition of IFRS 16 leases and similar types of transactions that give rise to the recognition of an asset and a liability, such as decommissioning, restoration and similar liabilities with corresponding amounts recognised as part of the related asset.
Amendment 1 January 2023 Upon becoming effective, management might need to consider the impact on recognition of deferred tax on assets and liabilities that arise from a single transaction.
STEFANUTTI STOCKS GROUP Consolidated annual financial statements 202192
ACCOUNTING POLICIES continued
FOR THE YEAR ENDED 28 FEBRUARY
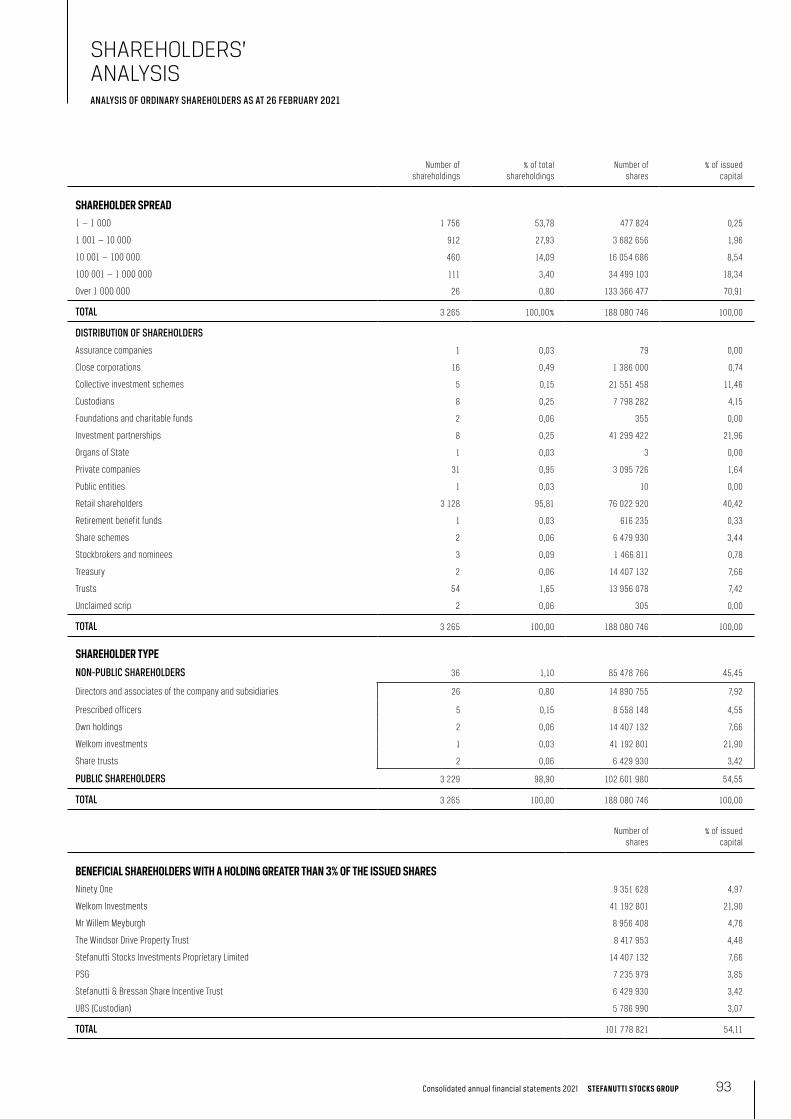
Number ofshareholdings
% of totalshareholdings
Number ofshares
% of issuedcapital
SHAREHOLDER SPREAD1 — 1 000 1 756 53,78 477 824 0,25
1 001 — 10 000 912 27,93 3 682 656 1,96
10 001 — 100 000 460 14,09 16 054 686 8,54
100 001 — 1 000 000 111 3,40 34 499 103 18,34
Over 1 000 000 26 0,80 133 366 477 70,91
TOTAL 3 265 100,00% 188 080 746 100,00
DISTRIBUTION OF SHAREHOLDERS
Assurance companies 1 0,03 79 0,00
Close corporations 16 0,49 1 386 000 0,74
Collective investment schemes 5 0,15 21 551 458 11,46
Custodians 8 0,25 7 798 282 4,15
Foundations and charitable funds 2 0,06 355 0,00
Investment partnerships 8 0,25 41 299 422 21,96
Organs of State 1 0,03 3 0,00
Private companies 31 0,95 3 095 726 1,64
Public entities 1 0,03 10 0,00
Retail shareholders 3 128 95,81 76 022 920 40,42
Retirement benefit funds 1 0,03 616 235 0,33
Share schemes 2 0,06 6 479 930 3,44
Stockbrokers and nominees 3 0,09 1 466 811 0,78
Treasury 2 0,06 14 407 132 7,66
Trusts 54 1,65 13 956 078 7,42
Unclaimed scrip 2 0,06 305 0,00
TOTAL 3 265 100,00 188 080 746 100,00
SHAREHOLDER TYPENON-PUBLIC SHAREHOLDERS 36 1,10 85 478 766 45,45
Directors and associates of the company and subsidiaries 26 0,80 14 890 755 7,92
Prescribed officers 5 0,15 8 558 148 4,55
Own holdings 2 0,06 14 407 132 7,66
Welkom investments 1 0,03 41 192 801 21,90
Share trusts 2 0,06 6 429 930 3,42
PUBLIC SHAREHOLDERS 3 229 98,90 102 601 980 54,55
TOTAL 3 265 100,00 188 080 746 100,00
Number ofshares
% of issuedcapital
BENEFICIAL SHAREHOLDERS WITH A HOLDING GREATER THAN 3% OF THE ISSUED SHARESNinety One 9 351 628 4,97
Welkom Investments 41 192 801 21,90
Mr Willem Meyburgh 8 956 408 4,76
The Windsor Drive Property Trust 8 417 953 4,48
Stefanutti Stocks Investments Proprietary Limited 14 407 132 7,66
PSG 7 235 979 3,85
Stefanutti & Bressan Share Incentive Trust 6 429 930 3,42
UBS (Custodian) 5 786 990 3,07
TOTAL 101 778 821 54,11
Consolidated annual financial statements 2021 STEFANUTTI STOCKS GROUP 93
SHAREHOLDERS’ ANALYSISANALYSIS OF ORDINARY SHAREHOLDERS AS AT 26 FEBRUARY 2021
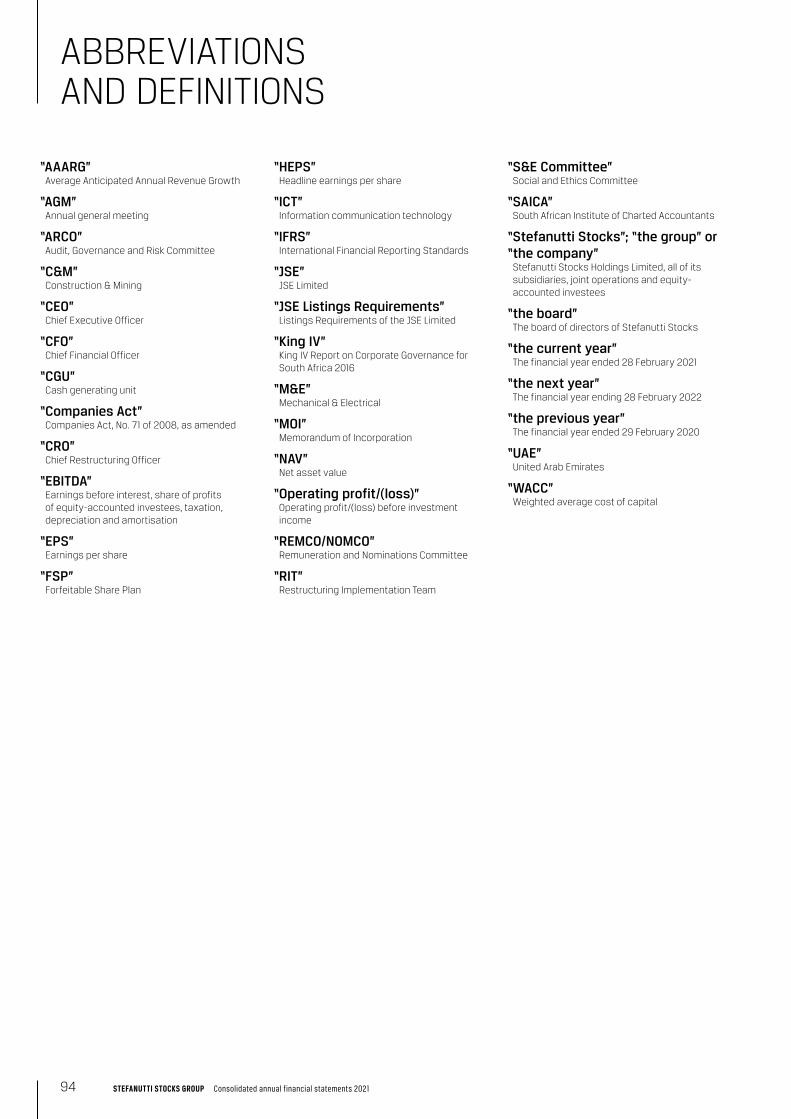
“AAARG”Average Anticipated Annual Revenue Growth
“AGM”Annual general meeting
“ARCO”Audit, Governance and Risk Committee
“C&M”Construction & Mining
“CEO”Chief Executive Officer
“CFO”Chief Financial Officer
“CGU”Cash generating unit
“Companies Act”Companies Act, No. 71 of 2008, as amended
“CRO”Chief Restructuring Officer
“EBITDA”Earnings before interest, share of profits of equity-accounted investees, taxation, depreciation and amortisation
“EPS”Earnings per share
“FSP”Forfeitable Share Plan
“S&E Committee”Social and Ethics Committee
“SAICA”South African Institute of Charted Accountants
“Stefanutti Stocks”; “the group” or “the company”
Stefanutti Stocks Holdings Limited, all of its subsidiaries, joint operations and equity-accounted investees
“the board”The board of directors of Stefanutti Stocks
“the current year”The financial year ended 28 February 2021
“the next year”The financial year ending 28 February 2022
“the previous year”The financial year ended 29 February 2020
“UAE”United Arab Emirates
“WACC”Weighted average cost of capital
“HEPS”Headline earnings per share
“ICT”Information communication technology
“IFRS”International Financial Reporting Standards
“JSE”JSE Limited
“JSE Listings Requirements”Listings Requirements of the JSE Limited
“King IV”King IV Report on Corporate Governance for South Africa 2016
“M&E”Mechanical & Electrical
“MOI”Memorandum of Incorporation
“NAV”Net asset value
“Operating profit/(loss)”Operating profit/(loss) before investment income
“REMCO/NOMCO”Remuneration and Nominations Committee
“RIT”Restructuring Implementation Team
STEFANUTTI STOCKS GROUP Consolidated annual financial statements 202194
ABBREVIATIONS AND DEFINITIONS

Company informationStefanutti Stocks Holdings Limited
Share code: SSK ISIN: ZAE000123766
JSE Sector: Construction Year-end: 28 February
Registration number1996/003767/06
Country of incorporationSouth Africa
Registered officeNo. 9 Palala Street, Protec Park, Cnr Zuurfontein Avenue and Oranjerivier Drive, Kempton Park, 1619
Postal addressPO Box 12394, Aston Manor, 1630
Telephone number+27 11 571 4300
DirectorsAs at 21 June 2021: ZJ Matlala * (Chairman); HJ Craig *; B Harie *; BP Silwanyana *; JM Poluta * (alternate to BP Silwanyana); DG Quinn *; RW Crawford (CEO); Y du Plessis (Acting CFO)
* Independent non-executive directors.
Company SecretaryWR Somerville
Co-Unity Offices, 18 Royal Street, Hermanus, Western Cape, 7200
AuditorsMazars
Mazars House, 54 Glenhove Road, Melrose Estate, 2196
PO Box 6697, Johannesburg, 2000
Telephone number: +27 11 547 4000
Attorneys
Webber Wentzel
90 Rivonia Road, Sandton, Johannesburg, 2196
PO Box 61771, Marshalltown, 2107
Telephone number: +27 11 530 5000
Transfer SecretariesComputershare Investor Services (Pty) Ltd
Rosebank Towers, 15 Biermann Avenue, Rosebank, 2196
PO Box 9000, Saxonwold, 2132
Telephone number: +27 11 370 5000
SponsorBridge Capital Advisors (Pty) Ltd
10 Eastwood Road, Dunkeld, 2196
PO Box 651010, Benmore, 2010
Telephone number: +27 11 268 6231
BankersAbsa Bank Limited
Banco Comercial e de Investimentos
Banco Internacional de Moçambique
Eswatini Bank Limited
First National Bank, a division of FirstRand Bank Limited
First National Bank Botswana Limited
First National Bank Eswatini, a division of FirstRand Bank Limited
Nedbank Limited
Nedbank Eswatini Limited
Société Générale Moçambique
Stanbic Bank Botswana Limited
Stanbic Bank Zambia Limited
Standard Bank Eswatini
United Bank for Africa Zambia Limited
Websitewww.stefanuttistocks.com
sigil design bureau
CORPORATE INFORMATION

www.stefanuttistocks.com