steel concrete reinforcing bar from mexico and turkey · steel concrete reinforcing bar from mexico...
TRANSCRIPT

U.S. International Trade CommissionPublication 4496 October 2014
Washington, DC 20436
Steel Concrete Reinforcing Bar from Mexico and Turkey
Investigation Nos. 701-TA-502 and 731-TA-1227 (Final)

U.S. International Trade Commission
COMMISSIONERS
Meredith M. Broadbent, Chairman Dean A. Pinkert, Vice Chairman
Irving A. Williamson David S. Johanson
F. Scott Kieff Rhonda K. Schmidtlein
Karen Laney
Staff assigned
Address all communications to Secretary to the Commission
United States International Trade Commission Washington, DC 20436
Acting Director of Operations
Alan Treat, Investigator and Industry Analyst Amelia Preece, Economist
David Boyland, Accountant Maureen Letostak, Statistician
Mara Alexander, Statistician Assistant John Henderson, Attorney
Douglas Corkran, Supervisory Investigator

U.S. International Trade CommissionWashington, DC 20436
www.usitc.gov
Publication 4496 October 2014
Steel Concrete Reinforcing Bar from Mexico and Turkey
Investigation Nos. 701-TA-502 and 731-TA-1227 (Final)


CONTENTS Page
i
Determinations ............................................................................................................................... 1
Views of the Commission ............................................................................................................... 3
Part I: Introduction ................................................................................................................ I‐1
Background ................................................................................................................................ I‐1
Statutory criteria and organization of the report ..................................................................... I‐2
Statutory criteria ................................................................................................................... I‐2
Organization of report ........................................................................................................... I‐3
Market summary ....................................................................................................................... I‐3
Summary data and data sources ............................................................................................... I‐4
Previous and related investigations .......................................................................................... I‐5
Previous and related global safeguard investigations .............................................................. I‐7
Nature and extent of subsidies and sales at LTFV .................................................................... I‐8
Nature of the subsidies ......................................................................................................... I‐8
Sales at LTFV .......................................................................................................................... I‐9
The subject merchandise ........................................................................................................ I‐10
Commerce’s scope .............................................................................................................. I‐10
Tariff treatment ................................................................................................................... I‐10
The product ............................................................................................................................. I‐11
Description and applications ............................................................................................... I‐11
Manufacturing processes .................................................................................................... I‐14
Domestic like product ............................................................................................................. I‐16
Part II: Conditions of competition in the U.S. market ............................................................ II‐1
U.S. market characteristics ....................................................................................................... II‐1
U.S. purchasers ......................................................................................................................... II‐1
Channels of distribution ........................................................................................................... II‐2
Purchasers’ major customers ............................................................................................... II‐6
Regional sales ....................................................................................................................... II‐8
Shipping distances ................................................................................................................ II‐9

CONTENTS Page
ii
Part II: Conditions of competition in the U.S. market‐‐Continued ..............................................
Supply and demand considerations ......................................................................................... II‐9
U.S. supply ............................................................................................................................ II‐9
U.S. demand ....................................................................................................................... II‐13
Substitutability issues ............................................................................................................. II‐18
Lead times .......................................................................................................................... II‐18
Knowledge of country sources ........................................................................................... II‐19
Factors affecting purchasing decisions............................................................................... II‐19
Comparisons of domestic products, subject imports, and nonsubject imports ................ II‐25
Comparison of U.S.‐produced and imported rebar ........................................................... II‐28
Elasticity estimates ................................................................................................................. II‐30
U.S. supply elasticity ........................................................................................................... II‐30
U.S. demand elasticity ........................................................................................................ II‐31
Substitution elasticity ......................................................................................................... II‐31
Part III: U.S. producers’ production, shipments, and employment ....................................... III‐1
U.S. producers ......................................................................................................................... III‐1
U.S. production, capacity, and capacity utilization ................................................................. III‐4
Alternative products ............................................................................................................ III‐4
U.S. producers’ U.S. shipments and exports ........................................................................... III‐6
U.S. producers’ inventories ..................................................................................................... III‐8
U.S. producers’ imports and purchases .................................................................................. III‐9
U.S. employment, wages, and productivity ............................................................................ III‐9
Part IV: U.S. imports, apparent U.S. consumption, and market shares ................................ IV‐1
U.S. importers.......................................................................................................................... IV‐1
U.S. imports ............................................................................................................................. IV‐2
Critical circumstances .............................................................................................................. IV‐6
Negligibility .............................................................................................................................. IV‐9
Cumulation considerations ..................................................................................................... IV‐9

CONTENTS Page
iii
Part IV: U.S. imports, apparent consumption, and market shares‐‐Continued ...........................
Fungibility ............................................................................................................................ IV‐9
Presence in the market ..................................................................................................... IV‐13
Geographical markets ....................................................................................................... IV‐16
Apparent U.S. consumption .................................................................................................. IV‐17
U.S. market shares ................................................................................................................ IV‐17
Ratio of imports to U.S. production ...................................................................................... IV‐20
Part V: Pricing data ............................................................................................................... V‐1
Factors affecting prices ............................................................................................................ V‐1
Raw material costs ............................................................................................................... V‐1
U.S. inland transportation costs ........................................................................................... V‐2
Pricing practices ....................................................................................................................... V‐3
Pricing methods .................................................................................................................... V‐3
Sales terms and discounts .................................................................................................... V‐4
Independent Steel Alliance................................................................................................... V‐5
Purchases from related fabricators ...................................................................................... V‐6
Price leadership .................................................................................................................... V‐6
Price data .................................................................................................................................. V‐9
Price trends ......................................................................................................................... V‐17
Price comparisons .............................................................................................................. V‐19
Lost sales and lost revenue .................................................................................................... V‐19
Part VI: Financial experience of U.S. producers .................................................................... VI‐1
Background .............................................................................................................................. VI‐1
Operations on rebar ................................................................................................................ VI‐2
Revenue ............................................................................................................................... VI‐6
Cost of goods sold and gross profit ..................................................................................... VI‐6
SG&A expenses and operating income or (loss) ................................................................. VI‐8
Capital expenditures and research and development expenses ............................................ VI‐9

CONTENTS Page
iv
Part VI: Financial experience of U.S. producers‐‐Continued .......................................................
Capital and investment ........................................................................................................... VI‐9
Actual negative effects ........................................................................................................ VI‐9
Anticipated negative effects ................................................................................................ VI‐9
Part VII: Threat considerations and information on nonsubject countries .......................... VII‐1
The industry in Mexico ........................................................................................................... VII‐2
Operations on rebar ........................................................................................................... VII‐4
Alternative products ........................................................................................................... VII‐5
The industry in Turkey ............................................................................................................ VII‐6
Operations on rebar ........................................................................................................... VII‐7
Alternative products ........................................................................................................... VII‐8
Subject countries combined ................................................................................................... VII‐8
U.S. inventories of imported merchandise ............................................................................ VII‐9
U.S. importers’ outstanding orders ...................................................................................... VII‐10
Trade remedy measures in third‐country markets .............................................................. VII‐11
Information on nonsubject sources ..................................................................................... VII‐12
Nonsubject Turkish producer Habas ................................................................................ VII‐13
Ukraine ............................................................................................................................. VII‐14
Spain ................................................................................................................................. VII‐16
Belarus .............................................................................................................................. VII‐18
Portugal ............................................................................................................................ VII‐20
Latvia ................................................................................................................................ VII‐22
Korea ................................................................................................................................. VII‐24
Dominican Republic .......................................................................................................... VII‐26

CONTENTS Page
v
Appendixes
A. Federal Register notices .................................................................................................... A‐1
B. List of hearing witnesses ................................................................................................... B‐1
C. Summary data ................................................................................................................... C‐1
D. Domestic like product issues and information on deformed steel wire .......................... D‐1
E. U.S. producer commercial and transfer sales: average per short ton value .................... E‐1
Note.—Information that would reveal confidential operations of individual concerns may not
be published and therefore has been deleted. Such deletions are indicated by asterisks.


1
UNITED STATES INTERNATIONAL TRADE COMMISSION Investigation Nos. 701‐TA‐502 and 731‐TA‐1227 (Final) STEEL CONCRETE REINFORCING BAR FROM MEXICO AND TURKEY DETERMINATIONS
On the basis of the record1 developed in the subject investigations, the United States International Trade Commission (“Commission”) determines, pursuant to sections 705(b) and 735(b) of the Tariff Act of 1930 (19 U.S.C. § 1671d(b)) and (19 U.S.C. § 1673d(b)) (“the Act”), that an industry in the United States is materially injured by reason of imports from Mexico of steel concrete reinforcing bar (“rebar”) that have been found by the Department of Commerce (“Commerce”) to be sold in the United States at less than fair value, and by reason of imports from Turkey of rebar that have been found by Commerce to be subsidized by the government of Turkey. The subject merchandise is provided for primarily in subheadings 7213.10.00 and 7214.20.00 and statistical reporting number 7228.30.8010 of the Harmonized Tariff Schedule of the United States.2
BACKGROUND
The Commission instituted these investigations effective September 4, 2013, following receipt of a petition filed with the Commission and Commerce by the Rebar Trade Action Coalition and its individual members: Nucor Corporation, Charlotte, NC; Gerdau Ameristeel U.S. Inc., Tampa; FL; Commercial Metals Company, Irving, TX; Cascade Steel Rolling Mills, Inc., McMinnville, OR; and Byer Steel Corporation, Cincinnati, OH. The final phase of the investigations was scheduled by the Commission following notification of preliminary determinations by Commerce regarding imports of rebar from Mexico and Turkey.3 Notice of
1 The record is defined in sec. 207.2(f) of the Commission’s Rules of Practice and Procedure (19
CFR § 207.2(f)). 2 All six Commissioners voted in the affirmative. The Commission also finds that imports subject to
Commerce's affirmative critical circumstances determinations are not likely to undermine seriously the remedial effect of the antidumping duty order on rebar from Mexico and the countervailing duty order on rebar from Turkey.
3 On February 26, 2014, Commerce preliminarily determined that imports of rebar from Turkey were not subsidized within the meaning of section 703(b) of the Act (19 U.S.C. § 1671b(b)) (79 F.R. 10771). On April 24, 2014, Commerce preliminarily determined that imports of rebar from Mexico and Turkey were dumped within the meaning of 733(b) of the Act (19 U.S.C. § 1673b(b)) (79 F.R. 22802–22804). On September 15, 2014, Commerce published notice of its final affirmative determination of countervailable subsidies for producers and exporters of rebar from Turkey (79 F.R. 54963), its final affirmative determination of sales at less than fair value with respect to imports from Mexico (79 F.R.
(continued...)

2
the scheduling of the final phase of the Commission’s investigations and of a public hearing to be held in connection therewith was given by posting copies of the notice in the Office of the Secretary, U.S. International Trade Commission, Washington, DC, and by publishing the notice in the Federal Register on May 30, 2014 (79 F.R. 31136). The hearing was held in Washington, DC, on September 15, 2014, and all persons who requested the opportunity were permitted to appear in person or by counsel.
(…continued) 54967), and its final negative determination of sales at less than fair value with respect to imports from Turkey (79 F.R. 54965).

3
Views of the Commission
Based on the record in the final phase of these investigations, we find that an industry in the United States is materially injured by reason of imports of steel concrete reinforcing bar (“rebar”) from Mexico found by the U.S. Department of Commerce (“Commerce”) to be sold in the United States at less than fair value, and by reason of imports of rebar from Turkey found by Commerce to have been subsidized by the government of Turkey. We also find that critical circumstances do not exist with respect to imports of rebar from Mexico and Turkey that are covered by Commerce’s final affirmative critical circumstances determinations.
Background I.
The petitions in these investigations were filed on September 4, 2013, by the Rebar Trade Action Coalition (“RTAC” or “Petitioner”), whose individual members are Byer Steel Corporation (“Byer”), Cascade Steel Rolling Mills, Inc., Commercial Metals Company (“CMC”), Gerdau Ameristeel US Inc. (“Gerdau”), and Nucor Corporation (“Nucor”), all U.S. producers of rebar. Representatives of four member companies of RTAC (Byer, CMC, Gerdau, and Nucor) appeared with counsel at the hearing, and Petitioner submitted prehearing and posthearing briefs.
Several respondent entities participated in these investigations. Deacero S.A. de C.V. and Deacero USA, Inc. (collectively “Deacero”), which respectively produce and import subject merchandise from Mexico, appeared with counsel at the hearing and submitted prehearing and posthearing briefs. Another Mexican producer of subject merchandise, Grupo Simec, submitted a prehearing brief, while a third Mexican producer of subject merchandise, Grupo Acerero, S.A. de C.V. (“Grupo Acerero”), appeared with counsel at the hearing, and made a posthearing submission.1 The Turkish Steel Exporters Association, a trade association, and two Turkish rebar producers, Icdas Celik Enerji Tersane ve Ulasim Sanayi A.S. (“Icdas”), and Colakoglu Metalurji A.S. (collectively “Turkish Respondents”), appeared with counsel at the hearing and submitted prehearing and posthearing briefs.
U.S. industry data are based on the questionnaire responses from nine domestic producers that accounted for virtually all domestic production of rebar in 2013.2 U.S. import data are based on official Commerce import statistics and ***.3 Usable questionnaire responses were received from 18 U.S. importers, accounting for virtually all imports of rebar from Mexico, and 84.2 percent of imports of rebar from Turkey in 2013.4 Usable questionnaire responses were received from seven Mexican producers that accounted for virtually all
1 A representative from the Embassy of Mexico also participated in the hearing. 2 Confidential Report (“CR”) at III‐1; Public Report (“PR”) at III‐1. 3 CR at IV‐1 n.2; PR at IV‐1 n.2. 4 CR at IV‐1; PR at IV‐1 n.2.

4
production of subject merchandise in Mexico in 2013, and from six Turkish producers that estimated that they accounted for *** production of subject merchandise in Turkey in 2013.5
Domestic Like Product II.
A. In General
In determining whether an industry in the United States is materially injured or threatened with material injury by reason of imports of subject merchandise, the Commission first defines the “domestic like product” and the “industry.”6 Section 771(4)(A) of the Tariff Act of 1930, as amended (“the Tariff Act”), defines the relevant domestic industry as the “producers as a whole of a domestic like product, or those producers whose collective output of a domestic like product constitutes a major proportion of the total domestic production of the product.”7 In turn, the Tariff Act defines “domestic like product” as “a product which is like, or in the absence of like, most similar in characteristics and uses with, the article subject to an investigation.”8
The decision regarding the appropriate domestic like product in an investigation is a factual determination, and the Commission has applied the statutory standard of “like” or “most similar in characteristics and uses” on a case‐by‐case basis.9 No single factor is dispositive, and the Commission may consider other factors it deems relevant based on the facts of a particular investigation.10 The Commission looks for clear dividing lines among possible like products and disregards minor variations.11 Although the Commission must accept
5 CR at VII‐3, VII‐10; PR at VII‐3, VII‐6. The Turkish producers’ estimate of coverage is likely ***.
CR at VII‐10 n.17; PR at VII‐6 n.17. The period of investigation (“POI”) for these investigations was January 2011 through March 2014, including calendar years 2011, 2012, and 2013, and interim periods in 2013 and 2014 (January‐March for each year).
6 19 U.S.C. § 1677(4)(A). 7 19 U.S.C. § 1677(4)(A). 8 19 U.S.C. § 1677(10). 9 See, e.g., Cleo Inc. v. United States, 501 F.3d 1291, 1299 (Fed. Cir. 2007); NEC Corp. v.
Department of Commerce, 36 F. Supp. 2d 380, 383 (Ct. Int’l Trade 1998); Nippon Steel Corp. v. United States, 19 CIT 450, 455 (1995); Torrington Co. v. United States, 747 F. Supp. 744, 749 n.3 (Ct. Int’l Trade 1990), aff’d, 938 F.2d 1278 (Fed. Cir. 1991) (“every like product determination ‘must be made on the particular record at issue’ and the ‘unique facts of each case’”). The Commission generally considers a number of factors, including the following: (1) physical characteristics and uses; (2) interchangeability; (3) channels of distribution; (4) customer and producer perceptions of the products; (5) common manufacturing facilities, production processes, and production employees; and, where appropriate, (6) price. See Nippon, 19 CIT at 455 n.4; Timken Co. v. United States, 913 F. Supp. 580, 584 (Ct. Int’l Trade 1996).
10 See, e.g., S. Rep. No. 96‐249 at 90‐91 (1979). 11 Nippon, 19 CIT at 455; Torrington, 747 F. Supp. at 748‐49; see also S. Rep. No. 96‐249 at 90‐91
(Congress has indicated that the like product standard should not be interpreted in “such a narrow fashion as to permit minor differences in physical characteristics or uses to lead to the conclusion that the product and article are not ‘like’ each other, nor should the definition of ‘like product’ be (Continued...)

5
Commerce’s determination as to the scope of the imported merchandise that is subsidized or sold at less than fair value,12 the Commission determines what domestic product is like the imported articles Commerce has identified.13
B. Product Description
Commerce defined the scope of the imported merchandise under investigation as follows:
The merchandise subject to these investigations is steel concrete reinforcing bar imported in either straight length or coil form (“rebar”) regardless of metallurgy, length, diameter, or grade. The subject merchandise is classifiable in the Harmonized Tariff Schedule of the United States (“HTSUS”) primarily under item numbers 7213.10.0000, 7214.20.0000, and 7228.30.8010.
The subject merchandise may also enter under other HTSUS numbers including 7215.90.1000, 7215.90.5000, 7221.00.0015, 7221.00.0030, 7221.00.0045, 7222.11.0001, 7222.11.0057, 7222.11.0059, 7222.30.0001, 7227.20.0080, 7227.90.6085, 7228.20.1000, and 7228.60.6000. Specifically excluded are plain rounds (i.e., non‐deformed or smooth rebar). Also excluded from the scope is deformed steel wire meeting ASTM A1064/A1064M with no bar markings (e.g., mill mark, size, or grade) and without being subject to an elongation test. HTSUS numbers are provided for convenience and customs purposes; however, the written description of the scope remains dispositive.14
(…Continued) interpreted in such a fashion as to prevent consideration of an industry adversely affected by the imports under consideration.”).
12 See, e.g., USEC, Inc. v. United States, 34 Fed. Appx. 725, 730 (Fed. Cir. 2002) (“The ITC may not modify the class or kind of imported merchandise examined by Commerce.”); Algoma Steel Corp. v. United States, 688 F. Supp. 639, 644 (Ct. Int’l Trade 1988), aff’d, 865 F.3d 240 (Fed. Cir.), cert. denied, 492 U.S. 919 (1989).
13 Hosiden Corp. v. Advanced Display Mfrs., 85 F.3d 1561, 1568 (Fed. Cir. 1996) (the Commission may find a single like product corresponding to several different classes or kinds defined by Commerce); Cleo, 501 F.3d at 1298 n.1 (“Commerce’s {scope} finding does not control the Commission’s {like product} determination.”); Torrington, 747 F. Supp. at 748‐52 (affirming the Commission’s determination defining six like products in investigations in which Commerce found five classes or kinds).
14 Steel Concrete Reinforcing Bar from Mexico: Final Determination of Sales at Less than Fair Value and Final Affirmative Determination of Critical Circumstances, 79 Fed. Reg. 54967 (Sept. 15, 2014). The next‐to‐last sentence in the scope definition, regarding the exclusion of certain deformed steel wire (Continued...)

6
Rebar is a long‐rolled steel product that is commonly used in construction projects to provide strength to concrete.15 Rebar sold in the U.S. market is generally manufactured to conform to the standards of the American Society for Testing and Material International (“ASTM”), which specify for each bar size the nominal weight, nominal dimensions and deformation requirements, as well as chemical composition, tensile strength, yield strength (grade), and elongation tolerances.16 The construction industry is the principal end user of rebar, and uses it extensively to reinforce concrete structures.17
Deformed steel wire is a cold‐drawn wire product used for the reinforcement of concrete, and is often used to produce welded wire mesh for concrete reinforcement.18 Under Commerce’s scope definition, deformed steel wire meeting ASTM A1064/A1064M, not containing bar markings, and not subject to an elongation test, is excluded from the scope. By contrast, deformed steel wire that meets ASTM A1064/A1064M, contains bar markings, and/or is subject to an elongation test, is not excluded and is within the scope. According to petitioner, deformed steel wire that meets ASTM A1064/A1064M, contains bar markings, and is subject to an elongation test can be used as rebar, but if it does not meet all three criteria, it cannot be used as rebar.19 Deacero ***.20 Accordingly, ***.
While there is some U.S. production of deformed steel wire, the record does not indicate any reported U.S. production of deformed steel wire meeting ASTM A1064/A1064M, containing bar markings, and subject to an elongation test ***.21
C. Arguments of the Parties
Petitioner’s Arguments. Petitioner argues that the Commission should find a single domestic like product that is coextensive with the scope of these investigations, including deformed steel wire within the scope definition.22
Respondents’ Arguments. Deacero argues that the Commission should find that deformed steel wire is a separate like product from rebar, arguing, inter alia, that deformed
(…Continued) from the scope, was an amendment first included in Commerce’s final determination on September 15, 2014. Id. Previously, in April 2014, Commerce had preliminarily determined that two particular deformed steel wire products produced by Deacero were within the scope. See Memorandum from James Doyle to Paul Piquado dated April 18, 2014, entitled Scope Comments Decision Memorandum for the Preliminary Determination of the Less‐Than‐Fair‐Value Investigation of Steel Concrete Reinforcing Bar from Mexico (included as Attachment 3 to May 28, 2014 submission by Deacero to the Commission) (EDIS Document No. 534642) (“April 18, 2014 Commerce Decision Memo”).
15 CR at I‐15; PR at I‐11. 16 CR at I‐16; PR at I‐12. 17 CR at I‐15; PR at I‐11. 18 CR at I‐18 to I‐19; PR at I‐13 to I‐14. 19 Petitioner’s Posthearing Brief, Exh. 1 at 50‐51. 20 See CR/PR at Table IV‐2 n.1. 21 CR at I‐24 to I‐25; PR at I‐17; Petitioner’s Posthearing Brief, Exh. 1 at 51‐52. 22 Petitioner’s Posthearing Brief, Exh. 1 at 52‐54.

7
steel wire has different physical characteristics from rebar and is manufactured through a different process.23 Deacero states that it is unclear whether there is any domestic production of deformed steel wire corresponding to the subject imports of deformed steel wire, but argues that the Commission should find a separate like product even if there is no such domestic production.24 Turkish Respondents have not objected to the definition of the like product from the preliminary determinations, but have not otherwise commented.25
D. Domestic Like Product Analysis
In the preliminary determinations, the Commission found there was no clear dividing line between different types of rebar, and defined a single domestic like product consisting of rebar, whether coiled or straight length, that was coextensive with the scope of the investigations.26 As previously discussed, Commerce has modified the scope of investigation since the Commission issued its preliminary determinations.
In the final phase of these investigations, we consider Deacero’s argument, made with respect to the modified scope definition, that the Commission should consider rebar and deformed steel wire within the scope as separate domestic like products.27 Deacero does not indicate that its proposed deformed steel wire domestic like product would encompass domestically produced articles outside the scope definition, and we do not construe it in that manner. For purposes of our discussion below, we assume arguendo that there is or could be domestic production of those deformed steel wire products within the scope, although the record does not indicate that there is any such production.28 Based on the record, we define a single domestic like product that is coextensive with the scope.
In our analysis below, we examine domestically produced articles that are like the articles described in the scope, using the Commission’s usual six‐factor analysis to guide the inquiry.29 The articles described in the scope include rebar (imported in either straight length
23 Deacero’s Prehearing Brief at 3‐10; Deacero’s Posthearing Brief, Answers to Commissioner Questions at 59‐60. Deacero’s argument is not entirely clear, in that it repeatedly uses “non‐scope deformed steel wire” to mean, read in context, imported deformed steel wire that is not within the exclusion to the scope, and thus is subject merchandise (and any corresponding domestic production). See Deacero’s Posthearing Brief, Answers to Commissioner Questions at 59‐60.
24 Deacero’s Posthearing Brief, Answers to Commissioner Questions at 59‐60. 25 Turkish Respondents’ Prehearing Brief at 16. 26 Steel Concrete Reinforcing Bar from Mexico and Turkey, Inv. Nos. 701‐TA‐502 and 731‐TA‐
1227‐1228 (Preliminary), USITC Pub. 4432 (Nov. 2013) at 4‐7. 27 See Deacero’s Prehearing Brief at 3‐10; Deacero’s Posthearing Brief, Answers to Commissioner
Questions at 59‐60. 28 See CR at I‐24 to I‐25, PR at I‐17; Petitioner’s Posthearing Brief, ex. 1 at 52. The Commission’s
practice in original investigations is not to define a domestic like product that is not produced domestically. See, e.g., Grain‐Oriented Electrical Steel from Germany, Japan, and Poland, Inv. Nos. 731‐TA‐1233, 1234, and 1236 (Final), USITC Pub. 4491 at 10 & n.49 (Sept. 2014).
29 See 19 U.S.C. § 1677(10) (the domestic like product is “a product which is like, or in the absence of like, most similar in characteristics and uses with, the article subject to an investigation under this title”); Cleo, 501 F.3d at 1295.
8
or coil form, but not including plain rounds) and deformed steel wire meeting ASTM A1064/A1064M, containing bar markings, and/or being subject to an elongation test.
Physical Characteristics and Uses. A principal characteristic of the articles included within the scope definition is that they can be used for construction applications, in particular the reinforcement of concrete. This is a characteristic of rebar. The record indicates that this is also true of the specified deformed steel wire within the scope.30
Channels of Distribution. The information supplied by petitioner suggests that in‐scope deformed steel wire when used for rebar will likely be sold in the same channels of distribution as those for rebar.31 Domestically produced rebar is sold to distributors, end users, and firms that are both distributors and end users.32 Over *** percent of subject imports from Mexico in each year of the POI were reported to be sold to firms that were strictly distributors.33
Interchangeability. In‐scope deformed steel wire meeting ASTM A1064/A1064M, containing bar markings, and subject to an elongation test, can be used interchangeably with rebar in a number of construction applications.34 Commerce’s preliminary decision memorandum noted that Deacero had stated that its deformed steel wire products in question could be used as substitutes for rebar.35
Manufacturing Facilities, Production Processes, and Employees. The record indicates that deformed steel wire is usually produced on different equipment than rebar with a different process, in that rebar is hot‐rolled, while deformed steel wire is cold‐drawn.36 Petitioner states that in‐scope deformed steel wire can be manufactured in the same facilities with rebar using the same employees, and that Nucor could produce both products in its Connecticut facility using the same equipment, although it does not currently produce in‐scope deformed steel wire.37
Producer and Customer Perceptions. The limited record indicates that both U.S. producers and U.S. purchasers perceive that in‐scope deformed steel wire and rebar can be used as substitutes for each other under certain circumstances (e.g., in concrete reinforcement applications).38 In addition, petitioner states that Deacero markets its in‐scope deformed steel wire as rebar, using a Spanish word, “Varilla,” which is understood in the steel industry to mean “rebar.”39
30 Petitioner’s Posthearing Brief, Exh. 1 at 50‐51; see April 18, 2014 Commerce Decision Memo at
2. 31 Petitioner’s Posthearing Brief, Exh. 1 at 53. 32 CR/PR at Table II‐1. 33 CR/PR at Table II‐1. ***. 34 Petitioner’s Posthearing Brief, Exh. 1 at 53; see CR at D‐7 to D‐9; PR at D‐4. 35 April 18, 2014 Commerce Decision Memo at 2. 36 CR at D‐5 to D‐6; PR at D‐3 to D‐4. 37 Petitioner’s Posthearing Brief, Exh. 1 at 53. 38 CR at D‐10 to D‐12; PR at D‐4 to D‐5. 39 Petitioner’s Posthearing Brief, Exh. 1 at 53 and Exh. 9; see April 18, 2014 Commerce Decision
Memo at 2; see EDIS Document No. 543610 (Deacero marketing brochure).

9
Price. Both Petitioner and Deacero agree that deformed steel wire can be more expensive to produce than rebar, although they differ as to how much more.40
Conclusion. Based on the information available, we find that domestically produced rebar is like the subject merchandise. The record further indicates that domestically produced deformed steel wire within the scope, to the extent such a product exists, would be like both the subject merchandise and domestically produced rebar, given similarities in characteristics and end uses, as well as in terms of channels of distribution, interchangeability, and customer and producer perceptions. Consequently, we define a single domestic like product that is coextensive with the scope of these investigations.
Domestic Industry III.
The domestic industry is defined as the domestic “producers as a whole of a domestic like product, or those producers whose collective output of a domestic like product constitutes a major proportion of the total domestic production of the product.”41 In defining the domestic industry, the Commission’s general practice has been to include in the industry producers of all domestic production of the like product, whether toll‐produced, captively consumed, or sold in the domestic merchant market.
We must determine whether any producer of the domestic like product should be excluded from the domestic industry pursuant to section 771(4)(B) of the Tariff Act.42 This provision allows the Commission, if appropriate circumstances exist, to exclude from the domestic industry producers that are related to an exporter or importer of subject merchandise or which are themselves importers.43 Exclusion of such a producer is within the Commission’s discretion based upon the facts presented in each investigation.44
We first identify which domestic producers may be subject to exclusion pursuant to the statutory related parties provision. One U.S. producer, ***, directly imported subject
40 See CR at D‐15; PR at D‐5 to D‐6. 41 19 U.S.C. § 1677(4)(A). 42 19 U.S.C. § 1677(4)(B). 43 See Torrington Co. v. United States, 790 F. Supp. 1161, 1168 (Ct. Int’l Trade 1992), aff’d
without opinion, 991 F.2d 809 (Fed. Cir. 1993); Sandvik AB v. United States, 721 F. Supp. 1322, 1331‐32 (Ct. Int’l Trade 1989), aff’d mem., 904 F.2d 46 (Fed. Cir. 1990); Empire Plow Co. v. United States, 675 F. Supp. 1348, 1352 (Ct. Int’l Trade 1987).
44 The primary factors the Commission has examined in deciding whether appropriate circumstances exist to exclude a related party include the following:
(1) the percentage of domestic production attributable to the importing producer; (2) the reason the U.S. producer has decided to import the product subject to investigation, i.e.,
whether the firm benefits from the LTFV sales or subsidies or whether the firm must import in order to enable it to continue production and compete in the U.S. market; and
(3) the position of the related producer vis‐à‐vis the rest of the industry, i.e., whether inclusion or exclusion of the related party will skew the data for the rest of the industry. See, e.g., Torrington Co. v. United States, 790 F. Supp. at 1168.

10
merchandise from both Mexico and Turkey during the POI,45 and is therefore a related party under 19 U.S.C. § 1677(4)(B)(i). Two U.S. rebar producers have corporate affiliations with Mexican rebar producers. U.S. producer ArcelorMittal USA and subject producer and exporter Arcelor Mittal Las Truchas are both subsidiaries of the same corporate parent, ArcelorMittal S.A. (Luxembourg).46 Therefore, ArcelorMittal USA is a related party under 19 U.S.C. § 1677(4)(B)(ii)(III). U.S. producer Gerdau is affiliated with subject producer Sidertul SA de CV (“Sidertul”),47 which produces rebar (***).48 Since Gerdau *** and Sidertul *** subject merchandise during the POI, Gerdau is not a related party.
We next discuss whether there are appropriate circumstances to exclude either *** or ArcelorMittal USA from the domestic industry.
***. *** stated that ***.49 *** imported *** short tons of subject merchandise in 2011, *** short tons in 2012, *** short tons in 2013, *** short tons in January‐March (“interim”) 2013, and *** short tons in interim 2014.50 By contrast, *** domestic production was *** short tons in 2011, *** short tons in 2012, *** short tons in 2013, *** short tons in interim 2013, and *** short tons in interim 2014.51 The ratio of *** imports of subject merchandise to its domestic production was *** percent in 2011, *** percent in 2012, *** percent in 2013, *** percent in interim 2013, and *** percent in interim 2014.
*** is a member of RTAC, which brought the petition. It was the *** U.S. producer of rebar in 2013, accounting for *** percent of domestic production.52 *** ratio of operating income to net sales was *** than the industry average ***.53 Nevertheless, this financial performance *** of subject imports.54
In light of its *** domestic production than importation of subject merchandise, *** primary interest clearly appears to be in domestic production and not in the importation of subject merchandise. Accordingly, we find that appropriate circumstances do not exist to exclude this firm from the domestic industry.
45 CR/PR at Table III‐10; CR at III‐14; PR at III‐9. 46 CR/PR at Table III‐1 and n.1; ArcelorMittal USA questionnaire response (EDIS Document No.
538183). 47 U.S. producer Gerdau Ameristeel US Inc. is owned by Gerdau Ameristeel Corp. (Canada),
which is in turn owned by Gerdau S.A. (Brazil), which has a subsidiary in Mexico, Sidertul. CR/PR at Table III‐1 n.3.
48 CR at VII‐7 n.13; PR at VII‐5 n.13. 49 ***. 50 CR/PR at Table III‐10. 51 ***. 52 CR/PR at Table III‐1. 53 CR/PR at Table VI‐2. 54 As he has done in other investigations, Vice Chairman Pinkert has not relied upon related
parties’ financial performance on their U.S. manufacturing operations as a factor in determining whether there are appropriate circumstances to exclude them from the domestic industry and has instead relied on the other information set forth in the text.
11
Arcelor Mittal U.S.A. ArcelorMittal Las Truchas exported *** short tons of rebar to the United States in ***, but *** to the United States in ***, *** and ***.55 ArcelorMittal Las Truchas’s share of total Mexican rebar exports to the United States was approximately *** percent in *** and *** percent in ***, *** and ***.56
Arcelor Mittal USA *** the petition.57 ArcelorMittal USA produced *** short tons of rebar in ***, *** short tons in ***, *** short tons in ***, *** short tons in ***, and *** short tons in ***.58 Its share of U.S. production was *** percent in ***.59 Arcelor Mittal’s ratio of operating income to net sales was *** than the industry average in ***.60
Because the record indicates that ArcelorMittal USA’s domestic production is *** the exports of ArcelorMittal Las Truchas, its principal interest appears to be in domestic production. Moreover, *** financial benefit from its affiliation with Arcelor Mittal Las Truchas. Accordingly, we find that appropriate circumstances do not exist to exclude it from the domestic industry.
In light of our domestic like product definition, we define the domestic industry to include all domestic producers of the domestic like product.
Cumulation61 IV.
For purposes of evaluating the volume and price effects for a determination of material injury by reason of subject imports, section 771(7)(G)(i) of the Tariff Act requires the Commission to cumulate subject imports from all countries as to which petitions were filed and/or investigations self‐initiated by Commerce on the same day, if such imports compete with each other and with the domestic like product in the U.S. market. In assessing whether
55 CR at VII‐7 n.13; PR at VII‐5 n.13. 56 CR/PR at Table VII‐1. 57 CR/PR at Table III‐1. 58 *** (EDIS Document No. 538183). 59 CR/PR at Table III‐1. 60 CR/PR at Table VI‐2. 61 Pursuant to Section 771(24) of the Tariff Act, imports from a subject country of merchandise
corresponding to a domestic like product that account for less than 3 percent of all such merchandise imported into the United States during the most recent 12 months for which data are available preceding the filing of the petition shall be deemed negligible. 19 U.S.C. §§ 1671b(a), 1673b(a), 1677(24)(A)(i), 1677(24)(B); see also 15 C.F.R. § 2013.1 (developing countries for purposes of 19 U.S.C. § 1677(36)). Negligibility is not an issue in these investigations. Based on official import statistics and ***, subject imports from Mexico and Turkey exceeded the requisite statutory negligibility threshold for the most recent 12‐month period preceding the filing of the petition for which data are available. Subject imports from Mexico accounted for 30.3 percent of total U.S. rebar imports by quantity during the period September 2012 – August 2013, the most recent 12‐month period prior to the filing of the petition on September 4, 2013. Imports from subject producers and exporters from Turkey accounted for *** percent of total U.S. rebar imports by quantity during the period September 2012 – August 2013. CR at IV‐11; PR at IV‐9.

12
subject imports compete with each other and with the domestic like product, the Commission generally has considered four factors:
(1) the degree of fungibility between subject imports from different countries and between subject imports and the domestic like product, including consideration of specific customer requirements and other quality related questions;
(2) the presence of sales or offers to sell in the same geographic markets of subject imports from different countries and the domestic like product;
(3) the existence of common or similar channels of distribution for subject imports from different countries and the domestic like product; and
(4) whether the subject imports are simultaneously present in the market.62
While no single factor is necessarily determinative, and the list of factors is not
exclusive, these factors are intended to provide the Commission with a framework for determining whether the subject imports compete with each other and with the domestic like product.63 Only a “reasonable overlap” of competition is required.64
The threshold requirement for cumulation is satisfied because Petitioner filed the antidumping petition on imports from Mexico and the countervailing duty petition on imports from Turkey on the same day, September 4, 2013.65 Petitioner argues that the Commission should cumulate subject imports for its present material injury analysis, because all of the factors that the Commission examines in assessing the existence of a reasonable overlap of competition are satisfied.66 Deacero argues that neither the World Trade Organization (WTO) Antidumping Agreement nor the WTO Agreement on Subsidies and Countervailing Measures (SCM) permits cross‐cumulation of dumped imports from Mexico with subsidized imports from
62 See Certain Cast‐Iron Pipe Fittings from Brazil, the Republic of Korea, and Taiwan, Inv. Nos.
731‐TA‐278‐280 (Final), USITC Pub. 1845 (May 1986), aff’d, Fundicao Tupy, S.A. v. United States, 678 F. Supp. 898 (Ct. Int’l Trade), aff’d, 859 F.2d 915 (Fed. Cir. 1988).
63 See, e.g., Wieland Werke, AG v. United States, 718 F. Supp. 50 (Ct. Int’l Trade 1989). 64 The Statement of Administrative Action (SAA) to the Uruguay Round Agreements Act (URAA),
expressly states that “the new section will not affect current Commission practice under which the statutory requirement is satisfied if there is a reasonable overlap of competition.” H.R. Rep. No. 103‐316, Vol. I at 848 (1994) (citing Fundicao Tupy, S.A. v. United States, 678 F. Supp. at 902; see Goss Graphic Sys., Inc. v. United States, 33 F. Supp. 2d 1082, 1087 (Ct. Int’l Trade 1998) (“cumulation does not require two products to be highly fungible”); Wieland Werke, AG, 718 F. Supp. at 52 (“Completely overlapping markets are not required.”).
65 CR at I‐1; PR at I‐1. None of the statutory exceptions to cumulation applies. 66 Petitioner’s Prehearing Brief at 31 and Exh. 1 at 1‐6; Petitioner’s Posthearing Brief at 2‐3 and
Exh. 1 at 1‐3 (response to Vice Chairman Pinkert and Commissioner Kieff).

13
Turkey.67 Deacero does not argue, however, that there is no reasonable overlap of competition for cumulation purposes. Turkish Respondents do not address cumulation for purposes of a present injury analysis.
With respect to Deacero’s argument, the Commission’s long‐standing practice of “cross‐cumulating” imports subject to Commerce’s affirmative subsidy determinations with imports subject to Commerce’s affirmative dumping determinations, when the conditions for cumulation are otherwise met, is consistent with U.S. law.68 We recognize that a WTO dispute resolution panel recently found this practice to be inconsistent with Article 15 of the SCM Agreement, and we note that this panel report has not been adopted by the WTO Dispute Settlement Body and that the United States has appealed the panel report.69
As discussed below, there appears to be a reasonable overlap of competition between subject imports from Mexico and Turkey, and between subject imports from each source and the domestic like product.
Fungibility. Almost all responding U.S. producers reported that U.S.‐produced rebar was always interchangeable with subject imports from Mexico and subject imports from Turkey, and that subject imports from Mexico were likewise always interchangeable with subject imports from Turkey.70 Similarly, the vast majority of responding U.S. purchasers reported that U.S.‐produced rebar was always or frequently interchangeable with subject imports from Mexico and subject imports from Turkey, and that subject imports from Mexico were likewise always or frequently interchangeable with subject imports from Turkey.71 In addition, a substantial majority of responding U.S. importers reported that U.S.‐produced rebar was always or frequently interchangeable with subject imports from Mexico and subject imports from
67 Deacero’s Posthearing Brief, Answers to Commissioner Questions, at 40‐44 (response to
Commissioner Kieff and Vice Chairman Pinkert). 68 19 U.S.C. § 1677(7)(G). E.g., Circular Welded Carbon‐Quality Steel Pipe from India, Oman, the
United Arab Emirates, and Vietnam, Inv. Nos. 701‐TA‐482‐484 and 731‐TA‐1191‐1194 (Final), USITC Pub. 4362 at 12 n.59 (Dec. 2012); Softwood Lumber from Canada, Inv. Nos. 701‐TA‐414 and 731‐TA‐928 (Final), USITC Pub. 3509 at 29‐31 (May 2009); Bingham & Taylor v. United States, 815 F.2d 1482 (Fed. Cir. 1987).
69 www.wto.org/english/tratop_e/dispu_e/cases_e/ds436_e.htm. 70 CR/PR at Table II‐14. Eight of nine responding U.S. producers reported that domestically
produced rebar was always interchangeable with subject imports from Mexico and subject imports from Turkey. Six of seven responding U.S. producers reported that subject imports from Mexico were always interchangeable with subject imports from Turkey. Id.
71 CR/PR at Table II‐14. Six of 18 responding U.S. purchasers reported that domestically produced rebar was always interchangeable with subject imports from Mexico and ten purchasers reported that domestically produced rebar was frequently interchangeable with subject imports from Mexico. Six of 18 responding U.S. purchasers reported that domestically produced rebar was always interchangeable with subject imports from Turkey and nine purchasers reported that domestically produced rebar was frequently interchangeable with subject imports from Turkey. Eleven of 17 responding U.S. purchasers reported that subject imports from Mexico were always interchangeable with subject imports from Turkey, and five U.S. purchasers reported that subject imports from Mexico were frequently interchangeable with subject imports from Turkey. Id.

14
Turkey, and almost all responding U.S. importers reported that subject imports from Mexico were always or frequently interchangeable with subject imports from Turkey.72
There is also an overlap between domestically produced rebar and subject imports from Mexico and Turkey with respect to lengths, sizes, and grades offered.73 A majority of purchasers reported that domestically produced rebar and subject imports from Mexico were comparable in 13 of 14 non‐price factors, that domestically produced rebar and subject imports from Turkey were comparable in 9 of 14 non‐price factors, and that subject imports from Mexico and Turkey were comparable in 14 of 14 non‐price factors.74 Accordingly, the record indicates fungibility between and among the domestic like product, subject imports from Mexico, and subject imports from Turkey.
Channels of Distribution. A large majority of U.S. importers’ U.S. shipments of subject rebar from Turkey during the POI went to firms that were strictly distributors during 2011‐2013.75 Similarly, a large majority of U.S. importers’ U.S. shipments of rebar from Mexico likewise went to firms that were strictly distributors during each year of the POI.76 U.S. producers’ reported U.S. shipments during the POI primarily went to firms that were end users (including firms that were both distributors and end users).77 The record indicates that during each year from 2011 to 2013, appreciable percentages of the domestic like product, subject imports from Mexico, and subject imports from Turkey were sold to distributors.
72 CR/PR at Table II‐14. Five of 13 responding U.S. importers reported that domestically
produced rebar was always interchangeable with subject imports from Mexico, and four importers reported that that domestically produced rebar was frequently interchangeable with subject imports from Mexico. Six of 17 responding U.S. importers reported that domestically produced rebar was always interchangeable with subject imports from Turkey, and four importers reported that domestically produced rebar was frequently interchangeable with subject imports from Turkey. Six of ten responding U.S. importers reported that subject imports from Mexico were always interchangeable with subject imports from Turkey, and three importers reported that subject imports from Mexico were frequently interchangeable with subject imports from Turkey. Id.
73 CR/PR at Tables IV‐5 to IV‐7. 74 CR/PR at Table II‐12. Majorities of purchasers found the domestic product superior to subject
imports from Mexico and Turkey in terms of delivery time, and pluralities or majorities of purchasers additionally found the domestic product superior to subject imports from Turkey in terms of availability, delivery terms, and reliability of supply. Id.
75 The percentage of U.S. importers’ U.S. shipments of subject rebar from Turkey that went to firms that were strictly distributors was *** percent in 2011, *** percent in 2012, and *** percent in 2013. CR/PR at Table II‐1.
76 The percentage of U.S. importers’ U.S. shipments of subject rebar from Mexico that went to firms that were strictly distributors was *** percent in 2011, *** percent in 2012, and *** percent in 2013. CR/PR at Table II‐1. As the notes to Tables II‐1 through II‐3 indicate, ***.
77 During 2011‐2013, the percentage of U.S. producers’ U.S. shipments of rebar to firms that that went to firms that were strictly distributors ranged between a low of 18.7 percent in 2012 and a high of 19.7 percent in 2013, while the percentage that went to firms that were strictly end users ranged between a low of 28.5 percent in 2013 and a high of 29.2 percent in 2012, and the percentage that went to firms that were both distributors and end users ranged between a low of 51.8 percent in 2013 to a high of 52.2 percent in 2012. CR/PR at Table II‐1.

15
Geographic Overlap. U.S. producers reported selling rebar in all regions of the contiguous United States.78 Importers of rebar from Mexico reported serving all geographic areas of the United States except the Northeast, while importers of rebar from Turkey reported serving all geographic areas except the Mountain and Pacific Coast regions.79 Questionnaire data indicate that U.S. producers, subject imports from Mexico, and subject imports from Turkey all served the Midwest, Southeast, and Central Southwest geographical market areas in the United States.80 Thus, there is substantial geographic overlap between and among subject imports and the domestic like product.
Simultaneous Presence in Market. Subject imports from Mexico were present in the U.S. market in all 39 months during the POI, while subject imports from Turkey were present in *** of 39 months during the POI.81 The domestic like product was present in the U.S. market throughout the POI.82
Conclusion. The record indicates that there is a reasonable overlap of competition between and among subject imports and the domestic like product. Accordingly, we cumulate subject imports from Mexico and Turkey for our analysis of whether there is material injury by reason of subject imports.
Material Injury by Reason of Subject Imports V.
Based on the record in the final phase of these investigations, we find that an industry in the United States is materially injured by reason of imports of rebar from Mexico that Commerce has found to be sold in the United States at less than fair value and imports from Turkey that Commerce has found to be subsidized.
A. Legal Standards
In the final phase of antidumping and countervailing duty investigations, the Commission determines whether an industry in the United States is materially injured or threatened with material injury by reason of the imports under investigation.83 In making this determination, the Commission must consider the volume of subject imports, their effect on prices for the domestic like product, and their impact on domestic producers of the domestic like product, but only in the context of U.S. production operations.84 The statute defines “material injury” as “harm which is not inconsequential, immaterial, or unimportant.”85 In
78 CR/PR at Table II‐5; CR at II‐11; PR at II‐8. 79 CR/PR at Table II‐5. 80 CR/PR at Table II‐5. 81 CR/PR at Table IV‐8. 82 CR/PR at Tables V‐3 through V‐8. 83 19 U.S.C. §§ 1671d(b), 1673d(b). 84 19 U.S.C. § 1677(7)(B). The Commission “may consider such other economic factors as are
relevant to the determination” but shall “identify each {such} factor ... and explain in full its relevance to the determination.” 19 U.S.C. § 1677(7)(B).
85 19 U.S.C. § 1677(7)(A).

16
assessing whether the domestic industry is materially injured by reason of subject imports, we consider all relevant economic factors that bear on the state of the industry in the United States.86 No single factor is dispositive, and all relevant factors are considered “within the context of the business cycle and conditions of competition that are distinctive to the affected industry.”87
Although the statute requires the Commission to determine whether the domestic industry is “materially injured or threatened with material injury by reason of” unfairly traded imports,88 it does not define the phrase “by reason of,” indicating that this aspect of the injury analysis is left to the Commission’s reasonable exercise of its discretion.89 In identifying a causal link, if any, between subject imports and material injury to the domestic industry, the Commission examines the facts of record that relate to the significance of the volume and price effects of the subject imports and any impact of those imports on the condition of the domestic industry. This evaluation under the “by reason of” standard must ensure that subject imports are more than a minimal or tangential cause of injury and that there is a sufficient causal, not merely a temporal, nexus between subject imports and material injury.90
In many investigations, there are other economic factors at work, some or all of which may also be having adverse effects on the domestic industry. Such economic factors might include nonsubject imports; changes in technology, demand, or consumer tastes; competition among domestic producers; or management decisions by domestic producers. The legislative history explains that the Commission must examine factors other than subject imports to ensure that it is not attributing injury from other factors to the subject imports, thereby inflating an otherwise tangential cause of injury into one that satisfies the statutory material injury threshold.91 In performing its examination, however, the Commission need not isolate
86 19 U.S.C. § 1677(7)(C)(iii). 87 19 U.S.C. § 1677(7)(C)(iii). 88 19 U.S.C. §§ 1671d(a), 1673d(a). 89 Angus Chemical Co. v. United States, 140 F.3d 1478, 1484‐85 (Fed. Cir. 1998) (“{T}he statute
does not ‘compel the commissioners’ to employ {a particular methodology}.”), aff’g, 944 F. Supp. 943, 951 (Ct. Int’l Trade 1996).
90 The Federal Circuit, in addressing the causation standard of the statute, observed that “{a}s long as its effects are not merely incidental, tangential, or trivial, the foreign product sold at less than fair value meets the causation requirement.” Nippon Steel Corp. v. USITC, 345 F.3d 1379, 1384 (Fed. Cir. 2003). This was further ratified in Mittal Steel Point Lisas Ltd. v. United States, 542 F.3d 867, 873 (Fed. Cir. 2008), where the Federal Circuit, quoting Gerald Metals, Inc. v. United States, 132 F.3d 716, 722 (Fed. Cir. 1997), stated that “this court requires evidence in the record ‘to show that the harm occurred “by reason of” the LTFV imports, not by reason of a minimal or tangential contribution to material harm caused by LTFV goods.’” See also Nippon Steel Corp. v. United States, 458 F.3d 1345, 1357 (Fed. Cir. 2006); Taiwan Semiconductor Industry Ass’n v. USITC, 266 F.3d 1339, 1345 (Fed. Cir. 2001).
91 SAA at 851‐52 (“{T}he Commission must examine other factors to ensure that it is not attributing injury from other sources to the subject imports.”); S. Rep. 96‐249 at 75 (1979) (the Commission “will consider information which indicates that harm is caused by factors other than less‐than‐fair‐value imports.”); H.R. Rep. 96‐317 at 47 (1979) (“in examining the overall injury being experienced by a domestic industry, the ITC will take into account evidence presented to it which demonstrates that the harm attributed by the petitioner to the subsidized or dumped imports is (Continued...)
17
the injury caused by other factors from injury caused by unfairly traded imports.92 Nor does the “by reason of” standard require that unfairly traded imports be the “principal” cause of injury or contemplate that injury from unfairly traded imports be weighed against other factors, such as nonsubject imports, which may be contributing to overall injury to an industry.93 It is clear that the existence of injury caused by other factors does not compel a negative determination.94
Assessment of whether material injury to the domestic industry is “by reason of” subject imports “does not require the Commission to address the causation issue in any particular way” as long as “the injury to the domestic industry can reasonably be attributed to the subject imports” and the Commission “ensure{s} that it is not attributing injury from other sources to the subject imports.”95 96 Indeed, the Federal Circuit has examined and affirmed various Commission methodologies and has disavowed “rigid adherence to a specific formula.”97
(…Continued) attributable to such other factors;” those factors include “the volume and prices of nonsubsidized imports or imports sold at fair value, contraction in demand or changes in patterns of consumption, trade restrictive practices of and competition between the foreign and domestic producers, developments in technology and the export performance and productivity of the domestic industry”); accord Mittal Steel, 542 F.3d at 877.
92 SAA at 851‐52 (“{T}he Commission need not isolate the injury caused by other factors from injury caused by unfair imports.”); Taiwan Semiconductor Industry Ass’n, 266 F.3d at 1345 (“{T}he Commission need not isolate the injury caused by other factors from injury caused by unfair imports ... . Rather, the Commission must examine other factors to ensure that it is not attributing injury from other sources to the subject imports.” (emphasis in original)); Asociacion de Productores de Salmon y Trucha de Chile AG v. United States, 180 F. Supp. 2d 1360, 1375 (Ct. Int’l Trade 2002) (“{t}he Commission is not required to isolate the effects of subject imports from other factors contributing to injury” or make “bright‐line distinctions” between the effects of subject imports and other causes.); see also Softwood Lumber from Canada, Inv. Nos. 701‐TA‐414 and 731‐TA‐928 (Remand), USITC Pub. 3658 at 100‐01 (Dec. 2003) (Commission recognized that “{i}f an alleged other factor is found not to have or threaten to have injurious effects to the domestic industry, i.e., it is not an ‘other causal factor,’ then there is nothing to further examine regarding attribution to injury”), citing Gerald Metals, 132 F.3d at 722 (the statute “does not suggest that an importer of LTFV goods can escape countervailing duties by finding some tangential or minor cause unrelated to the LTFV goods that contributed to the harmful effects on domestic market prices.”).
93 S. Rep. 96‐249 at 74‐75; H.R. Rep. 96‐317 at 47. 94 See Nippon Steel Corp., 345 F.3d at 1381 (“an affirmative material‐injury determination under
the statute requires no more than a substantial‐factor showing. That is, the ‘dumping’ need not be the sole or principal cause of injury.”).
95 Mittal Steel, 542 F.3d at 877‐78; see also id. at 873 (“While the Commission may not enter an affirmative determination unless it finds that a domestic industry is materially injured ‘by reason of’ subject imports, the Commission is not required to follow a single methodology for making that determination ... {and has} broad discretion with respect to its choice of methodology.”) citing United States Steel Group v. United States, 96 F.3d 1352, 1362 (Fed. Cir. 1996) and S. Rep. 96‐249 at 75.
96 Vice Chairman Pinkert does not join this paragraph or the following three paragraphs. He points out that the Federal Circuit, in Bratsk, 444 F.3d 1369, and Mittal Steel, held that the Commission is required, in certain circumstances when considering present material injury, to undertake a particular (Continued...)

18
The Federal Circuit’s decisions in Gerald Metals, Bratsk, and Mittal Steel all involved cases where the relevant “other factor” was the presence in the market of significant volumes of price‐competitive nonsubject imports. The Commission interpreted the Federal Circuit’s guidance in Bratsk as requiring it to apply a particular additional methodology following its finding of material injury in cases involving commodity products and a significant market presence of price‐competitive nonsubject imports.98 The additional “replacement/benefit” test looked at whether nonsubject imports might have replaced subject imports without any benefit to the U.S. industry. The Commission applied that specific additional test in subsequent cases, including the Carbon and Certain Alloy Steel Wire Rod from Trinidad and Tobago determination that underlies the Mittal Steel litigation.
Mittal Steel clarifies that the Commission’s interpretation of Bratsk was too rigid and makes clear that the Federal Circuit does not require the Commission to apply an additional test nor any one specific methodology; instead, the court requires the Commission to have “evidence in the record” to “show that the harm occurred ‘by reason of’ the LTFV imports,” and requires that the Commission not attribute injury from nonsubject imports or other factors to subject imports.99 Accordingly, we do not consider ourselves required to apply the replacement/benefit test that was included in Commission opinions subsequent to Bratsk.
The progression of Gerald Metals, Bratsk, and Mittal Steel clarifies that, in cases involving commodity products where price‐competitive nonsubject imports are a significant factor in the U.S. market, the Court will require the Commission to give full consideration, with adequate explanation, to non‐attribution issues when it performs its causation analysis.100
(…Continued) kind of analysis of non‐subject imports, albeit without reliance upon presumptions or rigid formulas. Mittal Steel explains as follows:
What Bratsk held is that “where commodity products are at issue and fairly traded, price competitive, non‐subject imports are in the market,” the Commission would not fulfill its obligation to consider an important aspect of the problem if it failed to consider whether non‐subject or non‐LTFV imports would have replaced LTFV subject imports during the period of investigation without a continuing benefit to the domestic industry. 444 F.3d at 1369. Under those circumstances, Bratsk requires the Commission to consider whether replacement of the LTFV subject imports might have occurred during the period of investigation, and it requires the Commission to provide an explanation of its conclusion with respect to that factor.
542 F.3d at 878. 97 Nucor Corp. v. United States, 414 F.3d 1331, 1336, 1341 (Fed. Cir. 2005); see also Mittal Steel,
542 F.3d at 879 (“Bratsk did not read into the antidumping statute a Procrustean formula for determining whether a domestic injury was ‘by reason’ of subject imports.”).
98 Mittal Steel, 542 F.3d at 875‐79. 99 Mittal Steel, 542 F.3d at 873 (quoting from Gerald Metals, 132 F.3d at 722), 875‐79 & n.2
(recognizing the Commission’s alternative interpretation of Bratsk as a reminder to conduct a non‐attribution analysis).
100 To that end, after the Federal Circuit issued its decision in Bratsk, the Commission began to present published information or send out information requests in final phase investigations to producers in nonsubject countries that accounted for substantial shares of U.S. imports of subject merchandise (if, in fact, there were large nonsubject import suppliers). In order to provide a more (Continued...)

19
The question of whether the material injury threshold for subject imports is satisfied notwithstanding any injury from other factors is factual, subject to review under the substantial evidence standard.101 Congress has delegated this factual finding to the Commission because of the agency’s institutional expertise in resolving injury issues.102
B. Conditions of Competition and the Business Cycle
The following conditions of competition inform our analysis of whether there is material injury by reason of subject imports.
1. Demand Conditions
Rebar is primarily used by the construction industry to reinforce concrete structures, and the U.S market for rebar is tied closely to construction activity.103 U.S. demand for rebar typically follows trends in the overall U.S. economy ‐‐ in particular for nonresidential construction spending, and, to a lesser extent, residential construction spending.104 Although nonresidential construction accounts for a significantly larger share of total construction spending than residential construction, spending on residential construction increased to a greater degree than spending on nonresidential construction during the POI.105 Since construction activity is seasonal, and is at its lowest at the end of each year and the beginning of the following year, demand for rebar tends to be lower in the fall and winter, and can be affected by weather conditions, such as the severe winter of early 2014.106
There are limited substitutes for rebar.107 Rebar generally accounts for a small share of the total cost of the applications in which it is used.108 As such, changes in the price of rebar have a relatively small effect on total demand for rebar.109
(…Continued) complete record for the Commission’s causation analysis, these requests typically seek information on capacity, production, and shipments of the product under investigation in the major source countries that export to the United States. The Commission plans to continue utilizing published or requested information in final phase investigations in which there are substantial levels of nonsubject imports.
101 We provide in our respective discussions of volume, price effects, and impact a full analysis of other factors alleged to have caused any material injury experienced by the domestic industry.
102 Mittal Steel, 542 F.3d at 873; Nippon Steel Corp., 458 F.3d at 1350, citing U.S. Steel Group, 96 F.3d at 1357; S. Rep. 96‐249 at 75 (“The determination of the ITC with respect to causation is ... complex and difficult, and is a matter for the judgment of the ITC.”).
103 CR at I‐15, II‐1, II‐19; PR at I‐11; II‐1, II‐13; see Transcript of September 15, 2014 Hearing (“Hearing Tr.”) at 49 (Kerkvliet).
104 CR at II‐19; PR at II‐13. 105 CR/PR at Figure II‐2. 106 CR/PR at Figure II‐3; CR at II‐19, II‐21; PR at II‐13 to II‐14. 107 CR at II‐24 to II‐25; PR at II‐17 to II‐18. 108 CR at II‐25; PR at II‐18. 109 See CR at II‐46; PR at II‐31.

20
While some manufactured rebar is used in construction applications with no further processing, a large share is sold to fabricators that further process the rebar, using it to create forms used in construction.110 The three largest U.S. producers, CMC, Gerdau, and Nucor, as well as Byer, own purchasing firms that operate as fabricators and/or distributors.111 These purchasing firms obtain a significant share of the rebar for fabrication or distribution from their parent companies and the remainder from other producers and import suppliers.112
The record, however, shows that a significant number of purchasers (41 of 66) bought rebar from both U.S. producers and importers of subject merchandise. Moreover, 13 purchasers were listed by both one (or more) U.S. producer and one (or more) importer as among their ten largest purchasers.113
By the same token, the questionnaire data from purchasers indicate that the distribution channels were varied and overlapping. Some distributors are also end users, some are affiliated with domestic producers, and some are independent.114 End users reported selling to, inter alia, various contractors and sub‐contractors, home builders, and the general public. Distributors reported selling to, inter alia, fabricators, lumber yards, wholesalers, distributors, some end users, and national home retail centers. Independent end
110 CR at II‐1; PR at II‐1. The Independent Steel Alliance (ISA), a purchasing cooperative, was
created in 2013 by independent fabricators seeking to increase negotiating leverage when making purchases from steel suppliers, to earn rebates based on purchase volumes, and to respond to the growth of fabricators affiliated with the largest U.S. producers. The ISA also provides its suppliers (including Deacero) with an avenue to reach new purchasers and increase sales. The ISA is still relatively new, and questionnaire responses from U.S. producers, importers and purchasers indicate that it has thus far had little or no effect on price or purchaser patterns. CR at V‐6 to V‐8; PR at V‐5 to V‐6; see Hearing Tr. at 58 (Byer), 216 (Barzan).
111 CR at II‐1; PR at II‐1. 112 CR/PR at Table II‐4; CR at II‐1; PR at II‐1; Hearing Tr. at 40 (Darsey); 43 (Alvarado). The largest
purchasers of rebar were ***. CR at II‐1; PR at II‐1. During 2013, *** percent of the combined rebar sales of CMC, Gerdau, Nucor and Byer were to related purchasers. CR/PR at Tables VI‐1, VI‐2.
The domestic industry sells to independent fabricators and distributors, as well as to domestic producers’ affiliates. CR/PR at Table II‐4; Hearing Tr. at 39, 82 (Darsey); 50 (Kerkvliet). Deacero has presented evidence from an independent purchaser asserting that the domestic industry was unwilling or unable to meet this purchaser’s supply requests. See, e.g., Deacero’s Posthearing Brief, Answers to Commissioner Questions at 3‐8 (response to Vice Chairman Pinkert and Commissioner Williamson); Hearing Tr. at 162‐164 (Bergren). Petitioner has presented contrary evidence that there were various commercial considerations affecting sales by domestic producers to this purchaser. See Hearing Tr. at 50 (Kerkvliet); Petitioner’s Posthearing Brief, Exh. 1 at 22‐26 (response to Chairman Broadbent and Vice Chairman Pinkert), Exh. 11 (Declaration of ***, and Exh. 15 (Declaration of ***. We note that several independent fabricators and distributors provided testimony that they had historically been able to meet their supply needs from the domestic industry, although some of these noted that the domestic industry had recently been unable to meet the lower price of subject imports in some instances. Hearing Tr. at 60‐61 (Melvin); 62‐64, 87 (Webb); 64‐65 (Crowe); 84‐85 (Byer).
113 CR at II‐11; PR at II‐8. 114 See CR/PR at Table II‐4; CR at II‐9; PR at II‐7; Hearing Tr. at 44‐45, 144 (Alvarado); 97 (Porter);
143 (Kerkvliet).

21
users/distributors reported selling to, inter alia, fabricators, contractors, lumber yards, building material dealers, and other distributors. Related end users/distributors reported selling to, inter alia, small contractors, local lumber yards, rebar fabrication companies, and other distributors.115 These data demonstrate that distributors of all kinds, as well as domestic producers, sell to fabricators. Thus, there is no distinct channel of distribution associated with any market segment; we find that there is instead an overlap among various broad categories.116
Most responding U.S producers, importers, and purchasers reported that U.S. demand for rebar has increased since 2011.117 Apparent U.S. consumption increased from 6.5 million short tons 2011 to 7.4 million short tons in 2012, and then to 7.7 million short tons in 2013.118 Overall, apparent U.S. consumption was 18.2 percent higher in 2013 than in 2011.119
2. Supply Conditions
The domestic industry supplied the predominant share of the U.S. market throughout the POI. Its share of apparent U.S. consumption declined from 90.0 percent in 2011 to 84.4 percent in 2013.120 The three largest U.S. producers, CMC, Gerdau, and Nucor, accounted for *** percent of total domestic production in 2013.121 The domestic industry’s capacity utilization in 2013 was 68.4 percent.122
Cumulated subject imports’ share of apparent U.S. consumption during the POI increased throughout the POI from *** percent in 2011 to *** percent in 2013.123 Cumulated subject imports accounted for *** percent of the quantity of all U.S. imports of rebar in 2013.124 During the POI, volumes of subject imports from Turkey were typically *** in the first half of the year.125
115 CR at II‐9 to II‐10; PR at II‐7. 116 See Hearing Tr. at 39, 82 (Darsey); 44‐45, 144 (Alvarado); 60‐61 (Melvin); 63 (Webb); 84
(Byer); 97 (Porter); 143 (Kerkvliet). 117 CR/PR at Table II‐7. 118 CR/PR at Tables IV‐9, C‐1, C‐3. Apparent consumption was 1.8 million short tons in interim
2013 and 2.0 million short tons in interim 2014. Id. 119 CR/PR at Table C‐1, C‐3. 120 The domestic industry’s share of apparent U.S. consumption declined from 90.0 percent in
2011 to 86.7 percent in 2012 and to 84.4 percent in 2013, and was 80.5 percent in interim 2013 and 77.1 percent in interim 2014. CR/PR at Tables IV‐10, C‐1, C‐3.
121 CR/PR at Table III‐1. 122 CR/PR at Tables III‐3, C‐1. 123 Cumulated subject imports’ share of apparent U.S. consumption increased from *** percent
in 2011 to *** percent in 2012 and to *** percent in 2013, and was *** percent in interim 2013 and *** percent in interim 2014. CR/PR at Tables IV‐10, C‐1, C‐3.
124 CR at IV‐2; PR at IV‐2. 125 During 2011‐2013, *** percent of total subject imports from Turkey were imported during
January through June. By contrast, imports during January through June accounted for 46.4 percent of total subject imports from Mexico during 2011‐2013. See CR/PR at Table IV‐8.

22
Nonsubject imports’ share of apparent U.S. consumption increased from *** percent in 2011 to *** percent in 2013.126 The largest source of nonsubject imports was Turkish producer/exporter Habas, which accounted for *** percent of total U.S imports in 2013.127 Other sources of nonsubject imports during the POI included Spain, the Dominican Republic, Japan, Korea, and Peru.128 Imports of rebar from seven nonsubject countries are currently subject to antidumping duty orders, and were throughout the POI. These countries are Belarus, China, Indonesia, Latvia, Moldova, Poland, and Ukraine.129
3. Substitutability
Rebar sold in the U.S. market is generally manufactured to conform to ASTM specifications, and rebar of the same grade and dimension is generally interchangeable and substitutable regardless of origin.130 As previously discussed, almost all responding U.S. producers and purchasers and most responding U.S. importers reported that the domestic like product, subject imports from Mexico, and subject imports from Turkey are always or frequently interchangeable.131
Purchasers ranked price as by far the most important factor that they consider in their purchasing decisions, with all 28 responding purchasers listing it as among their three most important factors, and 20 purchasers listing it as their most important factor.132 Twenty‐five of 28 responding purchasers listed price as a very important factor in purchasing decisions, and price and quality meets industry standards were the two factors listed by the largest number of purchasers as very important.133
Respondents have raised a number of factors that they claim limit substitutability between the domestic like product and subject imports, including differences in length, size,
126 Nonsubject imports as a share of apparent U.S. consumption increased from *** percent in
2011 to *** percent in 2012, and then to *** percent in 2013. They were *** percent in interim 2013 and *** percent in interim 2014. CR/PR at Tables IV‐10, C‐1, C‐3.
127 CR/PR at Table IV‐2. Because imports from Habas received de minimis dumping margins and subsidy rates from Commerce, for purposes of these final determinations, we treat imports from Habas as nonsubject imports.
128 CR at IV‐3; PR at IV‐2. 129 CR at I‐7 to I‐9; PR at I‐6 to I‐7. See generally Steel Concrete Reinforcing Bar from Belarus,
China, Indonesia, Latvia, Moldova, Poland, and Ukraine, Inv. Nos. 731‐TA‐873‐874, 878‐880 and 882 (Second Review), USITC Pub. 4409 (July 2013).
130 CR at 1‐16, II‐26; PR at I‐12, II‐18; Hearing Tr. at 38, 82, 86‐87, 142 (Darsey); 42 (Alvarado); 47 (Kerkvliet); 62 (Webb).
131 CR/PR at Table II‐14. 132 CR/PR at Table II‐9. The other factors most often ranked by purchasers among their top
three factors in purchasing decisions were availability, quality, and credit/payment terms. Id. 133 CR/PR at Table II‐10. The other factors most often listed by purchasers as very important
were availability, delivery time, reliability of supply, and product consistency. Id.

23
and grade, affiliations of U.S. producers with downstream entities that purchase rebar from their parent, and Buy America(n) and other domestic preference programs.134
We find that there is significant overlap between the domestic like product and subject imports by length, size, and grade.135 Subject imports are concentrated primarily in lengths of 20 feet up to 40 feet, and 40 feet up to 60 feet, and domestic producers compete head‐to‐head with subject imports in those length ranges. While the domestic industry also supplies lengths of 60 feet and above, where subject import volumes have been more limited, the record overall indicates significant overlap by rebar length.136 Similarly, subject imports are concentrated in rebar sizes 3, 4, 5, and 6, and U.S. producers compete head‐to‐head with subject imports in those sizes. Again, the record indicates that subject import volumes have been somewhat lower for sizes 7, 8, 9, 10, and 11, but there remains competition between subject imports and the domestic like product in those larger sizes as well, again indicating significant overall overlap by rebar size.137 Subject imports are concentrated in grades 40 and 60, and U.S. producers compete head‐to‐head with them in those grades. Subject imports also compete with the domestic like product in grade 75 and “other”, although subject import volumes in those grades are relatively small. Thus, there is significant overall overlap by rebar grade.138
The record indicates that ***, and downstream affiliated purchasers reported that ***.139 However, the record also indicates that downstream affiliates of the principal U.S. producers *** purchase not only from their parent companies, but also from non‐affiliated sources, including subject imports.140 ***,141 indicating that subject imports were able to compete directly with the domestic like product in this part of the market.
Buy America preferences apply to the procurement of iron and steel products, including rebar, for certain Federal‐aid highway construction programs, while Buy American preferences
134 Deacero’s Posthearing Brief, Answers to Commissioner Questions at 10‐25; Turkish
Respondents’ Prehearing Brief at 12‐16; Turkish Respondents’ Posthearing Brief at 13‐14. Respondents also argue that longer lead times for imported product are a major factor limiting substitutability Deacero’s Prehearing Brief at 30‐31. As noted, the record indicates that delivery time is important to many purchasers, see CR/PR at Table II‐10, but lead times were ranked by very few purchasers (only four of 28) as among their three most important factors in making purchasing decisions. CR/PR at Table II‐9. The record indicates that lead times from U.S. mills and Mexican mills are shorter than lead times for subject imports from Turkey, and that lead times from inventories are somewhat longer for subject producers than for domestic producers. CR at II‐26; PR at II‐18 to II‐19. Thus, while there appear to be some differences in lead time between product from different sources, the record does not indicate that lead times play a major role in purchasing decisions.
135 See Hearing Tr. at 44 (Alvarado); 61 (Melvin). 136 CR/PR at Table IV‐5. 137 CR/PR at Table IV‐6. 138 CR/PR at Table IV‐7. 139 CR at II‐8; PR at II‐6; see Purchasers’ Questionnaire responses of CMC (EDIS Document No.
538081); Gastrich Rebar (EDIS Document No. 538077); Gerdau (EDIS Document No. 538075); and Harris Steel Inc. & Harris Supply Solutions Inc. (EDIS Document No. 538079).
140 CR/PR at Table II‐4; Hearing Tr. at 40 (Darsey); 43 (Alvarado). 141 CR at III‐14 and n.8; PR at III‐9 and n.8.

24
apply to Federal Government procurement of certain goods and services.142 Buy America(n) requirements may impose limits on substitutability, but projects subject to such preferences account for only a limited portion of U.S. shipments, and the record shows that the percentage of the market covered by public construction projects with Buy American requirements declined during the POI as federal stimulus spending declined.143
Another program that respondents claim provides a preference to domestic producers is a voluntary program under which building projects may seek to qualify for LEED (Leadership in Energy and Environmental Design) certification, which encourages sourcing of local and regional materials made within 500 miles of the project.144 However, there appears to be some flexibility for a project in meeting the LEED certification requirements by using a certain percentage of locally produced materials, and it is not clear that locally produced rebar is necessarily required to meet the local materials credit for a particular project.145 There is insufficient information in the record to draw any conclusion that LEED certification programs have resulted in a significant preference in the U.S. market for U.S. rebar producers.
Accordingly, given the substantial competition between the domestic like product and subject imports in every part of the market in which subject imports compete, we do not find that any of the factors raised by respondents significantly affect the substitutability of subject imports and the domestic like product. Based on the record, we find that rebar from different sources is highly substitutable, and that price is an important factor in purchasing decisions.146
4. Other Conditions
The primary raw material input for rebar production is steel scrap. Raw material costs accounted for approximately two‐thirds of domestic producers’ cost of goods sold (“COGS”) between January 2011 and March 2014, ranging between a high of 70.7 percent in 2011 and a low of 65.4 percent in 2013.147 Prices for steel scrap in the United States fluctuated between January 2011 and March 2014. They declined by 14.3 percent overall, with the highest price in the beginning of 2012 ($415 per short ton) and the lowest price in mid‐2012 ($299 per short
142 CR at II‐35; PR at II‐23 to II‐24. 143 CR at II‐36; PR at II‐24; Hearing Tr. at 39, 142 (Darsey); 48 (Kerkvliet); 141 (Crowe); see
Deacero’s Prehearing Brief at 39‐40. The Concrete Reinforcing Steel Institute estimated that projects subject to Buy America(n) requirements are expected to account for approximately 10.6 percent of total U.S. rebar demand. CR at II‐36; PR at II‐24.
144 CR at II‐37 to II‐38; PR at II‐25. While most building projects in the continental United States are within 500 miles of a domestic rebar production facility, the production facilities of subject producers from Mexico and Turkey are reported to be more than 500 miles from the United States. CR at II‐38; PR at II‐25.
145 CR/PR at II‐38; PR at II‐25. 146 See CR at II‐26; PR at II‐18. 147 CR at V‐1, VI‐15; PR at V‐1; VI‐6 to VI‐7.

25
ton).148 Several U.S. producers, including CMC, Gerdau, and Nucor, have upstream affiliates that process and supply steel scrap.149
C. Volume of Subject Imports
Section 771(7)(C)(i) of the Tariff Act provides that the “Commission shall consider whether the volume of imports of the merchandise, or any increase in that volume, either in absolute terms or relative to production or consumption in the United States, is significant.”150
The volume of cumulated subject imports increased from *** short tons in 2011 to *** short tons in 2012, and then to *** short tons in 2013.151 The share of apparent U.S. consumption held by cumulated subject imports, by quantity, increased from *** percent in 2011 to *** percent in 2012, and then to *** percent in 2013.152
Subject imports increased during a time of rising apparent U.S. consumption, but the volume of subject imports increased at a much greater rate. Subject imports increased by *** percent from 2011 to 2013, while apparent U.S. consumption increased by 18.2 percent during the same period.153 As a result of their rapid increase, subject imports took market share from the domestic industry: subject imports gained *** percentage points of market share from 2011 to 2013, and the domestic industry’s market share declined by 5.6 percentage points during this period.154
We find that the volume of cumulated subject imports, and the increase in that volume, are significant both in absolute terms and relative to consumption in the United States.
D. Price Effects of the Subject Imports
Section 771(7)(C)(ii) of the Tariff Act provides that evaluating the price effects of the subject imports, the Commission shall consider whether
148 CR/PR at Figure V‐1; CR at V‐1; PR at V‐1; see EDIS Document No. 543307. 149 CR at VI‐2; PR at VI‐1 to VI‐2. 150 19 U.S.C. § 1677(7)(C)(i). 151 CR/PR at Table IV‐2. The volume of cumulated subject imports was *** short tons in interim
2013, and *** short tons in interim 2014. Id. 152 CR/PR at Tables IV‐10, C‐1, C‐3. The share of apparent U.S. consumption held by cumulated
subject imports, by quantity, was *** percent in interim 2013 and *** percent in interim 2014. Id. 153 CR/PR at Table C‐1. 154 CR/PR at Tables IV‐10, C‐1. We reject respondents’ argument that the decline in domestic
industry market share during the POI should be given limited weight on the basis that imports have historically occupied an equal or greater share of the U.S. market than they did over the POI. See Turkish Respondents’ Prehearing Brief at 20‐22. The record does not indicate that the domestic industry market share level in 2011 was an anomaly. To the contrary, the record in the preliminary phase investigations indicated that the domestic industry’s market share was even higher in 2010 than it was in 2011. INV‐LL‐085 at Table IV‐7 (Oct. 28, 2013) (EDIS Document No. 532415). Nor does the record indicate that the domestic industry could not supply growing U.S. demand during the POI. To the contrary, throughout the POI the domestic industry’s capacity exceeded apparent U.S. consumption. See CR/PR at Tables III‐3, IV‐9.

26
(I) there has been significant price underselling by the imported merchandise as compared with the price of domestic like products of the United States, and
(II) the effect of imports of such merchandise otherwise depresses prices to a significant degree or prevents price increases, which otherwise would have occurred, to a significant degree.155
As discussed above, the record in these investigations indicates that subject imports and domestically produced rebar are made to ASTM specifications and are highly substitutable, and that price is an important factor in purchasing decisions.
In the final phase of these investigations, the Commission collected pricing data on six different products.156 The reported pricing data accounted for 81.0 percent of U.S. shipments of subject imports from Mexico, *** percent of U.S. shipments of subject imports from Turkey, and approximately 32.5 percent of U.S. producers’ U.S. shipments during the POI.157
We have used the pricing data without adjustment and find that the data provide meaningful comparisons between the prices for the domestic like product and the subject imports. We first observe that the Commission collected data on the f.o.b. value of the six products, in accordance with our usual practice.158 There is no indication in the available data that U.S. freight costs accounted for a significant distinction between subject imports and the domestic like product, since U.S. producers reported that their U.S. inland transportation costs ranged from 5 to 10 percent, while importers reported transportation costs ranging from 1 to 7 percent.159 We consequently disagree with respondents that the pricing data should be adjusted to account for higher freight expenses that may have been incurred for shipments of subject imports.160
155 19 U.S.C. § 1677(7)(C)(ii). 156 Four of the products concern straight ASTM A615, grade 60 rebar, as to which separate
pricing data were collected for no. 3, no. 4, no. 5, and no. 6 sizes. CR at V‐12 to V‐13; PR at V‐9. Two of the products concern straight ASTM A615, grade 40 rebar, as to which separate pricing data were collected for no. 3 and no. 5 sizes. Id.
157 CR at V‐13; PR at V‐9. The pricing data accounted for approximately 57.2 percent of U.S. producers’ commercial shipments. CR at V‐13 n.28; PR at V‐9 n.28. As noted above, a significant share of the domestic industry’s sales was to related purchasers and, consequently, was not included in these pricing data.
158 CR at V‐12; PR at V‐9. The Commission received no comments on the draft questionnaires from any party suggesting that the Commission should collect pricing data on a basis other than the f.o.b. value. See Deacero’s Comments on Draft Questionnaires, May 27, 2014 (EDIS Document No. 534545); Turkish Respondents’ Comments on Draft Questionnaires, May 27, 2014 (EDIS Document No. 534518).
159 CR at V‐3; PR at V‐2 to V‐3; see Hearing Tr. at 48, 103‐104 (Kerkvliet). 160 Deacero’s Posthearing Brief at 5 and Answers to Commissioner Questions at 49‐51 (response
to Commissioner Johanson).

27
We also followed our usual practice of examining arms’ length transactions between unaffiliated parties in our pricing data, and not including transfers between affiliates. The pricing data collected by the Commission reflects a substantial share (approximately 32.5 percent) of U.S. producers’ domestic shipments. Moreover, the information available in the record indicates that the transfers by domestic producers to their downstream affiliates were, on average, ***.161 As compared to relevant average commercial sales values, average transfer values ***.162 We observe that *** would be consistent with a volume discount that producers give to purchasers of large volumes.163 Furthermore, *** would be less than the average margin of underselling by subject imports, as described below. Because we view the pricing data reported by the domestic industry as reliable and representative, and do not believe the method proposed would yield results different from those in the record based on our traditional approach, we disagree with respondents that transfers of rebar from the three largest producers to their affiliates should be included in these data.164
Just as with our data requests in prior investigations and reviews with respect to rebar that the Commission has conducted since 1997, the Commission collected pricing data for products in which the grade and size of rebar were specified, but did not collect data for particular lengths of rebar, including 60‐foot rebar.165 No party suggested in their comments on the draft questionnaires that the Commission collect pricing data by length of rebar, or that the Commission specifically collect pricing data for 60‐foot rebar.166 We note that subject import volumes are significantly lower for this length than for shorter lengths.167 Accordingly, we reject respondents’ contention that the pricing data are unrepresentative because they do not include specific data for 60‐foot rebar, and do not account for a price premium that respondents claim exists with respect to domestically produced 60‐foot rebar.168
The subject imports undersold the domestic like product in 155 out of 156 pricing quarterly comparisons during this period, by margins ranging from 0.6 percent to 17.5 percent, and an average margin of underselling of 9.7 percent.169 We find this underselling to be significant in the light of the importance of price in purchasing decisions. Indeed, subject
161 See Petitioner’s Posthearing Brief, Exh. 8 (Declaration of ***) at Attachment A; Exh. 11
(Declaration of ***) at Attachment A; Exh. 15 (Declaration of ***) at Attachment A. 162 CR/PR at Table E‐1. 163 CR at V‐6; PR at V‐4. 164 Deacero’s Posthearing Brief at 5 and Answers to Commissioner Questions at 52‐53 (response
to Commissioner Johanson); see Turkish Respondents’ Prehearing Brief at 13‐14. 165 CR at V‐12 n.27; PR at V‐9 n.27. 166 See Deacero’s Comments on Draft Questionnaires, May 27, 2014 (EDIS Document No.
534545); Turkish Respondents’ Comments on Draft Questionnaires, May 27, 2014 (EDIS Document No. 534518).
167 CR/PR at Table IV‐5. 168 Deacero’s Posthearing Brief at 5 and Answers to Commissioner Questions at 52 (response to
Commissioner Johanson); Deacero’s Final Comments at 2‐3. 169 CR/PR at Table V‐10.

28
imports gained market share at the expense of the domestic industry while this pervasive underselling was taking place.170 171
We do not agree with respondents’ contention that the underselling data should be accorded little weight because of a domestic price premium reflecting purchaser preferences for domestically produced rebar over the subject imports.172 In light of the material in the record indicating the high interchangeability and substitutability of the domestic and subject products, that programs requiring use of domestically produced product account for only a small and declining percentage of the market, and that price is the most important factor in purchasing decisions, there is no basis for finding that domestically produced product commands a price premium. As previously stated, the record shows that the domestic industry competes in the same segments in which subject imports compete.
We do not find that subject imports depressed U.S. producers’ prices to a significant degree. The record indicates that prices declined between January 2011 and March 2014 for each of the pricing products for the domestic like product and subject imports from both Mexico and Turkey, with one exception.173 The decline in U.S. producers’ prices during the POI for the six pricing products ranged from 2.0 percent to 7.0 percent.174 However, the record indicates that rebar prices are affected by changes in prices of steel scrap, the primary raw material input for rebar production.175 Steel scrap prices declined by 14.3 percent between January 2011 and March 2014.176 Although we acknowledge that other factory costs of the domestic producers rose, and that apparent U.S. consumption increased during the POI,177 in light of the magnitude of the decline in raw materials costs we cannot conclude that the subject imports depressed prices to a significant degree.
170 We additionally note that there were a limited number of confirmed lost sales or lost
revenues due to competition from subject imports. CR/PR at Table V‐11 to V‐12; CR at V‐29‐36; PR at V‐19 to V‐20.
171 We acknowledge that Nucor was identified as the price leader by a majority of responding purchasers. CR at V‐9 to V‐12; PR at V‐6 to V‐9. We do not find this inconsistent with or detracting from our finding of significant underselling by subject imports. The identification of Nucor as price leader reflects its size, as the U.S producer *** in 2013. CR/PR at Tables III‐1, VI‐2. U.S. rebar prices are affected by steel scrap prices and other conditions in the market, see CR/PR at Figure V‐2, and price changes announced by Nucor tend to reflect those conditions. See Hearing Tr. at 108, 123‐ 124 (Darsey); 109, 124‐125 (Alvarado).
172 Deacero’s Prehearing Brief at 32‐34; Deacero’s Posthearing Brief, Answers to Commissioner Questions, at 17‐26; Turkish Respondents’ Prehearing Brief at 14‐16; Turkish Respondents’ Posthearing Brief at 14‐15.
173 CR at V‐26; PR at V‐17. The one exception was that prices for product *** from Mexico rose during the period. Id. at V‐26 n.34; PR at V‐17 n.34.
174 CR at V‐26; PR at V‐17. The decline in prices for subject imports from Mexico for *** ranged from *** to *** percent, while prices for product *** increased by *** percent. The decline in prices for subject imports from Turkey ranged between *** and *** percent. Id.
175 CR/PR at Figure V‐2; CR at V‐1; PR at V‐1. 176 See EDIS Document No. 543307. 177 CR/PR at Tables IV‐9, VI‐1; CR at VI‐16 to VI‐17; PR at VI‐5.
29
We also do not find that subject imports prevented price increases for the domestic like product that otherwise would have occurred. The domestic industry’s ratio of COGS to net sales was relatively flat during the POI, declining from 91.3 percent in 2011 to 90.5 percent in 2012, but then increasing to 92.1 percent in 2013, less than one percentage point higher than its 2011 level.178 We note that the increase in the COGS to net sales ratio between 2012 and 2013 was affected by an increase in other factory costs.179 Consequently, the record does not indicate that the domestic producers’ ability to recover their costs changed appreciably during the POI.
For the foregoing reasons, we find that the prices of the subject imports, which were pervasively lower than those of the domestic like product, caused the subject imports to gain market share at the expense of the domestic industry.
178 CR/PR at Tables VI‐1, C‐1. The ratio of COGS to net sales was 92.3 percent in interim 2013
and 95.6 percent in interim 2014. Id. 179 Other factory costs as a percentage of net sales increased from 20.3 percent in 2011 to 20.9
percent in 2012, and then to 24.8 percent in 2013; they were 23.4 percent in interim 2013 and 23.9 percent in interim 2014. CR/PR at Table VI‐1. See CR at VI‐16 to VI‐17; PR at VI‐5.

30
E. Impact of the Subject Imports180
Section 771(7)(C)(iii) of the Tariff Act provides that examining the impact of subject imports, the Commission “shall evaluate all relevant economic factors which have a bearing on the state of the industry.”181 These factors include output, sales, inventories, capacity utilization, market share, employment, wages, productivity, profits, cash flow, return on investment, ability to raise capital, research and development, and factors affecting domestic prices. No single factor is dispositive and all relevant factors are considered “within the context of the business cycle and conditions of competition that are distinctive to the affected industry.”
Many of the indicators of the domestic industry’s performance, including production, capacity utilization, net sales, U.S. shipments, and net sales value, showed some improvements
180 The statute instructs the Commission to consider the “magnitude of the dumping margin” in
an antidumping proceeding as part of its consideration of the impact of imports. 19 U.S.C. § 1677(7)(C)(iii)(V). In its final determination of sales at less than fair value with respect to subject imports from Mexico, Commerce found antidumping duty margins of 20.58 percent for Deacero, 66.70 percent for Grupo Acerero, 66.70 percent for Grupo Simec, and 20.58 percent for All Others. Steel Concrete Reinforcing Bar from Mexico: Final Determination of Sales at Less than Fair Value and Final Affirmative Determination of Critical Circumstances, 79 Fed. Reg. 54967, 54968 (Sept. 15, 2014).
In Commerce’s final countervailing duty determination with respect to subject imports from Turkey, it determined the following subsidy rates for Turkish companies: 0.74 percent (de minimis) for Habas; 1.25 percent for Icdas; 1.25 percent for all others. Steel Concrete Reinforcing Bar from Turkey, Final Affirmative Countervailing Duty Determination Final Affirmative Determination of Critical Circumstances, 79 Fed. Reg. 54963 (Sept. 15, 2014). While the statute requires the Commission to consider the magnitude of the dumping margin, it contains no similar provision concerning subsidy rates. According to the SAA, “the Commission will not be required to consider the rate of subsidization.” H. Conf. Rep. 103‐316, vol. I at 850 (1994). The SAA consequently expressly rebuts any argument by respondents that the Commission’s impact analysis must take into account the subsidy rates that Commerce found for subject imports from Turkey. Pursuant to our usual practice, we have considered the impact of subject imports on a cumulated basis. Deacero’s argument that this is not consistent with the statute, Deacero Posthearing Brief, Answers to Commissioner Questions at 39‐40, is incorrect. The statute states that “. . . the Commission shall cumulatively assess the volume and effect of imports of the subject merchandise from all countries. . .” 19 U.S.C. § 1677(7)(G). Thus, the statute references effects generally; it is not specifically limited, as Deacero suggests, to price effects. The impact analysis prescribed by the statute encompasses any analysis of such “effects” as “actual and potential negative effects on cash flow, inventories, employment, wages, growth, ability to raise capital, and investment,” 19 U.S.C. § 1677(7)(C)(iii)(III), and “actual and potential effects on the existing development and production efforts of the domestic industry. . .” 19 U.S.C. § 1677(7)(C)(iii)(IV). Consequently, the Commission’s practice of analyzing impact cumulatively is fully consistent with the statute.
181 19 U.S.C. § 1677(7)(C)(iii); see also SAA at 851 and 885 (“In material injury determinations, the Commission considers, in addition to imports, other factors that may be contributing to overall injury. While these factors, in some cases, may account for the injury to the domestic industry, they also may demonstrate that an industry is facing difficulties from a variety of sources and is vulnerable to dumped or subsidized imports.”).
31
during the POI as U.S. demand increased. However, as cumulated subject import volumes increased significantly and took market share at the expense of the domestic industry through significant and pervasive underselling, these indicators failed to rise commensurately with the increase in apparent U.S. consumption between 2011 and 2013. Indeed, as the industry’s declining market share prevented it from fully benefiting from the increased demand, a number of key performance indicators declined between 2012 and 2013, including production, capacity utilization, productivity, net sales quantity and value, net operating income and operating margin, while end‐of‐period inventories increased. As the domestic industry’s market share declined by 5.6 percentage points between 2011 and 2013, its profitability likewise declined, with net operating income declining by 11 percent over the same period, and its operating margin similarly declining.182
Capacity increased from 9.6 million short tons in 2011 to 9.8 million short tons in 2012, and then increased to 9.9 million short tons in 2013, an overall increase of 2.9 percent.183 Production increased from 6.3 million short tons in 2011 to 6.8 million short tons in 2012, and then declined to 6.8 million short tons in 2013, an overall increase of 7.1 percent.184 Capacity utilization increased from 65.7 percent in 2011 to 69.6 percent in 2012, and then declined to 68.4 percent in 2013.185
Net sales increased from 6.3 million short tons in 2011 to 6.8 million short tons in 2012, and although they declined very slightly they remained at 6.8 million short tons in 2013, an overall increase of 8.2 percent.186 U.S. shipments increased from 5.9 million short tons in 2011 to 6.4 million short tons in 2012, and to 6.5 million short tons in 2013, an overall increase of 10.8 percent.187 U.S. producers’ end‐of‐period inventories increased from 484,796 short tons in 2011 to 545,398 short tons in 2012, and then to 550,880 short tons in 2013, an overall increase of 13.6 percent; end‐of‐period inventories as a share of total shipments increased from *** percent in in 2011 to *** percent in 2012 and 2013.188
As the volume and market share of subject imports rose, the domestic industry’s share of apparent U.S. consumption fell. The domestic industry’s share of apparent U.S. consumption
182 CR/PR at Table C‐1. 183 CR/PR at Tables III‐3; C‐1. Capacity was 2.5 million short tons in both interim 2013 and
interim 2014. Id. 184 CR/PR at Tables III‐3; C‐1. Production was 1.56 million short tons in interim 2013, and 1.67
million short tons in interim 2014. Id. 185 CR/PR at Tables III‐3; C‐1. Capacity utilization was 61.8 percent in interim 2013, and 66.0
percent in interim 2014. Id. 186 CR/PR at Tables VI‐1; C‐1. Net sales were 1.5 million short tons in interim 2013, and 1.6
million short tons in interim 2014. Id. 187 CR/PR at Tables IV‐10; C‐1. U.S. shipments were 1.5 million short tons in interim 2013, and
1.6 million short tons in interim 2014. Id. 188 CR/PR at Tables III‐9, C‐1. End‐of‐period inventories were 562,035 short tons in interim 2013,
and 605,110 short tons in interim 2014. End‐of‐period inventories as a share of total shipments were *** percent in interim 2013 and *** percent in interim 2014. Id.

32
declined from 90.0 percent in 2011 to 86.7 percent in 2012 and then to 84.4 percent in 2013, a loss of 5.6 percentage points.189
The industry’s employment indicators increased during the POI, but productivity declined between 2012 and 2013.190
Net sales revenues increased from $4.1 billion in 2011 to $4.4 billion in 2012, and then declined to $4.3 billion in 2013, an overall increase of 4.1 percent.191 Operating income increased from $178.0 million in 2011 to $240.6 million in 2012, and then declined to $158.5 million in 2013, an overall decline of 11.0 percent.192 The industry’s operating income margin increased from 4.3 percent in 2011 to 5.5 percent in 2012, and then declined to 3.7 percent in 2013.193 Capital expenditures increased during the POI, while research and development (R&D) expenses were relatively modest and declined during the POI.194
We find that the significant and increasing volumes of subject imports sold at lower prices than the domestic like product led to declines in the domestic industry’s market share throughout the POI. Because of its lost market share, the domestic industry’s production, capacity utilization, net sales quantities, U.S. shipments, and net sales revenues did not rise commensurately with the increase in apparent consumption between 2011 and 2013, and its inventories increased. Moreover, a number of the industry’s performance indicators declined between 2012 and 2013. As set forth above, these included production, capacity utilization, productivity, net sales quantities, and net sales revenues, operating income, and operating margin. We find that the domestic industry’s loss of market share and its inability to benefit fully from increased demand, both as a result of subject imports, had a direct effect on the industry’s revenues and consequently its profitability. In a market in which demand was
189 CR/PR at Tables IV‐10; C‐1. The domestic industry’s share of apparent U.S. consumption was
80.5 percent in interim 2013, and 77.1 percent in interim 2014. Id. 190 Employment increased from 3,966 production‐related workers (PRWs) in 2011 to 4,078 in
2012, and then to 4,183 in 2013; there were 4,087 PRWS in interim 2013, and 4,133 PRWS in interim 2014. CR/PR at Tables III‐11; C‐1. Hours worked increased from 8.0 million hours in 2011 to 8.3 million hours in 2012, and then to 8.4 million hours in 2013; they were 2.0 million in interim 2013, and 2.1 million in interim 2014. CR/PR at Tables III‐11; C‐1. Wages paid increased from $283.8 million in 2011 to $309.5 million in 2012, and then to $321.5 million in 2013; they were $76.1 million in interim 2013, and $81.6 million in interim 2014.190 CR/PR at Tables III‐11; C‐1. Productivity (in short tons per 1,000 hours) increased from 793 in 2011 to 828 in 2012, and then declined to 810 in 2013; it was 781 in interim 2013, and 780 in interim 2014. CR/PR at Tables III‐11; C‐1.
191 CR/PR at Tables VI‐1; C‐1. Net sales value was $994.6 million in interim 2013, and $1.0 billion in interim 2014. Id.
192 CR/PR at Tables VI‐1; C‐1. Operating income was $33.2 million in interim 2013, and $1.7 million in interim 2014. Id.
193 CR/PR at Tables VI‐1; C‐1. The operating income margin was 3.3 percent in interim 2013, and 0.2 percent in interim 2014. Id.
194 Capital expenditures increased from $54.2 million in 2011 to $83.3 million in 2012, and then to $126.3 million in 2013; they were $21.0 million in interim 2013, and $17.0 million in interim 2014. CR/PR at Tables VI‐4, C‐1. R&D expenses increased from $*** in 2011 to $*** in 2012, and then declined to $*** in 2013; they were $*** in interim 2013, and $*** in interim 2014. CR/PR at Table VI‐4.

33
increasing, the industry’s operating income declined by 11.0 percent from 2011 to 2013, and its operating margin similarly declined.195 We accordingly find that the significant volume of cumulated subject imports, which gained market share at the expense of the domestic industry through significant and pervasive underselling, had a significant impact on the domestic industry.
In our analysis of the impact of subject imports on the domestic industry, we have taken into account whether there are other factors that may have had an adverse impact on the domestic industry during the POI to ensure that we are not attributing injury from other factors to the subject imports. Respondents have argued that the decline in steel scrap raw material prices during the POI was responsible for any declines in domestic producers’ prices during the POI and any adverse price effects for the domestic industry.196 However, the decline in steel scrap raw material prices during the POI cannot explain the domestic industry’s loss of market share to subject imports and its consequent loss of revenues.
We have also considered the role of nonsubject imports in these investigations. The record indicates that subject imports gained more market share during the POI than did nonsubject imports. Subject imports gained *** percentage points of market share between 2011 and 2013, while nonsubject imports gained only *** percentage points in the same period.197 Moreover, subject imports were sold at lower prices than nonsubject imports. As previously noted, the largest supplier of nonsubject imports during the POI was Turkish producer/exporter Habas. The Commission collected pricing data for Habas, which show that product from Habas was priced higher than subject product from Turkey in 71 of 75 comparisons, and was priced higher than subject product from Mexico in 67 of 75 comparisons.198 199 Since subject imports gained more market share and were sold at lower
195 CR/PR at Table C‐1. 196 Deacero’s Prehearing Brief at 54; Deacero’s Posthearing Brief at 6‐7; Turkish Respondents’
Prehearing Brief at 22‐23; Turkish Respondents’ Posthearing Brief, Exh. 1 at 5 (response to Commissioner Kieff). As previously discussed, steel scrap prices declined by 14.3 percent between January 2011 and March 2014. See EDIS Document No. 543307.
197 Cumulated subject imports’ share of apparent U.S. consumption increased from *** percent in 2011 to *** percent in 2012, and then to *** percent in 2013. Nonsubject imports’ share of apparent U.S. consumption increased from *** percent in 2011 to *** percent in 2012, and then to *** percent in 2013. CR/PR at Tables IV‐10, C‐1.
198 CR at V‐28 n.35; PR at V‐19 n.35. 199 Based on the evidence in these investigations, Vice Chairman Pinkert finds that rebar is a
commodity product for purposes of a Bratsk/Mittal Steel analysis and that price‐competitive nonsubject imports were a significant factor in the U.S. market for rebar during the period of investigation. He also finds, however, that nonsubject imports would not have replaced the subject imports without benefit to the domestic industry had the subject imports exited the market during the period. As stated in the text, the largest supplier of nonsubject imports during the POI was Turkish producer/exporter Habas, and imports from Habas were priced higher than subject product in most comparisons. Thus, any replacement of the subject imports by nonsubject imports would generally have been at higher prices, which would have benefited the domestic industry.

34
prices than nonsubject imports, we find that subject imports had injurious effects on the domestic industry distinct from any effects from nonsubject imports. We therefore conclude, for purposes of these final determinations, that the cumulated subject imports have had a significant adverse impact on the domestic industry.
Critical Circumstances VI.
A. Legal Standards and Party Arguments
In its final antidumping duty determination concerning rebar from Mexico200 and its final countervailing duty determination concerning rebar from Turkey,201 Commerce found that critical circumstances exist with respect to certain subject producers/exporters. Because we have determined that the domestic industry is materially injured by reason of subject imports from Mexico and Turkey, we must further determine "whether the imports subject to the affirmative {Commerce critical circumstances} determination ... are likely to undermine seriously the remedial effect of the antidumping {and/or countervailing duty} order{s} to be issued."202
The SAA indicates that the Commission is to determine "whether, by massively increasing imports prior to the effective date of relief, the importers have seriously undermined the remedial effect of the order" and specifically "whether the surge in imports prior to the suspension of liquidation, rather than the failure to provide retroactive relief, is likely to seriously undermine the remedial effect of the order."203 The legislative history for the critical circumstances provision indicates that the provision was designed "to deter exporters whose merchandise is subject to an investigation from circumventing the intent of the law by increasing their exports to the United States during the period between initiation of an investigation and a preliminary determination by {Commerce}."204 An affirmative critical
200 On September 15, 2014, Commerce issued its final affirmative antidumping duty
determination concerning imports of rebar from Mexico, and found that critical circumstances exist with respect to imports from the three exporters subject to separate rates and the Mexican firms subject to the all others rate. Steel Concrete Reinforcing Bar from Mexico: Final Determination of Sales at Less than Fair Value and Final Affirmative Determination of Critical Circumstances, 79 Fed. Reg. 54967 (Sept. 15, 2014). Thus, all subject imports from Mexico are subject to Commerce’s affirmative critical circumstances determination.
201 On September 15, 2014, Commerce issued its final affirmative countervailing duty determination concerning imports of rebar from Turkey, and found that critical circumstances did not exist for Habas and Icdas, but did exist for all companies subject to the all others rate. Steel Concrete Reinforcing Bar from Turkey, Final Affirmative Countervailing Duty Determination Final Affirmative Determination of Critical Circumstances, 79 Fed. Reg. 54963 (Sept. 15, 2014).
202 19 U.S.C. §§ 1671d(b)(4)(A)(ii), 1673d(b)(4)(A)(ii). 203 SAA at 877. 204 ICC Industries, Inc. v United States, 812 F.2d 694, 700 (Fed. Cir. 1987), quoting H.R. Rep. No.
96‐317 at 63 (1979), aff’g 632 F. Supp. 36 (Ct. Int’l Trade 1986). See 19 U.S.C. §§ 1671b(e)(2), 1673b(e)(2).

35
circumstances determination by the Commission, in conjunction with an affirmative determination of material injury by reason of subject imports, would normally result in the retroactive imposition of duties for those imports subject to the affirmative Commerce critical circumstances determination for a period 90 days prior to the suspension of liquidation.
The statute provides that, in making this determination, the Commission shall consider, among other factors it considers relevant,
(I) the timing and the volume of the imports,
(II) a rapid increase in inventories of the imports, and
(III) any other circumstances indicating that the remedial effect of the {order} will be seriously undermined.205
In considering the timing and volume of subject imports, the Commission's practice is to consider import quantities prior to the filing of the petition with those subsequent to the filing of the petition using monthly statistics on the record regarding those firms for which Commerce has made an affirmative critical circumstances determination.206
Because the petitions were filed on September 4, 2013, we have considered data for the six months prior to the month in which the petitions were filed (September 2013) and data for the six months including and following that month.
B. Analysis
1. Mexico
Petitioner argues that the Commission should find critical circumstances with respect to subject imports from Mexico, because subject imports from Mexico continued to increase during the six‐month period following the filing of the petition, and there was a significant increase in end‐of‐period inventories of subject imports from Mexico in interim 2014 relative to interim 2013.207
Deacero argues that the Commission should not find critical circumstances with respect to subject imports from Mexico, which increased by only 9 percent from the six‐month period before the filing of the petition to the six‐month period after the filing of the petition. It states
205 19 U.S.C. §§ 1671d(b)(4)(A)(ii), 1673d(b)(4)(A)(ii). 206 See Lined Paper School Supplies from China, India, and Indonesia, Inv. Nos. 701‐TA‐442‐43,
731‐TA‐1095‐97, USITC Pub. 3884 at 46‐48 (Sept. 2006); Carbazole Violet Pigment from China and India, Inv. Nos. 701‐TA‐437 and 731‐TA‐1060‐61 (Final), USITC Pub. 3744 at 26 (Dec. 2004); Certain Frozen Fish Fillets from Vietnam, Inv. No. 731‐TA‐1012 (Final), USITC Pub. 3617 at 20‐22 (Aug. 2003).
207 Petitioner’s Prehearing Brief at 55‐56. Petitioner states that a review of absolute import volumes before and after the filing of the petition in September 2013 is of limited utility, since demand for rebar is at its lowest in the fall and winter months, but does not propose an alternative time period for analysis. Id.

36
that the ratios of U.S. inventories of imports from Mexico to imports and to U.S. shipments remained low and consistent with those of prior years.208
The monthly data for subject import volume from Mexico for the six‐month periods before and after the filing of the petition on September 4, 2013, show a small increase in imports from Mexico subject to Commerce’s affirmative critical circumstances determination.209 These subject imports were 170,896 short tons in the six months preceding the filing of the petition and 186,342 short tons in the six months following the filing of the petition, an increase of 15,446 short tons, or 9.0 percent.210 We find that this increase in subject imports covered by Commerce’s affirmative critical circumstances determination is insufficient to undermine seriously the remedial effect of the antidumping duty order.211
Taken as a whole, the data on record do not show a sudden and significant increase in imports from Mexico subject to Commerce’s critical circumstances determination subsequent to the filing of the petition that would seriously undermine the remedial effect of the antidumping duty order to be issued on rebar from Mexico. We therefore make a negative critical circumstances determination with respect to subject imports from Mexico.
2. Turkey
Petitioner argues that the Commission should find critical circumstances with respect to subject imports from Turkey. It emphasizes that subject imports from Turkey remained substantial in the six months following the filing of the petition, and that there was a significant increase in end‐of‐period inventories of subject imports from Turkey in interim 2014 relative to interim 2013.212
Turkish Respondents assert that the volume of Turkish imports subject to the affirmative critical circumstances determination declined in the six months after the filing of the petition as compared to the six‐month period before the filing of the petition, and thus there
208 Deacero’s Prehearing Brief at 85‐87; Deacero’s Posthearing Brief at 11. 209 The periods considered are March‐August 2013 and September 2013‐February 2014. CR/PR
at Tables IV‐3. 210 CR/PR at Table IV‐3. The available data do not include monthly data for imports of subject
deformed steel wire from Mexico. ***, id. at Table IV‐3 n.1, the availability of data for deformed steel wire would not materially change our analysis.
211 The only available data with respect to U.S. importers’ end‐of‐period inventories of subject merchandise from Mexico subject to the affirmative Commerce critical circumstances determination indicate that such inventories were *** short tons at the end of March 2013, *** short tons at year end 2013 and *** short tons at the end of March 2014. CR/PR at Tables IV‐3, VII‐9. Inventories at the end of March 2014 were greater by *** short tons than inventories at the end of March 2013, but this difference was *** in relation to apparent U.S. consumption, which was 1.8 million short tons in interim 2013 and 2.0 million short tons in interim 2014. CR/PR at Tables C‐1, C‐3. Moreover, inventory levels were not significantly above those reported at year end 2012. CR/PR at Table VII‐9.
212 Petitioner’s Prehearing Brief at 55‐56. Again, while Petitioner stated that a comparison of import volumes before and after the filing of the petition is of limited utility, it did not propose an alternative time period for its analysis. Id.

37
was no surge in imports after the filing of the petition. They also contend that there was no rapid increase in inventories.213
The monthly data for subject imports from Turkey for the six‐month periods before and after the filing of the petition on September 4, 2013, show that there were fewer such imports in the six month period after the filing of the petition than in the six months prior to the filing of the petition.214 These subject imports were *** short tons in the six months preceding the filing of the petition and *** short tons in the six months following the filing of the petition.215 Since subject imports declined between these two periods, we do not find a massive increase in subject imports prior to the effective date of relief.216
Taken as a whole, the data on record do not show a sudden and significant increase in imports from Turkey subject to Commerce’s critical circumstances determination subsequent to the filing of the petition that would seriously undermine the remedial effect of the countervailing duty order to be issued on rebar from Turkey. We therefore make a negative critical circumstances determination with respect to subject imports from Turkey.
Conclusion VII.
For the reasons stated above, we determine that an industry in the United States is materially injured by reason of subject imports of rebar from Mexico that are sold in the United States at less than fair value and subject imports from Turkey that are subsidized by the government of Turkey. We also determine that critical circumstances do not exist with respect to subject imports from Mexico and Turkey covered by Commerce’s affirmative critical circumstances determinations.
213 Turkish Respondents’ Prehearing Brief at 38‐43; Turkish Respondents’ Posthearing Brief at
15. 214 We have used our normal method of comparing six‐month periods before and after the filing
of the petition; as previously stated, no party proposed use of any different periods. 215 CR/PR at Table IV‐4. 216 The only available data with respect to U.S. importers’ end‐of‐period inventories of subject
merchandise from Turkey subject to the affirmative Commerce critical circumstances determination indicate that such inventories were *** short tons at the end of March 2013 and *** short tons at the end of March 2014. CR/PR at Table IV‐4. Inventories at the end of March 2014 were greater by *** short tons than inventories at the end of March 2013, but this difference was *** in relation to apparent U.S. consumption, which was 1.8 million short tons in interim 2013 and 2.0 million short tons in interim 2014. CR/PR at Tables C‐1, C‐3.


I‐1
PART I: INTRODUCTION
BACKGROUND
These investigations result from petitions filed with the U.S. Department of Commerce (“Commerce”) and the U.S. International Trade Commission (“USITC” or “Commission”) by the Rebar Trade Action Coalition (“RTAC”) and its individual members: Nucor Corporation (“Nucor”), Charlotte, North Carolina; Gerdau Ameristeel U.S. Inc. (“Gerdau”), Tampa, Florida; Commercial Metals Company (“CMC”), Irving, Texas; Cascade Steel Rolling Mills, Inc. (“Cascade”), McMinnville, Oregon; and Byer Steel Corporation (“Byer Steel”), Cincinnati, Ohio, on September 4, 2013, alleging that an industry in the United States is materially injured and threatened with material injury by reason of subsidized imports of steel concrete reinforcing bar (“rebar”) 1 from Turkey, and less‐than‐fair value (“LTFV”) imports of rebar from Mexico and Turkey. The following tabulation provides information relating to the background of these investigations.2
1 See the section entitled “The Subject Merchandise” in Part I of this report for a complete description of the merchandise subject to these investigations.
2 Pertinent Federal Register notices are referenced in app. A, and may be found at the Commission’s website (www.usitc.gov). A list of witnesses appearing at the hearing is presented in app. B of this report.

I‐2
Effective date Action September 4, 2013 Petitions filed with Commerce and the Commission;
institution of Commission investigation (78 FR 55755, September 11, 2013)
October 2, 2013 Commerce’s notice of initiation of countervailing duty and antidumping duty investigations (78 FR 60831 and 78 FR 60827, October 2, 2013)
November 6, 2013 Commission’s preliminary determination (78 FR 68090, November 13, 2013)
February 26, 2014 Commerce’s preliminary determination for Turkey CVD (79 FR 10771, February 26, 2014)
April 24, 2014 Commerce’s preliminary determinations for Mexico LTFV (79 FR 22802, April 24, 2014) and Turkey LTFV (79 FR 22804, April 24, 2014)
April 24, 2014 Scheduling of final phase of Commission’s investigations (79 FR 31136, May 30, 2014)
September 15, 2014 Commission’s hearing September 15, 2014 Commerce’s determinations for Turkey CVD (79 FR
54963, September 15, 2014); Turkey LTFV (79 FR 54965, September 15, 2014); and Mexico LTFV (79 FR 54967, September 15, 2014)
September 15, 2014 Commission’s termination of investigation for Turkey LTFV (79 FR 571131, September 24, 2014)
October 14, 2014 Commission’s vote October 28, 2014 Commission’s views
STATUTORY CRITERIA AND ORGANIZATION OF THE REPORT
Statutory criteria
Section 771(7)(B) of the Tariff Act of 1930 (the “Act”) (19 U.S.C. § 1677(7)(B)) provides that in making its determinations of injury to an industry in the United States, the Commission‐‐
shall consider (I) the volume of imports of the subject merchandise, (II) the effect of imports of that merchandise on prices in the United States for domestic like products, and (III) the impact of imports of such merchandise on domestic producers of domestic like products, but only in the context of production operations within the United States; and. . . may consider such other economic factors as are relevant to the determination regarding whether there is material injury by reason of imports.
Section 771(7)(C) of the Act (19 U.S.C. § 1677(7)(C)) further provides that‐‐
In evaluating the volume of imports of merchandise, the Commission shall consider whether the volume of imports of the merchandise, or any

I‐3
increase in that volume, either in absolute terms or relative to production or consumption in the United States is significant. . . . In evaluating the effect of imports of such merchandise on prices, the Commission shall consider whether. . .(I) there has been significant price underselling by the imported merchandise as compared with the price of domestic like products of the United States, and (II) the effect of imports of such merchandise otherwise depresses prices to a significant degree or prevents price increases, which otherwise would have occurred, to a significant degree. . . . In examining the impact required to be considered under subparagraph (B)(i)(III), the Commission shall evaluate (within the context of the business cycle and conditions of competition that are distinctive to the affected industry) all relevant economic factors which have a bearing on the state of the industry in the United States, including, but not limited to . . . (I) actual and potential decline in output, sales, market share, profits, productivity, return on investments, and utilization of capacity, (II) factors affecting domestic prices, (III) actual and potential negative effects on cash flow, inventories, employment, wages, growth, ability to raise capital, and investment, (IV) actual and potential negative effects on the existing development and production efforts of the domestic industry, including efforts to develop a derivative or more advanced version of the domestic like product, and (V) in {an antidumping investigation}, the magnitude of the margin of dumping.
Organization of report
Part I of this report presents information on the subject merchandise, subsidy/dumping margins, and domestic like product. Part II of this report presents information on conditions of competition and other relevant economic factors. Part III presents information on the condition of the U.S. industry, including data on capacity, production, shipments, inventories, and employment. Parts IV and V present the volume of subject imports and pricing of domestic and imported products, respectively. Part VI presents information on the financial experience of U.S. producers. Part VII presents the statutory requirements and information obtained for use in the Commission’s consideration of the question of threat of material injury as well as information regarding nonsubject countries.
MARKET SUMMARY
Rebar generally is used to reinforce concrete structures in construction projects. The leading U.S. producers of rebar are Nucor, Gerdau, and CMC. The leading producers of rebar in

I‐4
subject countries include Deacero of Mexico and Icdas Celik Enerji Tersane e Ulasim Sanayi A.S. (“Icdas”) of Turkey.3 Leading producers of rebar in nonsubject countries include the following: ArcelorMittal Kryviy Rih of Ukraine, Byelorussian Steel Works of Belarus, Dongkuk Steel of Korea, and Hyundai Steel of Korea. The leading U.S. importer of rebar from Mexico is Deacero, while the leading U.S. importers of rebar from Turkey are ***, ***, and ***. The leading nonsubject sources of rebar in 2013 were the Dominican Republic, Habas of Turkey, and Spain. The leading U.S. importer of rebar from the Dominican Republic is ***. The leading U.S. importer of rebar from Habas is ***. The leading U.S. importer of rebar from Spain is ***. U.S. purchasers of product are rebar fabricators, distributors, or fabricators that also function as distributors in some instances. The largest U.S. purchasers of rebar are ***.
Apparent U.S. consumption of rebar totaled approximately 7.7 million short tons ($4.8 billion) in 2013. Currently, nine firms are known to produce rebar in the United States. U.S. producers’ U.S. shipments of rebar totaled 6.5 million short tons ($4.1 billion) in 2013, and accounted for 84.4 percent of apparent U.S. consumption by quantity and 85.6 percent by value. U.S. imports from subject sources totaled *** short tons ($***) in 2013 and accounted for *** percent of apparent U.S. consumption by quantity and *** percent by value. U.S. imports of rebar exported by nonsubject Habas, found to be neither dumped nor subsidized, totaled *** short tons ($***) in 2013 and accounted for *** percent of apparent U.S. consumption by quantity and *** percent by value. U.S. imports from all other nonsubject sources totaled 154,142 short tons ($95.8 million) in 2013 and accounted for 2.0 percent of apparent U.S. consumption by quantity and by value.
SUMMARY DATA AND DATA SOURCES
A summary of data collected in these investigations is presented in appendix C, tables C‐1 through C‐4.4 Except as noted, U.S. industry data are based on questionnaire responses of nine firms that accounted for virtually all U.S. production of rebar during 2013. U.S. imports are based on official Commerce import data and ***.5
3 In its final determinations, Commerce calculated a zero percent dumping margin and a de minimis subsidy rate for Habas Sinai Ve Tibbi Gazlar Istihsal Endustrisis A.S. (“Habas”) of Turkey. Accordingly, Habas is treated as a nonsubject source.
4 On April 18, 2014, Commerce preliminarily determined that certain deformed steel wire products are included in the scope of these investigations. On September 15, 2014, Commerce amended the scope to exclude certain deformed steel wire, but include other deformed steel wire. There is *** domestic production of non‐excluded deformed steel wire. Accordingly, summary data on non‐excluded deformed steel wire are limited to certain imports and foreign production and are presented in app. C, tables C‐2 through C‐4.
5 Official Commerce statistics presented in this report are for imports entered under Harmonized Tariff Schedule of the United States (2014) (“HTSUS”) subheadings 7213.10.00 and 7214.20.00 and statistical reporting number 7228.30.8010. Petitioners and Respondents view official Commerce
(continued...)
I‐5
PREVIOUS AND RELATED INVESTIGATIONS
In March 1964, the U.S. Tariff Commission issued an affirmative determination concerning LTFV imports of steel reinforcing bars from Canada (investigation No. AA1921‐33).6 In February 1970, the Tariff Commission issued an affirmative determination concerning LTFV imports of steel bars, reinforcing bars, and shapes from Australia (investigation No. AA1921‐62).7 There are no outstanding antidumping duty orders as a result of either of these investigations. In August 1973, the Tariff Commission issued a negative determination concerning LTFV imports of deformed concrete reinforcing bars of non‐alloy steel from Mexico (investigation No. AA1921‐122).8
More recently, in 1997 the Commission issued a final affirmative determination concerning LTFV imports of rebar from Turkey.9 Commerce issued an antidumping duty order on April 17, 1997.10 In 2003, the Commission determined that revocation of the order would be likely to lead to the continuation or recurrence of material injury to a U.S. regional industry within a reasonably foreseeable time.11 In December 2008, following partial revocation by Commerce of the antidumping duty order with respect to four Turkish manufacturers/exporters, the Commission issued a negative determination in its second five‐
(…continued) statistics as representative of U.S. imports. RTAC’s postconference brief, exh. 1, p. 36, and conference transcript, pp. 221‐222 (Nolan and Bond).
6 Steel Reinforcing Bars from Canada, Investigation No. AA1921‐33, Tariff Commission Publication 122, March 1964. In this investigation, the Tariff Commission focused on a Pacific Northwest industry consisting of three producers in Washington and Oregon.
7 Steel Bars, Reinforcing Bars, and Shapes from Australia, Investigation No. AA1921‐62, Tariff Commission Publication 314, February 1970. In this investigation, the Tariff Commission also focused on a Pacific Northwest industry consisting of three producers in Washington and Oregon.
8 Deformed Concrete Reinforcing Bars of Non‐Alloy Steel from Mexico, Investigation No. AA1921‐122, Tariff Commission Publication 605, August 1973. In this investigation, the Tariff Commission considered all U.S. facilities devoted to rebar production, but gave special attention to rebar facilities within and outside Texas which produced most domestic rebar sold in that state during the years prior to the investigation.
9 Concrete Reinforcing Bars from Turkey, Inv. No. 731‐TA‐745 (Final), USITC Publication 3034, April 1997. In making its determination, the Commission concluded that appropriate circumstances existed for a regional industry analysis, with the region consisting of the U.S. producers in the “Eastern Tier.” This region consisted of 22 contiguous states (Alabama, Connecticut, Delaware, Florida, Georgia, Kentucky, Louisiana, Maine, Maryland, Massachusetts, Mississippi, New Hampshire, New Jersey, New York, North Carolina, Pennsylvania, Rhode Island, South Carolina, Tennessee, Vermont, Virginia, and West Virginia), plus Puerto Rico and the District of Columbia.
10 Antidumping Duty Order: Certain Steel Concrete Reinforcing Bars From Turkey, 62 FR 18748, April 17, 1997.
11 Concrete Reinforcing Bars from Turkey, Inv. No. 731‐TA‐745 (Review), USITC Publication 3577, February 2003. The Commission again defined the region as the Eastern Tier.

I‐6
year review concerning rebar from Turkey.12 Commerce published its revocation of the antidumping duty order on rebar from Turkey on January 5, 2009, with an effective date of March 26, 2008.13
In May and July 2001, the Commission issued affirmative determinations concerning LTFV imports of rebar from Belarus, China, Indonesia, Korea, Latvia, Moldova, Poland, and Ukraine.14 Commerce issued an antidumping duty order on April 17, 1997.15 In July 2007, following affirmative determinations by Commerce,16 the Commission completed full five‐year reviews of the subject orders.17 The Commission determined that revocation of the antidumping duty orders on rebar from Belarus, China, Indonesia, Latvia, Moldova, Poland, and Ukraine would be likely to lead to continuation or recurrence of material injury to an industry in the United States within a reasonably foreseeable time, while revocation of the antidumping duty order on rebar from Korea would not be likely to lead to continuation or recurrence of material injury to an industry in the United States within a reasonably foreseeable time.18
12 Concrete Reinforcing Bars from Turkey, Inv. No. 731‐TA‐745 (Second Review), USITC Publication 4052, December 2008. The Commission revisited its regional industry definition and found that appropriate circumstances did not exist to conduct a regional industry analysis.
13 Revocation of Antidumping Duty Order: Certain Steel Concrete Reinforcing Bars from Turkey, 74 FR 266, January 5, 2009.
14 Concrete Reinforcing Bars from Indonesia, Poland, and Ukraine, Inv. Nos. 731‐TA‐875, 880, and 882 (Final), USITC Publication 3425, May 2001 and Concrete Reinforcing Bars from Belarus, China, Korea, Latvia, and Moldova, Inv. Nos. 731‐TA‐873‐874 and 877‐879 (Final), USITC Publication 3440, July 2001. In this determination, the Commission was evenly divided regarding the issue of a regional industry. Three Commissioners (Koplan, Okun, and Bragg) based their determinations on a regional industry analysis of a 30‐state region consisting of Wisconsin, Illinois, Missouri, Arkansas, and Louisiana, all states east of these states, as well as Puerto Rico, the District of Columbia, and Texas, whereas three Commissioners (Miller, Hillman, and Devaney) based their determinations on a national industry analysis.
15 Antidumping Duty Order: Certain Steel Concrete Reinforcing Bars From Turkey, 62 FR 18748, April 17, 1997.
16 Steel Concrete Reinforcing Bars from Moldova, the People’s Republic of China, South Korea, Indonesia, Poland, and Belarus; Final Results of the Expedited Sunset Reviews of the Antidumping Duty Orders, 71 FR 70509, December 5, 2006; Steel Concrete Reinforcing Bars from Ukraine; Final Results of the Sunset Review of Antidumping Duty Order, 72 FR 9732, March 5, 2007; and Steel Concrete Reinforcing Bars from Latvia; Final Results of the Sunset Review of Antidumping Duty Order, 72 FR 16767, April 5, 2007.
17 Steel Concrete Reinforcing Bar From Belarus, China, Indonesia, Korea, Latvia, Moldova, Poland, and Ukraine, Inv. Nos. 731‐TA‐873‐875, 877‐880, and 882 (Review), USITC Publication 3933, July 2007. In these first reviews, the Commission found that appropriate circumstances did not exist to conduct a regional industry analysis, so it based its determinations on a national industry analysis.
18 Steel Concrete Reinforcing Bar from Belarus, China, Indonesia, Korea, Latvia, Moldova, Poland, and Ukraine: Determinations, 72 FR 42110, August 1, 2007. The Commission conducted its analysis in the reviews on a national industry basis.

I‐7
Commerce consequently revoked the antidumping order on rebar from Korea19 and continued the antidumping duty orders on imports of rebar from Belarus, China, Indonesia, Latvia, Moldova, Poland, and Ukraine, effective August 9, 2007.20
In July 2012, Commerce initiated and the Commission instituted the second sunset reviews of antidumping duty orders on imports of rebar from Belarus, China, Indonesia, Latvia, Moldova, Poland, and Ukraine. In 2013, following affirmative determinations by Commerce,21 the Commission determined that revocation of the antidumping duty orders on rebar from Belarus, China, Indonesia, Latvia, Moldova, Poland, and Ukraine would be likely to lead to continuation or recurrence of material injury to an industry in the United States within a reasonably foreseeable time.22
PREVIOUS AND RELATED GLOBAL SAFEGUARD INVESTIGATIONS
In 2001, the Commission determined that rebar was being imported into the United States in such increased quantities as to be a substantial cause of serious injury, or threat thereof, to the domestic industry producing such articles, and recommended an additional ad valorem duty decreasing from 10 percent to 4 percent over four years.23 On March 5, 2002, President George W. Bush announced the implementation of steel safeguard measures. Import relief relating to rebar consisted of an additional tariff for a period of three years and one day (15 percent ad valorem on imports in the first year, 12 percent in the second year, and 9 percent in the third year).24 Following receipt of the Commission’s mid‐term monitoring report in September 2003, and after seeking information from the U.S. Secretary of Commerce and U.S. Secretary of Labor, President Bush determined that the effectiveness of the action taken had been impaired by changed circumstances. Therefore, he terminated the U.S. measure with respect to increased tariffs on December 4, 2003.25 On March 21, 2005, the Commission
19 Steel Concrete Reinforcing Bars from South Korea: Revocation of Antidumping Duty Order, 72 FR 44830, August 9, 2007.
20 Steel Concrete Reinforcing Bars from Belarus, Indonesia, Latvia, Moldova, the People’s Republic of China, Poland and Ukraine: Continuation of Antidumping Duty Orders, 72 FR 44830, August 9, 2007.
21 Steel Concrete Reinforcing Bars from Belarus, Indonesia, Latvia, Moldova, Poland, People’s Republic of China and Ukraine: Final Results of the Expedited Second Sunset Reviews of the Antidumping Duty Orders, 77 FR 70140, November 23, 2012.
22 Steel Concrete Reinforcing Bar from Belarus, China, Indonesia, Latvia, Moldova, Poland, and Ukraine: Determinations, 78 FR 41079, July 9, 2013. The Commission conducted its analysis in the second reviews on a national industry basis.
23 Steel; Import Investigations, 66 FR 67304, December 28, 2001. 24 Presidential Proclamation 7529 of March 5, 2002, To Facilitate Positive Adjustment to Competition
from Imports of Certain Steel Products, 67 FR 10553, March 7, 2002. The President also instructed the Secretaries of Commerce and the Treasury to establish a system of import licensing to facilitate steel import monitoring.
25 Presidential Proclamation 7741 of December 4, 2003, To Provide for the Termination of Action Taken With Regard to Imports of Certain Steel Products, 68 FR 68483, December 8, 2003. Import
(continued...)

I‐8
instituted an investigation under section 204(d) of the Trade Act of 1974 for the purpose of evaluating the effectiveness of the relief action imposed by President Bush on imports of certain steel products. The Commission transmitted its report on the evaluation to the President and the Congress on September 19, 2005.
NATURE AND EXTENT OF SUBSIDIES AND SALES AT LTFV
Nature of the subsidies
On September 15, 2014, Commerce published a notice in the Federal Register of its affirmative final determination of countervailable subsidies for producers and exporters of rebar from Turkey.26 The following programs in Turkey were determined to be countervailable:27
Provision of Natural Gas for Less Than Adequate Remuneration (LTAR)
Provision of Lignite for LTAR
Rediscount Program
Deductions from Taxable Income for Export Revenue Table I‐1 presents Commerce’s findings with respect to imports from Turkey.
Table I-1 Rebar: Commerce’s subsidy determinations with respect to imports from Turkey
Producer or exporter
Countervailable subsidy margin (percent)
Preliminary1 Final2
Habas Sinai ve Tibbi Gazlar Istihsal Endustrisi A.S. 0.78 (de minimis) 0.74 (de minimis)
Icdas Celik Enerji Tersane ve Ulasim Sanayi A.S. 0.10 (de minimis) 1.25 All others (de minimis) 1.25 1 Steel Concrete Reinforcing Bar From the Republic of Turkey: Preliminary Negative Countervailing Duty Determination, Preliminary Negative Critical Circumstances Determination, and Alignment With Final Antidumping Determination, 79 FR 10771, February 26, 2014. 2 Steel Concrete Reinforcing Bar From the Republic of Turkey: Final Affirmative Countervailing Duty Determination Final Affirmative Critical Circumstances Determination, 79 FR 54963, September 15, 2014.
(…continued) licensing, however, remained in place through March 21, 2005, and continues in modified form at this time.
26 Steel Concrete Reinforcing Bar From the Republic of Turkey: Final Affirmative Duty Determination Final Affirmative Critical Circumstances Determination, 79 FR 54963, September 15, 2014.
27 Commerce, International Trade Administration (ITA), Issues and Decision Memorandum for the Final Affirmative Countervailing Duty Determination and Final Critical Circumstances Determination in the Countervailing Duty Investigation of Steel Concrete Reinforcing Bar from the Republic of Turkey, September 8, 2014.

I‐9
Sales at LTFV
On September 15, 2014, Commerce published a notice in the Federal Register of its final affirmative determination of sales at LTFV with respect to imports from Mexico28 and its final negative determination of sales of LTFV with respect to imports from Turkey.29 Table I‐2 presents Commerce’s dumping margins with respect to imports of product from Mexico and Turkey.
Table I-2 Rebar: Commerce’s weighted-average LTFV margins with respect to imports from Mexico and Turkey
Country/producer or exporter LTFV (dumping) margin
(percent) Mexico Preliminary1 Final2
Deacero S.A.P.I. de C.V. 20.59 20.58 Grupo Acerero S.A. de C.V. 66.70 66.70 Grupo Simec 10.66 66.70 All others 20.59 20.58 Turkey Habas Sinai ve Tibbi Gazlar Istihsal Endustrisi A.S. 0.00 0.00 Icdas Celik Enerji Tersane ve Ulasim Sanayi A.S. 2.64 0.00 All others 2.64 0.00 1 Steel Concrete Reinforcing Bar From Mexico: Preliminary Determination of Sales at Less Than Fair Value, Preliminary Affirmative Determination of Critical Circumstances, and Postponement of Final Determination, 79 FR 22802, April 24, 2014; Steel Concrete Reinforcing Bar From Turkey: Preliminary Determination of Sales at Less Than Fair Value, Preliminary Affirmative Determination of Critical Circumstances, and Postponement of Final Determination, 79 FR 22804, April 24, 2014. 2 Steel Concrete Reinforcing Bar From Mexico: Final Determination of Sales at Less Than Fair Value and Final Affirmative Determination of Critical Circumstances, 79 FR 54967, September 15, 2014; Steel Concrete Reinforcing Bar From Turkey: Final Negative Determination of Sales at Less Than Fair Value and Final Determination of Critical Circumstances, 79 FR 54965, September 15, 2014.
28 Steel Concrete Reinforcing Bar From Mexico: Final Determination of Sales at Less Than Fair Value and Final Affirmative Determination of Critical Circumstances, 79 FR 54967, September 15, 2014.
29 Steel Concrete Reinforcing Bar From Turkey: Final Negative Determination of Sales at Less Than Fair Value and Final Determination of Critical Circumstances, 79 FR 54965, September 15, 2014.

I‐10
THE SUBJECT MERCHANDISE
Commerce’s scope
Commerce has defined the scope of these investigations as follows:
Steel concrete reinforcing bar imported in either straight length or coil form (“rebar”) regardless of metallurgy, length, diameter, or grade. Specifically excluded are plain rounds (i.e., nondeformed or smooth rebar). {…} Also excluded from the scope is deformed steel wire meeting ASTM A1064/A1064M with no bar markings (e.g., mill mark, size or grade) and without being subject to an elongation test.30 {…}
Tariff treatment
Based upon the scope set forth by the Department of Commerce, information available to the Commission indicates that the merchandise subject to these investigations is imported primarily under the following provisions of the Harmonized Tariff Schedule of the United States (2014) (“HTS”): subheadings 7213.10.00 and 7214.20.00 and statistical reporting number 7228.30.8010.31
HTS subheading 7213.10.00 covers concrete reinforcing bars and rod, of iron or nonalloy steel, hot‐rolled, in irregularly wound coils. HTS subheading 7214.20.00 covers straight concrete reinforcing bars and rods, of iron or nonalloy steel, that are not further worked than forged, hot‐rolled, hot‐drawn, or hot‐extruded, but including those twisted after rolling. HTS statistical reporting number 7228.30.8010 covers concrete reinforcing bars of other alloy steel, not further worked than hot‐rolled, hot‐drawn, or extruded. The general rate of duty for goods of each of these provisions is free.
On April 18, 2014, Commerce preliminarily determined that certain deformed steel wire products are included in the scope of these investigations.32 On September 15, 2014,
30 Steel Concrete Reinforcing Bar From Mexico: Final Determination of Sales at Less Than Fair Value and Final Affirmative Determination of Critical Circumstances, 79 FR 54967, September 15, 2014.
31 According to Commerce, the subject merchandise may also be imported under other HTS provisions that cover cold‐formed/cold‐finished or alloy bars and rods, including 7215.90.1000, 7215.90.5000, 7221.00.0015, 7221.00.0030, 7221.00.0045, 7222.11.0001, 7222.11.0057, 7222.11.0059, 7222.30.0001, 7227.20.0080, 7227.90.6085 (discontinued in 2014 and replaced with 7227.90.6030, 7227.90.6035, 7227.90.6040, and 7227.90.6090), 7228.20.1000, and 7228.60.6000. These numbers are provided for convenience and customs purposes only; the written description of the scope remains dispositive.
32 Scope Comments Decision Memorandum for the Preliminary Determination of the Less‐Than‐Fair‐Value Investigation of Steel Concrete Reinforcing Bar from Mexico and Turkey, Commerce Decision Memorandum, April 18, 2014. On June 19, 2014, Petitioner requested that Commerce amend the scope
(continued...)

I‐11
Commerce amended the scope to exclude certain deformed steel wire meeting ASTM A1064/A1064M with no bar markings (e.g., mill mark, size or grade) and without being subject to an elongation test.33 Such deformed steel wire (i.e., meeting ASTM A1064/A1064M with bar markings or with being subject to an elongation test) is not imported under HTS subheadings 7213.10.00 or 7214.20.00 or statistical reporting number 7228.30.8010, but rather may be imported under HTS statistical reporting number 7217.10.5090 and subheading 7217.10.60 and, depending on the characteristics of each shipment, may be imported under other provisions of HTS heading 7217 or 7223 (wire of stainless steel) or 7229 (wire of other alloy steel).34
THE PRODUCT
Description and applications
Rebar Rebar is a long‐rolled steel product that is commonly used in construction projects to
provide strength to concrete. Rebar is manufactured as either plain‐round or deformed round bars. However, in the United States deformed rebar is used almost exclusively because it provides greater adherence to concrete due to its ridges.35 Rebar can be shipped in either straight lengths or coils. Coiled rebar is produced in smaller sizes than straight lengths and is used for smaller, more complex applications.
The construction industry is the principal consumer of rebar and uses it extensively to reinforce concrete structures. Embedding rebar in concrete enhances the concrete’s compressional and tensional strength and controls cracking as concrete shrinks during curing or due to temperature fluctuations. Rebar resists tension, compression, temperature variation, and shear stresses in reinforced concrete because the surface protrusions on a deformed bar
(…continued) to exclude certain types of deformed steel wire. Petitioner, Steel Concrete Reinforcing Bar from Mexico and Turkey: Request to Amend Scope Language, letter to the Secretary of Commerce, June 19, 2014.
33 Steel Concrete Reinforcing Bar From Mexico: Final Determination of Sales at Less Than Fair Value and Final Affirmative Determination of Critical Circumstances, 79 FR 54967, September 15, 2014.
34 For more information on deformed steel wire, see the “Descriptions and applications” section of Part I.
35 Plain‐round rebar tends to be used in concrete for special purposes, such as dowels at expansion joints where bars must slide in a metal or paper sleeve, for contraction joints in roads and runways, and for column spirals. Plain‐round rebar offers only smooth, even surfaces for bonding with concrete. Because deformed rebar has greater surface contact (due to deformations) with the concrete compared with plain‐round rebar, deformed rebar adheres to concrete better than plain‐round rebar does. In building reinforcement applications where either deformed or plain‐round rebar in the same diameter could be used, 40 percent more plain‐round rebar would be needed than deformed rebar. Purposes and Types of Reinforcing Steel, found at http://www.tpub.com/steelworker2/76.htm, retrieved on October 17, 2013.

I‐12
inhibit longitudinal movement relative to the surrounding concrete. During construction projects, rebar is placed in a form and concrete from a mixer is poured over it. Once the concrete has set, deformation is resisted and stresses are transferred from the concrete to the rebar by friction and adhesion along the surface of the steel. A smaller market for rebar is for mine bolts, which hold support structures in mines.36
Rebar sold in the U.S. market is generally manufactured to conform to the test standards of the American Society for Testing and Materials (“ASTM”) International,37 which specify for each bar size the nominal unit weight, nominal dimensions, and deformation requirements (dimension and spacing of deformations), as well as chemical composition, tensile strength, yield strength (grade), and elongation tolerances.38 There are several ASTM specifications for rebar, based on steel composition. Generally, deformed rebar of these various ASTM specifications can be interchangeable with plain‐round rebar, except for use in seismic areas.39
To conform to ASTM specifications, deformed rebar is identified by bar markings—distinguishing sets of raised marks legibly rolled onto the surface of one side of the bar to denote: (1) the producer’s hallmark, (2) mill designation, (3) size designation, (4) specification of steel type, and (5) minimum yield designation. Guidelines for use of deformed rebar in building construction are provided by the American Concrete Institute (ACI) 318 Code. Guidelines for use of deformed rebar in highway and bridge construction are provided by the American Association of State and Highway and Transportation Officials (“AASHTO”) Standard Specifications. The contents of the two specifications are similar and are applicable throughout the continental United States and in Puerto Rico.
Rebar is available in sizes #3 through #18, as specified by ASTM standards. These size indicators are about eight times the respective nominal diameters in inches (e.g., 3/8‐inch bar is
36 Petition, p. 8. 37 ASTM International is not a product testing or certification organization. Rather, manufacturers can
choose voluntarily to indicate on the label or packaging that their products have been tested according to ASTM standards.
38 The ASTM standards apply to both deformed and plain‐round rebar, whether in straight lengths or coiled. There are separate and non‐interchangeable standards for rebar with dimensions and designations in English units (e.g., ASTM A615) versus SI (metric) units (e.g., ASTM A615M).
39 Deformed rebar is most commonly rolled from nonalloy billet steel to the requirements of ASTM A615/A615M. Rebar can also be re‐rolled from the head (top) portion that has been slit from scrapped nonalloy steel rails or re‐rolled from scrapped axles of railroad rolling stock and locomotives (ASTM A996/A996M, deformed rebar of either rail or axle steel; ASTM A616/A616M, deformed and plain rebar of rail steel; and A617/A617M, deformed and plain rebar of axle steel). For special applications (e.g., in seismic areas) that require a combination of strength, weldability, ductility, and bendability, ASTM A706/A706M (a high‐strength low‐alloy (HSLA) steel) is specified. Certain forged rebars of nonalloy or HSLA steel are covered under ASTM A970/970M. There is also a standard for deformed and plain rebar of stainless steel (ASTM A955/A955M) for special applications requiring corrosion resistance (e.g., for long‐term resistance to road salts and de‐icing chemicals on bridges) or controlled magnetic permeability (e.g., for avoiding interference with hospital imaging equipment).

I‐13
designated as size #3 and 1‐inch rebar is designated as size #8),40 although the relationship diverges somewhat for rebar larger than size #9.41 Coiled rebar is only sold from sizes #3 to #6, as larger sizes of rebar cannot be coiled.42 In total, rebar is available in diameters ranging from 0.375 inch (size #3) to 2.257 inches (size #18).
Certain rebar sizes and lengths tend to predominate among end uses. A considerable portion of smaller sizes (i.e., #3‐#5) and shorter lengths (i.e., 20‐30 foot) is applied to light construction applications (e.g., residences, swimming pools, patios, and walkways).43 By contrast, heavy construction applications (e.g., high‐rise buildings, commercial facilities, industrial structures, bridges, roads, etc.) use all sizes and lengths. The larger sizes (#6 and above) and longer lengths (60 feet or more) are used almost exclusively in heavy construction applications.44
Rebar is shipped in either straight lengths or coils. Straight length rebar is available from mills in various lengths, from less than 20 feet to more than 60 feet. Coiled rebar is produced in accordance with ASTM A615 (Grades 40 and 60) and A706.45 Coiled rebar is preferred for use in smaller applications that have more complex shapes because coiled rebar is able to run efficiently through more complicated fabrication processes with less waste and scrap than straight length rebar.46
Rebar may be coated by an epoxy (a powder‐coated paint) after the manufacturing process to enhance corrosion resistance.47 Coated rebar is used in applications where the rebar is exposed to a high degree of salt, such as in roads, bridges and parking garages. Rebar may also be bent in the post‐manufacturing fabrication process to reinforce the rebar joints.48
Deformed steel wire
In general, deformed steel wire is a cold‐drawn wire product used for the reinforcement
of concrete. Deformed steel wire sold in the U.S. market is manufactured to conform to the test standards of ASTM A1064 or ASTM A496.49 ASTM A1064 covers deformed wire, plain wire (for
40 Nominal diameters of deformed rebar are equivalent to those of plain round bars of the same unit weight (mass) per foot (meter).
41 Rebar is also available in metric sizes, with nominal diameters from 10 millimeters (mm) to 57 mm, as specified by ASTM standards.
42 Conference transcript, p. 179 (Noriega). 43 Hearing transcript, p. 167 (Bergren), pp. 195‐96 (Campbell), and pp. 212‐13 (Gutierrez); RTAC’s
posthearing brief, pp. 12‐13. 44 Harris Supply Solutions’ Website, Rebar Sizes #3 to #18, found at
http://www.harrissupplysolutions.com/3‐rebar.html, retrieved on October 18, 2013. 45 Conference transcript, p. 83 (Kerkvliet). 46 Conference transcript, pp. 83‐84 (Webb and Kerkvliet). 47 Conference transcript, p. 155 (Byer). 48 Conference transcript, pp. 155‐156 (Byer). 49 ASTM A1064, Steel Wire and Welded Wire Reinforcement, Plain and Deformed, for Concrete; ASTM
A494, Steel Wire, Deformed, for Concrete Reinforcement.

I‐14
concrete), and welded wire reinforcement (mesh).50 ASTM A494 covers deformed wire.51 Each specification specifies the nominal unit weight and dimensions, including diameter and cross‐sectional area, deformation requirements (depth and spacing), and tension strength (tensile and yield strength) requirements. Deformed steel wire is available in sizes D1 through D45, as specified by ASTM A494 and A1064. The size indicators refer to the cross‐sectional area of the wire in increments of hundredths of an inch (e.g., D1‐sized wire has a cross‐sectional diameter of 0.010 square inches while D45‐sized wire has a cross‐sectional diameter of 0.450 square inches). Deformed steel wire is produced in diameters ranging from 0.113 inches (wire size D1) to 0.757 inches (wire size D45). The diameters of deformed steel wire produced in sizes D11 through D45 (0.374–0.757 inch) overlap with the diameters of rebar produced in sizes 3 through 6 (0.375–0.750 inch).
Deformed steel wire, defined broadly, is used in a wide range of concrete reinforcing applications. Deformed steel wire is often used to produce welded wire mesh for concrete reinforcement. Deformed steel wires are pre‐straightened, sheared to the required length, and welded together to form the welded wire mesh. According to industry representatives, welded wire mesh made from deformed steel wire can substitute for rebar in certain applications.52 According to some industry estimates, 80 percent of the U.S. rebar market is in sizes that could potentially be replaced by welded wire mesh products.53
Manufacturing processes
Rebar Rebar mills typically specialize in producing rebar either from (1) billet steel, (2) rail
steel, or (3) axle steel, because each involves different starting materials and imposes somewhat different rolling requirements. The most common manufacturing process to produce rebar from billet steel consists of three stages: (1) melting steel scrap, (2) casting billets, and (3) hot‐rolling the bar. In contrast, the manufacturing process for rebar produced from scrapped rail or axle steel, or from purchased billets, requires only reheating these materials and hot‐rolling the bar.
In the United States, non‐integrated “mini‐mills” typically produce billets for rebar by melting steel scrap in electric arc furnaces. Once molten, liquid steel is poured from the furnace into a refractory‐lined ladle, where any necessary alloys are added to effect the required
50 ASTM A1064 does not require bar markings or an elongation test. ASTM International, ASTMA1064/A1054M: Steel Wire and Welded Wire Reinforcement, Plain and Deformed, for Concrete, 2009.
51 According to Deacero, ASTM A1064 replaced ASTM A496 in 2013, but the industry continues to refer to the ASTM A496 standard. Deacero, Response to Commission staff request for information regarding deformed steel wire, May 30, 3014.
52 For more information on deformed steel wire, see app. D. 53 AMM, “Insteel sees growth in rebar substitutes,” August 12, 2014.

I‐15
chemical and physical properties. Molten steel must be cast into billets of the size and shape suitable for the rolling process. In the more common continuous strand‐casting process, molten steel is poured from the ladle into a tundish (reservoir dam), which controls the rate of flow into the molds of the caster. A solid “skin” forms around the molten steel at the top openings of the mold, and as the columns of partially solidified steel descend through the caster, water sprays rapidly cool the cast steel (which helps minimize compositional segregation) to the point that the strands are completely solidified when emerging from the bottom of the caster. Lengths of continuous‐cast billets are flame cut at intervals, and then may be either sent directly for further processing or be cooled on a cooling bed and subsequently stored for later use.
Prior to rolling, newly cast billets, scrapped rails or scrapped railroad axles are heated to rolling temperature in a reheat furnace. The steel is reduced in size as it passes through successive rolling stands. Most modern rolling mills are in‐line, and rebar of different sizes can be produced by changing the rolls. For deformed rebar, deformations are rolled onto the surface of the rebar as it passes through the final finishing stand, which has patterns cut into the grooves of the rolls.54 After the rolling process, straight length rebar is cut to length before being sent to a cooling bed to be air‐cooled. Coiled rebar, however, goes to a reforming tub, where it is spooled and cut to the desired weights or lengths.55 Testing for tensile properties, including an elongation test (a measure of ductility), is then performed on test specimens of either straight length rebar or coiled rebar that is subsequently straightened prior to testing.
Rebar can be water‐quenched and tempered, rather than air‐cooled. Water‐quenching is a cooling process used to increase tensile strength in order for the rebar to comply with ASTM standards.56 Quenched‐and‐tempered rebar can meet the same physical property requirements of the ASTM A615/A615M specification without the addition of certain alloys to the steel billets that are rolled into rebar, and thus is slightly less expensive to produce. In this process (the Thermex process),57 hot‐rolled rebar passes through a water‐quenching stand (a series of water coolers), which rapidly cools the outer case of the rebar, before the final finishing process. The quench‐and‐temper treatment causes a dual metallurgical structure to form in the cross‐section of the bar, producing a rebar with a stronger outer case and a more ductile core.
Some U.S. rebar producers produce additional products using the same equipment, machinery, and production workers that are used to produce rebar, namely merchant bar, special‐bar quality (SBQ) bar products, and wire rod. Merchant bar products include bars with round, square, flat, angled, and channeled cross sections, and are used by fabricators and
54 When rolling plain rebar with uniformly smooth surfaces rather than with deformations, smooth‐grooved rolls are substituted in the final finishing stand.
55 Conference transcript, p. 137 (Kerkvliet). 56 Conference transcript, p. 157 (Porter). 57 Thermex refers to both the water‐quench and tempering process, as well as the mill equipment
used to produce rebar through this process. The Thermex process was developed and branded by Germany engineering firm Hennigsdorfer Stahl Engineering (HSE) in the 1970s.

I‐16
manufacturers to produce a variety of products, including steel floor and roof joists, safety walkways, ornamental furniture, stair railings, and farm equipment.58 SBQ bar products are made from higher‐quality carbon and alloy steels that have greater mechanical properties, metallurgical consistency, and dimensional accuracy than do merchant bar products. SBQ is principally used to produce automotive components. Wire rod (delivered in coil form) is used by manufacturers to provide a variety of products, such as chain‐link fencing, nails, and wire.59 SBQ bar products are typically priced highest, followed by merchant bar, wire rod, and rebar.60
Deformed steel wire
Deformed steel wire is produced from hot‐rolled steel wire rod, the primary material
input. Wire rod is first cleaned and descaled to remove any dirt or mill scale. Cleaning and descaling are accomplished chemically using a strong acid, or mechanically using abrasives. The cleaned and descaled wire rod is then coated with zinc phosphate, a lubricant to aid in the drawing process, and cold‐drawn through a series of drawing dies to reduce the cross‐sectional area. At the end of the drawing process, negative deformations (indentations) are rolled onto the surface of the wire at specified depths and dimensions in two or more lines spaced uniformly around the wire. The indentations increase the adherence of the wire to the concrete.
DOMESTIC LIKE PRODUCT
In its comments to Commerce regarding the scope of these investigations, Mexican respondent Deacero asserted that two of its product families—namely, certain deformed steel wire products—should be excluded from the scope.61 Deacero argued that the scope of these investigations is defined to cover steel concrete reinforcing bar and not deformed steel wire used to reinforce concrete. Deacero further contended that steel wire is cold‐drawn from wire rod, while rebar is manufactured directly from steel billet using a hot‐rolled process. Deacero stated that the products in question are primarily used to manufacture certain welded wire products (such as welded wire mesh and welded wire reinforcement mats) and to a lesser extent, used as substitutes for rebar. Petitioner argued that the products in question should be
58 Schnitzer Steel, “Products,” (available at http://www.schnitzersteel.com/steel_manufacturing_products.aspx, retrieved September 27, 2013).
59 Schnitzer Steel, “Products,” (available at http://www.schnitzersteel.com/steel_manufacturing_products.aspx, retrieved September 27, 2013).
60 According to ***, average U.S. spot prices in August 2014 were $*** per short ton for merchant bar, $*** per short ton for wire rod, and $*** per short ton for rebar (*** does not collect specific pricing data on SBQ products). ***.
61 Deacero, letter to Secretary Pritzker, October 31, 2013, referenced as attachment 1 to letter to Secretary Barton, May 30, 2014.

I‐17
covered by the scope of these investigations.62 Petitioner contended that Deacero’s alleged distinctions are all irrelevant based upon the language of the scope.
On April 18, 2014, Commerce preliminarily determined that certain deformed steel wire products are included in the scope of these investigations.63 On September 15, 2014, Commerce amended the scope to exclude certain deformed steel wire meeting ASTM A1064/A1064M with no bar markings (e.g., mill mark, size or grade) and without being subject to an elongation test.64 Two firms identified as producers of deformed steel wire, broadly defined, (Insteel and Tree Island Wire) provided responses to the Commission’s U.S. producer questionnaire, and provided usable data on their production operations. Two firms identified as producers of rebar also reported producing deformed steel wire, broadly defined, (Gerdau and Nucor), and provided usable data on their production operations. None of these firms reported producing deformed steel wire meeting ASTM A1064 with bar markings or with being subject to an elongation test.65 Accordingly, there is no reported domestic production of deformed steel wire that falls within Commerce’s scope. Nonetheless, Petitioner argues that for purposes of the Commission’s domestic like product analysis, the Commission should include deformed steel wire found to be within Commerce’s scope.66 Deacero argues that despite the amended scope definition, deformed steel wire not meeting Commerce’s scope definition (“non‐scope deformed steel wire”) is a separate like product, and requests that the Commission find that non‐scope deformed steel wire is a separate like product, and that the domestic industry producing non‐scope deformed steel wire is neither materially injured nor threated with material injury by reason of subject imports.67 For a discussion of deformed steel wire, broadly defined, and the Commission’s decision regarding the appropriate domestic product(s) that are “like” the subject imported product, see appendix D.
62 Scope Comments Decision Memorandum for the Preliminary Determination of the Less‐Than‐Fair‐Value Investigation of Steel Concrete Reinforcing Bar from Mexico and Turkey, Commerce Decision Memorandum, April 18, 2014.
63 Scope Comments Decision Memorandum for the Preliminary Determination of the Less‐Than‐Fair‐Value Investigation of Steel Concrete Reinforcing Bar from Mexico and Turkey, Commerce Decision Memorandum, April 18, 2014.
64 Steel Concrete Reinforcing Bar From Mexico: Final Determination of Sales at Less Than Fair Value and Final Affirmative Determination of Critical Circumstances, 79 FR 54967, September 15, 2014.
65 RTAC’s posthearing brief, exh. 1, p. 51; email from *** to Commission staff, dated September 17, 2014; email from *** to Commission staff, dated September 12, 2014.
66 RTAC’s posthearing brief, exh. 1, p. 49. 67 Deacero’s posthearing brief, p. 59 (response to Commission staff question 1).


II‐1
PART II: CONDITIONS OF COMPETITION IN THE U.S. MARKET
U.S. MARKET CHARACTERISTICS
The primary use of rebar is concrete reinforcement. As a result, the U.S. market for rebar is tied closely to U.S. construction activity. Major end‐use products requiring rebar include roads and bridges, commercial and industrial construction, residential construction, and public construction.
While some manufactured rebar is used in construction applications with no further processing, a large share is sold to fabricators that further process the rebar, using it to create forms used in construction. The three largest U.S. producers, CMC, Gerdau, and Nucor, as well as Byer, own purchasing firms that operate as fabricators and distributors. These purchasing firms obtain rebar for fabrication or distribution from their parent companies and in some cases from other producers and import suppliers.
U.S. PURCHASERS
Purchaser questionnaires were sent to 84 firms identified by producers and importers as among their ten largest purchasers.1 Twenty‐eight purchasers provided usable questionnaire responses. The largest responding purchasers, by far, are ***, each of which accounted for more than *** percent of all purchases reported by the responding purchasers in 2013. Together, these three largest purchasers accounted for *** percent of all reported purchases in 2013.2 Eleven purchasers are solely end users,3 eight are solely distributors, and eight are both distributors and end users.4 Four purchasers are related to U.S. producers: CMC, Gastrich (Byer), Gerdau, and Harris Supply (Nucor). Purchases by these related firms (including internal transfers) represented *** percent of all rebar bought by responding purchasers in 2013.5 Six purchasers reported purchasing deformed steel wire as well as rebar, while 21 rebar purchasers reported no purchases of deformed steel wire.
1 ***. 2 None of the other responding purchasers accounted for as much as *** percent of the reported
purchases in 2013. 3 The questionnaire requested that both fabricators and construction companies identify themselves
as end users. 4 Purchasers that were both fabricators and distributors include: ***. 5 These four firms purchased *** percent of all U.S. apparent consumption of rebar, *** percent of
U.S shipments of U.S.‐produced rebar, *** percent of U.S. imports of Mexican rebar, *** percent of U.S. imports of Turkish (including Habas) rebar, and *** percent of U.S. imports of rebar from other countries in 2013. However, this ***.

II‐2
CHANNELS OF DISTRIBUTION
U.S. producers’ sales were more likely to be to firms that were both distributors and end users than to firms that were only end users; sales to firms that were only distributors were least common.6 Importers of rebar from Mexico and Turkey sold mainly to distributors (tables II‐1 and II‐2).7 Imports from other sources mainly were sold to purchasers that were both distributors and end users in 2011 and 2012, but were mainly to distributors in 2013 and January‐March 2014. As shown in table II‐3, the largest volume of shipments in each period was to distributors/end users, followed by shipments to distributors, and finally by shipments to end users without distribution arms.
As presented in table II‐4, purchasers reported the sources of the rebar they purchased. All but two purchasers reported purchasing U.S.‐produced rebar; only *** did not purchase U.S.‐produced product. Four of 11 end users, 7 of 8 distributors, 2 of 4 independent end users/distributors, and 2 of 4 related end users/distributors reported purchasing Mexican rebar.8 Three of 11 end users, 7 of 8 distributors, 3 of 4 independent end users/distributors, 2 of 4 related end users/distributors, and *** reported purchasing Turkish rebar.9
6 These results were generally, but not entirely, consistent with reporting in prior proceedings. Compare USITC Publications 4409, 4052, and 3933.
7 ***. E‐mail correspondence, ***, September 29, 2014. 8 ***. 9 Purchasers were not asked to report purchases from Habas separately from product from other
Turkish sources so this includes purchases from Habas.

II‐3
Table II-1 Rebar: Shares of U.S. producers’ and importers’ U.S. shipments, by sources and channels of distribution, by shares, 2011-13, January-March 2013, and January-March 2014
Item
Period Calendar year January-March
2011 2012 2013 2013 2014 Share of reported shipments (percent) U.S. producers’ U.S. shipments of rebar: Distributors 19.4 18.7 19.7 20.3 18.5 End users 28.8 29.2 28.5 27.8 29.6 Firms that are both distributors and end users 51.9 52.2 51.8 51.9 51.9 U.S. importers’ U.S. shipments of rebar from Mexico: Distributors1 *** *** *** *** *** End users *** *** *** *** *** Firms that are both distributors and end users1 *** *** *** *** *** U.S. importers’ U.S. shipments of rebar from Turkey (excluding Habas): Distributors *** *** *** *** *** End users *** *** *** *** *** Firms that are both distributors and end users *** *** *** *** *** U.S. importers’ U.S. shipments of rebar from Turkey (Habas): Distributors *** *** *** *** *** End users *** *** *** *** *** Firms that are both distributors and end users *** *** *** *** ***U.S. importers’ U.S. shipments of rebar from all other countries: Distributors *** *** *** *** *** End users *** *** *** *** *** Firms that are both distributors and end users *** *** *** *** *** Total Distributors 27.0 27.1 29.7 27.7 32.5 End users 25.9 26.3 25.2 25.7 24.6 Firms that are both distributors and end users 47.1 46.7 45.2 46.6 42.8
1 ***. Source: Compiled from data submitted in response to Commission questionnaires.

II‐4
Table II-2 Rebar: U.S. producers’ and importers’ U.S. shipments, by sources and channels of distribution, Quantities in short tons, 2011-13, January-March 2013, and January-March 2014
Item
Period Calendar year January-March
2011 2012 2013 2013 2014 Quantities of reported shipments (short tons) U.S. producers’ U.S. shipments of rebar: Distributors 1,139,821 1,196,505 1,285,705 301,378 285,842 End users 1,692,509 1,870,642 1,858,208 413,229 456,740 Firms that are both distributors and end users 3,050,916 3,344,228 3,376,861 771,232 802,624U.S. importers’ U.S. shipments of rebar from Mexico: Distributors1 *** *** *** *** *** End users *** *** *** *** *** Firms that are both distributors and end users1 *** *** *** *** ***U.S. importers’ U.S. shipments of rebar from Turkey (excluding Habas): Distributors *** *** *** *** *** End users *** *** *** *** *** Firms that are both distributors and end users *** *** *** *** ***U.S. importers’ U.S. shipments of rebar from Turkey (Habas): Distributors *** *** *** *** *** End users *** *** *** *** *** Firms that are both distributors and end users *** *** *** *** ***U.S. importers’ U.S. shipments of rebar from all other countries: Distributors *** *** *** *** *** End users *** *** *** *** *** Firms that are both distributors and end users *** *** *** *** ***Total Distributors 1,779,072 1,966,254 2,246,679 460,964 619,107 End users 1,703,782 1,905,368 1,906,253 428,299 469,153 Firms that are both distributors and end users 3,101,922 3,386,268 3,421,123 776,253 815,125
1 ***. Source: Compiled from data submitted in response to Commission questionnaires.

II‐5
Table II-3 Rebar: U.S. producers’ and importers’ U.S. shipments, by channels of distribution and source, quantities in short tons, 2011-13, January-March 2013, and January-March 2014
Item
Period Calendar year January-March
2011 2012 2013 2013 2014 Quantities of reported shipments (short tons) Sales to distributors: U.S. producers 1,139,821 1,196,505 1,285,705 301,378 285,842 Mexico1 *** *** *** *** *** Turkey (excluding Habas) *** *** *** *** ***Total subject *** *** *** *** *** Turkey (Habas) *** *** *** *** *** Other countries *** *** *** *** ***Total 1,779,072 1,966,254 2,246,679 460,964 619,107 Sales to end users: U.S. producers 1,692,509 1,870,642 1,858,208 413,229 456,740 Mexico *** *** *** *** *** Turkey (excluding Habas) *** *** *** *** ***Total subject *** *** *** *** *** Turkey (Habas) *** *** *** *** *** Other countries *** *** *** *** ***Total 1,703,782 1,905,368 1,906,253 428,299 469,153 Sales to firms that are both distributors and end users: U.S. producers 3,050,916 3,344,228 3,376,861 771,232 802,624 Mexico1 *** *** *** *** *** Turkey (excluding Habas) *** *** *** *** ***Total subject *** *** *** *** *** Turkey (Habas) *** *** *** *** *** Other countries *** *** *** *** ***Total 3,101,922 3,386,268 3,421,123 776,253 815,125Sales total: U.S. producers 5,883,246 6,411,375 652,0774 1,485,839 1,545,206 Mexico *** *** *** *** *** Turkey (excluding Habas) *** *** *** *** *** Total subject *** *** *** *** *** Turkey (Habas) *** *** *** *** *** Other countries *** *** *** *** *** Total 6,584,776 7,257,890 7,574,055 1,665,516 1,903,385
1 ***. Source: Compiled from data submitted in response to Commission questionnaires.

II‐6
Table II-4 Rebar: Sources of rebar purchased in 2011 through 2013 reported by purchasers, by type of purchaser
* * * * * * *
Purchasers were asked if their suppliers compete with them by selling to their customers. Most of the responding purchasers (13 of 24) reported that they did compete with their suppliers. All eight responding distributor/end users reported competing with their suppliers (including ***), with six further indicating:
***;
***;
***;
***;
(***) reported competition with ***, and
(***) reported competition at ***. Three of eight responding distributors reported competition with their suppliers, reporting:
one (***) reported that this occurred when customers need to manage cash flow or *** did not have enough material to cover the purchasers needs;
*** reported that it sold to accounts to which domestic mills and trading companies also sell; and
*** reported that its customers “occasionally contact our sources directly for quotation” and each of its “suppliers from time to time will sell a *** customer material in competition.”
Two of the seven responding end users reported competing with their suppliers, reporting:
*** reported that *** reported “***;” and
*** reported competition with mill‐owned fabrication shops.10
Purchasers’ major customers
Purchasers were asked to report the “major types of customers to which …{they} sell rebar.” Twenty‐two purchasers responded, including five purchasers that reported that they were end users, all eight firms that reported they were distributors, eight firms that reported that they were end user/distributors, and ***.
End users reported selling to: “***;” “general contractors and sub‐contractors;” “commercial contractors, residential contractors, highway construction contractors, and we sell to the general public also;” “contractors;” and “commercial construction companies, general contractors, and home builders.”
10 One purchaser ***.

II‐7
Distributors reported selling to: “pre‐casters, fabricators, home improvement warehouses, lumber yards, wholesalers;” “rebar fabricators; precast concrete manufacturers; concrete construction suppliers (retail);” “lumber yards, distributors, some end users;” “retail lumber yards;” “hardware and contractors;” “retail lumber yards, fabrication shops, pre‐casters and masonry centers;” “rebar fabricators, pre‐casters, national home retail centers, lumber dealers, professional (pro) dealers, pool manufacturers;” and “lumberyards, concrete/masonry suppliers.”
Independent end users/distributors reported selling to: “fabricators, pre‐casters, building material companies;” “construction supply houses, pre‐casters, and fabricators;” “concrete yards, lumber yards, building material dealers, pool supply yards, precast manufacturers, smaller fabricators;” and “other fabricators and contractors and other distributors.”
Related end users/distributors reported selling to: “our distribution customers are small contractors, pool builders, local lumber yards, etc.,” “brokers, construction supply companies, and rebar fabrication companies,” “contractors, lumber yards, pool companies, precast suppliers, rental yards, service centers,” and “general contractors, concrete subcontractors, other distributors.”
Mexican respondents contend that domestic and imported rebar are concentrated in different sectors of the U.S. market.11 They report that imports are largely unable to sell to fabricators because fabricators prefer longer rebar.12 Deacero, in particular, reports that it is unable to make rebar longer than 42 feet.13 Mexican respondents also reported that their rebar generally is more likely to be used in residential construction because it is sold in shorter lengths and is more likely be fabricated on the building site rather than be fabricated by a fabricator.14 As a result, Mexican respondents claim that one of the reasons that consumption of Mexican product has grown more rapidly than that for U.S.‐produced rebar is that residential construction has grown more rapidly than other types of construction.15 Respondents further contend that U.S. producers’ related downstream end users/distributors help insulate the U.S. producers from import competition.16
RTAC, however, disagrees with these characterizations of the market. It states that U.S producers sell both to fabricators and distributors; sell in the residential and nonresidential
11 Mexican respondents also claim that the amount of rebar that U.S. producers have reported that they sell in the channels of distribution differs from what they reported in the latest Commission review of rebar. Mexican respondent’s posthearing brief, responses to Commissioners’ questions p. 16. In 2011 and 2012 over 30 percent of sales were reportedly to distributors while less than 1 percent of their sales were reportedly to distributor/end‐users. Steel Concrete Reinforcing Bar from Belarus, China, Indonesia, Latvia, Moldova, Poland, and Ukraine, Inv. Nos. 731‐TA‐873‐875, 877‐880, and 882 (Second Review), USITC Publication 4409, July 2013 (Table II‐1).
12 Hearing transcript, pp. 155‐157 (Bazan). 13 Hearing transcript, p. 150 (Gutierrez). 14 Hearing transcript, p. 161 (Bergren). 15 Hearing transcript, p. 202 (Campbell). 16 Hearing transcript, p. 272 (Campbell).

II‐8
construction markets; and sell all sizes, lengths, and grades. It argues that “there are no clean or isolated channels of distribution.”17 In addition, product sold to distributors may be sold by these distributors to fabricators; and that “there is no separate market for 20, 40 or 60 foot rebar. It is simply a matter of convenience in terms of the rebar length.”18
There is some overlap of sales between customers of importers and those of the U.S. producers. Importers listed 66 different purchasers.19 These purchasers overlapped with purchasers reported by the producers in 41 instances, and 13 separate purchasers were reported to be among the 10 largest purchasers by both one or more U.S. producer and one or more importer.
Regional sales
U.S. producers reported selling rebar to all regions in the contiguous United States (table II‐5).20 Importers in aggregate also sell to all regions of the contiguous United States; however, those selling rebar from Mexico reported that they did not sell into the Northeast, and those selling rebar from Turkey did not sell into the Mountain and Pacific Coast regions. Firms were also asked if they sold rebar in Puerto Rico, and if they did how much they sold in Puerto Rico. Firms selling to Puerto Rico included ***,21 ***,22 ***, and ***. With respect to rebar sold in Puerto Rico since 2011, ***.23
17 Hearing transcript, pp. 44‐45 (Alvarado). 18 Hearing transcript, pp. 60‐61 (Melvin). 19 Many of these were listed by multiple importers, with a total of 122 responses listed including
duplicates. 20 Four of eight responding U.S. producers reported selling to all regions of the contiguous United
States. Every region in the contiguous United States had at least six U.S. suppliers. 21 ***. 22 ***. ***. 23 ***. E‐mail from ***, August 5, 2014.

II‐9
Table II-5 Rebar: Geographic market areas in the United States served by U.S. producers and importers, by number of responding firms
Region U.S. producers Mexico Turkey Nonsubject
Imports Northeast 8 0 9 0 Midwest 8 6 6 0 Southeast 8 2 10 1 Central Southwest 6 9 11 1 Mountain 6 6 0 0 Pacific Coast 6 6 0 0 Puerto Rico 2 1 3 2 Other1 4 1 1 0
1 All other U.S. markets, including AK, HI, and VI, among others. Source: Compiled from data submitted in response to Commission questionnaires.
Shipping distances
Table II‐6 presents the distances U.S. producers and importers shipped rebar in 2013. U.S. producers reported that most of their sales were within 250 miles of their point of shipment. Most imports from Turkey are sold within 100 miles of point of shipment and most imports from Mexico are shipped between 101 and 250 miles.
Table II-6 Rebar: Distances transported by share of sales, 2013
Distance U.S. producers Importers of rebar
from Mexico Importers of rebar
from Turkey 100 miles or less 31.5 14.5 79.4 101 to 250 miles 22.5 51.8 10.5 251 to 500 miles 24.2 31.6 6.5 501 to 1,000 miles 17.3 1.3 3.6 Over 1,000 miles 4.5 0.7 0.0
Source: Compiled from data submitted in response to Commission questionnaires.
SUPPLY AND DEMAND CONSIDERATIONS
U.S. supply
Domestic production
Based on available information, U.S. producers have the ability to respond to changes in demand with moderate to large changes in the quantity of shipments of U.S.‐produced rebar to the U.S. market. The main factors contributing to this ability for supply to respond to changes in demand are excess capacity, some available inventories, and the ability to switch to and from producing other products on the same equipment.

II‐10
Industry capacity
U.S. producers’ production capacity increased between 2011 and 2013, rising from 9.6 million short tons to 9.9 million short tons. Production increased irregularly from 6.3 million short tons in 2011 to 6.8 million short tons in 2013. As a result, capacity utilization increased irregularly from 65.7 percent in 2011 to 68.4 percent in 2013. This relatively low level of capacity utilization suggests that U.S. producers may have substantial capacity to increase production of rebar in response to an increase in prices.
Alternative markets
U.S. producers’ exports as a percentage of total shipments decreased from *** percent in 2011 to *** percent in 2013, indicating that U.S. producers may have a limited ability to shift shipments into the U.S. market from other markets in response to price changes. U.S. producers exported rebar to Canada, the Caribbean, Central America, and Mexico.
Inventory levels
U.S. producers’ ratio of inventories to total shipments increased from *** percent at the end of 2011 to *** percent by the end of 2013. Inventories are relatively low, even though U.S. producers report that *** percent of their sales are from inventories. These levels of inventories suggest that U.S. producers may have some limited ability to use inventories to respond to price changes.
Production alternatives
Eight of nine responding U.S. producers reported producing other products using the same equipment, machinery, and workers, including: merchant bar, SBQ bar, wire rod, pencil rod, T‐stock, round bar, smooth rounds for grinding balls, light sections, and rod coils.24 All responding U.S. producers reported that their ability to shift was limited by either factors affecting the plants’ capacity, or demand for products.
Subject imports from Mexico
Based on available information, producers of rebar from Mexico have the ability to respond to changes in demand with moderate changes in the quantity of shipments of rebar to the U.S. market. The main contributing factors to the moderate degree of supply responsiveness are the availability of unused capacity, the existence of some alternate markets, and the ability to produce alternate products.
24 None of the nine rebar producers reported producing deformed steel wire on shared equipment.

II‐11
Industry capacity
Reported rebar capacity in Mexico increased from *** short tons in 2011 to *** short tons in 2013. Capacity utilization increased from *** percent in 2011 to *** percent in 2012 and then decreased to *** percent in 2013. Thus, the rebar industry in Mexico has some excess capacity that might be available to use to increase shipments to the United States.
Alternative markets
Most rebar shipments by the industry in Mexico were to the home market (*** percent in 2011, falling to *** percent in 2013). Exports to markets other than the United States increased from *** percent in 2011 to *** percent in 2013, accounting for most of the decrease in home market shipments. Mexican producers’ main export markets are ***. The rebar industry in Mexico therefore would have some rebar available that could be sold into the U.S. market.
Inventory levels
The Mexican industry’s rebar inventories as a share of total shipments increased irregularly from *** percent in 2011 to *** percent in 2013. This indicates that the industry in Mexico may have a somewhat limited ability to shift sales to the United States from inventories.
Production alternatives
Mexican producers reported producing more than 3 million short tons of alternative products (mainly ***) in their facilities. Thus Mexican producers may have the ability to increase sales to the U.S. market by shifting production to rebar from alternative products.
Supply constraints
Five Mexican producers reported supply constraints, including: the availability of Mexican iron ore and scrap or raw materials, as well as limits caused by the capacity constraints of their cooling beds, furnaces, reheat furnaces, and rolling speed.25
Subject imports from Turkey (excluding Habas)
Based on available information, producers of rebar from Turkey (other than Habas) have the ability to respond to changes in demand with limited‐to‐moderate changes in the quantity of shipments of rebar to the U.S. market. The main contributing factors to the limited‐to‐
25 Firms reported that capacity was also affected by the size of the billets used, rebar mix, and the diameter of the rebar produced. Capacity in terms of tons is lower for smaller diameter rebar.

II‐12
moderate degree of supply responsiveness are the existence of alternate markets, and the ability to produce alternate products.
Industry capacity
The subject Turkish industry’s rebar capacity increased from *** short tons to *** short tons between 2011 and 2013. Capacity utilization increased from *** percent in 2011 to *** percent in 2013. Thus the rebar industry in Turkey has limited excess capacity available that might be used to increase shipments to the United States.
Alternative markets
The majority of shipments of subject Turkish rebar producers were to export markets, primarily other than the United States. The percentage of such shipments increased irregularly from *** percent of total shipments in 2011 to *** percent in 2013, while exports to the U.S. market increased from *** percent of total shipments in 2011 to *** percent in 2013. Thus, the rebar industry in Turkey may be able to shift sales from other export markets to the U.S. market.
Inventory levels
Subject Turkish inventories as a share of total shipments were relatively low, but increased from *** percent to consistently *** percent during 2011‐13. This indicates that the Turkish rebar industry may have a limited ability to shift sales to the United States from inventories.
Production alternatives
Subject Turkish producers reported *** to *** short tons of production of alternative products in 2011‐13. Their production of alternative products decreased from *** percent of total overall production in 2011 to *** percent in 2013. Thus, subject Turkish producers may have some ability to increase sales to the U.S. market by shifting production to rebar from alternative products.
Supply constraints
Subject Turkish producers reported supply constraints which included maintenance, length, width, and size breakdowns.26
26 ***.

II‐13
Imports from nonsubject sources
Habas was the largest nonsubject source of U.S. imports during 2013, accounting for *** percent of all nonsubject imports. The next largest sources were Spain and Dominican Republic, accounting for *** and *** percent of nonsubject imports respectively.
New suppliers
Eight of 27 purchasers indicated that new suppliers entered the U.S. market since 2011. Purchasers cited Deacero, Fonderia, and Gasa (Mexico); Colakoglu Metalurji (Turkey); Tata Steel, Traxys, Intermetal27 (import sources unclear); and Korea, Japan, Peru, Portugal, Spain, and Taiwan (no company listed).
U.S. demand
Based on available information, it is likely that changes in the price level of rebar would result in small changes in the quantity of rebar demanded. The main contributing factors to the small degree of responsiveness of demand is the limited substitutability of other products for rebar and its relatively small cost share in its major uses.
The overall U.S. demand for rebar is driven by the U.S. economy, nonresidential construction spending and, to a lesser extent, residential construction spending. The aggregate U.S. economy, as measured by percentage changes in the gross domestic product, has fluctuated between a low of ‐2.1 percent in the first quarter of 2014 to a high of 4.6 percent in the fourth quarter of 2011 (figure II‐1).
27 The purchaser did not specify if the source were ***. ***.

II‐14
Figure II-1 Percent changes in real gross domestic product (GDP) growth, by quarters, January 2011 - June 2014
Source: Bureau of Economic Analysis, U.S. Department of Commerce.
The primary factor influencing rebar demand, nonresidential construction spending,
increased unevenly from January 2011 through November 2012. After a decline in January 2013, total nonresidential construction resumed an uneven increase (figure II‐2). Nonresidential construction is highly seasonal (figure II‐3). Construction demand is lowest at the end of each year and the beginning of the following year; this reduces rebar demand in the fall and winter. Respondents, however, reported that residential construction is also an important source of demand and these types of projects are more likely to use imported rebar.28 Residential construction increased from January 2011 through June 2014 and is also highly seasonal. Between January 2011 and June 2014, residential construction increased by 43.7 percent while nonresidential construction increased by 16.2 percent.
28 Hearing transcript, p. 154 (Gutierrez).
‐3.0
‐2.0
‐1.0
0.0
1.0
2.0
3.0
4.0
5.0
2011 2012 2013 2014
Percentage
chan
ge
Gross domestic product

II‐15
Figure II-2 Construction spending: Monthly total non-residential and residential construction, value in billions of dollars, annualized, seasonally adjusted, January 2011 - June 2014
Source: U.S. Census Bureau, Manufacturing, Mining and Construction Statistics, Construction Spending. http://www.census.gov/econ/currentdata. Figure II-3 Construction spending: Nonresidential and residential construction, not seasonally adjusted, value in billions of dollars monthly, January 2011 - June 2014
Source: U.S. Census Bureau, Manufacturing, Mining and Construction Statistics, Construction Spending. http://www.census.gov/econ/currentdata.
100
200
300
400
500
600
700
2011 2012 2013 2014
Billions of dollars
Nonresidential construction Residential construction
10
20
30
40
50
60
2011 2012 2013 2014
Billions of dollars
Nonresidential Residential

II‐16
Respondents contend that fabricators prefer the longer lengths of rebar not offered by Deacero or other importers.29 Fabricated rebar is typically focused on nonresidential construction, while imported rebar is more accepted in residential construction.30 Residential construction is more likely to use the 20‐foot rebar lengths Deacero typically exports.31 Thus, respondents believe the larger increase in residential construction has led to the greater increase in apparent consumption of imported rebar compared to domestically produced rebar.
In contrast, petitioner reported rebar is a “highly standardized product,” and that imported rebar from Mexico and Turkey is sold in the same sizes, lengths, and grades as domestically produced rebar and is used interchangeably. U.S.‐produced rebar is used in both residential and nonresidential construction. U.S. producers supply the majority of product distributors purchase and there is “no clean or isolated” channel of distribution.32
End uses
U.S. demand for rebar depends on the demand for U.S.‐produced downstream products. Reported end uses include construction (commercial, nonresidential, public, private, residential, roads and bridges), downstream rebar products (stirrups, mine roof bolts, spirals, and bar supports), and other uses such as ***.
Business cycles
Six of 8 responding U.S. producers, 6 of 16 responding importers, and 16 of 24 responding purchasers indicated that the rebar market was subject to business cycles following construction cycles or cycles caused by the weather. Six U.S. producers, four importers, and seven purchasers reported that there were other conditions of competition affecting the rebar market as well including: highly competitive imports, “Buy American” provisions, more trading companies, and oversupply.
Seven producers reported changes in business cycles or conditions; five reported continued unusually low demand from the 2008 recession. Other differences included competition from imports and other U.S. producers, low sales and low profitability, and shifts in government spending (first increasing in response to the recession and then declining due to budget concerns). Five importers reported changes in business cycles or conditions including: an “unusually slow” recovery from the recession, recovery from the recession (generally), changes in raw material supply and demand, increased construction and oversupply, and more trading companies selling imported rebar.33 Eleven purchasers reported changes including:
29 Hearing transcript, p. 156 (Bazan). 30 Hearing transcript, p. 154 (Gutierrez). 31 Hearing transcript, p. 157 (Bazan). 32 Hearing transcript, pp. 42‐45 (Alvarado). 33 ***.

II‐17
excess supply; increased imports; producers acting as fabricators thus cutting out independent fabricators; continued recession; and the need to purchase imports to be competitive.34
Apparent consumption
Apparent U.S. consumption of rebar increased during 2011‐13 from 6.5 million short tons in 2011 to 7.7 million short tons in 2013. Overall, the quantity of apparent U.S. consumption was 18.2 percent higher in 2013 than in 2011. Apparent U.S. consumption was also 8.6 percent higher in the first quarter of 2014 than in the first quarter of 2013.
Demand trends
Most producers, importers, and purchasers reported that U.S. demand for rebar had increased since 2011 (table II‐7). Half of responding producers reported that demand outside the United States had decreased, and most importers reported that demand had fluctuated. Purchasers’ responses were mixed, with most reporting demand had either fluctuated (5) or decreased (4). Six of 16 responding purchasers reported that demand for their downstream products using rebar had increased; six reported that demand had fluctuated; and four reported demand had decreased. Fifteen of 16 responding purchasers noted that demand for their end use product has affected their demand for rebar.
Table II-7 Rebar: Firms’ responses regarding U.S. demand, demand outside the United States and demand for purchasers’ final products, by number of responding firms
Item Increase No change Decrease Fluctuate Demand in the United States U.S. producers 6 0 2 2 Importers 11 1 0 6 Purchasers 13 6 2 3 Demand outside the United States U.S. producers 1 1 4 2 Importers 4 2 1 10 Purchasers 0 2 4 5 Demand for purchasers’ final product Purchasers 6 0 4 6
Source: Compiled from data submitted in response to Commission questionnaires.
Substitute products
Most responding U.S. producers (6 of 9) listed one or more substitutes for rebar.35 Most importers (14 of 17) and purchasers (19 of 24) reported that there were no substitutes for rebar. The most frequently reported substitute was wire mesh; other substitutes included fiber reinforced concrete, structural steel, pre‐stressed cable, deformed steel wire, and prestressed
34 ***. 35 Three U.S. producers reported that there were no substitutes for rebar.

II‐18
concrete strand (pc strand). Wire mesh could be used in concrete reinforcing, paving, residential construction, and noncritical applications. Other substitutes were reported to be used in concrete reinforcing, building frames, residential/nonresidential construction, and slabs and foundations for nonstructural applications and bridges. 36 Two producers (***) and one importer (***), but no purchasers, reported that substitutes affected the price of rebar. Wire mesh, deformed steel wire, and PC strand were reported to affect the price of rebar.
Cost share
Rebar accounts for a small share of the cost of the end‐use products in which it is used. Questionnaire respondents’ estimates of the cost of rebar as a share of most types of construction37 (the most common end use) varied little, ranging from 2 to 5 percent; exceptions were foundations, driveways, and “miscellaneous construction” (10 to 15 percent). For intermediate applications (forms fabricated from rebar),38 however, the rebar’s cost share was estimated to be much higher, ranging from 40 to 90 percent. Testimony from the staff conference suggests that there were no imports of fabricated forms because they are made specifically for each construction project and differ from project to project.39 As a result, the fabricated forms do not appear to face import competition and the cost share of rebar (whether or not fabricated) in construction will affect demand for rebar, rather than the direct cost share of rebar in fabricated forms.
SUBSTITUTABILITY ISSUES
The degree of substitution between domestically produced and imported rebar depends upon such factors as relative prices, quality (e.g., grade standards, reliability of supply, etc.), and conditions of sale (e.g., price discounts/rebates, lead times between order and delivery dates, payment terms, etc.). Based on available data, staff believes that there are few differences between domestic and imported rebar, and there is a high degree of substitution among product produced in the United States, the subject countries, and other import sources.
Lead times
Rebar is primarily produced‐to‐order. U.S. producers reported that 59.7 percent of their sales were produced‐to‐order, with lead times ranging from 14 to 60 days; six of the eight responding producers reported lead times of 30 to 36 days. U.S. importers reported that 61.4 percent of their sales were produced‐to‐order, with lead times ranging from 15 to 120 days; a
36 ***. 37 This included commercial and residential construction, and roads and bridges. 38 These include dowels, stirrups, cut and band, bar supports, spirals, coated rebar, cut to length,
“fabrication,” and roof bolts. 39 Conference transcript, pp. 143‐144 (Melvin and Webb).

II‐19
majority of responding importers reporting lead times of 60 to 65 days. Lead times from inventories in the United States ranged from “0” to 5 days for U.S. producers and 1 to 8 days for importers. Importers’ lead times from inventories outside the United States ranged from 25 to 60 days. Imports from Mexico can enter the United States more quickly (*** days for shipments from inventories and *** days for produced‐to‐order shipments) than product from Turkey. Respondents reported that Mexican rebar was either shipped by rail from Deacero’s production facilities or by truck from its warehouse facilities in Mexicali, a city south of California near the border between Mexico and the United States.40
Knowledge of country sources
Twenty‐six purchasers indicated they had marketing/pricing knowledge of domestic rebar, 17 of Mexican rebar, 17 of Turkish rebar, and nine of rebar from nonsubject countries. As shown in table II‐8, most purchasers and almost all their customers “sometimes” or “never” make purchasing decisions based on the producer or country of origin. Of the purchasers related to the U.S. producers, *** reported that they “always” consider the producer in their purchases, *** reported that it “sometimes” considers the producer, and *** reported that it “never” considers the producer. *** were the only purchasers that explained why they always considered the producer: ***.” ***.” *** of the four purchasers related to the producers (***) reported “never” purchasing based on the country of origin while *** reported “sometimes” purchasing based on country of origin (because of their customer’s requirements) and *** reported “sometimes” purchasing based on country of origin, stating that quality and availability were not an issue for rebar.
Table II-8 Rebar: Purchasing decisions based on producer and country of origin, by number of reporting firms
Purchaser/Customer Decision Always Usually Sometimes Never Purchaser makes decision based on producer 8 2 11 6 Purchaser’s customers make decision based on producer 0 0 13 15 Purchaser makes decision based on country 5 2 12 9 Purchaser’s customers make decision based on country 0 1 18 9
Source: Compiled from data submitted in response to Commission questionnaires.
Factors affecting purchasing decisions
Price was by far the most important factor that firms consider in their purchasing decisions for rebar (table II‐9). All 28 purchasers listed price among their three most important factors and most (20) listed it as the most important factor.41 The other factors frequently cited as one of the top three factors considered in purchasing decisions for rebar were availability (21
40 Conference transcript, pp. 177‐178 (Bazan). 41 The four purchases that “sometimes” purchase the lower‐priced product are ***.

II‐20
firms) and quality (12 firms). Availability was the most frequently reported second most important factor (11 firms) and third most important factor (8 firms).
Table II-9 Rebar: Ranking of factors used in purchasing decisions as reported by U.S. purchasers, by number of reporting firms
Factor First Second Third1 Total Price 20 6 2 28 Availability 2 11 8 21 Quality 2 4 6 12 Credit/payment terms 1 2 3 6 Traditional supplier/supplier relationship 1 2 1 4 Service 1 0 2 3 Delivery/lead times 0 2 2 4 Reliability/reliability of supply 0 0 2 2 Other2 1 1 1 3
1 One purchaser reported price for both first and third most important factor, only the first is included in the table. 2 Other factors include for first factor whether import or domestic, for second factor discounts offered, and for third factor ease of business. Source: Compiled from data submitted in response to Commission questionnaires.
The majority of purchasers (16 of 28) reported that they “usually” purchase the lowest‐priced rebar. Eight purchasers “always” purchase the lowest‐priced product, while four “sometimes” purchase the lowest‐priced product.42
When asked if they purchased rebar from one source although a comparable product was available at a lower price from another source, 22 purchasers reported reasons,43 including: vendor supplies other products; relationship; reliability/delivery; payment terms; availability; transportation costs and service; lead times, U.S. and Mexico have shorter lead times than Turkey or Japan; buy only domestic; prefer domestic since it can be used in any project; and prefer domestic for quality, lead time, minimum orders, reliability of supply, less chance of damage, and U.S. producers provide delivery. A number of purchasers reported on their methods of purchasing from related producers including: ***.
Five of 27 responding purchasers reported that certain types of rebar were only available from a single source. These included: domestic rebar is only available from U.S. mills; MMFX – ASTM A103544 and A706 and grade 75 are not always readily available as imports; #14
42 Three of the 11 responding end users, 1 of the 8 responding distributors, 2 of the 6 responding end user/distributors (***), and the one “other” purchaser reported always purchasing the least expensive product.
43 Three of the firms reporting that they “always” purchased the lowest priced product provided reasons that they did not always purchase the lowest priced product.
44 MMFX/ASTM A1035 “is one of the strongest grades” of rebar grades on the market. It is used in “humid or volatile environments” such as bridge construction because it resists corrosion. Found at http://www.harrissupplysolutions.com/a1035‐rebar‐astm‐a1035‐grade‐reinforcing‐bar.html; retrieved August 7, 2014.

II‐21
and #18 bar are only purchased from ***, because *** usually does not have these sizes; and large diameter rebar is only available domestically.
Purchasers were asked which factors they considered in determining the quality of rebar. The most common response was that the material must meet ASTM specifications. Other factors considered include: packaging such as material breaks away from its packaging and uniform tight neatly packaged bundle or coil; straightness; meets specifications, codes, and mill certification provided with every purchase; workability such as performance in machines and bends without problems; consistency; rust free surface; and straight longitudinal ribs.
Importance of specified purchase factors
Purchasers were asked to rate the importance of 15 factors in their purchasing decisions (table II‐10). No factor was reported to be “very important” by all 28 responding purchasers. The factors rated as “very important” by most purchasers were price, and quality meets industry standards (25 each) availability (24 each), delivery time and reliability of supply (22), and product consistency (21 each). Factors for which more firms reported they were not important than reported they were very important were quality exceeds industry standards and minimum quantity requirement (13 each reported that they were not important); and packaging and technical support/service (11 each).
Table II-10 Rebar: Importance of specific purchase factors, as reported by U.S. purchasers, by number of responding firms
Factor Very
important Somewhat important
Not important
Availability 24 4 0 Delivery terms 14 12 2 Delivery time 22 5 1 Discounts offered 11 13 4 Extension of credit 9 13 6 Minimum quantity requirements 1 14 13 Packaging 2 15 11 Price 25 3 0 Product consistency 21 7 0 Product range 8 15 5 Quality exceeds industry standards 5 9 13 Quality meets industry standards 25 2 1 Reliability of supply 22 6 0 Technical support/service 5 12 11 U.S. transportation costs 10 16 3
Source: Compiled from data submitted in response to Commission questionnaires.

II‐22
Supplier certification
All but one of the 28 responding purchasers require that their suppliers be ASTM certified.45 Most (21 of 25) purchasers did not require other certification or qualifications of their rebar suppliers. Only one purchaser reported the time to qualify a new supplier (30 days). No purchaser reported that any domestic or foreign supplier had failed in its attempt to qualify product, or had lost its approved status since 2011.
Changes in purchasing patterns
Purchasers were asked about changes in their purchasing patterns from different sources since 2011 (table II‐11). Reasons for decreased purchases of U.S. product included: reduced sales (including some of which stated that this was because of the recession), reduced mining, domestic material too expensive, and increased import pressure. Reasons for increased purchases of U.S. product include improved market, increased volume of concrete, domestic mills have become more competitively priced, slow recovery, company growth, and new products/focus. Purchasers reporting that U.S. demand has fluctuated reported that this occurred because of fluctuating business activity, Turkish rebar being more competitive, and economy‐wide changes.
Table II-11 Rebar: Changes in purchase patterns from U.S., subject, and nonsubject countries
Source of purchases Did not
purchase Decreased Increased Constant FluctuatedUnited States 2 8 8 5 4 Mexico 12 2 8 1 3 Turkey 10 3 8 2 2 Other 12 4 1 1 3
Source: Compiled from data submitted in response to Commission questionnaires.
Two firms reported that their purchases of Mexican product had declined, with both reporting Mexican product was becoming less competitive. Purchasers’ reasons for increased purchases of Mexican rebar included: competitive prices; a one‐time large purchase; purchased low‐priced imports to remain competitive; and company growth and new products/new focus. Purchasers’ reasons for reduced purchases of Turkish rebar included reduced sales and more competitive U.S. product prices. Purchasers’ reasons for increased purchases of Turkish product included: competitive prices; greater need for competitive prices; company growth; and new products/focus.
Six of 28 responding purchasers reported that they had changed rebar suppliers since 2011. Specifically, one purchaser reported adding *** while it reduced purchases from ***, one purchaser added ***, one purchaser added *** and dropped *** due to the pending antidumping case, and one firm added import brokers to get lower priced imports. Two other
45 The firm selling rebar *** did not require ASTM certification.

II‐23
purchasers did not report which firms they had added or dropped but reported that they varied their share of purchases from specific suppliers based on availability, service, and price.
Eight of 27 purchasers reported new suppliers in the market since 2011. Specific firms named included: Gasa, Deacero, and Fonderia (Mexico), as well as Colakoglu Metalurji (Turkey). For firms that import from a number of countries, purchasers reported that Traxys (North America), Intermetal,46 International Metal, and Tata International were new suppliers, and countries Japan, Korea, Portugal, Peru, Spain, and Taiwan were also new sources of supply.
Importance of purchasing domestic product
Purchasers were asked what shares of their sales were covered by “Buy American” provision or other preference for domestically produced rebar. Overall, 56.9 percent of the rebar which purchasers sold had no domestic content requirements. Most purchasers (19 of 27) reported that more than half of the rebar they sold had no domestic content requirement. Twenty‐one purchasers reported some purchases were covered by legal “Buy American” requirements, covering 17.6 percent of all sales which purchasers reported. Fourteen purchasers reported that, for some of their sales, customers required U.S. product; these purchases were 5.4 percent of sales reported by purchasers. Reasons customers required domestic product included: some customers think U.S. product is superior; some purchasers buy only U.S.‐produced rebar because they prefer to hold a single inventory that can be used in all projects (including “Buy American”); preferences; wanting to support the U.S. economy; lead times; and product not available as an import.47 *** purchasers (***) reported “other” preference for U.S. product; this accounted for 20.0 percent48 of all reported sales.49
“Buy America” requirements apply to iron and steel products such as rebar that are purchased for the Federal‐aid highway construction program. Under “Buy America,” federal‐aid funds may not be obligated for a project unless iron and steel products used in such projects are manufactured in the United States (with limited exceptions based on the product cost or its share of the original contract value). In addition, under an alternate‐bid procedure, foreign‐source materials may be used if the total project bid using foreign‐source materials is 25 percent less than the lowest total bid using domestic materials. “Buy American” is a separate and distinct program from “Buy America.” The Buy American Act, which covers specified products, requires the Federal Government to purchase domestic goods and services unless the head of the agency involved in the procurement has determined that the prices of the domestic
46 ***. 47 Most purchasers did not provide reasons for the preference. The only other reason reported was
that preference for U.S. product was job specific. 48 *** is why this share is relatively high. 49 Reasons for “other” preferences for U.S.‐produced rebar ***” and *** explained its “other”
preference was because imported rebar was not available.

II‐24
suppliers are “unreasonable” or that their purchase would be “inconsistent with the public interest.”50
U.S. producers were also asked if rebar they sold was covered by “Buy American” provisions or other restrictions preventing the purchase of imported rebar. They reported that, in 80.0 percent of their sales, purchasers did not prefer U.S.‐produced product. Most responding producers (8 of 9) reported that “Buy American” provisions covered from 15 to 50 percent of their sales, averaging 19.9 percent of sales. Only one producer reported any preference for domestic product besides complying with “Buy American” programs, requirements by customers (less than one tenth of one percent of sales).
The Concrete Reinforcing Steel Institute (CRSI) estimated that between 2002 and 2012, 11.5 percent of rebar usage was covered by “Buy American” provisions. Between 2008 and 2012, however, usage under the “Buy American” provisions was relatively high during the economic downturn, both because federal stimulus activity was high and because other construction was relatively low. Thus, CRSI estimates that going forward, the “Buy American” share should be 10.5 to 10.6 percent of total U.S. rebar demand.51
At the conference, witnesses for the petitioner reported that “Buy American” programs are dependent on transportation spending and this spending has fallen in the last 3 years so that the volume of current “Buy American” purchases is relatively low.52 Spending both for recovery from Hurricane Katrina and under the “American Recovery and Reinvestment Act,” which was enacted because of the recession, had been important sources of “Buy American” purchases. The projects covered by these programs are almost complete. U.S. producers reported that with more public/private partnerships in building infrastructure, the application of “Buy American” is uncertain.53 In addition, “Buy American” projects tend to be large projects, beyond the capacity of smaller rebar producers.54 Some U.S. producers reported that “Buy American” provisions have relatively little impact on the market, that they do not tend to increase prices, and that rebar producers typically do not know if a project is covered by “Buy American.”55
In contrast, respondents reported that “Buy American” provisions have a major impact on the market. It is difficult for importers to sell to fabricators because most of their “jobs” are “public jobs” and firms do not want to carry dual inventories, so they prefer to carry only U.S.‐
50 Prestressed Concrete Steel Wire Strand from China, Investigation Nos. 701‐TA‐464 and 731‐TA‐1160 (Final), USITC Publication 4162, June 2010, p. II‐10. U.S. Department of Transportation, Federal Highway Administration Web site, “Construction Program Guide: Buy America,” http://www.fhwa.dot.gov/construction/cqit/buyam.cfm (accessed September 29, 2014) and U.S. Department of Transportation, Federal Highway Administration Memorandum, “Buy America Requirements (HHO‐32),” dated, July 6, 1989, last modified December 12, 2013, http://www.fhwa.dot.gov/programadmin/contracts/070689.cfm (accessed September 29, 2014).
51 Letter submitted as an attachment to ***’s producer questionnaire. 52 Conference transcript, pp. 104‐105 (Crowe and Melvin). 53 Conference transcript, pp. 102‐104 (Porter and Kerkvliet). 54 Conference transcript, p. 104 (Webb). 55 Conference transcript, pp. 103‐104 (Kerkvliet).

II‐25
produced rebar.56 Under the “American Recovery and Reinvestment Act” “Buy American” provisions were tighter than the traditional “Buy American” provisions. Nonetheless, even under the traditional “Buy American” provisions, which have exceptions allowing the use of imports under some circumstances, imports are seldom used.57
Respondents contend that “domestic rebar is also required for building projects seeking to qualify for LEED certification. LEED stands for Leadership in Energy and Environmental Design, and certification is desired to showcase that the builder is environmentally responsible. LEED standards block imports because they require the construction materials to be made within 500 miles of the job site.”58
LEED is a voluntary certification program in which buildings receive different levels of certification based on fulfilment of a number of criteria.59 “One of the key strategies that LEED rewards is the use of local and regional materials from within 500 miles of the project. All materials, including wood, sourced or manufactured within 500 miles receive credit in LEED. This strategy is frequently adopted, as almost 90% of certified commercial LEED projects attain the local materials credit.”60 This credit is obtained by using “building materials or products that have been extracted, harvested or recovered, as well as manufactured, within 500 miles of the project site for a minimum of 10% or 20%, based on cost, of the total materials value.” Thus, in constructing a LEED certified building, the local material credits are not required. Locally produced rebar may or may not be used to cover the 10 to 20 percent of local materials in a project. On the other hand, if a builder is seeking to get the local material credits, rebar is likely to be eligible. The large number of rebar mills throughout the country ensure that, for most projects, rebar from within 500 miles of the building site is available. Deacero reports that nearly all its rebar production takes place at its Celaya facility, which is more than 500 miles from the United States.61
Comparisons of domestic products, subject imports, and nonsubject imports
Purchasers were asked a number of questions comparing rebar produced in the United States, subject countries, and nonsubject countries. First, purchasers were asked for a country‐by‐country comparison on the same 15 factors from table II‐10 for which they were asked to rate the importance. Table II‐12 compares product from the United States, Mexico, and Turkey. Table II‐13 compares product from the United States and subject countries to product from nonsubject countries.
56 Conference transcript, pp. 222‐223 (Bazan and Nolan). 57 The traditional “Buy American” programs allow waivers for short supply and allow purchase of
imports if its price is sufficiently lower than the price of U.S.‐produced rebar. Conference transcript, pp. 223‐254 (Nolan).
58 Hearing transcript, pp. 155‐156 (Bazan). 59 http://www.usgbc.org/LEED/. 60 http://www.usgbc.org/Docs/Archive/General/Docs9250.pdf retrieved September 19, 2014. 61 Mexican respondent’s posthearing brief, answers to Commissioners’ questions, p. 20 and exhibit 1.

II‐26
Table II-12 Rebar: Purchasers’ comparisons between U.S.-produced and subject imported product
Factor U.S. vs. Mexico U.S. vs. Turkey
Mexico vs. Turkey
S C I S C I S C I Availability 9 11 0 9 8 2 6 10 3 Delivery terms 8 12 0 10 8 1 7 11 1 Delivery time 12 8 0 13 6 0 8 10 1 Discounts offered 0 16 4 0 13 6 1 17 1 Extension of credit 3 16 1 3 16 0 0 19 0 Minimum quantity requirements 8 12 0 9 10 0 5 13 1 Packaging 3 16 1 3 14 2 1 17 1 Price1 0 7 13 1 1 17 2 8 9 Product consistency 1 19 0 2 17 0 2 17 0 Product range 7 12 1 4 14 1 1 14 4 Quality exceeds industry standards 2 16 0 2 15 0 1 16 0 Quality meets industry standards 1 19 0 1 18 0 1 18 0 Reliability of supply 8 10 1 9 8 2 5 12 2 Technical support/service 7 13 0 8 11 0 3 16 0 U.S. transportation costs1 5 13 2 5 9 5 2 15 2
1 A rating of superior means that price/U.S. transportation costs is generally lower. For example, if a firm reported “U.S. superior,” it meant that the U.S. product was generally priced lower than the imported product. Note.--S=first listed country’s product is superior; C=both countries’ products are comparable; I=first list country’s product is inferior. Source: Compiled from data submitted in response to Commission questionnaires.

II‐27
Table II-13 Rebar: Purchasers’ comparisons between U.S.-produced, subject imported and imported product from nonsubject countries
Factor
U.S. vs. nonsubject
Mexico vs. nonsubject
Turkey vs. nonsubject
S C I S C I S C I Availability 10 5 1 8 6 2 6 10 0 Delivery terms 11 5 0 8 8 0 5 10 1 Delivery time 11 5 0 9 7 0 5 11 0 Discounts offered 1 10 5 3 11 2 3 12 1 Extension of credit 5 11 0 4 12 0 3 13 0 Minimum quantity requirements 8 8 0 8 8 0 5 11 0 Packaging 4 12 0 3 13 0 2 14 0 Price1 2 5 9 7 6 3 11 4 1 Product consistency 4 12 0 3 12 1 2 14 0 Product range 6 10 0 2 13 1 2 14 0 Quality exceeds industry standards 4 11 0 1 13 1 1 14 0 Quality meets industry standards 2 14 0 0 15 1 0 16 0 Reliability of supply 10 5 1 7 8 1 5 11 0 Technical support/service 10 6 0 6 9 1 4 12 0 U.S. transportation costs1 6 8 2 3 10 3 2 14 0
1 A rating of superior means that price/U.S. transportation costs is generally lower. For example, if a firm reported “U.S. superior,” it meant that the U.S. product was generally priced lower than the imported product. Note.--S=first listed country’s product is superior; C=both countries’ products are comparable; I=first list country’s product is inferior. Source: Compiled from data submitted in response to Commission questionnaires.
Most responding purchasers reported that U.S. and Mexican rebar were comparable for 13 factors. Most purchasers reported U.S. product was superior for delivery time while most purchasers reported Mexican rebar was superior in price (lower‐priced) to U.S.‐produced rebar.62
Most responding purchasers reported that U.S. and Turkish rebar were comparable for nine factors. Among the five other factors, most purchasers reported U.S. product was superior for delivery terms and delivery time while most purchasers reported Turkish rebar was superior in price (lower‐priced) to U.S.‐produced rebar.63 U.S. transportation cost for U.S. and Turkish rebar was reported to be comparable by nine purchasers, five reported U.S. product was superior, and five reported U.S. product was inferior. For reliability of supply and availability, U.S. rebar was reported to be superior to Turkish by nine purchasers, comparable by eight, and inferior by two.
62 One of the three responding end users, five of eight responding distributors, five of the six responding end user/distributors (including all the related end user/distributors) reported that U.S. was inferior to Mexico on price (i.e., the U.S.‐produced rebar was higher‐priced).
63 One distributor reported that U.S. rebar was comparable to Turkish rebar on price and one end user reported U.S. rebar was superior in price (i.e., the U.S.‐produced rebar was lower‐priced).

II‐28
At least half of the responding purchasers reported that rebar from Mexico and Turkey was comparable on 14 factors. Regarding price, more purchasers (9) reported that rebar from Mexico was higher‐priced than rebar from Turkey than reported that they were comparable (8); two reported Mexican prices were lower.
At least half of the responding purchasers reported that U.S. rebar was comparable to rebar from nonsubject countries for nine factors. Most purchasers reported that U.S. rebar was superior for availability, delivery terms, delivery time, reliability of supply, and technical support/service while most responding purchasers reported that U.S. product was inferior with respect to price.
At least half of the responding purchasers reported that Mexican rebar was comparable to rebar from nonsubject countries on 12 factors. Most reported that Mexican rebar was superior with respect to delivery time. For availability, eight reported Mexico was superior, six that Mexican and nonsubject rebar were comparable, and two that Mexican rebar was inferior. For price, seven reported Mexican was superior (lower priced), six reported Mexican and nonsubject rebar were comparable and three reported Mexican rebar was inferior in price.
Most purchasers reported that Turkish rebar and rebar from nonsubject countries were comparable on all factors except price, for which most purchasers rated Turkish product as superior (lower‐priced).
Comparison of U.S.‐produced and imported rebar
In order to determine whether U.S.‐produced rebar can generally be used in the same applications as imports from Mexico and Turkey, U.S. producers, importers, and purchasers were asked whether the products can “always,” “frequently,” “sometimes,” or “never” be used interchangeably. As shown in table II‐14, all but one responding U.S. producer reported that U.S.‐produced rebar was “always” interchangeable with rebar from other countries. Most responding importers and purchasers reported that rebar from all countries was “always” or “frequently” interchangeable with rebar from other sources. One end user reported that U.S. and imported product from Mexico and Turkey were never interchangeable. It did not explain its response.64 One *** reported that U.S. and imported product from Mexico and Turkey were sometimes interchangeable. It did not explain its response.65 One distributor reported that U.S. and Turkish rebar were “never” interchangeable. It reported that some federal projects require domestic material and so U.S. product is not interchangeable with product from other countries.66
64 It reported it did not know about imported rebar from Mexico and Turkey. It reported purchases of rebar from ***.
65 It reported that it knew about rebar from the United States, Mexico, Turkey, and nonsubject sources. It reported purchasing rebar from ***.
66 It reported that it knew about product from Turkey and nonsubject countries. ***.

II‐29
Table II-14 Rebar: Interchangeability between rebar produced in the United States and in subject and nonsubject countries, by country pairs
Country pair Number of U.S.
producers reporting Number of U.S.
importers reporting Number of
purchasers reporting A F S N A F S N A F S N
U.S. vs. subject countries: U.S. vs. Mexico 8 0 1 0 5 4 3 1 6 10 1 1 U.S. vs. Turkey 8 0 1 0 6 4 5 2 6 9 1 2 Subject countries comparisons: Mexico vs. Turkey 6 0 1 0 6 3 1 0 11 5 1 0 Nonsubject countries comparisons: U.S. vs. nonsubject 7 0 1 0 5 2 1 1 6 5 2 1 Mexico vs. nonsubject 6 0 0 0 6 2 1 0 9 4 1 0 Turkey vs. nonsubject 6 0 1 0 6 2 2 0 9 4 1 0
Note.--A=Always, F=Frequently, S=Sometimes, N=Never. Source: Compiled from data submitted in response to Commission questionnaires.
As can be seen from table II‐15, most responding purchasers reported that rebar from all sources “always” met minimum quality specifications. Twenty‐three of 25 responding purchasers reported that the U.S. rebar “always” met minimum quality specifications, 16 of 20 reported Mexican rebar “always” met minimum quality specifications, and 14 of 19 purchasers reported that rebar from Turkey “always” met minimum quality specifications.
Table II-15 Rebar: Ability to meet minimum quality specifications, by source and number of reporting firms1
Source Always Usually Sometimes Rarely or never United States 23 1 1 0 Mexico 16 4 0 0 Turkey 14 5 0 0
1 Purchasers were asked how often domestically produced or imported product meets minimum quality specifications for their own or their customers’ uses. Source: Compiled from data submitted in response to Commission questionnaires.
Producers, importers, and purchasers were asked to assess how often differences other than price were significant in their sales/purchases of rebar from the United States, subject, or nonsubject countries. As seen in table II‐16, most producers reported that differences other than price were “never” significant. In contrast, most importers and purchasers reported that differences other than price between U.S. rebar and rebar from Mexico or Turkey were at least “sometimes” significant. Differences other than price between rebar from Mexico and Turkey were reported to be at least “sometimes” important by six of the nine responding importers. In contrast most purchasers (9 of 16) reported that there were no differences other than price between Mexican and Turkish rebar.

II‐30
Differences other than price between U.S. and nonsubject rebar were reported as at least “sometimes” important by just over half the importers (4 of 7) and purchasers (8 of 15). Half of the responding importers reported no differences other than price between product from Mexico and nonsubject countries, but just over half (5 of 9) reported differences other than price between rebar from Turkey compared with nonsubject countries. Over half the purchasers (8 of 14) reported there were “never” differences other than price for these country pairs.
Table II-16 Rebar: Significance of differences other than price between rebar produced in the United States and in other countries, by country pair
Country pair Number of U.S.
producers reporting Number of U.S.
importers reporting Number of
purchasers reporting A F S N A F S N A F S N
U.S. vs. subject countries: U.S. vs. Mexico 0 0 2 7 2 3 5 3 2 5 6 7 U.S. vs. Turkey 0 0 2 7 2 4 8 3 3 5 4 7 Subject countries comparisons: Mexico vs. Turkey 0 0 1 6 1 1 4 3 1 2 4 9 Nonsubject countries comparisons: U.S. vs. nonsubject 0 0 1 7 1 1 2 3 2 4 2 7 Mexico vs. nonsubject 0 0 1 6 1 1 2 4 1 2 3 8 Turkey vs. nonsubject 0 0 1 6 1 1 3 4 1 2 3 8
Note.--A = Always, F = Frequently, S = Sometimes, N = Never. Source: Compiled from data submitted in response to Commission questionnaires.
ELASTICITY ESTIMATES
This section discusses elasticity estimates; parties were encouraged to comment on these estimates in their briefs. None of the parties commented on these elasticity estimates.
U.S. supply elasticity
The domestic supply elasticity67 for rebar measures the sensitivity of the quantity supplied by U.S. producers to changes in the U.S. market price of rebar. The elasticity of domestic supply depends on several factors including the level of excess capacity, the ease with which producers can alter capacity, producers’ ability to shift to production of other products, the existence of inventories, and the availability of alternate markets for U.S.‐produced rebar. Analysis of these factors earlier indicates that the U.S. industry is likely to be able to increase or decrease shipments to the U.S. market; an estimate in the range of 4 to 8 is suggested.
67 A supply function is not defined in the case of a non‐competitive market.

II‐31
U.S. demand elasticity
The U.S. demand elasticity for rebar measures the sensitivity of the overall quantity demanded to a change in the U.S. market price of rebar. This estimate depends on factors discussed earlier such as the existence, availability, and commercial viability of substitute products, as well as the component share of the rebar in the production of any downstream products. Based on the available information, the aggregate demand for rebar is likely to be moderately inelastic; a range of –0.5 to ‐1.0 is suggested.
Substitution elasticity
The elasticity of substitution depends upon the extent of product differentiation between the domestic and imported products.68 Product differentiation, in turn, depends upon such factors as quality (e.g., chemistry, appearance, etc.) conditions of sale (e.g., availability, sales terms/ discounts/ promotions, etc.), and legal restrictions such as “Buy American” provisions. Based on available information, the elasticity of substitution between U.S.‐produced rebar and imported rebar is likely to be in the range of 3 to 6. However for projects that require rebar subject to “Buy American” clauses, the elasticity of substitution will be lower.
68 The substitution elasticity measures the responsiveness of the relative U.S. consumption levels of the subject imports and the domestic like products to changes in their relative prices. This reflects how easily purchasers switch from the U.S. product to the subject products (or vice versa) when prices change.


III‐1
PART III: U.S. PRODUCERS’ PRODUCTION, SHIPMENTS, AND EMPLOYMENT
The Commission analyzes a number of factors in making injury determinations (see 19 U.S.C. §§ 1677(7)(B) and 1677(7)(C)). Information on the dumping margins was presented in Part I of this report and information on the volume and pricing of imports of the subject merchandise is presented in Part IV and Part V. Information on the other factors specified is presented in this section and/or Part VI and (except as noted) is based on the questionnaire responses of nine firms that accounted for virtually all of U.S. production of rebar during 2013.
U.S. PRODUCERS
The Commission issued U.S. producer questionnaires to 11 firms identified as producers of rebar in the petition. Ten firms identified as rebar producers provided responses,1 including nine which provided usable data on their productive operations.2 Staff believes that these responses represent virtually all of U.S. production of rebar.3
Table III‐1 lists U.S. producers of rebar, their production locations, positions on the petition, related firms, shares of total production, ownership, and related and/or affiliated firms.
1 One firm, ***, reported that it does not produce rebar. 2 ***. E‐mail from ***, September 18, 2013. 3 ***. ***. E‐mail from ***, October 22, 2013.

III‐2
Table III-1 Rebar: U.S. producers of rebar, their positions on the petition, production locations, production, and shares of reported production, 2013
Firm Position on
petition Production location(s)
Share of production (percent)
ArcelorMittal1 ***
Canutillo, TX Georgetown, SC Harriman, TN ***
Byer Steel Petitioner Cincinnati, OH ***Cascade Petitioner McMinnville, OR ***
CMC2 Petitioner
Cayce, SC Magnolia, AR Mesa, AZ Seguin, TX ***
Evraz *** Pueblo, CO ***
Gerdau3 Petitioner
Baldwin, FL Charlotte, NC Jackson, TN Knoxville, TN Midlothian, TX Rancho Cucamonga, CA Sayreville, NJ St. Paul, MN West Vidor, TX Wilton, IA ***
Keystone *** Peoria, IL ***
Nucor Petitioner
Auburn, NY Birmingham, AL Darlington, SC Jackson, MS Jewett, TX Kankakee, IL Kingman, AZ Marion, OH Plymouth, UT Seattle, WA Wallingford, CT ***
SDI4 *** Pittsboro, IN Roanoke, VA ***
Total ***1 ArcelorMittal is related to subject producer ArcelorMittal Las Truchas, a subsidiary located in Mexico. ArcelorMittal S.A. has additional subsidiary rebar facilities in Algeria, Argentina, Brazil, Bosnia and Herzegovina, Canada, China, Czech Republic, Germany, Kazakhstan, Morocco, Poland, Spain, South Africa, and Ukraine. 2 CMC is related to nonsubject producer CMC Poland Sp z.o.o. 3 Gerdau Ameristeel Corp. (Canada) is 100 percent owned by Gerdau S.A. (Brazil), and is related to rebar producers in Canada, Brazil, and Mexico (Sidertul SA de CV). 4 ***. Source: Compiled from data submitted in response to Commission questionnaires.

III‐3
Table III‐2 summarizes important industry events since 2011.
Table III-2 Rebar: Important industry events since 2011 Year Company Event 2011 Nucor Expansion: Harris Steel, a subsidiary of Nucor and fabricator of
rebar, opened new facilities in Birmingham, Alabama, and San Antonio, Texas.
March 2011
Gerdau Expansion: Gerdau Ameristeel opened a new rebar fabrication facility in Navasota, Texas, that has a capacity of 40,000 tons.
April 2011 ArcelorMittal USA
Closure: ArcelorMittal USA closed its Harriman, TN rebar mill, which had the capacity to produce 350,000 tons of rebar and merchant bar products per year.
April 2011 Cascade Revised labor agreement: ***. October 2011 CMC Reduction: CMC reduced its global workforce by 350 workers and
closed five rebar fabricating locations (four domestic and one international location).
April 2012
Nucor Expansion: Nufab LLC, a rebar fabricator owned by Nucor, announced plans to invest $6.9 million in a facility in Alabama, which will create 80 new jobs within 5 years.
July 2012 Nucor
Expansion: Nucor announced plans to install a new reheat furnance at its rolling mill in Wallingford, Connecticut, that will boost annual production capacity to 350,000 metric tons from 250,000. The mill produces rebar, and wire products.
November 2012
CMC Expansion: CMC announced plans to increase the melt-shop capacity of its Mesa, Arizona, rebar mill. ***.
February 2013
Gerdau ***.
May 2013 Gerdau
Expansion: Gerdau Ameristeel announced that it will expand its presence in its Knox, Tennessee, location with the addition of 40 new jobs and an additional facility that will apply finishing services to rebar.
June 2013 CMC Layoffs: A “reduction in force” that will affect one-third of its operations at the Magnolia, Arizona, steel mill, which produces rebar and other long products. As of March 2010, CMC’s Magnolia steel plant had a rolling capacity of 150,000 tons.
July 2013 Keystone Change in ownership: Changed ownership from publicly traded to privately held. ***.
October 2013 Gerdau Layoffs: Gerdau Long Steel North America laid off 13 workers in its rebar mills in Rancho Cucamonga, California, and Midlothian, Texas, citing import pressure and slow economic conditions.
July 2014 Sherman Steel Capacity increase: Sherman Steel reportedly is in the early stages of feasibility and marketing studies to build an independent rebar mill near Youngstown, Ohio.
August 2014 Texas Steel LLC Capacity increase: Texas Steel reportedly plans to build a 200,000 tons-per-year rebar mill near Waco, Texas. Pending approval, construction could begin in spring 2015 with production commencing by mid-2016.
Source: Steel Concrete Reinforcing Bar from Belarus, China, Indonesia, Latvia, Moldova, Poland and Ukraine, Inv. Nos. 731-TA-873-875, 878-880, and 882 (Second Review), USITC Publication 4409, July 2013, table III-1; American Metal Market, various issues; company websites; other Internet articles, and responses to Commission questionnaires.

III‐4
U.S. PRODUCTION, CAPACITY, AND CAPACITY UTILIZATION
Table III‐3 presents U.S. producers’ production, capacity, and capacity utilization. Total U.S. capacity increased from 2011 to 2013 by approximately 280,000 short tons (2.9 percent). Capacity was moderately lower during January‐March 2014 compared with January‐March 2013.
Table III-3 Rebar: U.S. producers’ production, capacity, and capacity utilization, 2011-13, January-March 2013, and January-March 2014
Item Calendar year January to March
2011 2012 2013 2013 2014 Quantity (short tons) Capacity1 9,632,001 9,816,490 9,911,957 2,522,772 2,521,331 Production 6,327,968 6,831,468 6,776,007 1,558,702 1,665,052 Ratio (percent) Capacity utilization 65.7 69.6 68.4 61.8 66.0
1 Adjusted. Average production capacity reported in this table reflects a reduction of *** short tons for each calendar year and of *** short tons for January-March 2013 and for January-March 2014. These amounts reflect combined production capacity attributed to ***. Source: Compiled from data submitted in response to Commission questionnaires.
Total rebar production increased by 7.1 percent during 2011‐13, and was 6.8 percent higher in January‐March 2014 than in January‐March 2013. Capacity increased during 2011‐13, but at a slower rate than production, and was moderately higher in January‐March 2014 than in January‐March 2013. As a result, capacity utilization increased by 2.7 percentage points during 2011‐13 and was 4.2 percentage points higher in January‐March 2014 than in January‐March 2013.
Table III‐4 presents the information provided by U.S. producers regarding their constraints on capacity.
Table III-4 Rebar: U.S. producers’ constraint(s) on capacity
* * * * * * *
Alternative products
*** reported producing other products using the same manufacturing equipment and/or production employees that were used to produce rebar. U.S. producers generally cited market conditions as a factor determining their product mix. Table III‐5 presents the information provided by U.S. producers regarding their constraints on product shifting.

III‐5
Table III-5 Rebar: U.S. producers’ constraints on product shifting
* * * * * * *
Table III‐6 presents aggregate data for total U.S. production of all products made on the same equipment and machinery used to produce rebar. Overall capacity fluctuated slightly from 2011 to 2013, and was modestly higher in January‐March 2014 compared to January‐March 2013. Non‐rebar production decreased from 2011 to 2013, and was lower in January‐March 2014 than in January‐March 2013. No U.S. producers reported producing deformed steel wire on the same equipment and machinery used to produce rebar.
Table III-6 Rebar: U.S. producers’ total capacity, production, and capacity utilization, by product, 2011-13, January-March 2013, and January-March 2014
Item Calendar year January to March
2011 2012 2013 2013 2014 Quantity (short tons) Overall capacity1 18,557,314 18,511,314 18,533,314 4,626,988 4,650,218Production: Straight rebar 6,073,399 6,543,991 6,480,902 1,495,570 1,604,951
Coiled rebar 254,569 287,477 295,105 63,132 60,101Merchant bar 3,452,286 3,515,396 3,441,952 908,157 911,500Other bar/rod (including SBQ bar) 3,184,339 3,007,139 2,684,973 720,420 690,717Deformed steel wire 0 0 0 0 0
Total production 12,964,593 13,354,003 12,902,932 3,187,279 3,267,269 Ratios and shares (percent) Capacity utilization 69.9 72.1 69.6 68.9 70.3Share of production: Straight rebar 46.8 49.0 50.2 46.9 49.1
Coiled rebar 2.0 2.2 2.3 2.0 1.8Merchant bar 26.6 26.3 26.7 28.5 27.9Other bar/rod (including SBQ bar) 24.6 22.5 20.8 22.6 21.1Deformed steel wire 0.0 0.0 0.0 0.0 0.0
Total production 100.0 100.0 100.0 100.0 100.0 1 Adjusted. Average production capacity reported in this table reflects a reduction of *** short tons for each calendar year and of *** short tons for January-March 2013 and for January-March 2014. These amounts reflect combined production capacity attributed to ***. Source: Compiled from data submitted in response to Commission questionnaires.

III‐6
U.S. PRODUCERS’ U.S. SHIPMENTS AND EXPORTS
Table III‐7 presents U.S. producers’ U.S. shipments, export shipments, and total shipments.4 U.S. producer’s U.S. shipments increased by 10.8 percent from 2011 to 2013, and were 4.0 percent higher in January‐March 2014 than in January‐March 2013. U.S. commercial shipments accounted for more than *** of total shipments, while transfers to related firms accounted for slightly more than *** percent of total shipments during this period. Export shipments, in contrast, accounted for less than *** percent of total shipments. Total shipments increased by *** percent from 2011 to 2013, and were *** percent higher in January‐March 2014 than in January‐March 2013.
4 U.S. shipments include commercial shipments, internal consumption, and transfers to related firms. Commercial shipments are shipments, other than internal consumption and transfers to related firms, within the United States. Internal consumption refers to product consumed internally by a firm. Transfers to related parties are shipments made to related domestic firms. Export shipments are shipments to destinations outside the United States, including shipments to related firms. Total shipments are U.S. shipments and export shipments combined.

III‐7
Table III-7 Rebar: U.S. producers’ U.S. shipments, exports shipments, and total shipments, 2011-13, January-March 2013, and January-March 2014
Item Calendar year January to March
2011 2012 2013 2013 2014 Quantity (short tons) Commercial U.S. shipments *** *** *** *** ***Internal consumption *** *** *** *** ***Transfers to related firms *** *** *** *** ***
Subtotal, U.S. shipments 5,883,245 6,411,375 6,520,775 1,485,838 1,545,205Export shipments *** *** *** *** ***
Total shipments *** *** *** *** *** Value (1,000 dollars) Commercial U.S. shipments *** *** *** *** ***Internal consumption *** *** *** *** ***Transfers to related firms *** *** *** *** ***
Subtotal, U.S. shipments 3,861,848 4,162,510 4,080,230 957,585 981,886Export shipments *** *** *** *** ***
Total shipments *** *** *** *** *** Unit value (dollars per short ton) Commercial U.S. shipments *** *** *** *** ***Internal consumption *** *** *** *** ***Transfers to related firms *** *** *** *** ***
Subtotal, U.S. shipments 656 649 626 644 635Export shipments *** *** *** *** ***
Total shipments *** *** *** *** *** Share of quantity (percent) Commercial U.S. shipments *** *** *** *** ***Internal consumption *** *** *** *** ***Transfers to related firms *** *** *** *** ***
Subtotal, U.S. shipments *** *** *** *** ***Export shipments *** *** *** *** ***
Total shipments 100.0 100.0 100.0 100.0 100.0 Share of value (percent) Commercial U.S. shipments *** *** *** *** ***Internal consumption *** *** *** *** ***Transfers to related firms *** *** *** *** ***
Subtotal, U.S. shipments *** *** *** *** ***Export shipments *** *** *** *** ***
Total shipments 100.0 100.0 100.0 100.0 100.0 NA = not applicable. Source: Compiled from data submitted in response to Commission questionnaires.

III‐8
Three firms reported transfers to related firms: CMC, Gerdau, and Nucor.5 *** accounted for approximately *** of the total transfers. *** reported that its transfers are to its ***. ***. *** also reported that its mills ***. ***. ***. ***. Furthermore, ***.
U.S. producers were asked to report data on their U.S. shipments of rebar, by length, by size, and by grade, in 2013.6 Rebar greater than or equal to 60 feet in length accounted for the largest share of U.S. producers’ U.S. shipments (44.2 percent), followed by rebar greater than or equal to 20 feet in length but less than 40 feet in length (27.5 percent), and then by rebar greater than or equal to 40 feet in length but less than 60 feet in length (21.6 percent). The two remaining categories—rebar less than 20 feet in length and coiled rebar—accounted for 6.8 percent of U.S. producers’ U.S. shipments. U.S. producers’ U.S. shipments by size were concentrated in No. 5 (24.5 percent), No. 4 (22.4 percent), and No. 6 (15.9 percent). None of the remaining sizes accounted for more than 7.8 percent of U.S. producers’ U.S. shipments. U.S. producers’ U.S. shipments by grade were concentrated predominantly in grade 60 (84.5 percent). None of the remaining grades accounted for more than 7.2 percent of U.S. producers’ shipments.
U.S. PRODUCERS’ INVENTORIES
Table III‐9 presents U.S. producers’ end‐of‐period inventories and the ratio of these inventories to U.S. producers’ production, U.S. shipments, and total shipments during 2011‐13, January‐March 2013, and January‐March 2014. U.S. producers’ inventories increased throughout 2011‐13 and were higher in January‐March 2014 than in January‐March 2013. End‐of‐period inventory was highest in March 2014.7
Table III-9 Rebar: U.S. producers’ inventories, 2011-13, January-March 2013, and January-March 2014
Item Calendar year January to March
2011 2012 2013 2013 2014 Quantity (short tons) U.S. producers' end-of-period inventories 484,796 545,398 550,880 562,035 605,110 Ratio (percent) Ratio of inventories to.—
U.S. production 7.7 8.0 8.1 9.0 9.1U.S. shipments 8.2 8.5 8.4 9.5 9.8Total shipments *** *** *** *** ***
Source: Compiled from data submitted in response to Commission questionnaires.
5 ***. ***. 6 These data appear in Part IV of this report, under Cumulation Considerations. 7 *** accounted for *** percent of the net increase in U.S. producers’ end‐of‐period inventories
between 2011 and 2013, and for *** percent of the net increase in U.S. producers’ end‐of‐period inventories in January‐March 2014 compared to January‐March 2013.

III‐9
U.S. PRODUCERS’ IMPORTS AND PURCHASES
***. ***. 8 ***.9 ***. ***. ***. The company reported that ***. The company reported that ***. Table III‐10 presents *** during 2011‐13, January‐March 2013, and January‐March 2014.
Table III-10 Rebar: *** U.S. imports and purchases of rebar, 2011-13, January-March 2013, and January-March 2014
Item Calendar year January to March
2011 2012 2013 2013 2014 Quantity (short tons) Imports from --
Mexico *** *** *** *** ***Turkey (other than Habas) *** *** *** *** ***Turkey (Habas) *** *** *** *** ***All other sources *** *** *** *** ***
Purchases from -- Mexico *** *** *** *** ***Turkey (other than Habas) *** *** *** *** ***Turkey (Habas) *** *** *** *** ***All other sources *** *** *** *** ***
Source: Compiled from data submitted in response to Commission questionnaires.
U.S. EMPLOYMENT, WAGES, AND PRODUCTIVITY
Table III‐11 presents U.S. producers’ employment‐related data during 2011‐13, January‐March 2013, and January‐March 2014. The number of production and related workers increased between 2011 and 2012, as did their hours worked and wages paid. Hourly wages also increased between 2011 and 2012, but productivity gains kept unit labor costs stable. Between 2012 and 2013, the number of production and related workers increased again, as did their hours worked and wages paid. Hourly wages increased further, but lower productivity resulted in increased unit labor costs. The number of production and related workers, their hours worked, and their wages paid were all higher in January‐March 2014 than in January‐March 2013, while hourly wage rates, productivity, and unit labor costs were generally comparable.
8 ***. ***. Email from ***, August 21, 2014. 9 ***.

III‐10
Table III-11 Rebar: Average number of production and related workers, hours worked, wages paid to such employees, hourly wages, productivity, and unit labor costs, 2011-13, January-March 2013, and January-March 2014
Item Calendar year January to March
2011 2012 2013 2013 2014 Production and related workers (PRWs) (number) 3,966 4,078 4,183 4,087 4,133Total hours worked (1,000 hours) 7,977 8,251 8,369 1,996 2,134Hours worked per PRW (hours) 2,011 2,023 2,001 488 516Wages paid ($1,000) 283,836 309,473 321,526 76,124 81,581Hourly wages (dollars per hour) $35.58 $37.51 $38.42 $38.14 $38.23 Productivity (short tons per 1,000 hours) 793 828 810 781 780Unit labor costs (dollars per short tons) $45 $45 $47 $49 $49
Source: Compiled from data submitted in response to Commission questionnaires.

IV‐1
PART IV: U.S. IMPORTS, APPARENT U.S. CONSUMPTION, AND MARKET SHARES
U.S. IMPORTERS
The Commission issued importer questionnaires to 47 firms believed to be importers of subject rebar, as well as to all U.S. producers of rebar.1 Usable questionnaire responses were received from 18 companies, representing virtually all imports of rebar from Mexico, and 84.2 percent of imports of rebar from Turkey in 2013.2 Table IV‐1 lists all responding U.S. importers of rebar from Mexico, Turkey, and other sources, their locations, and their shares of U.S. imports, in 2013.
1 The Commission issued questionnaires to those firms identified in the petition, along with firms that, based on a review of proprietary data provided by ***, may have imported merchandise under the HTS statistical reporting numbers by which subject imports primarily enter the United States: 7213.10.0000, 7214.20.0000, and 7228.30.8010. The subject merchandise may also enter under other statistical reporting numbers, including 7215.90.1000, 7215.90.5000, 7221.00.0015, 7221.00.0030, 7221.00.0045, 7222.11.0001, 7222.11.0057, 7222.11.0059, 7222.30.0001, 7227.20.0080, 7227.90.6085 (discontinued in 2014 and replaced with 7227.90.6030, 7227.90.6035, 7227.90.6040, and 7227.90.6090), 7228.20.1000, and 7228.60.6000.
2 Import data are based on official Commerce statistics (HTS statistical reporting numbers 7213.10.0000, 7214.20.0000, and 7228.30.8010). Staff believes official Commerce statistics are more reliable than importers’ questionnaire response data due to export shipping lag times arising from producers/exporters (e.g., ***) acting as their own importer of record. Parties view official Commerce statistics as representative of U.S. imports. RTAC’s postconference brief, exh. 1, p. 36, and conference transcript, pp. 221‐222 (Nolan and Bond).

IV‐2
Table IV-1 Rebar: U.S. importers, headquarters, and share of imports by source, 2013
Firm Headquarters
Share of imports by source (percent)
Mexico
Turkey (other than
Habas) Turkey (Habas)
All other sources Total
Aldarra Overseas Group Inc. San Juan, PR *** *** *** *** ***
C&F International Houston, TX *** *** *** *** ***
CMC Irving, TX *** *** *** *** ***
Concrete Reinforcing Products Sunrise , FL *** *** *** *** ***
Deacero USA, Inc. Houston, TX *** *** *** *** ***
Ekinciler Istanbul, Turkey *** *** *** *** ***
Gasa Steel San Antonio, TX *** *** *** *** ***
Habas Istanbul, Turkey *** *** *** *** ***
Icdas Istanbul, Turkey *** *** *** *** ***
Intermetal Rebar LLC Miami, FL *** *** *** *** ***
Intermetal-International Metal Miami, FL *** *** *** *** ***
Izmir Demir Celik Sanayi A.S. Izmir, Turkey *** *** *** *** ***
Macsteel International USA Corp. White Plains, NY *** *** *** *** ***
Medtrade, Inc. Houston, TX *** *** *** *** ***
Simec USA Corp. National City, CA *** *** *** *** ***
Stemcor USA, Inc. New York, NY *** *** *** *** ***
Tata Steel International (North America) Ltd. Schaumburg, IL *** *** *** *** ***
Ternium International USA Corp. Houston, TX *** *** *** *** ***
Total *** *** *** *** ***
Source: Compiled from data submitted in response to Commission questionnaires.
U.S. IMPORTS
Table IV‐2 presents data for U.S. imports of rebar from Mexico, Turkey, and all other sources.3 In 2011, Mexico was the largest supplier of rebar to the United States. In 2012, Turkey (other than Habas) became the largest supplier of rebar to the United States, and continued as such in 2013 and into 2014. In 2013, imports of rebar from Mexico and from subject Turkish producers and exporters, combined, accounted for *** percent of the quantity and *** percent of the value of all U.S. imports of rebar. The largest nonsubject supplier was Habas, which accounted for *** percent of the quantity of total imports in 2013. Other nonsubject suppliers include Spain (3.5 percent of the quantity of total imports in 2013), the Dominican Republic (2.6 percent), Japan (2.1 percent), Korea (1.6 percent), and Peru (1.0 percent).
From 2011 to 2013, the quantity of imports of rebar from subject Turkish producers and exporters increased by *** percent and the value increased by *** percent. The unit value of these imports from Turkey decreased by *** percent from 2011 to 2012, and declined by *** percent from 2012 to 2013, resulting in an overall decrease in unit value from 2011 to 2013 of
3 In its final determination, Commerce calculated a zero percent dumping margin and a de minimis subsidy rate for Habas. Accordingly, Habas is treated as a nonsubject source and table IV‐2 presents U.S. imports from Turkey from producers and exporters other than Habas.

IV‐3
*** percent. The quantity of imports of rebar from subject Turkish producers and exporters was *** percent lower in January‐March 2014 than in January‐March 2013, although the value was *** percent higher. Accordingly, the unit value of these imports from Turkey was *** percent higher in January‐March 2014 than in January‐March 2013.
From 2011 to 2013, the quantity of imports of rebar from Mexico increased by 19.4 percent and the value increased by 8.2 percent. The unit value of imports of rebar from Mexico decreased by 9.4 percent from 2011 to 2013, as the quantity of imports of rebar from Mexico increased more than the value during the period. The quantity of imports of rebar from Mexico was 7.5 percent higher in January‐March 2014 than in January‐March 2013. The value of imports of rebar from Mexico was 4.6 percent higher in January‐March 2014 than in January‐March 2013. The unit value of imports of rebar from Mexico was 2.6 percent lower in January‐March 2014 than in January‐March 2013.

IV‐4
Table IV-2 Rebar: U.S. imports by source, 2011-13, January-March 2013, and January-March 20141
Item Calendar year January to March
2011 2012 2013 2013 2014 Quantity (short tons) U.S. imports from.-- Mexico 283,285 293,749 338,200 77,482 83,281
Turkey (other than Habas) *** *** *** *** ***
Subtotal (subject *** *** *** *** ***
All other sources --
Turkey (Habas) *** *** *** *** ***
Spain 0 0 42,744 0 26,445
Dominican Republic 82,359 39,575 31,242 5,624 7,411
Japan 0 23 25,723 0 17,497
Korea 0 0 19,586 4,752 2,244
Peru 0 0 11,635 0 6,060
All other 22,393 12,467 23,213 1,949 14,155
Subtotal (nonsubject) *** *** *** *** ***
Total U.S. imports 655,418 979,431 1,208,898 360,186 460,117
Value (1,000 dollars) U.S. imports from.-- Mexico 174,697 174,015 188,960 44,855 46,938
Turkey (other than Habas) *** *** *** *** ***
Subtotal (subject) *** *** *** *** ***
All other sources --
Turkey (Habas) *** *** *** *** ***
Spain 0 0 25,707 0 16,703
Dominican Republic 46,778 26,881 20,559 3,435 4,882
Japan 0 20 13,336 0 9,505
Korea 0 0 11,448 2,775 1,273
Peru 0 0 6,911 0 3,767
All other 17,840 10,729 17,803 1,664 9,312
Subtotal (nonsubject) *** *** *** *** ***
Total U.S. imports 410,448 602,951 686,610 203,520 263,933 Table continued on next page.

IV‐5
Table IV-2--Continued Rebar: U.S. imports by source, 2011-13, January-March 2013, and January-March 20141
Item Calendar year January to March
2011 2012 2013 2013 2014 Unit value (dollars per short ton) U.S. imports from.-- Mexico 617 592 559 579 564
Turkey (other than Habas) *** *** *** *** ***
Subtotal (subject) *** *** *** *** ***
All other sources --
Turkey (Habas) *** *** *** *** ***
Spain 0 0 601 0 632
Dominican Republic 568 679 658 611 659
Japan 0 893 518 0 543
Korea 0 0 584 584 567
Peru 0 0 594 0 622
All other 797 861 767 854 658
Subtotal (nonsubject) *** *** *** *** ***
Total U.S. imports 626 616 568 565 574
Share of quantity (percent) U.S. imports from.-- Mexico 43.2 30.0 28.0 21.5 18.1
Turkey (other than Habas) *** *** *** *** ***
Subtotal (subject) *** *** *** *** ***
All other sources --
Turkey (Habas) *** *** *** *** ***
Spain 0.0 0.0 3.5 0.0 5.7
Dominican Republic 12.6 4.0 2.6 1.6 1.6
Japan 0.0 0.0 2.1 0.0 3.8
Korea 0.0 0.0 1.6 1.3 0.5
Peru 0.0 0.0 1.0 0.0 1.3
All other 3.4 1.3 1.9 0.5 3.1
Subtotal (nonsubject) *** *** *** *** ***
Total U.S. imports 100.0 100.0 100.0 100.0 100.0Table continued on next page.

IV‐6
Table IV-2--Continued Rebar: U.S. imports by source, 2011-13, January-March 2013, and January-March 20141
Item Calendar year January to March
2011 2012 2013 2013 2014 Share of value (percent) U.S. imports from.-- Mexico 42.6 28.9 27.5 22.0 17.8
Turkey (other than Habas) *** *** *** *** ***
Subtotal (subject *** *** *** *** ***
All other sources --
Turkey (Habas) *** *** *** *** ***
Spain 0.0 0.0 3.7 0.0 6.3
Dominican Republic 11.4 4.5 3.0 1.7 1.8
Japan 0.0 0.0 1.9 0.0 3.6
Korea 0.0 0.0 1.7 1.4 0.5
Peru 0.0 0.0 1.0 0.0 1.4
All other 4.3 1.8 2.6 0.8 3.5
Subtotal (nonsubject) *** *** *** *** ***
Total U.S. imports 100.0 100.0 100.0 100.0 100.0 1 Does not include imports of deformed steel wire. ***. For more information on deformed steel wire, see app. C. Source: Compiled from *** and official statistics of the Department of Commerce.
CRITICAL CIRCUMSTANCES
On September 15, 2014, Commerce issued its final determinations for these investigations, which included affirmative determinations of critical circumstances for several sources.4 In its final determination of sales at less than fair value for Mexico, Commerce determined that critical circumstances exist with regard to imports from Mexico from Deacero, Acerero, Simec, and Mexican firms that are subject to the all others rate (collectively, all producers and exporters).5 Table IV‐3 presents monthly data of imports of rebar by U.S. importers from Mexico from all producers and exporters, for the six‐month periods before and after the filing of the petition on September 4, 2013, as well as end‐of‐period inventories. In the
4 When petitioners file timely allegations of critical circumstances, Commerce examines whether there is a reasonable basis to believe or suspect that (1) either there is a history of dumping and material injury by reason of dumped imports in the United States or elsewhere of the subject merchandise, or the person by whom, or for whose account, the merchandise was imported knew or should have known that the exporter was selling the subject merchandise at LTFV and that there was likely to be material injury by reason of such sales; and (2) there have been massive imports of the subject merchandise over a relatively short period.
5 Steel Concrete Reinforcing Bar From Mexico: Final Determination of Sales at Less Than Fair Value and Final Affirmative Determination of Critical Circumstances, 79 FR 54967, September 15, 2014.

IV‐7
six‐month period before the filing of the petition (March‐August 2013), imports of rebar from Mexico totaled 170,896 short tons (47.8 percent of total imports of rebar from Mexico during March 2013‐February 2014). In the six‐month period after the filing of the petition (September 2013‐February 2014), imports of rebar from Mexico totaled 186,342 short tons (52.2 percent of imports of rebar from Mexico during March 2013‐February 2014).
Table IV-3 Rebar: U.S. imports from Mexico, by month, March 2013 through February 20141
Month/year U.S. imports from Mexico
Quantity (short tons) Share of total (percent) March 2013 35,962 10.1
April 2013 29,394 8.2
May 2013 22,073 6.2
June 2013 21,210 5.9
July 2013 24,981 7.0
August 2013 37,275 10.4
September 2013 31,530 8.8
October 2013 34,974 9.8
November 2013 31,063 8.7
December 2013 28,218 7.9
January 2014 35,008 9.8
February 2014 25,549 7.2
Total imports 357,238 100.0
Item Period
Jan-Mar 2013 Jan-Mar 2014 U.S. importers' EOP inventories *** *** 1 Does not include imports of deformed steel wire. ***. For more information on deformed steel wire, see app. C. Source: Compiled from official statistics of the Department of Commerce (import data) and data submitted in response to Commission questionnaires (inventory data).
In its final countervailing duty determination for Turkey, Commerce determined that critical circumstances exist with regard to imports from Turkey of rebar from all producers and exporters other than Habas and Icdas.6 Table IV‐4 presents monthly data of imports of rebar by U.S. importers from Turkey from all producers and exporters other than Habas and Icdas, for the six‐month periods before and after the filing of the petition on September 4, 2013, as well as end‐of‐period inventories. In the six‐month period before the filing of the petition (March‐August 2013), imports of rebar from Turkey excluding Habas and Icdas totaled *** short tons (*** percent of total imports of rebar from Turkey excluding Habas and Icdas during March 2013‐February 2014). In the six‐month period after the filing of the petition (September 2013‐
6 Steel Concrete Reinforcing Bar From the Republic of Turkey: Final Affirmative Countervailing Duty Determination Final Affirmative Critical Circumstances Determination, 79 FR 54963, September 15, 2014.

IV‐8
February 2014), imports of rebar from Turkey excluding Habas and Icdas totaled *** short tons (*** percent of total imports of rebar from Turkey excluding Habas and Icdas during March 2013‐February 2014).
Table IV-4 Rebar: U.S. imports from Turkey excluding Habas and Icdas, by month, March 2013 through February 2014
Month/year
U.S. imports from Turkey (other than Habas and Icdas)
Quantity (short tons) Share of total (percent) March 2013 *** ***
April 2013 *** ***
May 2013 *** ***
June 2013 *** ***
July 2013 *** ***
August 2013 *** ***
September 2013 *** ***
October 2013 *** ***
November 2013 *** ***
December 2013 *** ***
January 2014 *** ***
February 2014 *** ***
Total imports *** ***
Item Period
Jan-Mar 2013 Jan-Mar 2014 U.S. importers' EOP inventories *** ***
Source: Compiled from *** (import data) and data submitted in response to Commission questionnaires (inventory data).
Where Commerce has made affirmative final critical circumstances determinations, and if the Commission makes affirmative critical circumstances findings, subject imports from Mexico may be subject to antidumping duties retroactive by 90 days from April 24, 2014, the effective date of Commerce’s preliminary LTFV determination;7 and certain subject imports from Turkey may be subject to countervailing duties retroactive by 90 days from September 15, 2014, the effective date of Commerce’s final countervailing duty determination.8
7 Steel Concrete Reinforcing Bar From Mexico: Final Determination of Sales at Less Than Fair Value and Final Affirmative Determination of Critical Circumstances, 79 FR 54967, September 15, 2014.
8 Steel Concrete Reinforcing Bar From the Republic of Turkey: Final Affirmative Countervailing Duty Determination Final Affirmative Critical Circumstances Determination, 79 FR 54963, September 15, 2014.

IV‐9
NEGLIGIBILITY
The statute requires that an investigation be terminated without an injury determination if imports of the subject merchandise are found to be negligible.9 Negligible imports are generally defined in the Tariff Act of 1930, as amended, as imports from a country of merchandise corresponding to a domestic like product where such imports account for less than 3 percent of the volume of all such merchandise imported into the United States in the most recent 12‐month period for which data are available that precedes the filing of the petition or the initiation of the investigation. However, if there are imports of such merchandise from a number of countries subject to investigations initiated on the same day that individually account for less than 3 percent of the total volume of the subject merchandise, and if the imports from those countries collectively account for more than 7 percent of the volume of all such merchandise imported into the United States during the applicable 12‐month period, then imports from such countries are deemed not to be negligible.10 Imports from Mexico accounted for 30.3 percent of total imports of rebar by quantity during September 2012‐August 2013 and imports from subject Turkish producers and exporters accounted for *** percent of total imports of rebar by quantity during September 2012‐August 2013. During this period, imports from nonsubject Habas accounted for *** percent of total imports of rebar by quantity and all other sources accounted for 5.7 percent.
CUMULATION CONSIDERATIONS
In assessing whether imports should be cumulated, the Commission determines whether U.S. imports from the subject countries compete with each other and with the domestic like product and has generally considered four factors: (1) fungibility, (2) presence of sales or offers to sell in the same geographical markets, (3) common or similar channels of distribution, and (4) simultaneous presence in the market. Additional information concerning fungibility, geographical markets, and simultaneous presence in the market is presented below.
Fungibility
Table IV‐5 presents U.S. producers’ and importers’ U.S. shipments of rebar by length. Table IV‐6 presents U.S. producers’ and U.S importers’ U.S. shipments by size. Table IV‐7 presents U.S. producers’ and importers’ U.S. shipments of rebar by grade.
9 Sections 703(a)(1), 705(b)(1), 733(a)(1), and 735(b)(1) of the Act (19 U.S.C. §§ 1671b(a)(1), 1671d(b)(1), 1673b(a)(1), and 1673d(b)(1)).
10 Section 771 (24) of the Act (19 U.S.C § 1677(24)).

IV‐10
Table IV-5 Rebar: U.S. producers’ and importers’ U.S. shipments, by length, 2013
Item
United States Mexico1
Quantity (short tons) Share (%)
Quantity (short tons) Share (%)
< 20 feet (straight) 96,788 1.5 *** ***
≥ 20 but < 40 feet (straight) 1,790,975 27.5 *** ***
≥ 40 but < 60 feet (straight) 1,407,718 21.6 *** ***
≥ 60 feet (straight) 2,881,481 44.2 *** ***
Coiled rebar 343,813 5.3 *** ***
Total U.S. shipments 6,520,775 100.0 *** ***
Item
Turkey (other than Habas) Turkey (Habas) Quantity
(short tons) Share (%) Quantity
(short tons) Share (%) < 20 feet (straight) *** *** *** ***
≥ 20 but < 40 feet (straight) *** *** *** ***
≥ 40 but < 60 feet (straight) *** *** *** ***
≥ 60 feet (straight) *** *** *** ***
Coiled rebar *** *** *** ***
Total U.S. shipments *** *** *** ***
Item
All other sources Total importers’ U.S. shipments Quantity
(short tons) Share (%) Quantity
(short tons) Share (%) < 20 feet (straight) *** *** 91,253 8.6
≥ 20 but < 40 feet (straight) *** *** 666,001 62.6
≥ 40 but < 60 feet (straight) *** *** 276,128 26.0
≥ 60 feet (straight) *** *** 16,090 1.5
Coiled rebar *** *** 13,870 1.3
Total U.S. shipments *** *** 1,063,341 100.01 Does not include imports of deformed steel wire. ***. For more information on deformed steel wire, see app. C. Source: Compiled from data submitted in response to Commission questionnaires.

IV‐11
Table IV-6 Rebar: U.S. producers’ and importers’ U.S. shipments, by size, 2013
Item
United States Mexico1 Quantity
(short tons) Share (%) Quantity
(short tons) Share (%) No. 3 315,721 4.8 *** ***
No. 4 1,457,509 22.4 *** ***
No. 5 1,596,598 24.5 *** ***
No. 6 1,038,814 15.9 *** ***
No. 7 418,793 6.4 *** ***
No. 8 507,473 7.8 *** ***
No. 9 370,817 5.7 *** ***
No. 10 247,314 3.8 *** ***
No. 11 361,099 5.5 *** ***
No. 14/18 79,019 1.2 *** ***
Other 127,618 2.0 *** ***
Total U.S. shipments 6,520,775 100.0 *** ***
Item
Turkey (other than Habas) Turkey (Habas) Quantity
(short tons) Share (%) Quantity
(short tons) Share (%) No. 3 *** *** *** ***
No. 4 *** *** *** ***
No. 5 *** *** *** ***
No. 6 *** *** *** ***
No. 7 *** *** *** ***
No. 8 *** *** *** ***
No. 9 *** *** *** ***
No. 10 *** *** *** ***
No. 11 *** *** *** ***
No. 14/18 *** *** *** ***
Other *** *** *** ***
Total U.S. shipments *** *** *** ***Table continued on next page.

IV‐12
Table IV-6--Continued Rebar: U.S. producers’ and importers’ U.S. shipments, by size, 2013
Item
All other sources Total importers’ U.S. shipments Quantity
(short tons) Share (%) Quantity
(short tons) Share (%) No. 3 *** *** 237,780 22.4
No. 4 *** *** 452,520 42.6
No. 5 *** *** 236,803 22.3
No. 6 *** *** 75,336 7.1
No. 7 *** *** 18,814 1.8
No. 8 *** *** 15,448 1.5
No. 9 *** *** 7,200 0.7
No. 10 *** *** 3,929 0.4
No. 11 *** *** 5,638 0.5
No. 14/18 *** *** 0 0.0
Other *** *** 9,873 0.9
Total U.S. shipments *** *** 1,063,341 100.01 Does not include imports of deformed steel wire. ***. For more information on deformed steel wire, see app. C. Source: Compiled from data submitted in response to Commission questionnaires.

IV‐13
Table IV-7 Rebar: U.S. producers’ and importers’ U.S. shipments, by grade,1 2013
Item
United States Mexico2 Quantity
(short tons) Share (%) Quantity
(short tons) Share (%) Grade 40 328,408 5.0 *** ***
Grade 60 5,506,819 84.5 *** ***
Grade 75 213,022 3.3 *** ***
Other 472,525 7.2 *** ***
Total U.S. shipments 6,520,775 100.0 *** ***
Item
Turkey (other than Habas) Turkey (Habas) Quantity
(short tons) Share (%) Quantity
(short tons) Share (%) Grade 40 *** *** *** ***
Grade 60 *** *** *** ***
Grade 75 *** *** *** ***
Other *** *** *** ***
Total U.S. shipments *** *** *** ***
Item
All other sources Total importers’ U.S. shipments Quantity
(short tons) Share (%) Quantity
(short tons) Share (%) Grade 40 *** *** 213,265 20.1
Grade 60 *** *** 838,452 78.9
Grade 75 *** *** 6,104 0.6
Other *** *** 5,520 0.5
Total U.S. shipments *** *** 1,063,341 100.01 Refers to minimum yield strength, in thousands of pounds per square inch (psi). Thus grade 60 rebar (60,000 psi) has a higher minimum yield strength than grade 40 rebar (40,000 psi).
2 Does not include imports of deformed steel wire. ***. For more information on deformed steel wire, see app. C. Source: Compiled from data submitted in response to Commission questionnaires.
Presence in the market
Official Commerce statistics and *** for U.S. imports were used to evaluate subject import presence in the market. Table IV‐8 and Figure IV‐1 present U.S. imports by month from each subject source. With respect to U.S. imports of rebar from Mexico, the month with the greatest quantity of entries was January 2011, with entries of 44,870 short tons. Subject imports from Turkey exceeded this level in 16 of the 42 months between January 2011 and June 2014, peaking at *** short tons in *** 2013.

IV‐14
Table IV-8 Rebar: U.S. imports from subject sources, by month, January 2011-June 20141
Country
2011 Jan Feb Mar Apr May Jun
Quantity (short tons) Mexico 44,870 18,207 29,380 16,290 19,416 18,496
Turkey (other than Habas) *** *** *** *** *** ***
Subtotal (subject) *** *** *** *** *** ***
Turkey (Habas) *** *** *** *** *** ***
All other sources 6,195 16,097 8,913 6,403 6,785 3,375
Subtotal (nonsubject) *** *** *** *** *** ***
Total imports 51,065 83,240 62,360 94,739 54,352 54,302
Country
2011 Jul Aug Sep Oct Nov Dec
Quantity (short tons) Mexico 21,980 29,906 28,364 20,776 20,590 15,009
Turkey (other than Habas) *** *** *** *** *** ***
Subtotal (subject) *** *** *** *** *** ***
Turkey (Habas) *** *** *** *** *** ***
All other sources 6,720 24,323 4,313 11,540 3,708 6,379
Subtotal (nonsubject) *** *** *** *** *** ***
Total imports 28,704 54,283 32,697 32,317 35,658 71,702
Country
2012 Jan Feb Mar Apr May Jun
Quantity (short tons) Mexico 20,110 11,939 29,877 19,007 22,754 24,407
Turkey (other than Habas) *** *** *** *** *** ***
Subtotal (subject) *** *** *** *** *** ***
Turkey (Habas) *** *** *** *** *** ***
All other sources 10,257 3,168 7,758 3,385 4,119 4,630
Subtotal (nonsubject) *** *** *** *** *** ***
Total imports 137,057 124,460 109,084 105,703 75,983 70,180
Country
2012 Jul Aug Sep Oct Nov Dec
Quantity (short tons) Mexico 19,767 33,234 32,800 22,617 30,411 26,825
Turkey (other than Habas) *** *** *** *** *** ***
Subtotal (subject) *** *** *** *** *** ***
Turkey (Habas) *** *** *** *** *** ***
All other sources 2,704 3,513 4,097 3,928 1,778 2,729
Subtotal (nonsubject) *** *** *** *** *** ***
Total imports 36,802 57,643 46,299 58,814 97,728 59,679
Table continued on next page.

IV‐15
Table IV-8--Continued Rebar: U.S. imports from subject sources, by month, January 2011-June 20141
Country
2013 Jan Feb Mar Apr May Jun
Quantity (short tons) Mexico 19,106 22,414 35,962 29,394 22,073 21,210
Turkey (other than Habas) *** *** *** *** *** ***
Subtotal (subject) *** *** *** *** *** ***
Turkey (Habas) *** *** *** *** *** ***
All other sources 7,026 3,364 1,936 1,631 7,644 14,175
Subtotal (nonsubject) *** *** *** *** *** ***
Total imports 117,679 82,290 160,217 39,369 150,983 100,411
Country
2013 Jul Aug Sep Oct Nov Dec
Quantity (short tons) Mexico 24,981 37,275 31,530 34,974 31,063 28,218
Turkey (other than Habas) *** *** *** *** *** ***
Subtotal (subject) *** *** *** *** *** ***
Turkey (Habas) *** *** *** *** *** ***
All other sources 7,131 5,728 23,867 9,459 20,330 51,850
Subtotal (nonsubject) *** *** *** *** *** ***
Total imports 49,248 111,165 140,179 73,676 103,614 80,068
Country
2014 Jan Feb Mar Apr May Jun
Quantity (short tons) Mexico 35,008 25,549 22,723 14,647 185 167
Turkey (other than Habas) *** *** *** *** *** ***
Subtotal (subject) *** *** *** *** *** ***
Turkey (Habas) *** *** *** *** *** ***
All other sources 41,372 18,738 13,703 45,215 36,324 6,002
Subtotal (nonsubject) *** *** *** *** *** ***
Total imports 214,572 92,242 153,303 132,634 87,839 69,6231 Does not include imports of deformed steel wire. ***. For more information on deformed steel wire, see app. C. Source: Compiled from official Commerce statistics and ***.
Figure IV-1 Rebar: U.S. imports from Mexico and Turkey (other than Habas), by month, January 2011-June 2014
* * * * * * *

IV‐16
Geographical markets
Official Commerce statistics show that in 2013, approximately 92.6 percent of U.S. imports of rebar from Mexico entered the United States through the customs districts of Laredo, Texas (75.6 percent); and El Paso, Texas (17.0 percent). All other U.S. imports of rebar from Mexico entered through the customs districts of San Diego, California; and Nogales, Arizona; and San Juan, Puerto Rico. Official Commerce statistics and *** show that in 2013, approximately *** percent of U.S. imports of rebar from subject Turkish producers and exporters entered through the customs districts of Houston‐Galveston, Texas (*** percent); Miami, Florida (*** percent); New Orleans, Louisiana (*** percent); San Juan, Puerto Rico (*** percent); and Philadelphia, Pennsylvania (*** percent). All other U.S. imports of rebar from subject Turkish producers and exporters entered through the customs districts of New York, New York; Baltimore, Maryland; Boston, Massachusetts; and Tampa, Florida. Figures IV‐2 and IV‐3 present the share of U.S. imports by district from Mexico and Turkey (excluding Habas).
Figure IV-2 Rebar: Share of U.S. imports from Mexico, by district, 2013
Note.-- Excludes imports of deformed steel wire. Source: Compiled from official Commerce statistics.
17.0%
75.6%
0.8%5.7% 0.9%
El Paso, TX
Laredo, TX
Nogales, AZ
San Diego, CA
San Juan, PR

IV‐17
Figure IV-3 Rebar: Share of U.S. imports from Turkey (excluding Habas), by district, 2013
* * * * * * *
APPARENT U.S. CONSUMPTION
Table IV‐9 presents data on apparent U.S. consumption and U.S. market shares for rebar over 2011‐13, January‐March 2013, and January‐March 2014.
U.S. MARKET SHARES
U.S. market share data are presented in table IV‐10. Respondents argued that there is seasonality in the U.S. market, as construction is more prevalent during the spring months but lags during the winter months. Accordingly, purchases for rebar are low in the fourth quarter but are high during the first half the year.11 Counsel for respondents argued that because of this seasonality, comparing market shares between an interim period and a full year is not a valid assessment.12
11 Hearing transcript, pp. 186‐87 (Nolan). 12 Hearing transcript, pp. 186‐87 (Nolan).

IV‐18
Table IV-9 Rebar: U.S. shipments of domestic product, U.S. imports, and apparent U.S. consumption, 2011-13, January-March 2013, and January-March 2014
Item Calendar year January to March
2011 2012 2013 2013 2014 Quantity (short tons) U.S. producers' U.S. shipments 5,883,245 6,411,375 6,520,775 1,485,838 1,545,205
U.S. imports from.-- Mexico 283,285 293,749 338,200 77,482 83,281
Turkey (other than Habas) *** *** *** *** ***
Subtotal (subject) *** *** *** *** ***
All other sources --
Turkey (Habas) *** *** *** *** ***
Spain 0 0 42,744 0 26,445
Dominican Republic 82,359 39,575 31,242 5,624 7,411
Japan 0 23 25,723 0 17,497
Korea 0 0 19,586 4,752 2,244
Peru 0 0 11,635 0 6,060
All other 22,393 12,467 23,213 1,949 14,155
Subtotal (nonsubject) *** *** *** *** ***
Total U.S. imports 655,418 979,431 1,208,898 360,186 460,117
Apparent U.S. consumption 6,538,663 7,390,806 7,729,673 1,846,024 2,005,322
Value (1,000 dollars) U.S. producers' U.S. shipments 3,861,848 4,162,510 4,080,230 957,585 981,886
U.S. imports from.-- Mexico 174,697 174,015 188,960 44,855 46,938
Turkey (other than Habas) *** *** *** *** ***
Subtotal (subject) *** *** *** *** ***
All other sources --
Turkey (Habas) *** *** *** *** ***
Spain 0 0 25,707 0 16,703
Dominican Republic 46,778 26,881 20,559 3,435 4,882
Japan 0 20 13,336 0 9,505
Korea 0 0 11,448 2,775 1,273
Peru 0 0 6,911 0 3,767
All other 17,840 10,729 17,803 1,664 9,312
Subtotal (nonsubject) *** *** *** *** ***
Total U.S. imports 410,448 602,951 686,610 203,520 263,933
Apparent U.S. consumption 4,272,296 4,765,461 4,766,840 1,161,105 1,245,819 1 Does not include imports of deformed steel wire. ***. For more information on deformed steel wire, see app. C. Source: Compiled from data submitted in response to Commission questionnaires (shipment data), ***, and official statistics of the Department of Commerce (import data).

IV‐19
Table IV-10 Rebar: U.S. consumption and market shares, 2011-13, January-March 2013, and January-March 2014
Item Calendar year January to March
2011 2012 2013 2013 2014 Share of quantity (percent) U.S. producers' U.S. shipments 90.0 86.7 84.4 80.5 77.1
U.S. imports from.-- Mexico 4.3 4.0 4.4 4.2 4.2
Turkey (other than Habas) *** *** *** *** ***
Subtotal (subject) *** *** *** *** ***
All other sources --
Turkey (Habas) *** *** *** *** ***
Spain 0.0 0.0 0.6 0.0 1.3
Dominican Republic 1.3 0.5 0.4 0.3 0.4
Japan 0.0 0.0 0.3 0.0 0.9
Korea 0.0 0.0 0.3 0.3 0.1
Peru 0.0 0.0 0.2 0.0 0.3
All other 0.3 0.2 0.3 0.1 0.7
Subtotal (nonsubject) *** *** *** *** ***
Total U.S. imports 10.0 13.3 15.6 19.5 22.9
Share of value (percent) U.S. producers' U.S. shipments 90.4 87.3 85.6 82.5 78.8
U.S. imports from.-- Mexico 4.1 3.7 4.0 3.9 3.8
Turkey (other than Habas) *** *** *** *** ***
Subtotal (subject) *** *** *** *** ***
All other sources --
Turkey (Habas) *** *** *** *** ***
Spain 0.0 0.0 0.5 0.0 1.3
Dominican Republic 1.1 0.6 0.4 0.3 0.4
Japan 0.0 0.0 0.3 0.0 0.8
Korea 0.0 0.0 0.2 0.2 0.1
Peru 0.0 0.0 0.1 0.0 0.3
All other 0.4 0.2 0.4 0.1 0.7
Subtotal (nonsubject) *** *** *** *** ***
Total U.S. imports 9.6 12.7 14.4 17.5 21.2 1 Does not include imports of deformed steel wire. ***. For more information on deformed steel wire, see app. C. Source: Compiled from data submitted in response to Commission questionnaires (shipment data), ***, and official statistics of the Department of Commerce (import data).

IV‐20
RATIO OF IMPORTS TO U.S. PRODUCTION
Table IV‐11 presents data on the ratio of U.S. imports to U.S. production.
Table IV-11 Rebar: Ratio of U.S. imports to U.S. production, 2011-13, January-March 2013, and January-March 20141
Item Calendar year January to March
2011 2012 2013 2013 2014 Ratio to U.S. rebar production (percent) U.S. imports from.-- Mexico 4.5 4.3 5.0 5.0 5.0
Turkey (other than Habas) *** *** *** *** ***
Subtotal (subject) *** *** *** *** ***
All other sources --
Turkey (Habas) *** *** *** *** ***
Spain 0.0 0.0 0.6 0.0 1.6
Dominican Republic 1.3 0.6 0.5 0.4 0.4
Japan 0.0 0.0 0.4 0.0 1.1
Korea 0.0 0.0 0.3 0.3 0.1
Peru 0.0 0.0 0.2 0.0 0.4
All other 0.4 0.2 0.3 0.1 0.9
Subtotal (nonsubject) *** *** *** *** ***
Total U.S. imports 10.4 14.3 17.8 23.1 27.6 1 Does not include imports of deformed steel wire. ***. For more information on deformed steel wire, see app. C. Source: Compiled from data submitted in response to Commission questionnaires and official Commerce Statistics.

V‐1
PART V: PRICING DATA
FACTORS AFFECTING PRICES
As noted earlier, demand factors such as fluctuations in the non‐residential (and to a lesser extent in residential) construction sectors, as well as overall U.S. economic activity, influence rebar prices. On the supply side, rebar prices are affected mainly by scrap prices.
Raw material costs
Raw materials accounted for approximately two‐thirds of rebar cost of goods sold (COGS) during January 2011 – March 2014. The principal raw material used in rebar production is scrap metal. As shown in figure V‐1, prices for scrap steel in the United States have fluctuated between January 2011 and July 2014, with the highest price in the beginning of 2012 ($415 per short ton) and the lowest price in mid‐2012 ($299 per short ton). Overall, scrap prices declined by 18.4 percent between January 2011 and July 2014. Figure V‐2 compares the quarterly average price of scrap with the price of U.S. product 3 (the largest product in terms of quantity sold to unrelated purchasers by U.S. producers).
Figure V-1 Scrap prices: Monthly price of shredded auto scrap to consumers, Chicago, January 2011 - July 2014
Source: American Metal Markets, October 2014.
0
50
100
150
200
250
300
350
400
450
2011 2012 2013 2014
Dollars per short ton
Shredded auto scrap, Chicago

V‐2
Figure V-2 Rebar and scrap: Quarterly prices of U.S. pricing product 3 and scrap (lagged by one quarter), January 2011 - March 2014
Source: American Metal Markets and compiled from data submitted in response to Commission questionnaires.
Producers and importers were asked how raw material costs had changed and if they expected these trends to continue. Most producers reported that scrap prices were volatile and an important cost. Importers reported that raw material prices (including scrap and iron ore) have fluctuated, and that raw material costs are an important determinant of rebar prices. None of the U.S. producers predicted how scrap prices would change in the future; however two importers expected that the price of inputs would increase, one expected it would decrease, and one expected continued fluctuations.
U.S. inland transportation costs
Most responding U.S. producers (8 of 9) reported that they typically arrange transportation to their customers. In contrast, most importers reported that their purchasers arranged transportation. U.S. producers reported that their U.S. inland transportation costs ranged from 5 to 10 percent with seven of the eight responding producers reporting transportation costs averaging 7 percent or less. Seven importers reported transportation costs
0
100
200
300
400
500
600
700
800
2011 2012 2013 2014
Dollars per short ton
Product 3 Lagged scrap

V‐3
ranging from 1 to 7 percent, with six of the seven reporting transportation costs of 5 percent or less.1
PRICING PRACTICES
Pricing methods
All nine U.S. producers of rebar and 16 of 18 responding importers used transaction‐by‐transaction negotiations to set prices (table V‐1). Two producers and three importers used contracts, and one producer used a price list.2 One importer not reporting transaction‐by‐transaction prices reported setting reported using contracts. The importer responding “other” did not explain how it set prices.
Table V-1 Rebar: U.S. producers’ and importers’ reported price setting methods, by number of responding firms1
Method U.S. producers Importers Transaction-by-transaction 9 16 Contract 2 3 Set price list 1 0 Other 0 1
1 The sum of responses down will not add up to the total number of responding firms as each firm was instructed to check all applicable price setting methods employed. Source: Compiled from data submitted in response to Commission questionnaires.
The vast majority of U.S.‐produced and imported rebar is sold on a spot basis (table V‐2). Of the five U.S. producers that use short‐term contracts, one fixes only price, while four fix both price and quantity; two noted that prices cannot be renegotiated, while three indicated that the contracts contain meet‐or‐release provisions. Of the *** producers that use long‐term contracts, *** fixes only price and *** fixes both price and quantity; *** noted that prices cannot be renegotiated, and *** indicated that the contracts contain meet‐or‐release provisions. U.S. producers’ short‐term contracts lasted from 30 to 180 days, with three of the five producers reporting that short‐term contracts lasted 30 to 45 days; long‐term contracts lasted from *** days.
1 Since most importers did not arrange transportation, most did not report cost share of inland transportation.
2 ***.
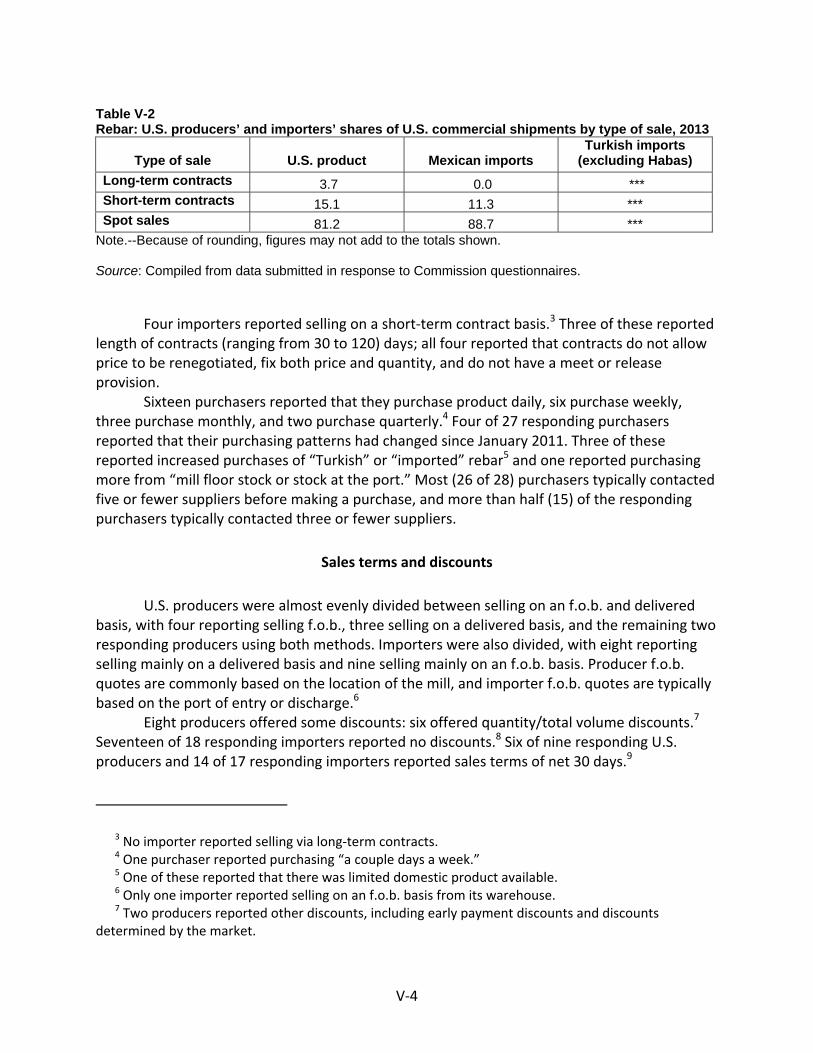
V‐4
Table V-2 Rebar: U.S. producers’ and importers’ shares of U.S. commercial shipments by type of sale, 2013
Type of sale U.S. product Mexican imports Turkish imports
(excluding Habas) Long-term contracts 3.7 0.0 *** Short-term contracts 15.1 11.3 *** Spot sales 81.2 88.7 ***
Note.--Because of rounding, figures may not add to the totals shown. Source: Compiled from data submitted in response to Commission questionnaires.
Four importers reported selling on a short‐term contract basis.3 Three of these reported
length of contracts (ranging from 30 to 120) days; all four reported that contracts do not allow price to be renegotiated, fix both price and quantity, and do not have a meet or release provision.
Sixteen purchasers reported that they purchase product daily, six purchase weekly, three purchase monthly, and two purchase quarterly.4 Four of 27 responding purchasers reported that their purchasing patterns had changed since January 2011. Three of these reported increased purchases of “Turkish” or “imported” rebar5 and one reported purchasing more from “mill floor stock or stock at the port.” Most (26 of 28) purchasers typically contacted five or fewer suppliers before making a purchase, and more than half (15) of the responding purchasers typically contacted three or fewer suppliers.
Sales terms and discounts
U.S. producers were almost evenly divided between selling on an f.o.b. and delivered basis, with four reporting selling f.o.b., three selling on a delivered basis, and the remaining two responding producers using both methods. Importers were also divided, with eight reporting selling mainly on a delivered basis and nine selling mainly on an f.o.b. basis. Producer f.o.b. quotes are commonly based on the location of the mill, and importer f.o.b. quotes are typically based on the port of entry or discharge.6
Eight producers offered some discounts: six offered quantity/total volume discounts.7 Seventeen of 18 responding importers reported no discounts.8 Six of nine responding U.S. producers and 14 of 17 responding importers reported sales terms of net 30 days.9
3 No importer reported selling via long‐term contracts. 4 One purchaser reported purchasing “a couple days a week.” 5 One of these reported that there was limited domestic product available. 6 Only one importer reported selling on an f.o.b. basis from its warehouse. 7 Two producers reported other discounts, including early payment discounts and discounts
determined by the market.

V‐5
Independent Steel Alliance
In January 2013, several U.S. and Canadian independent rebar fabricators began a purchasing cooperative called the Independent Steel Alliance (“ISA”) in order to increase negotiating leverage when making purchases from steel suppliers and to earn rebates based on purchase volumes. Its members account for more than $500 million in purchases of rebar, wire mesh, and bar supports. The ISA also was established to allow its suppliers an avenue to reach new purchasers and increase sales. Among its steel suppliers are domestic producers Byer and SDI and Mexican producer Deacero.10 Members report that the ISA is very new and still being tested.11 Respondents assert that the creation of the ISA was a response to the growing power of the largest three U.S. rebar producers who owned major distributors/fabricators.12
Eight of 10 responding producers but only 3 of 16 responding importers reported that they had sold rebar to ISA members. None of the U.S. producers and only one importer (***) reported that its conditions of sale to ISA members differed from those for other sales. *** reported ***. Eight of nine responding producers and all responding importers reported no differences between sales to ISA members and other sales and that the ISA had not affected prices or purchaser patterns.13
While only 5 of the 28 responding purchasers reported that they were members of the ISA, two of these had used the ISA in making purchases. Three purchasers reported that 5 percent or less of their 2013 purchases were through the ISA. All eight responding purchasers reported that there was no difference between ISA and other purchases.14 Two ISA members reported that the only differences in their purchases were that they identify themselves as ISA
(…continued)
8 One importer reported prompt payment discounts. 9 This includes ½ percent 10 net 30. One producer reported selling 2 percent 10 net 30, one reported
1 percent 10 net 30, and one reported ***. Two importers reported letter of credit at sight or cash against document and one reported terms are set before importation.
10 Steel Concrete Reinforcing Bar from Belarus, China, Indonesia, Latvia, Moldova, Poland, and Ukraine, Inv. Nos. 731‐TA‐873‐875, 878‐880, and 882 (Second Review), USITC Publication 4409, July 2013, p. II‐21. See also “Deacero joins ISA rebar buying co‐op,” AMM, August 9, 2013. Deacero joined the ISA on July 1, 2013. A company official indicated an interest in becoming more active in the (U.S.) fabrication market as a supplier and noted that Deacero had expanded its rebar fabrication customer base by joining the ISA. The official observed that the ISA allows Deacero to “realize improved margins” by selling directly to fabricators rather than through distributors.
11 Conference transcript, pp. 164‐165 (Melvin and Webb). 12 Respondents assert that, in addition to the degree of concentration of U.S. rebar production, “the
Big Three rebar producers ‐‐ Nucor, Gerdau, and CMC ‐‐ got into the fabrication business and consolidated it… Combined, the Big Three have over 160 fabrication shops around the United States. About 50 percent of all U.S. fabrication work goes to one of the Big Three's fabricators.” Conference transcript, pp. 185‐186 (Bazan).
13 The producer reporting there were differences did not explain what these differences were. 14 One of these, however, reported that there was the possibility of earning rebates.

V‐6
members and receive year‐end rebates of 5 percent.15 One reported that rebate programs were negotiated by the ISA and the purchase terms are negotiated between purchaser and supplier. Only 1 of 15 responding purchasers reported that the ISA has affected prices or purchase patterns, reporting that its independent purchases are made using member suppliers. Five purchasers reported benefits of ISA membership, including: possibility of getting rebates; allowing independent fabricators to consolidate volumes to compete more effectively with mill owned fabricators; and getting industry information.16
Purchases from related fabricators
Four of 10 producers and 3 of 18 importers reported sales to related fabricators or distributors. No producers or importers reported that their sales process differed between related and unrelated purchasers. No producers reported that prices differed between related and unrelated purchasers, and one of nine responding purchasers reported that it was different, reporting the payment is automatic for the related purchaser.17 Two of the seven responding importers (***) reported that prices differed based on volume and that terms differed although they did not report how. None of the six responding producers and seven importers reported any supply preference for related purchasers.
Six of the 28 responding purchasers reported purchasing product from related fabricators. One of these (***) reported its purchase process differed between related and unrelated suppliers, reporting it purchases ***.18 One purchaser, ***, reported that its purchase process did not differ between related and unrelated firms but reported it paid the “***.”19 No purchasers reported paying different prices to related and unrelated suppliers. Two of the nine purchasers reported that terms differed between related and unrelated suppliers: *** reported that payment to related suppliers was immediate and *** reported payments are made through a centralized cash management system and there are no credit‐related concerns.
Price leadership
In the purchasers’ questionnaire, a price leader was defined as “(1) one or more firms that initiate a price change, either up or down, that is followed by other firms, or (2) one or more firms that have a significant impact on prices. A price leader is not necessarily the lowest‐priced supplier.” Most responding purchasers (18 of 26) reported that Nucor was the price
15 One purchaser reported that everything else being equal it preferred purchasing from ISA members.
16 One purchaser reported that the cost outweighed the benefits. 17 One producer (***) reported that there were no credit expenses for sales to related purchasers. 18 ***. 19 The only other purchaser that provided details (***) reported it negotiated competitive prices
from both *** and third parties.

V‐7
leader.20 Nucor was reported to announce monthly price changes based on raw material costs and market conditions, and/or the first to announce price changes.21
Six of the eight responding distributors reported that Nucor was the price leader, with two of these reporting that other firms also acted as price leaders. Explanations of how Nucor acted as a price leader included:
“the market generally follows their price changes;”
“Nucor announces price changes and all other domestic producers adjust pricing accordingly;”
Nucor “is the largest producer and they lead the market;”
“all the suppliers have similar prices;” and
Nucor “announced price movements, all other domestic producers generally wait and follow. Importers will also key off Nucor's announcements and thus make changes.”
Distributors reporting other firms were also price leaders reported that:
“during the periods of 2011, 2012, 2013 Nucor was the demonstrated leader in pricing for domestic material. Monthly pricing announcements were sent just prior to the 3rd Monday of every month and were anxiously anticipated. Other Domestic suppliers would in fact attempt to take price leadership, almost always this leadership was rejected. In 2012 and 2013, Intermetal re‐emerged into the market place. It was very quick that for import material, Intermetal become a price leader. This was typically Turkish material that was offered at a sub market price.” and
“everyone in the industry follows their lead. They set the market with Gerdau being the low cost provider between the two, lower than import in most cases.”
One distributor reported Concrete Reinforcing Products (an importer) was a price leader,22 stating that:
prices drop as a result of oversupply/purchase by this firm.
20 This includes three purchasers that reported that both Nucor and Gerdau were price leaders, one that reported Nucor and Intermetal were price leaders, and one that reported Harris was a price leader because it was owned by Nucor. Other price leaders were reported by ***.
21 For examples of articles about Nucor’s price announcements, and anticipated announcements, see http://www.metalbulletin.com/Article/2627032/Iron/AMM‐Rebar‐prices‐falling‐as‐market‐awaits‐Nucor‐move‐for‐July.html#axzz374hH4ia9 and http://www.steelfirst.com/Article/3062336/Nucor‐reduces‐rebar‐prices‐by‐20‐per‐ton.html retrieved July 10, 2014.
22 ***.

V‐8
Nine end users reported Nucor was the price leader, one of these also reported Gerdau was a price leader. End users’ responses included:
“adjust prices monthly based on raw material, market conditions and foreign competition;”
“I am told that others follow Nucor's lead;”
“they announce price changes and others follow;”
“we consider Nucor as the price leader because all other suppliers and producers wait to see what Nucor does every month and they follow their lead;”
“release monthly letter;”
“since 2004, Nucor has taken the lead in establishing pricing using the scrap index which is published monthly. Any change in pricing since 2004, established by Nucor, has been followed by the other mills;”
“established a standard by which to relate scrap increases into the price;” and
“always first out with price change notifications.”
Three of the eight responding end user/distributors reported that Nucor was the price leader ***. *** of these firms reported that Nucor made price announcements, and one of these reported that it led prices up or down. Two of the *** reported other price leaders including: Icdas, Deacero, and various brokers selling imported rebar. All four *** provided further information about price leaders, including:
“firms don't determine prices, the market determines prices. The mill, foreign or domestic, that is offering the lowest price sets the standard that all must meet to be competitive in the marketplace;”
“imports lead prices down;”
“imports from various sources, primarily from Turkey and Mexico;” and
“both importing companies (Icdas and Deacero) have consistently made offers and sold in the U.S. that are about $100/ton below market prices. Domestic producers have to be close to that price level to compete.”
Two unrelated purchasers/end users reported importers were price leaders, reporting:
“Nucor & Gerdau try to lead prices up, Turkish national leads prices down” and
“they consistently and continuously lead prices down.”
Respondents contend that “Nucor and Gerdau are the price leaders and undersold other U.S. producers and each other,”23 emphasizing sales by the two producers to fabricators.24 Petitioner stated that U.S. producers are not price leaders. Nucor reported that it was a price
23 Hearing transcript, p. 166 (Bond). 24 Hearing transcript, p. 225 (Campbell).

V‐9
follower, not a price leader.25 Petitioner argued that the fact that Nucor publishes price lists does not make it a price leader.26
PRICE DATA
The Commission requested U.S. producers and importers to provide quarterly data for the total quantity and f.o.b. value of the following rebar products shipped to unrelated U.S. customers during January 2011 to March 2014.27
Product 1.‐‐ Straight ASTM A615, No. 3, grade 60 rebar Product 2.‐‐ Straight ASTM A615, No. 4, grade 60 rebar Product 3.‐‐ Straight ASTM A615, No. 5, grade 60 rebar Product 4.‐‐ Straight ASTM A615, No. 6, grade 60 rebar Product 5.‐‐ Straight ASTM A615, No. 3, grade 40 rebar Product 6.‐‐ Straight ASTM A615, No. 5, grade 40 rebar Six U.S. producers provided usable price data for U.S.‐produced rebar, 10 importers
provided usable price data for product from Mexico, and 11 importers provided usable price data for rebar from Turkey (other than Habas). Seven importers provided price data for product produced by Habas. Not all producers or importers reported data for all products and all quarters during January 2011 to March 2014. Pricing data reported by these firms accounted for approximately 32.5 percent of U.S. producers’ shipments of product,28 *** percent of U.S. shipments of subject imports from Mexico, and *** percent of U.S. shipments of subject imports from Turkey (other than Habas) during January 2011 to March 2014.29
Price data for products 1‐6 are presented in tables V‐3 to V‐8 and figures V‐3 to V‐8.30 Turkish respondents contend that product 1 is not sold in the same manner by the Turkish exporters as by the U.S. producers. “Turkish exporters normally sell rebar in multiple sizes at a blended price with a limitation on the quantity of …{product 1}…that may be included in any order.” “U.S. producers typically sell this product at a premium in the U.S. market.” “Therefore,
25 Hearing transcript, p. 108 (Darsey). 26 Hearing transcript, p. 109 (Alvarado). 27 Prior investigations and reviews conducted by the Commission, dating back to 1997, have routinely
requested data for ASTM A615 grade 60 rebar in size numbers 3, 4, and 5, and generally for size number 6 as well. Deacero requested the addition of product 5 and product 6, reporting that grade 40 rebar was “an important portion of its exports to the United States.” Deacero’s response to draft questionnaire, May 27, 2014.
28 Price data accounted for approximately *** percent of U.S. producers’ commercial shipments. 29 Turkish price data was requested separately for Habas, Icdas, and all other Turkish producers. 30 No pricing data were collected for rebar from nonsubject countries because imports from
nonsubject countries accounted for less than 5 percent of the U.S. market during January 2011‐March 2014.

V‐10
… {product 1}…will indicate a lower price when in fact it is part of a blended average price per order.”31
Table V-3 Rebar: Weighted-average f.o.b. prices and quantities of domestic and imported product 11 and margins of underselling/(overselling), by quarters, January 2011 - March 2014
Period
United States Mexico Turkey
(other than Habas) Turkey (Habas)
Price (dollars
per short ton)
Quantity (short tons)
Price (dollars
per short ton)
Quantity(short tons)
Margin (percent)
Price (dollars
per short ton)
Quantity(short tons)
Margin (percent)
Price (dollars
per short ton)
Quantity(short tons)
2011: Jan.-Mar. 672 37,139 *** *** *** *** *** *** *** ***Apr.-June 700 36,917 *** *** *** *** *** *** *** ***July-Sept. 703 43,161 *** *** *** *** *** *** *** ***Oct.-Dec. 701 39,963 *** *** *** *** *** *** *** ***2012: Jan.-Mar. 679 36,061 *** *** *** *** *** *** *** ***Apr.-June 697 35,983 *** *** *** *** *** *** *** ***July-Sept. 669 43,947 *** *** *** *** *** *** *** ***Oct.-Dec. 649 35,348 *** *** *** *** *** *** *** ***2013: Jan.-Mar. 661 31,434 *** *** *** *** *** *** *** ***Apr.-June 647 35,627 *** *** *** *** *** *** *** ***July-Sept. 633 35,716 *** *** *** *** *** *** *** ***Oct.-Dec. 632 35,852 *** *** *** *** *** *** *** ***2014: Jan.-Mar. 649 35,966 *** *** *** *** *** *** *** ***1 Product 1: Straight ASTM A615, No. 3, grade 60 rebar. Source: Compiled from data submitted in response to Commission questionnaires.
31 Turkish respondents’ comments on draft questionnaires, p. 2.

V‐11
Table V-4 Rebar: Weighted-average f.o.b. prices and quantities of domestic and imported product 21 and margins of underselling/(overselling), by quarters, January 2011 - March 2014
Period
United States Mexico Turkey
(other than Habas) Turkey (Habas)
Price (dollars
per short ton)
Quantity (short tons)
Price (dollars
per short ton)
Quantity(short tons)
Margin (percent)
Price (dollars
per short ton)
Quantity(short tons)
Margin (percent)
Price (dollars
per short ton)
Quantity(short tons)
2011: Jan.-Mar. 670 115,696 *** *** *** *** *** *** *** ***Apr.-June 684 144,559 *** *** *** *** *** *** *** ***July-Sept. 688 171,865 *** *** *** *** *** *** *** ***Oct.-Dec. 691 174,374 *** *** *** *** *** *** *** ***2012: Jan.-Mar. 695 142,479 *** *** *** *** *** *** *** ***Apr.-June 683 156,745 *** *** *** *** *** *** *** ***July-Sept. 653 192,295 *** *** *** *** *** *** *** ***Oct.-Dec. 639 178,413 *** *** *** *** *** *** *** ***2013: Jan.-Mar. 655 119,992 *** *** *** *** *** *** *** ***Apr.-June 638 138,620 *** *** *** *** *** *** *** ***July-Sept. 625 134,714 *** *** *** *** *** *** *** ***Oct.-Dec. 625 152,404 *** *** *** *** *** *** *** ***2014: Jan.-Mar. 648 119,374 *** *** *** *** *** *** *** ***1 Product 2: Straight ASTM A615, No. 4, grade 60 rebar. Source: Compiled from data submitted in response to Commission questionnaires.

V‐12
Table V-5 Rebar: Weighted-average f.o.b. prices and quantities of domestic and imported product 31 and margins of underselling/(overselling), by quarters, January 2011 - March 2014
Period
United States Mexico Turkey
(other than Habas) Turkey (Habas)
Price (dollars
per short ton)
Quantity (short tons)
Price (dollars
per short ton)
Quantity(short tons)
Margin (percent)
Price (dollars
per short ton)
Quantity(short tons)
Margin (percent)
Price (dollars
per short ton)
Quantity(short tons)
2011: Jan.-Mar. 667 168,052 *** *** *** *** *** *** *** ***Apr.-June 685 170,145 *** *** *** *** *** *** *** ***July-Sept. 687 197,808 *** *** *** *** *** *** *** ***Oct.-Dec. 689 189,079 *** *** *** *** *** *** *** ***2012: Jan.-Mar. 695 159,000 *** *** *** *** *** *** *** ***Apr.-June 679 176,612 *** *** *** *** *** *** *** ***July-Sept. 649 213,958 *** *** *** *** *** *** *** ***Oct.-Dec. 640 195,499 *** *** *** *** *** *** *** ***2013: Jan.-Mar. 650 162,194 *** *** *** *** *** *** *** ***Apr.-June 634 165,042 *** *** *** *** *** *** *** ***July-Sept. 614 169,064 *** *** *** *** *** *** *** ***Oct.-Dec. 612 179,199 *** *** *** *** *** *** *** ***2014: Jan.-Mar. 640 153,845 *** *** *** *** *** *** *** ***1 Product 3: Straight ASTM A615, No. 5, grade 60 rebar. Source: Compiled from data submitted in response to Commission questionnaires.

V‐13
Table V-6 Rebar: Weighted-average f.o.b. prices and quantities of domestic and imported product 41 and margins of underselling/(overselling), by quarters, January 2011 - March 2014
Period
United States Mexico Turkey
(other than Habas) Turkey (Habas)
Price (dollars
per short ton)
Quantity (short tons)
Price (dollars
per short ton)
Quantity(short tons)
Margin (percent)
Price (dollars
per short ton)
Quantity(short tons)
Margin (percent)
Price (dollars
per short ton)
Quantity(short tons)
2011: Jan.-Mar. 671 124,316 *** *** *** *** *** *** *** ***Apr.-June 672 122,401 *** *** *** *** *** *** *** ***July-Sept. 676 149,358 *** *** *** *** *** *** *** ***Oct.-Dec. 682 128,680 *** *** *** *** *** *** *** ***2012: Jan.-Mar. 686 119,628 *** *** *** *** *** *** *** ***Apr.-June 671 131,182 *** *** *** *** *** *** *** ***July-Sept. 644 147,003 *** *** *** *** *** *** *** ***Oct.-Dec. 640 125,179 *** *** *** *** *** *** *** ***2013: Jan.-Mar. 652 108,371 *** *** *** *** *** *** *** ***Apr.-June 642 123,614 *** *** *** *** *** *** *** ***July-Sept. 624 116,652 *** *** *** *** *** *** *** ***Oct.-Dec. 634 131,027 *** *** *** *** *** *** *** ***2014: Jan.-Mar. 657 110,400 *** *** *** *** *** *** *** ***1 Product 4: Straight ASTM A615, No. 6, grade 60 rebar. Source: Compiled from data submitted in response to Commission questionnaires.

V‐14
Table V-7 Rebar: Weighted-average f.o.b. prices and quantities of domestic and imported product 51 and margins of underselling/(overselling), by quarters, January 2011 - March 2014
Period
United States Mexico Turkey
(other than Habas) Turkey (Habas)
Price (dollars
per short ton)
Quantity (short tons)
Price (dollars
per short ton)
Quantity(short tons)
Margin (percent)
Price (dollars
per short ton)
Quantity(short tons)
Margin (percent)
Price (dollars
per short ton)
Quantity(short tons)
2011: Jan.-Mar. 672 7,878 *** *** *** *** *** *** *** ***Apr.-June 681 12,076 *** *** *** *** *** *** *** ***July-Sept. 686 11,900 *** *** *** *** *** *** *** ***Oct.-Dec. 689 14,331 *** *** *** *** *** *** *** ***2012: Jan.-Mar. 690 9,573 *** *** *** *** *** *** *** ***Apr.-June 675 9,431 *** *** *** *** *** *** *** ***July-Sept. 640 12,256 *** *** *** *** *** *** *** ***Oct.-Dec. 636 10,787 *** *** *** *** *** *** -- 0 2013: Jan.-Mar. 628 9,443 *** *** *** *** *** *** *** ***Apr.-June 615 9,710 *** *** *** *** *** *** *** ***July-Sept. 605 9,125 *** *** *** *** *** *** *** ***Oct.-Dec. 605 9,038 *** *** *** *** *** *** *** ***2014: Jan.-Mar. 634 7,157 *** *** *** *** *** *** *** ***1 Product 5: Straight ASTM A615, No. 3, grade 40 rebar. Source: Compiled from data submitted in response to Commission questionnaires.

V‐15
Table V-8 Rebar: Weighted-average f.o.b. prices and quantities of domestic and imported product 61 and margins of underselling/(overselling), by quarters, January 2011 - March 2014
Period
United States Mexico Turkey
(other than Habas) Turkey (Habas)
Price (dollars
per short ton)
Quantity (short tons)
Price (dollars
per short ton)
Quantity(short tons)
Margin (percent)
Price (dollars
per short ton)
Quantity(short tons)
Margin (percent)
Price (dollars
per short ton)
Quantity(short tons)
2011: Jan.-Mar. 642 7,214 *** *** *** *** *** *** *** ***Apr.-June 670 8,911 *** *** *** *** *** *** *** ***July-Sept. 674 10,397 *** *** *** *** *** *** *** ***Oct.-Dec. 677 8,332 *** *** *** *** *** *** *** ***2012: Jan.-Mar. 681 8,927 *** *** *** *** *** *** *** ***Apr.-June 667 8,182 *** *** *** *** *** *** *** ***July-Sept. 630 10,083 *** *** *** *** *** *** -- 0 Oct.-Dec. *** *** *** *** *** *** *** *** -- 0 2013: Jan.-Mar. 629 9,270 *** *** *** *** *** *** *** ***Apr.-June 617 7,676 *** *** *** *** *** *** *** ***July-Sept. *** *** *** *** *** *** *** *** *** ***Oct.-Dec. 611 8,644 *** *** *** *** *** *** *** ***2014: Jan.-Mar. 597 6,646 *** *** *** *** *** *** *** ***1 Product 6: Straight ASTM A615, No. 4, grade 40 rebar. Source: Compiled from data submitted in response to Commission questionnaires.

V‐16
Figure V-3 Rebar: Weighted-average prices and quantities of domestic and imported product 1, by quarters, January 2011 - March 2014
* * * * * * *
Figure V-4 Rebar: Weighted-average prices and quantities of domestic and imported product 2, by quarters, January 2011 - March 2014
* * * * * * *
Figure V-5 Rebar: Weighted-average prices and quantities of domestic and imported product 3, by quarters, January 2011 - March 2014
* * * * * * *
Figure V-6 Rebar: Weighted-average prices and quantities of domestic and imported product 4, by quarters, January 2011 - March 2014
* * * * * * *
Figure V-7 Rebar: Weighted-average prices and quantities of domestic and imported product 5, by quarters, January 2011 - March 2014
* * * * * * *
Figure V-8 Rebar: Weighted-average prices and quantities of domestic and imported product 6, by quarters, January 2011 - March 2014
* * * * * * *

V‐17
Respondents stated that the AUVs for U.S. producers’ sales to their related end users/distributors tend to be lower than the AUVs of commercial shipments and thus the exclusive focus on U.S. commercial sales inflates the margins of underselling in the pricing data in section V.32
Petitioner reported that the price they charge to their related end users/distributors is the same as the price they charge independent purchasers for similarly sized orders. Firms that make large purchases get volume discounts.33
Price trends
Prices decreased between January 2011 and March 2014 for product from the United States, Mexico, and Turkey (other than Habas) for all but one country‐product combination.34 Table V‐9 summarizes the price trends, by country and by product. As shown in the table, domestic price decreases ranged from 2.0 to 7.0 percent from January 2011 to March 2014. Price decreases for rebar from Mexico for products *** ranged from *** to *** percent, while the price of Mexican product *** increased by *** percent. Import price decreases for rebar imported from Turkey (other than Habas) ranged from *** to *** percent.
32 Hearing transcript, p. 255 (Campbell). 33 Hearing transcript, pp. 82‐83 (Kaplan). 34 Mexican product *** prices increased over the period.

V‐18
Table V-9 Rebar: Summary of weighted-average f.o.b. prices for products 1-6 from the United States, Mexico, and Turkey (other than Habas)
Item Number of quarters
Low price (dollars per short ton)
High price (dollars per short ton)
Change in price1 (percent)
Product 1 United States 13 632 703 (3.4)Mexico 13 *** *** ***Turkey (other than Habas) 13 *** *** ***Product 2 United States 13 625 695 (3.2)Mexico 13 *** *** ***Turkey (other than Habas) 13 *** *** ***Product 3 United States 13 612 695 (4.0)Mexico 13 *** *** ***Turkey (other than Habas) 13 *** *** ***Product 4 United States 13 624 686 (2.0)Mexico 13 *** *** ***Turkey (other than Habas) 13 *** *** ***Product 5 United States 13 605 690 (5.7)Mexico 13 *** *** ***Turkey (other than Habas) 13 *** *** ***Product 6 United States 13 *** 681 (7.0)Mexico 13 *** *** *** Turkey (other than Habas) 13 *** *** ***
1 Percentage change from the first quarter of 2011 to the first quarter of 2014 for all countries and products. Source: Compiled from data submitted in response to Commission questionnaires.

V‐19
Price comparisons
As shown in table V‐10, prices for rebar imported from Mexico were below those for U.S.‐produced rebar in all of 78 comparisons; margins of underselling ranged from 0.7 to 15.3 percent. Prices of rebar imported from Turkey (other than Habas) were below those for U.S.‐produced rebar in 77 of 78 comparisons; margins of underselling ranged from 0.6 to 17.5 percent. In the remaining comparison, the margin of overselling for rebar from Turkey (other than Habas) was *** percent higher. 35
Table V-10 Rebar: Instances of underselling/overselling and the range and average of margins, by country, January 2011 - March 2014
Source
Underselling Overselling Number
of instances
Range (percent)
Average margin
(percent)
Number of
instances Range
(percent)
Average margin
(percent)Mexico 78 0.7 to 15.3 8.6 0 NA NA Turkey (other than Habas) 77 0.6 to 17.5 10.9 1 *** *** Total (Mexico and Turkey other than Habas) 155 0.6 to 17.5 9.7 1 *** ***
Source: Compiled from data submitted in response to Commission questionnaires.
LOST SALES AND LOST REVENUE
The Commission requested U.S. producers of rebar to report any instances of lost sales or revenue they experienced due to competition from imports of rebar from Mexico and Turkey since January 2010. Seven U.S. producers (all responding producers except ***) alleged that they had to reduce prices and two reported they had to roll back price increases (***). All eight responding U.S. producers alleged that they had lost sales to imported product from the subject countries. The *** lost sales allegations36 totaled $*** and involved more than *** short tons of rebar, and the *** lost revenue allegations totaled $*** and involved *** short tons of
35 In 78 possible product / quarter combinations, product from Turkey (other than Habas) was priced lower than product from Mexico in 61 instances and higher in 17 instances. In 75 possible product / quarter combinations, product from Turkey (other than Habas) was priced lower than product from Turkey (Habas only) in 71 instances and higher in 4 instances. In 75 possible product / quarter combinations, product from Mexico was priced lower than product from Turkey (Habas only) in 67 instances and higher in 8 instances. In 75 possible product / quarter combinations, product from Turkey (Habas only) was priced lower than U.S.‐produced product in 63 instances and higher in 12 instances.
36 Petitioner also reported two lost sales allegations regarding a firm that petitioner reports is no longer in business. These allegations are not included in the tables or the totals.

V‐20
rebar. The following summarizes allegations and confirmations by source. However, as discussed below, not all purchasers provided a response to the allegations.
*** of the lost sales allegations concerned rebar from Turkey alone; these allegations concerned *** short tons of rebar with a value of $***. Purchasers confirmed *** of these instances of lost sales consisting of *** short tons of rebar with a value of $***. *** of the lost revenue allegations concerned rebar from Turkey alone; these allegations concerned *** short tons of rebar with a revenue loss of $***. Purchasers confirmed *** of these instances of lost revenue consisting of *** short tons of rebar with a revenue loss of $***.
*** of the lost sales allegations concerned rebar from Turkey and Mexico, and concerned *** short tons of rebar with a value of $***. Purchasers ***. *** of the lost revenue allegations concerned rebar from Turkey and Mexico; these allegations concerned *** short tons of rebar with a revenue loss of $***. Purchasers confirmed *** of these instances of lost revenue consisting of *** short tons of rebar with a revenue loss of $***.
*** of the lost sales allegations concerned rebar from Mexico alone; these allegations concerned *** short tons of rebar with a value of $***. Purchasers confirmed *** of these instances of lost sales. There were no of the lost revenue allegations concerned rebar from Mexico alone.
Staff contacted 14 purchasers;37 a summary of the information obtained is presented in tables V‐11 and V‐12 and in the text that follows.
Purchasers were asked to provide details regarding the lost sales and/or lost revenue allegations.
***.
Table V-11 Rebar: U.S. producers’ lost sales allegations
* * * * * * * Table V-12 Rebar: U.S. producers’ lost revenue allegations
* * * * * * *
***. ***. ***. ***. ***.
37 This includes *** purchasers for which *** lost sales were reported and *** purchasers for which *** lost revenues were reported.

VI‐1
PART VI: FINANCIAL EXPERIENCE OF U.S. PRODUCERS
BACKGROUND
Part VI presents the rebar financial results of nine U.S. producers. The majority of U.S. producers reported their financial results for calendar‐year periods and on the basis of generally accepted accounting principles (GAAP).1 Staff conducted off‐site verifications of the U.S. producers’ questionnaires of Gerdau and Nucor and incorporated changes pursuant to those verifications into this report.
As discussed in Part III, the operations of the U.S. industry are relatively concentrated, with the three largest volume producers (CMC, Gerdau, and Nucor) accounting for *** percent of the reported quantity of net sales in 2013. Transfers account for a relatively large share of total sales volume, ranging from a low of *** percent of total sales volume to a high of *** percent. CMC, Gerdau, and Nucor, accounting for *** reported transfers, confirmed that transfers represent rebar sales to related distributor/fabricator operations.2 3
Through related suppliers, the operations of a number of rebar producers are integrated with respect to ferrous scrap, the primary raw material input: Cascade purchases scrap from a related company (Schnitzer Steel’s Metal Recycling Business);4 CMC operates nine scrap metal recycling plants which directly support the company’s overall mill operations;5 Gerdau’s parent company operated 23 scrap recycling centers in North America in 2013;6 Nucor’s David J. Joseph (DJJ) company operated 70 scrap recycling facilities in 2013; 7 and SDI’s metal recycling
1 Cascade and CMC reported their annual financial results on the basis of fiscal years ending August 31. Gerdau, a subsidiary of the Brazilian firm Gerdau S.A., reported its financial results on the basis of International Financial Reporting Standards (IFRS).
2 RTAC’s postconference brief, Exhibit 1 (Attachment A). ***. Staff verification report, Nucor, p. 3. ***.
3 As characterized by an industry witness, related fabrication is essentially an additional route to the end market. Conference transcript, p. 150 (Porter). With regard to the benefit of having downstream fabricating operations, an industry witness at the staff conference noted that that U.S. producers with rebar production and downstream fabricating operations are in a position to extract profit from both levels of rebar activity. Conference transcript, p. 151 (Porter). Another industry witness stated that the presence of related fabricating operations does not insulate the rebar manufacturing operations from demand volatility, but indicated there would be a financial benefit to rebar manufacturing operations, at least to some extent, due to marginally lower selling, general and administration (SG&A) expenses associated with sales to a related company; e.g., the absence of bad debt allowance for transfers and lower sales and marketing resources expended as compared to commercial sales. Conference transcript, p. 152 (Kerkvliet). RTAC’s postconference brief also reiterated that related fabricators are operated as separate business units which purchase rebar from both related and unrelated sources. RTAC’s postconference brief, p. 35.
4 http://www.cascadesteel.com/company_profile.aspx, retrieved October 28, 2013. ***. July 24, 2014 submission by Wiley Rein on behalf of ***.
5 CMC 2013 10‐K, p. 4. ***. RTAC’s postconference brief, p. 35. 6 Gerdau SA (2013 20‐F), p 26. ***. *** U.S. producer questionnaire response, III‐7. 7 Nucor 2013 10‐K, p. 4. ***. RTAC’s postconference brief, Exhibit 1 (Attachment A). ***. July 24,
2014 submission by Wiley Rein on behalf of ***.

VI‐2
operations supplied around half of the company’s overall ferrous scrap requirements in 2012 and 2013.8 9 U.S. producers with related scrap supply varied in terms of whether ferrous scrap was purchased at cost (***) or at a transfer price reflecting fair market value (***). 10 11
With respect to rebar manufacturing facilities, all U.S. producers other than Byer Steel reported the production and sale of other products in addition to rebar. While CMC, Gerdau, and Nucor differed to some extent in terms of the relative importance of rebar and other products,12 smaller‐volume producers, with some exceptions, generally reported that rebar was a minor product with respect to their overall operations.
OPERATIONS ON REBAR
Income‐and‐loss data for the U.S. industry’s rebar operations are presented in table VI‐1. Selected company‐specific financial information is presented in table VI‐2. A variance analysis of these financial results is presented in table VI‐3.13
8 SDI 2013 10‐K, p. 5. 9 RTAC’s postconference brief stated that underlying scrap prices are determined by global supply
and demand and that related scrap suppliers are operated as separate business units, which in turn suggests that scrap purchases from related suppliers cannot insulate related producers from price volatility. As described by RTAC, a benefit of integration with respect to ferrous scrap would instead be that, at least to some extent, it enhances security of supply. RTAC’s postconference brief, pp. 15‐16. RTAC’s postconference brief, Exhibit 1, (Attachment A). ***. September 30, 2013 e‐mail with attachment from *** to USITC auditor.
10 July 24, 2014 submission by Wiley Rein on behalf of ***. July 24, 2014 submission by Wiley Rein on behalf of ***. July 24, 2014 submission by Wiley Rein on behalf of ***.
11 With regard to input purchases from related companies, the Commission’s standard practice requires the elimination of the related company’s profit or loss from the relevant COGS reported in the financial section of the U.S. producer questionnaire. The intent of this adjustment is for the related company’s actual cost to be recognized in determining the financial results reported to the Commission. The U.S. producers referenced above indicated that they complied with the Commission’s requested input valuation.
12 ***. *** U.S. producer questionnaire, response to question III‐5. *** U.S. producer questionnaire, response to question III‐5. *** U.S. producer questionnaire, response to question III‐5. It should be noted that these percentages reflect an aggregation of overall mill operations. Individual mills do not necessarily reflect these shares and can vary substantially with regard to the relative importance of rebar. ***. Staff verification report, Gerdau, pp. 3‐4. Staff verification report, Nucor, p. 3.
13 The Commission’s variance analysis is calculated in three parts: sales variance, cost of goods sold (COGS) variance, and SG&A expenses variance. Each part consists of a price variance (in the case of the sales variance) or a cost variance (in the case of the COGS and SG&A expenses variances) and a volume (quantity) variance. The sales or cost variance is calculated as the change in unit price/cost times the new volume, while the volume variance is calculated as the change in volume times the old unit price/cost. Summarized at the bottom of table VI‐3, the price variance is from sales, the cost/expense variance is the sum of those items from COGS and SG&A, respectively, and the net volume variance is the sum of the price, COGS, and SG&A volume variances. All things being equal, a stable overall product mix, which U.S. producers generally indicated was the case, enhances the utility of the Commission’s variance analysis.

VI‐3
Table VI-1 Rebar: Results of operations of U.S. firms, 2011-13, January-March 2013, and January-March 2014
Item Calendar year January-March
2011 2012 2013 2013 2014 Quantity (short tons)
Commercial sales *** *** *** *** ***Internal consumption1 *** *** *** *** ***Transfers to related firms *** *** *** *** *** Total net sales quantity 6,252,358 6,763,455 6,762,561 1,542,114 1,610,824 Value ($1,000) Commercial sales *** *** *** *** ***Internal consumption1 *** *** *** *** ***Transfers to related firms *** *** *** *** *** Total net sales value 4,096,256 4,401,929 4,266,236 994,583 1,021,690 Cost of goods sold: Raw materials 2,644,948 2,772,837 2,569,730 611,699 654,218 Direct labor 266,344 292,249 304,281 73,455 78,490 Other factory costs 829,884 919,701 1,056,123 232,804 244,123 Total cost of goods sold 3,741,176 3,984,787 3,930,134 917,958 976,831 Gross profit 355,080 417,142 336,102 76,625 44,859 SG&A expenses 177,046 176,581 177,621 43,396 43,175 Operating income 178,034 240,561 158,481 33,229 1,684 Interest expense 43,501 27,366 34,180 8,158 8,408 Other expenses 7,325 2,883 3,829 816 986 Other income items2 (1,667) (2,891) 23,260 (551) (472) Net income or (loss) 125,541 207,421 143,732 23,704 (8,182) Depreciation/amortization 132,211 128,941 136,982 33,973 34,534 Estimated cash flow from operations 257,752 336,362 280,714 57,677 26,352 Ratio to net sales (percent) Raw materials 64.6 63.0 60.2 61.5 64.0 Direct labor 6.5 6.6 7.1 7.4 7.7 Other factory costs 20.3 20.9 24.8 23.4 23.9 Cost of goods sold 91.3 90.5 92.1 92.3 95.6 Gross profit 8.7 9.5 7.9 7.7 4.4 SG&A expenses 4.3 4.0 4.2 4.4 4.2 Operating income 4.3 5.5 3.7 3.3 0.2 Net income or (loss) 3.1 4.7 3.4 2.4 (0.8) Table continued on next page.
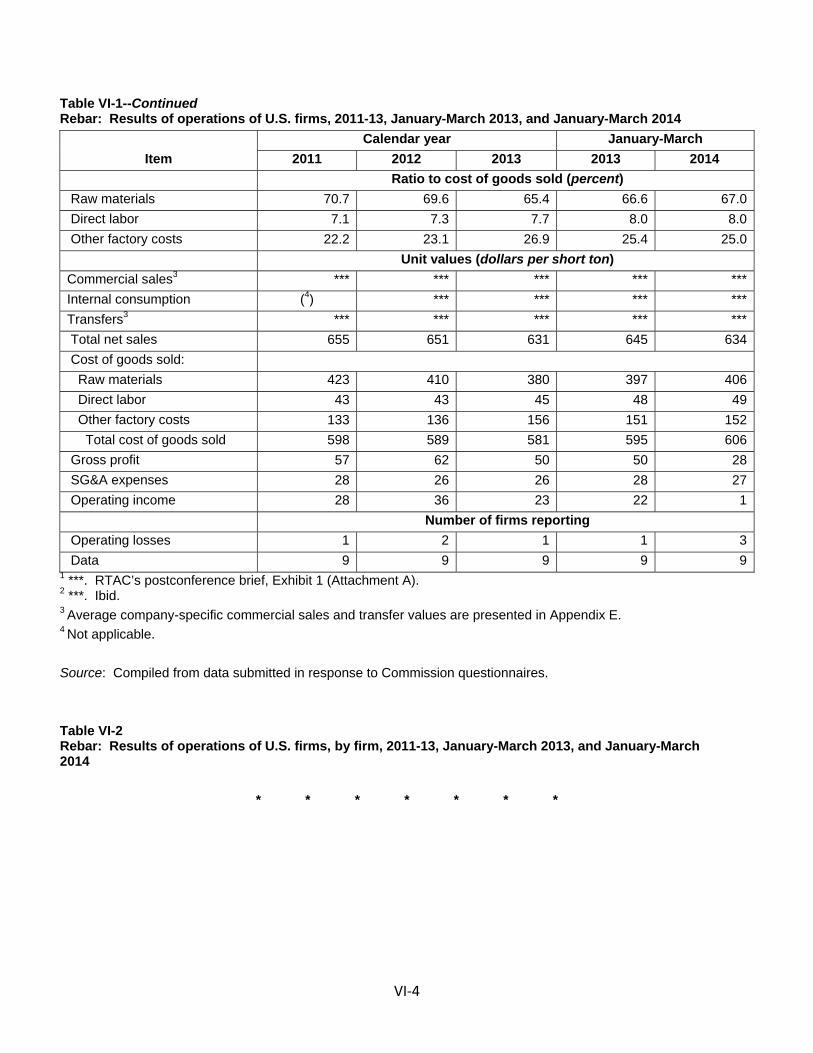
VI‐4
Table VI-1--Continued Rebar: Results of operations of U.S. firms, 2011-13, January-March 2013, and January-March 2014
Item Calendar year January-March
2011 2012 2013 2013 2014 Ratio to cost of goods sold (percent) Raw materials 70.7 69.6 65.4 66.6 67.0 Direct labor 7.1 7.3 7.7 8.0 8.0 Other factory costs 22.2 23.1 26.9 25.4 25.0 Unit values (dollars per short ton) Commercial sales3 *** *** *** *** ***Internal consumption (4) *** *** *** ***Transfers3 *** *** *** *** *** Total net sales 655 651 631 645 634 Cost of goods sold: Raw materials 423 410 380 397 406 Direct labor 43 43 45 48 49 Other factory costs 133 136 156 151 152 Total cost of goods sold 598 589 581 595 606 Gross profit 57 62 50 50 28 SG&A expenses 28 26 26 28 27 Operating income 28 36 23 22 1 Number of firms reporting Operating losses 1 2 1 1 3 Data 9 9 9 9 9
1 ***. RTAC’s postconference brief, Exhibit 1 (Attachment A). 2 ***. Ibid. 3 Average company-specific commercial sales and transfer values are presented in Appendix E. 4 Not applicable.
Source: Compiled from data submitted in response to Commission questionnaires.
Table VI-2 Rebar: Results of operations of U.S. firms, by firm, 2011-13, January-March 2013, and January-March 2014
* * * * * * *

VI‐5
Table VI-3 Rebar: Variance analysis of U.S. firms’ operations, 2011-13, January-March 2013, and January-March 2014
Item Calendar year January-March
2011-12 2012-13 2013-14 Total net sales: Value ($1,000) Price variance (29,174) (135,111) (17,207) Volume variance 334,847 (582) 44,314 Total net sales variance 305,673 (135,693) 27,107 Cost of sales: Raw materials: Cost variance 88,321 202,740 (15,264) Volume variance (216,210) 367 (27,255) Net raw material variance (127,889) 203,107 (42,519) Direct labor: Cost variance (4,133) (12,071) (1,762) Volume variance (21,772) 39 (3,273) Net direct labor variance (25,905) (12,032) (5,035) Other factory costs: Cost variance (21,978) (136,544) (946) Volume variance (67,839) 122 (10,373) Net other factory cost variance (89,817) (136,422) (11,319) Net cost of sales: Cost variance 62,210 54,126 (17,973) Volume variance (305,821) 527 (40,900) Total net cost of sales variance (243,611) 54,653 (58,873) Gross profit variance 62,062 (81,040) (31,766) SG&A expenses: Expense variance 14,938 (1,063) 2,155 Volume variance (14,473) 23 (1,934) Total SG&A variance 465 (1,040) 221 Operating income variance 62,527 (82,080) (31,545) Summarized as: Price variance (29,174) (135,111) (17,207) Net cost/expense variance 77,148 53,063 (15,818) Net volume variance 14,553 (32) 1,481 Source: Compiled from data submitted in response to Commission questionnaires.
VI‐6
Revenue
As indicated previously, the shares of the primary rebar sales categories (commercial sales and transfers) remained relatively stable throughout the period.14 As shown in the revenue section of the table VI‐3 variance analysis, the industry’s total revenue increased between 2011‐12 due to a positive volume variance which more than offset a smaller corresponding negative price variance. In contrast, total revenue declined between 2012‐13 due to a large negative price variance and a smaller negative volume variance.
Table VI‐2 shows that during the full‐year period, as well as in interim 2014 compared to interim 2013, directional trends in company‐specific rebar sales volume were generally the same.15 However, there were exceptions; e.g., *** that reported higher sales volume in 2013, while *** reporting lower sales volume in interim 2014 compared to interim 2013.16 17
Gerdau’s *** may to some extent reflect shipping delays in the first quarter 2013 during implementation of a new ERP system at a number of mills.18 ***.19
While in most cases reporting similar directional trends in sales volume, smaller‐volume producers also tended to report larger percentage swings/changes in sales volume as compared to the larger‐volume producers.20 With regard to average sales value, U.S. producers shared the same directional trend for much of the period. In most instances, the directional trend of average sales and average raw material were also the same.21
Cost of goods sold and gross profit
As shown in table VI‐1, total raw material costs, a large share of which represents ferrous scrap, ranged from a low of 65.4 percent of COGS in 2013 to a high of 70.7 percent of
14 ***. September 30, 2013 e‐mail with attachment from *** to USITC auditor. 15 ***. September 30, 2013 e‐mail with attachment (revised table II‐7a) from *** to USITC auditor. 16 ***. Staff verification report, Nucor, p. 4. 17 ***. July 24, 2014 submission by Wiley Rein on behalf of ***. 18 The following Gerdau rebar mills transitioned to SAP in February 2013 which resulted in a planned
halt in shipping during part of that month: Gerdau Beaumont, Gerdau Charlotte, Gerdau Jackson, Gerdau Jacksonville, Gerdau Knoxville, Gerdau St. Paul, and Gerdau Wilton. Gerdau Long Steel North America plans brief shipment halt to install new software, Metal Bulletin Daily, January 18, 2013, Issue 348, p. 43. ***. Staff verification report, Gerdau, p. 3. While Gerdau’s shipping (at the above‐referenced mills) was to be suspended intentionally for four days in February 2013, delays reportedly persisted at least into March 2013. Gerdau Long Steel North America new software causing delays, buyers say, Metal Bulletin. March 8, 2013, Issue 9293, p. 159.
19 July 24, 2014 submission by Wiley Rein on behalf of ***. 20 ***. July 23, 2014 e‐mail with attachments (including revised table II‐7a and III‐10) from *** to
USITC auditor. ***. July 24, 2014 submission by Wiley Rein on behalf of ***. ***. July 24, 2014 e‐mail with attachment from *** to USITC auditor.
***. July 24, 2014 submission by Wiley Rein on behalf of ***. ***. July 18, 2014 e‐mail with attachment from *** to USITC auditor.
21 Most U.S. producers indicated that surcharges were not a component of reported rebar sales. While ***. RTAC’s postconference brief, Exhibit 1 (Attachment A). ***. September 30, 2013 e‐mail with attachment from *** to USITC auditor.

VI‐7
COGS in 2011.22 A number of U.S. producers, as noted previously, source ferrous scrap from related suppliers.23
Other factory costs, the second largest component of total rebar COGS, were at their highest level as a share of total COGS in 2013, at 26.9 percent, and at their lowest level in 2011, 22.2 percent. “Other factory costs” represent a combination of fixed, variable, and mixed (semi‐fixed/semi‐variable) costs which differ by company based on factors such as manufacturing operations, product mix, and company‐specific accounting choices regarding cost assignment. All things being equal, the directional trend of other factory costs (on an average basis and as a share of total COGS), due to the presence of fixed manufacturing costs, would tend to be the opposite of the directional trend of corresponding sales/production volume.24 25 Among the large‐volume producers, ***.26 ***.27
22 In general, raw material costs can be interpreted as primary raw material, namely ferrous scrap of varying grades, and additional non‐scrap materials (depending on cost classification). The extent to which conversion costs to produce billet are included directly in raw material costs or reported separately as part of other factory costs varies. In some instances, raw material can also reflect billets and/or other raw materials (not requiring a separate melting and casting stage) purchased from outside sources. In addition to differences in mill‐specific yield, which would impact the average raw material costs consumed per ton of finished rebar produced, the above generally indicates that company‐specific average raw material costs should not be assumed to be directly comparable.
23 Byer Steel, a reroller, is unique in terms of its rebar production and raw material input. The company purchases railroad axles, described as a low‐cost scrap item which can be treated like a billet. This reportedly allows the company to bypass the melt stage and instead charge the primary raw material input directly to a gas‐fed reheat furnace. Conference transcript, p. 149 (Byer). Similarly and as described in CMC’s 2013 10‐K, “{o}ur smaller Arkansas minimill does not have a melt shop or continuous casting equipment. The Arkansas minimill manufacturing process begins with a reheating furnace utilizing used rail, primarily salvaged from railroad abandonments, and billets acquired either from our other minimills or from unrelated suppliers as its raw material. The remainder of the manufacturing process utilizes a rolling mill, cooling bed and finishing equipment and support facilities similar to, but on a smaller scale than, those at our other minimills.” CMC 2013 10‐K, p. 5. CMC’s other mills, located in Alabama, Arizona, South Carolina, and Texas, have melt shops. Of these mills, only the Alabama mill reportedly does not produce rebar. Ibid.
24 The directional trend of other factory costs, however, can also be impacted by increases or decreases in variable costs (e.g., electricity and natural gas) that are often classified as part of other factory costs, as well as indirectly by changes in cost classification. With respect to the information reported to the Commission, as noted below, several companies specified higher energy costs as a factor impacting the level of other factory costs. ***.
25 ***. RTAC’s postconference brief, Exhibit 1 (Attachment A). ***. July 24, 2014 submission by Wiley Rein on behalf of ***.
***. September 30, 2013 e‐mail with attachment from *** to USITC auditor. ***. July 24, 2014 submission by Wiley Rein on behalf of ***. ***. July 24, 2014 submission by Wiley Rein on behalf of ***. 26 ***. RTAC’s postconference brief, Exhibit 1 (Attachment A). ***. October 22, 2013 e‐mail from
Wiley Rein on behalf of *** to USITC auditor. ***. July 24, 2014 submission by Wiley Rein on behalf of ***. ***. See also footnote 24.
27 July 24, 2014 submission by Wiley Rein on behalf of ***.

VI‐8
Direct labor, the smallest component of rebar COGS, ranged from a low of 7.1 percent of total COGS to a high of 8.0 percent.
Overall metal margin (the difference between average sales value and average raw material cost) was at its highest level as a ratio of sales in 2013, its lowest level in 2011, and its second lowest level in interim 2014 (see table VI‐2). As such and with some company‐specific exceptions, the directional trend of the industry’s overall gross profit ratio (total gross profit or (loss) divided by total revenue) during the full‐year period appears to be more directly related to positive and negative changes in the level of other factory costs as a share of total COGS. In contrast, lower overall gross profitability in interim 2014 compared to interim 2013 reflects both a reduced metal margin and higher other factory costs as a ratio of sales. ***.28
SG&A expenses and operating income or (loss)
Table VI‐2 shows that, while company‐specific SG&A expense ratios (SG&A expenses divided by total revenue) were not uniform, large‐volume rebar producers reported SG&A expense ratios which were generally in a similar range.29 As noted above, large‐volume producers have similar sales structures in which rebar is sold to independent rebar fabricators and distributors, as well as to related fabricators.
The industry’s overall SG&A expense ratio remained within a relatively narrow range during the full year period and was at its highest in interim 2013.30 31 Overall operating profit reached its highest level on an absolute basis and as a share of sales in 2012 and then declined in 2013 and was essentially just above breakeven in interim 2014. With respect to the large‐volume producers, table VI‐2 shows that ***. While there are likely a number of distinguishing characteristics and factors which help to explain ***, underlying product focus and primary markets may provide at least part of the explanation; e.g., while all have downstream fabrication operations, *** has a somewhat larger share of its rebar sales dedicated to this channel. On an overall basis, *** mills are also somewhat more focused on rebar as compared to *** (see footnote 2 and footnote 12).
28 ***. July 24, 2014 submission by Wiley Rein on behalf of ***. 29 ***. RTAC’s postconference brief, Exhibit 1 (Attachment A). 30 Like “other factory costs,” SG&A expenses reflect a combination of costs that are variable, mixed
(elements of fixed and variable costs), and fixed. 31 ***. Staff verification report, Gerdau, p. 6.

VI‐9
CAPITAL EXPENDITURES AND RESEARCH AND DEVELOPMENT EXPENSES
Table VI‐4 presents company‐specific capital expenditures and research and development (R&D) expenses related to U.S. rebar operations.32 As shown in table VI‐4, the absolute level of company‐specific capital expenditures varied with *** accounting for the *** share of total capital expenditures (*** percent), followed by *** (*** percent) and CMC (*** percent).33 The remaining producers accounted for relatively small company‐specific share ranging from *** percent (***) to *** percent (***).
Table VI-4 Rebar: Capital expenditures and research and development expenses, by firm, 2011-13, January-March 2013, and January-March 2014
* * * * * * *
Table VI‐4 shows that company‐specific R&D expenses were limited and mostly intermittent with ***.34 35
CAPITAL AND INVESTMENT
The Commission requested that U.S. producers describe any actual or potential negative effects of imports of rebar from Mexico and Turkey on their growth, investment, ability to raise capital, development and production efforts, or the scale of capital investments. The responses of U.S. producers are as follow.
Actual negative effects
* * * * * * *
Anticipated negative effects
* * * * * * *
32 As reported by the U.S. industry, total assets were $1.6 billion in 2011, $1.6 billion in 2012, and $1.7 billion in 2013. With respect to a company’s overall operations, staff notes that a total asset value (i.e., the bottom line value on the asset side of a company’s balance sheet) reflects an aggregation of a number assets which, for the most part, are not product specific. Accordingly and with respect to most U.S. rebar producers, it can be reasonably assumed that high‐level allocation factors would be required in order to report a total asset value for rebar operations. ***. Staff verification report, Gerdau, p. 6. Staff verification report, Nucor, p. 7. ***.
33 ***. July 24, 2014 submission by Wiley Rein on behalf of ***. ***. July 24, 2014 submission by Wiley Rein on behalf of ***. ***. July 24, 2014 submission by Wiley Rein on behalf of ***. 34 RTAC’s postconference brief, Exhibit 1 (Attachment A). 35 ***. September 30, 2013 e‐mail with attachment from *** to USITC auditor.


VII‐1
PART VII: THREAT CONSIDERATIONS AND INFORMATION ON NONSUBJECT COUNTRIES
Section 771(7)(F)(i) of the Act (19 U.S.C. § 1677(7)(F)(i)) provides that—
In determining whether an industry in the United States is threatened with material injury by reason of imports (or sales for importation) of the subject merchandise, the Commission shall consider, among other relevant economic factors1‐‐ (I) if a countervailable subsidy is involved, such information as may
be presented to it by the administering authority as to the nature of the subsidy (particularly as to whether the countervailable subsidy is a subsidy described in Article 3 or 6.1 of the Subsidies Agreement), and whether imports of the subject merchandise are likely to increase,
(II) any existing unused production capacity or imminent, substantial increase in production capacity in the exporting country indicating the likelihood of substantially increased imports of the subject merchandise into the United States, taking into account the availability of other export markets to absorb any additional exports,
(III) a significant rate of increase of the volume or market penetration of imports of the subject merchandise indicating the likelihood of substantially increased imports,
(IV) whether imports of the subject merchandise are entering at prices that are likely to have a significant depressing or suppressing effect on domestic prices, and are likely to increase demand for further imports,
(V) inventories of the subject merchandise,
1 Section 771(7)(F)(ii) of the Act (19 U.S.C. § 1677(7)(F)(ii)) provides that “The Commission shall consider {these factors} . . . as a whole in making a determination of whether further dumped or subsidized imports are imminent and whether material injury by reason of imports would occur unless an order is issued or a suspension agreement is accepted under this title. The presence or absence of any factor which the Commission is required to consider . . . shall not necessarily give decisive guidance with respect to the determination. Such a determination may not be made on the basis of mere conjecture or supposition.”

VII‐2
(VI) the potential for product‐shifting if production facilities in the foreign country, which can be used to produce the subject merchandise, are currently being used to produce other products,
(VII) in any investigation under this title which involves imports of both a raw agricultural product (within the meaning of paragraph (4)(E)(iv)) and any product processed from such raw agricultural product, the likelihood that there will be increased imports, by reason of product shifting, if there is an affirmative determination by the Commission under section 705(b)(1) or 735(b)(1) with respect to either the raw agricultural product or the processed agricultural product (but not both),
(VIII) the actual and potential negative effects on the existing development and production efforts of the domestic industry, including efforts to develop a derivative or more advanced version of the domestic like product, and
(IX) any other demonstrable adverse trends that indicate the probability that there is likely to be material injury by reason of imports (or sale for importation) of the subject merchandise (whether or not it is actually being imported at the time).2
Information on the volume and pricing of imports of the subject merchandise is presented in Parts IV and V; and information on the effects of imports of the subject merchandise on U.S. producers’ existing development and production efforts is presented in Part VI. Information on inventories of the subject merchandise; foreign producers’ operations, including the potential for “product‐shifting”; any other threat indicators, if applicable; and any dumping in third‐country markets, follows. Also presented in this section of the report is information obtained for consideration by the Commission on nonsubject countries.
THE INDUSTRY IN MEXICO
The Commission issued foreign producers’ or exporters’ questionnaires to ten firms believed to produce and/or export rebar from Mexico.3 Usable responses to the Commission’s questionnaire were received from seven firms: ArcelorMittal Las Truchas, Deacero, Grupo
2 Section 771(7)(F)(iii) of the Act (19 U.S.C. § 1677(7)(F)(iii)) further provides that, in antidumping investigations, “. . . the Commission shall consider whether dumping in the markets of foreign countries (as evidenced by dumping findings or antidumping remedies in other WTO member markets against the same class or kind of merchandise manufactured or exported by the same party as under investigation) suggests a threat of material injury to the domestic industry.”
3 These firms were identified through a review of information submitted in the petition.

VII‐3
Acerero S.A. de C.V. (“Acerero”), Grupo Simec S.A.B. (“Simec”), Sidertul S.A. de C.V. (“Sidertul”), Talleres y Aceros S.A. de C.V. (“Talleres”), and Ternium Mexico S.A. de C.V. (“Ternium”). These firms’ exports to the United States accounted for virtually all of U.S. imports of rebar from Mexico since 2011.4 According to estimates requested of the responding Mexican producers, the production of rebar in Mexico reported by these seven firms accounts for all rebar production in Mexico in 2013. Sidertul reported that *** percent of its total sales in its most recent fiscal year were sales of rebar. Deacero reported that *** percent of its total sales in its most recent fiscal year were sales of rebar. ArcelorMittal Las Truchas reported that *** percent of its total sales in its most recent fiscal year were sales of rebar. Acerero reported that *** percent of its total sales in its most recent fiscal year were sales of rebar. Ternium reported that *** percent of its total sales in its most recent fiscal year were sales of rebar. Talleres reported that *** percent of its total sales in its most recent fiscal year were sales of rebar. *** reported that *** percent of its total sales in its most recent fiscal year were sales of rebar.
Deacero reported that it began construction of a new plant (Ramos Arizpe Steel Mill (“Ramos mill”)) in September 2010 and began production operations in February 2012.5 According to Deacero, the Ramos mill, which includes a hot‐rolling mill of 400,000 metric ton (441,000 short tons) of installed annual capacity, was constructed primarily to produce structural shapes (i.e., channels, rounds, squares, flat bars, beams, and angles).6 The plant did, however, produce straight rebar on its hot‐rolling mill while it was moving up the learning curve for producing merchant bar.7 Specifically, Deacero reported the following:
In 2012, structural shapes and merchant bars accounted for *** percent (*** short tons) of the mill’s production on its hot‐rolling mill, while rebar accounted for *** percent (*** short tons);
In 2013, structural shapes and merchant bars accounted for *** percent (*** short tons) of the mill’s production on its hot‐rolling mill, while rebar accounted for *** percent (*** short tons);
In January‐March 2014, structural shapes and merchant bars accounted for *** percent (*** short tons) of the mill’s production on its hot‐rolling mill, while rebar accounted for *** percent (*** short tons);
4 Deacero estimated that its rebar exports to the United States accounted for approximately *** percent of all such exports of rebar from Mexico reported in 2013; *** estimated that its exports to the United States accounted for approximately *** percent of all such exports in 2013; *** estimated that its exports to the United States accounted for *** percent of all such exports in 2013. *** reported that it exported *** short tons to the United States in 2011. *** reported that *** to the United States during 2011‐March 2014. *** reported that it exported *** short tons of rebar to the United States in 2011 and *** short tons of rebar to the United States in 2012.
5 Questionnaire response of Deacero, II‐2. 6 Conference transcript, pp. 180‐181 (Noriega); Deacero’s posthearing brief, p. 47 (response to
question 7). 7 Hearing transcript, p. 150 (Gutierrez).

VII‐4
In July‐August 2014, structural shapes and merchant bars accounted for *** percent (*** short tons) of the mill’s production on its hot‐rolling mill.8
According to Deacero, the Ramos facility’s hot‐rolling mill has not produced rebar since
May 2014.9 Deacero also stated that the Ramos plant did not export any rebar to the United States.10 Deacero also reported that in January 2013, it ***. Deacero reported that ***.11
Operations on rebar
Table VII‐1 presents information on the rebar operations of the seven responding producers in Mexico. Reported capacity in Mexico increased by *** percent from 2011 to 2013 and was *** percent higher in January‐March 2014 than in January‐March 2013. Reported capacity is projected to increase by *** percent from 2013 to 2014 and to be *** percent higher in 2015 than in 2013. Reported production in Mexico increased by *** percent from 2011 to 2012, resulting in an overall increase of *** percent from 2011 to 2013. Production was *** percent lower in January‐March 2014 than in January‐March 2013. Production is projected to increase by *** percent in 2014 compared to 2013, with slightly *** projections for 2015 compared with 2014. Capacity utilization mirrored production, increasing from *** percent in 2011 to *** percent in 2012 before falling to *** percent in 2013. Capacity utilization rates were higher in January‐March 2013 than in January‐March 2014, *** percent and *** percent, respectively. Capacity utilization rates are projected to be *** percent in 2014 and *** percent in 2015.12
8 Deacero’s posthearing brief, p. 47 (response to question 7) and exh. 21. 9 Deacero’s posthearing brief, p. 47 (response to question 7) and exh. 21. 10 Conference transcript, p. 270 (Gutierrez). 11 Questionnaire response of Deacero, II‐2. 12 With respect to production constraints, ArcelorMittal Las Truchas reported ***. Deacero reported
***. Sidertul reported ***. Ternium reported ***. Talleres reported ***. Grupo Acerero reported that ***. Simec reported that ***.

VII‐5
Table VII-1 Rebar: Data for producers in Mexico, 2011-13, January-March 2013, January-March 2014, and projected 2014-15
* * * * * * *
Exports of rebar from Mexico to the United States as a share of total Mexican shipments ranged from *** percent to *** percent during 2011‐January‐March 2014.13 Exports of rebar from Mexico to the United States increased by *** percent from 2011 to 2013 and were *** percent higher in January‐March 2014 than in January‐March 2013. Exports to all other markets as a share of total shipments increased from *** percent in 2011 to *** percent in 2013, reflecting the *** percent increase in exports to all other markets during this period. Primary other markets reported by subject producers include Central and South America and the Caribbean.14
Alternative products
Table VII‐2 presents information on the total capacity and production of products made on the same equipment and machinery used to produce rebar of the seven responding producers in Mexico. ***. *** responding firms reported producing deformed steel wire on the same equipment and machinery used to produce rebar. However, *** responding firms (***) did report producing deformed steel wire on other equipment and machinery. Deacero, the only subject producer that reported producing deformed steel wire meeting ASTM A1064/A106M with bar markings or subject to an elongation test, estimates that its U.S. imports of such wire from Mexico were at most *** short tons in 2011, *** short tons in 2012, *** short tons in 2013, and *** short tons during January‐March 2014. For a summary of data on such deformed steel wire, see appendix C.
Table VII-2 Rebar: Mexican producers’ total capacity, production, and capacity utilization, by product, 2011-13, January-March 2013, and January-March 2014
* * * * * * *
Table VII‐3 presents the information provided by Mexican producers regarding their constraints on product shifting.
13 Apart from ***, subject producers generally reported exporting *** of rebar to the United States. ***. ***. ***. ***. ***.
14 ***. ***. ***. ***.

VII‐6
Table VII-3 Rebar: Mexican producers’ constraints on product shifting
* * * * * * *
THE INDUSTRY IN TURKEY
The Commission issued foreign producers’ or exporters’ questionnaires to 41 firms believed to produce and/or export rebar from Turkey.15 Usable responses to the Commission’s questionnaire were received from seven firms: Kaptan Demir Celik Endustrisi ve Ticaret (“Kaptan”), Kroman Celik San A.S. (“Kroman”), Colakoglu, Ekinciler Demir Celik Sanaysi A.S. (“Ekinciler”), Habas, Icdas, and Izmir Demir Celik Sanaysi A.S. (“Izmir”).16 These firms’ exports to the United States (excluding those from nonsubject Habas) accounted for *** percent of U.S. imports of rebar from Turkey in 2013 (*** percent of U.S. imports of rebar from Turkey excluding those from Habas). According to estimates requested of the responding Turkish producers, the production of rebar in Turkey by the responding firms accounts for *** of overall production of rebar in Turkey in 2013.17 Colakoglu reported that *** percent of its total sales in its most recent fiscal year were sales of rebar; Ekinciler reported that *** of its total sales in its most recent fiscal year were sales of rebar; Icdas reported that *** percent of its total sales in its most recent fiscal year were sales of rebar; Izmir reported that *** percent of its total sales in its most recent fiscal year were sales of rebar; *** percent of their total sales in their most recent fiscal year were sales of rebar.
***. ***. ***. In 2014, Turkish billet producer Yolbulan Bastug Metalurji reportedly began trial production runs of rebar at its new rebar mill that has an annual capacity of 1.25 million metric tons (1.4 million short tons).18 In recent years, several Turkish steel manufacturers have entered the U.S. market by forming U.S.‐based subsidiaries. Colakoglu formed a wholly‐owned U.S. subsidiary named Medtrade LLC in Texas in late 2012 to source U.S. scrap to Turkey, and to market and sell finished rebar products to U.S. consumers.19
15 These firms were identified through a review of information submitted in the petition. 16 In its final determination, Commerce calculated a weighted‐average dumping margin of 0.00
percent and a de minimis subsidy rate for Habas. Accordingly, Habas is treated as a nonsubject source, and its operations are excluded from the data in this section of the staff report. Data reported by Habas appear in the section of the report entitled “Information on Nonsubject Sources.”
17 This figure is likely ***. ***. 18 “Turkish merchant billet producer starts rebar mill trials,” Kallanish Commodities, September 16,
2014, found at http://www.kallanish.com/articles/Turkish‐merchant‐billet‐producer‐starts.html, retrieved September 18, 2014.
19 “In depth: Çolakoğlu Metalurji sets up trading company in US,” Steel Orbis, November 26, 2012, found at http://www.steelorbis.com/steel‐news/interviews/in‐depth‐colakoglu‐metalurji‐sets‐up‐trading‐company‐in‐us‐725582.htm, retrieved on October 21, 2013.

VII‐7
Operations on rebar
Table VII‐4 presents information on the rebar operations of the six responding subject producers (i.e., those other than Habas) in Turkey. Reported capacity in Turkey increased by *** percent from 2011 to 2013 and was *** percent higher in January‐March 2014 than in January‐March 2013. Reported capacity is projected to be slightly *** in 2014 compared to 2013, and moderately *** in 2015 than in 2014.20 Reported production in Turkey increased steadily during 2011‐13, showing an overall increase of *** percent. Production was *** percent lower in January‐March 2014 than in January‐March 2013. Reported production is projected to be *** in 2014 compared to 2013, and moderately *** in 2015 than in 2014.21 The capacity utilization rates mirrored the increases in production, increasing from *** percent in 2011 to *** percent in 2013. Capacity utilization was lower in January‐March 2014 (*** percent) compared to January‐March 2013 (*** percent). Capacity utilization rates are projected to be *** percent in 2014 and *** percent in 2015.
Table VII-4 Rebar: Data for subject producers in Turkey (excluding Habas), 2011-13, January-March 2013, January-March 2014, and projected 2014-15
* * * * * * *
Exports of rebar from Turkey to the United States as a share of total Turkish shipments, by subject producers, increased from *** percent in 2011 to *** percent in 2013. Exports of rebar from Turkey to the United States increased by *** percent from 2011 to 2012 and by *** percent from 2012 to 2013, resulting in an overall increase of *** percent from 2011 to 2013. Exports to the United States were *** percent higher in January‐March 2014 than in January‐March 2013, and their share of total shipments, by subject Turkish producers, was *** percent in January‐March 2014 compared to *** percent in January‐March 2013. Exports to all other markets increased by *** percent from 2011 to 2013 and their share of total shipments, by subject Turkish producers, ranged from *** percent to *** percent.
20 Capacity projections for 2014 are higher in the final phase of these investigations than in the preliminary phase of these investigations because *** additional firms (***) submitted responses to the Commission questionnaire and provided projections in the final phase.
21 Production projections for 2014 are higher in the final phase of these investigations than in the preliminary phase of these investigations because *** additional firms (***) submitted responses to the Commission questionnaire and provided projections in the final phase.
VII‐8
Alternative products
Table VII‐5 presents information on the total capacity and production of products made on the same equipment and machinery used to produce rebar of the six responding subject producers in Turkey.22 *** reported producing other products on the same equipment and machinery used to produce rebar.
Table VII-5 Rebar: Subject Turkish producers’ (excluding Habas) total capacity, production, and capacity utilization, by product, 2011-2013, January-March 2013, and January-March 2014
* * * * * * *
Table VII‐6 presents the information provided by Turkish producers regarding their constraints on product shifting.
Table VII-6 Rebar: Turkish producers’ (excluding Habas) constraints on product shifting
* * * * * * *
SUBJECT COUNTRIES COMBINED
Table VII‐7 presents information on rebar operations of the reporting subject producers in the subject countries. Estimates of projected capacity for 2014 and 2015 for subject producers combined are ***.
Table VII-7 Rebar: Data for subject producers combined (excluding Habas), 2011-13, January-March 2013, January-March 2014, and projected 2014-15
* * * * * * *
Table VII‐8 presents information on total capacity and production for reporting subject producers in the subject countries.
22 With respect to production constraints, Colakoglu reported ***, Icdas reported ***, and Izmir Demir reported ***.

VII‐9
Table VII-8 Rebar: Total capacity, production, and capacity utilization for subject producers combined (excluding Habas), 2011-13, January-March 2013, January-March 2014, and projected 2014-15
* * * * * * *
U.S. INVENTORIES OF IMPORTED MERCHANDISE
Table VII‐9 presents data on U.S. importers’ reported inventories of rebar.

VII‐10
Table VII-9 Rebar: U.S. importers’ inventories, 2011-13, January-March 2013, and January-March 2014
Item Calendar year January to March
2011 2012 2013 2013 2014 Imports from Mexico: Inventories (short tons) *** *** *** *** *** Ratio to U.S. imports (percent) *** *** *** *** *** Ratio to U.S. shipments of imports (percent) *** *** *** *** *** Imports from Turkey (other than Habas): Inventories (short tons) *** *** *** *** *** Ratio to U.S. imports (percent) *** *** *** *** *** Ratio to U.S. shipments of imports (percent) *** *** *** *** ***Subtotal (subject): Inventories (short tons) *** *** *** *** *** Ratio to U.S. imports (percent) *** *** *** *** *** Ratio to U.S. shipments of imports (percent) *** *** *** *** *** Imports from Turkey (Habas): Inventories (short tons) *** *** *** *** *** Ratio to U.S. imports (percent) *** *** *** *** *** Ratio to U.S. shipments of imports (percent) *** *** *** *** *** Imports from all other sources: Inventories (short tons) *** *** *** *** *** Ratio to U.S. imports (percent) *** *** *** *** *** Ratio to U.S. shipments of imports (percent) *** *** *** *** *** Subtotal (nonsubject): Inventories (short tons) *** *** *** *** *** Ratio to U.S. imports (percent) *** *** *** *** *** Ratio to U.S. shipments of imports (percent) *** *** *** *** ***Total: Inventories (short tons) 7,257 47,473 93,968 67,055 134,450 Ratio to U.S. imports (percent) 0.9 5.1 8.1 7.7 7.9 Ratio to U.S. shipments of imports (percent) 1.0 5.6 8.8 9.3 8.6 Source: Compiled from data submitted in response to Commission questionnaires.
U.S. IMPORTERS’ OUTSTANDING ORDERS
The Commission requested importers to indicate whether they imported or arranged for the importation of rebar from subject sources and all other sources after March 31, 2014. Table VII‐10 presents U.S. import shipments of rebar arranged for importation after March 31, 2014.

VII‐11
Table VII-10 Rebar: U.S. importers’ arranged imports, April 2014-March 2015
* * * * * * *
TRADE REMEDY MEASURES IN THIRD‐COUNTRY MARKETS
Rebar from subject countries has been subject to several trade remedy investigations. In 2011, the Dominican Republic imposed antidumping duties on imports of rebar from Turkey.23 In November 2012, Egypt imposed provisional safeguard measures for 200 days on imports of all rebar.24 However, Egypt terminated the investigation in November 2013 without imposing a definitive safeguard measure.25 Jordan has imposed a definitive safeguard measure, scheduled to have begun June 16, 2013. 26 Turkey was identified as a leading exporting country affected by the measure, while Mexico was listed as an excluded country due to being a developing country with import share below 3 percent.27 In August 2013, Colombia initiated a safeguard investigation into imports of rebar from WTO member countries, which includes both Mexico and Turkey, and in September 2013 notified that it would be imposing a 200‐day provisional safeguard measure.28 However, in April 2014, Colombia notified the WTO that it had terminated the safeguard investigation without imposing a definitive safeguard measure, effective March 31, 2014.29 In June 2014, Canada initiated investigations into allegedly injurious dumped and subsidized rebar from China, Korea, and Turkey. In August 2014, Canada preliminarily determined that there is a reasonable indication that imports of rebar from these countries have caused injury or are threatening to cause injury to the Canadian industry.30 31 On
23 Dominican Republic, Semi‐Annual Report Under Article 16.4 of the Agreement, WTO, Committee on Anti‐Dumping Practices, October 14, 2013.
24 Egypt, Notification Under Article 12.4 of the Agreement on Safeguards Before Taking a Provisional Safeguard Measure Referred to in Article 6 (No Definitive Safeguard Measure Imposed), WTO, Committee on Safeguards, December 4, 2013.
25 Ibid. 26 Bars and Rods of Iron and Steel, Notification Under Article 12.1(B) of the Agreement on Safeguards
on Finding a Serious Injury or Threat Thereof Caused by Increased Imports, Notification of a Proposal to Impose a Measure, Jordan, WTO, Committee on Safeguards, July 1, 2013.
27 Ibid. 28 Bars and Rods of Iron or Non‐Alloy Steel (Corrugated Bars and Rods) and Bars and Rods, Hot Rolled,
of Iron or Non‐Alloy Steel (Corrugated Bars and Rods, Hot Rolled), Notification Under Article 12.1(a) of the Agreement on Safeguards on Initiation of and Investigation and the Reason for it, Columbia, WTO, Committee on Safeguards, September 4, 2013.
29 Colombia, Notification Under Article 12.4 of the Agreement on Safeguards Before Taking a Provisional Safeguard Measure Referred to in Article 6, WTO, Committee on Safeguards, April 29, 2014.
30 Canadian International Trade Tribunal, Dumping and Subsidizing Determination, Concrete Reinforcing Bar, Preliminary Injury Inquiry No. PI‐2014‐001, August 12, 2014. The product scope included hot‐rolled deformed steel concrete reinforcing bar in straight lengths or coils, in various
(continued...)

VII‐12
September 11, 2014, the Canadian authorities made preliminary determinations of dumping and subsidization with respect to imports of rebar from China, Korea, and Turkey, and imposed provisional duties.32
INFORMATION ON NONSUBJECT SOURCES
Rebar is produced in substantial quantities throughout the world. Global Trade Atlas (GTA) publishes data on the global exports of steel concrete reinforcing bars for HS subheadings 7213.10 and 7214.20, sold in both straight lengths and coils. As shown in Table VII‐11, global exports of rebar increased by 7.9 percent from 2011 to 2013.33 Turkey, Ukraine, Italy, Spain, Germany, and Portugal accounted for nearly two‐thirds of global exports of rebar in 2013 from countries other than China. Intra‐European trade accounts for a substantial portion of exports of rebar from EU countries.
Leading exporters of rebar are discussed following table VII‐11, including nonsubject Turkish producer Habas, Ukraine, Spain, Belarus, Portugal, Latvia, and Korea. The Dominican Republic is also discussed.
(…continued) diameters up to and including 56.4 mm (approximately 2.22 inches), in various finishes, excluding plain round bar and fabricated rebar products.
31 Petitioners in the case include Alta Steel, Edmonton, Alberta; ArcelorMittal Long Carbon North America, Contrecoeur, Quebec; and Gerdau Long Steel North America, Whitby, Ontario. AMM, “Canada rules rebar imports causing injury,” August 12, 2014.
32 Canadian Border Services Agency, Statement of Reasons Concerning the Preliminary Determinations with Respect to the Dumping and Subsidizing of Certain Concrete Reinforcing Bar Originating in or Exported to the People’s Republic of China, the Republic of Korea and the Republic of Turkey, September 26, 2014.
33 This calculation does not include exports from China classified as hot‐rolled alloy bar.

VII‐13
Table VII-11 Rebar: Global reported exports, 2011-13
Country
Calendar year2011 2012 2013
Quantity (short tons)Turkey 7,743,756 9,375,757 9,162,646Ukraine 2,390,088 2,688,068 2,739,646Italy 1,182,895 1,771,018 2,092,024Spain 1,528,684 1,749,047 1,990,336Germany 1,233,102 1,245,407 1,305,621Portugal 981,684 1,134,403 1,178,038Mexico 495,345 656,753 986,024Poland 929,509 1,191,896 982,009Belarus 848,368 921,000 861,147France 694,413 692,670 636,299United States 578,224 666,794 546,247Greece 895,978 590,182 427,318Czech Republic 389,295 587,614 410,588Brazil 472,657 304,248 386,923South Korea 738,402 370,071 382,515Russia 281,876 372,282 354,042Norway 280,048 309,860 308,924China 246,858 289,171 299,423Latvia 626,566 879,189 293,151Slovakia 62,106 290,962 287,399All others 3,860,899 3,184,046 2,907,466Total 26,460,752 29,270,439 28,537,788Note 1.--Original data published in metric tons, which were converted to short tons by multiplying by 1.1023. Because of rounding, totals may not add to the figures shown. Note 2.--The vast majority of rebar from China may be classified under HS subheading 7228.30 for hot-rolled alloyed bar, rather than HS subheading 7214.20 for concrete reinforcing bars. See Steel Concrete Reinforcing Bar from Belarus, China, Indonesia, Moldova, Poland, and Ukraine, Inv. Nos. 731-TA-873-875, 878-880 and 882 (Second Review), USITC Publication 4409, July 2013, p. IV-15. HS 7228.30 is a basket category that contains bars and rods made of tool steel, high-nickel alloy steel, alloy concrete reinforcing bars and other alloy steel bars. According to Global Trade Atlas, Chinese exports of hot-rolled alloy bar under HS subheading 7228.30 nearly tripled between 2011 and 2013, from 3,231,424 short tons in 2011 to 9,163,085 short tons in 2013). During the same period, Chinese exports of concrete reinforcing bars classified under HS subheadings 7214.20 and 7213.10 remained relatively steady. Source: Global Trade Atlas (accessed June 30, 2014), HS subheadings 7213.10 and 7214.20.
Nonsubject Turkish producer Habas
According to ***, Habas has the second largest rebar rolling capacity in Turkey, second only to subject Turkish producer Icdas.34 The Commission collected data on Habas’ rebar operations prior to Commerce’s final determination in which it calculated a zero percent
34 ***.

VII‐14
dumping margin and a de minimis subsidy rate with respect to Habas. Table VII‐12 presents information on Habas’ rebar operations in Turkey. Table VII‐13 presents information on Habas’ total capacity and production of products made on the same equipment and machinery used to produce rebar.
Table VII-12 Rebar: Data for Habas, 2011-13, January-March 2013, January-March 2014, and projected 2014-15
* * * * * * * Table VII-13 Rebar: Habas’ total capacity, production, and capacity utilization, by product, 2011-13, January-March 2013, January-March 2014, and projected 2014-15
* * * * * * *
Ukraine
Ukraine has been slow to recover from the global recession, which has contributed to significantly contracted residential and non‐residential construction sectors since 2009.35 Ukraine rebar producers include ArcelorMittal Kryviy Rih (“AMK”), Dneprovsky Iron and Steel Works, Kramatorsk Iron Works and Yenakiero Iron and Steel. AMK, Ukraine’s largest integrated steel company, was previously a state‐owned company named Krivoi Rog Mining & Metallurgical Integrated Works before being acquired by ArcelorMittal in 2005.36 In January 2013, AMK announced that its finished rolling capacity increased 11 percent from the previous year to a total of 1.419 million metric tons, which also includes rebar.37 Dneprovsky Iron and Steel Works has an annual capacity to produce 3.55 million metric tons of rolled steel in 2011.38 Yenakiieve Iron and Steel, a subsidiary of Ukraine‐based holding company named Metinvest Group, has an annual capacity to produce 720,000 metric tons of finished rolled products,
35 “Ukrainian construction market to decrease again in 2012,” PMR: Construction sector in Russia, November 26, 2012, found at http://www.constructionrussia.com/177138/Ukrainian‐construction‐market‐to‐decrease‐again‐in‐2012.shtml, retrieved on September 27, 2013.
36 Steel Concrete Reinforcing Bar from Belarus, China, Indonesia, Korea, Latvia, Moldova, Poland, and Ukraine, Inv. Nos. 731‐TA‐873‐875, 878‐880, and 882 (Second Review), USITC Publication 4409, July 2013.
37 “ArcelorMittal Kryvyi Rih’s crude steel output up 1.5 percent in January‐May,” Steel Orbis, June 12, 2013, found at http://www.steelorbis.com/steel‐news/latest‐news/arcelormittal‐kryvyi‐rihs‐crude‐steel‐output‐up‐15‐percent‐in‐jan_may‐764265.htm, retrieved on September 27, 2013.
38 “PJSC Dneprovsky Integrated Iron & Steel Works named after Dzershinsky” Company Profile (Ukraine),” Infomine Market Research Group, found at http://eng.infomine.ru/files/catalog/355/file_355_eng.pdf, retrieved on September 27, 2013.

VII‐15
including rebar.39 According to ***, the ongoing conflict in Ukraine has reportedly led to production interruptions and mill closures. Raw materials deliveries have reportedly been delayed due to damaged railways and roads, and fighting in eastern Ukraine has reportedly resulted in stoppages of some of Ukraine’s largest mills, including Dneprovsky Iron and Steel Works, Ilyich Iron and Steel Works, and Yenakiieve Iron and Steel.40 As shown in Table VII‐14, Ukraine’s largest export markets for rebar are Russia and Iraq.
Table VII-14 Rebar: Ukraine’s reported exports, 2011-13
Calendar year 2011 2012 2013
Country Quantity (short tons)
Russia 481,070 716,509 948,546Iraq 760,938 978,758 839,991Azerbaijan 179,156 233,776 277,787Lebanon 176,806 161,551 143,020Belarus 23,302 76,200 119,092Turkmenistan 15,673 77,377 84,046Georgia 70,619 63,596 74,359India 163,384 44,937 71,253Moldova 39,585 25,956 49,589Armenia 40,893 36,010 35,903Egypt 34,149 72,572 22,187Nigeria 30,215 16,806 21,230Ghana 25,883 20,066 12,398Guinea 6,644 3,350 10,225Senegal 7,140 5,916 8,619Tunisia 0 0 5,329Romania 58,038 23,326 4,267Benin 5,440 1,760 4,146Lithuania 6,041 2,609 2,464Jordan 3,585 4,602 2,206All others 261,531 122,389 2,989Total 2,390,088 2,688,067 2,739,645Note.-- Original data were published in metric tons, which was converted to short tons by multiplying by 1.1023. Because of rounding, totals may not add to the figures shown. Source: Global Trade Atlas (accessed June 30, 2014), HS subheadings 7213.10 and 7214.20.
39 Metinvest Company website, “Our Facilities”, found at http://emz.metinvestholding.com/en/about/structure, retrieved on September 27, 2013.
40 ***.

VII‐16
Spain
Spain’s domestic rebar market has been experiencing sluggish demand since 2008, and Spanish rebar producers reportedly are selling rebar at deep discount to North African markets, specifically Algeria.41 Grupo Alfonso Gallardo is the largest steel producer in Spain for rebar and other long steel products. In May 2011, Brazilian flat‐rolled steelmaker, Companhia Siderurgica Nacional (“CSN”) announced that it would acquire five companies from Grupo Alfonso Gallardo for $772 million, including two rebar plants, Corrugados Azpeitia SL and Corrugados Lasao SLU.42 In April 2013, Grupo Alfonso Gallardo said that it would cut 38 jobs at Corrugados Lasao SLU and shut down Corrugados Azpeitia SL entirely due to lackluster demand for long steel products.43 Moreover, Grupo Alfsonso stated that it would revise its job cuts production plan at its Siderurgica Balboa plant in October 2013.44 Megasa, a Spanish‐based long steel producer, maintains an annual capacity of its long steel products of 800,000 tons per year. Celsa Group, a rebar manufacturer based in Barcelona, Spain, cut rebar production in April 2012.45 Weak demand from the construction sector in southern Europe continues to plague Spanish rebar producers into 2014, reportedly forcing them to turn to export markets.46 Table VII‐15 shows that Algeria and Portugal are Spain’s largest export markets.
41 “Spanish rebar exporters stir buyers with discounts,” Metal News, October 16, 2013, found at http://europesteeltrade.com/market‐news, retrieved on October 24, 2013.
42 “CSN to purchase four Spanish steel companies,” Steel Orbis, May 23, 2011, found at http://www.steelorbis.com/steel‐news/latest‐news/csn‐to‐purchase‐four‐spanish‐steel‐companies‐601605.htm, retrieved on October 24, 2013.
43 Spain’s Grupo Alfonso Gallardo to cut jobs due to lackluster demand,” Steel Orbis, April 22, 2013, found at http://www.steelorbis.com/steel‐news/latest‐news/spains‐grupo‐alfonso‐gallardo‐to‐cut‐jobs‐due‐to‐lackluster‐demand‐754345.htm, retrieved on October 24, 2013.
44 “Grupo Alfonso revises job cuts plan for Siderurgica Balboa in Spain,” Steel First, October 4, 2013, found at http://www.grupoag.es/en/portada/portada.php, retrieved on October 24, 2013.
45 Inside Metals Newsletter, April 4, 2012, found at https://customers.reuters.com/community/newsletters/metals/IM_Apr_4_2012.pdf, retrieved on October 24, 2013.
46 “Spanish rebar exporters watching US trade case against Turkey, Mexico,” Metal Bulletin, February 10, 2014; “Construction lull clouds Southern Europe’s domestic rebar market,” Metal Bulletin, September 24, 2014.

VII‐17
Table VII-15 Rebar: Spain’s reported exports, 2011-13
Calendar year 2011 2012 2013
Country Quantity (short tons)
Algeria 823,000 978,883 1,158,996Portugal 242,515 127,578 104,780Singapore 11,891 98,495 103,368France 108,929 112,063 99,712Australia 16,540 79,788 87,040Morocco 14,571 47,981 85,497Israel 32,662 68,637 69,039Angola 23,321 6,628 46,614United Kingdom 65,804 50,248 46,196Dominican Republic 1,076 20,267 32,979Chile 44,643 0 30,135Malaysia 640 8,628 28,766Brazil 1 1,392 13,889Germany 31,705 20,605 13,371Ireland 33,019 13,409 10,668Sweden 0 0 7,870Belgium 1,263 4,813 6,989Mauritius 3,774 7,348 6,919Togo 0 0 6,549Switzerland 187 10,963 5,344All others 73,142 91,321 40,866Total 1,528,686 1,749,048 2,005,585Note.-- Original data were published in metric tons, which was converted to short tons by multiplying by 1.1023. Because of rounding, totals may not add to the figures shown. Source: Global Trade Atlas (accessed June 30, 2014), HS subheadings 7213.10 and 7214.20.

VII‐18
Belarus
Belarus has recently been investing in residential housing construction projects. The construction market is further expected to grow because the Belarusian central government plans to pass legislation to boost government spending for housing construction.47 Byelorussian Steel Works (“BSW”) is the only known producer of rebar in Belarus. In July 2013, BSW announced plans to open a new rolling mill that will eventually produce 1 million tons of rolled‐steel products per year.48 BSW claimed that up to 13 percent of its production from the new mill will be exported to former Soviet Union countries, and two‐thirds to other global markets. BSW plans to produce a total of 3 million metric tons per year of rolled products by 2015, as a result of the modernization of its existing steel plants. As shown in Table VII‐16, Russia was Belarus’ largest rebar export market, accounting for 75.2 percent of Belarus’ total exports of rebar in 2013.
47 “Recession registered in Belarus,” Belarus in Focus, May 21, 2013, found at http://belarusinfocus.info/p/5895, retrieved on September 27, 2013; and “ International Monetary Fund: Republic of Belarus: Selected Issues,” International Monetary Fund, April 19, 2012, found at http://www.imf.org/external/pubs/ft/scr/2012/cr12114.pdf, retrieved on September 27, 2013.
48 Byelorussian Steel Works website, “Eurasian Bank of Development and Belarusbank SB jointly finance the erection of a new rolling mill” July 19, 2013, found at http://belsteel.com/eng/press/news.php?id=549, retrieved on September 27, 2013.

VII‐19
Table VII-16 Rebar: Belarus’ reported exports, 2011-13
Calendar year 2011 2012 2013
Country Quantity (short tons)
Russia 443,341 599,998 652,181Lithuania 66,429 90,479 84,349Finland 22,308 32,820 32,077Latvia 15,450 21,636 20,713Estonia 220 4,583 15,529Ghana 44,921 21,486 14,618Iceland 3,618 873 8,466Jordan 20,180 10,579 5,744Norway 10,753 12,982 5,698Turkey 0 0 5,437Poland 14,989 1,845 5,093Sweden 15,146 24,284 4,870Mauritania 2,179 0 3,325Senegal 13,603 5,819 3,156Gabon 4,936 2,622 2,682Ukraine 0 365 1,179Chad 0 0 1,035Cameroon 0 0 619Burkina Faso 5,079 0 441Cote d’Ivoire 601 0 367All others 164,614 90,630 3Total 848,368 921,001 867,582Note.-- Original data were published in metric tons, which was converted to short tons by multiplying by 1.1023. Because of rounding, totals may not add to the figures shown. Source: Global Trade Atlas (accessed August 14, 2014), HS subheadings 7213.10 and 7214.20.

VII‐20
Portugal
Portugal’s rebar industry has been hit hard by the country’s depressed construction industry, which is the country’s largest employer.49 As a result, Portugal rebar producers have sought increasingly to export to other foreign markets, specifically Algeria, in order to prop their sales. In June 2013, the Portuguese government signed four agreements with its Algerian counterparts worth in excess of 4 billion euros, in which Portuguese companies agreed to build 75,000 social housing units and middle class homes, as well as supply building materials, to Algeria.50 There are two major rebar producers in Portugal, which are both foreign‐owned. Bollinghaus Steel is a German‐based steel company that has since moved its manufacturing operations exclusively to Portugal. According to Bollinghaus Steel’s website, the company is investing over $3 million over the next three years to increase production capacity at its rolling mill in Vieira de Leiria, Portugal.51 Siderurgica Nacional Longos Sexial (“SN Longos) is majority owned by Megasa, a Spanish steel producer. SN Longos is capable of producing 900,000 metric tons of rebar and wire rod annually.52 According to Table VII‐17, exports to Algeria accounted for 30.8 percent of total rebar exports from Portugal in 2013.
49 “Portugal construction bleeds job, threatens banks,” Reuters, June 28, 2012, found at http://www.reuters.com/article/2012/06/28/us‐portugal‐construction‐debt‐idUSBRE85R18T20120628, retrieved on October 24, 2013.
50 “Algeria lifeline for Portuguese construction industry,” The Portugal News Online, February 20, 2013, found at http://theportugalnews.com/news/algeria‐throws‐portuguese‐construction‐industry‐a‐four‐billion‐euro‐lifeline/27806, retrieved on October 24, 2013.
51 Bollinghaus Steel’s website, found at http://www.boellinghaus.de/57.html, retrieved on October 24, 2013.
52 Megasa Company Profile, Steel Orbis, found at http://www.steelorbis.com/steel‐companies/megasa/, retrieved on October 24, 2013.

VII‐21
Table VII-17 Rebar: Portugal’s reported exports, 2011-13
Calendar year 2011 2012 2013
Country Quantity (short tons)
Algeria 234,063 295,756 363,154Spain 427,039 295,965 253,986United Kingdom 43,959 69,680 96,957United States 0 0 89,928Morocco 20,309 42,336 83,181Angola 83,928 154,916 81,905Ireland 37,829 61,220 54,501Equatorial Guinea 5,818 14,748 48,602Brazil 0 71,357 41,277Senegal 10,423 11,885 11,899Cape Verde 10,698 10,298 11,343Congo 565 1,348 9,877Mauritania 1,629 3,251 5,968Gabon 6,768 6,820 5,545Israel 0 33,623 4,709Congo Dem. Rep. 2,808 4,862 4,002Germany 11,536 2,665 2,614Venezuela 0 8 1,766France 2,312 460 1,510Burkina Faso 658 222 1,031All others 81,346 52,986 4,286Total 981,687 1,134,406 1,178,039Note.-- Original data were published in metric tons, which was converted to short tons by multiplying by 1.1023. Because of rounding, totals may not add to the figures shown. Source: Global Trade Atlas (accessed August 14, 2014), HS subheadings 7213.10 and 7214.20.

VII‐22
Latvia
Latvia is one of the fastest growing European economies, and the construction industry accounted for 6.1 percent of its GDP in 2012.53 Liepajas Metalurgs (“Liepajas”) is the only known Latvian producer of rebar and one of the largest companies in Latvia. Liepajas states on its website that it exports 98 percent of its rebar to global markets.54 However, in April 2013, Liepajas reportedly halted production of its rebar due to falling steel prices, solvency issues and its inability to pay back a state‐guaranteed loan that was used to upgrade its production.55 In August 2013, Liepajas was in the process of drafting a legal protection plan before it could resume operations.56 In September 2013, Liepajas announced that it would lay off 500 workers and increase prices for its steel products pursuant to its legal protection plan.57 In September 2014, Liepajas was acquired by KVV Group, a Ukrainian scrap producer.58 Table VII‐18 indicates that Latvia’s largest export markets for rebar are Algeria and Poland.
53 “Economy of Latvia,” Baltic Export, found at http://balticexport.com/?article=latvijas‐ekonomika, retrieved on September 27, 2013.
54 “Polish journalists uncover possible fraud at Latvian steel plant,” News Wave, April 8, 2013, found at http://newswave.eu/polish‐journalists‐uncover‐possible‐fraud‐at‐latvian‐steel‐plant/, retrieved on September 27, 2013.
55 “Latvian steel mill seeks investors to avoid bankruptcy,” Baltic Business News, May 10, 2013, found at http://www.balticbusinessnews.com/?PublicationId=73b599c4‐3a82‐4335‐b41f‐b7adc8a7b4be, retrieved on September 27, 2013.
56 “Russian investor Dalpolimetall withdraws from talks on rescuing Liepajas metalurgs,” Baltic Export, August 1, 2013, found at http://balticexport.com/?lang=en&article=portals‐krievijas‐investors‐dalpolimetall‐izstajas‐no‐sarunam‐par‐lm‐glabsanu, retrieved on September 27, 2013.
57 “Liepajas Metalurgs begins selling off property, laying off 500 workers,” The Baltic Course, September 16, 2013, found at http://www.baltic‐course.com/eng/markets_and_companies/?doc=80627, retrieved on September 27, 2013.
58 “Latvia’s Liepajas Metalurgs sells to Ukrainian scrap group,” Kallanish Commodities, September 12, 2014, found at http://www.kallanish.com/articles/Liepajas‐metalurgs‐sells‐to‐Ukrainian.html.

VII‐23
Table VII-18 Rebar: Latvia’s reported exports, 2011-13
Calendar year 2011 2012 2013
Country Quantity (short tons)
Algeria 104,814 282,147 147,308Poland 330,289 267,189 55,132Estonia 53,017 48,195 28,932Finland 31,778 31,870 15,551Lithuania 41,517 44,283 11,480Sweden 17,303 23,314 8,673United Kingdom 9,029 52,152 5,898Belgium 0 0 5,505Russia 6,011 23,302 4,917Germany 15,923 10,233 3,030Denmark 6,843 10,880 2,314Norway 1,114 2,406 2,057Netherlands 1,541 524 1,519Iceland 2,401 5,527 559Belarus 374 14,988 143Cyprus 0 568 130Czech Republic 396 0 0Azerbaijan 0 425 0France 0 0 0Ireland 1,171 86 0All others 3,047 61,108 0Total 626,567 879,194 293,149Note.-- Original data were published in metric tons, which was converted to short tons by multiplying by 1.1023. Because of rounding, totals may not add to the figures shown. Source: Global Trade Atlas (accessed June 30, 2014), HS subheadings 7213.10 and 7214.20.

VII‐24
Korea
The Korean residential housing construction market has remained sluggish since the 2008 global recession.59 However, it reportedly is set to expand in the near future, driven mostly by infrastructure construction projects in preparation for the 2018 Winter Olympics.60 The Korean rebar industry focuses on manufacturing high‐strength rebar that is earthquake resistant and can be used in nuclear power plant construction.61 Korea mostly produces coiled rebar.62 The average capacity utilization for Korean rebar producers was above 70 percent in 2012.63 Hyundai Steel, a Korean producer of rebar, developed a niche to produce ultra‐high strength rebars and earthquake resistant rebars in 2011. Dongkuk Steel planned to open a new rolling mill in 2012 to increase its rebar production from 1.4 million tons to 2.2 million tons.64 Daehan Steel started a new rolling mill for coiled rebar production in 2011, and plans to increase its rebar processing facilities throughout Korea.65 Korean steel producer, YK Steel, reduced its rebar production in June 2012 because of facility repairs at its steelmaking mills.66 YK Steel claimed that its monthly output was 75,000 metric tons in 2012.67 As shown in Table VII‐19, the largest export markets for rebar from Korea in 2013 were Singapore, Canada, and Malaysia.
59 “Stagnant South Korea Property Drags on Growth Rebound: Economy,” Bloomberg, August 4, 2013, found at http://www.bloomberg.com/news/2013‐08‐05/stagnant‐south‐korea‐property‐drags‐on‐growth‐rebound‐economy.html, retrieved on September 27, 2013.
60 “South Korea's construction industry prepares for the 2018 Winter Olympics,” Building, August 6, 2013, found at http://www.building.ca/news/south‐koreas‐construction‐industry‐prepares‐for‐the‐2018‐winter‐olympics/1002521299/, retrieved on September 27, 2013.
61 “South Korean rebar producers to target niche market,” Steel Orbis, February 3, 2012, found at http://www.steelorbis.com/steel‐news/latest‐news/south‐korean‐rebar‐producers‐to‐target‐niche‐markets‐660104.htm, retrieved on September 27, 2013.
62 Id. 63 “South Korea rebar mills’ capacity usage to exceed 70% in July,” Steel Orbis, July 20, 2012, found at
http://www.steelorbis.com/steel‐news/latest‐news/south‐korean‐rebar‐mills‐capacity‐usage‐to‐exceed‐70‐in‐july‐700943.htm, retrieved on September 27, 2013.
64 “South Korean rebar producers to target niche market,” Steel Orbis, February 3, 2012, found at http://www.steelorbis.com/steel‐news/latest‐news/south‐korean‐rebar‐producers‐to‐target‐niche‐markets‐660104.htm, retrieved on September 27, 2013.
65 Id. 66 “South Korea rebar mills’ capacity usage to exceed 70% in July,” Steel Orbis, July 20, 2012, found at
http://www.steelorbis.com/steel‐news/latest‐news/south‐korean‐rebar‐mills‐capacity‐usage‐to‐exceed‐70‐in‐july‐700943.htm, retrieved on September 27, 2013.
67 Ibid.

VII‐25
Table VII-19 Rebar: Korea’s reported exports, 2011-13
Calendar year 2011 2012 2013
Country Quantity (short tons)
Singapore 262,354 165,736 87,019Canada 28,367 45,431 61,446Malaysia 51 13,928 47,553United Arab Emirates 9,139 27,131 38,426United States 0 4,752 34,871Kuwait 0 6 20,034Philippines 518 332 14,755Australia 0 2,625 11,024Hong Kong 240,052 27,129 9,825Vietnam 21,639 10,170 6,633Taiwan 6,732 6,542 6,264Ghana 0 0 4,764Dominican Republic 0 0 4,370Sri Lanka 0 0 3,832Panama 5,842 0 3,778Guam 7,088 4,611 3,567South Africa 5,456 0 3,312Uzbekistan 0 0 3,287Myanmar 85,738 45,173 3,082Uruguay 0 0 2,841All others 65,425 16,504 11,834Total 738,401 370,069 382,517Note.-- Original data were published in metric tons, which was converted to short tons by multiplying by 1.1023. Because of rounding, totals may not add to the figures shown. Source: Global Trade Atlas (accessed June 30, 2014), HS subheadings 7213.10 and 7214.20.

VII‐26
Dominican Republic
The Dominican Republic experienced a notable increase in residential and non‐residential construction over the last decade and therefore an increase in demand for rebar, propelled by an increase in tourism and hotel‐related projects.68 There are two known producers of rebar in the Dominican Republic: Industrias Nacionales CxA (INCA), and Metaldom. INCA merged with Brazilian‐based company, Gerdau, resulting in Gerdau owning a 49‐percent share and INCA owning a 51‐percent share in the company. In 2007, INCA invested $125 million to build a rolling mill to increase annual installed capacity from 300,000 metric tons to 720,000 metric tons of rolled products.69 Metaldom is one of the largest steelmakers in the Caribbean region, and is owned by VICINI Group, a private asset management firm. Metaldom has a capacity to make 400,000 tons of rolled steel products at its Santo Domingo plant.70 Reportedly, Metaldom primarily exports its products to the Caribbean and South American markets.71 Table VII‐20 shows that the largest export markets for rebar from the Dominican Republic in 2012 were Haiti, the United States, and Suriname.
68 Senior, Bolivar A., and Rodriguez, Tulio A., “Analyzing Barriers to Construction Productivity Improvement in the Dominican Republic,” 20th Conference of the International Group for Lean Construction, 2012, found at http://www.iglc20.sdsu.edu/papers/wpcontent/uploads/2012/07/71%20P%20140.pdf, retrieved on September 27, 2013.
69 Gerdau website, “Inca invests $125 million in the Dominican Republic,” November 29, 2007, found at http://www.gerdau.com/media‐center/noticias‐detalhes.aspx?cd=36aa0bb3‐4e8f‐4713‐b811‐efa424407670, retrieved on September 27, 2013.
70 “Developments in Steelmaking Capacity of Non‐OECD Economies 2010,” Organization for Economic Co‐operation and Development, 2010, found at http://www.oecd‐ilibrary.org/industry‐and‐services/developments‐in‐steelmaking‐capacity‐of‐non‐oecd‐countries_19991606, retrieved on September 27, 2013.
71 “Metaldom to fuel rolling mill furnace with natural gas,” BNAmericas, December7, 2010, found at http://www.bnamericas.com/news/metals/Metaldom_to_fuel_rolling_mill*s_furnace_with_natural_gas, retrieved on September 27, 2013.

VII‐27
Table VII-20 Rebar: Dominican Republic’s reported exports, 2010-121
Calendar year 2010 2011 2012
Country Quantity (short tons)
Haiti 48,886 87,161 22,106United States 29,247 77,008 17,608Suriname 7,207 11,048 7,405Jamaica 25,313 23,142 1,536Curacao 0 516 1,092St. Lucia 2,487 3,082 1,078Dominica 2,433 3,394 947Antigua & Barbuda 2,568 2,525 785Cayman Islands 1,008 1,151 340Guyana 2,116 2,234 190Turks & Caicos Islands 917 606 62Barbados 29 0 57Anguilla 388 594 31British Virgin Islands 1,440 877 29All others 31,201 30,078 0Total 155,239 243,418 53,2641 2013 data are unavailable. Note.-- Original data were published in metric tons, which was converted to short tons by multiplying by 1.1023. Because of rounding, totals may not add to the figures shown. Source: Global Trade Atlas (accessed September 30, 2014), HS subheadings 7213.10 and 7214.20.


A‐1
APPENDIX A
FEDERAL REGISTER NOTICES


A‐3
The Commission makes available notices relevant to its investigations and reviews on its website, www.usitc.gov. In addition, the following tabulation presents, in chronological order, Federal Register notices issued by the Commission and Commerce during the current proceeding.
Citation Title Link
78 FR 55755 September 11, 2013
Steel Concrete Reinforcing Bar From Mexico and Turkey; Institution of Antidumping and Countervailing Duty Investigations and Scheduling of Preliminary Phase Investigations
http://www.gpo.gov/fdsys/pkg/FR‐2013‐09‐11/pdf/2013‐22020.pdf
78 FR 60831 October 2, 2013
Steel Concrete Reinforcing Bar From Turkey: Initiation of Countervailing Duty Investigation
http://www.gpo.gov/fdsys/pkg/FR‐2013‐10‐02/pdf/2013‐23987.pdf
78 FR 60827 October 2, 2013
Steel Concrete Reinforcing Bar From Mexico and Turkey: Initiation of Antidumping Duty Investigations
http://www.gpo.gov/fdsys/pkg/FR‐2013‐10‐02/pdf/2013‐23983.pdf
78 FR 68090 November 13, 2013
Steel Concrete Reinforcing Bar From Turkey
http://www.gpo.gov/fdsys/pkg/FR‐2013‐11‐13/pdf/2013‐27069.pdf
79 FR 10771 February 26, 2014
Steel Concrete Reinforcing Bar From the Republic of Turkey: Preliminary Negative Countervailing Duty Determination, Preliminary Negative Critical Circumstances Determination, and Alignment of Final Determination With Final Antidumping Determination
http://www.gpo.gov/fdsys/pkg/FR‐2014‐02‐26/pdf/2014‐04221.pdf
Tabulation continued on next page.

A‐4
Citation Title Link
79 FR 22802 April 24, 2014
Steel Concrete Reinforcing Bar From Mexico: Preliminary Determination of Sales at Less Than Fair Value, Preliminary Affirmative Determination of Critical Circumstances, and Postponement of Final Determination
http://www.gpo.gov/fdsys/pkg/FR‐2014‐04‐24/pdf/2014‐09368.pdf
79 FR 22804 April 24, 2014
Steel Concrete Reinforcing Bar From Turkey: Preliminary Determination of Sales at Less Than Fair Value, Preliminary Affirmative Determination of Critical Circumstances, and Postponement of Final Determination
http://www.gpo.gov/fdsys/pkg/FR‐2014‐04‐24/pdf/2014‐09372.pdf
79 FR 31136 May 30, 2014
Steel Concrete Reinforcing Bar From Mexico and Turkey; Scheduling of the Final Phase of the Countervailing Duty and Antidumping Investigations
http://www.gpo.gov/fdsys/pkg/FR‐2014‐05‐30/pdf/2014‐12507.pdf
79 FR 54963, September 15, 2014
Steel Concrete Reinforcing Bar From the Republic of Turkey: Final Affirmative Countervailing Duty Determination Final Affirmative Critical Circumstances Determination
http://www.gpo.gov/fdsys/pkg/FR‐2014‐09‐15/pdf/2014‐21989.pdf
79 FR 54965, September 15, 2014
Steel Concrete Reinforcing Bar from Turkey: Final Negative Determination of Sales at Less Than Fair Value and Final Determination of Critical Circumstances
http://www.gpo.gov/fdsys/pkg/FR‐2014‐09‐15/pdf/2014‐21986.pdf
Tabulation continued on next page.

A‐5
Citation Title Link
79 FR 54967, September 15, 2014
Steel Concrete Reinforcing Bar From Mexico: Final Determination of Sales at Less Than Fair Value and Final Affirmative Determination of Critical Circumstances
http://www.gpo.gov/fdsys/pkg/FR‐2014‐09‐15/pdf/2014‐21982.pdf
79 FR 57131, September 15, 2014
Steel Concrete Reinforcing Bar From Turkey; Termination of Investigation
http://www.gpo.gov/fdsys/pkg/FR‐2014‐09‐24/pdf/2014‐22692.pdf
Source: https://www.federalregister.gov/


B-1
APPENDIX B
LIST OF HEARING WITNESSES


B-3
CALENDAR OF PUBLIC HEARING
Those listed below appeared as witnesses at the United States International Trade Commission’s hearing:
Subject: Steel Concrete Reinforcing Bar from Mexico and Turkey
Inv. Nos.: 701-TA-502 and 731-TA-1227-1228 (Final)
Date and Time: September 15, 2014 - 9:30 a.m.
Sessions were held in connection with these investigations in the Main Hearing Room (room 101), 500 E Street, S.W., Washington, D.C. CONGRESSIONAL APPEARANCE: The Honorable Amy Klobuchar, United States Senator, Minnesota STATE GOVERNMENT WITNESS: The Honorable Jim Pitts, State Representative of Texas, District 10 EMBASSY WITNESSES: Embassy of Mexico Washington, D.C.
Kenneth Smith Ramos, Head of Trade and NAFTA Office of the Ministry of Economy
Salvador Behar, Legal Counsel for International Trade
OPENING REMARKS: Petitioners (Alan H. Price, Wiley Rein LLP) Respondents (Matthew M. Nolan, Arent Fox LLP, Jay C. Campbell,
White & Case LLP)

B-4
In Support of the Imposition of Antidumping and Countervailing Duty Orders:
Wiley Rein LLP Washington, DC on behalf of The Rebar Trade Action Coalition Jim Kerkvliet, Vice President of Sales and Marketing, Gerdau Long Steel
North America
Marcelo Canosa, Director, Rebar and Wire Rod, Gerdau Long Steel North America
Joseph Alvarado, President and Chief Executive Officer, Commercial Metals Company Tracy Porter, Senior Vice President, Commercial Metals Company
and President, Commercial Metals Company Americas Division Jim Darsey, Executive Vice President of Bar Products, Nucor Corporation Robert J. Stone, Commercial Director of Sales and Marketing, Long
Products, Nucor Corporation Leo W. Gerard, International President, United Steel, Paper and Forestry,
Rubber, Manufacturing, Energy, Allied Industrial and Service Workers International Union
Burke Byer, President and Chief Executive Officer, Byer Steel
Chris Crowe, President, Magnolia Steel Company
James R. Melvin, President, Re-Steel Supply Company, Inc. Robert Webb, President, Southwestern Suppliers
Dr. Seth Kaplan, Senior Economic Advisor, Capital Trade Inc.
Alan H. Price ) ) – OF COUNSEL John R. Shane )

B-5
In Opposition to the Imposition of the Antidumping Countervailing Duty Orders (coutinued): White & Case Washington, DC on behalf of Deacero S.A. P. I. de C.V. (“Deacero”) Deacero USA, Inc. (“Deacero USA”) Mauricio Gutierrez Noriega, Export Sales Director, Deacero
Eugenio Gutierrez Noriega, Vice President of Finance & Trade Affairs, Deacero
Miguel Angel Bazan Briseno, Sales Manager, Deacero Luis Eugenio Leal Rangel, Trade Affairs Manager, Deacero Frank Bergren, Managing Director, Metal Partners Rebar
David E. Bond ) ) – OF COUNSEL Jay C. Campbell ) Arent Fox Washington, DC on behalf of Turkish Steel Exporters Association Icdas Celik Enerji Tersane ve Ulasim Sanayi A.S. Colakoglu Metalurji A.S. (“Turkish Exporters and Producers”) Uğur Dalbeler, Turkish Steel Exporter’s Association (CIB) Board Member and Chief Executive Officer, Colakoglu Metalurji
Kamil Murat Cebecioğlu, Icdas Foreign Trade Manager
Matthew M. Nolan ) – OF COUNSEL

B-6
In Opposition to the Imposition of the Antidumping Countervailing Duty Orders (coutinued):
Davis & Leiman P.C. Washington, DC on behalf of Grupo Acerero, SA de CV GASA Steel LLC Carlos Diaz, Business Development Manager, GASA Steel, LLC Humberto Abaroa, Chief Executive Officer/Director, Grupo
Acerero SA Mark David Davis ) – OF COUNSEL REBUTTAL/CLOSING REMARKS:
Petitioners (Alan H. Price, Wiley Rein LLP) Respondents (Matthew M. Nolan, Arent Fox LLP and Jay C. Campbell,
White & Case LLP)
-END-

C‐1
APPENDIX C
SUMMARY DATA


C-3
Table C-1 Rebar: Summary data concerning the U.S. market, 2011-13, January to March 2013, and January to March 2014
(Quantity=short tons; Value=1,000 dollars; Unit values, unit labor costs, and unit expenses=dollars per short ton; Period changes=percent--exceptions noted)
Report data Period changes
Calendar year January to March Calendar year
Jan-Mar
U.S. consumption quantity: 2011 2012 2013 2013 2014 2011-13 2011-12 2012-13 2013-14
Amount...................................................................... 6,538,663 7,390,806 7,729,673 1,846,024 2,005,322 18.2 13.0 4.6 8.6 Producers' share (fn1).............................................. 90.0 86.7 84.4 80.5 77.1 (5.6) (3.2) (2.4) (3.4) Importers' share (fn1):
Mexico.................................................................... 4.3 4.0 4.4 4.2 4.2 0.0 (0.4) 0.4 (0.0) Turkey (other than Habas)..................................... *** *** *** *** *** *** *** *** ***
Subtotal (subject)................................................ *** *** *** *** *** *** *** *** *** Turkey (Habas)...................................................... *** *** *** *** *** *** *** *** *** All others sources.................................................. 1.6 0.7 2.0 0.7 3.7 0.4 (0.9) 1.3 3.0
Subtotal (nonsubject).......................................... *** *** *** *** *** *** *** *** *** Total imports.................................................... 10.0 13.3 15.6 19.5 22.9 5.6 3.2 2.4 3.4
U.S. consumption value:
Amount...................................................................... 4,272,296 4,765,461 4,766,840 1,161,105 1,245,819 11.6 11.5 0.0 7.3Producers' share (fn1).............................................. 90.4 87.3 85.6 82.5 78.8 (4.8) (3.0) (1.8) (3.7)Importers' share (fn1):
Mexico.................................................................... 4.1 3.7 4.0 3.9 3.8 (0.1) (0.4) 0.3 (0.1)Turkey (other than Habas)..................................... *** *** *** *** *** *** *** *** ***
Subtotal (subject)................................................ *** *** *** *** *** *** *** *** ***Turkey (Habas)...................................................... *** *** *** *** *** *** *** *** ***All others sources.................................................. 1.5 0.8 2.0 0.7 3.6 0.5 (0.7) 1.2 3.0
Subtotal (nonsubject).......................................... *** *** *** *** *** *** *** *** ***Total imports.................................................... 9.6 12.7 14.4 17.5 21.2 4.8 3.0 1.8 3.7
U.S. importers' U.S. imports from: Mexico:
Quantity.................................................................. 283,285 293,749 338,200 77,482 83,281 19.4 3.7 15.1 7.5Value...................................................................... 174,697 174,015 188,960 44,855 46,938 8.2 (0.4) 8.6 4.6Unit value............................................................... $617 $592 $559 $579 $564 (9.4) (3.9) (5.7) (2.6)Ending inventory quantity...................................... *** *** *** *** *** *** *** *** ***
Turkey (other than Habas) Quantity.................................................................. *** *** *** *** *** *** *** *** ***Value...................................................................... *** *** *** *** *** *** *** *** ***Unit value............................................................... *** *** *** *** *** *** *** *** ***Ending inventory quantity...................................... *** *** *** *** *** *** *** *** ***
Subtotal (subject) Quantity.................................................................. *** *** *** *** *** *** *** *** ***Value...................................................................... *** *** *** *** *** *** *** *** ***Unit value............................................................... *** *** *** *** *** *** *** *** ***Ending inventory quantity...................................... *** *** *** *** *** *** *** *** ***
Turkey (Habas) Quantity.................................................................. *** *** *** *** *** *** *** *** ***Value...................................................................... *** *** *** *** *** *** *** *** ***Unit value............................................................... *** *** *** *** *** *** *** *** ***Ending inventory quantity...................................... *** *** *** *** *** *** *** *** ***
All other sources: Quantity.................................................................. 104,752 52,064 154,142 12,326 73,813 47.1 (50.3) 196.1 498.9Value...................................................................... 64,618 37,630 95,759 7,874 45,441 48.2 (41.8) 154.5 477.1Unit value............................................................... $617 $723 $621 $639 $616 0.7 17.2 (14.0) (3.6)Ending inventory quantity...................................... *** *** *** *** *** *** *** *** ***
Subtotal (nonsubject) Quantity.................................................................. *** *** *** *** *** *** *** *** ***Value...................................................................... *** *** *** *** *** *** *** *** ***Unit value............................................................... *** *** *** *** *** *** *** *** ***Ending inventory quantity...................................... *** *** *** *** *** *** *** *** ***
Total imports: Quantity.................................................................. 655,418 979,431 1,208,898 360,186 460,117 84.4 49.4 23.4 27.7Value...................................................................... 410,448 602,951 686,610 203,520 263,933 67.3 46.9 13.9 29.7Unit value............................................................... $626 $616 $568 $565 $574 (9.3) (1.7) (7.7) 1.5Ending inventory quantity...................................... 7,257 47,473 93,968 67,055 134,450 1,194.9 554.2 97.9 100.5
Table continued next page

C-4
Table C-1 -- continued Rebar: Summary data concerning the U.S. market, 2011-13, January to March 2013, and January to March 2014
(Quantity=short tons; Value=1,000 dollars; Unit values, unit labor costs, and unit expenses=dollars per short ton; Period changes=percent--exceptions noted)
U.S. producers':
Notes:
fn1.--Report data are in percent and period changes are in percentage points. fn2.--Undefined.
Source : Compiled from data submitted in response to Commission questionnaires, official U.S. import statistics, and proprietary ***. Table C-2 Deformed steel wire: Summary data concerning the U.S. market, 2011-13, January to March 2013, and January to March 2014
* * * * * * *
Table C-3 Rebar and deformed steel wire: Summary data concerning the U.S. market, 2011-13, January to March 2013, and January to March 2014
* * * * * * *
Table C-4 Deformed steel wire: Data on industry in Mexico, 2011-2013, January to March 2013, January to March 2014, and projected 2014-15
* * * * * * *
Report data Period changes
2011 Calendar year
2012 2013
January to March 2013 2014
2011-13 Calendar year
2011-12 2012-13Jan-Mar 2013-14
Average capacity quantity........................................ 9,632,001 9,816,490 9,911,957 2,522,772 2,521,331 2.9 1.9 1.0 (0.1)Production quantity................................................... 6,327,968 6,831,468 6,776,007 1,558,702 1,665,052 7.1 8.0 (0.8) 6.8Capacity utilization (fn1)........................................... U.S. shipments:
Quantity.................................................................. 65.7
5,883,245
69.6
6,411,375
68.4
6,520,775
61.8
1,485,838
66.0
1,545,205 2.7
10.8
3.9
9.0 (1.2)
1.7
4.3
4.0Value...................................................................... 3,861,848 4,162,510 4,080,230 957,585 981,886 5.7 7.8 (2.0) 2.5Unit value............................................................... $656 $649 $626 $644 $635 (4.7) (1.1) (3.6) (1.4)
Export shipments: Quantity.................................................................. *** *** *** *** *** *** *** *** ***Value...................................................................... *** *** *** *** *** *** *** *** ***Unit value............................................................... *** *** *** *** *** *** *** *** ***
Ending inventory quantity......................................... 484,796 545,398 550,880 562,035 605,110 13.6 12.5 1.0 7.7Inventories/total shipments (fn1).............................. *** *** *** *** *** *** *** *** ***Production workers................................................... 3,966 4,078 4,183 4,087 4,133 5.5 2.8 2.6 1.1Hours worked (1,000s)............................................. 7,977 8,251 8,369 1,996 2,134 4.9 3.4 1.4 6.9Wages paid ($1,000)................................................ 283,836 309,473 321,526 76,124 81,581 13.3 9.0 3.9 7.2Hourly wages............................................................ $35.58 $37.51 $38.42 $38.14 $38.23 8.0 5.4 2.4 0.2Productivity (short tons per 1,000 hours)................. 793 828 810 781 780 2.1 4.4 (2.2) (0.1)Unit labor costs......................................................... Net sales:
Quantity.................................................................. $44.85
6,252,358
$45.30
6,763,455
$47.45
6,762,561
$48.84
1,542,114
$49.00
1,610,824 5.8
8.2
1.0
8.2 4.7
(0.0)
0.3
4.5Value...................................................................... 4,096,256 4,401,929 4,266,236 994,583 1,021,690 4.1 7.5 (3.1) 2.7Unit value............................................................... $655 $651 $631 $645 $634 (3.7) (0.7) (3.1) (1.7)
Cost of goods sold (COGS)...................................... 3,741,176 3,984,787 3,930,134 917,958 976,831 5.1 6.5 (1.4) 6.4Gross profit of (loss)................................................. 355,080 417,142 336,102 76,625 44,859 (5.3) 17.5 (19.4) (41.5)SG&A expenses....................................................... 177,046 176,581 177,621 43,396 43,175 0.3 (0.3) 0.6 (0.5)Operating income or (loss)....................................... 178,034 240,561 158,481 33,229 1,684 (11.0) 35.1 (34.1) (94.9)Capital expenditures................................................. 54,169 83,315 126,256 20,975 17,026 133.1 53.8 51.5 (18.8)Unit COGS................................................................ $598 $589 $581 $595 $606 (2.9) (1.5) (1.4) 1.9Unit SG&A expenses................................................ $28 $26 $26 $28 $27 (7.2) (7.8) 0.6 (4.8)Unit operating income or (loss)................................ $28 $36 $23 $22 $1 (17.7) 24.9 (34.1) (95.1)COGS/sales (fn1)..................................................... 91.3 90.5 92.1 92.3 95.6 0.8 (0.8) 1.6 3.3Operating income or (loss)/sales (fn1)..................... 4.3 5.5 3.7 3.3 0.2 (0.6) 1.1 (1.8) (3.2)

D‐1
APPENDIX D
DOMESTIC LIKE PRODUCT ISSUES AND INFORMATION ON DEFORMED STEEL WIRE


D‐3
The Commission’s decision regarding the appropriate domestic product(s) that are “like” the subject imported product is based on a number of factors including: (1) physical characteristics and uses; (2) common manufacturing facilities and production employees; (3) interchangeability; (4) customer and producer perceptions; (5) channels of distribution; and (6) price. Information regarding these factors is discussed below.1
Physical characteristics and uses
Petitioner argues that deformed steel wire produced to meet ASTM A1064 that has bar markings and is subjected to an elongation test is a steel product that can be used for the same purpose as rebar—to reinforce concrete. Petitioner contends that such deformed steel wire has similar characteristics to rebar; both have markings (deformations) indicating the mill, size, and grade of the rebar.2 Deacero argues that although both rebar and deformed steel wire can be used to reinforce concrete, they differ significantly in terms of their physical characteristics and uses. Deacero contends that deformed steel wire is more appropriately used to manufacture wire products, such as wire mesh, wire reinforcement mats, and other shapes.3 D‐1 presents the information provided by U.S. producers and purchasers on the comparison of the physical characteristics and uses of rebar and deformed steel wire.
Table D-1 Rebar and deformed steel wire: Comparison of physical characteristics and uses
* * * * * * *
Manufacturing facilities and production employees
Petitioner argues that deformed steel wire produced to ASTM A1064 that has bar markings and is subjected to the elongation test can be manufactured in the same facilities, have substantially similar production processes, and the same production employees. Petitioner states that ***.4 Deacero argues that deformed steel wire is manufactured using a different process and equipment than rebar. Deacero contends that whereas rebar is hot‐rolled
1 The Commission did not collect information from U.S. producers and purchasers on within‐scope deformed steel wire (i.e., meeting ASTM A1064 with bar markings and with being subject to an elongation test), but rather on a broader category of deformed steel wire (i.e., meeting ASTM A1064) because the Commission issued questionnaires prior to the adoption of Commerce’s amended scope. As a result, information provided by U.S. producers and purchasers concerns the broader category of deformed steel wire.
2 RTAC’s posthearing brief, Exh. 1, p. 52‐53. 3 Deacero’s prehearing brief, p. 4. 4 RTAC’s posthearing brief, Exh. 1, p. 52.

D‐4
from steel billet, deformed steel wire is cold‐rolled from wire rod.5 Table D‐2 presents the information provided by U.S. producers in their comparison of the manufacturing facilities, processes, and employees of rebar and deformed steel wire. ***. ***.
Table D-2 Rebar and deformed steel wire: Comparison of manufacturing facilities, processes, and employees
* * * * * * *
Interchangeability
Petitioner argues that deformed steel wire that meets ASTM A1064 that has bar markings and is subjected to an elongation test is interchangeable with rebar, as both can be used to reinforce concrete.6 Deacero argues that deformed steel wire is a limited substitute for rebar, and is only interchangeable with rebar in limited circumstances. Deacero contends that deformed steel wire cannot be used “as‐is” to substitute for rebar in those limited circumstances; rather, welded wire mesh, which is made from deformed steel wire, can substitute for rebar in those applications.7 Table D‐3 presents the information provided by U.S. producers and purchasers on the interchangeability of rebar and deformed steel wire.
Table D-3 Rebar and deformed steel wire: Assessment of interchangeability
* * * * * * *
Producer and customer perceptions
Petitioner argues that customers and producers perceive deformed steel wire that meets ASTM A1064 that has bar markings and is subjected to an elongation test, as rebar as similar products. Petitioner contends that this is evidenced from the fact that on its website, Mexico rebar producer Deacero advertises and sells such deformed steel wire as “Varilla,” which, when translated, means “rebar.”8 Deacero argues that deformed steel wire is not a substitute for rebar from the perspective of the consumer. Deacero contends that deformed steel wire and rebar are sold to different categories of customers and, due to their different price points and predominant uses, are not perceived by U.S. purchasers to be reasonably
5 Deacero’s posthearing brief, p. 59. 6 RTAC’s posthearing brief, Exh. 1, p. 53. 7 Deacero’s prehearing brief, pp. 6‐7. 8 RTAC’s posthearing brief, Exh. 1, p. 53.

D‐5
interchangeable products.9 Table D‐4 presents the information provided by U.S. producers and purchasers on producer and customer perceptions of rebar and deformed steel wire.
Table D-4 Rebar and deformed steel wire: Assessment of producer and customer perceptions
* * * * * * *
Channels of distribution
Petitioner argues that deformed steel wire that meets ASTM A1064 that has bar markings and that is subjected to an elongation test when sold for use as rebar will likely be sold in the same channels of distribution as rebar.10 Deacero argues that deformed steel wire and rebar generally utilize different channels of distribution. Deacero argues that rebar is sold principally to steel wholesalers and construction contractors, whereas deformed steel wire is sold directly to companies that manufacture welded wire reinforcement products.11 Table D‐5 presents the information provided by U.S. producers and purchasers on the channels of distribution of rebar and deformed steel wire. U.S. producers of deformed steel wire reported that *** percent of their U.S. shipments were to end users (e.g., wire mesh producers) during the 2011‐2013 and January‐March 2014 periods.12 U.S. producers of rebar reported that 18.7‐20.3 percent of their U.S. shipments were to distributors, 27.8‐29.2 percent of their U.S. shipments were to end users, and 51.8‐52.2 percent of U.S. shipments were to firms that are both distributors and end users.13
Table D-5 Rebar and deformed steel wire: Comparison of channels of distribution
* * * * * * *
Price
Petitioner argues that deformed steel wire that meets ASTM A1064 and that has bar markings and that is subjected to an elongation test may be slightly more expensive to produce than rebar due to the additional processing involved in production.14 Deacero argues that
9 Deacero’s prehearing brief, p. 8. 10 RTAC’s posthearing brief, Exh. 1, p. 53. 11 Deacero’s prehearing brief, p. 8. 12 For summary data on deformed steel wire, see app. C. 13 For more information on channels of distribution, see Part II. 14 RTAC’s posthearing brief, Exh.1, p. 54.

D‐6
deformed steel wire is considerably more expensive than rebar, due to the more extensive production process required for deformed steel wire.15 Table D‐6 presents the information provided by U.S. producers and purchasers on the price of rebar and deformed steel wire. Table D‐7 presents the unit values of domestic producers’ U.S. shipments of rebar and deformed steel wire. The average unit values of deformed steel wire were *** than unit values of domestic producers’ U.S. shipments of rebar during 2011‐13 and January‐March 2014.
Table D-6 Rebar and deformed steel wire: Comparison of prices
* * * * * * * Table D-7 Rebar and deformed steel wire: Unit values of domestic producers’ U.S. shipments of rebar and deformed steel wire, 2011-2013, January-March 2013, and January-March 2014
Item Calendar year January to March
2011 2012 2013 2013 2014 Unit Value (dollars per short ton) Rebar $656 $649 $626 $644 $635Deformed steel wire *** *** *** *** *** Source: Compiled from data submitted in response to Commission questionnaires.
15 Deacero’s prehearing brief, p. 9.

E-1
APPENDIX E
U.S. PRODUCERS’ COMMERCIAL AND TRANSFER SALES: AVERAGE PER SHORT TON VALUE


E-3
Table E-1 Rebar: Results of operations of U.S. firms, by firm, 2011-13, January-March 2013, and January-March 2014
* * * * * * *
