steady mixing. -...
TRANSCRIPT
PULMONARYDIFFUSING CAPACITY: A COMPARISONOFBREATH-HOLDINGAND STEADYSTATE METHODS
USING CARBONMONOXIDE
By G. H. APTHORP* AND R. MARSHALLt
(From the Medical Unit, St. Bartholomew's Hospital, London, England)
(Submitted for publication November 11, 1960; accepted May 12, 1960)
Three methods are in current use for measur-ing the diffusing capacity of the lungs for carbonmonoxide (DL). Two of these are steady statemethods, and they differ in the methods used tocalculate the mean alveolar carbon monoxide ten-sion. Filley, MacIntosh and Wright (1) calcu-late the alveolar Pco indirectly, assuming thephysiological dead space for carbon dioxide to bethe same as that for carbon monoxide, while Bates,Boucot and Dormer (2) use the end-tidal Pco asthe mean alveolar Pco. The third method is thesingle breath method of Krogh and Krogh (3)as modified by Ogilvie, Forster, Blakemore andMorton (4). Each method in theory measuresthe total resistance to gas diffusion offered bythe structures that lie between the gas in thealveoli and the hemoglobin within the red cellsof the pulmonary capillaries. The results ob-tained by each method differ in normal subjects;and in disease states, such as emphysema, thedifferences may be great. While the differentresults obtained in similar subjects by the twosteady state methods can largely be explained bythe different methods of estimating the meanalveolar Pco (5), the breath-holding method con-sistently gives higher results than either of thesteady state methods (6). Marshall (7) has re-cently compared the breath-holding method ofmeasuring DL with a steady state method, usingend-tidal samples in a small group of normal sub-jects and patients with emphysema. He foundthat, while in normal subjects the end-tidal sam-ple satisfactorily reflected the mean alveolar Pco,in emphysema with impaired intrapulmonary gasmixing, the end-tidal sample overestimates themean alveolar Pco and therefore gives falsely lowresults for the diffusing capacity. These results
* Cattlin and Cooper Research Scholar, St. Bartholo-mew's Hospital.
t Present address: Nuffield Department of Surgery,Radcliffe Infirmary, Oxford.
throw doubt on the validity of the end-tidal steadystate method of measuring diffusing capacity insubjects with other cardiopulmonary diseases whoalso have impaired pulmonary gas mixing.
The present study was made 1) to comparethe single breath and steady state methods in alarge group of subjects with widely varying intra-pulmonary gas mixing; and 2) since abnormali-ties of intrapulmonary gas mixing cannot explainthe differences that occur between the two meth-ods in normal subjects, a study was made of thevariations in the type of breathing which mightinfluence the results of the steady state methodin normal subjects.
METHODS
The steady state method used was that of Bates andco-workers (2) but the apparatus was modified in anumber of details. The valve assembly consisted of singleinspiratory and expiratory valves set in 2.5 cm-boremetal tubing in order to reduce the dead space andallow end-tidal samples to be obtained with smaller tidalvolumes than were possible with the original apparatus.An automatic end-tidal sampler, triggered by a changein pressure at the mouthpiece, snatched a 35 ml sampleat the end of each breath. During the test the subjectbreathed 0.125 per cent carbon monoxide in air; 1.5 min-utes was allowed for the subject to reach a steady stateand the expired gas was collected for a further 2 minutesduring which time end-tidal samples were taken. TheCO concentration in the inspired, mixed expired andend-tidal samples was measured by an infrared analyzer.Oxygen and carbon dioxide in the expired gas weremeasured by the Haldane method.
The pulmonary capillary carbon monoxide tension can-not be ignored in the steady state method. Subjects witha normal or high diffusing capacity have a considerableincrease in blood carbon monoxide during the test, andunless this is allowed for, it may lower the calculateddiffusing capacity by as much as 20 per cent (8). Non-smokers were assumed to have a negligible level of bloodCO initially, and measurements of the pulmonary capil-lary blood CO tension were made only after the tests.In smokers the measurements were made both- beforeand after. We used a modification of the method of
1775

7G. H. APTHORPAND R. MARSHALL
Sj6strand (9) which has been (lescried(l elsewhere (10).The subject breathed oxygen for 3 minutes from an opencircuit to wash out the nitrogen from the lungs. Hethen took a deep breath in and exhaled through a sodalime canister into an empty rubber bag from which herebreathed for a further 3 minutes. The content of thebag was then analyzed for carbon dioxide, oxygen andcarbon monoxide. The carbon monoxide tension of theblood, at the oxygen tension in the lungs during thetest, was then calculated from the carbon monoxide andoxygen tensions in the rebreathing bag by the methoddescribed by Forster and co-workers (11). The steadystate DL is calculated from the equation:
DL =ml COtaken up in 1 inuinite(ETco - PBco) X (B - 47)
where ETco is the fraction of CO in the end-tidal sam-ple, B is the atmospheric pressure in mmHg, and PBcois the calculated fraction of CO in equilibrium with thepulmonary capillary blood; i.e., CO% in equilibratedbag X calculated end-tidal 02%/02% in equilibrated bag.
The measurements on patients at rest, for reasons ex-plained below, were made with the patient hyperventi-lating to maintain a tidal volume of at least 600 ml(STPD) and a respiratory rate of over 12 per minute.Subjects with tidal volumes or respiratory rates belowthese limits were excluded from the series. Measure-ments were made on exercise with the subjects walkingon a motor-driven treadmill at a speed to cause moderatedyspnea.
The single breath method used was that described byOgilvie and colleagues (4). An inspired mixture con-taining 14 per cent helium, 0.125 per cent carbon monox-ide, 20 per cent oxygen and the remainder nitrogen wasused. The back pressure of CO in the blood was calcu-lated as for the steady state method. Two estimationsof DL were made, with a few minutes between each,and the mean of the two results taken.
Lung volumes and intra pulmonary gas mixing weremeasured by the helium closed-circuit technique withthe apparatus described by Bates and Christie (12).The normal limits of the mixing efficiency index by thismethod are considered to be 50 to 100 per cent.
Subjects and procedure. The normal subjects weremedical students and laboratory staff. All patients at-tending the laboratory for pulmonary function testsduring the period of the study are included in the series;16 normal subjects and 125 patients with cardiopulmonarydisease were studied. The order of investigation follows:1) the lung volumes and intrapulmonary gas mixing weremeasured; 2) the basal level of CO in the blood wasmeasured in smokers; 3) two estimations of the singlebreath DL were made; 4) the CO in the blood was againmeasured; 5) the steady state DL was measured at rest(during this estimation the tidal volume was recordedby a low resistance dry-gas meter on the inspiratory sideof the circuit so that tidal volume was immediately readoff and the patient was encouraged to increase his tidalvolume to about one-third of his vital capacity) ; 6) the
steady state Di, was measured during exercise; 7) theCO in the blood was again measured.
The steady state DL was also measured in 3 normalsubjects at varying tidal volumes both at rest and onexercise and in 4 of the subjects at varying respiratoryrates at rest. All volumes are recorded at STPD.
RESULTS
The relationiship of steady state DL, ventilation.and exercise in normal subjects. The steady stateDL was measured in three normal subjects whobreathed at a fixed rate of 12 breaths per minuteto a metronome and varied their tidal volumes.The results in all three subjects were similar,and detailed results in Subject GHAat rest areshown in Figure 1. In this subject the steady
24
cis 20
EI-J
C
0
X 3 4US
.O
Tidal Volume(L)
FIG. 1. EFFECT OF TIDAL VOLUMEON STEADY STATE DL,END-TIDAL COS, AND CO UPTAKE; SUBJECT GHA.Steady state DL measured at a constant respiratory rateof 12 per minute and varying tidal volume. The lowergraph shows the steady rise in the volume of CO takenup as the tidal volume increases. The middle graphshows the rise of end-tidal CO as the tidal volume de-creases. The rise in CO%oat low tidal volumes is dueto contamination with dead space gas (COo of deadspace = inspired CO%o 0.125% CO). The quotient ofthese two, the steady state DL, shows a rapid rise untila tidal volume of about 1 L is reached and after that aslowly rising plateau.
1776

1777PULMONARYDIFFUSING CAPACITY
35
3C
Ja 25
_ dw 20
Is&
'0 U
O-P 10U)'
51
X Exercise3A
Rest
0.5 10 I-5 202ISTidalJ lume
3:0 3.5 4-0
FIG. 2. THE EFFECT OF TIDAL VOLUMEON STEADY STATE
DL AT REST AND DURING EXERCISE; SUBJECT GHA.Steady state DL at rest and during steady exercise (3mph) on treadmill. The subject was breathing at a
steady 12 breaths per minute and varying tidal volume.
state DL rose rapidly to reach 15 ml per minuteper mmHg at a tidal volume of 600 ml; there-after there was a more gradual rise in DL as thealveolar ventilation increased, and at a tidal vol-ume of 3,700 ml the DL was 23 ml per minute per
mmHg. The volume of COtaken up per minuteincreased from 2 ml per minute when the tidalvolume was a few hundred ml to about 9 ml per
minute at the greatest tidal volume. The increasein end-tidal CO per cent and the fall in DL at
low tidal volumes are due to contamination of theend-tidal sample with dead space carbon monox-
ide. From the results of these experiments it
was concluded that a tidal volume of 600 ml was
the minimum necessary for end-tidal sampling,and the steady state DL varied with the alveolarvolume or alveolar ventilation at which it was
measured.A similar rise of DL with increasing tidal vol-
ume was also found during exercise. Two sub-j ects exercised at a steady speed of 3 mph andagain breathed to a metronome at 12 breaths per
minute. The results in two subjects (GHA andRM) were very similar and Figure 2 shows theresults in Subject GHA. The most comfortabletidal volume at this respiratory rate was about0.5 L at rest and about 2 L on exercise. Thedifference between DL measured during quietbreathing at rest (DL = 15 ml/min/mm Hg witha tidal volume of 0.5 L) and that on exercise(DL = 27 ml/min/mm Hg with a tidal volumeof 2.0 L) is 12 ml per minute per mmHg. Ofthis increase, 5 ml per minute per mmHg can
be produced at rest by increasing the tidal volumeto 2.0 L; the other 7 ml per minute per mmHgis presumably the result of exercise.
In a second series of experiments nine normalsubjects were examined, and both the steady stateand single breath DL measured. The steady stateDL was measured at rest during "quiet" breath-ing, during hyperventilation at the same respira-tory rate (11 per minute) and during exercise.The tidal volume during the "quiet" respirationwas at least 600 ml, and during hyperventilationit was as deep as possible. During exercise thesubject breathed at his most comfortable rate and
TABLE I
Comparison of steady state DL measured during quiet breathing and hyperventilation with single breath DL in9 normal subjects all breathing at rest to a metronome set at 11 breaths per minute *
Steady state DL FractionSteady state DL
XA. Quiet breathing B. Hyperventilation C. ExerciseSingle Single breath DL
Vital breath Resp. Resp. Resp.Subject Age Sex SA capacity DL VT rate DL VT rate DL Speed VT rate DL A B C
mn2 inl mphRM 34 M 1.95 4,540 34.7 865 10 22.0 2,510 10 29.0 3.5 1,060 21 32.6 0.64 0.84 0.94GHA 34 M 1.95 4,300 31.0 660 10 17.1 3,500 12 24.0 3 1,045 17 31.4 0.55 0.78 1.01JSM 22 M 1.65 3,468 36.2 1,738 10 33.0 3 760 24 42.6 0.91 1.18RDW 25 M 2.31 5,730 28.9 1,052 10 20.0 2,995 10.5 32.3 3 1,705 14 34.0 0.69 1.12 1.18CPR 21 M 1.93 5,875 56.0 795 12.5 32.6 3,450 10 53.7 3 1,540 16 46.0 0.58 0.96 0.82JAW 20 F 1.61 3,275 29.2 640 12 20.3 1,880 12 24.5 2.5 757 15 25.4 0.70 0.84 0.87MEU 33 F 1.74 3,500 27.5 993 11 19.0 1,918 11 27.3 2.5 1,520 14 35.7 0.69 0.99 1.31MC 22 F 1.50 2,900 24.0 1,070 11 23.1 1.921 11 27.0 3 1,420 9.0 37.0 0.96 1.13 1.54PJB 32 M 1.97 4,500 34.0 505 13 26.8 1,766 11 32.4 3 1.382 14 43.6 0.79 0.95 1.28
Meanfigures 27 1.85 4,220 33.5 822 11 22.6 2,330 10.7 32.0 3 1,243 16 36.5 0.70 0.95 1.1
* SA =surface area in square meters; VT =tidal volume in ml; reap. rate =respiratory rate; A =during quiet breathing at rest; B =duringhyperventilation at rest; C =during exercise. All volumes measured STPD.

G. H. APTHORPAND R. MARSHALL
TABLE II
The effect of increase in respiratory rate at constant tidal volume on steady state DL
Surface Tidal Minute SteadySubject Sex Age area Respirations volume volume state DL
M2 rate/min ml L/min nml CO/minimmHg
RM M 34 1.95 10 865 8.6 22.020.6 850 17.5 22.5 a26.3 850 22.4 20.0
GHA M 34 1.95 9.5 2,150 20.2 33.015.0 2,500 37.6 25.025.5 2,060 52.6 25.3
RW M 26 2.30 8.0 2,290 17.7 52.017.4 2,170 37.8 46.024.3 2,270 55.1 45.0
MH F 30 1.69 10.2 1,100 11.2 22.218.6 1,270 23.6 17.331.4 1,260 39.5 18.9
tidal volume. The results of the experiments areshown in Table I. A rise in the steady state DLoccurred in all subjects during hyperventilation,and during hyperventilation the steady state DLand the single breath DL became approximatelyequal. During quiet breathing the mean steady
60
55
50
45
£ V,
mu
I
40
35
30
25
state DL was 70 per cent of the mean single breathDL, while during hyperventilation at the samerespiratory rate the steady state DL was 95 percent of the single breath DL. The steady state
60
5s
* Patientsx Normal Subjects 50
45
F
-i
C.5' Ecpna
*0
I. I
20
Is'
15
40
35
30
25]
20
Is
go
'75%
5 o0 is 20 2S 30 35
Steady State DL tesiung)
40
5 10 IS 20 25 30 3S 40
Steady State DL (Resting)
(mLC0/mlL/mnmHg)
FIG. 3. STEADY STATE DL PLOTTED AGAINST SINGLE
BREATH DL IN SUBJECTS WITH NORMALINTRAPULMONARYGAS MIXING. Mean relationship 75%.
(mLCO/mIf/mlnm
FIG. 4. STEADY STATE DL PLOTTED AGAINST SINGLEBREATH DL IN PATIENTS WITH IMPAIRED MIXING BUTEXCLUDING THOSE WITH EMPHYSEMA. The line indicat-ing the 75% relationship which exists in normal subjectsis shown for comparison.
1778
.
.
.
PULMONARYDIFFUSING CAPACITY
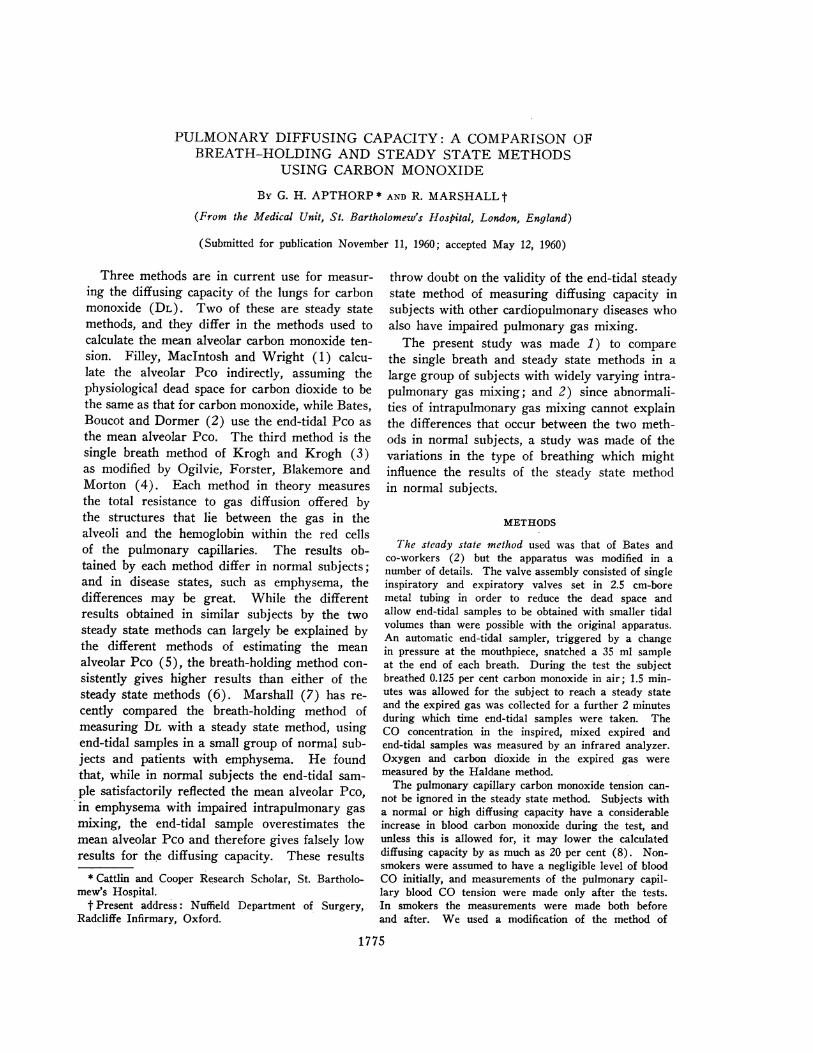
TABLE III
The relationship between steady state DL and single breath DL in subje;ts with a normal mixing cificienty,patients with impaired mixing but no emphysema, and patients with emphysema
FractionHelium Steady state DL Meanmixing oxygenindex Mean Single breath DL Mean consumption
within helium rate of duringGroup Subjects range mixing Resting Exercise exercise exercise
no. % % mph mt/min1. Normal subjects 16 50-100 83 0.72l 2.9 1,050
Patients with normal '0.75 1.09mixing 74 50-100 71 -0.74J 2.0 913
2. Patients with impairedmixing but no evidence 26 0-49 36 0.66 0.91 1.7 766of emphysema
3. Emphysema 25 0-49 29 0.34 0.41 0.8 714
DL on exercise was higher than during hyper-ventilation at rest in all but one case.
In four subjects the steady state DL was meas-ured at a steady tidal volume and varying res-piratory rates. The diffusing capacity was notrelated to the rate of breathing or the minutevolume. The results are summarized in Table II.
A comparison of steady state and single breathmethods in patients with cardiac or pulmonarydisease. The 125 patients and 16 normal sub-jects were divided into three groups.
Group 1, subjects with a mixing efficiency of 50per cent or more: 16 normal subjects and 74patients.
Group 2, subjects, excluding those with chronicobstructive emphysema, whose mixing efficiencywas below 50 per cent: 26 patients.
Group 3, subjects with a clinical diagnosis ofchronic obstructive emphysema: 25 patients, allwith a mixing efficiency of less than 50 per cent.
The details of the composition of each groupand the mean figure for intrapulmonary gas mix-ing are shown in Table III, together with themean oxygen consumption at rest and duringexercise, and also the rate of exercise. Groups1 and 2 were largely composed of patients withrheumatic heart disease, congenital heart diseaseand sarcoidosis but included some patients withthyrotoxicosis and some with asthma. The lowestDL'S were recorded in patients with emphysemaor with alveolar-capillary block syndrome (13)due to sarcoidosis, metastatic carcinoma or idi-opathic pulmonary fibrosis. The highest figureswere obtained in patients with congenital heart
disease with increased pulmonary blood flow.Most of these patients had atrial septal defectswith left to right shunts. All the patients ingroup 3 suffered from chronic obstructive emphy-sema. The diagnosis was made on the clinicaland radiological findings before they were referredfor respiratory function studies.
so
45
.J a
.C dE
o 8cjC1,
40
35
is
IC
* 0
.0/
S 10 1i5 20 25 30
Steady State DL (Resting)(ml.CO/min./m reH)
35 40
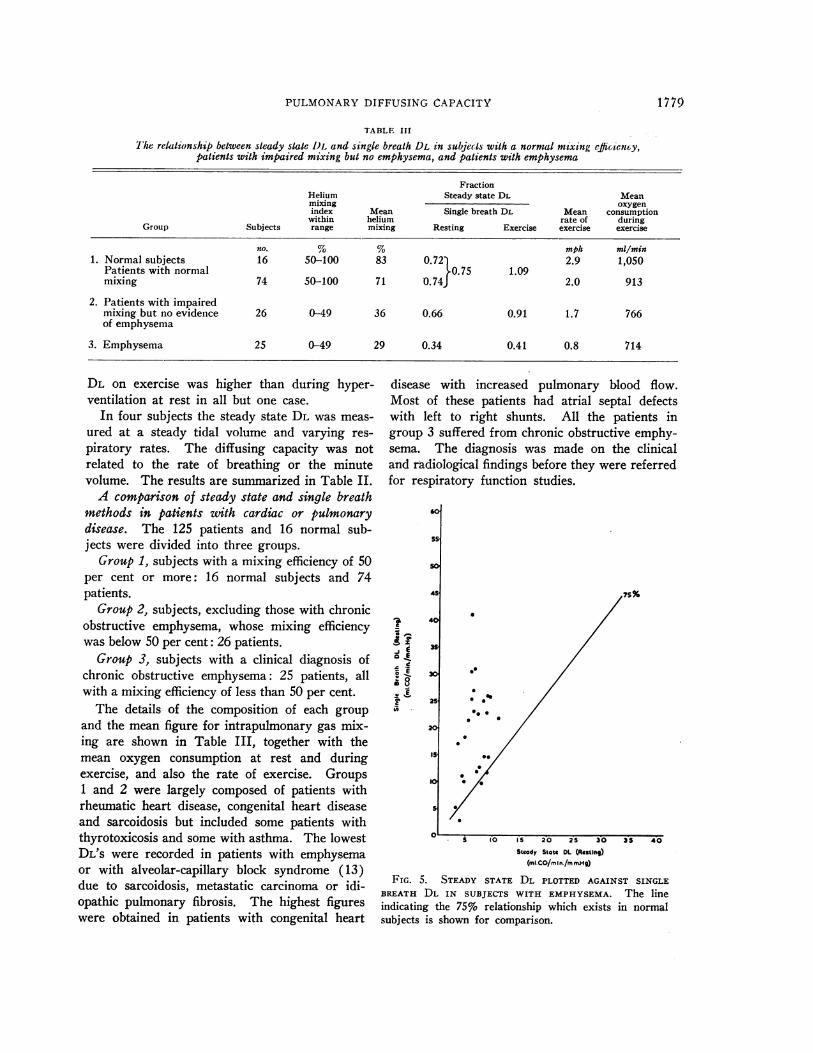
FIG. 5. STEADY STATE DL PLOTTED AGAINST SINGLEBREATH DL IN SUBJECTS WITH EMPHYSEMA. The lineindicating the 75% relationship which exists in normalsubjects is shown for comparison.
1779
.
* /11
.

G. H. APTHORPAND R. MARSHALL
The single breath Di, was plotted against thesteady state DL separately in each group, anldthe results at rest are shown in Figures 3, 4 and 5,and during exercise in Figures 6 and 7. Thescale is identical in each case. The relationshipbetween the two measurements of DL was calcu-lated by the method of least squares. Figure 3shows the results in group 1, which was composedof all subjects with normal intrapulmonary gasmixing. The steady state figure was 78 per centof the single breath figure for the group of 16normal subjects, and 74 per cent for the 74 pa-tients with normal intrapulmonary gas mixing.The mean figure for the whole group was 75 percent. In group 2, which includes all patientswith impaired intrapulmonary gas mixing, butwith no clinical evidence of emphysema, the meansteady state DL was 66 per cent of the singlebreath DL (Figure 4).
The mean pulmonary gas mixing index ofgroup 3 (29 per cent) is comparable with thatof group 2 (36 per cent), but in group 3 thesingle breath and steady state methods give re-sults that bear no relationship to each other (Fig-ure 5). All the patients with emphysema showeda steady state DL below 10 ml per minute permmHg, while the corresponding single breath DLvaries between 3 and 42 ml per minute per mmHg. The finding that patients with clinical em-physema have a steady state DL below 10 ml perminute per mmHg is in agreement with the re-sults of Bates, Knott and Christie (14) who usedthe same method.
DISCUSSION
A rise in steady state DL was found when nor-mal subjects hyperventilated. This is in linewith previous reported work. Ross, Frayser andHickam (15) and Turino, Brandfonbrener andFishman (16) using the Filley method, and Mac-Namara, Prime and Sinclair (17) using the Batesmethod of measuring the steady state DL, all founda rise in DL when subjects hyperventilated. Inthis series, when normal subjects hyperventilatedby progressively increasing their tidal volumewhile keeping the respiratory rate unchanged, aprogressive rise in DL occurred (Figure 1); butwhen the subjects hyperventilated by progressivelyincreasing the respiratory rate while keeping thetidal volume steady, no rise in DL occurred (Table
so
-_E
-0
0 t
cI
20
Is
10
S~
x Normal Sujbsois 0
94%
x/x
*x/
|X x x
*.ok*MSx
*00> 0 X
5 10 IS 20 25 30 35 40 45
Steady State DL (Exeecise)
(mnLCO/mmn./metehg)
0O
FIG. 6. STEADY STATE DL DURING EXERCISE PLOTTED
AGAINST THE RESTING SINGLE BREATH READING. Meanrelationship 94%,. The graph contains all subjects exceptthose with emphysema.
II). This suggests that the DL varies with thealveolar volume at which it is measured ratherthan with the alveolar ventilation.
There seems little doubt that DL measured bythe single breath method also varies with thealveolar volume. Although Ogilvie and colleagues(4) found DL varied little at different alveolarvolumes, Marks, Cugell, Cadigan and Gaensler(6) and Shephard (18) found DL at full inspira-tion to be up to 50 per cent greater than DLmeasured at the functional residual capacity, whileMcGrath and Thomson (19), under similar cir-cumstances, found a mean increase in DL of 31per cent in eight normal subjects. In a previousstudy Marshall (7) measured the single breathDL at varying alveolar volumes and showed thatDL decreased in such a way that, when the breathwas held at the functional residual volume, thesingle breath DL became approximately equal tothe steady state DL using end-tidal samples.
In this series there was good agreement betweenthe resting steady state DL measured at maximaltidal volume and the resting single breath DL(Table I). These findings suggest that there is nofundamental difference between the two methodsin normal subjects. The increase in DL on hyper-
1780)
30
2S

PULMONARYDIFFUSING CAPACITY
ventilation may be due to an increase in the pul-monary capillary blood volume in association withan increased alveolar gas volume and, therefore,a larger blood gas interface. This suggests thatthe resting single breath DL measured at maximalinspiration and the resting steady state DL meas-ured on maximal hyperventilation are equal, andboth reflect the maximal diffusing capacity of thelungs for carbon monoxide in the resting subject.
The steady state DL on exercise was higherthan the hyperventilation DL in all but one sub-ject, and higher than the single breath DL in sixof the nine subjects. Although the exercise DLobtained in these subjects was not usually equaledduring hyperventilation or when measured by thesingle breath method, the mean exercise DL wasonly 11 per cent greater than the resting singlebreath DL. Ross (15), and Turino (16), andtheir associates made observations at rest andduring exercise, using the Filley method. Theyshowed that in the series as a whole, the increasein DL on exercise was no greater than that pro-duced by an equivalent degree of hyperventilationat rest. In the present study, repeated measure-ments on three subjects (the results on one of
60
so
la 40
la
E 35E
Ci~m y
c0 25-ni
10
5 I0 IS 20 25 30 35 40 45 So
Steady State DL (Exerc se)(ml.C0/#min./mm nHg)
FIG. 7. STEADY STATE DL DURING EXERCISE PLOTTED
AGAINST THE RESTING SINGLE BREATH DL IN 12 CASESOF EMPHYSEMA. The line indicating the 94% relation-ship which existed in all other subjects is shown forcomparison.
whom are shown in Figure 1) have shown thatexercise produces an increase in DL, measured bythe steady state method, which is greater thanthat which can be accounted for by the hyper-ventilation alone. This is in keeping with thefindings of MacNamara and co-workers (17) whoalso used the Bates method of measuring DL.
The diffusing capacity is not a constant butvaries with the alveolar volume at which it ismeasured, and it is clearly important to controlthe tidal volume at which DL is measured if theresults are not to be misleading. In this contextthe single breath method has the advantage thatthe alveolar volume at which it is measured iseasily fixed at maximal inspiration, while hyper-ventilation in the untrained subject at rest mayresult in irregular tidal volumes and an unreliablefigure for DL. Measurement of the steady stateDL during exercise overcomes this difficulty, butthe result must then be related to the rate ofwork (2) or oxygen consumption (20) and func-tional residual volume (2) or surface area.
The general relationship between the steadystate and single breath DL ill this series of 141subjects is similar to that obtained by Marks andco-workers (6) who found the Filley steady statemethod gave results about two-thirds of the singlebreath DL.
The patients in group 1, with cardiac or respira-tory disease but normal intrapulmonary gas mix-ing, behaved similarly to the normal subjects, thesteady state DL being equal to approximately 75per cent of the single breath DL (Figure 3).
The difference in the ratio of steady state DLto single breath DL in group 1 (74 per cent) com-pared with group 2 (66 per cent) may be due toa number of factors. Patients in group 2 weremore incapacitated than those in group 1 (TableIII) and breathed at a smaller tidal volume.Borderline cases such as one with severe per-sistent asthma and widespread cystic bronchiecta-sis (steady state DL 4.6, single breath DL 18 mlCO/min/mm Hg) were included in group 2rather than 3. In addition, it is likely that inthe presence of impaired intrapulmonary gas mix-ing the steady state DL is too low because of end-tidal sampling errors. This point is discussedfurther below, but the maximal effect of inaccu-rate end-tidal sampling in group 2 is to lower thesteady state Dr, by only 10 per cent,
1781
20

G. H. APTHORPAND R. MARSHALL
The difference in the ratio of DL calculated bythe two methods in group 2 (patients with im-paired intrapulmonary gas mixing) and group 3(patients with emphysema) is more interesting.Although the helium mixing index is similar inboth groups, the steady state and single breathDL bear no relation to each other in patients withemphysema. The reasons for this may be:
1. The single breath DL is too high in thesepatients. The single breath DL is calculated fromthe alveolar volume obtained by adding the in-spired volume to the residual volume measured bythe helium equilibration technique. In patientswith unequal gas mixing this volume (Veq) isgreater than that calculated from the dilution ofhelium inspired in the single breath test (Vsb).The alveolar volume Vs1, is only an approximatemeasure of the volume ventilated by the singlebreath, because the expired sample collected may
not represent the mean helium concentration in
the lungs; the highest concentrations of heliumare discarded with the dead space gas, and theless well ventilated parts of the lungs contributeonly a small volume of the collected sample. Inpractice, the single breath DL calculated from Vbis reduced to 95 per cent of the normally calcu-lated single breath DL in patients in group 2.The patients with emphysema (group 3) have a
mean single breath DL calculated from Vsb whichis 70 per cent of the normal single breath DL.Even when this reduced single breath DL is takeninto consideration, there is no relationship be-tween the single breath and steady state DL ingroup 3.
A further possible cause of error, giving falselyhigh results by the single breath method in pa-
tients with emphysema, lies in the length of timetaken to collect the alveolar sample. In this seriesthe breath-holding time was measured from thebeginning of inspiration to the start of samplecollection (4). By recalculating DL, using "ef-fective breath-holding time" as suggested by Jonesand Meade (21)-namely, from the beginning ofinspiration to the endpoint of sample collection,less 3/10 of inspiration time-DL dropped by an
average of 10 per cent, but there was still no
relationship between the single breath and steadystate methods in this group.
2. The steady state DL is too low. Marshall(7) has recently discussed the enid-tidal sampling
method of measuring DL in patients with emphy-sema. In emphysema, where no clear divisionexists between dead space and alveolar gas, theend-tidal samples contain more COthan the meanconcentration of CO in the lungs. The steadystate method using end-tidal samples thereforegives falsely low figures for the over-all diffusingcapacity of the lung. Bates (22) believes thesteady state method with end-tidal sampling re-flects the diffusing capacity of the predominantlyventilated portion of the lung.
The most striking difference between groups 2and 3 is the lack of correlation between the singlebreath and steady state DL either at rest or onexercise in group 3. Although the mean mixingefficiency index of group 3 (29 per cent) is onlyslightly lower than that of group 2 (36 per cent),this index is not a sensitive measurement of gasmixing and the differences of gas distribution inthe two groups may be greater than that indi-cated by the mixing index figures. If the ratioVsb/Veq is used as a measure of mixing efficiency,a much greater difference is found between thetwo groups. A lower mixing efficiency in group 3than in group 2 would contribute to the lack ofcorrelation between the two methods in thesegroups.
3. The main cause of the differences betweengroups 2 and 3 is probably the inequality of ven-tilation and perfusion in the emphysematous lung.The volume of unperfused or underperfused lungof emphysema patients is increased, and this in-creased physiological dead space is ventilatedmainly by the tidal volume. When the DL ismeasured with normal tidal volumes, as in thesteady state method, a large proportion of thetidal volume will ventilate physiological deadspace and give a low DL. A previous study byMarshall (7) showed that the DL in emphysemawas uniform throughout most of a full expiration.The method was not capable of detecting changesin the first few hundred ml of alveolar gas air,and it is probable that the gas first expired, whichhas the highest ventilation-perfusion ratio, comesfrom regions of the lung with a low DL. Highvalues for the single breath DL with low valueslay the steady state method could occur when thepathological changes in the lungs are such thatthe most severely affected parts of the lung areventilated by the tidal volume and when the re-
1 782

PULMONARYDIFFUSING CAPACITY
mainder of the lung is less severely affected.When the emphysematous changes in the lungsare diffused throughout the lungs, both the singlebreath and steady state DL will be low.
It appears that in the absence of emphysemaeither method gives a satisfactory figure for DL.The difference between the results obtained by thetwo methods can largely be accounted for by thedifferent alveolar volume at which they are meas-ured, although impaired intrapulmonary gas mix-ing may lower the steady state result by approxi-mately 10 per cent.
In emphysema neither method measures DLsatisfactorily. The steady state method gives con-sistently low results for reasons discussed aboveand, although this makes the'steady state methoda useful test clinically, the results do not reflectthe true diffusing capacity of the lungs. Thesingle breath method gives results in emphysemawhich are often optimistic and which, althoughthey may be of value in investigating the physiol-ogy of the disease, are usually of little help in theassessment of disability.
SUMMARY
In 16 normal subjects and 125 patients withcardiac or respiratory disease, measurements ofthe diffusing capacity of the lungs for carbon mon-oxide (DL) were made by both the single breathand the steady state methods with end-tidal sam-ples as a measure of alveolar CO.
In 16 normal subjects at rest the steady stateDL was about 75 per cent of the single breath DL.The steady state DL increased with increasingtidal volume so that at maximal tidal volume thesteady state DL was approximately the same asthe single breath DL. The increase of DL onexercise was greater than could be accounted forby the increased ventilation on exercise. An in-crease of respiratory rate without an increase intidal volume did not increase DL.
The patients with cardiac or respiratory diseasewere considered in three groups. Group 1 (74patients with normal pulmonary gas mixing): thesteady state DL was 74 per cent of the single breathDL at rest. Group 2 (26 patients with impairedpulmonary gas mixing but no clinical evidence ofemphysema): the steady state DL was 66 per centof the single breath figure. The difference be-tween groups 1 and 2 may be due, in part, to the
errors in end-tidal sampling in patients with un-even pulmonary ventilation. Group 3 (25 patientswith--emphysema): there was no relationship be-tween the single breath and steady state DL. Thereasons for this are discussed.
ACKNOWLEDGMENTS
Weare grateful to Miss Jane Howard and Miss J. A.West for skilled technical assistance, Mr. R. E. Wallerfor statistical analysis of the results, and the physiciansof St. Bartholomew's Hospital for referring cases to us.
REFERENCES
1. Filley, G. F., MacIntosh, D. J., and Wright, G. W.Carbon monoxide uptake and pulmonary diffusingcapacity in normal subjects at rest and during exer-cise. J. din. Invest. 1954, 33, 530.
2. Bates, D. V., Boucot, N. G., and Dormer, A. E.The pulmonary diffusing capacity in normal sub-jects. J. Physiol. (Lond.) 1955, 129, 237.
3. Krogh, A., and Krogh, M. On the rate of diffusionof carbonic oxide into the lungs of man. Skand.Arch. Physiol. 1910, 23, 236.
4. Ogilvie, C. M., Forster, R. E., Blakemore, W. S.,and Morton, J. W. A standardized breath holdingtechnique for the clinical measurement of the dif-fusing capacity of the lung for carbon monoxide.J. dlin. Invest. 1957, 36, 1.
5. Forster, R. E. Exchange of gases between alveolarair and pulmonary capillary blood: Pulmonary dif-fusing capacity. Physiol. Rev. 1957, 37, 391.
6. Marks, A., Cugell, D. W., Cadigan, J. B., and Gaens-ler, E. A. Clinical determination of the diffusioncapacity of the lungs. Comparison of methods innormal subjects and patients with "alveolar-capil-lary block" syndrome. Amer. J. Med. 1957, 22, 51.
7. Marshall, R. A comparison of methods of measuringthe diffusing capacity of the lungs for carbon mon-oxide. Investigation by fractional analysis of thealveolar air. J. dlin. Invest. 1958, 37, 394.
8. Linderholm, H. On the significance of CO tensionin pulmonary capillary blood for determination ofpulmonary diffusing capacity with the steady stateCO method. Acta med. scand. 1957, 156, 413.
9. Sjdstrand, T. A method for the determination ofcarboxyhaemoglobin concentrations by analysis ofalveolar air. Acta physiol. scand. 1948, 16, 201.
10. Henderson, M., and Apthorp, G. H. A rapid methodfor the estimation of carbon monoxide in blood.Brit. med. J. 1960, 2, 1853.
11. Forster, R. E., Roughton, F. J. W., Cander, L.,Briscoe, W. A., and Kreuzer, F. Apparent pul-monary diffusing capacity for COat varying alveo-lar 02 tensions. J. appl. Physiol. 1957, 11, 277.
12. Bates, D. V., and Christie, R. V. Intrapulmonarymixing of helium in health and in emphysema.Clin. Sci. 1950, 9, 17.
1 783

G. H. APTHORPAND R. MARSHALL
13. Cournand, A. The syndrome of "alveolar-capillaryblock": Clinical, physiologic, pathologic and thera-peutic considerations. Proc. Roy. Coll. Phys. Surg.,Canada, 1952, pp. 3447.
14. Bates, D. V., Knott, J. M. S., and Christie, R. V.Respiratory function in emphysema in relation toprognosis. Quart. J. Med. 1956, 25, 137.
15. Ross, J. C., Frayser, R., and Hickam, J. B. A studyof the mechanism by which exercise increases thepulmonary diffusing capacity for carbon monoxide.J. clin. Invest. 1959, 38, 916.
16. Turino, G. M., Brandfonbrener, M., and Fishman,A. P. The effect of changes in ventilation andpulmonary blood flow on the diffusing capacity ofthe lungs. J. clin. Invest. 1959, 38, 1186.
17. MacNamara, J., Prime, F. J., and Sinclair, J. D.The increase in diffusing capacity of the lungs on
exercise: An experimental and clinical study.Lancet 1960, i, 404.
18. Shephard, R. J. "Breath-holding" measurement ofcarbon monoxide diffusing capacity. Comparisonof field test with steady-state and other methodsof measurement. J. Physiol. (Lond.) 1958, 141,408.
19. McGrath, M. W., and Thomson, M. L. Effect ofage, body size and lung volume change on alveolar-capillary permeability and diffusing capacity inman. J. Physiol. (Lond.) 1959, 146, 572.
20. Cugell, D. W., Marks, A., Ellicott, M. F., Badger,T. L., and Gaensler, E. A. Carbon monoxide dif-fusing capacity during steady exercise. Amer. Rev.Tuberc. 1956, 74, 317.
21. Jones, R. S., and Meade, F. Pulmonary diffusingcapacity: An improved single-breath method.Lancet 1960, i, 94.
22. Bates, D. V. The measurement of the pulmonarydiffusing capacity in the presence of lung disease.J. clin. Invest. 1958, 37, 591.
1784