stay active: the physical activity, ageing and health study stay active... · stay active: the...
TRANSCRIPT

Stay Active: the physical activity, ageing and health study Final Report A research project funded by the Centre for Ageing Research and Development in Ireland (CARDI) through a Data Mining 13 grant.
2014
CARDI and Mary Immaculate College

2
Compiled by
Dr. Elaine Murtagh (Mary Immaculate College),
Prof. Marie Murphy (University of Ulster), Dr.
Niamh Murphy (Waterford Institute of
Technology), Dr. Catherine Woods (Dublin City
University) and Dr. Aoife Lane (Waterford
Institute of Technology)
Suggested citation
EM Murtagh, MH Murphy, N Murphy, C Woods
and A Lane (2014) Stay Active – the physical
activity, ageing and health study. Final Report.
Mary Immaculate College and CARDI
Acknowledgement
The authors wish to acknowledge Dr. Jennifer
Joyce’s role as research assistant on this
project. The valuable feedback provided by
Paul McGill (CARDI) on an earlier version of this
report is also gratefully acknowledged.

3
Table of Contents
Table of Contents .................................................................................................................................... 3
Executive Summary ................................................................................................................................. 4
Project Details ......................................................................................................................................... 7
Literature Review .................................................................................................................................... 8
Physical activity levels ......................................................................................................................... 8
Correlates of regular participation in physical activity ....................................................................... 9
The association between physical activity level, walking and body mass index .............................. 10
The relationship between participation in physical activity and health status ................................ 10
The contribution of organised sport to recommended physical activity ......................................... 11
Methodology ......................................................................................................................................... 13
Data sources ...................................................................................................................................... 13
Data extraction & coding .................................................................................................................. 14
Statistical analysis ............................................................................................................................. 14
Findings ................................................................................................................................................. 16
Description of Participants ................................................................................................................ 16
Current physical activity levels of older adults ................................................................................. 17
Correlates of physical activity ........................................................................................................... 20
Association between walking, physical activity and body mass index ............................................. 23
Relationship between physical activity and health indicators.......................................................... 24
Sport Participation ............................................................................................................................ 26
What the project has added to existing knowledge ............................................................................. 28
Conference papers ............................................................................................................................ 29
Learning from the process of the research ........................................................................................... 30
Discussion / Relevance to policy & practice ......................................................................................... 31
Physical Activity Levels ...................................................................................................................... 31
Correlates of Physical Activity ........................................................................................................... 32
Association between walking, physical activity and body mass index ............................................. 33
Relationship between physical activity and health status ................................................................ 34
Sports Participation ........................................................................................................................... 35
Conclusions & Recommendations ........................................................................................................ 38
References ............................................................................................................................................ 39

4
Executive Summary
Introduction
The Stay Active study examines the relationship between physical activity participation and
health status in older adults in Ireland, North and South. Globally, we are experiencing a
rapid population expansion in the number of older adults. The increase in life expectancy
observed in the last century has forced policy makers to think laterally about strategies to
sustain quality of life and independence in this population demographic. Exercise has been
identified as one intervention strategy which promotes physical maintenance in advanced
age.
The Stay Active study uses data from five population surveys: The Irish Longitudinal Study
on Ageing, the Survey of Lifestyles Attitudes and Nutrition in Ireland, the Irish Sports
Monitor, the Health Survey Northern Ireland and the Northern Ireland Sport and Physical
Activity Survey. Quantitative data from 12,333 adults aged 60+ were included in the project.
Physical Activity levels
The National Guidelines on Physical Activity for Ireland (Department of Health and Children
& Health Service Executive, 2009) and the World Health Organization (2010) recommend
that older adults should engage in 150 minutes of moderately intense activity each week to
achieve both physical and cognitive health benefits. Although the proportion considered
compliant in the current study varied by survey the analysis suggests that only a minority of
older adults achieve current guidelines. Moreover in all surveys physical activity declined
with advancing age. Adults aged 75+ were 1.56 to 3.4 times less likely than 60-64 year olds
to meet physical activity guidelines, indicating that physical activity levels decline with age.
There was a similar finding for self-reported walking, with self-reported walking decreasing
with age, particularly among those aged 75 years or more.
Correlates of Physical Activity
Examination of these cross sectional datasets allows us to examine the factors associated
with physical activity, i.e. the correlates of physical activity. Understanding the correlates of
physical activity participation in older adults in Ireland can help in planning interventions
which are likely to be more effective at increasing physical activity.
Across the non sport specific surveys women reported lower levels of physical activity
across all ages and females displayed higher odds of being insufficiently active (ORs: 1.50-
1.99) than males. It also appeared that older people living in rural locations in Ireland were
more likely to meet the physical activity guidelines than those living in urban settings. A

5
clear relationship between socioeconomic status and meeting physical activity guidelines
among Irish older adults was not observed. Across all datasets except TILDA, low
socioeconomic status was associated with insufficient activity levels
Association between walking, physical activity and body mass index
Walking is a common, accessible, inexpensive form of physical activity and is an important
component of total physical activity in adult populations. A very weak association was
observed between total walking per week and weight status. When total physical activity
(walking plus all other activity) was considered, older adults who reported meeting the
current physical activity guidelines were consistently less likely to be obese. Results
demonstrated an inverse relationship between self-reported walking intensity and weight
status. Individuals who reported walking at higher intensity were less likely to be overweight
or obese.
Relationship between physical activity and health
Physical activity was consistently related to self-ratings of health; participants who had poor
perceptions of their health and ability to be active were much more likely not to meet
physical activity guidelines than those who had more favourable perceptions about their
health. Older adults who reported meeting the physical activity guidelines had significantly
lower BMI and waist circumference than those not meeting physical activity guidelines; but
the relative difference appeared quite small. There was little consistency across surveys for
the relationship between blood pressure, smoking and physical activity. Further
longitudinal research is needed.
Sports Participation
Just under one third (31.6%) of older adults in the Republic of Ireland (RoI) reported
participation in sport in the previous seven days compared to a 23.8% participation rate in
Northern Ireland. Participation decreased by 50% between the 60-64 and 75+ age groups in
Northern Ireland but remained relatively consistent across all age groups in the RoI cohort.
Participation rates were notably higher among older adults aged 65+ in RoI compared to
their counterparts in NI, while the mean time spent playing sport per week was also higher
in the RoI cohort.
Conclusion
The majority of older adults on the island of Ireland are insufficiently active. There is a need
for interventions focused on maintaining physical activity with advancing age and targeting
older females and those living in urban locations. Walking should form the cornerstone of
physical activity promotion strategies for older adults. Existing levels of sports participation
should be supported so that older adults maintain involvement in these activities. Care

6
should be taken when interpreting results of individual surveys given the range in findings
noted in this report.

7
Project Details
Title of project:
Stay Active – the physical activity, ageing, and health study
Project Aim:
The overall aim of this project is to examine the relationship between physical activity
participation and health status in older adults in Ireland, North and South.
Project objectives:
Specific objectives of the project were to:
Assess the current physical activity levels of older adults
Examine determinants and correlates of regular participation in physical activity, such as
socio economic status, educational attainment, living arrangements, ethnicity, and
geographical variables (e.g. access to public leisure facilities and green space;
urban/rural location)
Examine the association between physical activity level, walking volume, walking pace
and body mass index (a measure of weight status)
Quantify the relationship between regular participation in physical activity and
perceived health status
Examine the association between self reported physical activity participation and
objective measures of cardiovascular disease risk (blood pressure, waist:hip ratio, lipid
profile)
Assess the relative contribution of organised sport to recommended physical activity in
older adult populations

8
Literature Review
Physical activity levels
Ageing is synonymous with a progressive deterioration in physiological function and despite
exercise being a universally recognised and established component in the management of
many chronic diseases associated with ageing, physical activity participation levels tend to
progressively decline with increasing age (Batt et al., 2013), particularly after 65 years of age
when the decline is more pronounced (Hansen et al., 2012). Given the growing proportion
of older adults, these suboptimal levels of physical activity (PA) represent an increasing
public health problem.
Physical activity has been defined as any bodily movement produced by skeletal muscles
which results in energy expenditure (Nieman, 2003). The National Guidelines on Physical
Activity for Ireland recommend that older adults should engage in 150 minutes of
moderately intense activity each week, as well as activities which increase muscular
strength and balance on 2 – 3 days per week (Department of Health and Children & Health
Service Executive, 2009). There is ample evidence to support the participation in frequent
physical activity as a means to ameliorate age-associated physiological dysfunction, while
concurrently providing psychological and cognitive benefits (Nelson et al., 2007).
Despite extensive evidence of both the physical and psychological benefits derived from
regular activity (Vogel et al., 2009, Riechman et al., 2012, Nelson et al., 2007, Morgan et al.,
2011, CARDI, 2011), surveys conclude that older adults do not engage in sufficient physical
activity to accrue the associated health benefits. Results from a British Heart Foundation
survey (2012) reveal that only 27% of UK men aged 55-74 years of age meet the
recommended physical activity guidelines with adherence becoming more worrying for
males over the age of 75 years with only 12.5% participating in the recommended amount
of activity (Townsend et al., 2012). Female participation in recommended levels of physical
activity is even less promising with only 23% of females aged 55-74 meeting guidelines and
less than 8% getting sufficient physical activity over the age of 75 years.
Physical inactivity is a major determinant of poor health and according to the World Health
Organisation (World Health Organisation, 2003) is associated with risk of premature
mortality, coronary heart disease, hypertension, colon cancer, type 2 diabetes, osteoporosis
and weight gain. Exercise offers a potential mechanism to substantially reduce the burden
of disease and improve quality of life in older adults (Acree et al., 2006). Given their high
level of absolute risk for mortality and a range of health problems, sedentary older adults
have the potential to benefit more than any other sector of the population from increased

9
physical activity participation (Sims et al., 2006). Therefore, intervening to increase
participation in physical activity is an important strategy for maintaining functional status
and independence in this age group who will typically suffer increased levels of chronic
disease compared to younger adults.
Correlates of regular participation in physical activity
Knowledge on the factors that correlate with physical activity in older adults will
significantly enhance the development of effective interventions for promoting increased
physical activity participation in this demographic.
Research suggests that socioeconomic status (SES) is one such factor which can influence
physical activity participation. The inverse relationship between SES and unhealthy
behaviours such as physical inactivity has been well demonstrated empirically (Pampel et
al., 2010). However, researchers admit that this relationship is complex and not yet fully
understood (Chinn et al., 1999).
Findings from an ipsos MRBI study on physical activity and sports participation in a
representative sample of 1,002 people aged 50 years and over, published in 2012, indicated a
regional bias, with 48% of older people living in Dublin (city and county) participating in sport
or recreational physical activity (excluding walking), compared to 36% in Munster and 35%
in Connaught., at least once in the last four weeks. When asked about their satisfaction
about access to sporting facilities, there was a statistically significant difference depending
on where the respondents live, with lowest satisfaction levels amongst those living in open
country (56%) compared to those living in a city, including Dublin (67%). Those living in Dublin
were much more likely to have taken at least one walk of 30 minutes or more in the last
four weeks.
Research suggests that geographic variables such as location and access to leisure facilities
can have a profound impact on levels of participation in physical activity (Ipsos MRBI, 2012).
The unique importance of specific built environment factors has been highlighted in the
literature. In particular, facilities within a one kilometre distance from one’s residence are
positively correlated with objectively-measured physical activity and self-reported walking
(Sims et al., 2006). Emerging evidence confirms that access to aesthetically pleasing public
open spaces is conducive to higher rates of walking, implying that health gains can be
achieved by providing access to such environments (Giles-Corti, Broomhall et al. 2005).
A particularly salient issue in relation to the environment is that many rural communities on
the island of Ireland lack the infrastructure to support sport and leisure activities and
research has shown that participation in sporting activities by rural residents aged 65 years
and over is only 43% compared to 54% of urban dwellers of the same age (Walsh and Ward,

10
2013). Strong evidence exists which demonstrates that the creation or enhancement of
access to places for physical activity is effective in increasing levels of physical activity, as
measured by an increase in the percentage of people engaging in physical activity (Cavill et
al., 2006, Kahn et al., 2002). One of the seven “best investments for physical activity” relates
to urban design regulations and infrastructure that provide for equitable and safe access for
recreational physical activity, and recreational and transport-related walking and cycling
across the life course (Global Advocacy for Physical Activity (GAPA) the Advocacy Council of
the International Society for Physical Activity and Health (ISPAH), February 2011). These
environmental factors continue to be understudied relative to other determinants of
participation, however may have considerable effects on efforts to successfully adopt and
maintain regular physical activity in older adults, which could be particularly important for
the under-served rural communities
The association between physical activity level, walking and body mass index
According to the World health organisation (WHO), in 2008 35% of the global population
over the age of 20 was overweight, with 12% being obese (WHO, 2009). Overweight is an
independent risk factor for cardiovascular and pulmonary disease, diabetes, dyslipidemia as
well as many types of cancer (Ferreira et al., 2013). If the current culture of inactivity and
obesity which is observed in younger and middle-aged adults continues, we will soon
witness the appearance of a massive global health burden in the form of an increasingly
aged, obese and chronically ill older population.
Being overweight or obese is associated with lower levels of physical activity (Martínez-
González et al., 1999, Blanchard et al., 2005), poorer walking performance (Woo et al.,
2007) and greater functional limitations which encumber the completion of daily activities
(Davison et al., 2002, Friedmann et al., 2001). Research has shown that increased volume of
walking is highly beneficial for functionality and elderly people walking outdoors four times
weekly or more for at least 15 min benefit from almost half the risk of mortality in
comparison to elderly people walking less than four times weekly (Fortes et al., 2013).
The relationship between participation in physical activity and health status
Self-rated health is a reliable indicator of overall health status, and is a widely used measure
in health and ageing surveys (Idler and Benyamini, 1997, Sargent-Cox et al., 2010), with
perceived health being considered a good predictor of mortality, even when physical health
and demographic variables have been controlled for. In a recent study (Burke et al., 2012)
conducted to evaluate factors associated with perceived health in an older adult Irish
population, results revealed that, as would be expected, comorbidity emerged as a

11
predictor of perceived health status, which suggests that subjective health is rated in
concordance with physical health.
In developed countries, 80% of all deaths from cardiovascular diseases occur in people aged
65 years and older (World Health Organisation, 1996). It is promising however that research
has consistently provided evidence for an inverse association between increased physical
activity and cardiovascular disease (CVD) mortality risk (Ruigómez et al., 1995, Sherman et
al., 1994, Sattelmair et al., 2011). It seems prudent then to strongly encourage increased
participation in physical activity as a means to enhance longevity.
In a study which investigated the relationship between physical activity and markers of
inflammation in a healthy elderly population, results revealed that higher levels of physical
activity were associated with lower concentrations of four out of five inflammation markers
(C-reactive protein, white blood cells, fibrinogen, and Factor VIII activity), measured in a
cohort aged ≥ 65 years (Geffken et al., 2001). Given the known association between these
biomarkers and CVD risk (Danesh et al., 1998), this exercise-induced reduction in
inflammation is very encouraging. Research by Mello et al. (2010) also observed a significant
association between increased exercise participation and reduced Waist-Hip Ratio (WHR),
and enhanced quality of life (QOL). Encouragingly, in relation to the benefits of physical
activity participation on CVD risk factors, research by Patel et al. (2013) concluded that older
adults beginning low levels of physical activity at or after age 65 years may be able to
significantly reduce their risk of acute myocardial infarction, stroke and cardiovascular
mortality.
The contribution of organised sport to recommended physical activity
While research is limited in this area, a recent study conducted in Canada (Canadian
Heritage, 2013) highlighted the worrying trend of falling sports participation rates in older
adults aged 55 years and over with only 17% of Canadians in this age bracket regularly
practicing sport. Research in Ireland (Fahey et al., 2004) demonstrated that as people age,
participation in moderate to high intensity sport drops with individuals opting to engage in
non-team sports such as golf, swimming or aerobics. Data presented in the most recent Irish
Sports Monitor report (Ipsos MRBI, 2013) highlighted that 46% of all adults in RoI take part
in sport. Participation was greatest, at 60%, amongst 20-34 year olds and decreased
consistently with age; to approximately 30% amongst older adults. The SAPAS report (Sport
Northern Ireland, 2010) presented similar age related declines in sport participation. Ward
et al. (2009) reported on the most recently gathered health behavior data on a cross section
of the population in RoI and NI, using the SLAN and 2007 and NIHSWS 2005 data sets. In an
assessment of participation in physical activity including exercise or sport in 65+ year olds,
46% of those in RoI compared to 19% in NI indicated that they were regularly physically
active. It appears that older adults in RoI are more active than their Northern counterparts,

12
at least in a sports context. Reports produced on the Irish Sports Monitor (IPSOS MRBI,
2011) and SAPAS (Sport NI, 2010) both confirmed that exercise specific sports such as
weight training, jogging, swimming, and using cardiovascular exercise machines are the
most popular sports among adults including older adults. In the SAPAS report, it was
revealed that participation in team sports was negligible with only 1% of adults aged 50+
taking part in soccer related activity. Previously, (Lunn and Layte, 2008) observed in their
assessment of Irish sporting lives that individual sports are much more likely to be played
into adulthood than team sports, thus from an older adult perspective, the odds of
remaining active in sport is increased if they are involved in individual sports and
participation in team sports overall among this group is minimal. Ensuring sustained
participation in sports for older adults is a challenging issue for policy makers but
recreational and indeed competitive sports participation can make an important
contribution to physical activity levels, which is related to healthy ageing.

13
Methodology
Data sources
Quantitative data from adults aged 60+ in TILDA (n=4892), SLÁN (n=2691), Health Survey NI
(n=1359), SAPAS (n=1393), and the Irish Sports Monitor (n=1998) were included in the
project.
The Irish LongituDinal Study on Ageing (TILDA) is a population-representative prospective
cohort study with baseline assessment conducted between October 2009 and February
2011 and follow-up waves planned every 2 years. Participants were sampled in geographic
clusters, with each member of the Irish population aged 50 and older having an equal
probability of being invited to participate in the study (Whelan and Savva, 2013). Detailed
information on the design and methodology of TILDA has been published (Whelan and
Savva, 2013).
The Survey of Lifestyles Attitudes and Nutrition in Ireland (SLÁN) is the third national SLAN
survey conducted in 2007 using face-to-face interviews with adults aged 18 years or over,
interviewed at home addresses. The sample was representative of the general population in
Ireland when compared with Census 2006 figures and was further weighted to match the
Census prior to analysis.
The 2011 Irish Sports Monitor is designed to measure and monitor physical and social
participation in sport and other forms of exercise. The survey sample is designed to be
representative of the Irish population aged 16 and over. Interviews were conducted by
telephone throughout 2011.
The 2010/11 Health Survey Northern Ireland was conducted by the Northern Ireland
Statistics & Research Agency’s Central Survey Unit and covered the period April 2010 to
March 2011. Data were collected using Computer Assisted Personal Interviewing (CAPI) and
where appropriate Computer Assistant Self Interviewing (CASI) from those aged 16 and over
in private households in Northern Ireland.
The Northern Ireland Sport and Physical Activity Survey (SAPAS) is a cross-sectional survey
of Northern Irish adults conducted in 2009/10. 4653 adults (aged 16+) completed face-to-
face interviews conducted in their homes using computer assisted personal interviewing.
The sampling procedures ensured proportionality with the Northern Ireland population
based on estimates of the number of residents aged 16 or older provided by the Census
Office for Northern Ireland (1.4 million).

14
Data extraction & coding
Detailed examination of all variables was conducted to allow cross-study comparisons. Key
variables include: self-reported height and weight, physical activity (determined by IPAQ),
self-reported participation in moderate-vigorous physical activity and walking, perceived
health status, objectively measured cardiovascular risk factors (body mass index, waist and
hip circumference, blood pressure, blood lipids) and demographics (including socioeconomic
status).
Although there are commonly used definitions of old age, there is no general agreement on
the age at which a person becomes old. The traditional use of a calendar age to mark the
threshold of old age assumes equivalence with biological age, though it is generally
accepted that these two are not necessarily synonymous (Timiras, 2003). The United
Nations uses the age of 60 to mark to define older persons (United Nations, 2009) and this
guided the categorisation of individuals in this report.
Statistical analysis
As indicated above, old age in this analysis was defined as 60 years and older. Participants
were grouped into age categories (60-64, 65-69, 70-74 and 75+) and all subsequent analysis
in each data set was undertaken on this specific group of participants. To facilitate
comparison across data sets, data for comparable variables were re-coded where possible
into similar response categories. Descriptive statistics were then used to summarise
participant characteristics, such as gender, age, socioeconomic status (SES), level of
education, ethnicity, marital status and place of residence in each sample. For physical
activity (PA), participants were classified as sufficient or insufficiently active based on their
self reported weekly engagement in PA and/or sport. Meeting or exceeding minimum PA
guidelines (150 minutes of at least moderate intensity activity weekly) was deemed
sufficient PA; individuals who did not meet this criteria were categorised as insufficiently
active. For data sets that collected PA data using IPAQ (SLAN, TILDA, HSNI) analysis was
conducted using the IPAQ Scoring Protocol (International Physical Activity Questionnaire,
2005) where participants are categorised as ‘low’, ‘moderate’ or ‘high’ active; the latter
reflects those meeting PA guidelines. The use of the ‘high’ IPAQ category for applying PA
guidelines is recommended to account for limitations in IPAQ relating to assessing total daily
activity (Bauman et al., 2009). Participation in moderate and vigorous intensity PA was
summed to calculate MVPA while for the sport specific data sets (SAPAS, ISM), weekly
participation in sport was computed in the absence of measures of MVPA. Chi squared
statistics and forced entry logistic regression was used to identify factors associated with
insufficient PA, using SPSS Version 19. Data were presented as adjusted odds ratios (OR) of
the likelihood of the specified outcome (insufficient PA) across correlates such as age,
15
gender, SES, level of education etc. Probability values and 95% confidence intervals for each
adjusted OR were presented. ORs greater than 1 indicate an increased odds of the outcome
occurring while ORs less than 1 represent a decreased likelihood of being insufficiently
active. Pearsons correlations were carried out to assess the relationship between BMI and
participation in PA while independent t-tests were used to investigate differences in health
indicators, such as BMI, waist circumference, triglycerides and cholesterol between
participants meeting or not meeting PA guidelines. Weighting was incorporated into all
analysis in this report to faciltate the generalisation of findings to the overall older adult
population in NI and RoI. Significance was set at 0.05.

16
Findings
Description of Participants
Across all data sets, there were a greater proportion of females than males among survey
respondents. Lower social classes are particularly well represented in the HSNI, SAPAS and
ISM data sets while the large majority of participants did not report having tertiary level
education. Only 5% of participants were non White Irish, and slightly greater proportions
were married or cohabiting. In the SAPAS dataset 83% of adults aged 60+ lived in urban
areas. Data in SAPAS was collected using face-to-face interviews from a random sample of
participants across electoral areas. Place of residence (urban/rural) was not included in the
sampling criteria.
Table 1: Description of Participants
SLAN (n=2691)
TILDA (n=4892)
HSNI (n=1359)
SAPAS (n=1393)
ISM (n=1998)
Sex Male (%) Female (%)
46 54
46.4 53.6
36.5 63.5
46 54
51.1 48.9
Age 60-64 (%) 65-69 (%) 70-74 (%) 75+ (%)
28.8 22 19.7 29.6
30.1 21.6 17.7 30.5
25.9 22.2 18 33.9
25.7 25.4 19.5 29.4
29 25.4 17.7 27.9
Social Class SC1-2 (%) SC3-4 (%) SC5-6 (%)
29.9 43.7 26.3
31.9 39 29.1
13.3 58.5 28.2
37.1 15.7 47.2
29.6 10.3 60
Education level No Tertiary (%) Tertiary (%)
82.3 17.7
85.5 14.5
- 88.4 11.6
63.6 36.4
Ethnicity Irish (%) Other (%)
94.6 5.4
97.1 2.9
- - 95.2 4.8
Marital status/living arrangement Single/Widowed/Divorced/Separated (%) Married/Cohabiting (%)
40.5 59.5
49.1 50.9
45.8 54.2
38.5 61.5
33.1 66.9
Location Urban (%) Rural (%)
50.4 49.6
50.7 49.3
- 83 17
51.9 48.1
SC1-2: Professional, Managerial, Group A, B, C1; SC3-4: Skilled Manual, Non Manual, C2; SC5-6: Semi
Skilled, Unskilled Manual, D, DE

17
Current physical activity levels of older adults
Three datasets utilised the International Physical Activity questionnaire (SLAN, TILDA, HSNI)
while SAPAS and ISM assessed walking and participation in other activities such as sport. For
older adults living in Ireland, north and south, there was a significant difference in physical
activity levels between all age groups (60-64, 65-69, 70-74, 75+), with physical activity levels
declining with age.
Table 2: Age Comparison of PA Status
Low (%) Moderate (%) High (%)
SLAN (IPAQ) 60-64 42.9 39.8 17.4
65-69 44.4 40.6 15
70-74 53 36.1 10.9
75+ 63.9 29.3 6.8*
TILDA (IPAQ) 60-64 27.7 35 37.3
65-69 28.6 39 32.4
70-74 35.2 36.8 28.1
75+ 50.8 31.5 17.8*
HSNI (IPAQ) 60-64 57.4 20.4 22.2
65-69 61.6 21.6 16.8
70-74 62.4 21 16.6
75+ 79.7 13.6 6.6*
Do not meet guidelines Meet guidelines
(30minsxmodx5days)
SAPAS (Sport, Work,
Getting About, Home)
60-64 70.6 29.4
65-69 78.9 21.1
70-74 89.3 18.7
75+ 82.1 17.9*
ISM (Sport and
Recreational and
Transport Walking
and Cycling)
60-64 67.5 32.5
65-69 65.3 34.7
70-74 71.8 28.2
75+ 75.6 24.4*
*p<.05
The percentage of adults in the top tertile for PA level fell from 17, 37 and 22% in SLAN,
TILDA and HSNI respectively for 60 – 64 year olds, to 7, 17 and 7% for those aged 75+. A
similar trend is evident for the proportion of older adults meeting physical activity
guidelines (Department of Health and Children & Health Service Executive, 2009) in the
SAPAS and ISM sample.

18
Figure 1: Age Comparison of Proportion Meeting PA Guidelines
*SLAN, TILDA and HSNI = IPAQ (high active), ISM = Participated in 30 minutes moderate physical
activity at least five times during the previous seven days (i.e. meet National Physical Activity
Guidelines) (Highly Active), SAPAS – KPI: mod intensity at least 30 mins on at least 5 days.
Volume of weekly walking (mins/week) decreased with age, with IPAQ, results from SLAN
and TILDA demonstrating a significant difference between all age groups. Adults aged 60-64
reported walking 275 (SLAN) and 341 (TILDA) minutes per week. For those aged 75+ this
decreased to 169 (SLAN) and 223 (TILDA) minutes. A similar trend was seen for minutes of
moderate-vigorous PA per week with a significant difference between all age groups (TILDA
and SLAN). While data from older adults Northern Ireland (HSNI) indicated a decrease in
minutes of MVPA and minutes of walking from age 60 – 75+, a significant difference was
only evident between the 75+ category and other age groups. Walking was a more common
mode of activity than sport in both the SAPAS and ISM datasets with participation in both
modes of PA also consistently decreasing with age.
0
5
10
15
20
25
30
35
40
SLAN HSNI TILDA ISM SAPAS
60-64 17.4 22.2 37.3 32.5 29.4
65-69 15 16.8 32.4 34.7 21.1
70-74 10.9 16.6 28.1 28.2 18.7
75+ 6.8 6.6 17.8 24.4 17.9
Axi
s Ti
tle

19
Table 3: Age Comparison of Type of PA
MVPA (mins/wk) Walking (mins/wk)
SLAN (IPAQ) 60-64 169.7 275.4
65-69 154.7 250.1
70-74 105.0 218.3
75+ 57.8 169.0
Sig between all age groups for walking and MVPA
TILDA (IPAQ) 60-64 403.9 341.2
65-69 355.8 329.9
70-74 287.6 316.7
75+ 190.3 223.8
Sig between all age groups for walking and MVPA
HSNI (IPAQ) 60-64 243.6 108.7
65-69 200.5 86.5
70-74 199.4 85.3
75+ 100.5 44.8
Sig between 75+ and other categories only (MVPA and walking)
Sport (mins/wk) Walking (mins/wk)
SAPAS (Sport, Work, Getting About, Home)
60-64 89.3 276.9
65-69 51.5 151.7
70-74 55.8 122.1
75+ 40.2 104.7
Sig diff between 60-64 and all other groups only in walking and sport (except 70-74)
ISM (Sport and Recreational and Transport Walking and Cycling)
60-64 137.4 193.6
65-69 118.4 214.2
70-74 126.6 182.3
75+ 117.7 171.4
No sig diff in sport, sig diff between 75+ and 65-69 in walking
*HSNI extra questions on walking, all not captured in IPAQ

20
Correlates of physical activity
In this section, the following correlates of PA participation were examined: sex, age,
socioeconomic status, education level, marital status, ethnicity and geographical living
location. Odds ratios (ORs) are presented as the likelihood of participants being
insufficiently active i.e. not meeting PA guidelines. Data from SLAN, TILDA and HSNI
indicated that females were between 1.5 and twice as likely to be insufficiently active than
males. The odds of being sufficiently active declined as age increased, with adults aged 75+
between 1.56 (ISM) and 3.4 (HSNI) times more likely than 60-64 year olds to be insufficiently
active.
Less consistent trends were apparent for other correlates. Across all datasets except TILDA,
low socioeconomic status was associated with insufficient activity levels, while adults from
the Republic of Ireland with 3rd level education were marginally less likely to meet PA
guidelines than their more educated counterparts.
Being married was associated with being sufficiently active; in the TILDA analysis, married
women had an 8% reduced chance of not meeting PA guidelines. Finally, data from SLAN
and TILDA indicated that those living in urban locations were 1.05 and 1.76 times more
likely to be insufficiently active than rural dwellers.
Table 4: Correlates of physical activity
SLAN
Sufficiently Active (%)
Insufficiently Active (%)
Adjusted OR (95% CI)
Gender Male Female
66.3 33.7
42.9 57.1*
1 1.99 (1.47-2.68)^
Age 60-64 65-69 70-74 75+
40.2 26.7 17.2 16
27.2 21.5 20 31.3*
1 1.17 (.82-1.67) 1.52 (1.02-2.27)^ 2.80 (1.82-4.28)^
SES High Middle Low
30.7 47.1 22.2
29.9 43.4 26.7*
1 .84 (.59-1.18) 1.09 (.72-1.66)
Education No third Level Third Level
75.2 24.8
83.3 16.7*
1 .75 (.53-1.06)
Marital Status
Single/Widowed/Divorced/Separated
Married 32.6 67.4
41.8 58.2*
1 1.19 (.86-1.64)
Ethnicity White All other
92.8 7.2
94.8 5.2*
1 .88 (50-1.57)
Location Rural Urban
57.9 42.1
48.2 51.8*
1 1.76 (1.33-2.35)^
*p<.05, ^OR significant

21
TILDA
Sufficiently Active (%)
Insufficiently Active (%)
Adjusted OR (95% CI)
Gender Male Female
60.1 39.9
40.7 59.3*
1 1.66 (1.63-1.69)^
Age 60-64 65-69 70-74 75+
39.2 24.5 17.3 19
26.5 20.5 17.8 35.2*
1 1.14 (1.12-1.17)^ 1.31 (1.28-1.34)^ 2.20 (2.14-2.24)^
SES High Middle Low
26.3 30.7 42.9
28.2 35.3 36.5*
1 .91 (.89-.93)^ .97 (.93-.1.0)
Education No third Level Third Level
82.7 17.3
86.6 13.4
1 .97 (.96-.97)^
Marital Status Single/living alone Married/cohabiting
41.6 58.4
51.9 48.1*
1 .92 (.90-.93)^
Ethnicity White All other
96.9 3.1
97.2 2.8
1 1.10 (1.05-1.15)^
Location Rural Urban
53.5 46.5
47.7 52.3*
1 1.05 (1.03-1.07)^
*p<.05, ^OR significant
HSNI
Sufficiently Active (%)
Insufficiently Active (%)
Adjusted OR (95% CI)
Gender Male Female
48.8 51.2
34.2 65.8*
1 1.50 (1.01-2.25)^
Age 60-64 65-69 70-74 75+
38.4 24.8 20.8 16
22.9 21 17.8 33.8*
1 1.50(.90-2.50) 1.53 (.89-2.62) 3.40 (1.92-6.04)^
SES High Middle Low
14.6 65 20.3
12.3 56.7 31*
1 .91 (.51-1.63) 1.51 (.76-3.00)
Marital Status
Single/Widowed/Divorced/Separated
Married 32.5 67.5
49 51*
1 .73 (.47-1.11)
*p<.05, ^OR significant

22
SAPAS
Sufficiently Active (%)
Insufficiently Active (%)
Adjusted OR (95% CI)
Gender Male Female
42.4 57.6
47 53
1 .72 (.53-.98)^
Age 60-64 65-69 70-74 75+
34.7 24.5 16.7 24.1
23.2 25.6 20.3 30.9*
1 1.49 (1.01-2.20)^ 1.70 (1.11-2.62)^ 1.98 (1.32-2.96^)
SES High Middle Low
42.7 20.3 37
35.5 14.5 50.1*
1 .98 (.64-1.51) 1.67 (1.18-2.38)^
Education No third Level Third Level
88.3 11.7
88.4 11.6
1 1.41 (.86-2.31)
Marital Status
Single/Widowed/Divorced/Separated
Married 34.3 65.7
39.7 60.3
1 .92 (.67-1.28)
Location Rural Urban
18.4 81.6
16.6 83.4
1 1.15 (.79-1.67)
*p<.05, ^OR significant
ISM
Sufficiently Active (%)
Insufficiently Active (%)
Adjusted OR (95% CI)
Gender Male Female
52.1 47.9
51.6 48.4
1 .86 (.67-1.11)
Age 60-64 65-69 70-74 75+
32 29.1 16.4 22.6
28.5 23.6 17.9 30*
1 .96 (.68-1.35) 1.31 (.89-1..94) 1.56 (1.10-2.20)^
SES High Middle Low
31.7 10.3 58.1
28.9 10.1 60.9
1 1.14 (.71-1.84) .90 (.67-1.22)
Education No third Level Third Level
59.8 40.2
63.8 36.2
1 .81 (.62-1.06)
Marital Status
Single/Widowed/Divorced/Separated
Married 29 71
34.3 65.7*
1 .83 (.63-1.10)
Ethnicity White All other
95.3 4.7
95.2 4.8
1 .86 (.67-1.13)
Location Rural Urban
44.4 55.6
48.9 51.1
1 .87 (.66-1.09)
*p<.05, ^OR significant

23
Association between walking, physical activity and body mass index
A very weak association was observed between total walking per week / amount of
moderate-to-vigorous physical activity per week and weight status (BMI).
Table 5: Association between PA and BMI
Total Walking/Wk MVPA/wk
SLAN BMI -.063* -.049*
SAPAS BMI -.05 -.007
*p<.05
Walking intensity was reported in two datasets (SLAN and SAPAS). Results demonstrated an
inverse relationship between walking intensity and weight status. For example, 25% of older
adults in Northern Ireland who reported walking at a light intensity were obese. However,
only 11% of older adults in Northern Ireland who reported moderate-vigorous intensity
walking were obese. Conversely, a significantly greater proportion of those who reported
moderate-vigorous intensity walking were normal weight (34.4 – 51.5%) compared to those
who reported light intensity waking (21.5 – 35.2%).
Adults meeting PA guidelines are also less likely to be classified as obese in comparison to
those not meeting PA guidelines (SLAN, TILDA, SAPAS). The greatest difference was seen in
the Northern Ireland dataset, with 26% of adults not meeting PA being classified as obese,
whereas only 9.2% of those meeting PA guidelines were obese.
Table 6: Association between BMI and Walking Intensity/PA
Light (%)
MV (%)
Insufficiently Active (%)
Sufficiently Active (%)
SLAN
UW/Normal 21.5 34.4 23.4 27.5
OW 45.2 45 44.2 44.3
Obese 33.3 20.6* 32.3 28.2*
TILDA
UW/Normal - - 23.2 19.7
OW - - 40.8 46.7
Obese - - 36.1 33.6*
SAPAS
UW/Normal 35.2 51.5 35.8 46.3
OW 40 37.9 38.5 44.5
Obese 24.8 10.7* 25.7 9.2*

24
Relationship between physical activity and health indicators
A single question addressed the relationship between perceived health indicators and
physical activity status. Subjects who perceived their overall health as fair or poor were
between 1.68 (SLAN) and 2.77 (HSNI) times more likely to be insufficiently active as those
who reported their health to be good or excellent. Also, across SLAN, HSNI and the ISM,
there were lower proportions of insufficiently active among respondents who felt that their
activity levels were not limited by their health (ORs: .28-.57). Little consistency was
apparent for the relationship between BP, smoking and PA. In relation to the proportions of
elevated BP and smokers across activity categories, there was little difference apparent. For
example in the TILDA analysis, 48% and 42% of the sufficient activity group reported high BP
and smoking compared to 47% and 44% among their insufficiently active counterparts.
Significance apparent in odds ratios are likely due to weighted analysis.
Table 7: Relationship between health indicators and physical activity
SLAN
Sufficiently Active (%)
Insufficiently Active (%)
Adjusted OR (95% CI)
Self Reported Health
Excellent/Good Fair/Poor
86.8 13.2
70.1 29.9*
1 1.68 (1.04-2.72)^
PA Limited due To Health
Yes No
7 93
25.2 74.8*
1 .28 (.15-.52)^
BP High Normal
28.9 71.1
32.9 67.1
1 1.04 (.73-1.47)
Smoking Status Yes No
46.5 53.5
44.6 55.4
1 1.11 (.81-1.53)
Adjusted for age, gender, SES, *p<.05, ^OR significant
TILDA
Sufficiently Active (%)
Insufficiently Active (%)
Adjusted OR (95% CI)
Self Reported Health
Excellent/Good Fair/Poor
92.6 7.4
78.5 21.5*
1 2.17 (2.07-2.29)^
PA Limited due To Health
Yes No
79.3 20.7
79.2 20.8
1 .85 (.83-.87)^
BP High Normal
48.2 51.8
47 53*
1 1.23 (1.21-1.25)^
Smoking Status Yes No
57.8 42.2
55.6 44.4*
1 .87 (.85-.88)^
Adjusted for age, gender, SES, *p<.05, ^OR significant
HSNI

25
Sufficiently Active (%)
Insufficiently Active (%)
Adjusted OR (95% CI)
Self Reported Health
Excellent/Good Fair/Poor
78.4 21.6
47.5 52.5*
1 2.34 (1.16-4.75)^
PA Limited due To Health
Yes No
58.7 41.3
80.4 19.6*
1 .57 (.28-1.18)
BP High Normal
25 75
19.6 80.4
n/a
Smoking Status Yes No
48.8 51.2
54.4 45.6
1 .68 (.35-1.33)
Adjusted for age, gender, SES, *p<.05, ^OR significant
SAPAS
Sufficiently Active (%)
Insufficiently Active (%)
Adjusted OR (95% CI)
Self Reported Health
Excellent/Good Fair/Poor
71.4 28.6
46.1 53.9*
1 2.77 (2.03-3.80)^
PA Limited due To Health
Yes No
1.6 98.4
2.9 97.1
1 .70 (.22-2.20)
Adjusted for age, gender, SES, *p<.05, ^OR significant
ISM
Sufficiently Active (%)
Insufficiently Active (%)
Adjusted OR (95% CI)
PA Limited due To Health
Yes No
61.3 38.7
77 23*
1 .45 (.29-.71)^
Adjusted for age, gender, SES, *p<.05, ^OR significant
Subjects who were sufficiently active appeared to have lower BMI and waist circumference
than those not meeting PA guidelines (SLAN, TILDA). Surprisingly total cholesterol was lower
in the insufficiently active group (SLAN, TILDA). A clear picture was not evident for
triglycerides1, with SLAN and TILDA demonstrating that those not meeting PA guidelines had
higher and lower levels respectively. As is indicated in the data below, differences while
statistically significant were not large in absolute terms.
1 Triglycerides are a type of fat found in the body. High levels of triglycerides may increase the risk of heart
disease.

26
Table 8: Relationship between objectively-measured health indicators and physical activity
SLAN
Sufficiently Active
(M, SD)
Insufficiently Active
(M, SD)
BMI Score 27.6 (4.7) 28.4 (4.7)
Waist Circumference 92.8 (14.0) 96.6 (13.5)*
Triglycerides 1.5 (0.8) 1.7 (1.0)
Total Cholesterol 5.4 (1.0) 5.2 (1.2)
*p<.05
TILDA
Sufficiently Active
(M, SD)
Insufficiently Active
(M, SD)
BMI Score 28.4 (4.0) 28.7 (4.7)*
Waist Circumference 96.7 (12.6) 96.9 (14.0)*
Waist/Hip Ratio .92 (.1) .91 (.1)*
Triglycerides 1.74 (1.1) 1.70 (1.0)*
Total Cholesterol 4.95 (1.0) 4.93 (1.1)*
Grip Strength (D) 27.6 (9.5) 22.8 (9.1)*
Visual Reasoning 2.8 (1.3) 2.6 (1.3)*
Picture Memory Test 5.6 (.7) 5.5 (.8)*
*p<.05
Sport Participation
Sport participation was higher among older adults aged 60+ in the South of Ireland than their
counterparts in Northern Ireland (31.6% v 23.8%).
27
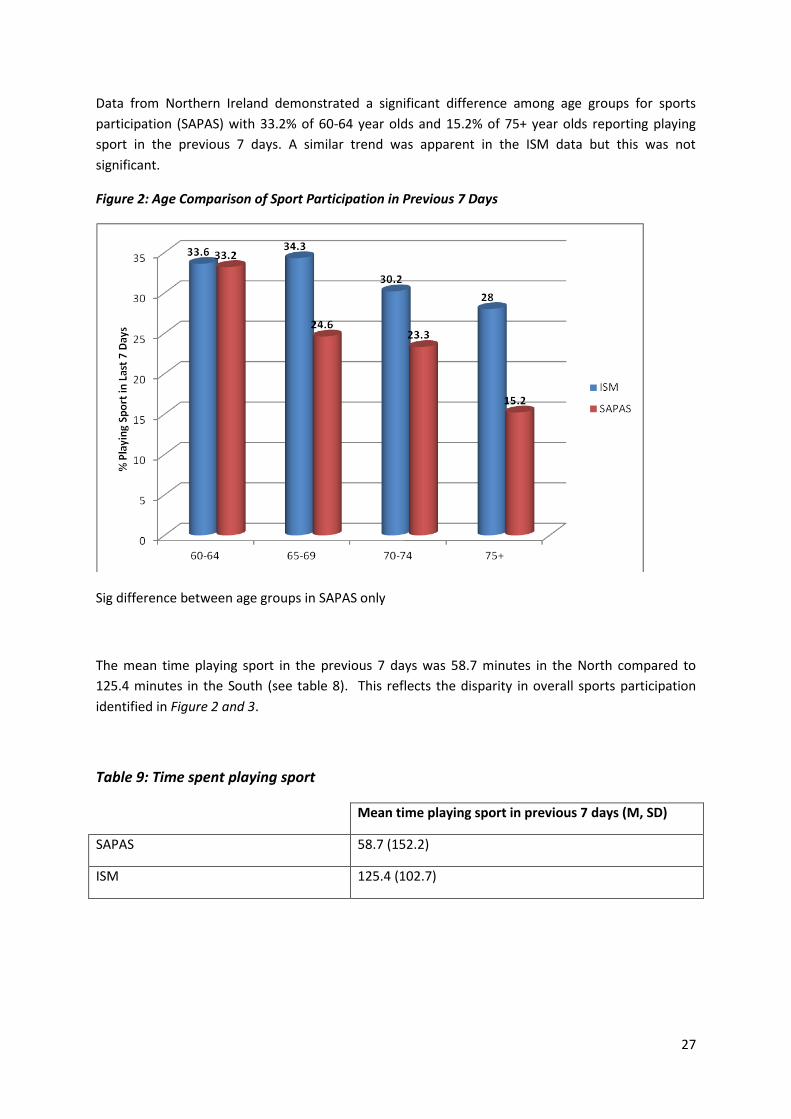
Data from Northern Ireland demonstrated a significant difference among age groups for sports
participation (SAPAS) with 33.2% of 60-64 year olds and 15.2% of 75+ year olds reporting playing
sport in the previous 7 days. A similar trend was apparent in the ISM data but this was not
significant.
Figure 2: Age Comparison of Sport Participation in Previous 7 Days
Sig difference between age groups in SAPAS only
The mean time playing sport in the previous 7 days was 58.7 minutes in the North compared to
125.4 minutes in the South (see table 8). This reflects the disparity in overall sports participation
identified in Figure 2 and 3.
Table 9: Time spent playing sport
Mean time playing sport in previous 7 days (M, SD)
SAPAS 58.7 (152.2)
ISM 125.4 (102.7)

28
What the project has added to existing knowledge
This study uniquely examines physical activity participation and the effect of physical activity
on both perceived and objective health in adults aged 60+ from an all-Ireland perspective.
Comparison of results from large population surveys revealed considerable differences with
regard to the proportion of older adults considered to be sufficiently physically active. For
example, the percentage of adults aged 60 – 64 years meeting physical activity guidelines
was 37.3% according to TILDA data, however only 17.4% of the same age group meet PA
guidelines according to data from SLAN. Both surveys utilised the International Physical
Activity questionnaire. Though the 4-year difference in field work should be noted it is
unlikely to explain this discrepancy. Our finding highlights the challenge for policy makers
when interpreting results available from surveys undertaken in Ireland and elsewhere.
However it should be noted that in all five surveys there was a clear trend with physical
activity declining with advancing age. Our examination of compliance with physical activity
recommendations by gender is particularly important and the finding emphasises the need
for targeted interventions for older females.
Data from SLAN and TILDA suggest that those living in urban locations are 1.1-1.8 times less
likely to meet the physical activity recommendations than rural dwellers. This appears to be
counter-intuitive as it is often thought that urban locations, with high street connectivity
and access to public transport, facilitate more physical activity (for example, Walsh et al.,
2013). Though research on older adults in New South Wales has shown that adequate
physical activity is associated with rural residence (Lim and Taylor, 2005). Our results could
imply that Irish urban neighbourhoods are not encouraging physical activity to the same
degree as rural locations. Recent research has demonstrated that environments offering
comfort, safety from crime, and pleasantness may attract older adults to walk for
transportation (Van Cauwenberg et al., 2014).
Adults from the Republic of Ireland with third level education were marginally less likely to
meet PA guidelines (SLAN and TILDA). In Northern Ireland (SAPAS), education level was not
a correlate of physical activity. These findings are not consistent with international data
(Bauman et al, 2012) and may suggest unique implications for physical activity promotion
for older adults in Ireland.
As with the findings in relation to overall physical activity levels discussed above, the
findings in relation to the association between physical activity level and socioeconomic
status varied greatly depending on the survey reported. In the analyses of SLAN and SAPAS,
those from low socioeconomic groups were less likely to meet the PA guidelines. This is
consistent with international literature. However, the results from the TILDA study indicated
that those from low socioeconomic groups were more likely to meet PA guidelines. Again,

29
this poses problems for policy makers and practitioners when tasked with identifying those
in most need of physical activity interventions.
Results revealed that a relationship exists between PA and health status. Across SLAN,
TILDA, HSNI and SAPAS, individuals who met the recommended amounts of physical activity
were more likely to perceive their overall health as good or excellent, in comparison to their
inactive counterparts who indicated that their health was poor or fair. This finding was
reinforced by those individuals who reported no limitations due to health problems also
being the most active individuals.
From a physical health perspective, older adults who reported meeting the PA guidelines
had a lower BMI, waist circumference and were less likely to be obese that their peers who
did not meet the PA guidelines. Minutes of walking were (weakly) correlated with BMI,
showing a positive and linear relationship, with walking intensity inversely related to BMI.
On other health indicators – cholesterol, blood pressure - the results were inconclusive. All
statistical differences, though in the right direction (i.e. regularly active individuals had
better health results), these differences were small and most non-significant.
Our analyses revealed some new insights into sports participation among older adults North
and South. Just under one third (31.6%) of older adults in the South reported participation
in sport in the previous seven days compared to a 23.8% participation rate in the North.
Participation decreased by 50% between the 60-64 and 75+ age groups in Northern Ireland
but remained relatively consistent across all age groups in the Southern cohort.
Participation rates were notably higher among older adults aged 65+ in the South compared
to their counterparts in the North while the mean time spent playing sport per week was
higher in the Southern cohort. In relation to data collection, both surveys assessed sport
participation separate to physical activity accrued in the work or home environment but
unlike the ISM, SAPAS did include walking as a sport in the questionnaire. This reaffirms the
observed difference between older adults in the North and South of Ireland and suggests
that this difference could be underestimated.
Conference papers The Stay Active study has contributed to existing knowledge by presenting findings at the
following national and international conferences:
Lane, A., Murphy, M., Murphy, N., Woods, C. & Murtagh, E. 2013. Stay Active - the physical
activity, ageing and health study: study protocol and preliminary results. PEPAYS Annual
Research Forum. Dublin. 13th – 14th June.
Murphy, M., Woods, C., Murphy, N., Lane, A., & Murtagh, E. 2013. Self-report physical
activity and correlates of activity in older adults in Ireland. Annual Conference of HEPA
Europe. Helsinki. 21st – 24th Oct

30
Learning from the process of the research
Key learning surrounds the practicalities of mining existing data sets in terms of how
extensively the data has been cleaned and coded prior to being made available to
researchers. There was considerable variation across the five datasets and a substantial staff
contribution was necessary in order to prepare the data for analysis.
Given the large subject numbers the power of the statistical procedures means that even
small percentage differences could be statistically significant. Previous reports from SLÁN
suggest that the comparisons between demographic breakdowns are likely to be more
meaningful than direct comparisons of estimates (Ward et al., 2009).
Large variation in findings was noted across data-sets in relation to some research
questions. This has been discussed further in the previous section.
31
Discussion / Relevance to policy & practice
Physical Activity Levels
Self-reported physical activity from 5 surveys (3RoI and 2NI) was used to estimate the
proportion of older Irish adults who meet the current recommendations of 150 minutes of
moderate to vigorous physical activity per week. Although this proportion varied by survey
the analysis suggests that only a minority of older adults achieve current guidelines. This
finding is supported by other research that has highlighted that this age group has very poor
compliance rates with PA guidelines and therefore do not always realise the health-
enhancing benefits associated with sufficient aerobic exercise (Rydwik et al., 2012, CDC,
2003, Harris et al., 2009).
In all surveys physical activity declined with advancing age. Adults aged 75+ were 1.56 to 3.4
times less likely than 60-64 year olds to meet physical activity guidelines. Low levels of
physical activity and a decline in activity levels during successive decades of life are common
in cross-sectional studies from a range of countries in the developed world. Given the
importance of regular moderate physical activity to the maintenance of functional
independence (Paterson and Warburton, 2010) the result of this analysis suggests
significant numbers of older Irish adults may be accelerating their functional decline through
inactivity. Research suggests that older adults who commenced an exercise programme that
encouraged them to comply with current PA guidelines and obtain sufficient aerobic
exercise could expect to increase their life expectancy by an additional 1-2 years even if they
started as late as 60 years of age (Thurston and Green, 2004). Furthermore, findings from
the US suggest that increasing physical activity in this population has the potential to reduce
healthcare costs (Martinson et al., 2003).
Across all surveys women reported lower levels of physical activity across all ages. Given the
increased life expectancy of females compared to males (thought to be due to a
combination of genetic, behavioural and lifestyle factors), the earlier onset of osteoporosis
and the concomitant increase in fracture risk, older Irish women may be a particularly
worthwhile target for efforts to increase daily physical activity.
Self-reported physical activity has limitations with some studies suggesting that physical
activity is over-estimated by such methods. It is likely therefore that these estimates of the
proportion of older adults who are sufficiently active are if anything, optimistic. These
findings suggest a need to develop interventions which slow or arrest the age-related
decline in physical activity and increase the number of Irish adults who meet current
physical activity recommendations. In particular interventions focusing on maintaining
physical activity with advancing age and targeting older females and those living in urban
locations may be useful in older Irish adults. In addition to designing and delivering
32
interventions to encourage sustained medium to long term increases physical activity there
is a need to objectively measure physical activity in this population in order to set
appropriate all-island targets for the percentage of older adults who achieve the
recommended levels of physical activity.
Correlates of Physical Activity
Examination of these cross-sectional data sets allows us to examine the factors associated
with physical activity, i.e. the correlates of physical activity. The pooling of the datasets from
five population surveys has permitted the correlates of self-reported physical activity to be
considered on an all-Island basis.
Consistent with the current analysis of Irish data, a recent review of correlates of physical
activity in the Lancet (Bauman et al, 2012) found that age (inversely), and male sex are
reported correlates of activity. Data from SLAN, TILDA and HSNI indicated that females
were between 1.5 and 2.0 times more likely not to meet PA guidelines than males. Similarly
in the ipsos MRBI study, males were much more likely to have participated than females
(44% vs. 36% respectively) in some form of sport or recreational activity, excluding walking,
at least once in the past four weeks (Ipsos MRBI, 2012). A recent study on German older
adults indicated that older men engaged in sporting activities more often than women while
women performed more domestic activities (Moschny et al., 2011). Older adults may have
experienced more conventional role assignment than is currently the case, and while the
domestic activities undertaken by women may compensate for low participation in sporting
activity, it may not yield the same benefits for social and psychological health. There is an
opportunity for policy makers and service providers to increase older women’s interest in
and motivation for physical activity.
More older people living in rural locations in Ireland met the physical activity guidelines than
those living in urban settings. The international literature has consistently shown that the
walkability of a neighbourhood is strongly associated with walking, so it may be that Irish
rural neighbourhoods are indeed walkable (Owen et al., 2004, Bengoechea et al., 2005).
Previous research on Irish older people has found that walking often comprises the bulk of
older people’s health-enhancing physical activity. While 11% of people achieve the health
guidelines of an average of five periods of 30 minutes activity weekly for the last four weeks
through walking alone, only 4% achieve the same level of activity through participation in
sport or recreational physical activity alone (Ipsos MORI, 2009). Thus, it is important that
policies in Ireland enhance the walkability of neighbourhoods, and that neighbourhood
design features are particularly sensitive to the needs of older people. There is also a strong
case for maintaining and increasing funding for walking programmes for older people, such
as Go for Life’s walking leader training programme.

33
In the literature, education level is a consistent correlate in adults. Studies which have used
measures of educational attainment to define socioeconomic position (SEP) consistently
show differences in leisure time physical activity between different class groups, and this is
the case in older adults as well as adults (Bauman et al., 2012). The socioeconomic gradient
is less clear for other forms of physical activity apart from leisure time physical activity, i.e.
occupational physical activity, domestic physical activity and travel as these domains have
been measured less frequently (World Health Organisation, 2013). However, in Irish older
adults an inconsistent picture emerged. Adults from the Republic of Ireland with 3rd level
education were marginally less likely to meet PA guidelines (SLAN and TILDA), and this
would not be consistent with international data. In Northern Ireland (SAPAS), education
level was not a correlate of physical activity. In the analyses of SLAN and SAPAS, those from
low socioeconomic groups were more likely to not meet PA guidelines. In the ipsos MRBI
study (2012), a respondent’s socio-economic status had a bearing on their likelihood to
participate in sports and physical activity: 54% of ABC1s (those in higher socioeconomic
positions) participated compared with 37% of C2Des (those in lower socioeconomic
positions). This is consistent with a review of the literature on physical activity prevalence
across European countries undertaken as part of the WHO physical activity project on
physical activity and social disadvantage which showed that adults of low socioeconomic
position (SEP) are less active during leisure time than those of high SEP. However, the
results from the TILDA study indicated that those from low socioeconomic groups were
more likely to meet PA guidelines. Significance may be due to the weighted analysis applied
by TILDA, which equated the sample to the overall population. Significance is more likely in
this instance.
It should be noted that correlates research assesses only statistical association, rather than
providing evidence of a causal relationship between factors and physical activity (Bauman et
al, 2012). Longitudinal designs are necessary to describe causal associations, or
determinants of physical activity. Future waves of TILDA will allow for richer examination of
these data. Improved knowledge of psychological, inter personal, and environmental
correlates can identify new potential mediators for use in interventions—i.e., programmes
can be tailored to affect these correlates and thus lead to changes in physical activity
behaviour. Understanding the correlates of physical activity participation in older adults in
Ireland can help in planning interventions which are likely to be effective.
Association between walking, physical activity and body mass index Walking is a common, accessible, inexpensive form of physical activity and is an important
component of total physical activity in adult populations. Walking can be undertaken for
personal transport and recreational purposes and in older adults walking is typically
responsible for the largest proportion of self-reported physical activity. Despite a large
variation in walking volume between surveys there was a consistent age gradient across

34
studies with self-reported walking decreasing with age with older adults, particularly those
75 years or more. It is likely that these declines in walking result from a range of factors
including reduction in personal transport need (e.g. less occupational and domestic related
walking) physiological (e.g. disease and disability) environmental (e.g. access to suitable
walking routes) and psychosocial (e.g. lack of social support) factors.
The high proportion of older adults who reported walking in all five surveys highlights the
importance of this source of physical activity and suggests that the promotion of walking in
this group may represent a viable method for increasing their physical activity. Since
adherence to new physical activity regimes is poor (Foster et al., 2009) it may be more
effective to increase the volume of existing activities such as walking rather than trying to
encourage new activities (Stevens et al., 1998).
Walking can be performed at a range of speeds and hence can elicit different relative
exercise intensities. Current physical activity guidelines recommend 150 minutes of
moderate intensity physical activity per week. Two of the five surveys included in this
analysis reported intensity of walking (SAPAS and SLAN). Results demonstrated an inverse
relationship between self-reported walking intensity and weight status. Individuals who
reported walking at higher intensity were less likely to be overweight or obese. Walking
speed is often used as measure of physical capability in older people. In several
epidemiological studies walking speed has emerged as a factor which predicts survival in
older adults. A recent cohort study of men aged 70+ suggests that those able to walk at a
speed greater than 2 miles per hour were less likely to die than those who walked at slower
speeds (Stanaway et al., 2011).
Self-reported volume of walking has been associated with leanness in a number of
populations (Chan et al., 2003, Wagner et al., 2001). In the analysis of the current dataset a
very weak association was observed between total walking per week and weight for height
or Body Mass Index. When total physical activity (walking plus all other activity) was
considered older adults who reported meeting the current physical activity guidelines were
consistently less likely to obese.
Collectively these results suggest that interventions designed to encourage older adults to
increase walking pace (and hence intensity) and maintain walking volume with advancing
age may help them to maintain a healthy body weight and increase the proportion of older
adults meeting physical activity guidelines .
Relationship between physical activity and health status

35
The most substantial body of evidence for achieving healthy active ageing relates to the
beneficial effects of regular health enhancing physical activity. A regularly active older adult
benefits from a reduction in chronic illness as well as increased social contact, enhanced
physical and emotional health (Chodzko-Zajko et al., 2009, Stathi et al., 2010). Although
limited by the cross-sectional nature of the data all of the population studies examined in
this report showed a relationship between level of physical activity and individual
perceptions of health. Regularly active individuals were more likely, than their inactive
counterparts, to perceive their overall health as excellent or good, as opposed to poor or
fair. Self-rated health is a reliable indicator of overall health status (Idler and Benyamini,
1997), it is also accepted as a good predictor of mortality (Burke et al., 2012). Our findings
provide additional support for the relationship between healthy active ageing and positive
perceptions of health. Future longitudinal research is needed to explore this relationship
fully.
Physical inactivity is now accepted as an independent risk factor for premature mortality,
resulting in 9% (14.2% in RoI) of all-cause premature mortality or more than 5.3 million
deaths in 2008 (Lee et al., 2012). Inactivity increases the risk of many adverse health
conditions, including diseases such as cardiovascular disease (CVD), type 2 diabetes and
breast and colon cancers and shortens life expectancy (Lee et al., 2012). Worldwide it is
estimated that inactivity causes 6% (8.8% in Ireland) of the burden for CVD, 7% (10.8%
Ireland) of type 2 diabetes, 10% (15.2% Ireland) of breast cancer and 10% (15.7% Ireland) of
colon cancer (Lee et al., 2012). CVD is a leading cause of premature death and disability
worldwide, as an estimated 7.3 million people died from CVD in 2008, representing more
than one in ten of all global deaths (World Health Organisation, 2011). CVD accounts for
over 1.9 million deaths in the European Union each year, making it the single most common
cause of death (Nichols et al., 2012). In Ireland, approximately 10,000 people die each year
from CVD, and 6% of the Irish healthcare budget in 2009 was spent on treating the disease
(Department of Health and Children, 2010). A systematic review of prospective cohort
studies and randomised controlled trials aimed at improving lifestyle factors among
established CVD patients reported that all-cause mortality was reduced by 24% through
increased PA (RR 0.76, 95% CI, 0.59 to 0.98) (Iestra et al., 2005). Our results found that
older adults in Ireland who met the PA guidelines had lower BMI, waist circumference and
were less likely to be obese than their inactive peers. Future longitudinal research with
more detailed information on physical activity is warranted.
Sports Participation
Just under one third (31.6%) of older adults in RoI reported participation in sport in the
previous seven days compared to a 23.8% participation rate in NI. Participation decreased
by 50% between the 60-64 and 75+ age groups in Northern Ireland but remained relatively

36
consistent across all age groups in the RoI cohort. Participation rates were notably higher
among older adults aged 65+ in RoI compared to their counterparts in NI while the mean
time spent playing sport per week was not surprisingly higher in the RoI cohort. This is
consistent with an island analysis conducted by (Ward et al., 2009).
Sports participation among older adults in NI and RoI is much lower than that of younger
adults. Participation in sport in RoI has increased slightly between 2011 and 2013 possibly
due to the influx and increased popularity of exercise specific sports typically carried out in a
gym context, and the related growth of recreational running and cycling as a mode of
sporting activity (Ipsos MRBI, 2013). As a result, it may be that current young adults will
maintain active sports participation to a greater extent across the lifespan particularly as
participation in individual sports is more likely to remain consistent over time (Lunn and
Layte, 2008). It is important that this is taken into consideration by those charged with
promoting participation in sport and physical activity as they work to maintain sustained
engagement in activity.
Despite this potentially more positive outlook for future older adults, across Ireland, sports
participation has and is likely to continue to decline with age. This is likely to be partly due
to a variety of health factors, which limit or cease completely an individual’s ability to take
part in sport but it may also be due to an absence of options for adults as they age to remain
active in a sports context. This is particularly relevant for team sports, among which
participation inevitably decreases with age due to the high contact and high intensity nature
of these games. Participation in team sports however must be continually encouraged and
facilitated among young people and young to middle aged adults for the wide variety of
benefits it accrues beyond participation in physical activity. However, it remains important
that older adults have opportunities to stay active in a sporting context. Those who do
achieve this, cite participation in sports such as cycling swimming, golf, aerobics, dance and
jogging so it is important that a transition from team to individual sports is available for
middle to older aged adults. As indicated above, it is important that young to middle aged
adults who play team sports are directed, encouraged and facilitated to take part in more
individual sports to ensure participation across the lifespan.
Among current older adults, efforts are required to increase sports participation and
contribute to overall physical activity levels, which as mentioned in previous sections are
commonly insufficient among older adults to achieve health benefits. It is also important,
particularly in NI, that efforts are instigated to prevent the decline in participation between
the phases of young and advanced old age. It is clear that older adults are more likely to
take part in individual/exercise specific sports so opportunities for this mode of activity
should be made available. As with other age groups, it is likely that packaging and delivering
this type of sporting activity in a group, fun and social context will improve uptake and

37
enjoyment but it may be important also to communicate and support the ability of older
adults to be active in a sport context particularly as they move through old age.
38
Conclusions & Recommendations
Ageing is a universal, intrinsic, progressive and deleterious process (Vina et al., 2007) and a
method to successfully delay or avoid it completely would surely be one of the ultimate
achievements of science and modern medicine. People in Ireland are living longer. In 2006,
11% of the ROI population and 14% of the NI population were over 65 years. By 2014, this is
estimated to rise to 22% and 24% respectively (McGill, 2010). Regular physical activity has
been shown to play a key role in maintaining health with advancing age. Indeed it has been
suggested that physical activity should be one of the highest priorities for preventing and
treating disease and disablement in older adults (Nelson et al., 2007). Alarmingly the
present study indicates that only a minority of older adults of the island of Ireland are
sufficiently physically active. Considering our findings in relation to physical activity
participation, correlates of physical activity and both perceived and objective health status,
the following recommendations are made:
Targeted physical activity interventions are warranted for adults aged 65+, 70+ and 75 +
as decreases in physical activity participation are evident from one age-group to the
next. In particular interventions focusing on maintaining physical activity with advancing
age and targeting older females and those living in urban locations may be useful in
older Irish adults.
There is a need to objectively measure physical activity in this population in order to set
appropriate all-island targets for the percentage of older adults who achieve the
recommended levels of physical activity.
Walking should form the cornerstone of activity promotion strategies for older adults as
it is the most commonly reported activity for the 60+ age group.
Walking at a moderate to vigorous intensity should be encouraged in older adults as it is
associated with better self-reported health than walking at a light intensity.
It is important that policies in Ireland enhance the walkability of neighbourhoods, and
that neighbourhood design features are particularly sensitive to the needs of older
people. There is also a strong case for maintaining and increasing funding for walking
programmes for older people, such as Go for Life’s walking leader training programme.
Older adults who engage in regular health enhancing physical activity have better
perceptions of their overall health, have lower BMI, waist circumference and are less
likely to be obese than their inactive counterparts.
Longitudinal designs are necessary to describe causal associations, or determinants of
physical activity.
It remains important that older adults have opportunities to stay active in a sporting
context. Those who do achieve this, cite participation in sports such as cycling
swimming, golf, aerobics, dance and jogging, so it is important that a transition from
team to individual sports is available for middle to older adults.

39
References
Acree, L. S., Longfors, J., Fjeldstad, A. S., Fjeldstad, C., Schank, B., Nickel, K. J., Montgomery, P. S. & Gardner, A. W. 2006. Physical activity is related to quality of life in older adults. Health and quality of life outcomes, 4, 37.
Batt, M. E., Tanji, J. & Börjesson, M. 2013. Exercise at 65 and beyond. Sports Medicine, 43, 525-530.
Bauman, A., Ainsworth, B., Bull F, Craig, C., Hagströmer, M., Sallis, J., Pratt, M. & Sjöström, M. 2009. Progress and Pitfalls in the Use of the International Physical Activity Questionnaire (IPAQ) for Adult Physical Activity Surveillance. Journal of Physical Activity and Health, 6, S5–S8.
Bauman, A. E., Reis, R. S., Sallis, J. F., Wells, J. C., Loos, R. J. & Martin, B. W. 2012. Correlates of physical activity: why are some people physically active and others not? The Lancet, 380, 258-271.
Bengoechea, E. G., Spence, J. C. & McGannon, K. R. 2005. Gender differences in perceived environmental correlates of physical activity. International Journal of Behavioral Nutrition and Physical Activity, 2, 12.
Blanchard, C. M., McGannon, K. R., Spence, J. C., Rhodes, R. E., Nehl, E., Baker, F. & Bostwick, J. 2005. Social ecological correlates of physical activity in normal weight, overweight, and obese individuals. International journal of obesity, 29, 720-726.
Burke, K. E., Schnittger, R., O’Dea, B., Buckley, V., Wherton, J. P. & Lawlor, B. A. 2012. Factors associated with perceived health in older adult Irish population. Aging & mental health, 16, 288-295.
Canadian Heritage 2013. Sport Participation 2010 Research Paper. Statistics Canada.
CARDI 2011. Physical Activity & Mental Health in Ageing. Dublin: Centre for Ageing Research and Development in Ireland.
Cavill, N., Kahlmeier, S. & Racioppi, F. 2006. Physical activity and health in Europe: evidence for action, World Health Organization.
CDC 2003. Prevalence of physical activity, including lifestyle acitivities among adults - United States, 2000-2001. In: MMWR (ed.). Centre for Disease Control and Prevention.

40
Chan, C. B., Spangler, E., Valcour, J. & Tudor‐Locke, C. 2003. Cross‐sectional Relationship of Pedometer‐Determined Ambulatory Activity to Indicators of Health. Obesity Research, 11, 1563-1570.
Chinn, D. J., White, M., Harland, J., Drinkwater, C. & Raybould, S. 1999. Barriers to physical activity and socioeconomic position: Implications for health promotion. Journal of Epidemiology and Community Health, 53, 191-192.
Chodzko-Zajko, W. J., Proctor, D. N., Fiatatrone Singh, M. A., Minson, C. T., Nigg, C. R., Salem, G. J. & Skinner, J. S. 2009. Exercise and Physical Activity for Older Adults: American College of Sports Medicine Position Stand. Medicine and Science in Sports and Exercise, 41, 1510-1530.
Danesh, J., Collins, R., Appleby, P. & Peto, R. 1998. Association of fibrinogen, C-reactive protein, albumin, or leukocyte count with coronary heart disease: meta-analyses of prospective studies. Jama, 279, 1477-1482.
Davison, K. K., Ford, E. S., Cogswell, M. E. & Dietz, W. H. 2002. Percentage of body fat and body mass index are associated with mobility limitations in people aged 70 and older from NHANES III. Journal of the American Geriatrics Society, 50, 1802-1809.
Department of Health and Children 2010. National Cardiovascular Health Policy, 2010-2019, Changing Cardiovascular Health. Dublin: Government Publications.
Department of Health and Children & Health Service Executive 2009. The National Guidelines on Physical Activity for Ireland.
Fahey, T., Layte, R. & Gannon, B. 2004. Sports participation and health among adults in Ireland. Economic and Social Research Institute (ESRI) Research Series.
Ferreira, R. S., da Silva Coqueiro, R., Barbosa, A. R., Pinheiro, P. A. & Fernandes, M. H. 2013. Relationship between BMI and physical performance among older adults. Geriatric Nursing, 34, 465-468.
Fortes, C., Mastroeni, S., Sperati, A., Pacifici, R., Zuccaro, P., Francesco, F., Agabiti, N., Piras, G., Amleto, D. A. & Ebrahim, S. 2013. Walking four times weekly for at least 15min is associated with longevity in a Cohort of very elderly people. Maturitas, 74, 246-251.
41
Foster, C., Hillsdon, M. & Thorogood, M. 2009. Interventions for promoting physical activity. Cochrane database of systematic reviews.
Friedmann, J. M., Elasy, T. & Jensen, G. L. 2001. The Relationship Between Body Mass Index and Self‐Reported Functional Limitation Among Older Adults: A Gender Difference. Journal of the American Geriatrics Society, 49, 398-403.
Geffken, D. F., Cushman, M., Burke, G. L., Polak, J. F., Sakkinen, P. A. & Tracy, R. P. 2001. Association between physical activity and markers of inflammation in a healthy elderly population. American Journal of Epidemiology, 153, 242-250.
Global Advocacy for Physical Activity (GAPA) the Advocacy Council of the International Society for Physical Activity and Health (ISPAH) February 2011. NCD Prevention: Investments that Work for Physical Activity. Available from: www.globalpa.org.uk/investmentsthatwork.
Hansen, B. H., Kolle, E., Dyrstad, S. M., Holme, I. & Anderssen, S. A. 2012. Accelerometer-determined physical activity in adults and older people. Medicine and science in sports and exercise, 44, 266-272.
Harris, T. J., Owen, C. G., Victor, C. R., Adams, R. & Cook, D. G. 2009. What factors are associated with physical activity in older people, assessed objectively by accelerometry? British Journal of Sports Medicine, 43, 442-450.
Idler, E. L. & Benyamini, Y. 1997. Self-rated health and mortality: a review of twenty-seven community studies. Journal of health and social behavior, 21-37.
Iestra, J., Kromhout, D., Van der Schouw, Y., Grobbee, D., Boshuizen, H. & Van Staveren, W. 2005. Effect Size Estimates of Lifestyle and Dietary Changes on All-Cause Mortality in Coronary Artery Disease Patients A Systematic Review. Circulation, 112, 924-934.
International Physical Activity Questionnaire. 2005. IPAQ Scoring Protocol [Online]. Available: https://sites.google.com/site/theipaq/scoring-protocol [Accessed 20 Jan 2010].
IPSOS MRBI 2011. Irish Sports Monitor 2011 Annual Report. Dublin: Irish Sports Council.
Ipsos MRBI 2012. Physical Activity and Sport 2011. Participation and attitudes of older people in Ireland. Go for Life and Irish Sports Council.
Ipsos MRBI 2013. Irish Sports Monitor Interim Report. Dublin.

42
Kahn, E. B., Ramsey, L. T., Brownson, R. C., Heath, G. W., Howze, E. H., Powell, K. E., Stone, E. J., Rajab, M. W., Corso, P. & Briss, P. A. 2002. The effectiveness of interventions to increase physical activity - A systematic review. American Journal of Preventive Medicine, 22, 73-108.
Lee, I.-M., Shiroma, E. J., Lobelo, F., Puska, P., Blair, S. N. & Katzmarzyk, P. T. 2012. Effect of physical inactivity on major non-communicable diseases worldwide: an analysis of burden of disease and life expectancy. The Lancet, 380, 219-229.
Lim, K. & Taylor, L. 2005. Factors associated with physical activity among older people—a population-based study. Preventive Medicine, 40, 33-40.
Lunn, P. & Layte, R. 2008. Sports Lives: An Analysis of a Lifetime of Irish Sport. Dublin: The Economic and Social Research Institute.
Martínez-González, M. Á., Alfredo Martinez, J., Hu, F., Gibney, M. & Kearney, J. 1999. Physical inactivity, sedentary lifestyle and obesity in the European Union. International Journal of Obesity & Related Metabolic Disorders, 23.
Martinson, B. C., Crain, A. L., Pronk, N. P., O’Connor, P. J. & Maciosek, M. V. 2003. Changes in physical activity and short-term changes in health care charges: a prospective cohort study of older adults. Preventive Medicine, 37, 319-326.
McGill, P. 2010. Illustrating ageing in Ireland North and South: Key facts and figures. Belfast: Centre for Ageing Research and Development in Ireland.
Mello, D. B., Verdini, M. L. P., Dantas, E. H. M., Giani, T. S., Ferreira, M. A., Emygdio, R. F. & Hortale, V. A. 2010. Impact of obesity on quality of life in the elderly. Medicina Sportiva, 14, 63-66.
Morgan, K., O'Farrell, J., Doyle, F. & McGee, H. 2011. Physical activity and core depressive symptoms in the older Irish adult population. A project funded by the Centre for Ageing Research and Development in Ireland (CARDI). Dublin: Royal College of Surgeons in Ireland.
Moschny, A., Platen, P., Klaaßen-Mielke, R., Trampisch, U. & Hinrichs, T. 2011. Physical activity patterns in older men and women in Germany: a cross-sectional study. BMC public health, 11, 559.
Nelson, M., Rejeski, W., Blair, S. N., Duncan, P., Judge, J., King, A., Macera, C. A. & Castaneda-Sceppa, C. 2007. Physical Activity and Public Health in Older Adults:

43
Recommendation From the American College of Sports Medicine and the American Heart Association. Circulation, 116, 1094-1105.
Nichols, M., Townsend, N., Luengo-Fernandez, R., Leal, J., Gray, A., Scarborough, P. & Rayner, M. 2012. European cardiovascular disease statistics 2012. European Heart Network, Brussels, European Society of Cardiology, Sophia Antipolis, 104.
Nieman, D. C. 2003. Exercise testing and prescription: a health-related approach, Mountain View, CA, Mayfield.
Owen, N., Humpel, N., Leslie, E., Bauman, A. & Sallis, J. F. 2004. Understanding environmental influences on walking: review and research agenda. American journal of preventive medicine, 27, 67-76.
Pampel, F. C., Krueger, P. M. & Denney, J. T. 2010. Socioeconomic disparities in health behaviors. Annual review of sociology, 36, 349-370.
Patel, K., Sui, X., Zhang, Y., Fonarow, G. C., Aban, I. B., Brown, C. J., Bittner, V., Kitzman, D. W., Allman, R. M. & Banach, M. 2013. Prevention of heart failure in older adults may require higher levels of physical activity than needed for other cardiovascular events. International journal of cardiology, 168, 1905-1909.
Paterson, D. H. & Warburton, D. E. 2010. Physical activity and functional limitations in older adults: a systematic review related to Canada's Physical Activity Guidelines. International Journal of Behavioral Nutrition and Physical Activity, 7, 38.
Riechman, S. E., Schoen, R. E., Weissfeld, J. L., Thaete, F. L. & Kriska, A. M. 2012. Association of physical activity and visceral adipose tissue in older women and men. Obesity Research, 10, 1065-1073.
Ruigómez, A., Alonso, J. & Antó, J. M. 1995. Relationship of health behaviours to five-year mortality in an elderly cohort. Age and ageing, 24, 113-119.
Rydwik, E., Welmer, A.-K., Kareholt, I., Angleman, S., Fratiglioni, L. & Wang, H.-X. 2012. Adherence to physical exercise recommendations in people over 65—The SNAC-Kungsholmen study. The European Journal of Public Health, 1-6.
Sargent-Cox, K. A., Anstey, K. J. & Luszcz, M. A. 2010. The choice of self-rated health measures matter when predicting mortality: evidence from 10 years follow-up of the Australian longitudinal study of ageing. BMC geriatrics, 10, 18.
44
Sattelmair, J., Pertman, J., Ding, E. L., Kohl, H. W., Haskell, W. & Lee, I.-M. 2011. Dose response between physical activity and risk of coronary heart disease a meta-analysis. Circulation, 124, 789-795.
Sherman, S. E., D'Agostino, R. B., Cobb, J. L. & Kannel, W. B. 1994. Does exercise reduce mortality rates in the elderly? Experience from the Framingham Heart Study. American heart journal, 128, 965-972.
Sims, J., Hill, K., Hunt, S., Haralambous, B., Brown, A., Engel, L., Huang, N., Kerse, N. & Ory, M. 2006. National physical activity recommendations for older Australians: Discussion document. Canberra: Australian Government Department of Health and Ageing.
Sport Northern Ireland 2010. The Northern Ireland Sport and Physical Activivity Survey (SAPAS) 2010. A baseline report. Sport NI and Dept Culture, Arts and Leisure.
Stanaway, F. F., Gnjidic, D., Blyth, F. M., Le Couteur, D. G., Naganathan, V., Waite, L., Seibel, M. J., Handelsman, D. J., Sambrook, P. N. & Cumming, R. G. 2011. How fast does the Grim Reaper walk? Receiver operating characteristics curve analysis in healthy men aged 70 and over. British Medical Journal, 343, d7679.
Stathi, A., McKenna, J. & Fox, K. 2010. Processes associated with participation and adherence to a 12-month exercise programme for adults aged 70 and older. Journal of health psychology, 15, 838-847.
Stevens, W., Hillsdon, M., Thorogood, M. & McArdle, D. 1998. Cost-effectiveness of a primary care based physical activity intervention in 45-74 year old men and women: a randomised controlled trial. British journal of sports medicine, 32, 236-241.
Thurston, M. & Green, K. 2004. Adherence to exercise in later life: how can exercise on prescription programmes be made more effective? Health Promotion International, 19, 379-387.
Timiras, P. S. 2003. Physiological Basis of Aging and Geriatrics, , Boca Raton, FL, CRC Press.
Townsend, N., Bhatnagar, P., Wickramasinghe, K., Scarborough, P., Foster, C. & Rayner, M. 2012. Physical activity Statistics 2012. London: British Heart Foundation.
United Nations 2009. World Population Ageing 2009. New York: United Nations.

45
Van Cauwenberg, J., Van Holle, V., De Bourdeaudhuij, I., Clarys, P., Nasar, J., Salmon, J., Maes, L., Goubert, L., Van de Weghe, N. & Deforche, B. 2014. Physical Environmental Factors that Invite Older Adults to Walk for Transportation. Journal of Environmental Psychology.
Vina, J., Borras, C. & Miquel, J. 2007. Theories of ageing. International Union of Biochemistry and Molecular Biology Life, 59, 249-254.
Vogel, T., Brechat, P. H., Leprêtre, P. M., Kaltenbach, G., Berthel, M. & Lonsdorfer, J. 2009. Health benefits of physical activity in older patients: a review. International Journal of Clinical Practice, 63, 303-320.
Wagner, A., Simon, C., Ducimetiere, P., Montaye, M., Bongard, V., Yarnell, J., Bingham, A., Hedelin, G., Amouyel, P. & Ferrieres, J. 2001. Leisure-time physical activity and regular walking or cycling to work are associated with adiposity and 5 y weight gain in middle-aged men: the PRIME Study. International Journal of Obesity & Related Metabolic Disorders, 25, 940–948.
Walsh, K. & Ward, P. 2013. Social Exclusion and Ageing in Rural Areas: Patterns and Implications. Rural Ageing Observatory Paper. Galway, Ireland: Irish Centre for Social Gerontology.
Ward, M., McGee, H., Morgan, K., Van Lente, E., Layte, R., Barry, M., Watson, D., Shelley, E. & Perry, I. 2009. SLÁN 2007: Survey of Lifestyle, Attitudes and Nutrition in Ireland. ‘One Island – One Lifestyle?’ Health and lifestyles in the Republic of Ireland and Northern Ireland: Comparing the population surveys SLÁN 2007 and NIHSWS 2005. Dublin: Department of Health and Children.
Whelan, B. J. & Savva, G. M. 2013. Design and methodology of the irish longitudinal study on ageing. Journal of the American Geriatrics Society, 61, S265-S268.
Woo, J., Leung, J. & Kwok, T. 2007. BMI, body composition, and physical functioning in older adults. Obesity, 15, 1886-1894.
World Health Organisation 1996. Epidemiology and Prevention of Cardiovascular Diseases in Elderly People: Report of a WHO Study Group. WHO Technical Report Series 853. Geneva, Switzerland: WHO.
World Health Organisation 2003. Diet, Nutrition, and the Prevention of Chronic Diseases: Report of a Joint WHO/FAO Expert Consultation. WHO Technical Report Series 916. Geneva, Switzerland: WHO.

46
World Health Organisation 2011. Cardiovascular diseases (CVDs). Fact sheet N 317. Switzerland: WHO.
World Health Organisation 2013. Physical activity promotion in socially disadvantaged groups: principles for action. PHAN Work Package 4 Final Report. World Health Organisation Regional Office for Europe.
World Health Organization 2010. Global Recommendations on Physical Activity for Health, Switzerland, WHO.