status report - world bankpubdocs.worldbank.org/en/917221487262351436/03-03-icp-tag07...civil...
TRANSCRIPT

A Preliminary Assessment of the Effect of the Change in Construction Methodology Between the 2005 and 2011 Rounds
7TH Technical Advisory Group Meeting
September 17-18, 2012
Washington, DC
[03.03]

Outline
Comparing the 2005 and 2011 ICP rounds
2005 Results Using the BOCC Method
2005 Results Using the Input Method
Comparison of Results and Conclusions
2

Comparing the 2005 and 2011 ICP rounds
3

4
Change in size of the economies
Change in price and
consumption patterns
Change in country
participation and regional
grouping
Change in application of methodology
in regions (Housing,
Productivity Adj., etc)
Change in methodology
(Linking, Construction,
etc)
Change in Exchange
Rates
Change in Population
Economic and Demographic
Factors
ICP Factors
2005 2011
Change in product lists and survey frames
Changes between 2005 and 2011 ICP rounds
Statistical Errors in 2005 Round and 2011 Round

5
Construction: 2005 vs. 2011
2005 Approach – BOCC Method 2011 Approach – Input Method
Basket A combination of simple and complex components. Simple components are inputs. Complex components are composed of a certain mix of inputs (Materials, Labor, and Equipment).
A basket of simple components: Materials (38 inputs) Equipment (5 inputs) Labor (7 inputs).
Structure 3 BHs: Residential, Non-Residential, and Civil Engineering. Components are grouped under systems that play the role of sub-headings.
3 BHs: Residential, Non-Residential, and Civil Engineering. Each BH has three Sub-Headings: Materials, Equipment and Labor.
PPP computation
Unweighted CPD is used to calculate PPPs for these Systems (Sub-Headings).
Unweighted CPD is used to calculate PPPs for these Sub-Headings.
PPP aggregation
Aggregation of the Systems PPPs to the BH level PPPs requires System Weights (W2 weights).
Aggregation of the Sub-Heading PPPs to the BH level PPPs requires Sub-Heading Resource Mixes to be used as weights.
Issues Difficulties with the establishment of W2 weights and confusion over the mixture of simple and complex components.
Need Markups and professional fees? Need Productivity Adjustment? Resource mixes need to be reliable.

2005 Results Using the BOCC Method
6
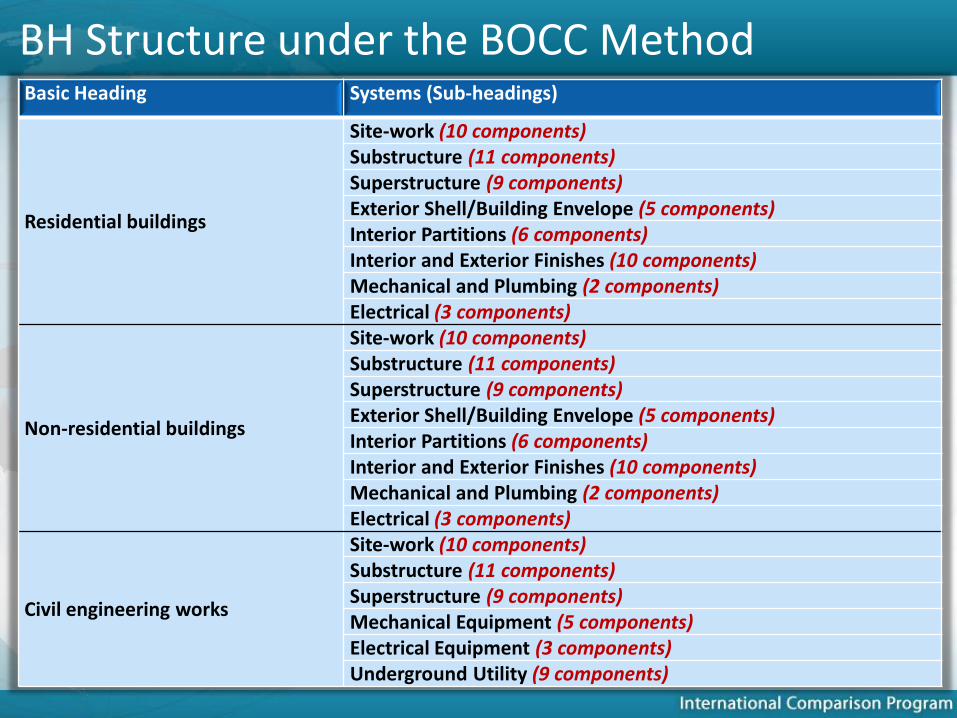
BH Structure under the BOCC Method
7
Basic Heading Systems (Sub-headings)
Residential buildings
Site-work (10 components) Substructure (11 components) Superstructure (9 components) Exterior Shell/Building Envelope (5 components) Interior Partitions (6 components) Interior and Exterior Finishes (10 components) Mechanical and Plumbing (2 components) Electrical (3 components)
Non-residential buildings
Site-work (10 components) Substructure (11 components) Superstructure (9 components) Exterior Shell/Building Envelope (5 components) Interior Partitions (6 components) Interior and Exterior Finishes (10 components) Mechanical and Plumbing (2 components) Electrical (3 components)
Civil engineering works
Site-work (10 components) Substructure (11 components) Superstructure (9 components) Mechanical Equipment (5 components) Electrical Equipment (3 components) Underground Utility (9 components)

Estimating W2 weights
8
Systems Residential Buildings
Non-Residential Buildings Civil Engineering
Non-Gulf Gulf Non-Gulf Gulf Non-Gulf Gulf
Site-work 5% 3% 6% 3% 12% 37%
Substructure 22% 14% 18% 13% 21% 22%
Superstructure 23% 22% 23% 25% 40% 27%
Exterior Shell/ Building Envelope 12% 6% 10% 6%
Interior Partitions 9% 7% 10% 7%
Interior and Exterior Finishes 11% 19% 17% 16%
Mechanical and Plumbing 10% 17% 9% 14%
Electrical 8% 13% 8% 17%
Mechanical Equipment 10% 3%
Electrical Equipment 8% 4%
Underground Utility 9% 7%

9
Code Aggregate
PLIs (Base=Region)
Bah
rain
Egyp
t
Iraq
Jord
an
Ku
wai
t
Leb
ano
n
Om
an
Qat
ar
S. A
rab
ia
Syri
a
Yem
en
1502 Construction 1.14 0.65 1.13 1.09 1.19 1.02 1.19 1.35 1.20 0.79 0.60
15021 Residential
Buildings 1.15 0.57 1.08 1.20 1.21 1.22 1.16 1.23 1.37 0.70 0.59
15022 Non-Residential
Buildings 1.17 0.63 1.06 1.08 1.08 1.04 1.22 1.23 1.26 0.83 0.68
15023 Civil Engineering
Works 1.14 0.74 1.24 1.01 1.25 0.86 1.21 1.77 0.88 0.87 0.54
2005 Results using the BOCC Method

2005 Results Using the Input Method
10

Scenarios Under the Input Method
11
Resource mix shares were identified to help estimate the national accounts expenditure at the sub-heading level.
Scenario A: computed the PPPs for Materials, Labor, and Equipment using the unit costs of overlapping inputs between the BOCC and Input methods.
Scenario B: considered the unit costs of all inputs -Materials, Labor, and Equipment- identified from the BOCC data sets submitted by countries.
Prices
National Accounts

BH Structure under the Input Method
12
Basic Heading Sub-headings
Residential buildings
Materials: 34 material inputs
Equipment: 5 types of equipment (hire rates)
Labor: 7 categories of construction labor
Non-residential buildings
Materials: 36 material inputs
Equipment: 5 types of equipment (hire rates)
Labor: 7 categories of construction labor
Civil engineering works
Materials: 19 material inputs
Equipment: 5 types of equipment (hire rates)
Labor: 7 categories of construction labor

Estimating Resource Mixes
13
H = High; M = Medium; and L = Low.
Bah
rain
Egyp
t
Iraq
Jord
an
Ku
wai
t
Leb
ano
n
Om
an
Qat
ar
S. A
rab
ia
Syri
a
Yem
en
Income Classification H M M M H M H H H M M
Relative Cost of labor M L M M H H M M H L L
CONSTRUCTION
Residential buildings
Labor 25% 20% 25% 25% 30% 25% 25% 25% 30% 20% 20%
Equipment 5% 5% 5% 5% 8% 5% 5% 5% 8% 5% 5%
Materials 70% 75% 70% 70% 63% 70% 70% 70% 63% 75% 75%
Non-residential buildings
Labor 25% 20% 25% 25% 30% 25% 25% 25% 30% 20% 20%
Equipment 8% 8% 8% 8% 10% 8% 8% 8% 10% 8% 8%
Materials 68% 73% 68% 68% 60% 68% 68% 68% 60% 73% 73%
Civil engineering works
Labor 23% 20% 23% 23% 20% 23% 23% 23% 20% 20% 20%
Equipment 28% 30% 28% 28% 30% 28% 28% 28% 30% 30% 30%
Materials 50% 50% 50% 50% 50% 50% 50% 50% 50% 50% 50%

Scenario A: Overlap with BOCC
14
Materials (9 inputs) Labor (7 inputs) Equipment (5 inputs)
Aggregate for concrete General (unskilled)
laborers
Wheeled loader and
excavator
Sand for concrete and mortar Bricklayer Tracked tractor
Exterior plywood Plumber Skid steer loader
Emulsion paint Carpenter Tandem vibrating roller
Ordinary Portland cement Structural steel worker Compact track loader
Ready mix concrete Electrician
High yield steel reinforcement Machine (equipment)
operator
Mild steel reinforcement
Structural steel sections

15
Code Aggregate
PLIs (Base=Region)
Bah
rain
Egyp
t
Iraq
Jord
an
Ku
wai
t
Leb
ano
n
Om
an
Qat
ar
S. A
rab
ia
Syri
a
Yem
en
1502 Construction 1.13 0.62 1.15 0.92 1.78 0.93 0.85 1.15 1.18 0.73 0.97
15021 Residential
Buildings 1.15 0.63 1.24 0.88 1.59 1.00 0.85 1.10 1.20 0.71 1.02
15022 Non-Residential
Buildings 1.14 0.63 1.22 0.89 1.64 0.98 0.86 1.11 1.19 0.71 0.99
15023 Civil Engineering
Works 1.09 0.63 1.04 1.01 2.08 0.86 0.86 1.28 1.14 0.76 0.81
Scenario A: 2005 Results

Scenario B: Larger basket of inputs
16
Materials (31 inputs)
Labor (7 inputs)
Equipment (5 inputs)
Residential Buildings
Non-Residential
Buildings
Civil Engineering
Materials (31 inputs)
Labor (7 inputs)
Equipment (5 inputs)
Materials (34 inputs)
Labor (7 inputs)
Equipment (5 inputs)

17
Code Aggregate
PLIs (Base=Region)
Bah
rain
Egyp
t
Iraq
Jord
an
Ku
wai
t
Leb
ano
n
Om
an
Qat
ar
S. A
rab
ia
Syri
a
Yem
en
1502 Construction 1.04 0.64 1.08 1.04 1.50 0.86 1.03 1.17 1.32 0.74 0.88
15021 Residential
Buildings 1.05 0.61 1.07 1.04 1.52 0.89 1.04 1.19 1.28 0.72 0.91
15022 Non-Residential
Buildings 1.05 0.61 1.07 1.04 1.54 0.85 1.04 1.18 1.32 0.73 0.90
15023 Civil Engineering
Works 1.00 0.70 1.11 1.06 1.49 0.86 1.00 1.13 1.39 0.79 0.76
Scenario B: 2005 Results

Comparison of Results and Conclusions
18

19
Agg
rega
te
Met
ho
ds PLIs (Base=Region)
Ave
rage
of
abso
lute
%
ch
ange
Bah
rain
Egyp
t
Iraq
Jord
an
Ku
wai
t
Leb
ano
n
Om
an
Qat
ar
S. A
rab
ia
Syri
a
Yem
en
Co
nst
ruct
ion
BOCC Method 1.14 0.65 1.13 1.09 1.19 1.02 1.19 1.35 1.20 0.79 0.60
Input Method
- Scenario A 1.13 0.62 1.15 0.92 1.78 0.93 0.85 1.15 1.18 0.73 0.97
% change -1% -4% 2% -16% 50% -9% -28% -15% -1% -9% 61% 18%
Input Method
- Scenario B 1.04 0.64 1.08 1.04 1.50 0.86 1.03 1.17 1.32 0.74 0.88
% change -9% -1% -4% -5% 26% -15% -14% -13% 10% -7% 47% 14%
Comparison of Results

Conclusions and Questions
20
No markups or professional fees included in the analysis, as this information was not collected in 2005. Are markups and professional fees needed?
No productivity adjustment on the cost of labor under the Input Method. Does the data imply the need to adjust for labor productivity?
BOCC method has multiple layers of weights (mix of inputs under each component, frequency of inputs under components, and system weights). Input method has one set of weights (Resource mixes). Thus, it is crucial to have reliable resource mixes.
We can obtain resource mixes from the BOCC data in some regions. The cost of materials, labor, and equipment as percentages from the total cost of each complex component can be used to deduce average resource mixes for each country. Would that be useful?
To further study the impact of the change in Construction methodology between the 2005 and 2011 Rounds on the resulting PPPs for Construction, the 2005 Construction PPPs need to be compared to the 2011 preliminary Construction PPPs, once these are available.

21