status of mineral resource information for the fort peck ... · status of mineral resource...
TRANSCRIPT

STATUS OF MINERAL RESOURCE INFORMATION FOR THE FORT PECK INDIAN RESERVATION,
NORTHEASTERN MONTANA
By
M. R. Mudge Michael Sokaski
D. D. Rice George McIntyre
U.S. Geological Survey U.S. Bureau of Mines
Administrative report BIA-28
1977

CONTENTS
SUMMARY AND CONCLUSIONS . . . . . . . . . . . . . . . . . . . . . . . . . . . . . . . . . . . . . . . . . . . . . . . . . 1
INTRODUCTION . . . . . . . . . . . . . . . . . . . . . . . . . . . . . . . . . . . . . . . . . . . . . . . . . . . . . . . . . . . . . . . . 1
Previous Investigations . . . . . . . . . . . . . . . . . . . . . . . . . . . . . . . . . . . . . . . . . . . . . . . . . . . . . . 2
Present Investigation . . . . . . . . . . . . . . . . . . . . . . . . . . . . . . . . . . . . . . . . . . . . . . . . . . . . . . . . 2
GEOLOGY . . . . . . . . . . . . . . . . . . . . . . . . . . . . . . . . . . . . . . . . . . . . . . . . . . . . . . . . . . . . . . . . . . . . . 2
General . . . . . . . . . . . . . . . . . . . . . . . . . . . . . . . . . . . . . . . . . . . . . . . . . . . . . . . . . . . . . . . . . . . 2
Stratigraphy . . . . . . . . . . . . . . . . . . . . . . . . . . . . . . . . . . . . . . . . . . . . . . . . . . . . . . . . . . . . . . . 2
Structure. . . . . . . . . . . . . . . . . . . . . . . . . . . . . . . . . . . . . . . . . . . . . . . . . . . . . . . . . . . . . . . . . . 5
MINERAL RESOURCES . . . . . . . . . . . . . . . . . . . . . . . . . . . . . . . . . . . . . . . . . . . . . . . . . . . . . . . . . . 5
General . . . . . . . . . . . . . . . . . . . . . . . . . . . . . . . . . . . . . . . . . . . . . . . . . . . . . . . . . . . . . . . . . . . 5
Energy Resources. . . . . . . . . . . . . . . . . . . . . . . . . . . . . . . . . . . . . . . . . . . . . . . . . . . . . . . . . . . 6
Petroleum and Natural Gas . . . . . . . . . . . . . . . . . . . . . . . . . . . . . . . . . . . . . . . . . . . . . 6
General . . . . . . . . . . . . . . . . . . . . . . . . . . . . . . . . . . . . . . . . . . . . . . . . . . . . . . . 6
Oilfield Stratigraphy . . . . . . . . . . . . . . . . . . . . . . . . . . . . . . . . . . . . . . . . . . . . 6
Productive Structures . . . . . . . . . . . . . . . . . . . . . . . . . . . . . . . . . . . . . . . . . . . . 7
Production . . . . . . . . . . . . . . . . . . . . . . . . . . . . . . . . . . . . . . . . . . . . . . . . . . . . 8
Oil Fields . . . . . . . . . . . . . . . . . . . . . . . . . . . . . . . . . . . . . . . . . . . . . . . . . . . . . 9
General . . . . . . . . . . . . . . . . . . . . . . . . . . . . . . . . . . . . . . . . . . . . . . . . . 9
East Poplar . . . . . . . . . . . . . . . . . . . . . . . . . . . . . . . . . . . . . . . . . . . . . . 9
Northwest Poplar . . . . . . . . . . . . . . . . . . . . . . . . . . . . . . . . . . . . . . . . 11
Tule Creek . . . . . . . . . . . . . . . . . . . . . . . . . . . . . . . . . . . . . . . . . . . . . 12
East Tule Creek . . . . . . . . . . . . . . . . . . . . . . . . . . . . . . . . . . . . . . . . . 13
South Tule Creek . . . . . . . . . . . . . . . . . . . . . . . . . . . . . . . . . . . . . . . . 14
Benrud . . . . . . . . . . . . . . . . . . . . . . . . . . . . . . . . . . . . . . . . . . . . . . . . 15
East Benrud . . . . . . . . . . . . . . . . . . . . . . . . . . . . . . . . . . . . . . . . . . . . 16
Northeast Benrud . . . . . . . . . . . . . . . . . . . . . . . . . . . . . . . . . . . . . . . . 17
Volt . . . . . . . . . . . . . . . . . . . . . . . . . . . . . . . . . . . . . . . . . . . . . . . . . . 18
Bredette . . . . . . . . . . . . . . . . . . . . . . . . . . . . . . . . . . . . . . . . . . . . . . . 19
North Bredette . . . . . . . . . . . . . . . . . . . . . . . . . . . . . . . . . . . . . . . . . . 19
Red Fox . . . . . . . . . . . . . . . . . . . . . . . . . . . . . . . . . . . . . . . . . . . . . . . 20
Mineral Bench . . . . . . . . . . . . . . . . . . . . . . . . . . . . . . . . . . . . . . . . . . 21
Chelsea Creek . . . . . . . . . . . . . . . . . . . . . . . . . . . . . . . . . . . . . . . . . . 22
Wolf Creek. . . . . . . . . . . . . . . . . . . . . . . . . . . . . . . . . . . . . . . . . . . . . 22
Oil Refining . . . . . . . . . . . . . . . . . . . . . . . . . . . . . . . . . . . . . . . . . . . . . . . . . . 23
Transportation and Markets . . . . . . . . . . . . . . . . . . . . . . . . . . . . . . . . . . . . . . 23
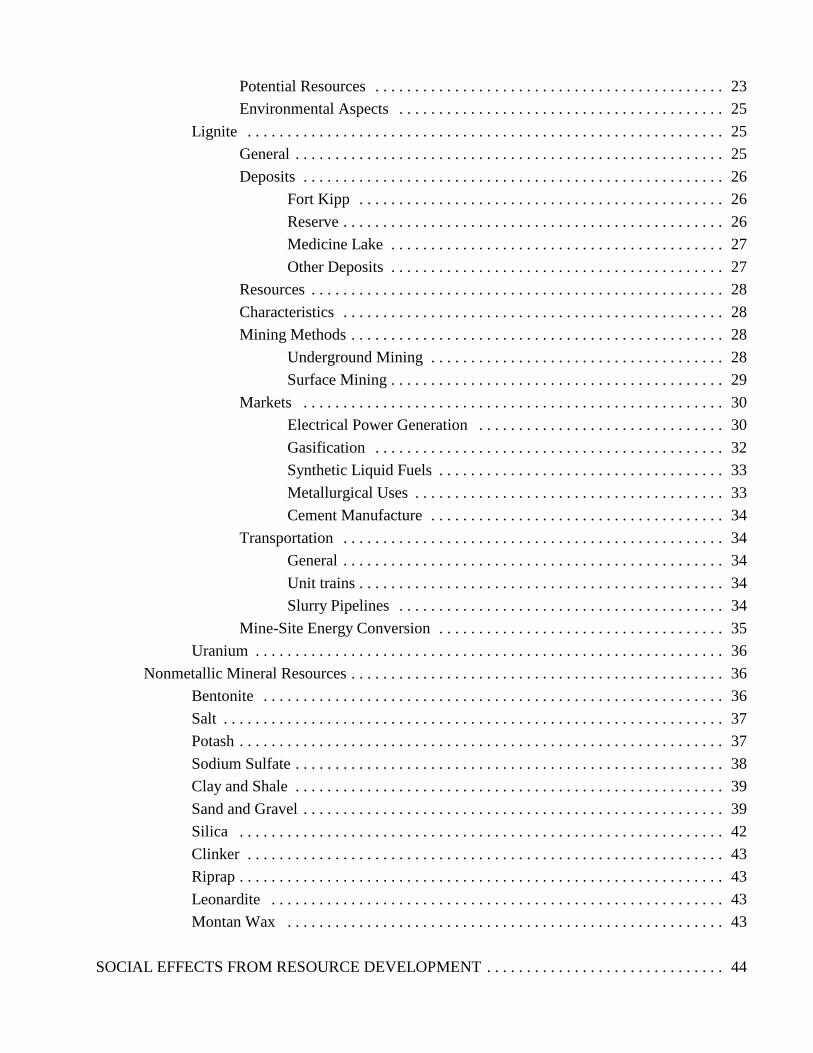
Potential Resources . . . . . . . . . . . . . . . . . . . . . . . . . . . . . . . . . . . . . . . . . . . . 23
Environmental Aspects . . . . . . . . . . . . . . . . . . . . . . . . . . . . . . . . . . . . . . . . . 25
Lignite . . . . . . . . . . . . . . . . . . . . . . . . . . . . . . . . . . . . . . . . . . . . . . . . . . . . . . . . . . . . 25
General . . . . . . . . . . . . . . . . . . . . . . . . . . . . . . . . . . . . . . . . . . . . . . . . . . . . . . 25
Deposits . . . . . . . . . . . . . . . . . . . . . . . . . . . . . . . . . . . . . . . . . . . . . . . . . . . . . 26
Fort Kipp . . . . . . . . . . . . . . . . . . . . . . . . . . . . . . . . . . . . . . . . . . . . . . 26
Reserve. . . . . . . . . . . . . . . . . . . . . . . . . . . . . . . . . . . . . . . . . . . . . . . . 26
Medicine Lake . . . . . . . . . . . . . . . . . . . . . . . . . . . . . . . . . . . . . . . . . . 27
Other Deposits . . . . . . . . . . . . . . . . . . . . . . . . . . . . . . . . . . . . . . . . . . 27
Resources . . . . . . . . . . . . . . . . . . . . . . . . . . . . . . . . . . . . . . . . . . . . . . . . . . . . 28
Characteristics . . . . . . . . . . . . . . . . . . . . . . . . . . . . . . . . . . . . . . . . . . . . . . . . 28
Mining Methods. . . . . . . . . . . . . . . . . . . . . . . . . . . . . . . . . . . . . . . . . . . . . . . 28
Underground Mining . . . . . . . . . . . . . . . . . . . . . . . . . . . . . . . . . . . . . 28
Surface Mining. . . . . . . . . . . . . . . . . . . . . . . . . . . . . . . . . . . . . . . . . . 29
Markets . . . . . . . . . . . . . . . . . . . . . . . . . . . . . . . . . . . . . . . . . . . . . . . . . . . . . 30
Electrical Power Generation . . . . . . . . . . . . . . . . . . . . . . . . . . . . . . . 30
Gasification . . . . . . . . . . . . . . . . . . . . . . . . . . . . . . . . . . . . . . . . . . . . 32
Synthetic Liquid Fuels . . . . . . . . . . . . . . . . . . . . . . . . . . . . . . . . . . . . 33
Metallurgical Uses . . . . . . . . . . . . . . . . . . . . . . . . . . . . . . . . . . . . . . . 33
Cement Manufacture . . . . . . . . . . . . . . . . . . . . . . . . . . . . . . . . . . . . . 34
Transportation . . . . . . . . . . . . . . . . . . . . . . . . . . . . . . . . . . . . . . . . . . . . . . . . 34
General . . . . . . . . . . . . . . . . . . . . . . . . . . . . . . . . . . . . . . . . . . . . . . . . 34
Unit trains. . . . . . . . . . . . . . . . . . . . . . . . . . . . . . . . . . . . . . . . . . . . . . 34
Slurry Pipelines . . . . . . . . . . . . . . . . . . . . . . . . . . . . . . . . . . . . . . . . . 34
Mine-Site Energy Conversion . . . . . . . . . . . . . . . . . . . . . . . . . . . . . . . . . . . . 35
Uranium . . . . . . . . . . . . . . . . . . . . . . . . . . . . . . . . . . . . . . . . . . . . . . . . . . . . . . . . . . . 36
Nonmetallic Mineral Resources. . . . . . . . . . . . . . . . . . . . . . . . . . . . . . . . . . . . . . . . . . . . . . . 36
Bentonite . . . . . . . . . . . . . . . . . . . . . . . . . . . . . . . . . . . . . . . . . . . . . . . . . . . . . . . . . . 36
Salt . . . . . . . . . . . . . . . . . . . . . . . . . . . . . . . . . . . . . . . . . . . . . . . . . . . . . . . . . . . . . . . 37
Potash. . . . . . . . . . . . . . . . . . . . . . . . . . . . . . . . . . . . . . . . . . . . . . . . . . . . . . . . . . . . . 37
Sodium Sulfate. . . . . . . . . . . . . . . . . . . . . . . . . . . . . . . . . . . . . . . . . . . . . . . . . . . . . . 38
Clay and Shale . . . . . . . . . . . . . . . . . . . . . . . . . . . . . . . . . . . . . . . . . . . . . . . . . . . . . . 39
Sand and Gravel . . . . . . . . . . . . . . . . . . . . . . . . . . . . . . . . . . . . . . . . . . . . . . . . . . . . . 39
Silica . . . . . . . . . . . . . . . . . . . . . . . . . . . . . . . . . . . . . . . . . . . . . . . . . . . . . . . . . . . . . 42
Clinker . . . . . . . . . . . . . . . . . . . . . . . . . . . . . . . . . . . . . . . . . . . . . . . . . . . . . . . . . . . . 43
Riprap. . . . . . . . . . . . . . . . . . . . . . . . . . . . . . . . . . . . . . . . . . . . . . . . . . . . . . . . . . . . . 43
Leonardite . . . . . . . . . . . . . . . . . . . . . . . . . . . . . . . . . . . . . . . . . . . . . . . . . . . . . . . . . 43
Montan Wax . . . . . . . . . . . . . . . . . . . . . . . . . . . . . . . . . . . . . . . . . . . . . . . . . . . . . . . 43
SOCIAL EFFECTS FROM RESOURCE DEVELOPMENT . . . . . . . . . . . . . . . . . . . . . . . . . . . . . . 44

RECOMMENDATIONS FOR FURTHER WORK . . . . . . . . . . . . . . . . . . . . . . . . . . . . . . . . . . . . . 44
REFERENCES . . . . . . . . . . . . . . . . . . . . . . . . . . . . . . . . . . . . . . . . . . . . . . . . . . . . . . . . . . . . . . . . . 46

_________________________________________________________________________________________________
Status of Mineral Resource Information For The Fort Peck Indian Reservation, Northeastern Montana M. R. Mudge, Michael Sokaski, D. D. Rice, and George McIntyre
SUMMARY AND CONCLUSIONS
Petroleum and natural gas and lignite are the
most important mineral resources on the Fort Peck
Indian Reservation. Oil is being produced and
lignite resources are sufficient to support
large-scale surface mining. Deposits of salt,
potash, clay, shale, bentonite, clinker, sand, gravel,
silica, and possibly sodium sulfate are present.
Some lignite may contain significant quantities of
leonardite, montan wax, and uranium.
Additional petroleum and natural gas discover
ies are likely. Geologic and geophysical surveys
should be conducted in favorable, though still
unexplored, areas.
The eastern part of the reservation contains
three large lignite deposits that can be mined by
surface methods. Further exploration aimed at
finding other deposits should be undertaken.
The clay, shale, bentonite, sand, gravel, and
silica deposits should be examined to obtain
additional information as to their quality and size.
INTRODUCTION
The Fort Peck Indian Reservation occupies
about 1,456 square miles (931,792 acres) in Val
ley, Roosevelt, Daniels, and Sheridan Counties in
northeastern Montana (Figure 1 and Figure 2). The
reservation has natural boundaries on three sides;
the Missouri River on the south, Porcupine Creek
on the west, and Big Muddy Creek on the east. The
northern boundary is along the upper part of the
second tier of sections through township 33 N.,
from the east side of Range 39 E. to the east side of
Range 55 E.
The Fort Peck Indian Reservation is in the
Northern Great Plains and typically has rolling
uplands that are dissected by the Missouri and
Poplar Rivers and their tributaries. The Missouri
River is the largest stream in the area, flowing
eastward at a gradient of about 1 foot per mile.
The Poplar River flows south across the central
part of the reservation to join the Missouri River at
Poplar. The altitude ranges from about 3,050 feet
in the northwestern part of the reservation to less
than 1,900 feet in the southeastern part.
The main settlements are in the valley of the
Missouri River, along U.S. Highway 2 (Figure 2);
the largest city is Wolf Point. The largest nearby
city is Glasgow, about 15 miles west of the south
west corner of the reservation. A few Post Office
stations are in the northern part of the reservation.
State Highway 13 extends north through the
center of the reservation and State Highway 247
(not on map) extends across the northwest corner.
Several unsurfaced county roads are present, but
not shown on Figure 2. The main line of the
Burlington Northern Railroad extends across the
southern edge of the reservation, parallel to U.S.
Highway 2, and a branch line extends north on the
east side of Big Muddy Creek.
Cattle grazing and wheat farming, extensive in
the upland areas, are the main industry. There is
production of oil in the central and northwestern
parts. Sand and gravel and lignite are the other
principal mineral commodities that have been
produced.
BIA Administrative Report 28 (1977) 1
_________________________________________________________________________________________________
Status of Mineral Resource Information For The Fort Peck Indian Reservation, Northeastern Montana M. R. Mudge, Michael Sokaski, D. D. Rice, and George McIntyre
Previous Investigations
The reservation and adjacent areas have been
of much geologic interest since Lewis and Clark
traveled up the Missouri River in 1805. The
Hayden survey included the region in its studies of
the Nebraska territory (Meek and Hayden, 1862;
Meek, 1876). An early study evaluated the ex
posed lignite beds (Smith, 1910) in the reservation.
In 1946 geologic studies in and near the reser
vation provided data for the U.S. Bureau of Recla
mation. Numerous maps and reports were pre
pared by Colton (1955, 1962, 1963a-j, and 1964a
and b); Colton and Bateman (1956); Colton,
Lemke, and Lindvall (1961); Witkind (1959); and
Jensen and Varnes (1964). A recent study near the
reservation is an unpublished mineral resource
survey of the Charles M. Russell National Wildlife
Range (Wolfbauer and Rice, 1976).
The reservation's mineral resources and their
potential were evaluated by Henkes and Magill
(1970). Ayler, Smith, and Deutman (1969) de
scribed coal deposits in Montana that are minable
by surface methods. Three of these deposits are on
the reservation. The lignite, salt, and potash
deposits have been described by the Great North
ern Railway Co. (Burlington Northern, Inc.;
1953-1955, 1959, 1965, 1966). Witkind (1959)
described geology and mineral resources in the
northeastern part of the reservation.
Present Investigation
This report was prepared for the U.S. Bureau of
Indian Affairs by the U.S. Geological Survey and
the U.S. Bureau of Mines under an agreement to
compile and summarize available information on
the geology, mineral and energy resources, and
potential for economic development of certain
Indian Lands. Sources of information were pub
lished and unpublished reports as well as personal
communication with various individuals. Re
source computer files of the Geological Survey and
the Bureau of Mines were searched for reference to
specific mineral deposits in northeastern Montana.
No field work was done.
GEOLOGY
General
The Fort Peck Indian Reservation is in the
western part of the Williston Basin (Figure 3), an
exceptionally large sedimentary basin during much
of Paleozoic and Mesozoic time. More than
10,000 feet of sedimentary strata underlie the area,
of which about 1,900 feet is exposed at the surface
(Figure 4). As much as 357 feet of Quaternary and
late Tertiary unconsolidated sediment overlie the
sedimentary rocks.
Stratigraphy
The outcropping sedimentary rocks are Late
Cretaceous and Early Tertiary in age (Table 1).
They are mostly shale and siltstone with lesser
amounts of sandstone and some thin beds of
bentonite and thin to thick beds of lignite. The
oldest unit is the Bearpaw Shale of which only
about 400 feet is exposed, in the southern and
western part of the reservation (Figure 3). The
shale either forms badland topography or a terrain
BIA Administrative Report 28 (1977) 2

_________________________________________________________________________________________________
Status of Mineral Resource Information For The Fort Peck Indian Reservation, Northeastern Montana M. R. Mudge, Michael Sokaski, D. D. Rice, and George McIntyre
of small hills having gentle slopes (Jensen and (Jensen and Varnes, 1964, p. 11-12). The Fox Hills
Varnes, 1964, p. 5). is exposed along the east side of Little Porcupine
The Fox Hills Sandstone overlies the Bearpaw Creek and in the south-central part of the reserva
and consists of a lower transitional marine shale tion (Figure 4). It was eroded in the western part
overlain by a thick sandstone. The shale mostly of the reservation prior to deposition of the Flax-
weathers in slopes like that of the Bearpaw Shale, ville Gravel.
whereas the sandstone forms a conspicuous yel
lowish brown to dark yellowish orange rimrock
TABLE 1
Rock Units Exposed in the Fort Peck Indian Reservation
(from Colton and Bateman, 1956; and Colton, 1962, 1963a-j)
Quaternary SystemPleistocene and Recent
Alluvium , fine to coarse flood-plain deposits of Missouri River and majortributaries. Chiefly silt with local gravel lenses. Deposits are 15 to 30feet thick in valley of smaller tributaries, but may be more than 150 feetthick along the Missouri River.Kintyre Formation , buff brown clay, silt, and sand; well bedded, somecrossbedding, locally contorted; thickness up to 150 feet.Plentywood Formation , poorly sorted and bedded gravel deposits 25 to 50feet thick containing cobbles and boulders. Terrace remnants of a valleytrain of glacial origin.Glacial till , consists of older and younger glacial tills, unstratified,compact, highly impervious, heterogeneous mixture ranging in size from clayto boulders. Generally 15 feet thick; locally as much as 250 feet thick.
Tertiary SystemMiocene or Pliocene
Flaxville Gravel , sand and gravel, 90 percent of which is brown and redquartzite and argillite. Caps highland areas ranging in altitude from 2,400to 3,000 feet. Mostly 30 to 50 feet thick, but locally may be more than 80feet thick. Well stratified and well sorted, consisting of about 5 percentsilt, 35 percent sand, 60 percent pebbles, and a few cobbles.
Unconformity Paleocene
Fort Union Formation , interbedded gray clay, buff silt, lignite, buffcalcareous sandstone, brown carbonaceous clay, olive-gray sand, graybentonitic clay, and silty limestone concretions. Well sorted and stratified. Marked lateral variations. About 1,100 feet thick. Lower contactarbitrarily placed at base of lowest mappable lignite bed.
Gradational contactCretaceous System
Hell Creek Formation , well-stratified shales, siltstones, sandstones, andcarbonaceous shales about 280 feet thick. Overall appearance is sombergreenish gray. Weathered surfaces of bentonitic shale beds have spongytexture. Lower 50 to 100 feet is mostly medium-tan sand, locally cementedto sandstone. Contains vertebrate remains. A few quartzite pebbles locallyin basal 50 feet.
BIA Administrative Report 28 (1977) 3

_________________________________________________________________________________________________
Status of Mineral Resource Information For The Fort Peck Indian Reservation, Northeastern Montana M. R. Mudge, Michael Sokaski, D. D. Rice, and George McIntyre
UnconformityMontana Group
Fox Hills Sandstone , consists of upper sandstone unit 50 to 80 feet thickunderlain by transitional marine shale unit 35 feet thick. Lower unitconsists of thin-bedded, well-laminated shale grading to silt toward top.Upper sandstone contains numerous concretions. Upper parts of formationlocally eroded prior to Hell Creek sedimentation.
Gradational contactBearpaw Shale , dark olive-gray, slightly fissile semi-consolidated jointedclayey shale. Contains ellipsoidal concretions of several kinds, manycontaining marine fossils. A few sandy shale beds in upper part. About1,100 feet thick, of which only the upper 400 feet crops out. Thin bentonite lenses present; bentonite is also disseminated through some shales.
The Hell Creek Formation overlies the Fox
Hills Sandstone and is mainly shale and siltstone
with interbedded ledge-forming sandstone. The
outcrop area in the central and north central part of
the reservation is much dissected by coulees whose
steep sides are locally interrupted by ledges of
cross-bedded sandstone; the sandstone ledges cap
buttes in the upland area (Jensen and Varnes, 1964,
p. 18). The formation is absent in the western part
of the reservation as a result of pre-Flaxville
erosion.
The thick (1,400 feet) Fort Union Formation
overlies the Hell Creek, and consists mainly of
clay, silt, sandstone and lignite (Table 1). Some of
the clay is bentonitic. The formation forms a
grass-covered rolling landscape with some sand
stone benches (Colton, 1962, p. 245). Colton
(1962, p. 279-282) describes 12 of the more
important lignite beds (2-9 feet thick) in and north
of the northeast part of the reservation, and notes
that there are many local beds less than 2 ½ feet
thick.
The Fort Union Formation (Colton and Bate
man (1956), and Colton (1955, 1962, 1973a-j)
includes, in descending order, the Tongue River
and Lebo Members of the Fort Union and the
Tullock Member of the Lance Formation as
mapped south of the reservation by Collier and
Knechtel (1939). The lignite beds are more com
mon in the lower and middle parts of the combined
units (the Fort Union Formation).
The Fort Union, in general, dips eastward and
the thickest sequence of strata are in the eastern
part of the reservation. In the area between Poplar
and Little Porcupine Creeks the Fort Union is
locally absent and Flaxville gravel rests uncon
formably on the Hell Creek Formation (Figure 4).
The formation is absent west of the Middle Fork of
Wolf Creek and the upper reaches of Cottonwood
Creek.
The Flaxville Gravel is a widespread deposit of
sand and gravel of Miocene or Pliocene age that
caps highland areas in much of the central and
northern parts of the reservation (Figure 4). Collier
and Thom (1918, p. 182) record 15 feet of pure
volcanic ash in the Flaxville north of the reserva
tion in secs. 19 and 20, T. 35 N., R. 43 E. Colton
(1963d, g, h, i, j; 1964) reports thin, impure, and
lenticular deposits of volcanic ash in the northern
part of the reservation.
The Wiota gravel (Jensen, 1959b), is
pre-glacial and of post-Flaxville age; it lies at
BIA Administrative Report 28 (1977) 4

_________________________________________________________________________________________________
Status of Mineral Resource Information For The Fort Peck Indian Reservation, Northeastern Montana M. R. Mudge, Michael Sokaski, D. D. Rice, and George McIntyre
altitudes ranging from about 2,100 to about 2,400
feet. Most of the deposits are on terraces north of
the Missouri River. Typically, the lower part of a
deposit contains moderately well bedded sandy
gravel and many lenses of sand whereas the upper
part is commonly silt and fine- to medium-grained
sand with intercalated clay lenses (Jensen and
Varnes, 1964, p. 29).
Till deposits from Pleistocene continental
glaciation mantle much of the reservation (Colton,
Lemke, and Lindvall, 1961). There are two ages of
deposits (Colton, 1955, 1962, 1963a-j, and 1964),
but only the very thick deposits are shown on
Figure 4. The north central upland area is un-
glaciated (Colton, Lemke, and Lindvall, 1961).
Melt-water channels, ice-crack, recessional,
lateral, and end moraines, and undrained depres
sions are common features (Colton, Lemke, and
Lindvall, 1961). Outwash, kame, and esker depos
its also are common and are mostly composed of
sand and gravel (Colton, 1955, 1962, 1963a-j, and
1964).
Alluvium, colluvium, pond, and eolian deposits
are widespread. The thickest alluvium is in the
Missouri River valley where it may be more than
130 feet thick (Colton, 1955; Swenson, 1955).
Colluvium is along the sides of most valleys.
Ponded deposits are in most of the undrained
depressions in the glaciated area (Colton, 1955,
1962, 1963a-j, and 1964). Dune sand is common
in the vicinity of Brockton, on the uplands south of
Little Cottonwood Creek, northeast of Tule Creek
and along the northern border north of the upper
reaches of the East Fork of the Little Porcupine
Creek (Colton, 1963a, 1964).
Structure
The structure is shown on Figure 3 and Figure
5. The main features are the Poplar Dome, the east
flank of the Bowdoin Dome and the
Brockton-Froid fault zone (Colton and Bateman,
1956). Associated with the Poplar Dome are the
Opheim Syncline and the Bredette, Wolf Creek,
and Oswego Noses. The Bowdoin Dome includes
about 200,000 acres and has a closure of about 750
feet; the dips are gentle and range between 20 and
50 feet per mile (Schroth, 1953, p. 140).
The Brockton-Froid fault zone extends north
east across the southeast corner (Colton and Bate
man, 1956); other small faults in the area are
shown by Colton (1963).
MINERAL RESOURCES
General
Mineral resources of value or potential value in
the Fort Peck Indian Reservation include petro
leum and natural gas, lignite, sand and gravel, clay
and shale, bentonite, sodium sulfate, potash, salt,
silica, leonardite, montan wax, riprap, and clinker.
Of these, petroleum and natural gas and lignite are
the most important. The reservation has no poten
tial for metallic mineral resources.
BIA Administrative Report 28 (1977) 5
_________________________________________________________________________________________________
Status of Mineral Resource Information For The Fort Peck Indian Reservation, Northeastern Montana M. R. Mudge, Michael Sokaski, D. D. Rice, and George McIntyre
Energy Resources
��������������������
�������
Petroleum was first discovered on the Fort
Peck Indian Reservation in October 1951, when oil
was tested from the Mississippian Charles Forma
tion on the east flank of Poplar dome, which is
now part of the East Poplar field. There are pres
ently 15 oil fields in the reservation, 10 of which
are producing oil as of January 1, 1977 (Figure 6).
These fields were discovered between 1951 and
1964. Gas is produced locally for use on the leases
in the East Poplar field.
��������������������
Strata ranging in age from Cambrian to Ter
tiary, except for Permian, have been penetrated in
oil and gas wells (Table 2). Most systems have
potential reservoirs and also organic-rich shales
which may be source beds. Many of the units were
described by Knechtel (1959) in the Little Rocky
Mountains approximately 100 miles to the west;
however, nomenclature, thicknesses, and general
descriptions of the units as shown in Table 2 and
described in the text are from subsurface control.
Mallory (1972) discusses the stratigraphy and
geologic history of the Rocky Mountain region.
Wolfbauer and Rice (1976) summarize the stratig
raphy of the Charles M. Russell Wildlife Refuge
southwest of the reservation.
The oldest beds penetrated by drilling are
shales assigned to the Cambrian Emerson Forma
tion which is overlain by approximately 780 feet of
Ordovician and 200 feet of Silurian sediments.
This Ordovician and Silurian sequence is almost
entirely limestone and dolomite with the exception
of the lower 100 feet or more which is mostly
sandstone of the Winnipeg Formation.
Although no Lower Paleozoic reservoirs
produce within the reservation, nearby fields yield
petroleum and natural gas from the Ordovician
Red River Formation. These accumulations may
be related to thinning over paleostructures
(Ballard, 1969, p. 16-17). Dow (1974, p. 1255)
identified the medial shale of the Winnipeg Forma
tion as the source rock for most of the lower
Paleozoic oil in the Williston basin. The western
limit of this shale unit is probably within the
reservation. The basal part of the Ordovician
Stony Mountain Formation is also a potential
source bed in this area.
The Devonian system is about 900 feet thick at
East Poplar field and is dominantly carbonate with
minor shale, siltstone, and anhydrite. The Bakken
Formation overlaps the Devonian-Mississippian
boundary and is black, organic-rich shale and
siltstone. The Prairie Formation, which attains a
maximum thickness of 525 feet in the deepest part
of the Williston basin with a thick halite sequence,
is absent in most of the area because of solution.
The Birdbear Formation, or Nisku Formation
of subsurface usage, is the major producing reser
voir within the reservation. The Winnipegosis
Formation produces oil east of the reservation in
structural traps where fracturing has increased the
permeability (Kinard and Cronable, 1969).
The Upper Devonian-Lower Mississippian
Bakken shale has been identified by Dow (1974, p.
BIA Administrative Report 28 (1977) 6
_________________________________________________________________________________________________
Status of Mineral Resource Information For The Fort Peck Indian Reservation, Northeastern Montana M. R. Mudge, Michael Sokaski, D. D. Rice, and George McIntyre
1257) as the principal source of oil for Mississip
pian Madison reservoirs in the Williston basin.
Dow (1974, p. 1260) also concluded that oil in the
Birdbear Formation in northeastern Montana came
from the Bakken shale where the two were juxta
posed by faults. However, some of the Birdbear
and other Devonian oil was probably generated in
local source beds. Probable marine source beds
are present in most of the Devonian formations.
The Mississippian System is represented by the
Madison and Big Snowy Groups which attain a
thickness of about 2,500 feet. The lower Madison
Group is predominantly limestone with some
anhydrite, dolomite, shale, and evaporites in the
upper Charles Formation which is the main reser
voir in the Poplar and Bredette fields. The Big
Snowy group is composed of sandstone, siltstone,
shale, and minor limestone.
Pennsylvanian rocks unconformably overlie the
Big Snowy Group and consist of siltstone, shale,
and minor sandstone and limestone of the Tyler
Formation and carbonates of the Minnelusa Forma
tion.
Over 100 feet of red sandstone, siltstone, and
shale of the Triassic Spearfish Formation rest
unconformably on Pennsylvanian rocks and are
unconformably overlain by Jurassic strata.
The Jurassic sequence consists of approxi
mately 1,100 feet of shale, sandstone, limestone,
dolomite, and anhydrite. The Late Jurassic Morri
son Formation along with the Early Cretaceous
Kootenai Formation are probably the only non
marine units in the subsurface.
Cretaceous sediments below the Fox Hills
Sandstone are about 4,000 feet thick and are
predominantly shale with sandstone and siltstone
limited to the Judith River, Muddy, Fall River, and
Kootenai Formations. The Judith River Formation
locally produces gas at the East Poplar field. On
Bowdoin dome, west of the reservation, the Upper
Cretaceous Carlile and Greenhorn intervals pro
duce dry gas over a large area.
�����������������
The main structural feature within the reserva
tion is the Poplar dome, a northwest-trending
asymmetrical anticline of Laramide age (Figure 5).
The western part of the reservation includes the
east flank of the Bowdoin dome, also a Laramide
feature.
Other significant structures are the northwest
trending Bredette, Oswego, and Wolf Creek noses
plus the Opheim syncline (Figure 5). These are
undoubtedly related to a major northeasterly and
northwesterly trending lineament block system as
detailed by Thomas (1974) in the greater Williston
basin-Blood Creek syncline area. Although the
exact cause of these lineaments, which are well
expressed on aerial photographs, is not known,
they suggest a general weakness of the basement
which undoubtedly had an effect on the geological
and petroleum history of the area as shown by the
following examples.
Ballard (1969) related Red River production in
northeastern Montana to depositional thins along
proposed lineaments. Oil accumulated in the
Charles "Radcliffe" zone in algal pelletoid mounds
which Hansen (1966) postulated were controlled
by paleomovement along trends of weakness.
Entrapment of oil in the Kibbey Sandstone at
Weldon field was enhanced by regional westward
BIA Administrative Report 28 (1977) 7

_________________________________________________________________________________________________
___________________________________________________________________________
___________________________________________________________________________
___________________________________________________________________________
Status of Mineral Resource Information For The Fort Peck Indian Reservation, Northeastern Montana M. R. Mudge, Michael Sokaski, D. D. Rice, and George McIntyre
truncation of the reservoir beds during barrels valued at $157,311,633 (Table 3). Cumula-
post-Pennsylvanian to pre-Jurassic time along the tive production from each field ranged from 1,979
Weldon fault (Edmisten and Foster, 1969). Sand-barrels (Wolf Creek) to 41,712,665 barrels (East
berg and Mapel (1967) showed offset of Devonian Poplar). Ten of the fields produced less than 1
indicative of paleomovement along the Weldon million barrels each.
fault which trends into the Brockton-Froid fault No gas fields have been discovered on the
zone in the study area. Other lineaments undoubt-reservation. However, natural gas is produced
edly cross the reservation and may have had an from the Tule Creek oil field. In 1974, 162,220
effect on both stratigraphy and hydrocarbon accu-Mcf were produced. McCulloch Interstate Gas
mulations. Corp. operates a natural gas liquids extraction
plant near the Tule Creek oilfield (Figure 6). The
��������� East Poplar oilfield produces a small amount of
gas, which is used in operations at the field. As of January 1976, cumulative production
from the 15 fields (Figure 6) was 57,556,463
TABLE 3
Cumulative Oil Production, Value, and Reserves for Oil Fields, Fort Peck Indian Reservation*
Cumulative value to
1-1-76 Field (dollars)
Cumulativeproduction Reservesto 1-1-76 on 1-1-76 Producing(barrels) (barrels) formations
Benrud 530,011 208,751 0 Nisku (Dev.)East Benrud 6,017,265 1,888,989 111,000 NiskuNortheast Benrud 2,320,866 845,136 135,000 NiskuBredette 413,000** 185,176** 0 Charles "C" (Miss.)North Bredette 1,160,000** 488,554** 0 Miss. Chelsea Creek 43,764 11,548 0 NiskuMineral Bench 361,636 139,554 1,000 Charles "C" Duperow
(Dev.)East Poplar 111,440,686 41,712,665 3,881,000 Madison & Heath (Miss.)
NiskuNorthwest Poplar 2,828,552 613,640 473,000 Charles "C"Red Fox 1,000,677 348,577 18,000 NiskuTule Creek 18,591,494 6,708,279 1,291,000 NiskuEast Tule Creek 5,281,883 1,904,019 195,000 NiskuSouth Tule Creek 1,721,998 612,264 89,000 Nisku Volt 5,597,526 1,887,332 839,000 NiskuWolf Creek 2,275 1,979 0 Madison
TOTALS 157,311,633 57,556,463 7,033,000
*Department of Natural Resources and Conservation of the State of Montana, Oil and Gas Conservation Division.
**Henkes and Magill, 1970, p. 19.
BIA Administrative Report 28 (1977) 8

_________________________________________________________________________________________________
Status of Mineral Resource Information For The Fort Peck Indian Reservation, Northeastern Montana M. R. Mudge, Michael Sokaski, D. D. Rice, and George McIntyre
���������
General.--The East Poplar field, the largest on
the reservation, and its extension, the Northwest
Poplar field, are centered about 10 miles
north-northeast of Poplar (Figure 6). The Tule
Creek, East Tule Creek, South Tule Creek, Benrud,
East Benrud, Northeast Benrud, Red Fox, Volt,
Wolf Creek, and Chelsea Creek fields are centered
about 18 miles north of Wolf Point. The Bredette
and North Bredette fields are about 30 miles north
of Poplar. The Mineral Bench field is about 26
miles north-northeast of Poplar.
East Poplar.--The East Poplar field (Figure 6
and Figure 7) was discovered in 1952 in T. 28 and
29 N., R. 50 and 51 E., Roosevelt County. The
discovery well, Murphy Oil Corporation's East
Poplar No. l, was in the SW ¼ NE ¼ sec. 2, T. 28
N., R. 51 E. Initial production was 625 barrels per
day of 41º API gravity oil from the Charles Forma
tion of the Madison Group. Perforations were
from 5,668 to 5,680 feet and from 5,799 to 5,814
feet (Henkes and Magill, 1970, p. 25). The
Charles "C" zone has about 25 feet of net pay with
an average porosity of 11 percent and underlies
about 18,000 acres. The oil has been trapped in a
dome-like structure with a natural water drive.
The depths of the formation tops, in feet, below
the Kelly bushing (elevation 2,123 feet), penetrated
by the discovery well are as follows: Judith River
752; Fall River Sandstone 3,178; Morrison 3,505;
and Mission Canyon 5,940. Total depth of the
hole is 9,163 feet (Henkes and Magill, 1970, p.
26).
In 1956, oil was discovered in the Kibbey
Sandstone (Mississippian) from a zone 5,231 to
5,243 feet deep. The discovery well, in SW ¼ NE
¼ sec. 27, T. 28 N., R. 51 E., initially produced 54
barrels per day. Production was discontinued
because it was noncommercial (Henkes and
Magill, 1970, p. 25).
The Poplar dome is about 30 miles long and 25
miles wide with about 300 feet of closure. The
East Poplar oil field is subsidiary dome on its
northeastern flank which covers an area about 8
miles long and 5 miles wide with a closure of
about 100 feet (Perry, 1970, p. 82).
In May 1969, oil was obtained from the Heath
Formation (Mississippian) through the reworked
Polumbus Huber No. 1 well in the NE ¼ sec. 10,
T. 28 N., R. 51 E. Initial pumped production was
245 barrels of oil and 50 barrels of water per day
from perforations between depths of 4,864 and
4,882 feet (Henkes and Magill, 1970, p. 25). The
combination structural and stratigraphic trap
underlies about 480 acres and has a natural water
drive. The producing zone has about 8 feet of net
pay with an average porosity of 11 percent. Oil
gravity is 38º API.
Oil was discovered in February 1969 in the
Nisku Formation (Devonian) when the E. A.
Polumbus Huber No. 5 well was drilled in the SW
¼ NE ¼ sec. 10, T. 28 N., R. 51 E. The well
initially produced 51 barrels of oil and 475 barrels
of water per day. Daily oil production increased to
about 200 barrels but soon declined to about 150
barrels while water production increased to 1,200
barrels. Perforations were between 7,262 and
7,264 feet (Henkes and Magill, 1970, p. 25). The
pool underlies about 320 acres and has about 12
BIA Administrative Report 28 (1977) 9

_________________________________________________________________________________________________
___________________________________________________________________________
___________________________________________________________________________
___________________________________________________________________________
Status of Mineral Resource Information For The Fort Peck Indian Reservation, Northeastern Montana M. R. Mudge, Michael Sokaski, D. D. Rice, and George McIntyre
feet of net pay with an average porosity of 8 per
cent. The field has a natural water drive. Water
produced is injected into the Fall River sandstone
and Judith River Formation. Production data are in
Table 4.
TABLE 4
Production Data, Number of Wells, and Reserves, East Poplar Oil Field, Fort Peck Indian Reserva
tion.
Production No. producing wells*Year (barrels) Heath (Miss.) Madison** Nisku (Dev.)
1966 889,626 0 70 0 1967 732,519 0 70 0 1968 674,917 0 61 0 1969 730,658 4 58 1 1970 706,247 4 59 3 1971 629,411 4 58 2 1972 538,045 3 60 1 1973 512,646 3 58 1 1974 497,395 3 59 1 1975 467,585 3 63 1
*Number wells at end of year. Producing formations: Heath (Miss.), Madison (Miss.) Nisku (Dev.).
**Charles and Mission Canyon Formations (Miss.) Cumulative production to January 1, 1976, was
41,712,665 barrels. Estimated reserves as of January 1, 1976, are:
Heath 88,000 barrels
Madison 3,728,000 barrels
Nisku 65,000 barrels
TOTAL 3,881,000 barrels
Probable water drive in all three formations. Estimated ultimate recoveries:
Heath 79 barrels/acre ft.
Madison 100 barrels/acre ft.
Nisku 65 barrels/acre ft.
Source: Department of Natural Resources and Conservation of the State of Montana, Oil and Gas Conserva
tion Division, Annual Reviews 1966 to 1975 inc., Summary of Producing Oil Fields and Listed Oil and Gas
Fields.
BIA Administrative Report 28 (1977) 10

_________________________________________________________________________________________________
___________________________________________________________________________
___________________________________________________________________________
___________________________________________________________________________
Status of Mineral Resource Information For The Fort Peck Indian Reservation, Northeastern Montana M. R. Mudge, Michael Sokaski, D. D. Rice, and George McIntyre
Northwest Poplar.--The Northwest Poplar Both surface geology and seismic data were aids in
oilfield (Figure 8) was discovered in 1952 when defining the prospect (Henkes and Magill, 1970, p.
the Ajax Oil Company McGowan No. 1 well was 26). The producing zone has about 16 feet of net
completed in the SE ¼ SW ¼ sec. 10, T. 29 N., R. pay with an average porosity of 10 percent and
50 E. Initial pumped production was 75 barrels of underlies about 800 acres.
oil and 25 barrels of water per day from the Production data, number of wells, and reserves
Charles Formation of the Madison Group. Perfora-are given in Table 5.
tions were between depths of 6,164 and 6,189 feet.
TABLE 5
Production Data, Number of Wells, and Reserves, Northwest Poplar Oil Field, Fort Peck Indian
Reservation.
ProductionYear (barrels) No. producing wells* No. shut-in wells*
1964 21,212 5 0 1965 19,522 5 0 1966 20,830 4 0 1967 20,199 5 0 1968 18,479 5 0 1969 14,432 1 0 1970 17,112 3 0 1971 16,282 3 0 1972 11,322 2 0 1973 13,885 3 0 1974 11,968 3 0 1975 121,265 9 0
*Number of wells at end of year.
Producing formation: Charles (Miss.).
Cumulative production to January 1, 1976, was 613,640 barrels.
Estimated reserves as of January 1, 1976, are 473,000 barrels.
Probable water drive.
Estimated ultimate recovery: 78 barrels/acre-ft.
Source: Department of Natural Resources and Conservation of the State of Montana, Oil and Gas Conserva
tion Division, Annual Reviews 1964 to 1975 inc., Summary of Producing Oil Fields and Listed Oil and Gas
Fields.
BIA Administrative Report 28 (1977) 11
_________________________________________________________________________________________________
___________________________________________________________________________
___________________________________________________________________________
___________________________________________________________________________
Status of Mineral Resource Information For The Fort Peck Indian Reservation, Northeastern Montana M. R. Mudge, Michael Sokaski, D. D. Rice, and George McIntyre
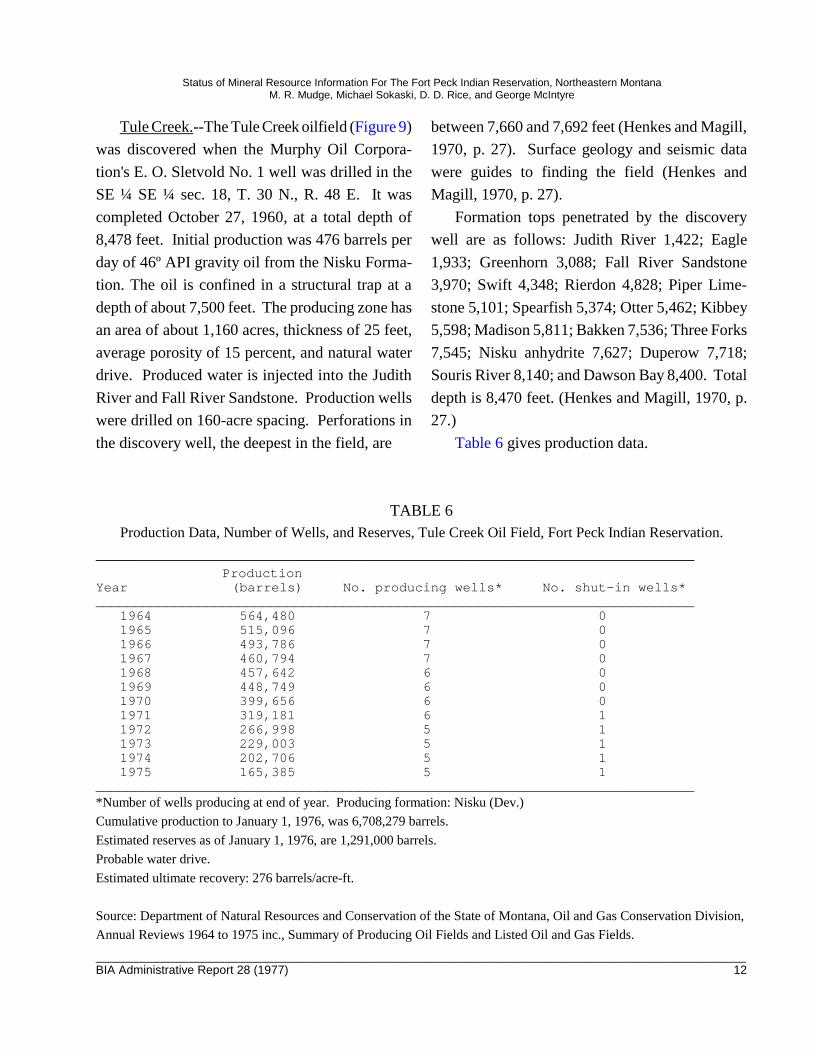
Tule Creek.--The Tule Creek oilfield (Figure 9) between 7,660 and 7,692 feet (Henkes and Magill,
was discovered when the Murphy Oil Corpora-1970, p. 27). Surface geology and seismic data
tion's E. O. Sletvold No. 1 well was drilled in the were guides to finding the field (Henkes and
SE ¼ SE ¼ sec. 18, T. 30 N., R. 48 E. It was Magill, 1970, p. 27).
completed October 27, 1960, at a total depth of Formation tops penetrated by the discovery
8,478 feet. Initial production was 476 barrels per well are as follows: Judith River 1,422; Eagle
day of 46º API gravity oil from the Nisku Forma-1,933; Greenhorn 3,088; Fall River Sandstone
tion. The oil is confined in a structural trap at a 3,970; Swift 4,348; Rierdon 4,828; Piper Lime-
depth of about 7,500 feet. The producing zone has stone 5,101; Spearfish 5,374; Otter 5,462; Kibbey
an area of about 1,160 acres, thickness of 25 feet, 5,598; Madison 5,811; Bakken 7,536; Three Forks
average porosity of 15 percent, and natural water 7,545; Nisku anhydrite 7,627; Duperow 7,718;
drive. Produced water is injected into the Judith Souris River 8,140; and Dawson Bay 8,400. Total
River and Fall River Sandstone. Production wells depth is 8,470 feet. (Henkes and Magill, 1970, p.
were drilled on 160-acre spacing. Perforations in 27.)
the discovery well, the deepest in the field, are Table 6 gives production data.
TABLE 6 Production Data, Number of Wells, and Reserves, Tule Creek Oil Field, Fort Peck Indian Reservation.
ProductionYear (barrels) No. producing wells* No. shut-in wells*
1964 564,480 7 0 1965 515,096 7 0 1966 493,786 7 0 1967 460,794 7 0 1968 457,642 6 0 1969 448,749 6 0 1970 399,656 6 0 1971 319,181 6 1 1972 266,998 5 1 1973 229,003 5 1 1974 202,706 5 1 1975 165,385 5 1
*Number of wells producing at end of year. Producing formation: Nisku (Dev.)
Cumulative production to January 1, 1976, was 6,708,279 barrels.
Estimated reserves as of January 1, 1976, are 1,291,000 barrels.
Probable water drive.
Estimated ultimate recovery: 276 barrels/acre-ft.
Source: Department of Natural Resources and Conservation of the State of Montana, Oil and Gas Conservation Division,
Annual Reviews 1964 to 1975 inc., Summary of Producing Oil Fields and Listed Oil and Gas Fields.
BIA Administrative Report 28 (1977) 12

_________________________________________________________________________________________________
___________________________________________________________________________
___________________________________________________________________________
__________________________________________________________________________ _
Status of Mineral Resource Information For The Fort Peck Indian Reservation, Northeastern Montana M. R. Mudge, Michael Sokaski, D. D. Rice, and George McIntyre
East Tule Creek.--The East Tule Creek oilfield gravity oil from the Nisku Formation. The oil is
(Figure 9) was discovered on October 28, 1964 confined in a structural trap with a water drive.
with the completion of Murphy Oil Corporation's The producing area, about 400 acres, has about 30
Bridges No. 1 well in the SE ¼ NE ¼ sec. 15, T. feet of net pay with an average porosity of 18
30 N., R. 48 E. Perforations in the discovery well percent. Produced water is injected into the Judith
were between depths of 7,490 and 7,508 feet River Formation. The field has 160-acre well
(Henkes and Magill, 1970, p. 28). Initial pumped spacing. Production data, number of wells, and
production was 411 barrels per day of 43º API reserves are given in Table 7.
TABLE 7
Production Data, Number of Wells, and Reserves, East Tule Creek Oil Field, Fort Peck Indian
Reservation.
ProductionYear (barrels) No. producing wells* No. shut-in wells*
1964 47,855 2 0 1965 374,684 2 0 1966 342,847 2 0 1967 279,866 2 0 1968 230,396 2 0 1969 175,056 2 0 1970 120,687 2 0 1971 101,703 2 0 1972 89,413 2 0 1973 70,976 2 0 1974 43,646 2 0 1975 26,890 2 0
*Number of wells at end of year.
Producing formation: Nisku (Dev.). Cumulative production to
January 1, 1976, was 1,904,019, barrels.
Estimated reserves as of January 1, 1976, are 195,000 barrels.
Probable water drive.
Estimated ultimate recovery: 175 barrels/acre-ft.
Source: Department of Natural Resources and Conservation of the State of Montana, Oil and Gas Conserva
tion Division, Annual Reviews 1964 to 1975 inc., Summary of Producing Oil Fields and Listed Oil and Gas
Fields.
BIA Administrative Report 28 (1977) 13

_________________________________________________________________________________________________
___________________________________________________________________________
___________________________________________________________________________
___________________________________________________________________________
Status of Mineral Resource Information For The Fort Peck Indian Reservation, Northeastern Montana M. R. Mudge, Michael Sokaski, D. D. Rice, and George McIntyre
South Tule Creek.--The South Tule Creek (Nisku) has about 8 feet of net pay and averages 12
oilfield (Figure 9) was discovered June 19, 1964, percent porosity. Estimated size of the field is 400
when the Brinkerhoff Track No. 1 well in the SE ¼ acres. The produced water is injected into the
NW ¼ sec. 36, T. 30 N., R. 47 E. was completed. Judith River Formation and Fall River Sandstone.
Total depth of the well is 7,360 feet. Initial pro-Two offset wells were drilled; one initially pro
duction was 84 barrels per day of 43º API gravity duced 80 barrels per day, and the other was a dry
oil. The oil is confined in a structural trap with a hole (Henkes and Magill, 1970, p. 28).
natural water drive. The producing horizon Production data are in Table 8.
TABLE 8
Production Data, Number of Wells, and Reserves, South Tule Creek Oil Field, Fort Peck Indian
Reservation.
ProductionYear (barrels) No. producing wells* No. shut-in wells*
1964 25,579 1 0 1965 57,920 1 0 1966 69,646 2 0 1967 93,750 3 0 1968 87,217 3 0 1969 81,583 3 0 1970 54,023 3 0 1971 45,406 3 0 1972 32,401 3 0 1973 29,665 3 0 1974 18,342 3 0 1975 16,422 3 0
*Number of wells at end of year.
Producing formation: Nisku (Dev.).
Cumulative production to January 1, 1976, was 612,264 barrels.
Estimated reserves as of January 1, 1976, are 89,000 barrels.
Probable water drive.
Estimated ultimate recovery: 219 barrels/acre-ft.
Source: Department of Natural Resources and Conservation of the State of Montana, Oil and Gas Conserva
tion Division, Annual Reviews 1964 to 1975 inc., Summary of Producing Oil Fields and Listed Oil and Gas
Fields.
BIA Administrative Report 28 (1977) 14

_________________________________________________________________________________________________
___________________________________________________________________________
___________________________________________________________________________
___________________________________________________________________________
Status of Mineral Resource Information For The Fort Peck Indian Reservation, Northeastern Montana M. R. Mudge, Michael Sokaski, D. D. Rice, and George McIntyre
Benrud.--The Benrud oilfield (Figure 6) was The producing zone has about 22 feet of net pay
discovered December 7, 1961, by the Calvert with an average porosity of 16 percent. The oil is
Exploration Company with their No. 1 trapped in a small structural dome (about 80 acres)
Listug-Olson "A" well in the NE ¼ SW ¼ sec. 34, with a natural water drive. Produced water is
T. 31 N., R. 47 E. Initial production was 498 injected into the Judith River Formation.
barrels per day of 43º API gravity oil from the Production data, number of wells, and reserves
Nisku Formation at a total depth of 7,620 feet. are given in Table 9.
TABLE 9
Production Data, Number of Wells, and Reserves, Benrud Oil Field, Fort Peck Indian Reservation.
ProductionYear (barrels) No. producing wells* No. shut-in wells*
1964 23,011 1 0 1965 31,268 1 0 1966 29,084 1 0 1967 16,915 1 0 1968 11,967 1 0 1969 5,455 1 0 1970 2,529 0 1 1971 49 0 1 1972 16,192 1 1 1973 9,047 1 1 1974 8,103 1 1 1975 200 1 1
*Number of wells at end of year.
Producing formation: Nisku (Dev.).
Cumulative production to January 1, 1976, was 208,751 barrels.
Estimated reserves as of January 1, 1976, are zero.
Probable water drive.
Estimated ultimate recovery: 119 barrels/acre-ft.
Source: Department of Natural Resources and Conservation of the State of Montana, Oil and Gas Conserva
tion Division, Annual Reviews 1964 to 1975 inc., Summary of Producing Oil Fields and Listed Oil and Gas
Fields.
BIA Administrative Report 28 (1977) 15

_________________________________________________________________________________________________
___________________________________________________________________________
___________________________________________________________________________
___________________________________________________________________________
Status of Mineral Resource Information For The Fort Peck Indian Reservation, Northeastern Montana M. R. Mudge, Michael Sokaski, D. D. Rice, and George McIntyre
East Benrud.--This field (Figure 6) was discov- about 7,500 feet deep and has about 22 feet of net
ered by the Murphy Oil Corporation with their pay with an average porosity of 15 percent. The
Tribal No. l-A well, completed December 13, field contains a structural trap with a productive
1962, in the SE ¼ NW ¼ sec. 36, T. 31 N., R. 47 area of about 480 acres and a natural water drive.
E. at a total depth of 7,804 feet. Initial production Produced water is injected into the Judith River
was 503 barrels per day of 46º API gravity oil from Formation.
the Nisku Formation. The producing zone is Production data are listed in Table 10.
TABLE 10
Production Data, Number of Wells, and Reserves, East Benrud Oil Field,fort Peck Indian Reserva
tion.
ProductionYear (barrels) No. producing wells* No. shut-in wells*
1964 176,289 1 0 1965 129,877 1 0 1966 111,420 1 0 1967 101,267 1 0 1968 100,267 1 0 1969 175,605 2 0 1970 170,302 2 0 1971 150,216 2 0 1972 151,549 3 0 1973 157,129 3 0 1974 122,761 3 0 1975 128,014 3 0
*Number of wells at end of year.
Producing formation: Nisku (Dev.).
Cumulative production to January 1, 1976, was 1,888,989 barrels.
Estimated reserves as of January 1, 1976, are 1,111,000 barrels.
Probable water drive.
Estimated ultimate recovery: 284 barrels/acre-ft.
Source: Department of Natural Resources and Conservation of the State of Montana, Oil and Gas Conserva
tion Division, Annual Reviews 1964 to 1975 inc., Summary of Producing Oil Fields and Listed Oil and Gas
Fields.
BIA Administrative Report 28 (1977) 16

_________________________________________________________________________________________________
___________________________________________________________________________
___________________________________________________________________________
___________________________________________________________________________
Status of Mineral Resource Information For The Fort Peck Indian Reservation, Northeastern Montana M. R. Mudge, Michael Sokaski, D. D. Rice, and George McIntyre
Northeast Benrud.--The Northeast Benrud
oilfield (Figure 6) was discovered September 10,
1964, by the Murphy Oil Corporation. The discov
ery well, Mule Creek-Allotted No. 1, is in the SW
¼ SE ¼ sec. 20, T. 31 N., R. 48 E. Initial produc
tion was 408 barrels per day of 46º API gravity oil
from the Nisku Formation. Perforations in the
discovery well were between the depths of 7,620
and 7,625 feet and between 7,637 and 7,643 feet
(Henkes and Magill, 1970, p. 23). The producing
zone has about 23 feet of net pay with an average
porosity of 16 percent. The oil is in a structural
trap with a natural water drive. The productive
area underlies about 160 acres. Produced water is
injected into the Judith River Formation.
The depths to the formation tops, in feet below
the Kelly bushing (elevation 2,704 feet), penetrated
by the discovery well are as follows: Judith River
Formation 1,438; Eagle 1,968; Niobrara 2,817;
Greenhorn 3,153; Graneros 3,343; Fall River
Sandstone 4,078; Swift 4,412; Rierdon 4,834;
Piper Limestone 5,113; Nesson 5,260; Spearfish
5,391; Otter 5,435; Kibbey 5,563; Madison 5,818;
Bakken 7,502; Three Forks 7,507; Nisku 7,589;
and Duperow 7,687. Total depth is 7,865 feet
(Henkes and Magill, 1970, p. 23).
Table 11 gives production data, number of
wells, and reserves.
TABLE 11
Production Data, Number of Wells, and Reserves, Northeast Benrud Oil Field, Fort Peck Indian
Reservation.
ProductionYear (barrels) No. producing wells* No. shut-in wells*
1964 50,504 1 0 1965 176,364 1 0 1966 182,354 2 0 1967 152,099 1 0 1968 90,016 1 0 1969 50,629 1 0 1970 35,816 1 0 1971 28,666 1 0 1972 23,212 1 0 1973 20,013 1 0 1974 18,956 1 0 1975 16,507 1 0
*Number of wells at end of year.
Producing formation: Nisku (Dev.). Cumulative production to January 1, 1976 was 845,136 barrels.
Estimated reserves as of January 1, 1976, are 135,000 barrels.
Probable water drive.
Estimated ultimate recovery: 267 barrels/acre-ft.
Source: Department of Natural Resources and Conservation of the State of Montana, Oil and Gas Conservation Division,
Annual Reviews 1964 to 1975 inc., Summary of Producing Oil Fields and Listed Oil and Gas Fields.
BIA Administrative Report 28 (1977) 17

_________________________________________________________________________________________________
___________________________________________________________________________
___________________________________________________________________________
___________________________________________________________________________
Status of Mineral Resource Information For The Fort Peck Indian Reservation, Northeastern Montana M. R. Mudge, Michael Sokaski, D. D. Rice, and George McIntyre
Volt.--The Volt oilfield (Figure 10) was dis- 1,327; Fall River Sandstone 3,967; Rierdon 4,753;
covered July 11, 1964, when the Murphy Oil Kibbey 5,368; Madison 5,572; Bakken 7,174;
Corporation's Courchene No. 1 well was com-Nisku 7,272; and Duperow 7,372 (Henkes and
pleted. It is in the SE ¼ SW ¼ sec. 4, T. 30 N., R. Magill, 1970, p. 28 and 29).
36 E., Roosevelt County. Initial production was The Nisku productive area (approximately 800
145 barrels of oil and 60 barrels of water per day. acres) has about 14 feet of net pay with an average
Production is from the Nisku Formation through porosity of 20 percent. The oil is confined in a
perforations between depths of 7,304 and 7,311 structural trap with a natural water drive. Produced
feet. (Henkes and Magill, 1970, p. 28.) water is injected into the Judith River Formation.
The depths of the formation tops, in feet below Production data, number of wells, and reserves
the Kelly bushing (elevation 2,726 feet), penetrated are given in Table 12.
by the discovery well are as follows: Judith River
TABLE 12
Production Data, Number of Wells, and Reserves, Volt Oil Field, Fort Peck Indian Reservation.
ProductionYear (barrels) No. producing wells* No. shut-in wells*
1964 40,850 2 0 1965 153,420 5 0 1966 266,712 5 0 1967 230,929 6 0 1968 215,009 4 0 1969 176,867 4 0 1970 155,970 4 0 1971 140,403 4 2 1972 133,281 4 2 1973 120,894 4 2 1974 125,513 5 1 1975 110,100 5 1
*Number of wells at end of year.
Producing formation: Nisku (Dev.).
Cumulative production to January 1, 1976, was 1,887,332 barrels.
Estimated reserves as of January 1, 1976, are 839,000 barrels.
Probable water drive.
Estimated ultimate recovery: 241 barrels/acre-ft.
Source: Department of Natural Resources and Conservation of the State of Montana, Oil and Gas Conserva
tion Division, Annual Reviews 1964 to 1975 inc., Summary of Producing Oil Fields and Listed Oil and Gas
Fields.
BIA Administrative Report 28 (1977) 18

_________________________________________________________________________________________________
Status of Mineral Resource Information For The Fort Peck Indian Reservation, Northeastern Montana M. R. Mudge, Michael Sokaski, D. D. Rice, and George McIntyre
Oil was also discovered in the Charles Forma
tion on April 21, 1965, when the Murphy Oil
Corporation's Trimble No. 1 well was reworked.
The well, in the NE ¼ NE ¼ sec. 8, T. 30 N., R. 46
E., was originally drilled into the Devonian at
7,437 ft but abandoned in 1963. The well was
reworked and perforations are between 5,891 and
5,909 feet in the Charles "C" zone (a show of oil
was found in this zone when the well was drilled).
Initial pumped production was 16 barrels of 40º
API gravity oil and 33 barrels of water per day.
Net pay averages about 7 feet thick with an average
porosity of 8 percent. The pool is in a structural
trap with a natural water drive, and is estimated to
underlie about 40 acres. Estimated ultimate recov
ery is 89 barrels per acre-foot. The Charles "C"
zone has produced between 17,000 and 26,000
barrels of oil.
Bredette.--The abandoned Bredette oilfield
(Figure 6) is about 30 miles north of the town of
Poplar. The field was discovered in May 1955 by
the California Company in their Elizabeth Grimm
No. 1 well, in sec. 13, T. 32 N., R. 49 E. Initial
production was 140 barrels of 40º API gravity oil
and 31 barrels of water per day from perforations
between depths of 6,537 and 6,545 feet. The
producing formation was the Charles "C" zone.
Five months after the field was discovered, eight
wells had been drilled; four were noncommercial.
Seismograph data indicate the Bredette field, in
secs. 12 and 13, T. 32 N., R. 49 E., is on a north-
west-southwest trending anticline (Henkes and
Magill, 1970, p. 23). The reservoir rock is a frac
tured microcrystalline, anhydritic and dolomitic
limestone with some porosity (Henkes and Magill,
1970, p. 23 and 24).
The formation tops and their depths, in feet
below the Kelly bushing (elevation 2,423 feet),
penetrated by the discovery well are as follows:
Judith River 1,565; Greenhorn 3,202; Muddy
3,742; Fall River 4,056; Rierdon 4,894; Piper
Limestone 5,173; Spearfish 5,488; Heath 5,590;
Otter 5,691; Kibbey 5,805; Charles 6,056; Mission
Canyon 6,603; Lodgepole 7,237; Bakken 7,731;
Three Forks 7,790; Nisku 7,895; Duperow 7,986;
Souris River 8,475; Interlake 9,013; Stony Moun
tain 9,317; Red River 9,442; and Winnipeg 9,731.
Total depth is 9,761 feet (Henkes and Magill,
1970, p. 23).
Peak production was 97,886 barrels in 1956
from five wells. The last recorded production was
2,922 barrels in 1960 (Henkes and Magill, 1970, p.
24).
Table 3 lists production data for this field.
North Bredette.--The North Bredette field
(Figure 6) which has not produced since 1965, is in
sec. 1, T. 32 N., R. 49 E. and secs. 28 and 34, T. 33
N., R. 49 E. It was discovered in May 1956 by the
California Company with their Paulson No. 1 well
which is in the SW ¼ sec. 34, T. 33 N., R. 49 E.
Initial production was 114 barrels of 38º API
gravity oil per day from the McGowan and "C"
zones of the Charles Formation.
The producing zones are fractured, micro
crystalline, anhydritic and dolomitic limestone with
an average net pay zone of about 25 feet. The
depths to the formation tops, in feet below the
Kelly bushing (elevation 2,695 feet), penetrated by
the discovery well are as follows: Judith River
1,874; Fall River 4,358; Charles 6,262; Mission
Canyon 6,784; and Lodgepole 7,410. Total depth
is 7,475 feet (Henkes and Magill, 1970, p. 24). All
BIA Administrative Report 28 (1977) 19

_________________________________________________________________________________________________
___________________________________________________________________________
___________________________________________________________________________
___________________________________________________________________________
Status of Mineral Resource Information For The Fort Peck Indian Reservation, Northeastern Montana M. R. Mudge, Michael Sokaski, D. D. Rice, and George McIntyre
six of the field's wells were completed as flowing
wells. However, within 2 months, oil flow usually
terminated because of excess water and pumping
became necessary (Perry, 1960, p. 82). In 1958 the
field produced 151,261 barrels of oil from five
wells (Perry, 1960, p. 82).
Table 3 lists production data.
Red Fox.--The Red Fox oilfield (Figure 6) was
discovered in April 1967 when the Murphy Oil
Corporation's Red Fox No. 1 well was completed
in the SE ¼ NE ¼ sec. 17, T. 30 N., R. 38 E.
Perforations were between 7,694 and 7,698 feet
and 7,704 and 7,711 feet (Henkes and Magill,
1970, p. 27). Initial pumped production was 443
barrels of 46º API gravity oil and 148 barrels of
water per day from the Nisku Formation.
The depths of the formation tops, in feet below
the Kelly bushing (elevation 2,707 feet), penetrated
by the discovery well are as follows: Greenhorn
3,092; Fall River 3,950; Spearfish 5,366; Kibbey
5,742; Madison 5,844; Bakken 7,571; Nisku 7,670;
and Duperow 7,758. Total depth is 7,775 feet
(Henkes and Magill, 1970, p. 27). The producing
zone averages about 10 feet of net pay with an
average porosity of 18 percent. The field is con
fined to a structural trap with a natural water drive.
Production data, number of wells, and reserves
are given in Table 13.
TABLE 13
Production Data, Number of Wells, and Reserves, Red Fox Oil Field, Fort Peck Indian Reservation.
ProductionYear (barrels) No. producing wells* No. shut-in wells*
1967 101,565 l 0 1968 106,583 l 0 1969 73,838 1 0 1970 27,690 1 0 1971-72 16,988 1 0 1973 7,961 1 0 1974 7,201 1 0 1975 6,751 1 0
*Number of wells at end of year. Producing formations: (Dual Completion) Duperow (Dev.) and Charles "C"
(Miss.).
Cumulative production to January 1, 1976, was 348,577 barrels.
Estimated reserves as of January 1, 1976, are 18,000 barrels.
Probable water drive.
Source: Department of Natural Resources and Conservation of the State of Montana, Oil and Gas Conserva
tion Division, Annual Reviews 1964 to 1975 inc., Summary of Producing Oil Fields and listed Oil and Gas
Fields.
BIA Administrative Report 28 (1977) 20
_________________________________________________________________________________________________
___________________________________________________________________________
___________________________________________________________________________
___________________________________________________________________________
Status of Mineral Resource Information For The Fort Peck Indian Reservation, Northeastern Montana M. R. Mudge, Michael Sokaski, D. D. Rice, and George McIntyre
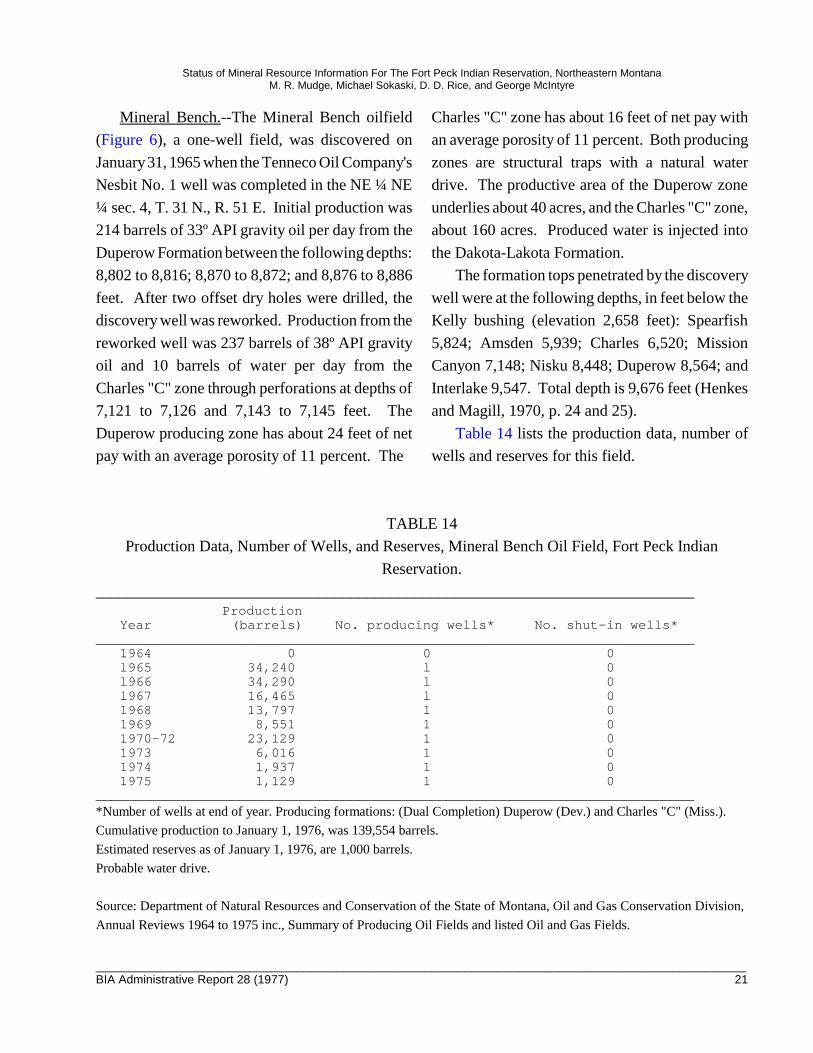
Mineral Bench.--The Mineral Bench oilfield
(Figure 6), a one-well field, was discovered on
January 31, 1965 when the Tenneco Oil Company's
Nesbit No. 1 well was completed in the NE ¼ NE
¼ sec. 4, T. 31 N., R. 51 E. Initial production was
214 barrels of 33º API gravity oil per day from the
Duperow Formation between the following depths:
8,802 to 8,816; 8,870 to 8,872; and 8,876 to 8,886
feet. After two offset dry holes were drilled, the
discovery well was reworked. Production from the
reworked well was 237 barrels of 38º API gravity
oil and 10 barrels of water per day from the
Charles "C" zone through perforations at depths of
7,121 to 7,126 and 7,143 to 7,145 feet. The
Duperow producing zone has about 24 feet of net
pay with an average porosity of 11 percent. The
Charles "C" zone has about 16 feet of net pay with
an average porosity of 11 percent. Both producing
zones are structural traps with a natural water
drive. The productive area of the Duperow zone
underlies about 40 acres, and the Charles "C" zone,
about 160 acres. Produced water is injected into
the Dakota-Lakota Formation.
The formation tops penetrated by the discovery
well were at the following depths, in feet below the
Kelly bushing (elevation 2,658 feet): Spearfish
5,824; Amsden 5,939; Charles 6,520; Mission
Canyon 7,148; Nisku 8,448; Duperow 8,564; and
Interlake 9,547. Total depth is 9,676 feet (Henkes
and Magill, 1970, p. 24 and 25).
Table 14 lists the production data, number of
wells and reserves for this field.
TABLE 14
Production Data, Number of Wells, and Reserves, Mineral Bench Oil Field, Fort Peck Indian
Reservation.
ProductionYear (barrels) No. producing wells* No. shut-in wells*
1964 0 0 0 l965 34,240 l 0 l966 34,290 l 0 l967 16,465 l 0 1968 13,797 l 0 1969 8,551 1 0 1970-72 23,129 1 0 1973 6,016 1 0 1974 1,937 1 0 1975 1,129 1 0
*Number of wells at end of year. Producing formations: (Dual Completion) Duperow (Dev.) and Charles "C" (Miss.).
Cumulative production to January 1, 1976, was 139,554 barrels.
Estimated reserves as of January 1, 1976, are 1,000 barrels.
Probable water drive.
Source: Department of Natural Resources and Conservation of the State of Montana, Oil and Gas Conservation Division,
Annual Reviews 1964 to 1975 inc., Summary of Producing Oil Fields and listed Oil and Gas Fields.
BIA Administrative Report 28 (1977) 21

_________________________________________________________________________________________________
___________________________________________________________________________
___________________________________________________________________________
___________________________________________________________________________
Status of Mineral Resource Information For The Fort Peck Indian Reservation, Northeastern Montana M. R. Mudge, Michael Sokaski, D. D. Rice, and George McIntyre
Chelsea Creek.--The Chelsea Creek field, an production was 160 barrels per day from the Nisku
abandoned one-well field, was discovered April Formation. The oil is confined in a structural trap
29, 1972, when the Calvert Petro Funds No. 1 with a natural water drive.
Federal well was drilled in SE ¼ SW ¼ sec. 33, T. Table 15 gives the production data and number
30 N., R. 48 E. Total depth is 7,545 feet. Initial of wells.
TABLE 15
Production Data, Number of Wells, and Reserves, Chelsea Creek Oil Field, Fort Peck Indian
Reservation.
ProductionYear (barrels) No. producing wells* No. shut-in wells*
1972 3,881 1 0 1973 5,428 1 0 1974 1,327 1 0 1975 912 0 0
*Number of wells at end of year. Producing formations: (Dual Completion) Duperow (Dev.) and Charles "C"
(Miss.).
Cumulative production to January 1, 1976, was 11,548 barrels.
Estimated reserves as of January 1, 1976, are zero barrels.
Probable water drive.
Source: Department of Natural Resources and Conservation of the State of Montana, Oil and Gas Conserva
tion Division, Annual Reviews 1964 to 1975 inc., Summary of Producing Oil Fields and listed Oil and Gas
Fields.
Wolf Creek.--The Wolf Creek field (Figure The depths of the formation tops, in feet below
10), abandoned in 1956, is in sec. 14, T. 30 N., R. the Kelly bushing (elevation 2,727 feet), penetrated
46 E., Roosevelt County. It was discovered in by the discovery well are as follows: Judith River
December 1952 when the Continental Oil Com-920; Fall River Sandstone 3,925; Rierdon 4,806;
pany's Fast No. 1 well was completed. Initial Kibbey 5,510; Charles 5,574; and Mission Canyon
pumped production was 185 barrels of 32º API 6,110. Total depth is 6,448 feet (Henkes and
gravity oil and 65 barrels of water per day from the Magill, 1970, p. 29).
Madison Formation. Perforations are between
depths of 6,409 and 6,437 feet. Cumulative pro
duction from two wells was 1,979 barrels of oil.
BIA Administrative Report 28 (1977) 22

_________________________________________________________________________________________________
Status of Mineral Resource Information For The Fort Peck Indian Reservation, Northeastern Montana M. R. Mudge, Michael Sokaski, D. D. Rice, and George McIntyre
�����������
The Tesoro Petroleum Company refinery, with
a charge capacity of 2,700 barrels of crude oil per
day, is the only oil refinery on the reservation
(Figure 6). In 1975, 690,142 barrels of crude oil
were refined. Nearby fields supplied 686,624
barrels and the balance was imported from Canada.
Between 1970 and 1974 the crude oil refined
yearly ranged from 515,831 barrels in 1970 to
861,309 barrels in 1969.
������������������������
An 8-inch gas pipeline crosses the southwest
corner and south-central part of the reservation.
This pipeline runs from the Bowdoin gas field to
Poplar where it connects with a line to Williston,
N. Dak. A 4-inch oil pipeline connects the Tule
Creek field with the East Poplar field. A 12-inch
oil pipeline runs from the East Poplar field to
Regina, Sask. A 10-inch oil pipeline runs south
from the East Poplar field to join a 16-inch pipe
line at Cabin Creek and extends south into Wyo
ming. The major pipelines are shown in Figure 6.
There is a ready market for oil and gas in
Montana. The state imports about 81 percent of
the oil that it refines (Table 16).
�����������������
The occurrence of petroleum and natural gas
accumulations is related to their different modes of
origin within the generally recognized three stages
of thermal maturation of organic matter in sedi
mentary rocks: (1) immature--biological processes
at shallow depths in accumulating sediments
generate gas consisting of methane; (2)
mature--thermal cracking processes generate liquid
hydrocarbons (oil) and high molecular-weight gas;
and (3) post-mature--gas, consisting of methane, is
generated by destruction of liquid hydrocarbons
and higher molecular-weight gases and by conver
sion of organic matter to carbon-rich residues and
volatile compounds in response to increasingly
severe thermal cracking processes. Thermal
cracking processes are controlled by temperature
and duration of time (geologic time) factors.
Temperature is controlled primarily by depth of
burial.
Another important element in the formation of
hydrocarbons is the deposition of organic-rich
sediments and (or) carbonates. The amount and
type of hydrocarbon (oil or gas) generated depends
on the volume of source rock and the concentration
and type of organic matter it contains. When
sufficient hydrocarbons are generated and expelled,
they migrate along vertical and horizontal path
ways until trapped in porous, permeable reservoir
rock.
In the Fort Peck Reservoir area west of the
reservation, Mississippian and older Paleozoic
rocks have probably generated oil, if adequate
source beds are present (Wolfbauer and Rice,
1976). Based on criteria of Baker (1972) and
Momper (1972) and data from Wolfbauer and Rice
(1976) and Williams (1974), organic-rich intervals
in the Ordovician Winnipeg, Red River., and Stony
Mountain Formations are considered as source
beds for Ordovician and Silurian oil because they
are in close contact with reservoirs that contain oil
in adjacent areas. The Bakken shale is an excellent
source bed for Upper Devonian and Mississippian
BIA Administrative Report 28 (1977) 23

_________________________________________________________________________________________________
Status of Mineral Resource Information For The Fort Peck Indian Reservation, Northeastern Montana M. R. Mudge, Michael Sokaski, D. D. Rice, and George McIntyre
reservoirs. Shaly interbeds in the Madison Group
are potential source beds for Mississippian oil.
Devonian shales are probable sources of oil for
Devonian reservoirs.
Oil accumulations in the Fort Peck Indian
Reservation have been both structurally and strati
graphically entrapped. Any remaining accumula
tions will probably be stratigraphic with only
subtle structural control. To the east, stratigraphic
traps in the Red River Formation and Charles
"Radcliffe" are localized along basement linea
ments which may extend to the reservation. Local
structure combined with porosity and permeability
variations and fracturing of Devonian carbonate
units such as the Winnipegosis, Dawson Bay, and
Birdbear Formations are possible traps for Devo
nian oil. Also, cyclical deposition of carbonates
interbedded with shales and evaporites in the
Souris River and Duperow Formations may form
additional Devonian stratigraphic traps.
Future discoveries that produce over six mil
lion barrels each will probably be in stratigraphic
traps. A favorable location for an oilfield with this
type of trap is in T. 29 N., R. 52 E. and within
Lower Cretaceous, Upper Jurassic, Lower Pennsyl
vanian, and Mississippian strata.
Most of the future discoveries will probably be
in structural traps that individually produce less
than two million barrels. Favorable locations are
in T. 30 N., R. 53 E. and T. 31 N., R. 51 E. Struc
tural traps could be in Devonian, Mississippian,
Silurian, and Ordovician strata.
More extensive shallow, biogenic gas accumu
lations of the immature stage which may exist in
the Poplar field area should be reexamined. Signif
icant resources of this type in low permeability
sandstone and siltstone in the Bowdoin field to the
west have been primarily stratigraphically con
trolled.
Total known reserves on the reservation are
7,033,000 barrels (Table 3). Future exploration
may increase the reserves. Conditions considered
favorable for oil exploration on the reservation are:
(1) Newly discovered oil commands a high
price.
(2) Oil is currently produced on the reservation.
(3) The reservation is underlain by sedimentary
rocks that could contain oil and gas in stratigraphic
traps. The most favorable rocks are of Lower
Cretaceous, Upper Jurassic, Lower Pennsylvanian,
and Mississippian age.
(4) In December 1974, a 1,400,000 barrel
oilfield (Big Muddy Creek) was discovered six
miles east of the southeast border of the reserva
tion. The discovery well penetrated the Interlake
(Silurian) and Red River (Ordovician) Formations
for a total depth of 11,963 feet. Initial production
was 1,246 barrels per day. Both formations pro
duce oil from a structural trap with a natural water
drive. Cumulative production in 1975, from both
formations, was 306,968 barrels of oil valued at
$4,003,556 (3 Red River wells and 1 Interlake
well). The Interlake Formation is estimated to
contain a productive area of about 320 acres with
an ultimate recovery of 200,000 barrels. The
productive area of the Red River Formation is
estimated to be 960 acres with an ultimate recovery
of 1,200,000 barrels. This discovery demonstrated
that a small structure can produce more than 1
million barrels of oil.
(5) Not all of the potentially favorable struc
tures on the reservation have been tested.
Factors considered unfavorable for oil explora
tion on the reservation are:
BIA Administrative Report 28 (1977) 24
_________________________________________________________________________________________________
Status of Mineral Resource Information For The Fort Peck Indian Reservation, Northeastern Montana M. R. Mudge, Michael Sokaski, D. D. Rice, and George McIntyre
(1) Rocky Mountain oil costs about twice as
much to find as Midcontinent oil, according to a
large independent oil company.
(2) Most of the conspicuous structures have
probably been tested.
(3) Nine of 15 oilfields are 1-, 2-, or 3-well
fields and are surrounded by dry holes. Because
the cost of drilling dry holes substantially increases
total production costs, 1-, 2-, or 3-well fields are
often noncommercial.
(4) Seven of the 15 reservation oilfields will
produce less than one-half million barrels each
(Table 3).
��������������������
All well sites should be graded and planted
with grass after the well is completed. Wells and
pumping equipment should have automatic devices
that will halt production when abnormal conditions
occur. All storage tanks should be enclosed by
dikes and should be equipped with floating roofs to
reduce the escape of hydrocarbons into the air.
�������
�������
Lignite is a major resource in the Fort Peck
Reservation. Numerous lignite beds occur in the
Fort Union Formation in the eastern half of the
reservation (Smith, 1910). Some beds are wide
spread but most are lenticular; they are a northern
extension of the Montana lignite field which has
been studied by many. Smith (1910) studied the
lignite in the reservation and Colton (1962) studied
the lignite in northeastern Montana. The same
strata to the south were studied by Collier and
Knechtel (1939), to the east by Beekley (1912), and
to the north by Bauer (1914b). All conclude that it
is difficult to correlate beds of lignite from one
area to another, partly because they are lenticular
and partly because they are extensively concealed
by younger deposits. The area in which the Fort
Union Formation occurs and the abandoned lignite
mines are shown on Figure 11.
The Fort Union strata mostly dip at a low angle
to the east. In the north central and central parts of
the reservation the tilted beds are truncated by the
Flaxville gravel. Therefore, the oldest strata of the
Fort Union crop out in those areas, as well as in the
southeastern part of the reservation. The younger
strata crop out in the northeastern part.
Northeast of Brockton (Figure 2) the lignite
beds dip 25 to 135 feet per mile to the east (Smith,
1910). Smith (1910, p. 46-47) lists 10 lignite beds
in a composite section 884 feet thick. The lignite
beds range in thickness from 2 to 9 feet; the lower
most bed is 7.7 feet thick.
West of the West Branch of Poplar River and
Cottonwood Creek are exposures of numerous
beds of lignite of the Fort Union Formation (Smith,
1910). Here the Fort Union is overlain by rela
tively thin glacial deposits on the lower elevation
and thicker deposits of Flaxville gravel and dune
sand on the upland area (Colton, 1963c, d, j, and
1964a). In the area southeast of the junction of
Cottonwood Creek and West Branch of Poplar
River, Smith (1910, p. 57) lists a measured section
(242.8 feet thick) that contains 9 lignite beds
which range in thickness from 5 inches to 6 ½
feet. He (1910, p. 56-57) lists another section (180
ft 10 in.) at the east end of the bench south of the
west branch of Poplar River with 6 lignite beds that
BIA Administrative Report 28 (1977) 25

_________________________________________________________________________________________________
Status of Mineral Resource Information For The Fort Peck Indian Reservation, Northeastern Montana M. R. Mudge, Michael Sokaski, D. D. Rice, and George McIntyre
range in thickness from 5 inches to 6 feet; most are
less than 3 feet thick. Smith (1910, p. 58) lists 4
lignite beds north of Cottonwood Creek in a sec
tion (about 63 feet); each bed is less than 2 feet
thick.
Several lignite beds are in the northeastern part
of the reservation (Smith, 1910; Bauer, 1914b; and
Colton, 1962). Good exposures are on the south
side of Wolf Creek, and along Coulee Creek. The
important beds are shown graphically on Figure 12.
Their reserves as of 1962 are shown on Table 17.
These lignite beds should be in strata equivalent to
the lower part of the Tongue River Member of the
Fort Union Formation
Colton (1962, p. 281) reports the average
thickness of individual lignite beds in the north
eastern part of the reservation to range between 2.8
and 9 feet. These contain a measured reserve of
32,952,800 short tons, and an inferred reserve of
61,487,500 short tons (Colton, 1962, p. 279).
��������
Fort Kipp.--The Fort Kipp lignite deposit, in
the southeastern part of the reservation, contains
two beds (Figure 13). The upper or Fort Peck bed
ranges in thickness from 3 to 9 feet and averages
5.4 feet. The underlying Fort Kipp bed is 7 to 10
feet thick, and averages 8.5 feet. Intervening rock,
mainly claystone between the two coal beds,
ranges in thickness from 7 to 49 feet with an
average of 27.
The lignite beds dip about 80 feet per mile,
generally northeasterly, as shown by Figure 14,
Figure 15, and Figure 16. However, there are local
variations in dip.
The overlying strata are mainly claystone, but
some sandstones and calcareous siltstones also are
present. These are generally irregularly inter
bedded and poorly indurated. Well indurated silt
and sand concretions with carbonate nuclei are
randomly distributed throughout the overlying
strata. These are small and should not adversely
affect mining (Burlington Northern, Inc., 1975, p.
177). Glacial till covers most of the area.
The topography is characterized by gently
rolling hills. Maximum depth of the coal beds is
about 200 feet (Figure 17 and Figure 18).
Lignite resources and overburden ratios are
listed in Table 18.
Reserve.--The Reserve lignite deposit is in T.
32 N., R. 55 E., T. 33 N., R. 54 E., and T. 33 N., R.
55 E., west of the towns of Reserve and Medicine
Lake (Figure 11 and Figure 19). Figure 19 depicts
structure contours of the No. 1 bed and the 50- and
100-foot isopachous lines of the overburden. The
No. 1 bed, which is the most important, has been
designated the Coal Mine lignite bed by Colton
(1962, p. 279, 280). It dips generally to the south
east about 16 feet per mile, but ranges from f lat in
some areas to as much as 80 feet per mile in others.
Coal thicknesses average 7.5 feet.
Assuming a 100-foot overburden limit, the No.
1 bed underlies 18, 237 acres and contains 246
million tons of lignite. Approximately 1,471
million cubic yards of overburden cover the bed,
giving an overburden-to-coal ratio of 6 cubic yards
to 1 ton (Great Northern Railway Co., 1967,
unpublished report). About 23 million tons of
lignite in the deposit are north of the reservation
boundary (Figure 19).
BIA Administrative Report 28 (1977) 26

_________________________________________________________________________________________________
Status of Mineral Resource Information For The Fort Peck Indian Reservation, Northeastern Montana M. R. Mudge, Michael Sokaski, D. D. Rice, and George McIntyre
A lower bed, the No. 2, is 2 feet thick in the
northern part of the deposit and thickens in the
south. In T. 32 N., R. 55 E. it is about 18 feet
below the No. 1 bed and averages 5 feet thick. In
this township, an unnamed bed lies about 18 feet
below the No . 2 bed . It ranges from 1 to 4 feet in
thickness. An upper bed, also unnamed, overlies
the No. 1 bed in the northern part of the area.
Although locally it may be as much as 6 feet thick,
it is not persistent. Resources in these beds are
unknown.
Medicine Lake.--The Medicine Lake lignite
deposit is mainly in T. 32 N., R. 54 E., but extends
into secs . 35 and 36 , T. 33 N., R. 53 E., sec . 31,
T. 33 N., R. 53 E., and sec. 31, T. 33 N., R. 54 E.
(Figure 11 and Figure 20). It is probably an exten
sion of the Reserve deposit, which is about four
miles to the east. The thickest lignite bed, identi
fied as the Timber by Colton (1962, p. 280),
averages about 9 feet thick. The bed underlies an
area of 3,740 acres and contains 58 million tons
under less than 110 feet of overburden (Ayler and
others, 1969, p. 60).
An additional bed in the area, called the local
bed D by Colton (1962, p. 280), is about 3 feet
thick. He calculated the measured resources to be
294,000 tons and indicated resources to be
1,134,000 tons.
Other Deposits.--Other lignite beds underlie the
southeastern part of the reservation in the
Brockton-Culbertson area. The A bed, locally
known as the Big Dirty, is near the contact of the
Fort Union and the Hell Creek Formations. The
bed crops out extensively in T. 28 N., R. 53 E., as
shown in Figure 11, but has been burned along its
outcrop in secs. 21 and 22. The following bed
section was reported from the center of sec. 21, T.
28 N., R. 53 E. (Smith, 1910, p. 47).
feetinch
Roof, clay
lignite 2 2
clay 1
lignite 2 7
lignite, dirty 4
lignite 2 6
Total lignite 7 7
The A bed dips to the east about 100 feet per
mile. It underlies the area between its outcrop
eastward to the reservation boundary on Big
Muddy Creek (Smith, 1910, p. 47). The bed is
estimated to contain about 400 million tons.
Three additional lignite beds are in the
Brockton-Culbertson area (Smith, 1910, p. 48). A
5 foot bed of lignite lies about 15 feet above the A
bed. It has a l-foot clay parting near its top. Bed B
is about 300 feet above bed A and is extremely
variable in thickness, ranging from 1 foot to 5-½
feet in secs. 30 and 31, T. 28 N., R. 54 E. Bed C is
about 115 feet above bed B and only about 2 feet
thick. The resources in these beds have not been
estimated.
Lignite exposures have been reported in the
eastern part of the reservation on Smoke Creek and
Sauerkraut Coulee (Witkind, 1959, pl. 1). Scat
tered occurrences are along the Poplar River and
Cottonwood Creek in the central and northern part
of the reservation, as well as north of the town of
Wolf Creek (Smith, 1910, pl. III). Exposures are
few, mainly because of the glacial till that mantles
BIA Administrative Report 28 (1977) 27

_________________________________________________________________________________________________
Status of Mineral Resource Information For The Fort Peck Indian Reservation, Northeastern Montana M. R. Mudge, Michael Sokaski, D. D. Rice, and George McIntyre
these areas. Estimate of resources in these beds is
not possible at this time.
��������
The lignite resources of the major beds in the
Fort Kipp, Reserve, and Medicine Lake deposits
total 617 million tons. Minor associated beds will
add to the resources. In the southeastern part of the
reservation the A bed contains an estimated 400
million tons. Substantial resources probably occur
in the Smoke Creek and Sauerkraut Coulee areas;
the extent of those in the central part of the reser
vation are unknown.
���������������
The rank of the coal on the reservation is
lignite A. Coal of this rank has a high moisture
content, heat contents range from 6,300 to 8,300
Btu per pound on a mineral matter free basis, and
is nonagglomerating and noncoking.
Analyses of lignite samples from drill cores are
listed in Table 19. They average 36.7 percent
moisture and 6,637 Btu per pound. Ash is low to
intermediate but sulfur varies widely, ranging from
0.32 percent to 2.28 percent. The high sulfur
content of a few samples is probably due to pyrite.
An investigation of Montana lignites by the Bureau
of Mines also indicated large variations in sulfur
percentages (Cooley and Ellman, 1975, p. 145,
146).
Lignite is tough and fibrous when freshly
mined, but it tends to disintegrate or slack when
exposed to weather, particularly when alternately
dampened and dried or exposed to heat. It heats
when oxidized which can lead to spontaneous
combustion. Special precautions must be observed
when lignite is stored in piles for long periods. The
U.S. Bureau of Mines and the U.S. Army Corps of
Engineers have developed a safe and stable storage
method (Ellman, 1963, p. 42-44), which is com
monly followed to provide emergency fuel supplies
for industrial users.
�������������
Underground Mining.--A few small under
ground lignite mines on the reservation formerly
supplied local markets. Production was limited;
none were operating on the reservation in 1975
(Lawson, 1976, p. 41, 42).
The Alton mine is in NE ¼ sec. 20, T. 28 N.,
R. 54 E. (Figure 11). A 10º slope was driven
through siltstone to the 9-foot-thick Fort Kipp bed.
Room and pillar mining method was used (Figure
21). Because the depth of cover was only 25 feet,
many rooms have caved to the surface, forming
vertically-walled depressions as much as 30 feet
long, 10 to 15 feet wide, and as much as 15 feet
deep (Henkes and Magill, 1970, p. 10). About 6.8
acres have been disturbed by mining. Production
from 1942 to 1952 when the mine was abandoned
was 32,037 tons (Henkes and Magill, 1970, p. 10).
Production prior to 1942 is not recorded.
The Simons-Gilligan mines are in SE ¼ sec.
16, T. 28 N., R. 53 E. (Figure 11). The lignite,
probably the A bed, is 12 to 14 feet thick with
cover of 30 to 50 feet of clayey material and silt
stone. Only 7 to 8 feet of the bed's thickness was
mined. Mining terminated in 1941 and the portals
were reported caved in 1965 (Henkes and Magill,
1970, p. 11). The workings underlie about 1.35
acres (Figure 22).
BIA Administrative Report 28 (1977) 28

_________________________________________________________________________________________________
Status of Mineral Resource Information For The Fort Peck Indian Reservation, Northeastern Montana M. R. Mudge, Michael Sokaski, D. D. Rice, and George McIntyre
Other small underground lignite mines have
been reported in the Brockton area, near Wolf
Creek, and in Coal Mine Coulee (Colton, 1962, p.
280).
Underground mining of the reservation's lignite
is unlikely in the foreseeable future because of the
high cost and difficult working conditions.
Surface Mining.--Surface mining accounted for
54 percent of the U.S. coal production in 1975 and
is projected to account for approximately
two-thirds by 1985 (Hunter, 1976, p. 56). Five
large active surface coal mines are in eastern
Montana. Production from them in 1975 was
21,786 thousand tons, including 300 thousand tons
of lignite. Production is expected to increase to
41.0 million tons a year by 1980 and the number of
mines to nine (Glass, 1974, p. 19, 20).
The lignite in the Fort Kipp, Reserve, and
Medicine Lake deposits can be mined by surface
methods. Lignite has been mined from the Medi
cine Lake deposit at the Wolf Creek mine (Figure
11 and Figure 20). Total production from this
small surface mine was between 13,000 and 15,000
tons. It has been closed since 1960 (Henkes and
Magill, 1970, p. 11).
The reservation's flat-lying beds and subdued
topography make area mining the most applicable
method. At area surface mines, the topsoil is
removed, usually by scraper-loaders. The overbur
den is then drilled and broken by explosives,
removed by draglines and/or power shovels, and
deposited in an adjacent cut where the coal has
been previously removed. Next, the exposed coal
is drilled and blasted, loaded by power shovels or
front end loaders, and hauled to the shipping site.
Rehabilitation of mined land has received
much attention in recent years. It includes topsoil
removal, overburden leveling, topsoil replacement,
surface manipulation to trap rain and snow,
revegetation, and possibly fertilizing and irrigation.
A study by the National Academy of Sciences
(1974, p. 53) concluded that there "presently exists
technology for rehabilitating certain western sites
with a high probability of success." These sites
include those with more than 10 inches of annual
precipitation. The annual precipitation on the
reservation is about 13 inches and, therefore,
should be sufficient for successful rehabilitation.
However, rehabilitation is essentially site specific
and depends on many factors other than precipita
tion, such as soil composition, topography, vegeta
tion, and projected land use. The average rehabili
tation cost for three mines in eastern Montana,
according to a recent Bureau of Mines study, is
about $3,560 per acre (Persse and others, 1976).
Coal beds in Montana are commonly aquifers
and are often used by farmers and ranchers as
sources of water. Surface mining may disrupt flow
patterns through these aquifers. Fortunately, the
amount of disturbed land at any time will be small
so that only local disruptions should occur. A
study of aquifers disturbed by surface mining in
southeastern Montana disclosed no indications of
adverse post-mining hydrologic conditions (Van
Voast and Hedges, 1975, p. 30).
A recent study of the capital investment and
operating costs for surface coal mines in the North
ern Great Plains indicates that the coal selling price
is markedly sensitive to production rate and bed
thickness (Table 20). Based on this the lignite
selling price from large surface mines on the
reservation would be on the order of $4.86 to $6.58
BIA Administrative Report 28 (1977) 29

_________________________________________________________________________________________________
___________________________________________________________________________
___________________________________________________________________________
___________________________________________________________________________
Status of Mineral Resource Information For The Fort Peck Indian Reservation, Northeastern Montana M. R. Mudge, Michael Sokaski, D. D. Rice, and George McIntyre
per ton. Montana lignite sold for an average price
of $5.04 per ton in 1975. The lower selling prices
of coal from mines in thicker beds (25 to 50 feet)
are included in Table 20 to show the relatively
favorable competitive position enjoyed by the large
surface mines now operating in the Northern Great
Plains.
TABLE 20
Estimated selling price for coal from surface mines in the Northern Great Plains.
Production Bed thickness Selling price (million tons/year) (feet) (dollars/ton)
3.68 10 6.58 5.52 15 4.86 9.20 25 3.39
18.40 50 2.39
Source: Basic Estimated Capital Investment and Operating Costs for Coal Strip Mines, 1976, U.S. Bur. Mines,
IC 8703.
�������
Electrical Power Generation.--In 1975 electric
utilities consumed approximately 404 million tons
or 72 percent of the total domestic supply
(Westerstrom, 1976, p. 40). Because electrical
power consumption is expected to increase 7.1
percent per year, coal consumption will continue to
rise (Bonneville Power Administration, 1973, p.
13). Thus, the electric utilities will be the most
important market for reservation coal.
Coal specifications for power plant use include
the usual properties, such as moisture, ash, sulfur,
and heat content. Also of importance are the
softening temperature, initial deformation tempera
ture, fluid temperature, and fouling characteristics
of the ash. These properties should be determined
in any future investigation of reservation coals.
Coal contracts for electrical power plants
specify limits on moisture, ash, and sulfur content;
penalties are assessed for exceeding specified
limits. Similarly, a minimum heat content is
specified. Ash and sulfur can usually be reduced
and the heat content increased by mechanical
cleaning.
In pulverized coal firing, ash fusion character
istics determine whether the ash can be removed
from the furnace in either the liquid or dry form.
For example, coal with an ash softening tempera
ture above 2,600ºF cannot be used in cyclone
furnaces (Spicer and Leonard, 1968, p. 3-22). The
fusion characteristics of the coal ash commonly
depend on the amount of bases and acids in the
ash. These terms have a different meaning in
pyrochemistry than in normal wet chemistry. In
pyrochemistry, the bases are Fe2O3, CaO, MgO,
BIA Administrative Report 28 (1977) 30

_________________________________________________________________________________________________
___________________________________________________________________________
___________________________________________________________________________ 1.0
Status of Mineral Resource Information For The Fort Peck Indian Reservation, Northeastern Montana M. R. Mudge, Michael Sokaski, D. D. Rice, and George McIntyre
Na2O, K2O; the acids are SiO2, A12O3, and TiO2.
An ash analysis of a lignite sample from the Fort
Kipp prospect, Fort Kipp bed SW ¼ NE ¼ sec. 9,
T. 28 N., R. 54 E. is as follows (Burlington North
ern, Inc., 1975, p. 197).
Ash analysis (percent of ash)
Loss on ignition SiO2 A12O3 Fe2o3 TiO2 P2O5 CaO MgO Na2O K2O SO3
22.4 13.5 13.0 0.3 0.3 12.4 6.1 1.6 0.6 21.9
Most modern power plants operate with steam
temperatures above 1,000ºF. These high tempera
tures occasionally cause a new type of fouling
deposit to form on boiler tubes. The source of
these deposits are some sodium and potassium
compounds found in the coal, particularly the
chlorides, which decompose in the flame, are
vaporized, and combine with SO3. These alkali or
alkali-iron sulfates then condense on the boiler
tubes. Coal ash containing 2 to 5 percent Na20 is
considered medium fouling for Western coals;
higher Na2O contents may cause severe fouling
(Winegartner and Ubbens, 1974, p. 6). Some
boiler manufacturers, recognizing that most of the
alkali associated with fouling problems is in the
form of chlorides, evaluate fouling potential by
analyzing the coal for chlorine. Chlorine content
above a critical value ranging from 0.3 to 0.5
percent can lead to fouling (Sondreal and others,
1968, p. 21).
The Environmental Protection Agency (EPA)
requires that no more than 1.2 pounds of sulfur
dioxide per million Btu can be emitted into the
atmosphere. To comply with this regulation, the
lignite must contain less than 0.44 percent sulfur,
and this assumes it averages 6,650 Btu/pound and
that 10 percent of the sulfur remains in the ash
(Zachar and Gilbert, 1968, p. 5-24). However,
recent tests of lignite-burning power plants indi
cated that about 10 to 40 percent of the sulfur
remained in the ash; in one test the ash retained 73
percent (Gronhovd and others, 1974, p. 102).
A coal property that is important in pulverized
firing is grindability, which is a composite physical
property dependent on hardness, toughness,
strength, tenacity, and fracture. Grindability is
commonly measured by the Hargrove grindability
test which is a standard test of the American
Society of Testing Materials.
Some trace elements in coal may be hazardous
when emitted into the atmosphere in the form of
vapors or fine particles during combustion. These
include mercury, selenium, beryllium, cadmium,
arsenic, lead, antimony, thallium, vanadium,
chromium, manganese, nickel, and zinc (Davidson
BIA Administrative Report 28 (1977) 31

_________________________________________________________________________________________________
Status of Mineral Resource Information For The Fort Peck Indian Reservation, Northeastern Montana M. R. Mudge, Michael Sokaski, D. D. Rice, and George McIntyre
and others, 1974, p. 1107; Linton and others, 1975,
p. 8523.
Semiquantitative analyses of ash from four
lignite beds on the reservation are listed in Table
21 (Great Northern Railway Co., 1953-1955).
Gasification.--Natural gas has been one of the
cheapest and most convenient fossil fuels. The
heat content is high, and natural gas is virtually
nonpolluting. These attributes caused the con
sumption of natural gas to grow at a rate of 5.4
percent per year between 1947 and 1971 as com
pared to 3.1 percent per year for total energy
consumption. However, gas consumption declined
3 percent in 1974 and 7 percent in 1975, while
proven reserves also continued to decline
(Koelling, 1976, p. 109). By the year 2000, about
20 percent of the gas consumed could be synthetic
natural gas from coal. This would require 300
million tons of coal per year for about 57 plants
each producing 250 million cubic feet of gas per
day (Dupree and Corsentino, 1975, p. 42). Al
though no significant production is expected before
1980, the synthetic natural gas industry could be a
future market for the reservation's coal.
First generation gasification plants will proba
bly use proven foreign technology based on the
Lurgi gasifier. Lignite is particularly suitable as a
feed stock because it is non-agglomerating and
highly reactive. Also, lignite from the reservation
can easily meet the ash requirements (under 30
percent) for gasification by the Lurgi process.
The cost of a first-generation, 250 million
cubic-feet-per-day gasification plant, which is the
minimum feasible size, is estimated to be more
than $1 billion (Winegartner, 1976, p. 58). The
cost of synthetic natural gas to be manufactured
between 1981 and 2006 in North Dakota and
delivered to Michigan is expected to average about
$3.00/Mcf (Mermer, 1975, p. 226). Another
estimate places the cost close to $4.00/Mcf
(Hammond, 1976, p. 193). At the present time, a
synthetic natural gas industry appears likely to
develop in the United States only with the help of
some form of government subsidy.
Much research is being directed toward the
development of new gasification technology.
Among second generation processes are the Hygas,
Bi-gas, Cogas, Synthane, and the C02 Acceptor
process. The latter is of particular interest as it is
being developed to gasify lignite. Which processes
will be the most economical cannot be determined
at this time. Each will reduce gas costs by approxi
mately 10 to 15 percent over first generation
processes (Elliott, 1975, p. 284).
Underground gasification may be applicable to
some of the deeper lignite beds on the reservation.
The heat content of the gas is low, but it could be
used near the gasification site for electrical power
generation and industrial uses or upgraded to the
quality of natural gas. An advantage is that a clean
fuel would be produced. Also, underground
mining would be eliminated, along with its low
productivity and health and safety problems;
surface mining would also be eliminated along
with its environmental concerns. Waste disposal
problems would be eliminated because the ash
would remain underground. However, techniques
that might insure uniform gas flow and quality
have not been well developed. There may be
problems with subsidence as well as contamination
of groundwater. Nevertheless, underground gasifi
cation may offer a solution to the utilization of
some reservation lignite resources.
BIA Administrative Report 28 (1977) 32
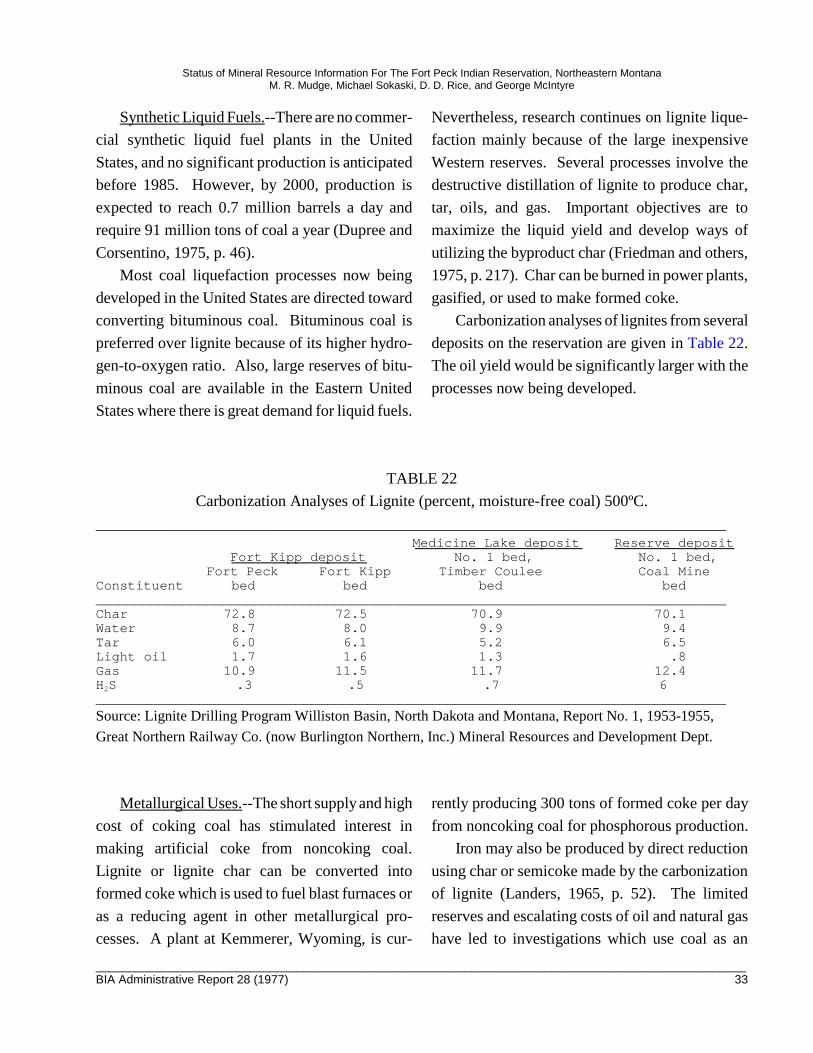
_________________________________________________________________________________________________
_______________________________________________________________________________
_______________________________________________________________________________
_______________________________________________________________________________
Status of Mineral Resource Information For The Fort Peck Indian Reservation, Northeastern Montana M. R. Mudge, Michael Sokaski, D. D. Rice, and George McIntyre
Synthetic Liquid Fuels.--There are no commer
cial synthetic liquid fuel plants in the United
States, and no significant production is anticipated
before 1985. However, by 2000, production is
expected to reach 0.7 million barrels a day and
require 91 million tons of coal a year (Dupree and
Corsentino, 1975, p. 46).
Most coal liquefaction processes now being
developed in the United States are directed toward
converting bituminous coal. Bituminous coal is
preferred over lignite because of its higher hydro-
gen-to-oxygen ratio. Also, large reserves of bitu
minous coal are available in the Eastern United
States where there is great demand for liquid fuels.
Nevertheless, research continues on lignite lique
faction mainly because of the large inexpensive
Western reserves. Several processes involve the
destructive distillation of lignite to produce char,
tar, oils, and gas. Important objectives are to
maximize the liquid yield and develop ways of
utilizing the byproduct char (Friedman and others,
1975, p. 217). Char can be burned in power plants,
gasified, or used to make formed coke.
Carbonization analyses of lignites from several
deposits on the reservation are given in Table 22.
The oil yield would be significantly larger with the
processes now being developed.
TABLE 22
Carbonization Analyses of Lignite (percent, moisture-free coal) 500ºC.
Fort Kipp deposit Fort Peck Fort Kipp
Constituent bed bed
Medicine Lake deposit Reserve deposit No. 1 bed, No. 1 bed,
Timber Coulee Coal Minebed bed
Char 72.8 72.5 70.9 70.1 Water 8.7 8.0 9.9 9.4 Tar 6.0 6.1 5.2 6.5 Light oil 1.7 1.6 1.3 .8 Gas 10.9 11.5 11.7 12.4 H2S .3 .5 .7 6
Source: Lignite Drilling Program Williston Basin, North Dakota and Montana, Report No. 1, 1953-1955,
Great Northern Railway Co. (now Burlington Northern, Inc.) Mineral Resources and Development Dept.
Metallurgical Uses.--The short supply and high
cost of coking coal has stimulated interest in
making artificial coke from noncoking coal.
Lignite or lignite char can be converted into
formed coke which is used to fuel blast furnaces or
as a reducing agent in other metallurgical pro
cesses. A plant at Kemmerer, Wyoming, is cur
rently producing 300 tons of formed coke per day
from noncoking coal for phosphorous production.
Iron may also be produced by direct reduction
using char or semicoke made by the carbonization
of lignite (Landers, 1965, p. 52). The limited
reserves and escalating costs of oil and natural gas
have led to investigations which use coal as an
BIA Administrative Report 28 (1977) 33

_________________________________________________________________________________________________
Status of Mineral Resource Information For The Fort Peck Indian Reservation, Northeastern Montana M. R. Mudge, Michael Sokaski, D. D. Rice, and George McIntyre
alternate fuel for indurating iron taconite pellets.
Experiments at the Twin Cities Metallurgical
Center indicate that lignite would be suitable.
About 100 pounds of lignite would be required to
produce each ton of pellets (Kaplan, 1975, p. 348).
Cement Manufacture.--In the past few years,
nearly all cement manufacturers have had to con
sider coal as a primary fuel. Many have acquired
coal reserves or signed long-term contracts to
assure a reliable coal supply.
A temperature of 3,000ºF must be maintained
in a cement kiln (Landers, 1965, p. 55). This
temperature cannot be obtained from raw lignite
because of its low heat content. However, the heat
content, which must exceed 10,000 Btu/pound, can
be increased sufficiently by drying lignite (Leonard
and McCurdy, 1968, p. 3-25; Landers, 1965, p.
55).
��������������
General.--Local-markets are limited and can
utilize only a small quantity of the reservation's
lignite. If large-scale mines are developed, the
energy contained in the lignite will have to be
utilized in distant markets. The markets will be
supplied in two ways, by unit trains or slurry
pipelines. Alternatively, the lignite could be
converted near the mine to high-quality energy
forms such as electrical power, gas, or liquid fuels.
These, in turn, could be transported to distant
markets.
Unit trains.--The reservation is provided with
rail service by Burlington Northern, Inc. The main
line passes through the southern part of the reser
vation immediately north of the Missouri River. A
line east of the reservation runs north from Bain
ville to Plentywood. From here, the line, about 12
miles north of the reservation, runs west.
Unit trains consist of special purpose rail
haulage equipment specifically designed to trans
port coal over long distances. They are loaded at
the mine site, travel over existing rail lines to
specific destinations, are unloaded, and returned
directly to the mine--all on a predetermined sched
ule. The significant economies achieved by unit
train transportation over conventional rail transpor
tation are mainly the result of three principal
factors: design efficiency, equipment balance, and
intensive use (Glover and others, 1970, p. l). Unit
trains are advantageous over other transportation
systems because they use existing rail lines. Thus,
capital cost is relatively low and lead-time between
planning and full-scale operation is minimized.
A recent study lists the cost of moving coal in
a unit train as about 1.2 cents per ton-mile for 500
miles, 1.0 cents per ton-mile for l,000 miles, and
0.9 cents per ton-mile for 1,500 miles (Wasp,
1976, p. 29).
Transportation costs can be reduced by remov
ing a substantial part of the lignite's moisture.
Experiments at the Grand Forks Energy Research
Center showed that the moisture content could be
reduced from 39 percent to 12 percent by a simple
drying operation (Ellman and others, 1975, p. 322).
Another advantage is that dried lignite has a higher
heat content and is a superior product for power-
plant utilization.
Slurry Pipelines.--Another method of transpor
tation to distant markets is by slurry pipeline. With
this method, coal is crushed and ground extremely
BIA Administrative Report 28 (1977) 34

_________________________________________________________________________________________________
Status of Mineral Resource Information For The Fort Peck Indian Reservation, Northeastern Montana M. R. Mudge, Michael Sokaski, D. D. Rice, and George McIntyre
fine, water is added, and the resultant mixture
pumped through pipelines. In Arizona 300 tons of
coal per hour are transported in an
18-inch-diameter pipeline 273 miles from a surface
mine to a powerplant. The coal is ground to
325-mesh and mixed with an equal weight of water
to form the slurry.
An advantage of pipelines is that they are
continuous transportation systems. Manpower and
energy requirements are low. They are safer and
more environmentally acceptable than unit trains in
that there is no hazardous grade crossings, noise, or
dust. A disadvantage is the large water require-
ment--about 600 acre-feet per million tons of
coal--and the slurry must be dewatered before it
can be used.
The cost of transporting 25 million tons of coal
per year a distance of l,000 miles is estimated at
0.5 cents per ton-mile (Wasp, 1976, p. 29). Costs
increase sharply with both decreased volume and
distance. Each initial slurry pipeline will require a
coal resource of about 750 million tons. The
known surface-minable resources on the reserva
tion are insufficient to support a large slurry pipe
line system, but additional exploration could
establish sufficient resources on the reservation
and in adjacent areas. Also, feeder pipelines from
smaller deposits may be practical if slurry pipelines
become a more established transportation method.
Pneumatic feeder pipelines have also been pro
posed (Rieber and others, 1975, p. IV-2). A recent
study indicated that about half of the coal exported
from the Northern Great Plains will be transported
via slurry pipelines and about half by unit trains
(U.S. Department of Interior, 1975, p. 305).
�������������������������
If the reservation's coal is to be converted to
high-quality energy forms such as electrical power,
synthetic natural gas, or liquid fuels at or near the
mine site and transported to distant markets, one of
the primary considerations will be an adequate
water supply. A base load l,000 megawatt electri
cal power plant will require 4.7 million tons of
lignite per year (80 percent capacity factor, 6,650
Btu per pound lignite). The water requirements are
estimated to be 12,000 to 15,000 acre-feet per year
if a wet natural draft cooling tower is used (North
ern Great Plains Resources Program, 1975, p. 71).
A dry tower will require only 2,000 acre-feet per
year, but dry towers cost more than three times as
much to build as natural draft wet towers
(Woodson, 1971, p. 77). Thus, there is consider
able economic incentive to locate power plants at
sites where relatively large supplies of cooling
water are available. Nevertheless, a power plant in
the 300 megawatt range with two dry cooling
towers is under construction at Wyodak, Wyoming.
The "best estimate" of the water requirements
for a 250 Mscf per day coal gasification plant in
the Northern Great Plains is 9,500 acre-feet per
year (Northern Great Plains Resources Program,
1975, p. 72). The water requirement of a coal
liquefaction plant producing 100,000 bbl per day is
25,000 acre-feet per year (U.S. Department of
Interior, 1975, p. 79). These estimates assume that
wet cooling towers are used; water requirements
are reduced by approximately one-half with dry
cooling towers.
Water for coal development in northeastern
Montana can probably be provided by the Missouri
River system without major storage facilities (U.S.
BIA Administrative Report 28 (1977) 35
_________________________________________________________________________________________________
Status of Mineral Resource Information For The Fort Peck Indian Reservation, Northeastern Montana M. R. Mudge, Michael Sokaski, D. D. Rice, and George McIntyre
Department of Interior, 1975, p. 308). However,
water pipelines and aqueducts will be needed.
Even with extensive coal development in Montana,
mine-site electrical power generation is not ex
pected to be large; most of the coal will be used for
synthetic natural gas conversion or exported (U.S.
Department of Interior, 1975, p. 305).
Mine-site conversion of lignite will generate
large quantities of ash. Much research is being
directed toward utilizing ash by-products, espe
cially fly ash, from electrical generating plants. Fly
ash is used in cement manufacture, concrete
construction as an aggregate, concrete products,
soil amendments, plant-growth stimulants, soil
stabilization, abrasives, lightweight aggregate, and
water purification, as well as a filler material in
tile, rubber, paint, putty, and asphalt (Quilici, 1973,
p. 5). Experiments at the University of North
Dakota have demonstrated that excellent brick can
be made from a mixture of 25 percent fly ash and
75 percent clay (Manz, 1973, p. 205). A mixture
of fly ash, lime, and aggregate (called poz-o-pac) is
used for road building in North Dakota. Because
of its high alkali content, lignite fly ash can be used
in flue gas desulfurization units of power plants
(Sondreal and Tufte, 1975, P- 65).
In 1975, 60 million tons of ash were produced,
but only 16.4 percent were processed. With the
probable scarcity of large markets near the reserva
tion, most of the ash will constitute a disposal
problem. Fortunately, it can be buried along with
the spoil at surface mines.
������
Coal commonly contains trace elements that
may be recovered in the future. For example, a
recent study of U.S. uranium resources indicated
that little high-grade uranium ore remains to be
discovered (Lieberman, 1976, p. 431). Therefore,
western lignite deposits have been suggested as a
possible future source of uranium. Uranium
content above 25 ppm (parts per million) will be
significant. It will be concentrated in the ash to
about 250 ppm. Other trace elements of interest,
which may be recovered from coal, are gallium,
germanium, selenium, tellurium, thallium, and
vanadium.
Nonmetallic Mineral Resources
���������
Bentonite is a clay mineral used mainly in the
manufacture of iron (taconite) ore pellets, foundry
sands, and oil-well drilling mud. Numerous beds
of bentonite are in the Bearpaw Shale in the west
ern and southwestern part of the reservation
(Colton and Bateman, 1956; and Jensen and
Varnes, 1964). Some beds of bentonite and
bentonitic shale are in the Hell Creek Formation
southwest of the area (C. A. Wolfbauer and D. D.
Rice, written commun., 1976).
In the southwestern part of the reservation and
adjoining Fort Peck area bentonite beds are com
mon throughout all of the exposed Bearpaw Shale
except the upper 255 feet (Jensen and Varnes,
1964, pl. 2), and the thickness of the beds is as
much as 18 inches. In the Charles M. Russell
Wildlife Refuge, Wolfbauer and Rice (1976)
record beds in the Bearpaw as much as 6 ½ feet
thick. They had 18 bentonite samples tested, all of
which were considered unsuitable for use as drill
ing mud, but of good enough quality to be a binder
BIA Administrative Report 28 (1977) 36

_________________________________________________________________________________________________
����
Status of Mineral Resource Information For The Fort Peck Indian Reservation, Northeastern Montana M. R. Mudge, Michael Sokaski, D. D. Rice, and George McIntyre
for foundry sands and possibly taconite pellets.
The samples they obtained from the Hell Creek are
not suitable for use in foundry sand. As noted by
Wolfbauer and Rice (1976) economical mining of
bentonite is dependent upon thin strippable over
burden.
A small amount of bentonite has been mined
near Brockton in S ½ NE ¼ SW ¼ sec. 21, T. 28
N., R. 53 E. (Henkes and Magill, 1970, p. 31). The
deposit is about 2 feet thick. Some test results
[sample FP-65-20, Table 23] indicate that the
properties approach those of commercial bentonite
(Henkes and Magill, 1970, p. 31).
Other bentonite deposits were reported in the
Medicine Lake area in SE ¼ sec. 9, T. 32 N., R. 54
E., and SW ¼ sec. 10, T. 32 N., R. 54 E. (Henkes
and Magill, 1970, p. 31). Test results of a sample
from the first location [sample FP-65-18, Table 23]
indicate that it is of lower quality than the benton
ite in the Brockton area, but should be suitable as
a ditch or pond sealant (Henkes and Magill, 1970,
p. 31).
The resources in these deposits are unknown.
Additional deposits may be present in the Bearpaw
shale which is found over much of the reservation.
In 1975, bentonite production in the U.S. was
about 3.2 million dry tons per year and is expected
to reach 6.5 million dry tons per year by 2000
(Auer, 1976, p. 29). Most of this projected in
crease will result from more oil and gas well
drilling and major expansions in the taconite
industry. The former will continue to use
high-grade sodium bentonite, but the latter is
expected to use more abundant and lower quality
calcium bentonite. Bentonite is also used as a feed
supplement for livestock and as a sealant for ponds
and reservoirs. Because of the increased consump
tion, the reservation's bentonite may supply these
expanding markets.
The sedimentary rocks on the reservation
contain substantial quantities of salt (NaCl). A
deposit ranging from 0 to 180 feet thick underlies
the reservation in Mississippian rocks at a depth
ranging from about 5,000 to 8,000 feet (Figure 23)
(Great Northern Railway Co., 1959).
Salt also occurs in the underlying Devonian
strata (Figure 24). The thickness of this deposit is
more than 200 feet in the northeastern part of the
reservation. Its depth is about 10,000 feet. Addi
tional salt deposits may be present in rocks of
Triassic and Permian age (Great Northern Railway
Co., 1965, p. 2).
The widespread occurrence of more accessible
salt deposits elsewhere make those on the reserva
tion of little economic interest at this time.
������
The thick salt deposit of Devonian age that
underlies the reservation contains as many as three
potash beds ranging in thickness from l to 7 feet
(Figure 25).
Solution mining has been suggested as the best
method for developing these potash beds. The
inherently high temperatures at the depth of these
beds should reduce evaporation costs. In addition,
the availability of adequate water supplies and low
cost energy in the form of lignite will be advanta
geous (Great Northern Railway Co., 1965, p. 17,
21). A thin bed of potash, similar to those on the
reservation, has been mined experimentally in the
BIA Administrative Report 28 (1977) 37

_________________________________________________________________________________________________
Status of Mineral Resource Information For The Fort Peck Indian Reservation, Northeastern Montana M. R. Mudge, Michael Sokaski, D. D. Rice, and George McIntyre
Carlsbad Basin, New Mexico; the experiment was
considered successful in both a technical and
practical sense (Davis and Shock, 1970, p. 96).
Successful solution mining of potash on a commer
cial scale in south-central Saskatchewan, Canada,
by Kalium Chemicals, Ltd., a subsidiary of PPG
Industries, Inc., has been reported, but the details
have not been disclosed (Husband, 1971, p. 141,
142). In July 1976, Kalium Chemicals, Ltd. drilled
an exploration hole in Bottoneau County, North
Dakota. The potash beds intersected in this hole
are an extension of the same ones that underlie the
reservation.
U.S. production of potash has been about 2.7
million tons (K20 equivalent) per year for the past
decade. The potash resources on the reservation
are likely to be developed only when demand
increases and an economical solution-mining
method is developed.
�����������
Hydrous sodium sulfate is known as Glauber's
salt and used principally in pulp and paper industry
in manufacture of kraft paper; it is also used in
container and plate industries, in curing hides, in
the dye and coal tar industry, in stock feeds, in
medical and chemical industries, in rayon and
textiles, and in the metallurgical industry.
The salt occurs as crusts, as crystals intermixed
with mud, and as massive beds in certain intermit
tent lakes. Lakes known to contain hydrous so
dium sulfate are just east of the reservation in
eastern Sheridan County and further east in North
Dakota (Grossman, 1949; Binyon, 1951, 1952;
Sahinen, 1956; and Witkind, 1952 and 1959).
According to Witkind (1959, p. 64) many of the
lakes are saline, which does not necessarily indi
cate the presence of a sodium sulfate. In general
the deposits are within undrained depressions of
which the walls and floors commonly consist of till
(Witkind, 1959, p. 71). Witkind (1959, p. 73)
suggested that the deposits in this region were
localized along channels that formed marginal to
the ice front and the renewed advance of the glacier
partly or completely buried the channel with till; it
thus became a buried valley with surface depres
sions.
In the reservation there are numerous types of
glacial lakes and ponds (Figure 26). The areas
shown as many small pond deposits are mostly
depressions as much as half a mile across in the till
plain (Colton, 1955). Most larger pond deposits
shown on Figure 26 are in ice-marginal and out
wash channels (Colton, 1955, 1962, 1963a-j,
1964a; Witkind, 1959; and Jensen and Varnes,
1964).
Lake deposits in depressions above buried
channels are in the area northwest of Wolf Point
(Colton, 1955, 1963e), north and northeast of
Chelsea (Colton, 1963b), south of Sargent Creek
(Colton, 1963g), west of the upper reaches of
Smoke Creek (Colton, 1964), northwest of Poplar
(Colton, 1963f), east of Wolf Creek, and west of
Medicine Lake (Colton, 1963). The lakes are
small; most are less than 100 acres.
The potential for deposits of hydrous sodium
sulfate in the reservation has not been established.
Brush Lake, about 15 miles east of the reservation,
is the nearest lake described by Witkind (1959, p.
68) that contains sodium sulfate. The deposits in
Montana have not been considered economically
important because of their remote locations and
small sizes (Weisman and Tandy, 1975, p. 1086).
BIA Administrative Report 28 (1977) 38

_________________________________________________________________________________________________
Status of Mineral Resource Information For The Fort Peck Indian Reservation, Northeastern Montana M. R. Mudge, Michael Sokaski, D. D. Rice, and George McIntyre
However, the large price increase from $23.99/ton
in 1974 to $45.20/ton in 1975 could stimulate
interest in these smaller and more remote deposits
(Klingman, 1976, p. 158).
������������
Large deposits of clay and shale are in and near
the reservation, but present data are inadequate to
determine their suitability for various manufactur
ing uses, such as lightweight aggregate, common
and facing brick, tile, pottery, and other stoneware.
Most clay and shale deposits in eastern Montana
have a low kaolinitic clay content and are rarely
well suited for manufacture of heavy ceramic
wares such as brick, tile and pottery (Knechtel and
Weis, 1965).
Some beds of clay shale in the Fort Union
Formation in Montana, however, have been found
suitable for use in manufacturing common and
facing bricks, tile, and pottery. Many clay deposits
in Daniels and Sheridan Counties, north of the
reservation, have been sampled and tested by
Sahinen, Smith, and Lawson (1960); their location
and ceramic properties are shown in Table 24 and
Table 25. Samples 186, 203, and 204 are from the
Bearpaw Shale, and the latter two are from the
southern part of the reservation. The rest of the
samples are from the Fort Union Formation, north
and northeast of the reservation. The same strata,
however, should occur in the northern part of the
reservation.
Almost all samples from the Fort Union are
suitable for use in making common brick and some
of them are suitable for use in various types of
ceramic products.
The shale samples from the Bearpaw Shale are
not suitable for use in making brick or ceramic
products.
Expandable clay or shale for use as lightweight
aggregate is present in the Bearpaw Shale in and
near the reservation. The presence of admixed
bentonite in the shales is a key indicator of their
suitability as use for lightweight aggregate
(Sahinen, 1957). Two samples of bentonitic
clay-shale (samples 203 and 204) appear to be
suitable for use as lightweight aggregate.
Southwest of the reservation in the Charles M.
Russell Fish and Wildlife Refuge, 19 samples from
the Bearpaw Shale and one sample of glacial till
were tested by Wolfbauer and Rice (1976). Only
four of the shale samples were not suitable for
lightweight aggregates.
Very little testing of the clay deposits on the
reservation has been done. No deposit has been
identified as a source of material suitable for the
manufacture of ceramic products such as structural
and face brick, drain tile, vitrified pipe, quarry tile,
flue tile, conduit, pottery, stoneware, and roofing
tile. The reservation should be explored for clay
deposits and samples tested for plasticity, green
strength, dry strength, drying and firing shrinkage,
vitrification range, and fired color.
�������������
Deposits of sand and gravel are widespread in
the reservation (Colton, 1964) (Figure 27) and
range in age from Tertiary to Recent. Most depos
its are unsuitable for use as concrete aggregate as
they commonly contain quartzite, chert and agate
pebbles.
BIA Administrative Report 28 (1977) 39
_________________________________________________________________________________________________
Status of Mineral Resource Information For The Fort Peck Indian Reservation, Northeastern Montana M. R. Mudge, Michael Sokaski, D. D. Rice, and George McIntyre
The largest and most extensive deposit of sand
and gravel comprises the Flaxville Formation,
which covers vast areas in the north central and
northwestern parts of the reservation (Colton and
Bateman, 1956). Overburden is absent on the
deposit in the driftless area except south of Cotton
wood Creek where dune sand (as much as 12 feet
thick) mantles the gravel (Colton, 1964). In gen
eral the Flaxville is well stratified and well sorted,
consisting of about 5 percent silt, 35 percent sand,
60 percent pebbles, and a few cobbles (Colton and
Bateman, 1956). It is mostly between 30 and 50
feet thick. However, Colton (1964) suggested that
individual prospects should be drilled first to
determine the quality and quantity of sand and
gravel because some parts of the formation are
mostly clay and sand.
The Flaxville is a vast resource of sand and
gravel in the reservation where-it covers about 750
square miles (Colton in Jensen and Varnes, 1964).
In the Wolf Creek area Colton (1955) noted that
the largest remnant of the Flaxville plain is
about-40 feet thick and covers about 3 square
miles. He estimated the reserve of the deposit at
about 25,000,000 cubic yards of sand and gravel.
Wiota gravel deposits are common along the
southern and southeastern margins of the reserva
tion (Figure 27). The gravel deposits are preglacial
and are commonly on benches along the Missouri
River and lower reaches of Big Muddy Creek. The
Wiota gravel deposits are at altitudes ranging from
2,550 to 2,000 feet (Colton, 1955; and Jensen,
1952b). Some of them have been sources for road
metal and aggregate from numerous pits along U.S.
highway 2 (Figure 27). The deposits commonly
contain poorly sorted sand and gravel and sand
lenses in the lower part with pebbles as much as 7
inches across, and silt and fine- to medium-grained
sand with intercalated clay lenses in the upper part
(Jensen and Varnes, 1964; and Colton, 1955). The
deposits are commonly overlain by till.
The Plentywood Formation occurs along the
west side of Big Muddy Creek (Colton, 1962). It
is commonly more than 20 feet thick and may be as
much as 125 feet thick. Mechanical analyses of
representative samples of the deposits show them
to consist of 6 percent silt, 23 percent sand, 12
percent granules, and 59 percent pebbles or larger
(Colton, 1962, p. 266). The pebbles are mostly
carbonate and quartzite (Colton, 1962, p. 265).
The gravel has been used for road metal and
provides a good foundation material. The volume
of the deposit in secs. 1, 11, and 12, T. 32 N., R. 55
E., which covers about 1 square mile and is at least
30 feet thick, is about 30,976,000 cubic yards
(Colton, 1962, p. 283).
Glacial outwash deposits are common on
terraces along some of the larger tributaries of the
Missouri River and in meltwater channels in and
marginal to the till-covered areas (Colton, 1955,
1962, 1963a-j; Jensen and Varnes, 1964; and
Witkind, 1959). They have been local sources for
road metal in the southern and eastern parts of the
reservation (Figure 27). The deposits are com
monly linear and of narrow width. An example is
in the northeast part of the reservation where
Colton (1962, p. 263) records them as much as 50
feet thick, commonly less than 100 feet wide, and
as much as 5 miles long. They overly till and
commonly are overlain by alluvial, colluvial, and
eolian deposits. The outwash deposits consist of
sandy gravel and silt with pebbles of quartzite,
carbonate, and granite. The estimated reserve of a
large body of outwash gravel in secs. 16, 17, 20,
BIA Administrative Report 28 (1977) 40

_________________________________________________________________________________________________
Status of Mineral Resource Information For The Fort Peck Indian Reservation, Northeastern Montana M. R. Mudge, Michael Sokaski, D. D. Rice, and George McIntyre
21, 28, and 34 of T. 28 N., R. 44 E., and sec. 3, T.
27 N., R. 44 E. is 5 million cubic yards (Jensen and
Varnes, 1964, p. 36).
Eskers and kames contain deposits of sand and
gravel that have been used locally in the reserva
tion as road metal (Figure 27). Esker deposits are
sinuous ridges of poorly sorted stratified sand and
gravel as much as 60 feet thick; they contain
boulders as much as 2 feet across (Colton,
1963a-j). Colton (1955) describes the deposits in
the Wolf Creek area as 1 ¼ miles long, 100 feet
wide, and about 15 feet high. An esker deposit in
the eastern part of the area is about 20 feet high
and about one mile long (Witkind, 1959, p. 49).
Kame deposits contain rudely stratified and
poorly sorted sand and gravel, about 100 feet thick,
with boulders as much as 2 feet across (Colton,
1963a-j). In the Wolf Creek area there are many
low gravel hills, each about 30 feet high, covering
nearly 100 acres (Colton, 1955). Kame deposits in
the eastern part of the area are 30 to 50 feet high
(Witkind, 1959, p. 48).
Alluvium, consisting of gravel, fine sand,
sandy silt, silty sand, and clay, is in the valley of
the Missouri River and its tributaries (Figure 27).
The deposits are as much as 150 feet thick along
the Missouri River. Elsewhere the thickness of the
alluvium ranges from a thin veneer to as much as
100 feet. The problem of removing the overlying
fine-grained sediment limits their use (Jensen and
Varnes, 1964, P- 39).
Eolian deposits as dune sand are present in the
area north of Poplar, north and east of Brockton,
south of Cottonwood Creek, northeast of Tule
Creek, northeast of the upper reaches of little
Porcupine Creek, and locally west of Big Muddy
Creek. The deposits consist mostly of medium to
fine-grained sand and less than 10 percent silt
(Colton, 1962, p. 270) and are as much as 20 feet
thick (Colton, 1955; and 1963a, b, c, f, h, i, ;).
Extensive industrial development in eastern
Montana, resulting from the availability of vast
energy resources, could create a strong demand for
local sand and gravel for road building and con
struction. An ideal deposit should be free of clay,
silt, and organic material and contain about 60
percent gravel and 40 percent sand (Goldman,
1975, p. 1037).
Testing procedures to determine the quality of
sand and gravel have been devised by the Amer
ican Society for Testing Materials. Principal tests
are for toughness, abrasion resistance, soundness,
organic content, grading, specific gravity, absorp
tion, thermal incompatibility, and alkali-aggregate
reactivity. The latter is of particular interest be
cause aggregates with a high silica content, such as
quartzites and chalcedony, react with alkalies in
portland cement to form an alkali-silica gel. This
reaction causes expansion, cracking, and deteriora
tion of concrete. Sand and gravel from the Wiota
gravel and Flaxville Formation are composed
almost entirely of quartzite and chalcedony in some
areas (Colton, 1962, pl. 37). The composition of
stream and outwash deposits may be similar.
Methods for controlling alkali-silica reactivity
include the use of portland cement with less than
0.6 percent total alkali, adding reactive materials
such as diatomite or fly ash (Dunn, 1975, p. 100).
The average at-plant price of sand and gravel in
1975 was $1.50/ton (Pajalich, 1976, p. 146). The
average price at major distribution points is ap
proximately double the at-plant price (Dunn, 1975,
p. 101). Sand and gravel sources are characteristi
cally located close to markets to minimize trans-
BIA Administrative Report 28 (1977) 41

_________________________________________________________________________________________________
___________________________________________________________________________
___________________________________________________________________________
___________________________________________________________________________
Status of Mineral Resource Information For The Fort Peck Indian Reservation, Northeastern Montana M. R. Mudge, Michael Sokaski, D. D. Rice, and George McIntyre
portation costs. Prices are increasing because of
rising land values, antipollution and rehabilitation
requirements, local zoning regulations, and, in
some areas, severance taxes. These factors are
tending to increase the distance between sources
and markets. Therefore, resources on the reserva
tion eventually could be utilized in distant markets.
However, annual growth of the sand and gravel
industry is projected to be only 3.9 to 4.7 percent
for the balance of this century (Goldman, 1975, p.
1040). Consequently, large-scale utilization of the
reservation's resources in distant markets is un
likely in the near future.
������
The high silica content of many of the gravel
deposits on the reservation suggests their use as a
siliceous raw material. For example, Colton (1962,
p. 259) reported that the cobbles and pebbles of the
Wiota gravel in the Otter Creek area contain 99.5
percent quartzite, amorphous silica and crypto
crystalline silica. The crushed cobbles and pebbles
as well as natural sand may be suitable as a refrac
tory sand or a filter medium. They may also be
useful as a raw material for flint glass and chemical
manufacture; impurity limits are given in Table 26
(Murphy, 1975, p. 1045). The well-rounded cob
bles and pebbles may be satisfactory as a medium
for grinding ceramic clay in tube mills; a very low
iron content is a necessary requirement.
TABLE 26
Maximum Allowable Impurity Contend in Sillica Sand Used for Flint Glass and Chemical Manufac
ture.
Impurity Maximum content (percent)
Iron
Alumina Calcium and Magnesium Oxides
Alkalies Cobalt Chromium Copper
0.015-0.030 0.05-0.15 for amber glass
0.200.05 for glass
0.15 for chemical use0.01NoneNoneNone
Source: Industrial Minerals and Rocks, 4th ed., p. 1045.
BIA Administrative Report 28 (1977) 42
_________________________________________________________________________________________________
Status of Mineral Resource Information For The Fort Peck Indian Reservation, Northeastern Montana M. R. Mudge, Michael Sokaski, D. D. Rice, and George McIntyre
�������
Clinker, as used here, is baked and fused roof
of a burned coal bed and some of it is vitrified and
in part bricklike; commonly it is red. The thick
ness of rock affected by burning partly depends on
the thickness of lignite consumed, and the propor
tion of easily altered shale above the lignite bed.
Thick clinker beds commonly reflect thick lignite
beds. Clinker is used mostly as road metal and
railroad ballast and locally as roofing granules and
walkways. In the reservation clinker is present in
secs. 21 and 22, T. 28 N., R. 53 E., in the upper,
reaches of Smoke Creek, locally on the west and
east sides of Wolf Creek, and along Otter Creek
(Smith, 1910). The fact that clinker beds are
extensive else where in eastern Montana and
Wyoming plus the lack of local markets restricts
their economic development.
������
Glacial boulders constitute the only material in
the area suitable for riprap. In extensive cultivated
areas, boulders have been piled near, section
corners (Witkind, 1959, p. 75; Colton, 1962, p.
282). Piles of boulders are present in many places
northwest of Poplar, north of Oswego, and north
west of Brockton (Colton, 1964). The boulder
piles in the northeastern part of the reservation
range from 2 to 40 cubic yards, they consist of
limestone, dolomite and a variety of igneous and
metamorphic rocks (Colton, 1962). The boulders
are as much as 10 feet across; they average about
2 feet (Witkind, 1959, p. 57).
����������
Leonardite, a naturally occurring oxidation
product of lignite, may occur on the reservation. It
is soft and earthy with a lower heat content than
lignite.
Leonardite is added to drilling mud to stabilize
the suspensions and to regulate consistency for
pumping and removing the cuttings. Also, it is
added directly to soils as a conditioner. Humic
acids can be chemically extracted from leonardite
as well as lignite and added to soil to improve its
texture and tilth. They also help mobilize and
release nutrients otherwise unavailable to plants
(Abbott, 1963, p. 86). Experiments at the Grand
Forks Coal Research Laboratory, U.S. Bureau of
Mines, showed that humic acids were beneficial to
plant growth (Cooley and others, 1970, p. 164).
��������
Montan wax is a natural mineral wax which
can be extracted from some lignites. The processed
wax varies from white to nearly dark brown in
color and has a melting point of 170 to 200ºF. Its
uses are in electrical insulation materials, paints,
wood fillers, shoe polishes, floor waxes, rubber
mixtures, high-grade candles, impregnations and
waterproofings, leather dressings, inks, carbon
papers, protective coatings, greases, phonograph
records, and (investment) castings (California
Division of Mines and Geology, 1976, p. 202;
Bostwick, 1975, p. 471). Some lignites may
contain as much as 20 percent wax (Ladoo, 1920,
p. 6). A minimum wax content of 10 percent has
been reported necessary for a lignite to be an
BIA Administrative Report 28 (1977) 43

_________________________________________________________________________________________________
Status of Mineral Resource Information For The Fort Peck Indian Reservation, Northeastern Montana M. R. Mudge, Michael Sokaski, D. D. Rice, and George McIntyre
economical source (California Division of Mines
and Geology, 1976, p. 202).
Before World War II, montan wax was im
ported into the United States from Germany and
Czechoslovakia. Since 1948, a plant at Ione,
California, which extracts it from local lignite, has
supplied all national needs.
SOCIAL EFFECTS FROM RESOURCE DEVELOPMENT
Development of the reservation's lignite re
sources by surface mining would provide jobs and
incomes for local residents. A mine with an annual
production of 9.2 million tons would require 213
employees (Katell and others, 1976a, p. 28).
Mining and shipment of the lignite to distant
markets probably would not seriously disrupt the
lifestyles of the residents. The social effects due to
development of the other mineral resources would
be similar.
The development of an energy park or large
coal-oil-gas (COG) complex on or near the reser
vation could have far-reaching social impacts. The
construction of a COG complex has been proposed
immediately west of the reservation near Glasgow,
Montana (Corsentino, 1976, p. 94). About 5 to 20
percent of the capital invested in an energy devel
opment is required for local services (Gilmore,
1976, p. 538). Zoning and land use planning is
necessary to shape community development.
Residents must be trained for the new jobs. New
housing, schools, sanitation services, roads, shop
ping facilities, etc. must be provided.
RECOMMENDATIONS FOR FURTHER WORK
1. Large areas of the Fort Peck Indian Reserva
tion remain untested by drilling and several oil
fields with reserves of one to three million barrels
of oil may be undiscovered at this time. In addi
tion, shallow gas accumulations in the Poplar field
area may be larger than indicated with potential
commercial production in the future.
Future exploration should be directed toward
two types of studies. First, thermal maturation and
source rock studies should be utilized to learn at
what specific subsurface intervals liquid hydrocar
bons were generated and to identify organic-rich
source beds within these horizons. In addition,
discovered oils should be separated into genetic
types and related to specific source sequences.
Then, vertical and horizontal migration pathways
can be mapped and related to reservoirs and traps.
Second, detailed stratigraphy of all systems
with emphasis on reservoirs in mature horizons
should be done to locate potential stratigraphic
traps such as subtle facies changes or porosity and
permeability changes. Attention should be paid to
how these changes may be related to paleo
movement along basement lineaments. This study
should include the examination of all available
well logs, core, and dig cuttings. Sophisticated
seismic data can also greatly aid in these studies.
A program of geologic mapping and drilling is
recommended for the area containing the Fort
Union Formation (Figure 4) as a means of estab
lishing the continuity and correlation of lignite
beds in the reservation, of determining lignite
quality, and of refining resource evaluations ac
cording to depth, bed thickness, location, and
BIA Administrative Report 28 (1977) 44

_________________________________________________________________________________________________
Status of Mineral Resource Information For The Fort Peck Indian Reservation, Northeastern Montana M. R. Mudge, Michael Sokaski, D. D. Rice, and George McIntyre
lignite constituents including ash and sulfur.
Surface mapping is recommended at a scale of
1:24,000, where information on the lignite beds
from any source is lacking. Drilling to depths of
200-500 or more feet should accompany mapping
to aid in correlation of individual lignite beds and
to give information on bed thickness and overbur
den characteristics. Laboratory analyses will be
required to determine lignite quality. The data
should identify potential sites for mining.
The data obtained in the lignite study will
provide critical information for developing other
resources. Systematic mapping and drill hole data
should provide information on deposits of sand,
gravel, and clay, water-bearing horizons, and
should provide pertinent data on structure features
that might have a bearing on the accumulation of
oil and gas.
2. Surface mining is the most practical method
for large-scale development of the reservation's
lignite resources. The surface mining potential of
some specific areas has been determined, but
should be evaluated for the remaining geologically
favorable areas. Topographic mapping on a scale
of 1:24,000 would be helpful.
3. Present or possible future uses will dictate
the requirements for rehabilitating surface mined
land. Baseline studies are needed to establish these
requirements. Farm and range potential should be
determined. The plant-animal ecosystem of all
prospective mine areas should be studied.
4. Surface mining with its disturbances of
shallow aquifers may cause local disruptions in
water supplies. The impact of these disruptions
and their areal extent should be determined prior to
mining.
5. An exploration program to establish the
reservation's bentonite resources is needed. Repre
sentative samples should be collected and tested to
determine their quality.
The clay and shale resources on the reservation
should be evaluated to determine their extent and
suitability for commercial uses such as in structural
ceramic products and expanded aggregate.
BIA Administrative Report 28 (1977) 45

_________________________________________________________________________________________________
Status of Mineral Resource Information For The Fort Peck Indian Reservation, Northeastern Montana M. R. Mudge, Michael Sokaski, D. D. Rice, and George McIntyre
REFERENCES
Abbott, G. A., 1963, Leonardite: A material of
industrial value, in Elder, J. L., and Kube, W.
R., eds., Technology and use of lignite: U.S.
Bur. Mines Inf. Circ. 8164, 113 p.
Alden, W. C., 1932, Physiography and glacial
geology of eastern Montana and adjacent areas:
U.S. Geol. Survey Prof. Paper 174, 133 p.
Auer, D. L., 1976, Bentonite: Min. Engr., v. 28,
No. 3, p. 29-30.
Ayler, M. F.,Smith, J. B., and Deutman, G. M.,
1969, Strippable coal reserves of Montana:
U.S. Bur. Mines Prel. Rept. 172, 68 p.
Badgley, E. K., Jr., 1953, Correlation of late Creta-
ceous-early Tertiary sediments in eastern
Montana: Unpubl. M.A. Thesis Univ. Wyo.,
105 p.
Baker, D. R., 1972, Organic geochemistry and
geological interpretations: Jour. Geol. Educa
tion, v. 20, no. 5, p. 221-234.
Ballard, W. W., 1969, Red River of northeast
Montana and northwest North Dakota, in
Montana Geol. Soc. 20th Ann. Conf. Guide
book, Eastern Montana Symposium, 1969: p.
85-94.
Bartram, J. G., and Erdman, C. E., 1935, Natural
gas in Montana, in Lay, G. E., ed., Geology of
Natural Gas: Am. Assoc. Petroleum Geolo
gists, p. 245-276.
Bateman, A. F., 1968, Salt, in Mineral and water
resources of Montana: U.S. Senate Document
no. 98, 90th Congress, 2d Session, p. 94-96.
Bauer, C. M., 1914a, Clay in northeastern
Montana: U.S. Geol. Survey Bull. 540, p.
369-372.
_____,1914b, Lignite in the vicinity of Plentywood
and Scobey, Sheridan County, Montana: U.S.
Geol. Survey Bull. 541, p. 301 [1912].
Beekley, A. L., 1912, The Culbertson Lignite field,
Valley County, [Sheridan and Roosevelt Coun
ties] Montana: U.S. Geol. Survey Bull. 471, p.
319-358.
Beekley, E. K., 1957, Poplar Type Field, Montana:
First Williston Basin Symposium: North Da
kota Geol. Soc. and Saskatchewan Geol. Soc.,
p. 61-65.
Bell, R. E., 1965, Geology and stratigraphy of the
Fort Peck fossil field, northwest McCone
County, Montana: unpub. M.S. thesis, Univ. of
Minnesota, 166 p.
Bentley, C. B., and Mowat, G. D., 1967, Reported
occurrences of selected minerals in Montana:
U.S. Geol. Survey Mineral Inv. Resource map
MR-50.
Berg, R. B., 1969, Bentonite in Montana: Mont.
Bur. of Mines and Geol. Bull. 74, 34 p.
Bigsby, Phillip, and Sollid, Sherman, 1975, Min
eral patent applications of American Colloid
Company for 38 placer claims located for
bentonite: U.S. Bur. Land Management Min
eral report, Montana (unpublished), 106 p.
Billings Geological Society, 1958, Montana oil and
gas fields symposium: rev. 1961; 2nd Supp.
1969, 247 p.
Binyon, E. O., 1951, North Dakota sodium sulfate
deposits: U.S. Bur. Mines Prelim. Rept. 53.
_____,1952, North Dakota sodium sulfate depos
its: U.S. Bur. Mines Rept. Inv. 4880, 41 p.
Blair, J. E., 1962, Geology of the Tule Creek area,
in Billings Geol. Soc. 13th Ann. Field Conf.
Guidebook, 1962, p. 94-99.
BIA Administrative Report 28 (1977) 46

_________________________________________________________________________________________________
Status of Mineral Resource Information For The Fort Peck Indian Reservation, Northeastern Montana M. R. Mudge, Michael Sokaski, D. D. Rice, and George McIntyre
Bonneville Power Administration, 1973, The
electric energy picture in the Pacific northwest:
Portland, Ore., 24 p.
Bostwick, J. M., 1975, Bituminous materials, in
Lefond, S. J., ed., Industrial minerals and
rocks: AIME, New York, p. 463-471.
Bowen, C. F., 1915, The stratigraphy of the
Montana group, with special reference to the
position and age of the Judith River formation
in north-central Montana: U.S. Geol. Survey
Prof. Paper 90, p. 95-153.
Brown, Barnum, 1907, The Hell Creek beds of
upper Cretaceous of Montana: Am. Mus. Natl.
History Bull. 23, p. 823-845.
_____,1914, Cretaceous-Eocene correlation in
New Mexico, Wyoming, Montana, Alberta:
Geol. Soc. America Bull., v. 25, p. 355-380.
Brown, R. W., 1952, Tertiary strata in eastern
Montana and western North and South Dakota,
in Sonnenberg, F. P., ed.: Billings Geol. Soc.
Guidebook, 34th Ann. Field Conf., p. 89-92.
Burlington Northern, Inc., 1975, The Fort Kipp
lignite deposit, northeastern Montana, in
Hadley, H. D., ed., Energy resources of
Montana: Mont. Geol. Soc., 22nd annual
publication, p. 177-201.
Bush, A. L., 1973, Lightweight aggregates, p.
333-355, in United States Mineral Resources,
D. A. Brobs-t and W. P. Pratt, eds.: U.S. Geol.
Survey Prof. Paper 820, 722 p.
California Division of Mines and Geology, 1976,
History of coal in California: California Geol
ogy, v. 29, No. 9, p. 202-203.
Calvert, W. R., 1912, Geology of certain lignite
fields in eastern Montana: U.S. Geol. Survey
Bull. 471, p. 187-201.
Campbell, T. C., and Katell, S., 1975,
Long-distance coal transport: unit trains or
slurry pipelines: U.S. Bur. Mines Inf. Circ
8690, 31 p.
Clapp, C. H., Bevan, Arthur, and Lambert, G. S.,
1921, Geology and oil and gas prospects of
central and eastern Montana: Mont. Bur. of
Mines and Geol. Bull. 4, 95 p.
Collier, A. J., 1917, The Bowdoin dome, Montana,
a possible reservoir of oil and gas: U.S. Geol.
Survey Bull. 661, p. 193-209.
_____,1918, Geology of northeastern Montana:
U.S. Geol. Survey Prof. Paper 120B, p. 17-39.
_____,1924, The Scobey Lignite field, Valley,
Daniels, and Sheridan Counties, Montana: U.S.
Geol. Survey Bull. 751-E, p. 157-230. Collier,
A. J., and Knechtel, M. M., 1939, The coal
resources of McCone County, Montana: U.S.
Geol. Survey Bu11.'905, 80 p.
Collier, A. J., and Thom, W. T., Jr., 1918, The
Flaxville gravel and its relation to other terrace
gravels of the northern Great Plains: U.S. Geol.
Survey Prof. Paper 108-J, p. 179-184.
Colton, R. B., 1955, Geologic map of the Wolf
Point quadrangle, Montana: U.S. Geol. Survey
Geol. Quad. Map GQ-67.
_____,1962, Geology of the Otter Creek quadran
gle, Montana: U.S. Geol. Survey Bull. llll-G, p.
237-288.
_____,1963a, Geologic map of the Brockton
quadrangle, Roosevelt and Richland Counties,
Montana: U.S. Geol. Survey Misc. Geol. Inv.
Map I-362. Colton, R. B., 1963b, Geologic
map of the Chelsea quadrangle, Roosevelt and
McCone Counties, Montana: U.S. Geol. Sur
vey Misc. Geol. Inv. Map I-363.
BIA Administrative Report 28 (1977) 47

_________________________________________________________________________________________________
Status of Mineral Resource Information For The Fort Peck Indian Reservation, Northeastern Montana M. R. Mudge, Michael Sokaski, D. D. Rice, and George McIntyre
_____,1963c, Geologic map of the Cuskers quad
rangle, Roosevelt County, Montana: U.S. Geol.
Survey Misc. Geol. Inv. Map I-364.
_____,1963d, Geologic map of the Hay Creek
quadrangle, Roosevelt County, Montana: U.S.
Geol. Survey Misc. Geol. Inv. Map I-365.
_____,1963e, Geologic map of the Oswego quad
rangle, Valley, Roosevelt, and McCone Coun
ties, Montana: U.S. Geol. Survey Misc. Geol.
Inv. Map I-366.
_____,1963f, Geologic map of the Poplar quadran
gle, Roosevelt, Richland, and McCone Coun
ties, Montana: U.S. Geol. Survey Misc. Geol.
Inv. Map I-367.
_____,1963g, Geologic map of the Porcupine
Valley quadrangle, Valley County, Montana:
U.S. Geol. Survey Misc. Geol. Inv. Map I-368.
_____,1963h, Geologic map of the Spring Creek
quadrangle, Valley County, Montana: U.S.
Geol. Survey Misc. Geol. Inv. Map I-369.
_____,1963i, Geologic map of the Todd Lakes
quadrangle, Valley and Roosevelt Counties,
Montana: U.S. Geol. Survey Misc. Geol. Inv.
Map I-370.
_____,1963j, Geologic map of the Tule Valley
quadrangle, Montana: U.S. Geol. Survey Misc.
Geol. Inv. Map I-371.
_____,1964a, Geologic map of the south half of
the Baylor, Larslan West Fork, Police Creek,
Kahle, and Lundville quadrangles, Valley,
Roosevelt, and Daniels Counties, Montana:
U.S. Geol. Survey Misc. Geol. Inv. Map I-361.
_____,1964b, Aggregate and riprap resource map
of the Wolf Point area, Montana: U.S. Geol.
Survey Misc. Geol. Inv. Map I-429.
______,Colton, R. B., and Bateman, A. F., Jr.,
1956, Geologic and structure contour map of
the Fort Peck Indian Reservation and vicinity,
Montana: U.S. Geol. Survey Misc. Geol. Inv.
Map I-225.
_____,Colton, R. B., Lemke, R. W., and Lindvall,
R. M., 1961, Glacial map of Montana east of
the Rocky Mountains: U.S. Geol. Survey Misc.
Geol. Inv. Map I-327.
Combo, J. X., Brown, D. M., Pulver, H. F., and
Taylor, D. A., 1949, Coal resources of
Montana; U.S. Geol. Survey Circ. 53, 28 p.
Combo, J. X., Holmes, C. N., and Christner, H. R.,
1950, Coal resources map of Montana: U.S.
Geol. Survey Coal Inv. Map C-2.
Cooley, S. A., and Ellman, R. D., 1975, Analyses
of coal and ash from lignites and
subbituminous coals of eastern Montana, in
Hadley, H. D., ed., Energy resources of
Montana: Mont. Geol. Soc., 22nd annual
publication, p. 143-158.
Cooley, A. M., Doulgas, G., Rasmussen, W. H.,
Rasmussen, J. J., and Theis, J., 1970,
Leonardite in Fertilizer, in Elder, J. L. and
Kube, W. R., ed., Technology and use of
Lignite: U.S. Bur. Mines Inf. Circ. 8471, p.
158-169.
Corsentino, J. S., 1976, Projects to expand fuel
sources in western states: U.S. Bur. Mines Inf.
Circ. 8719, 208 p.
Darrow, G., and Cardinal, F. L., 1962, Devonian
production in northeast Montana, in Billings
Geol. Soc. 13th Ann. Field Conf. Guidebook,
1962, p. 107-114.
Davis, J. G., and Shock, D'Arcy A., 1970, Solution
mining of thin-bedded potash: Trans. AIME, v.
247, p. 93-96.
BIA Administrative Report 28 (1977) 48
_________________________________________________________________________________________________
Status of Mineral Resource Information For The Fort Peck Indian Reservation, Northeastern Montana M. R. Mudge, Michael Sokaski, D. D. Rice, and George McIntyre
Davison, R. L., Natusch, D. F. S., Wallace, J. R.,
and Evans, C. A., Jr., 1974, Trace elements in
fly ash, dependence of concentration on parti
cle size: Environmental Science and Technol
ogy, v. 8, No. 13, p. 1107-1113.
Department of Natural Resources and Conserva
tion of the State of Montana, Oil and Gas
Conservation Division, 1953 to 1975 inc.,
Annual Reviews.
Dobbin, C. E., and Erdmann, C. E., 1934, Geo
logic occurrence of oil and gas in Montana, in
Problems of petroleum geology (Sidney Pow
ers Memorial volume): Am. Assoc. Petroleum
Geologists, p. 695-718.
_____,1955, Structure contour map of the Montana
Plains: U.S. Geol. Survey Oil and Gas Inv.
Map OM-178-A, revised.
Dobbin, C. E., and Reeside, J. B., Jr., 1929, The
contact of the Fox Hills
and Lance Formations: U.S. Geol. Survey Prof.
Paper 158-B, p. 9-25.
Dow, W. G., 1974, Application of oil-correlation
and source-rock data to exploration in
Williston Basin: Am. Assoc. Petroleum Geolo
gists Bull., v. 58, no. 7, p. 1253-1262.
Dunn, J. R., 1975, Construction materials, aggre-
gates-sand and gravel, in Lefond, S. J., ed.,
Industrial minerals and rocks: AIME, New
York, p. 97-108.
Dupree, W. G., Jr., and Corsentino, J. S., 1975,
United States energy through the year 2000
(rev.): U.S. Bur. Mines, 65 p.
Duzy, A. F., 1968, Characteristics of high-moisture
fuels in cyclone furnace applications, in Kube,
W. R., and Elder, J. F., ed., Technology and
use of lignite: U.S. Bur. Mines Inf. Circ. 8376,
p. 57-76.
Edmisten, N., and Foster, N. H., 1969, Weldon
field, McCone County, Montana, in Montana
Geol. Soc. 20th Ann. Conf. Guidebook, East
ern Montana Symposium, p. 137-142.
Elliott, M. A., 1975, Coal gasification - when, if
ever?, in Kube, W. R., and Gronhovd, G. H.,
ed., Technology and use of lignite proceedings
of a symposium sponsored by the U.S. Energy
Research and Development Administration and
the University of North Dakota, Grand Forks,
North Dakota, May 14-15, 1975, p. 276-285.
Ellman, R. C., 1963, Lignite preparation, in Elder,
J. L., and Kube, W. R., eds., Technology and
use of lignite: U.S. Bur. Mines Inf. Circ. 8164,
p. 35-44.
Ellman, R. C., Belter, J. W., and Dockter, L., 1968,
Lignite pulverization, a status report, in Kube,
W. R., ed., Technology and use of lignite: U.S.
Bur. Mines Inf. Circ. 8376, p. 29-39.
Ellman, R. C., Paulson, L. E., and Cooley, S. A.,
1975, Commercial-scale drying of low rank
western coals part 1, rail shipment test observa
tions, in Kube, W. R., and Gronhovd, G. H.,
ed., Technology and use of lignite proceedings
of a symposium sponsored by the U.S. Energy
Research and Development Administration and
the University of North Dakota, Grand Forks,
North Dakota, May 14-15, 1975, p. 312-340.
Fish, A. R., and Kinard, J.C., 1959 , Madison
Group stratigraphy and nomenclature in the
northern Williston Basin: Billings Geol. Soc.
10th Ann. Field Conf., p. 50.
BIA Administrative Report 28 (1977) 49

_________________________________________________________________________________________________
Status of Mineral Resource Information For The Fort Peck Indian Reservation, Northeastern Montana M. R. Mudge, Michael Sokaski, D. D. Rice, and George McIntyre
Friedman, S., Akhtar, S., and Vavorsky, P. M.,
1975 , Overview of coal liquefaction projects,
in Kube, W. R., and Gronhovd, G. H., ed.,
Technology and use of lignite proceedings of a
symposium sponsored by the U.S. Energy
Research and Development Administration and
the University of North Dakota, Grand Forks,
North Dakota, May 14-15, 1975, p. 202-221.
Fuller, J. G. C. M., 1961, Ordovician and contigu
ous formations in North Dakota, South Dakota,
Montana, and adjoining areas of Canada and
United States: Am. Assoc. Petroleum Geolo
gists Bull., v. 45, no. 8, p. 1334-1363.
Gilmore, J. S., 1976, Boomtowns may hinder
energy resource development: Science, v. 191,
No. 4227, p. 535-540.
Glass, G. B., 1974, Recent surface mining devel
opment in the western states: Min. Cong. J., v.
60, No. 9, p. 18-21.
Glover, T. O., Hinkle, M. E., and Riley, H. L.,
1970, Unit train transportation of coal: U.S.
Bur. Mines Inf. Circ. 8444, 109 p.
Goldman, H. B., 1975, Sand and gravel, in Lefond,
S. J., ed., Industrial minerals and rocks: AIME,
New York, p. 1027-1042.
Gott, G. B., Osterstock, R. W., and Witkind, I. J.,
1948, Geologic map of the Blair NE quadran
gle, Roosevelt County, Montana: U.S. Geol.
Survey Open-file map, 1:24,000.
Gott, G. B.,Prouty, C. E., Kaye, C. A., Smith, J.
H., Dodson, R. H. T., and Witkind, I. J., 1948,
Geology of the Homestead quadrangle, Roose
velt and Sheridan Counties, Montana: U.S.
Geol. Survey Open-file map, 1:24,000.
Gott, G. B., Smith, J. D., Dodson, R. H. T., and
Witkind, I. J., 1948, Geologic map of the Blair
NW quadrangle, Roosevelt County, Montana:
U.S. Geol. Survey Open-file map, 1:24,000.
Gott, G. B., and Witkind, I. J., 1947, Geology of
the Smoke Creek quadrangle, Roosevelt
County, Montana: U.S. Geol. Survey Open-file
map, 1:24,000.
Great Northern Railway Co. (now Burlington
Northern, Inc.), 1953-1955, Lignite drilling
program Williston basin, North Dakota and
Montana, Rept. No. 1: St. Paul, Minn., 26 p.
_____,1959, Salt in Williston basin (revised),
North Dakota and Montana, Rept. No. 7: St.
Paul, Minn., 6 p.
_____,1965, Potash occurrences in the Williston
basin (revised), Rept. No. 23: St. Paul, Minn.,
28 p.
_____,1966, The Fort Kipp lignite deposit, north
eastern Montana, Rept. No. 26: St. Paul, Minn.,
65 p.
Gronhovd, G. H., Tufte, P. H., and Selle, S. J.,
1974, Some studies on stack emissions from
lignite-fired powerplants, in Gronhovd, G. H.,
and Kube, W. R., ed., Technology and use of
lignite: U.S. Bur. Mines Inf. Circ. 8650, p.
83-102.
Grossman, I. G., 1949, The sodium sulfate deposits
of Western North Dakota: N. Dak. Geol. Sur
vey Rept. of Inv. 1, 66 p.
Hadley, H. D., Lewis, P. J., and Larsen, R. B.,
1952, Catalog of formation names for
Williston basin and adjacent areas, in
Sonnenberg, F. P., ed., Billings Geol. Soc.
Guidebook: 3d Ann. Field Conf., Sept. 1952, p.
132-143.
BIA Administrative Report 28 (1977) 50
_________________________________________________________________________________________________
Status of Mineral Resource Information For The Fort Peck Indian Reservation, Northeastern Montana M. R. Mudge, Michael Sokaski, D. D. Rice, and George McIntyre
Hammond, A. L., 1976, Coal research (11): gasifi
cation faces an uncertain future: Science, v.
193, No. 4255, p. 750-753.
Hansen, A. R., 1966, Reef trends of Mississippian
Ratcliff zone, northeast Montana and northwest
North Dakota: ' Am. Assoc. Petroleum Geolo
gists Bull., v. 50, no. 10, p. 2260-2268.
Henkes, W. C., and Magill, E. A., 1970, Mineral
resources and their potential on Indian lands,
Fort Peck Reservation, Daniels, Roosevelt,
Sheridan, and Valley Counties, Montana: U.S.
Bur. Mines Prel. Rept. 179, 41 p.
Hood, A., Gutjahr, C. C. M., and Heacock, R. L.,
1975, Organic metamorphism and the genera
tion of petroleum: Am. Assoc. Petroleum
Geologists Bull., v. 59, no. 6, p. 986-996.
Howard, A. D., 1958, Drainage evolution in north
eastern Montana and northwestern North
Dakota: Geol. Soc. Am. Bull., v. 69, p.
575-588.
Howard, A. D., 1960, Cenozoic history of north
eastern Montana and northwestern North
Dakota: U.S. Geol. Survey Prof. Paper 326,
107 p.
_____,1961, Cenozoic history of northeastern
Montana and northwestern North Dakota with
emphasis on the Pleistocene: U.S. Geol. Survey
Prof. Paper 326, 107 p.
Hunter, D. W., 1976, Trends in coal mining sys-
tems-conventional, continuous, longwall and
shortwall: Min. Cong. J., v. 62, No. 7, p. 56-60.
Husband, W. H. W., 1971, Application of solution
mining to the recovery of potash: Trans. AIME,
v. 250, p. 141-148.
Jensen, F. S., 1952a, Structural contour map of
part of the Williston basin in the Fort Peck
area, Montana: U.S. Geol. Survey open-file
report.
_____,1952b, Preliminary report on the geology of
the Nashua quadrangle: U.S. Geol. Survey
open-file report.
_____,1953, Preliminary geologic map of the
Glasgow quadrangle, Montana: U.S. Geol.
Survey open-file report.
Jensen, F. S., and Varnes, H. D., 1964, Geology of
the Fort Peck area, Garfield, McCone and
Valley Counties, Montana: U.S. Geol. Survey
Prof. Paper 414-F, 48 p.
Johnson, W. D., Jr., and Smith, H. R., 1964, Geol
ogy of the Winnett-Mosby area, Petroleum,
Garfield, Rosebud, and Fergus Counties,
Montana: U.S. Geol. Survey Bull. 1149, 91 p.
Kaplan, R. S., and Kirby, R. C., 1975, Metallurgi
cal applications of lignite and low rank coals,
in Kube, W. R., and Gronhovd, G. H., ed.,
Technology and use of lignite proceedings of a
symposium sponsored by the U.S. Energy
Research and Development Administration and
the University of North Dakota, Grand Forks,
North Dakota, May 14-15, 1975, p. 345-371.
Katell, S., Hemingway, E. L., and Berkshire, L. H.,
1976a, Basic estimated capital investment and
operating costs for coal strip mines: U.S. Bur.
Mines Inf. Circ. 8703, 33 p.
_____,1976b, Basic estimated capital investment
and operating costs for underground bitumi
nous coal mines: Bur. Mines Inf. Circ. 8682A,
41 p.
BIA Administrative Report 28 (1977) 51

_________________________________________________________________________________________________
Status of Mineral Resource Information For The Fort Peck Indian Reservation, Northeastern Montana M. R. Mudge, Michael Sokaski, D. D. Rice, and George McIntyre
Kinard, J. C., and Cronoble, W. R., 1969, The
Winnipegosis Formation in northeast Montana,
in Montana Geol. Soc. 20th Ann. Conf. Guide
book, Eastern Montana, Symposium, 1969: p.
33-44.
Klingman, C. L., 1976, Sodium sulfate, in Com
modity Data Summaries, 1976: U.S. Dept.
Interior (Bureau of Mines), p. 158-159.
Knechtel, M. H., 1959, Stratigraphy of the Little
Rocky Mountains and encircling foothills,
Montana: U.S. Geol. Survey Bull. 1072-N, p.
723-752.
Knechtel, M. M., and Weis, P. L., 1965, Nonfuel
mineral resources of eastern Montana except
uranium; Senate Document no. 12, 89th Cong.,
1st Sess., Mineral Potential of Eastern
Montana--a basis for future growth: p. 57-66.
Koelling, G. W., 1976, Natural gas, in Commodity
Data Summaries, 1976: U.S. Dept. Interior
(Bureau of Mines), p. 108-109.
Ladoo, R. B., 1920, The natural hydrocarbons;
gilsonite, elaterite, wurtzilite, grahamite,
ozokerite and others: U.S. Bur. Mines Rpt. Inv.
2121, 12 p.
Landers, W. S., 1965, Utilization of North Dakota
Lignite, in Elder, J. L., and Kube, W. R., ed.,
Technology and use of lignite proceedings:
U.S. Bur. Mines Inf. Circ. 8304, p. 50-57.
Lawson, D. C., 1976, Directory of mining enter
prises for 1975: Mont. Bur. Mines and Geol.
Bull. 100, 60 p.
Leonard, J. W., and McCurdy, W. A., 1968, Com
bustion for direct materials processing, in
Leonard, J. W., and Mitchell, D. R., ed., Coal
preparation: AIME, New York, p. 3-25 through
3-26.
Lewis, P. J., 1959, Mission Canyon bioherms of
northeast Montana, in Billings Geol. Soc. 10th
Ann. Guidebook, p. 59-63.
Lieberman, M. A., 1976, United States uranium
resources-an analysis of historical data: Sci
ence, v. 192, No. 4238, p. 431-436.
Linton, R. W., Loh, A., Natusch, D. F. S., Evans,
C. A., Jr., and Williams, P., 1976, Surface
predominance of trace elements in airborne
particles: Science, v. 191, No. 4229, p.
852-854.
Lochman-Balk, Christina, and Wilson, J. L., 1967,
Stratigraphy of Upper Cambrian-Lower Ordo
vician subsurface sequence in Williston basin:
Am. Assoc. Petroleum Geologists Bull., vol.
51, no. 5, p. 883-917.
Mallory, W. W., ed., 1972, Geologic atlas of the
Rocky Mountain region: Denver, Rocky Moun
tain Assoc. Geologists, 331 p.
Manz, O. E., 1973, Utilization of lignite and
subbituminous ash, in Gronhovd, G. H., and
Kube, W. R., ed., Technology and use of
lignite: U.S. Bur. Mines Inf. Circ. 8650, p.
204-219.
McCarl, H. N., 1975, Construction materials,
aggregates-lightweight aggregates, in Lefond,
W. J., ed., Industrial minerals and rocks:
AIME, New York, p. 85-96.
Meek, F. B., 1876, A report on the invertebrate
Cretaceous and Tertiary fossil of the upper
Missouri Country: U.S. Geol. Survey Territory
(Hayden), v. 9, 629 p.
BIA Administrative Report 28 (1977) 52

_________________________________________________________________________________________________
Status of Mineral Resource Information For The Fort Peck Indian Reservation, Northeastern Montana M. R. Mudge, Michael Sokaski, D. D. Rice, and George McIntyre
Meek, F. B., and Hayden, F. V., 1862, Descrip
tions of new Lower Silurian (Primordial)
Jurassic, Cretaceous, and Tertiary fossils col
lected in Nebraska Territory, with some re
marks on the rocks from which they were
obtained: Acad. Nat. Sci., Philadelphia Proc.,
v. 13, p. 419-427.
Mermer, N. F., 1975, Coal gasification now, in
Kube, W. R., and Gronhovd, G. H., eds., Tech
nology and use of lignite proceedings of a
symposium sponsored by the U.S. Energy
Research and Development Administration and
the University of North Dakota, Grand Forks,
North Dakota, May 14-15, 1975, p. 222-229.
Momper, J. A., 1972, Evaluating source beds for
petroleum (abs.): Am. Assoc. Petroleum Geol
ogists Bull., v. 56, no. 3, p. 640.
Murphy, T. D., 1975, Silica and silicon, in Lefond,
S. J., ed., Industrial Minerals and Rocks:
AIME, New York, p. 1043-1060.
National Academy of Sciences, 1974, Rehabilita
tion potential of western coal lands: Ballinger,
Cambridge, Mass., 198 p.
Nordquist, J. W., 1953, Mississippian stratigraphy
of northern Montana: Billings Geol. Soc. 4th
Ann. Field Conf. Guidebook, 1953: p. 68-82.
Nordquist, J. W., 1955, Pre-Rierdon Jurassic
stratigraphy in northern Montana and Williston
basin, in Billings Geol. Soc. 6th Ann. Field
Conf. Guidebook, Sweetgrass Arch-Disturbed
Belt, Montana, 1955: p. 96-106.
Northern Great Plains Resources Program, 1975,
Effects of coal development in the Northern
Great Plains: Denver, Colo., 165 p.
Pajalich, W., 1976, Sand and gravel, in Commod
ity Data Summaries, 1976: U.S. Dept. Interior
(Bur. Mines), p. 146-147.
Patterson, S. H., and Murray, H. H., 1975, Clays,
in Lefond, S. J., ed., Industrial minerals and
rocks: AIME, New York, p. 519-586.
Perry, E. S., 1934, Geology and artesian-water
resource along Missouri and Milk Rivers in
northeastern Montana: Montana Bur. Mines
and Geology Mem. 11, 34 p.
_____,1960, Oil and gas in Montana: Montana
Bur. Mines and Geology B 15, 86 p.
Persse, F. H., Lockard, D. W., and Lindquist, A.
E., 1976, Coal surface mining reclamation
costs in the western United States: to be pub
lished as U.S. Bur. Mines Inf. Circ.
Phillips Petroleum Co., 1974, The casebook:
Bartlesville, Okla., 25 p.
Porter, J. W., and Fuller, J. G. C. M., 1959, Lower
Paleozoic rocks of northern Williston Basin
and adjacent areas: Am. Assoc. Petroleum
Geologists Bull., v. 43, no. 1, p. 124-189.
Powell, J. B., Jr., 1955, Case history of the East
Poplar field, Montana, in Geological Record,
Rocky Mountain Section, Am. Assoc. Petro
leum Geologists, p. 75-87.
Quilici, F. J., 1973, Characteristics and uses of
Montana fly ash: Mont. Bur. Mines and Geol.
Bull. 90, 29 p.
Reeves, Frank, 1927, Geology of the Cat Creek
and Devils Basin oil fields and adjacent areas
in Montana: U.S. Geol. Survey Bull. 786, p.
39-95.
Rice, D. D., 1975, Origin of and conditions for
shallow accumulations of natural gas, in Wyo
ming Geol. Assoc. 27th Ann. Field Conf.
Guidebook, Geology and mineral resources of
the Bighorn Basin, 1975: p. 267-271.
BIA Administrative Report 28 (1977) 53

_________________________________________________________________________________________________
Status of Mineral Resource Information For The Fort Peck Indian Reservation, Northeastern Montana M. R. Mudge, Michael Sokaski, D. D. Rice, and George McIntyre
Rieber, M., Soo, S. L., and Stukel, J., 1975, The
coal future: economic and technological analy
sis of initiatives and innovations to secure fuel
supply independence: National Science Foun
dation, Rept. UIUC-CAC-DN-75-163, 227 p.
Roehl, P. O., 1967, Stony Mountain (Ordovician)
and Interlake (Silurian) facies analgos of Re
cent low-energy marine and subaerial carbon
ates, Bahamas: Am. Assoc. Petroleum Geolo
gists Bull., v. 51, no. 10, p. 1979-2032.
Ross, C. P., Andrews, D. A., and Witkind, I. J.,
1955, Geologic map of Montana; scale
1:500,000: U.S. Geol. Survey.
Ross, R. J., 1957, Ordovician fossils from wells in
the Williston basin, eastern Montana: U.S.
Geol. Survey Bull. 1021-M, p. 1979-2032.
Sahinen, U. M., 1956, Preliminary report on so
dium sulfate in Montana: Montana Bur. Mines
and Geol. Inf. Circ. 11, 9 p.
_____,1957, Expandable Shale in the Great Falls
Area Montana: Montana Bureau of Mines and
Geology, Inf. Circ. No. 18, 14 p.
Sahinen, U. M., Smith, R. I., and Lawson, D. C.,
1960, Progress report on clays of Montana:
Mont. Bur. Mines and Geology Bull. 13, 83 p.
Sampsel, W. H., 1964, Structural evolution of the
Tule Creek area of eastern Montana: Third
International Williston Basin Symposium:
North Dakota Geol. Soc. and Saskatchewan
Geol. Soc., p. 200-203.
Sandberg, C. A., 1961, Distribution and thickness
of Devonian rocks in Williston Basin and in
central Montana and north-central Wyoming:
U.S. Geol. Survey Bull. 1112-D, p. 105-127.
_____,1962, Geology of the Williston Basin, North
Dakota, Montana, and South Dakota, with
reference to subsurface disposal of radioactive
wastes: U.S. Geol. Survey Open-file Report
TEI-809, 148 p.
Sandberg, C. A., and Hammond, C. R., 1958,
Devonian System in Williston Basin and cen
tral Montana: Am. Assoc. Petroleum Geolo
gists Bull., v. 42, no. 10, p. 2293-2234.
Sandberg, C. A., and Mapel, W. J., 1967, Devo
nian of the northern Rocky Mountains and
Plains, in Oswald, D. H., ed., Internat. Sympo
sium on the Devonian System, Calgary,
Alberta, Sept. 1967: Calgary, Alberta Soc.
Petroleum Geologists, v. 1, p. 843-877.
Sandberg, D. T., 1959, Structure contour map on
top of the middle member of the Piper Forma
tion of Middle Jurassic age in the Williston
Basin and adjacent areas in Montana, North
Dakota, and South Dakota: U.S. Geol. Survey
Oil and Gas Inv. Map OM-165.
Schroth, H. A., 1953, Bowdoin dome, Montana:
Billings Geol. Soc. 4th Ann. Field Conf., p.
137-141.
Smith, C. D., 1990, The Fort Peck Indian Reserva
tion lignite field, Montana: U.S. Geol. Survey
Bull. 381, p. 40-59.
Sondreal, E. A., and Tufte, P. H., 1975, Scrubber
developments in the West, in Kube, W. R., and
Gronhovd, G. H., ed., Technology and use of
lignite proceedings of a symposium sponsored
by the U.S. Energy Research and Development
Administration and the University of North
Dakota, Grand Forks, North Dakota, May
14-15, 1975, p. 65-147.
BIA Administrative Report 28 (1977) 54

_________________________________________________________________________________________________
Status of Mineral Resource Information For The Fort Peck Indian Reservation, Northeastern Montana M. R. Mudge, Michael Sokaski, D. D. Rice, and George McIntyre
Sondreal, E. A., Kube, W. R., and Elder, J. L.,
1968, Analysis of the Northern Great Plains
province lignites and their ash: a study of
variability: U.S. Bur. Mines Rept. Inv. 7158,
94 p.
Spicer, T. S., and Leonard, J. W., 1968, Utilization
from the point of view of the preparation
engineer, in Leonard, J. W., and Mitchell, D.
R., ed., Coal preparation: AIME, New York, p.
3-3 through 3-24.
Stanton, T. W., and Hatcher, J. B., 1905, Geology
and paleontology of the Judith River beds: U.S.
Geol. Survey Bull. 257, 128 p.
Swenson, F. A., 1955, Geology and ground-water
resources of the Missouri River Valley in
northeastern Montana: U.S. Geol. Survey
Water-Supply Paper 1263, 128 p.
Swenson, R. E., 1967, Trap mechanics in Nisku
Formation of northeast Montana: Am. Assoc.
Petroleum Geologists Bull., v. 51, no. 10, p.
1948-1958.
Thom, W. T., and Dobbin, C. E., 1924, Stratigra
phy of Cretaceous-Eocene transition beds in
eastern Montana and the Dakotas: Geol. Soc.
Am. Bull., v. 35, no. 3, p. 481-505.
Thomas, G. E., 1974, Lineament-block tectonics:
Williston-Blood Creek basin: Am. Assoc.
Petroleum Geologists Bull., v. 58, no. 7, p.
1305-1322.
Tschudy, R. H., 1970, Palynology of the Creta-
ceous-Tertiary boundary in the Northern Rocky
Mountain and Mississippi Embayment Re
gions, p. 65-111, in Symposium on Palynology
of the Late Cretaceous and early Tertiary, R.
M. Kosanke, and A. T. Cross, eds.: Geol. Soc.
Am. Spec. Paper 127.
U.S. Department of Interior, 1975, Critical water
problems facing the eleven western states:
Washington, U.S. Govt. Printing Office, 457 p.
Van Voast, W. A., and Hedges, R. B., 1975,
Hydrogeologic aspects of existing and pro
posed strip coal mines near Decker, southeast
ern Montana: Mont. Bur. Mines and Geol.
Bull. 97, 31 p.
Wasp, E. J., 1976, Progress with coal slurry pipe
lines: Mine. Cong. J., v. 62, No. 4, p. 27-32.
Weis, P. L., 1968, Sand and gravel, in Mineral and
water resources of Montana: U.S. Senate
Document no. 98, 90th Congress, 2d Session,
p. 96-97.
Weisman, W. I., 1975, Sodium sulfate deposits, in
Lefond, S. J., Industrial minerals and rocks:
AIME, New York, p. 1081-1093.
Westerstrom, L., Coal, bituminous and lignite, in
Commodity Data Summaries, 1976: U.S. Dept.
of Interior (Bur. Mines), p. 40-41.
Williams, J. A., 1974, Characterization of oil types
in Williston Basin: Am. Assoc. Petroleum
Geologists Bull., v. 58, no. 7, p. 1243-1252.
Willis, P. P., 1959, Upper Mississippian-Lower
Pennsylvanian stratigraphy of central Montana
and Williston Basin: Am. Assoc. Petroleum
Geologists Bull., v. 43, no. 8, p. 1940-1966.
Winegartner, E. C., 1976, Coal utilization: Min.
Engr., v. 28, No. 3, p. 57-59.
Winegartner, E. C., and Ubbens, A. A., 1974,
Understanding coal ash quality parameters:
Exxon Res. and Engr. Co., Baytown, Texas, 11
p.
Witkind, I. J., 1952, The localization of sodium
sulfate deposits in northeastern Montana and
northwestern North Dakota: Am. Jour. Sci. v.
250, no. 9, p. 667-676.
BIA Administrative Report 28 (1977) 55
_________________________________________________________________________________________________
Status of Mineral Resource Information For The Fort Peck Indian Reservation, Northeastern Montana M. R. Mudge, Michael Sokaski, D. D. Rice, and George McIntyre
_____,1959, Quaternary geology of the Smoke
Creek-Medicine Lake-Grenora area, Montana
and North Dakota: U.S. Geol. Survey Bull.
1070, 80 p.
Woodson, R. D., 1971, Cooling towers: Sci. Am.,
v. 224, No. S, p. 70-78.
Wolfbauer, C. A., and Rice, D. D., 1976, Mineral
resources of the Charles M. Russell Wildlife
Refuge, Fergus, Garfield, McCone, Petroleum,
Phillips, and Valley Counties, Montana: U.S.
Geol. Survey unpublished report.
Zachar, F. R., and Gilbert, A. G., 1968, The eco
nomics of coal preparation, in Leonard, J. W.,
and Mitchell, D. R., ed., Coal preparation:
AIME, New York, p. 5-3 through 5-45.
BIA Administrative Report 28 (1977) 56


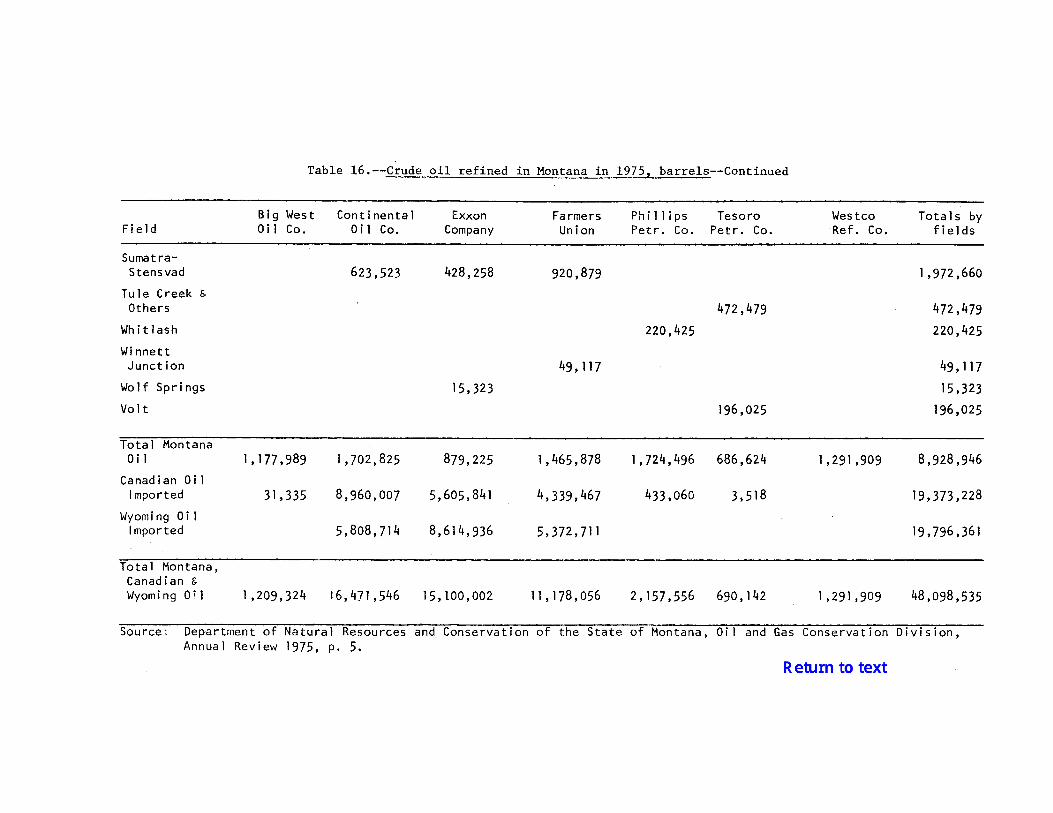
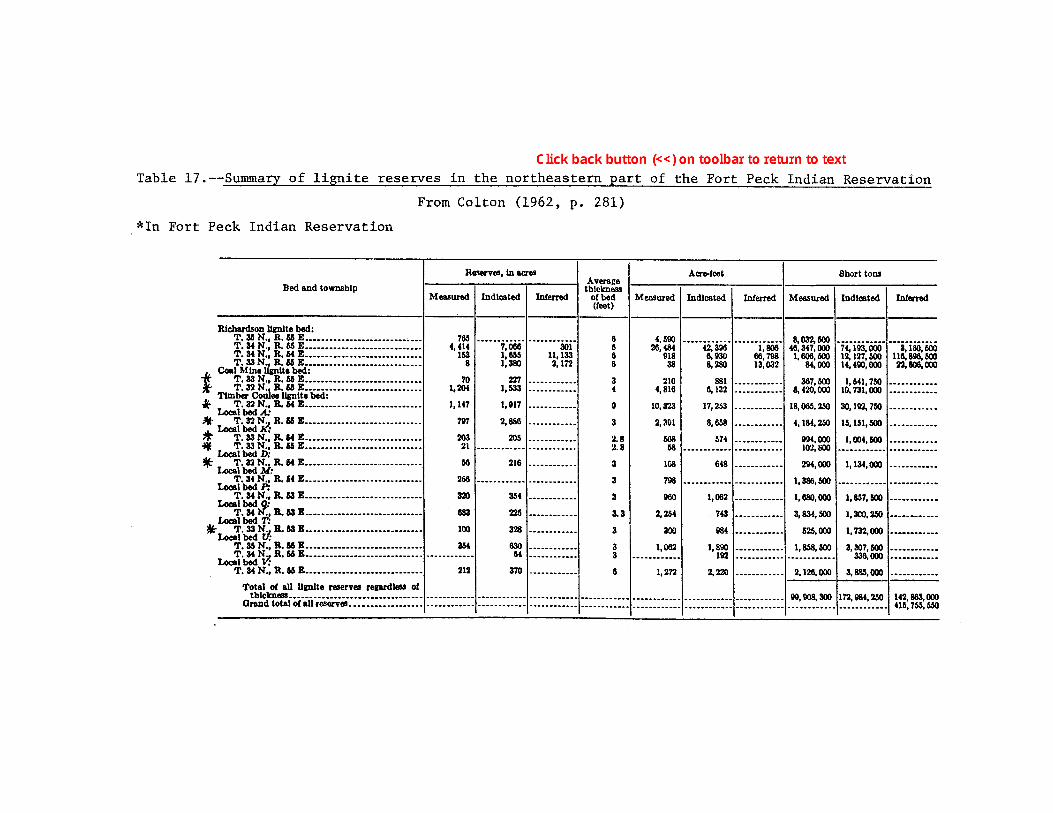

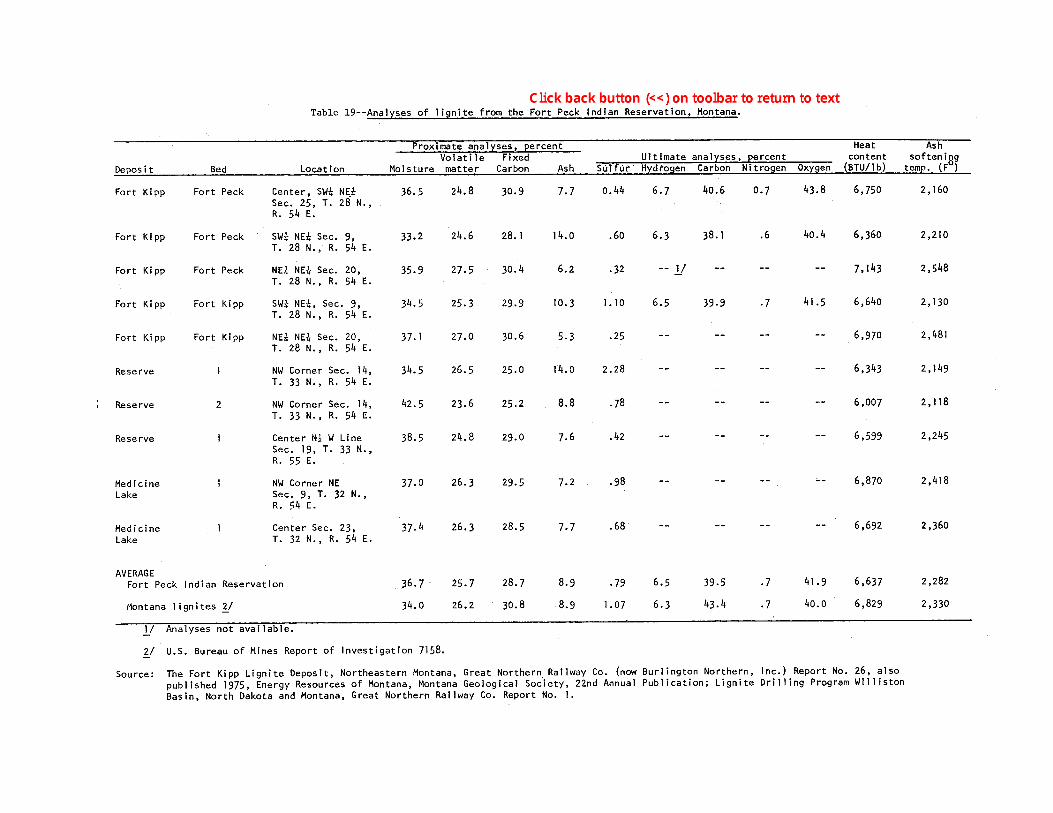


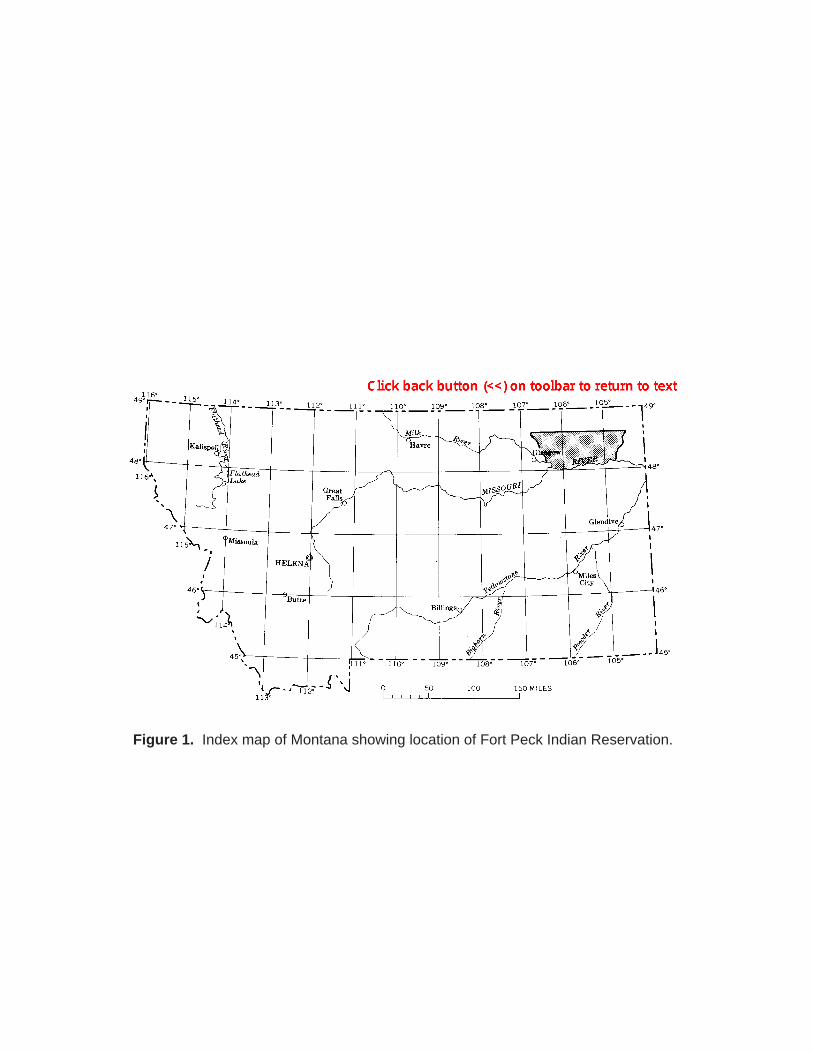
Figure 1. Index map of Montana showing location of Fort Peck Indian Reservation.

Figure 2. Index map of Fort Peck Indian Reservation, Northeastern Montana.

Figure 3. Map showing location of Williston Basin, major structural features, and Fort Peck Indian Reservation. Structure contours drawn at 500 foot intervals on base of Mississippian rocks (after Sandberg, 1962).

Figure 4. Geologic map of the Fort Peck Indian Reservation. Qa, Alluvium; Tf, Flaxville gravel; Tfu, Fort Union Formation; Khc, Hell Creek Formation; Kfh, Fox Hills Sandstone; and Kb, Bearpaw Shale. Area of thick glacial deposits shown by stippled pattern (from Ross, Andrews, and Witking, 1955).

Figure 5. Structure map of the Fort Peck Indian Reservation. Contours drawn on top of the Greenhorn Limestone equivalent. Datum is mean sea level (from Colton and Bateman, 1956).

Figure 6. Map showing oilfields, oil and gas pipelines, Fort Peck Indian Reservation (modified from Oil and Gasfields, Pipelines and Refineries, Montana Board of Oil and Gas Conservation, 1973).
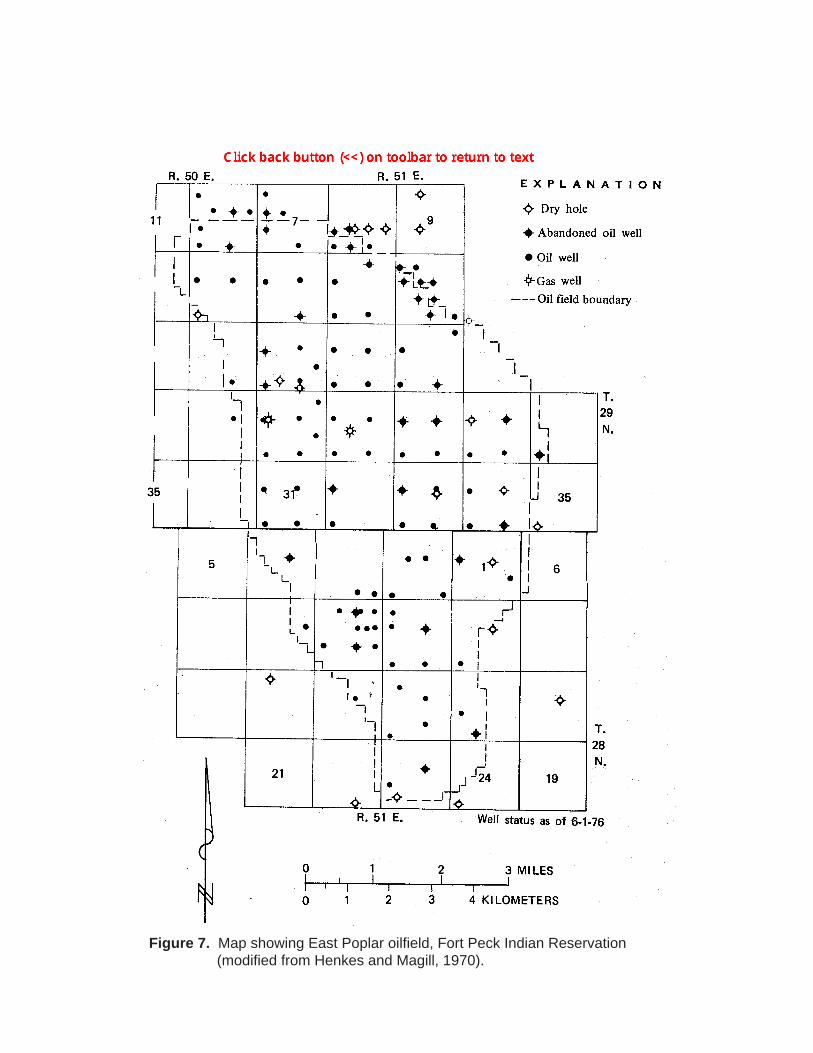
Figure 7. Map showing East Poplar oilfield, Fort Peck Indian Reservation (modified from Henkes and Magill, 1970).

Figure 8. Map showing Northwest Poplar Oilfield, Fort Peck Indian Reservation (modified from Henkes and Magill, 1970).

Figure 9. Map showing Tule Creek, East Tule Creek, South Tule Creek, Red Fox, and Chelsea Creek oilfields, Fort Peck Indian Reservation (modified from Henkes
and Magill, 1970).

Figure 10. Map showing Volt and Wolf Creek oilfields, Fort Peck Indian Reservation (modified from Henkes and Magill, 1970).

Figure 11. Map showing lignite deposits, Fort Peck Indian Reservation (modified from Smith, 1910; Colton and Bateman, 1956).

Figure 12. Sections of lignite beds in the Northeastern part of the Fort Peck Indian Reservation (adapted from Colton, 1962, pl. 40).
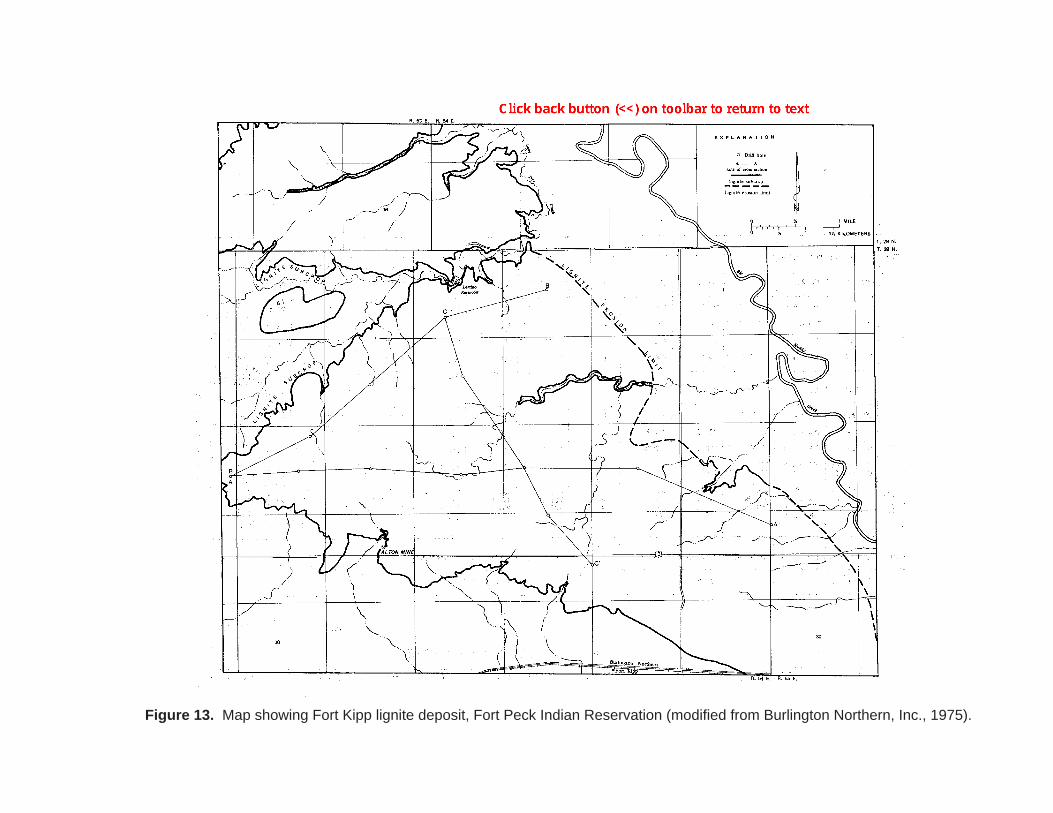
Figure 13. Map showing Fort Kipp lignite deposit, Fort Peck Indian Reservation (modified from Burlington Northern, Inc., 1975).
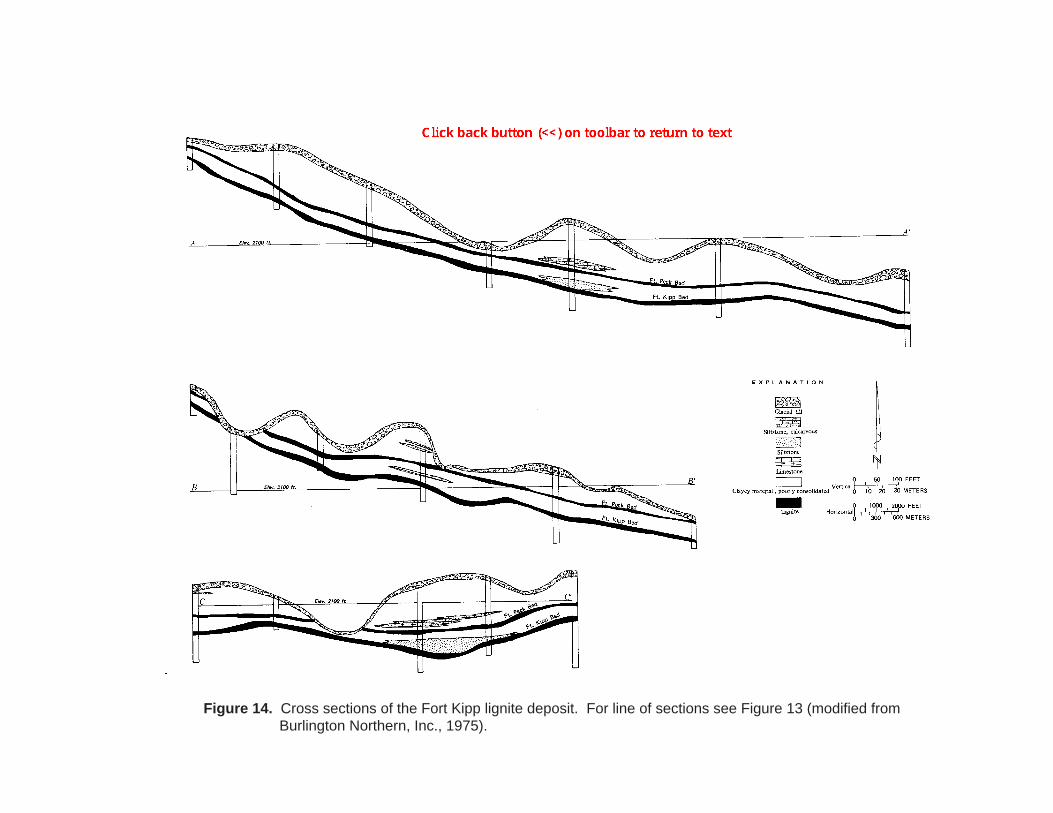
Figure 14. Cross sections of the Fort Kipp lignite deposit. For line of sections see Figure 13 (modified from Burlington Northern, Inc., 1975).

Figure 15. Structure contour map of the Fort Peck lignite bed, Fort Kipp lignite deposit, Fort Peck Indian Reservation (modified from Burlington Northern, Inc., 1975).

Figure 16. Structure contour map of the Fort Kipp lignite bed, Fort Kipp lignite deposit, Fort Peck Indian Reservation (modified from Burlington Northern, Inc., 1975).

Figure 17. Isopach map of strata overlying the Fort Peck lignite bed, Fort Kipp lignite deposit, Fort Peck Indian Reservation (modified from Burlington Northern, Inc., 1975).

Figure 18. Isopach map of strata overlying the Fort Kipp lignite bed, Fort Kipp lignite deposit, Fort Peck Indian Reservation (modified from Burlington Northern, Inc., 1975).

Figure 19. Map showing Reserve lignite deposit in and near Fort Peck Indian Resrvation (modified from Ayler, Smith, and Deutman, 1969 and unpublished Great Northern
Railway Co. report).

Figure 20. Map showing Medicine lake lignite deposit, Fort Peck Indian Reservation (modified from Ayler, Smith, and Deutman, 1969 and unpublished Great Northern Railway Co. report).

Figure 21. Map showing underground workings of Alton lignite mine, Fort Peck Indian Reservation (from Henkes and Magill, 1970).

Figure 22. Map showing underground workings of Simon-Gilligan lignite mines, Fort Peck Indian Reservation (from Henkes and Magill, 1970).
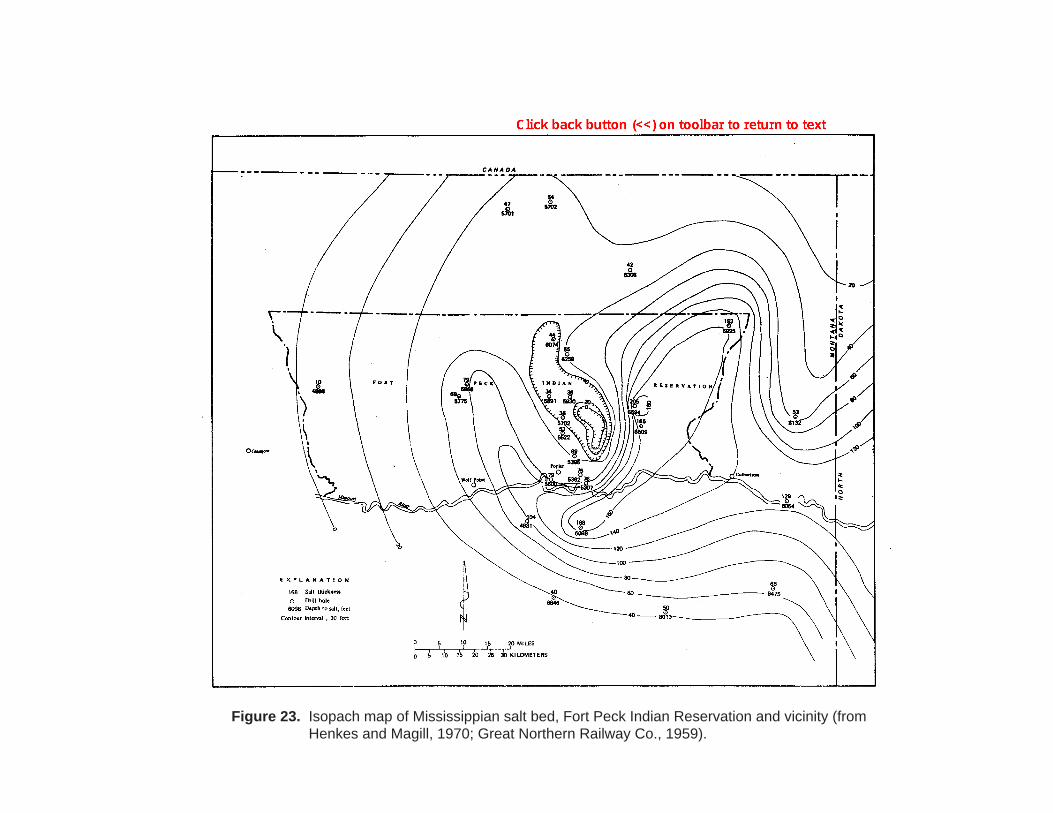
Figure 23. Isopach map of Mississippian salt bed, Fort Peck Indian Reservation and vicinity (from Henkes and Magill, 1970; Great Northern Railway Co., 1959).

Figure 24. Isopach map of Devonian salt bed, Fort Peck Indian Reservation and vicinity (from Great Northern Railway Co., 1965).

Figure 25. Map showing drill hole data in Devonian potash beds, Fort Peck Indian Reservation and vicinity (modified from Great Northern Railway Co., 1965).

Figure 26. Map showing pond deposits on Fort Peck Indian Reservation (Colton, 1955, 1962, 1963a-j, 1964a; Witkind, 1959; and Jensen and Varnes, 1964).
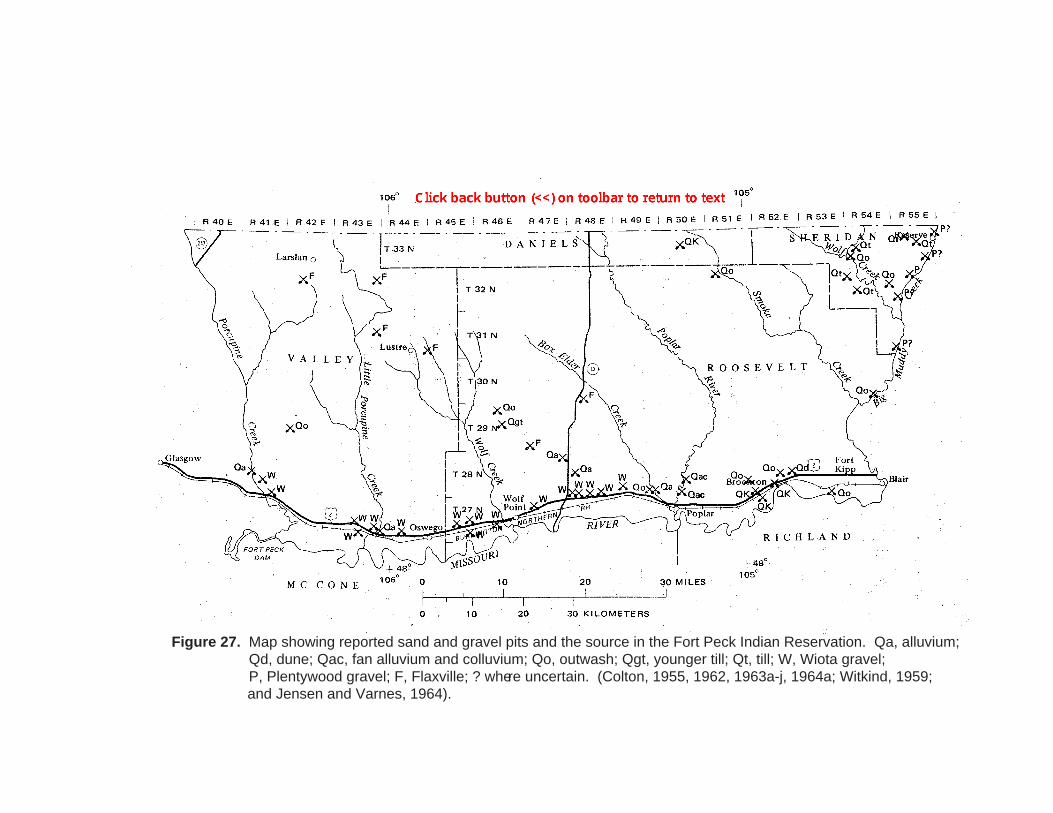
Figure 27. Map showing reported sand and gravel pits and the source in the Fort Peck Indian Reservation. Qa, alluvium; Qd, dune; Qac, fan alluvium and colluvium; Qo, outwash; Qgt, younger till; Qt, till; W, Wiota gravel; P, Plentywood gravel; F, Flaxville; ? where uncertain. (Colton, 1955, 1962, 1963a-j, 1964a; Witkind, 1959;
and Jensen and Varnes, 1964).