status of climate change actions in the virgin islandscohemis.uprm.edu/cacce/pdfs/06duncan.pdf ·...
TRANSCRIPT

C Y N A R A D U N C A N , E N V I R O N M E N T A L E D U C A T I O N O F F I C E R
C O N S E R V A T I O N A N D F I S H E R I E S D E P A R T M E N T
C A C C E W O R K S H O P , M A Y A G U E Z , P U E R T O R I C O
F E B R U A R Y 1 - 3 , 2 0 1 2
Status of Climate Change Actions
in the Virgin Islands

Overview of the Enhancing Capacity for Adaptation to Climate Change in the UKOTs (ECACC) Project
ECACC
Vulnerability and Capacity Assessment
(VCA)
Institutional mechanism to
address climate change
Adaptation
Ecosystem and climate monitoring
Education
Goal: building capacity for adaptation and mainstreaming climate change

Institutional Mechanism to Address Climate ChangeEnsuring climate change
work continues beyond the ECACC Project

Institutional Mechanism to Address Climate Change
Climate change declared subject matter under Ministry of Natural Resources and Labour
Climate Change Officer post created
Local climate change annual small budget allocated
National Climate Change Committee Cabinet approved in December 2008:

Enhanced Climate & Ecosystem Monitoring
Enhancing climate data, coral reef and beach monitoring

Ecosystem and climate monitoring
Increased weather station network (2 stations)
Strengthened partnership with Reef Check
Restarted beach monitoring programme

Tourism Sector Vulnerability & Capacity Assessment
Understanding and quantifying climate change impacts to tourism

VCA Components Overview
KAP Surveys
Hazard Vulnerability and Risk Assessment
Capacity Assessment
Risk Reduction Options

VCA Components
KAP surveys
Tourist Perception Survey - 30% to 60% say “significant influence” on their decision to revisit BVI.
Tourism managers - owners/managers are concerned about climate change impacts.
General public - ~50% highly concerned climate change; ~ 90% say early adaptation is necessary, even if costly.
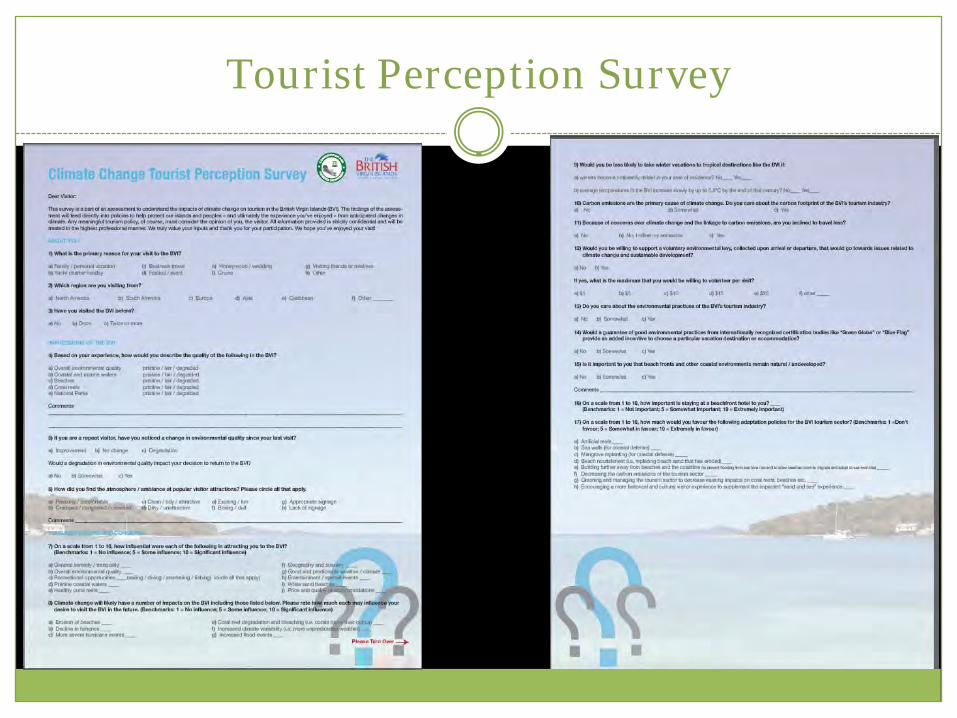
Tourist Perception Survey

VCA Components
Hazard Vulnerability and Risk Assessment
o Climate assessment
o Static risk maps – tourism properties/infrastructure in most vulnerable areas
o Beach Vulnerability Assessment - 24% avg. loss for 0.18m rise, 34% for 0.39m, 46% for 0.59m, 68% for 1m, 94% for 2m.
o Sea level rise vulnerability assessment – land area lost with 2m rise = 6% (Tortola), 2% (Virgin Gorda), 78% Anegada, 2% Jost Van Dyke
o Coral reef vulnerability assessment - total estimated decrease in reef value = $1,270,000 (= 25% of 2005 dive/snorkeling sector annual revenue )
o Risk assessment – priority impact areas - Environment, Tourism and Water Resources

Static Risk Map
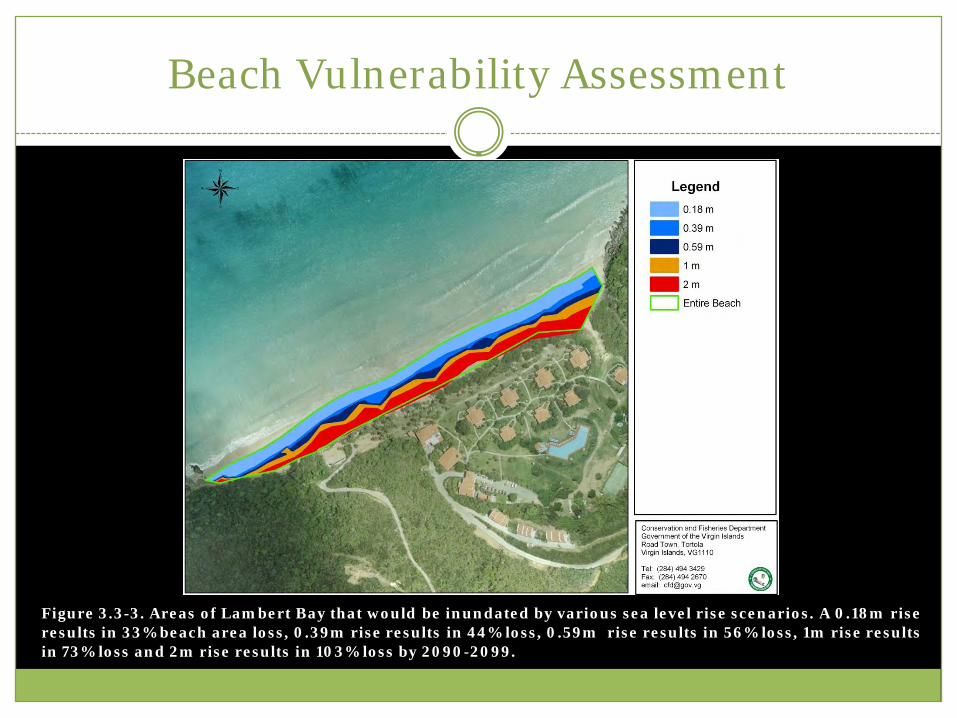
Beach Vulnerability Assessment
Figure 3.3-3. Areas of Lambert Bay that would be inundated by various sea level rise scenarios. A 0.18m rise results in 33% beach area loss, 0.39m rise results in 44% loss, 0.59m rise results in 56% loss, 1m rise results in 73% loss and 2m rise results in 103% loss by 2090-2099.

0.18m Scenario 0.39m Scenario 0.59m scenarioRank Beach Inundate
dBeach Inundate
dBeach Inundated
1(most
inundation)
Brewer’s Bay
38% Brewer’s Bay
53% Brewer’s Bay
73%
2 Lambert Bay
33% Lambert Bay
44% Lambert Bay 56%
3 Beef Island 30% Beef Island 39% Beef Island 45%
4 Cane Garden Bay
12% Cane Garden Bay
24% Cane Garden Bay
37%
5(least
inundation)
Josiah’s Bay 7% Josiah’s Bay 12% Josiah’s Bay 17%
1m scenario 2m scenarioRank Beach Inundated Beach Inundated
1(most
inundation)
Brewer’s Bay
93% Brewer’s Bay
>>100%
2 Lambert Bay 73% Lambert Bay
103%
3 Cane Garden Bay
68% Cane Garden Bay
103%
4 Beef Island Beach
58% Josiah’s Bay
85%
5(least
inundation)
Josiah’s Bay 48% Beef Island Beach
80%

SLR Maps
Island Land area that would be inundated with a 2m sea level risekm2 acres % of total area
Tortola 3.4 837 6.3%Virgin Gorda 0.7 169 1.8%Anegada 16.3 4, 024 77.6%Jost Van Dyke 0.2 42 2.2%
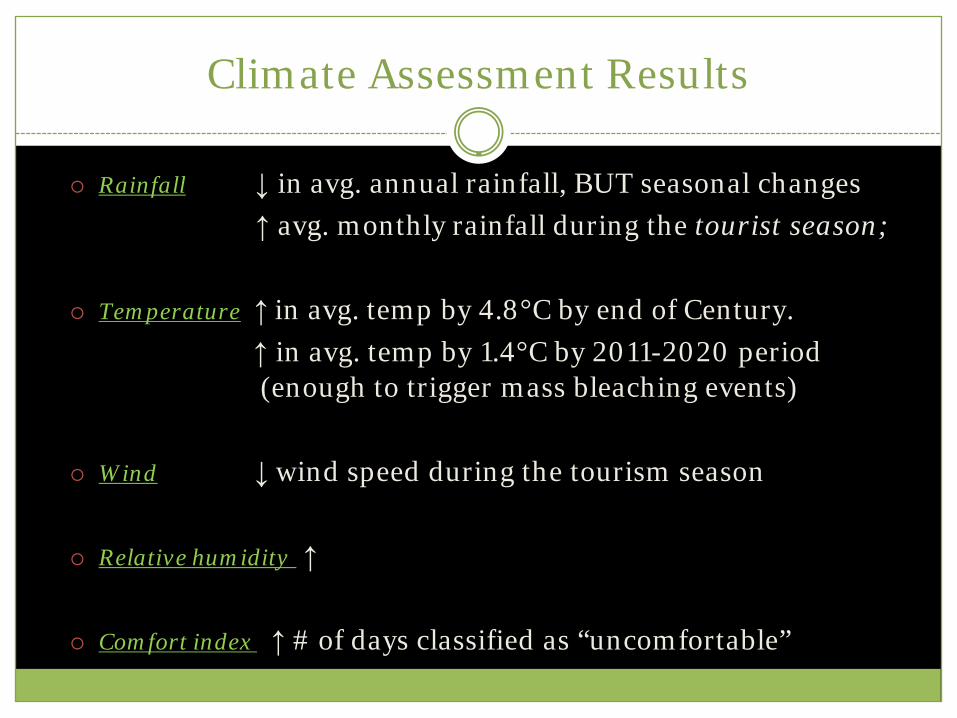
Climate Assessment Results
Rainfall ↓ in avg. annual rainfall, BUT seasonal changes
↑ avg. monthly rainfall during the tourist season;
Temperature ↑ in avg. temp by 4.8°C by end of Century.
↑ in avg. temp by 1.4°C by 2011-2020 period (enough to trigger mass bleaching events)
Wind ↓ wind speed during the tourism season
Relative humidity ↑
Comfort index ↑ # of days classified as “uncomfortable”

Climate Assessment Results
-30%
-25%
-20%
-15%
-10%
-5%
0%
5%
10%2
011
-2
02
0
20
21-
20
40
20
41-
20
60
20
61-
20
80
20
61-
20
80
20
81-
20
99
% C
ha
ng
e i
n r
ain
fall
Echam A2
Echam B2
Hadley A2
Hadley B2
Avg. of models
Figure 3.1-10 Average percentage (%) change in rainfall (for future time periods examined) compared to the baseline (1961 –1989). All model scenarios and average/consensus of model scenarios are shown.

-40.0
-30.0
-20.0
-10.0
0.0
10.0
20.0
30.0
40.0
Jan Feb Mar Apr May Jun Jul Aug Sep Oct Nov Dec
% C
ha
ng
e i
n r
ain
fall
2011-2020
2021-2040
2041-2060
2061-2080
2081-2099
2011-2099
Figure 3.1-13 Percentage (%) change in monthly rainfall (for future time periods examined) compared to the baseline. Average/consensus of model scenarios only is shown.

VCA Components
Capacity Assessment
Local CCC formed
↑ technical capacity needed – e.g. in land use planning and engineering
Urgent need for comprehensive environmental law and updated planning regs
NIDP, PDP and other management plans needed to guide development

VCA Components
Risk Reduction Options
Specific adaptation measures proposed for each impact under each affected sector as outlined in the draft Climate Change Policy
Diversify and increase resilience of economic sectors Improve environmental protection, disaster
management and development planning.
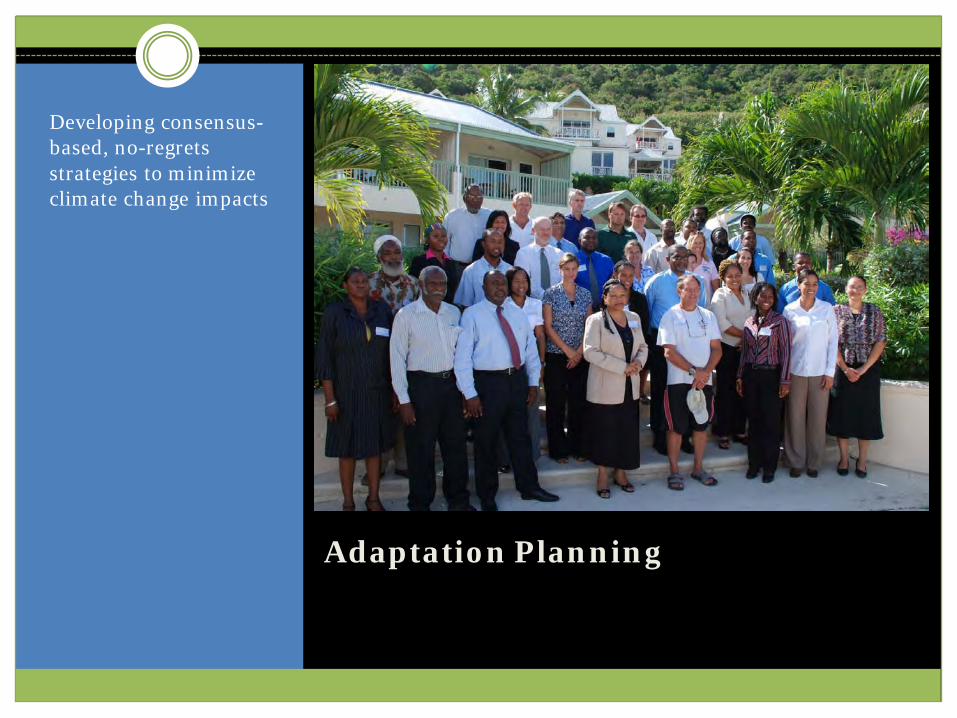
Adaptation Planning
Developing consensus-based, no-regrets strategies to minimize climate change impacts

“Wa
rmin
g o
f th
e c
lim
ate
sy
ste
m i
s u
ne
qu
ivo
cal”
IP
CC
20
07
Syn
thes
is R
epor
t


Impacts Happening Now
Coral bleaching
Flood events
– 2003 US $19,147,898
2007 record dengue
outbreaks

Stakeholder Consultation Approach
Country Vulnerability Profile
1st Stakeholder Consultation Climate Change Issues Paper
2nd Stakeholder Consultation Climate Change Green Paper
3rd Stakeholder Consultation Draft Climate Change Policy
Final Stakeholder Consultation
Cabinet Approved Climate Change Adaptation Policy

Public Education and Outreach
Building public and political awareness

Print Media / Internet
Climate Change and Tourism Brochure (November, 2008)
Newspaper mini series (May – June,2009)
Christian ads in newspaper (September, 2009)
Poster series (October, 2009)
Articles in the Hurricane Guide (June, 2009)
Update of CFD website (September, 2009)


Radio and TV
TV and Radio talk show appearances and radio reports
Minister’s World Environment Day Address (June 5th)
Climate change radio nuggets (May, 2009)
DDM TV (Focus) two 1hr features
Climate change radio soap opera series (coming soon)

Film
JNCC DVD distribution (May – June)
“Islands on the Edge: A Look at Climate Change in the Caribbean” “Climate Change in the UK Overseas Territories.”
Public screening of “An Inconvenient Truth” (June)


Students / Public Display
Logo competition (June – September, 2009)
Presentation to High School Science Department and Environmental Club (September, 2009)
350 beach event (October, 2009)
Skit about health and safety in the workplace – climate change aspect (2010)
Parade for the Planet (June 10, 2010)
Emancipation Festival Troupe – “Climate Change Messengers” (August, 201
“Climate Change and The Virgin Islands” public exhibit (ongoing)


BVI Participating in global 350 event!


Political Directorate
Presence at VCA Workshop, August 2008
Cabinet Paper “Developing a Mechanism for Addressing Climate Change in The Virgin Islands”
Climate change: An overview for politicians and senior decision makers Climate change: What does it mean for tourism?
Presence at Second Climate Change Stakeholder Consultation
Presentation to Caucus, September 21, 2010(Distribution of Green Paper)

Some Planned Activities
Climate change overview brief for Ministers
Climate change impact wall (along highway)
Climate Change Student Guide
30 second video clip about climate change for Facebook and other online media

Adaptation Pilot Project – Cane Garden Bay
Vetiver grass – erosion / flood controlPermeable Interlocking Concrete Pavement – flood controlGhut maintenance protocol – flood control