status of cardiovascular health in us adults -...
TRANSCRIPT

Status of Cardiovascular Health in US AdultsPrevalence Estimates From the National Health and Nutrition
Examination Surveys (NHANES) 2003–2008
Christina M. Shay, PhD, MA; Hongyan Ning, MD, MS; Norrina B. Allen, PhD, MPH;Mercedes R. Carnethon, PhD; Stephanie E. Chiuve, ScD; Kurt J. Greenlund, PhD*;
Martha L. Daviglus, MD, PhD; Donald M. Lloyd-Jones, MD, ScM
Background—The American Heart Association’s 2020 Strategic Impact Goals define a new concept, cardiovascular (CV)health; however, current prevalence estimates of the status of CV health in US adults according to age, sex, andrace/ethnicity have not been published.
Methods and Results—We included 14 515 adults (�20 years of age) from the 2003 to 2008 National Health and NutritionExamination Surveys. Participants were stratified by young (20–39 years), middle (40–64 years), and older (�65 years)ages. CV health behaviors (diet, physical activity, body mass index, smoking) and CV health factors (blood pressure,total cholesterol, fasting blood glucose, smoking) were defined as poor, intermediate, or ideal. Fewer than 1% of adultsexhibited ideal CV health for all 7 metrics. For CV health behaviors, nonsmoking was most prevalent (range,60.2%–90.4%), whereas ideal Healthy Diet Score was least prevalent (range, 0.2%–2.6%) across groups. Prevalencesof ideal body mass index (range, 36.5%–45.3%) and ideal physical activity levels (range, 50.2%–58.8%) were higherin young adults compared with middle or older ages. Ideal total cholesterol (range, 23.7%–36.2%), blood pressure(range, 11.9%–16.3%), and fasting blood glucose (range, 31.2%–42.9%) were lower in older adults compared withyoung and middle-aged adults. Prevalence of poor CV health factors was lowest in young age but higher at middle andolder ages. Prevalence estimates by age and sex were consistent across race/ethnic groups.
Conclusions—These prevalence estimates of CV health represent a starting point from which effectiveness of efforts topromote CV health and prevent CV disease can be monitored and compared in US adult populations. (Circulation.2012;125:45-56.)
Key Words: cardiovascular diseases � diet � epidemiology � obesity � risk factors
The American Heart Association’s (AHA’s) StrategicImpact Goals for 2020 and Beyond1 comprise the fol-
lowing objective: “By 2020, to improve the cardiovascularhealth of all Americans by 20% while reducing deaths fromcardiovascular diseases and stroke by 20%.” Accompanyingthese goals was a new concept, “cardiovascular health,”along with metrics for defining and monitoring it in the USpopulation. For this purpose, the definition includes crite-ria for the entire spectrum of cardiovascular (CV) health,including poor, intermediate, and ideal ranges for each of7 metrics. To achieve overall “ideal CV health,” adultsmust have the simultaneous presence of (1) no clinical CV
disease (ie, coronary heart disease, myocardial infarction,angina, stroke, heart failure); (2) ideal CV health behaviors(nonsmoking, body mass index [BMI] �25 kg/m2, physi-cal activity at recommended goal levels,2 and dietaryintakes consistent with a Dietary Approaches to StopHypertension [DASH]–like eating pattern3); and (3) idealCV health factors (nonsmoking [also considered a behav-ior], untreated total cholesterol �200 mg/dL, untreatedblood pressure �120/�80 mm Hg, untreated fasting bloodglucose �100 mg/dL). The association between ideal CVhealth and extremely favorable outcomes over 20 years offollow-up has recently been validated in the Atherosclero-
Received April 1, 2011; accepted October 27, 2011.From the Department of Preventive Medicine, Feinberg School of Medicine, Northwestern University, Chicago, IL (C.M.S., H.N., N.B.A., M.R.C.,
M.L.D., D.M.L.-J.); Division of Preventive Medicine, Department of Medicine, Brigham and Women’s Hospital and Harvard Medical School, andDepartment of Nutrition, Harvard School of Public Health, Boston, MA (S.E.C.); and Division of Adult and Community Health, Centers for DiseaseControl and Prevention, Atlanta, GA (K.J.G.). Dr Shay’s current affiliation is the Department of Biostatistics and Epidemiology, University of OklahomaHealth Sciences Center, Oklahoma City, OK.
Guest Editor for this article was Barbara G. Vickrey, MD, MPH.*The findings and conclusions in this report are those of the authors and do not necessarily represent the official position of the Centers for Disease Control.The online-only Data Supplement is available with this article at http://circ.ahajournals.org/lookup/suppl/doi:10.1161/CIRCULATIONAHA.
111.035733/-/DC1.Correspondence to Christina M. Shay, PhD, MA, Department of Biostatistics and Epidemiology, University of Oklahoma Health Sciences Center, 801
NE 13th Street, Oklahoma City, OK 73104. E-mail [email protected]© 2011 American Heart Association, Inc.
Circulation is available at http://circ.ahajournals.org DOI: 10.1161/CIRCULATIONAHA.111.035733
45
by guest on July 13, 2018http://circ.ahajournals.org/
Dow
nloaded from
by guest on July 13, 2018http://circ.ahajournals.org/
Dow
nloaded from
by guest on July 13, 2018http://circ.ahajournals.org/
Dow
nloaded from
by guest on July 13, 2018http://circ.ahajournals.org/
Dow
nloaded from
by guest on July 13, 2018http://circ.ahajournals.org/
Dow
nloaded from
by guest on July 13, 2018http://circ.ahajournals.org/
Dow
nloaded from
by guest on July 13, 2018http://circ.ahajournals.org/
Dow
nloaded from
by guest on July 13, 2018http://circ.ahajournals.org/
Dow
nloaded from
by guest on July 13, 2018http://circ.ahajournals.org/
Dow
nloaded from
by guest on July 13, 2018http://circ.ahajournals.org/
Dow
nloaded from
by guest on July 13, 2018http://circ.ahajournals.org/
Dow
nloaded from
by guest on July 13, 2018http://circ.ahajournals.org/
Dow
nloaded from
by guest on July 13, 2018http://circ.ahajournals.org/
Dow
nloaded from
by guest on July 13, 2018http://circ.ahajournals.org/
Dow
nloaded from
by guest on July 13, 2018http://circ.ahajournals.org/
Dow
nloaded from
by guest on July 13, 2018http://circ.ahajournals.org/
Dow
nloaded from
by guest on July 13, 2018http://circ.ahajournals.org/
Dow
nloaded from
by guest on July 13, 2018http://circ.ahajournals.org/
Dow
nloaded from
by guest on July 13, 2018http://circ.ahajournals.org/
Dow
nloaded from
by guest on July 13, 2018http://circ.ahajournals.org/
Dow
nloaded from
by guest on July 13, 2018http://circ.ahajournals.org/
Dow
nloaded from
by guest on July 13, 2018http://circ.ahajournals.org/
Dow
nloaded from
by guest on July 13, 2018http://circ.ahajournals.org/
Dow
nloaded from
by guest on July 13, 2018http://circ.ahajournals.org/
Dow
nloaded from
by guest on July 13, 2018http://circ.ahajournals.org/
Dow
nloaded from
by guest on July 13, 2018http://circ.ahajournals.org/
Dow
nloaded from
by guest on July 13, 2018http://circ.ahajournals.org/
Dow
nloaded from
by guest on July 13, 2018http://circ.ahajournals.org/
Dow
nloaded from
by guest on July 13, 2018http://circ.ahajournals.org/
Dow
nloaded from
by guest on July 13, 2018http://circ.ahajournals.org/
Dow
nloaded from
by guest on July 13, 2018http://circ.ahajournals.org/
Dow
nloaded from
by guest on July 13, 2018http://circ.ahajournals.org/
Dow
nloaded from

sis Risk in Communities study.4 Although general preva-lence estimates of CV health metrics are available for USadults �20 years of age,1 prevalence estimates by age, sex,and race/ethnicity have not been reported.
Clinical Perspective on p 56Using a representative sample of US adults examined from
2003 to 2008, we sought to define current age-, sex-, andrace/ethnicity-specific prevalence estimates of the individualcomponents of CV health according to poor, intermediate,and ideal levels. Additionally, we detail specific prevalenceestimates for adults having 0 to 7 ideal CV health componentsas identified in the AHA 2020 Strategic Impact Goals.
MethodsMeasurements and SampleThis cross-sectional study used 6 years of data from the 2003 to 2008National Health and Nutrition Examination Surveys (NHANES).5NHANES collects data in 2-year cycles, and the sampling method-ology used for participant recruitment is designed to ensure that thesample is nationally representative of the civilian, noninstitutional-ized US population. To ensure the representative nature of sampling,NHANES data are collected with the use of a complex, multistage,probability design to select participants from strata defined bygeography and proportions of minority populations. These strata aremostly single counties or contiguous counties selected with proba-bility proportional to a measure of size. Participants were inter-viewed at home and were invited to attend a mobile examinationcenter, where they underwent various anthropometric and physio-logical examinations and provided a blood sample. All data werecollected according to standard NHANES protocols across sites. TheNHANES questionnaires and protocols are available elsewhere.6 Thetotal combined sample of NHANES 2003 to 2008 was made up of30 619 participants. The analysis sample for the present reportconsisted of 14 515 adults after exclusions for age �20 years(n�14 015), incomplete interview or examination (n�1264), orpregnancy or breastfeeding at the time of examination (n�825). Allparticipants with available CV components were included in preva-lence estimates for specific components, whereas participants withcomplete information for all 7 CV health components were includedfor prevalence estimates of the number of CV health factors. Writteninformed consent was given by all participants, and the study design,data collection, and analyses were performed in accordance with
ethics standards of the supervising institutional review boards of allcenters involved.
Demographic CharacteristicsDemographic characteristics (age, sex, race/ethnicity, educationalattainment, annual household income) were queried during the homeinterview. Participants were stratified by age into 3 groups: youngage (20–39 years), middle age (40–64 years), or older age (�65years). Self-reported race/ethnicity was categorized as non-Hispanicwhite, non-Hispanic black, Mexican American, other Hispanic, orother according to NHANES protocol. Educational attainment wascategorized as less than high school, completion of high school, ormore than high school. Annual household income was categorized asbelow $45 000 or $45 000 and above.
Definition of CV HealthTo define the complete spectrum of CV health, all components arecategorized as poor, intermediate, or ideal as outlined in the AHA2020 Strategic Impact Goals.1 Criteria for CV health components foradults �20 years are outlined in Table 1. Ideal CV health is definedby the simultaneous presence of ideal levels of all 7 CV healthcomponents.
Assessment of CV Health BehaviorsSmoking status was determined on the basis of responses toquestionnaires regarding the use of cigarettes, pipes, and cigars.Height and weight were measured during the clinical examinationand used to calculate BMI (kg/m2). To assess self-reported physicalactivity, participants were asked to report the frequency and durationof specific moderate-intensity activities, “tasks that caused lightsweating or a slight to moderate increase in breathing or heart rate,”and vigorous-intensity activities that “cause heavy sweating or largeincreases in breathing or heart rate” over the past week or month.Transportation and household activities were asked about separately.For assessment of dietary intake, survey respondents provided 2interviewer-administered 24-hour recalls. From these recalls, theproportion of US adults who met the 5 primary goals of the HealthyDiet Score used to define CV health was assessed. These goals were�4.5 cups per day of fruits and vegetables, 2 or more 3.5-oz servingsper week of fish, 3 or more 1-oz servings per day of whole grains,�1500 mg/d sodium, and �450 kcal/wk of added sugar in sugar-sweetened beverages. Intakes of fruits, vegetables, fish, and wholegrains were scaled to a 2000-kcal/d diet. All dietary factors werecalculated with the MyPyramid Equivalents Database according to
Table 1. American Heart Association 2020 Strategic Impact Goals Definition of Poor, Intermediate, and Ideal Cardiovascular Healthfor Each Goal/Metric for Adults >20 Years of Age
Definitions
Cardiovascular Health Goals/Metrics Poor Intermediate Ideal
Current smoking Yes Former, quit �12 mo previously Never or quit �12 mo previously
Body mass index, kg/m2 �30.0 25.0–29.9 �25.0
Physical activity level None 1–149 min/wk moderate intensity, 1–74 min/wkvigorous intensity, 1–149 min/wk
moderate�vigorous*
�150 min/wk moderate intensity, �75min/wk vigorous intensity, or �150
min/wk moderate�vigorous*
Healthy Diet Score components† 0–1 2–3 4–5
Total cholesterol, mg/dL �240 200–239 or treated to goal �200 untreated
Blood pressure, mm Hg SBP �140 or DBP �90 SBP 120–139, DBP 80–89, or treated to goal �120/�80 untreated
Fasting blood glucose, mg/dL �126 100–125 or treated to goal �100 untreated
SBP indicates systolic blood pressure; DBP, diastolic blood pressure. Adapted from Lloyd-Jones et al.1
*Minutes of vigorous activity are equal to 2 times the minutes of moderate activity when moderate and vigorous activities are combined.†Healthy Diet Score components include the following: fruits and vegetables, �4.5 cups per day; fish, 2 or more 3.5-oz servings per week; fiber-rich whole grains
(�1.1 g fiber/10 g carbohydrate), 3 or more 1-oz-equivalent servings per day; sodium, �1500 mg/d; and sugar-sweetened beverages, �450 kcal/wk. Dietaryrecommendations are scaled according to a 2000-kcal/d diet.
46 Circulation January 3/10, 2012
by guest on July 13, 2018http://circ.ahajournals.org/
Dow
nloaded from

methodology established by the US Department of AgricultureCenter for Nutrition Policy and Promotion.7
Assessment of CV Health FactorsParticipants were asked to fast for �12 hours before clinicalexamination. Blood samples were obtained and sent to centrallaboratories for the determination of blood lipids and plasma glucose.Detailed descriptions about blood collection and processing are pro-vided in the NHANES Laboratory/Medical Technologists ProceduresManual (http://www.cdc.gov/nchs/nhanes/nhanes_questionnaires.htm).All blood pressure measurements were taken after the participant hadbeen resting quietly in a sitting position for 5 minutes and themaximum inflation level was determined. Three consecutive bloodpressure readings were attempted. If a blood pressure measurementwas interrupted or incomplete, a fourth attempt could be made. Theaverage of all blood pressure measurements was used for theseanalyses. Blood pressure measurements were taken in the mobileexamination center, and medical history, including medication useand history of CV disease or diabetes mellitus, was assessed duringthe home interview.
Definition of Treatment Control for CVHealth FactorsTotal cholesterol �200 mg/dL, blood pressure �140/�90 mm Hg,and fasting blood glucose �130 mg/dL were used as the thresholddefinitions of controlled treatment in agreement with current clinicalpractice guidelines.8–10
Statistical AnalysesAll statistical analyses were performed with SAS 9.1 (SAS institute,Cary, NC). To incorporate the complex, multistage sampling designof the NHANES, the SURVEYFREQ procedure was used. Theexamination and average laboratory weights were used to estimatethe number of noninstitutionalized, nonpregnant, nonlactating USadults �20 years of age in each age, sex, and race/ethnicity group asappropriate. Final sampling weights were divided by the number ofcombined surveys to estimate population average. For prevalenceestimates, nonoverlapping 95% confidence intervals indicate statis-tical significance.
ResultsOur final analysis sample included 14 515 NHANES partic-ipants, which represents a population of �205.6 millionnoninstitutionalized US adults. The sample was balanced bysex (49.3% women, 50.7% men). Sociodemographic charac-teristics and prevalence estimates for all components of CVhealth according to health status (poor, intermediate, ideal)stratified by sex and age group are presented in Tables 2 and3. Similar estimates for race/ethnic groups are presented inTables I through VI in the online-only Data Supplement. Menand women of all age groups were predominantly non-Hispanic white, and young and middle-aged men and womenfrequently had an education level beyond high school. Youngand middle-aged adults tended to have an annual householdincome of $45 000 or higher, whereas an annual income ofbelow $45 000 was most frequently reported for older adults.Compared with non-Hispanic whites, non-Hispanic black andMexican American men and women less frequently had aneducation level beyond high school and reported an annualhousehold income of $45 000 or higher.
Prevalence of CV Health BehaviorsThe majority of men and women in all age groups reportedideal smoking status; these were the highest prevalence ratesamong all ideal CV health components. Young non-Hispanic
white men exhibited the highest prevalence and older non-Hispanic white men exhibited the lowest prevalence ofcurrent smoking (eg, poor smoking status). Fewer than half ofyoung men and women exhibited ideal BMI, and more thantwo-thirds of middle-aged and older adults were overweightor obese. Non-Hispanic black women exhibited the highestprevalence and non-Hispanic white women exhibited thelowest prevalence of intermediate and poor BMI. Youngadults, particularly non-Hispanic black men, most frequentlyreported ideal physical activity levels, but prevalence waslower across higher age groups. The largest proportion ofmen and women with poor physical activity levels was inthe older age group with the highest prevalence in non-Hispanic white women. Women generally exhibited lowerprevalence of ideal physical activity in every age groupcompared with men.
Ideal Healthy Diet Score was the least prevalent CV healthcomponent overall. Greater than 99% of young men wereclassified as having an intermediate or poor Healthy DietScore. Zero young men had an ideal Healthy Diet Score.Unlike other health behaviors, the prevalence of adults withideal Healthy Diet Scores was highest in older age comparedwith young or middle age.
Prevalence of CV Health FactorsYoung adults exhibited the highest prevalence of ideal levelsof total cholesterol, blood pressure, and fasting glucoseplasma, particularly among non-Hispanic black women, com-pared with the middle-aged and older groups. Despite thesemore favorable estimates, between 13.4% and 48.7% ofyoung men and women had CV health factors in the inter-mediate or poor range (depending on the CV health compo-nent examined). Men had lower prevalence of ideal bloodpressure and total cholesterol in young adulthood comparedwith women of similar age. At older age, women had a lowerprevalence of ideal blood pressure and total cholesterolcompared with men. The highest prevalence of poor andintermediate total cholesterol was observed in older non-Hispanic women, whereas the highest prevalence of poor andintermediate blood pressure was observed in older non-Hispanic black women. Ideal levels of fasting blood glucosewere the most prevalent of ideal CV health factor across allgroups, particularly in young adults, in whom fewer than onethird (from 13.4%–29.4%) were in the poor and intermediateranges. Women generally exhibited higher prevalence ofideal fasting blood glucose compared with men, whereas thelowest prevalence of ideal fasting blood glucose was ob-served in non-Hispanic white men.
Number of Ideal CV Behaviors and FactorsFewer than 1% of all adults exhibited ideal levels of all 7 CVhealth components. Prevalence estimates for the number ofideal CV health components (0–7) by sex and age groups arepresented in Figure 1 and additionally stratified by race/ethnic group in Figures I through VI in the online-only DataSupplement. Young men most frequently had 3 to 4 ideal CVhealth components; middle-aged men most commonly had 2to 3 ideal CV health components; and older men mostcommonly exhibited 2 to 3 ideal CV health components.
Shay et al Prevalence of CV Health in US Adults 47
by guest on July 13, 2018http://circ.ahajournals.org/
Dow
nloaded from

Table 2. Characteristics and Prevalence of Cardiovascular Health Behaviors and Factors in US Women by Age Group: NationalHealth and Nutrition Examination Surveys 2003 to 2008
Young Age, 20–39 y Middle Age, 40–64 y Older Age, �65 y
Characteristics
PercentPrevalence(95% CI)
PopulationEstimate, �106
PercentPrevalence(95% CI)
PopulationEstimate, �106
PercentPrevalence(95% CI)
PopulationEstimate, �106
Race/ethnicity, n 2166 3008 1985
White (non-Hispanic) 64.4 (60.0–68.8) 23.1 72.5 (68.4–76.6) 35.0 82.5 (79.1–85.9) 16.9
Black (non-Hispanic) 14.1 (11.4–16.8) 5.1 12.0 (9.5–14.6) 5.8 8.7 (6.6–10.9) 1.8
Mexican American 10.1 (7.9–12.3) 3.6 5.8 (4.2–7.4) 2.8 3.2 (1.8–4.7) 0.7
Other Hispanics 5.3 (3.9–6.7) 1.8 5.8 (4.2–7.4) 1.9 2.1 (1.1–3.1) 0.7
Other 6.1 (4.6–7.7) 2.2 3.9 (2.6–5.2) 2.8 3.4 (2.3–4.6) 0.4
Educational attainment, n 2165 3007 1974
Less than high school 16.0 (14.0–18.1) 5.7 15.0 (13.1–16.9) 7.2 30.2 (26.5–34.0) 6.2
High school graduate 21.8 (19.4–24.2) 7.8 25.2 (23.1–27.2) 12.2 32.8 (30.6–35.1) 6.7
Greater than high school 62.2 (59.3–65.0) 22.3 59.8 (56.6–63.0) 28.9 36.9 (33.6–40.2) 7.5
Annual household income, n 1904 2656 1819
�$45 000 50.9 (47.7–54.1) 15.8 44.2 (40.8–47.6) 17.8 72.9 (69.0–76.9) 13.7
�$45 000 49.1 (45.9–52.3) 15.2 55.8 (52.4–59.2) 22.5 27.1 (23.1–31.0) 5.1
Smoking status, n 2165 3008 1985
Poor 27.2 (24.4–29.9) 9.7 22.2 (19.8–24.5) 10.7 8.6 (7.3–10.0) 1.7
Intermediate 3.8 (3.0–4.6) 1.4 2.2 (1.5–2.8) 1.1 1.0 (0.5–1.4) 0.2
Ideal 69.1 (66.1–72.0) 24.7 75.6 (73.3–78.0) 36.5 90.4 (89.0–91.7) 18.5
Body mass index, n 2142 2962 1908
Poor 31.2 (28.5–34.0) 11.1 39.1 (36.7–41.6) 18.6 30.8 (28.1–33.5) 6.1
Intermediate 23.4 (21.1–25.7) 8.3 27.8 (25.6–30.0) 13.2 35.5 (32.6–38.5) 7.0
Ideal 45.3 (42.1–48.6) 16.1 33.1 (30.6–35.7) 15.8 33.7 (30.6–36.7) 6.7
Physical activity level, n 2166 3008 1985
Poor 26.6 (24.3–28.9) 9.5 34.3 (31.7–36.9) 16.6 52.0 (48.5–55.5) 10.6
Intermediate 23.2 (20.7–25.6) 8.3 24.3 (22.4–26.2) 11.7 20.9 (18.7–23.1) 4.3
Ideal 50.2 (47.0–53.4) 18.0 41.4 (38.6–44.2) 20.0 27.1 (24.0–30.1) 5.5
Healthy Diet Score, n 1785 2651 1702
Poor 83.0 (80.9–85.1) 24.8 71.0 (1.6–67.7) 30.8 60.0 (1.4–57.1) 10.8
Intermediate 16.5 (14.4–18.7) 4.9 28.0 (1.6–24.8) 12.1 37.3 (1.4–34.6) 6.7
Ideal 0.5 (0.0–0.9) 0.1 1.1 (0.2–0.7) 0.5 2.6 (0.4–1.8) 0.5
Total cholesterol, n 2001 2851 1833
Poor 8.2 (6.8–9.6) 2.7 20.3 (18.4–22.3) 9.4 21.7 (19.4–23.9) 4.1
Intermediate 23.1 (21.2–25.1) 7.7 44.2 (42.4–46.0) 20.5 54.6 (52.3–57.0) 10.5
Ideal 68.7 (66.5–70.9) 22.8 35.5 (32.9–38.0) 16.4 23.7 (21.4–26.0) 4.5
Blood pressure, n 1963 2719 1776
Poor 2.2 (1.5–2.8) 0.7 17.2 (15.5–19.0) 7.5 41.4 (38.8–43.9) 7.6
Intermediate 19.0 (16.7–21.3) 6.2 45.4 (43.2–47.6) 19.9 46.7 (44.2–49.3) 8.6
Ideal 78.8 (76.5–81.1) 25.8 37.4 (34.7–40.1) 16.4 11.9 (9.7–14.0) 2.2
Fasting blood glucose, n 525 766 483
Poor 1.6 (0.6–2.7) 0.4 6.7 (4.6–8.8) 2.2 17.5 (13.2–21.8) 2.2
Intermediate 11.8 (9.0–14.6) 2.7 31.0 (26.2–35.8) 10.1 39.6 (34.2–44.9) 5.0
Ideal 86.6 (83.6–89.5) 20.1 62.3 (57.0–67.6) 20.2 42.9 (37.7–48.1) 5.4
CI indicates confidence interval. Percentages may not total 100 because of rounding. Population estimates for may not be equal across individual variables owingto varying sample sizes.
48 Circulation January 3/10, 2012
by guest on July 13, 2018http://circ.ahajournals.org/
Dow
nloaded from

Table 3. Characteristics and Prevalence of Cardiovascular Health Behaviors and Factors in US Men by Age Group: National Healthand Nutrition Examination Surveys 2003 to 2008
Young Age, 20–39 y Middle Age, 40–64 y Older Age, �65 y
Characteristics
PercentPrevalence(95% CI)
PopulationEstimate, �106
PercentPrevalence(95% CI)
PopulationEstimate, �106
PercentPrevalence(95% CI)
PopulationEstimate, �106
Race/ethnicity, n 2476 2900 1980
White (non-Hispanic) 62.5 (58.0–67.1) 24.9 74.6 (70.7–78.4) 34.2 83.4 (80.0–86.7) 12.8
Black (non-Hispanic) 11.6 (9.4–13.9) 4.6 10.4 (8.4–12.5) 4.8 7.6 (5.7–9.5) 1.2
Mexican American 13.8 (11.3–16.3) 5.5 6.4 (4.8–8.0) 2.9 3.4 (1.9–4.9) 0.5
Other Hispanic 5.3 (3.6–7.0) 2.1 3.1 (2.1–4.0) 1.4 2.6 (1.4–3.9) 0.4
Other 6.8 (5.1–8.4) 2.7 5.5 (4.1–6.9) 2.5 3.0 (1.8–4.2) 0.5
Educational attainment, n 2475 2898 1974
�High school 19.8 (17.6–22.1) 7.9 16.7 (14.5–18.9) 7.6 27.3 (23.9–30.7) 4.2
High school graduate 27.4 (24.8–30.1) 10.9 26.0 (23.8–28.1) 11.9 26.1 (22.6–29.7) 4.0
�High school 52.7 (49.3–56.2) 21.0 57.4 (54.2–60.5) 26.3 46.6 (41.7–51.4) 7.1
Annual household income, n 2153 1174 1810
�$45,000 47.7 (44.5–50.9) 16.4 38.5 (35.0–42.1) 14.5 64.7 (60.9–68.5) 9.0
�$45,000 52.3 (49.1–55.5) 18.0 61.5 (57.9–65.0) 23.1 35.3 (31.5–39.1) 5.0
Smoking status, n 2476 2900 1947
Poor 34.4 (32.1–36.7) 13.7 28.0 (25.4–30.5) 12.8 9.2 (7.5–11.0) 1.4
Intermediate 5.4 (4.3–6.5) 2.2 2.2 (1.5–2.9) 1.0 1.8 (1.0–2.6) 0.3
Ideal 60.2 (58.0–62.4) 24.0 69.8 (67.2–72.3) 32.0 89.0 (87.0–90.9) 13.7
Body mass index, n 2445 2862 1917
Poor 27.5 (24.8–30.2) 10.8 36.2 (33.3–39.2) 16.4 30.5 (27.9–33.2) 4.6
Intermediate 36.0 (33.7–38.3) 14.1 42.2 (39.5–44.9) 19.1 43.5 (40.1–46.9) 6.5
Ideal 36.5 (34.2–38.8) 14.4 21.5 (19.3–23.8) 9.7 26.0 (23.6–28.3) 3.9
Physical activity level, n 2476 2900 1980
Poor 22.0 (19.7–24.4) 8.8 32.1 (29.2–35.0) 14.7 42.6 (39.9–45.2) 6.5
Intermediate 19.2 (17.3–21.0) 7.6 19.0 (16.9–21.1) 8.7 16.5 (14.3–18.7) 2.5
Ideal 58.8 (56.0–61.6) 23.4 48.9 (46.4–51.5) 22.4 41.0 (37.7–44.3) 6.3
Healthy Diet Score, n 1958 2450 1705
Poor 92.0 (90.0–94.0) 29.6 82.7 (80.8–84.5) 32.5 69.4 (67.1–71.6) 9.5
Intermediate 7.8 (5.8–9.7) 2.5 16.7 (15.0–18.5) 6.6 29.5 (27.4–31.6) 4.0
Ideal 0.2 (0.0–0.5) 0.1 0.6 (0.2–0.9) 0.2 1.1 (0.5–1.8) 0.2
Total cholesterol, n 2301 2751 1883
Poor 10.9 (9.2–12.7) 4.1 19.6 (17.8–21.4) 8.6 9.3 (8.1–10.6) 1.4
Intermediate 28.2 (25.9–30.5) 10.5 44.4 (41.8–47.0) 19.6 54.4 (51.5–57.3) 8.0
Ideal 60.8 (58.5–63.1) 22.6 36.0 (33.3–38.7) 15.9 36.2 (33.4–39.1) 5.3
Blood pressure, n 2271 2692 1871
Poor 7.6 (6.1–9.1) 2.8 19.4 (17.4–21.5) 8.3 31.7 (28.8–34.5) 4.5
Intermediate 41.1 (38.6–43.7) 15.0 51.2 (48.5–53.9) 21.8 52.0 (49.6–54.5) 7.4
Ideal 51.3 (48.3–54.3) 18.7 29.4 (27.0–31.8) 12.5 16.3 (13.6–19.1) 2.3
Fasting blood glucose, n 645 726 538
Poor 2.4 (1.2–3.6) 0.6 9.5 (6.4–12.5) 2.8 17.0 (12.8–21.3) 1.7
Intermediate 27.0 (23.1–30.9) 7.2 43.9 (37.0–50.8) 12.9 51.8 (46.3–57.2) 5.2
Ideal 70.6 (66.8–74.4) 18.9 46.6 (40.3–53.0) 13.7 31.2 (27.0–35.4) 3.1
CI indicates confidence interval. Percentages may not total 100 as a result of rounding. Population estimates for may not be equal across individual variables owingto varying sample sizes.
Shay et al Prevalence of CV Health in US Adults 49
by guest on July 13, 2018http://circ.ahajournals.org/
Dow
nloaded from

Young women most frequently met ideal criteria for 4 to 5ideal CV health components; middle-aged women mostcommonly exhibited �3 ideal CV health components; andolder women exhibited 2 to 3 ideal CV health components.
The distribution of the number of ideal CV health compo-nents according to age was similar when examined acrossrace/ethnic groups; however, young non-Hispanic whitewomen exhibited the highest number of ideal CV health
Table 4. Distribution of Cardiovascular Health Behaviors and Factors According toCardiovascular Health Status in US Women by Age Group: National Health and NutritionExamination Surveys 2003 to 2008
Median (Interquartile Range)
CharacteristicsYoung Age, 20–39 y
(n�2166)Middle Age, 40–64 y
(n�3008)Older Age, �65 y
(n�1985)
Body mass index, n 2142 2962 1908
Poor, kg/m2 35.3 (32.3–39.6) 35.0 (32.2–39.2) 33.5 (31.6–37.0)
Intermediate, kg/m2 27.2 (26.1–28.5) 27.4 (26.2–28.8) 27.4 (26.2–28.6)
Ideal, kg/m2 21.9 (20.2–23.5) 22.5 (21.0–23.9) 22.7 (21.1–23.9)
Physical activity level, n 2166 3008 1985
Intermediate, min
Vigorous activity 9.3 (0.0–30.4) 0.0 (0.0–21.0) 0.0 (0.0–0.0)
Moderate activity 56.1 (28.0–90.0) 60.0 (28.0–98.1) 63.1 (35.0–100.0)
Total activity* 84.1 (60.0–120.0) 90.0 (56.1–120.0) 80.0 (40.0–120.0)
Ideal, min
Vigorous activity 126.2 (30.0–294.4) 105.1 (0.0–240.0) 0.0 (0.0–159.1)
Moderate activity 238.3 (120.0–600.0) 276.9 (154.2–600.0) 300.0 (210.0–510.0)
Total activity* 620.0 (332.9–1200.0) 600.0 (315.4–1200.0) 480.0 (287.4–900.0)
Total cholesterol, n 2001 2851 1833
Poor, mg/dL 258.5 (247.0–274.0) 260.0 (249.0–280.0) 261.0 (249.0–281.0)
Intermediate, mg/dL 214.0 (206.0–224.0) 213.0 (203.0–225.0) 208.0 (182.0–222.0)
Ideal, mg/dL 168.0 (151.0–182.0) 178.0 (162.0–189.0) 177.0 (161.0–189.0)
Blood pressure, n 1963 2719 1776
Poor, mm Hg
Systolic blood pressure 141.0 (134.0–149.0) 150.0 (143.0–159.0) 157.0 (147.0–171.0)
Diastolic blood pressure 91.0 (87.0–95.0) 82.0 (74.0–91.0) 70.0 (59.0–78.0)
Intermediate, mm Hg
Systolic blood pressure 123.0 (120.0–127.0) 124.5 (120.0–131.0) 127.0 (120.0–134.0)
Diastolic blood pressure 76.0 (69.0–82.0) 74.0 (68.0–80.0) 63.0 (55.0–71.0)
Ideal, mm Hg
Systolic blood pressure 107.0 (101.0–112.0) 109.0 (103.0–114.0) 112.0 (106.0–116.0)
Diastolic blood pressure 65.0 (60.0–71.0) 68.0 (62.0–73.0) 62.0 (55.0–68.0)
Fasting blood glucose, n 525 766 483
Poor, mg/dL 145.5 (137.0–248.8) 172.0 (141.0–234.0) 146.5 (134.0–174.0)
Intermediate, mg/dL 104.0 (101.0–108.0) 105.0 (102.0–111.9) 107.0 (103.0–114.0)
Ideal, mg/dL 90.0 (85.0–94.0) 92.3 (87.8–96.0) 93.0 (88.4–96.8)
*Minutes of vigorous activity are equal to 2 times the minutes of moderate activity when moderate and vigorousactivities are combined.
Figure 1. Number of ideal cardiovascularhealth components in US adults �20years by age and sex group (A and B):National Health and Nutrition Examina-tion Surveys 2003 to 2008.
50 Circulation January 3/10, 2012
by guest on July 13, 2018http://circ.ahajournals.org/
Dow
nloaded from

factors (4–5 ideal components). No older non-Hispanic blackmen exhibited �4 ideal CV health components.
Distribution of CV Health ComponentsThe distribution of CV health components according to age,sex, and CV health status is displayed in Tables 4 and 5. Forintermediate BMI, the lowest 25th percentile of adults are�1.5 U (kg/m2) from being classified as ideal BMI, whereasadults in the lowest 25th percentile of the poor BMI categoryare �2.0 (kg/m2) from reaching intermediate levels. Foradults with intermediate physical activity levels, 75% are�30 min/wk from reaching ideal levels. Median values forintermediate total cholesterol ranges are �15 mg/dL fromideal levels; older adults with intermediate total cholesterol
have ranges closest to ideal levels. Greater than 75% of adultswith intermediate blood pressure have elevated systolic bloodpressure (�120 mm Hg). Young adults with poor blood pressurehave a higher prevalence of elevated diastolic blood pressure(�80 mm Hg) compared with middle and older ages. Forintermediate fasting blood glucose, the lowest 25th percentile ofadults are �3 mg/dL from reaching ideal levels, whereas thelowest 25th percentile of adults in the poor category are �15mg/dL from reaching intermediate levels.
The proportion of adults who meet goal levels for individ-ual components of the Healthy Diet Score according to poor,intermediate, and ideal Healthy Diet Score is displayed byage and sex in Figure 2. Across all categories of Healthy DietScore, sodium and whole grain recommendations are the least
Table 5. Distribution of Cardiovascular Health Behaviors and Factors and TreatmentAccording to Category of Cardiovascular Health in US Men by Age Group: National Health andNutrition Examination Surveys 2003 to 2008
Median (Interquartile Range)
CharacteristicsYoung Age, 20–39 y
(n�2476)Middle Age, 40–64 y
(n�2900)Older Age, �65 y
(n�1980)
Body mass index, n 2445 2862 1917
Poor, kg/m2 33.4 (31.4–37.0) 33.4 (31.4–36.6) 32.9 (31.3–35.7)
Intermediate, kg/m2 27.4 (26.1–28.5) 27.5 (26.4–28.8) 27.4 (26.2–28.7)
Ideal, kg/m2 22.8 (21.1–23.9) 23.0 (21.5–24.0) 23.0 (21.4–24.2)
Physical activity level, n 2476 2900 1980
Intermediate, min
Vigorous activity 17.5 (4.7–37.4) 5.8 (0.0–28.0) 0.0 (0.0–14.0)
Moderate activity 42.1 (18.7–84.1) 60.0 (28.0–105.0) 70.0 (31.5–105.0)
Total activity* 86.4 (56.1–120.0) 90.0 (50.0–120.0) 90 (60.0–120.0)
Ideal, min
Vigorous activity 240.0 (105.1–660) 168.2 (51.4–420.6) 70.1 (0.0–300)
Moderate activity 300.1 (122.7–853.4) 300.0 (150.0–720.0) 353.4 (210.3–600.0)
Total activity* 960.0 (469.6–2281.5) 799.5 (385.5–1860.0) 654.2 (350.5–1200.0)
Total cholesterol, n 2301 2751 1883
Poor, mg/dL 261.0 (248.0–277.0) 261.0 (249.0–279.0) 259.0 (248.0–278.0)
Intermediate, mg/dL 214.0 (205.0–225.0) 210.0 (199.0–224.0) 195.0 (162.0–214.0)
Ideal, mg/dL 169.0 (150.0–184.0) 177.0 (162.0–189.0) 168.0 (150.0–185.0)
Blood pressure, n 2271 2692 1871
Poor, mm Hg
Systolic blood pressure 141.0 (132.0–145.0) 147.0 (141.0–155.0) 152.0 (145.0–163.0)
Diastolic blood pressure 91.0 (78.0–95.0) 88.0 (78.0–94.0) 74.0 (63.0–82.0)
Intermediate, mm Hg
Systolic blood pressure 125.0 (121.0–129.0) 124.0 (120.0–131.0) 127.0 (120.0–133.0)
Diastolic blood pressure 74.0 (65.0–81.0) 76.0 (70.0–82.0) 65.0 (57.0–73.0)
Ideal, mm Hg
Systolic blood pressure 112.0 (107.0–116.0) 112.0 (106.0–116.0) 111.0 (105.0–116.0)
Diastolic blood pressure 66.0 (59.0–72.0) 70.0 (65.0–74.0) 62.0 (56.0–68.0)
Fasting blood glucose, n 645 726 538
Poor, mg/dL 149.0 (132.0–250.0) 162.5 (134.0–236.0) 150.0 (135.0–182.0)
Intermediate, mg/dL 104.0 (101.0–108.0) 107.0 (103.0–113.0) 109.0 (103.0–115.0)
Ideal, mg/dL 92.0 (88.0–96.0) 94.0 (90.0–97.0) 94.0 (91.0–97.0)
*Minutes of vigorous activity are equal to 2 times the minutes of moderate activity when moderate and vigorousactivities are combined.
Shay et al Prevalence of CV Health in US Adults 51
by guest on July 13, 2018http://circ.ahajournals.org/
Dow
nloaded from

commonly achieved goals, whereas the sugar-sweetenedbeverages goal is most commonly met. A lower proportion ofmale participants meet the sodium and fruit and vegetablegoal compared with women in all categories; however, menmore consistently meet goals for fish intake.
Treatment of CV Health FactorsThe proportions of adults who are untreated, treated (uncon-trolled), and treated (controlled) for individual CV healthfactors (ie, blood pressure, total cholesterol, and fasting bloodglucose) are displayed according to age and sex in Figure 3.The proportion of adults reporting treatment was generallyhigher across increasing age groups. The proportion of adultsreceiving treatment in all age groups was similar betweenmen and women except in young adults with poor bloodpressure, in whom treatment was more prevalent in women.Prevalence of cholesterol treatment was the lowest of all CVhealth factors, particularly in young adults. For fasting bloodglucose, men in poor categories were more commonly treatedcompared with women, yet small proportions of adults in
intermediate categories reported treatment. Among adultsreceiving treatment, total cholesterol was the least frequentCV health factor treated to controlled levels.
DiscussionThese prevalence estimates of poor, intermediate, and ideallevels quantify the current status of the full spectrum of CVhealth in the US adult population and important subgroupsand provide a critical baseline for monitoring progress towardachievement of the AHA 2020 Strategic Impact Goals. TheAHA 2020 goals are focused on improving the CV health ofall Americans by reducing the prevalence of poor levels(through treatment and lifestyle) while increasing the preva-lence of ideal levels (with lifestyle change) of CV healthbehaviors and health factors. The concept is based on thenotion proposed by Rose11 that shifting the population meanand distribution of behaviors and factors (even slightly)toward healthier levels can have dramatic benefits in healthpromotion and disease prevention.11–13 Whereas ideal CVhealth is just that, “ideal,” this profile is unlikely to be
Figure 2. Prevalence of attaining individual components of the Healthy Diet Score in US adults �20 years of age according to poor,intermediate, and ideal Healthy Diet Score category by age and sex (A through F): National Health and Nutrition Examination Surveys2003 to 2008.
52 Circulation January 3/10, 2012
by guest on July 13, 2018http://circ.ahajournals.org/
Dow
nloaded from

achieved by large proportions of the US population for theforeseeable future. Therefore, clinical and public healthprograms focused on shifting the entire distribution of CVhealth toward more favorable levels are needed, particularlyamong minority populations.
Our data indicate that �1% of US adults have ideal levelsof all 7 CV health components; these prevalence estimates areeven lower in non-Hispanic black and Mexican Americanadults. Although alarming, these estimates are consistent withrecent reports from a middle-aged community-based studypopulation in which only 0.1% of participants exhibitedoverall ideal CV health.14 Although CV health behaviors andfactors are equally weighted in the current AHA definition, itis important to emphasize the direct causal association be-tween adverse CV behaviors (ie, physical inactivity, poordietary intake, obesity, smoking) and CV factors (ie, blood
pressure, blood lipids, blood glucose).15–25 Because �90% ofUS adults report intermediate or poor Healthy Diet Scores,more than two thirds exhibit intermediate or poor BMI, andfewer than half report physical activity at goal levels, it islikely that these unfavorable CV behaviors are substantiallyresponsible for the coinciding unfavorable state of CV healthfactors in the US adult population. More important, improve-ments in even a single health behavior such as improvementsachieved through weight loss can result in improvements inmultiple CV health factors. This strong interrelationshipbetween CV health behaviors and factors is an importantreminder that individual components of CV health do notexist in a physiological vacuum and this concept should bestrongly considered when determining specific target popu-lations and strategic interventions for the improvement of CVhealth from a population approach.
Figure 3. Treatment status for poor and intermediate cardiovascular health factors (blood pressure, total cholesterol, fasting blood glu-cose) in US adults �20 years by age and sex (A through F): National Health and Nutrition Examination Surveys 2003 to 2008.
Shay et al Prevalence of CV Health in US Adults 53
by guest on July 13, 2018http://circ.ahajournals.org/
Dow
nloaded from

Large proportions of US adults with poor and intermediateCV disease health factors (ie, blood pressure, total cholesterol,and blood glucose) are untreated or are receiving treatmentbut remain uncontrolled. These individuals represent a sub-stantial target population in which increases in prevalenceand effectiveness of pharmacological treatment may be aneffective approach for improving CV health. Although treatedadults cannot be (by definition) categorized as having idealCV health, substantial improvements in poor and intermedi-ate CV health factors could be achieved with effectivetreatment. For example, in adults with intermediate bloodpressure (a group representing a significant proportion of theUS adult population) mean treated systolic blood pressurewas �10 mm Hg lower than untreated systolic blood pres-sure. These current estimates indicate reasonable blood pres-sure control with treatment and it is therefore alarming thatthe majority of adults with intermediate CV health factors arenot receiving any pharmacological treatment. Consideringthese findings, a substantial need exists for interventionsaimed at increasing the prevalence of treatment in adults withintermediate and poor CV health factors. Furthermore, youngadults constitute the greatest proportions of untreated adultswith poor and intermediate CV health factors, which is anindication that significant public health action is needed toincrease the prevalence of treatment for CV health factorsexists in this age group. Among adults with treated CV healthfactors, a substantial need also exists for improvements in theprevalence of those treated to goal levels. Although lifestylemodification is often a preferred option for initial treatment ofunfavorable clinical CV risk factors, adjunct lifestyle anddrug treatment at earlier ages could reduce the duration ofexposure to CV risk and would likely result in lower CVdisease/coronary heart disease event rates in middle and olderages.
Because many past voluntary and individual-level effortsto improve aspects of CV health in the US population—particularly efforts for behavioral change—have been unsuc-cessful, public health policy changes may be a more effectiveapproach to assist in choosing healthier options. Examples ofsuccessful programs include indoor smoking bans26,27 andstate-regulated seat belt laws.28,29 The strikingly low preva-lence of ideal Healthy Diet Scores is an indication that thisCV health component requires direct targeting efforts. Theextensive evidence of a direct causal association betweendietary intake and CV disease risk13,30,31 further supports theconcept that population-based improvements in dietary qual-ity are a promising strategy to achieve progress toward theAHA 2020 Strategic Impact Goals. Broad population-leveldietary strategies have great potential for affecting largenumbers of people and targeting specific aspects of dietaryintake, which will directly influence CV risk. Recentlyproposed strategies include the institution of progressivemodification toward more favorable levels of nutrients andfoods, including sodium, whole grains, and potassium;32
these nutrients and foods are shown in the present study to bethe least prevalent components of the AHA’s Healthy DietScore for adults in all age groups to achieve. In 2003, thisapproach was implemented in the United Kingdom, whereindependent government agencies responsible for food safety
initiated changes in the sodium content of certain foodsthrough direct cooperation with food manufacturers. Suchefforts have resulted in an average reduction in sodium intakeby 360 mg/d in a 4-year period.33 Relatively gradual adjust-ments to the nutrient content of target items in the food supplycould result in changes that are nearly imperceptible toconsumers but would have a major impact on CV risk at thepopulation level. If sodium intake could be gradually reducedby 1200 mg/d in the US population, such a reduction wouldhave a beneficial influence on major CV disease risk factors,especially blood pressure, and is estimated to result in a 50%reduction in the annual number of new cases of coronaryheart disease, a 48.5% reduction in stroke cases, a 54.5%reduction in myocardial infarction cases, and a 47.8% reduc-tion in annual number of deaths resulting from any cause.34
Our findings should be interpreted in light of some limi-tations. Although NHANES is a complex, multistage proba-bility sample of the civilian noninstitutionalized population ofthe United States, these data are cross-sectional and do notrepresent changes in single individuals over time. TheNHANES measures of physical activity, smoking, and di-etary consumption examined for the present investigationwere self-reported; thus, the possibility of misclassificationexists. Physical activity and dietary questionnaires have beenshown to be valuable in indicating conditions in which animprovement would be beneficial and in monitoring popula-tion prevalence.35
It is also important to note that only participants withcomplete data for all 7 components of CV health wereincluded in prevalence estimates for the number of ideal CVhealth factors. According to NHANES protocols, fastingblood glucose is selected from a random subsample ofparticipants, and although proper sampling methodology isused to ensure national representation, fewer than one third ofparticipants have information for this CV health component.Despite attempts to ensure unbiased sampling, participantswith incomplete interview or examination data tended to beyounger and more frequently non-Hispanic black and exhib-ited higher systolic blood pressure and total cholesterol, andthese characteristics that may have biased these specificprevalence estimates toward apparent health.
Finally, because of the low prevalence of ideal CV health andmany of its individual components, participant data from mul-tiple NHANES examinations were combined for this report,which raises the possibility that changes in the prevalence ratesmay have occurred over the 6-year time period examined.Although it was necessary to combine multiple cycles ofNHANES examinations to increase the nationally representativenature of the prevalence estimates and to have sufficient num-bers of participants to estimate prevalence of all CV healthcomponents, we acknowledge that subtle indications of changesover time were observed. Most notable was the significantlyhigher prevalence of ideal physical activity levels in 2007 to2008 compared with earlier examination years. Although assess-ment of self-reported moderate and vigorous physical activitywas performed in all cycles examined, the differences in phys-ical activity levels across cycles may be due in part to improve-ments in the instruments used in the 2007 to 2008 NHANESquestionnaires. For other CV components, prevalence estimates
54 Circulation January 3/10, 2012
by guest on July 13, 2018http://circ.ahajournals.org/
Dow
nloaded from

for Healthy Diet Scores and blood pressure remained stable,prevalence estimates for adults with ideal smoking status in-creased slightly, and ideal levels of BMI, total cholesterol, andblood glucose decreased slightly across examinations. Thesesubtle changes may indicate worsening trends in obesity, dys-glycemia, and hypercholesterolemia but are accompanied byfavorable trends in physical activity levels and smoking, influ-ences that (when combined) would likely have little influence onthe prevalence estimates of overall ideal CV health.
ConclusionsThe prevalence of ideal levels of CV health behaviors andfactors as recommended by the AHA 2020 Strategic ImpactGoals is low and inversely associated with age, whereas thecorresponding levels of poor and intermediate health are unac-ceptably high. These estimates represent a starting point for thecurrent prevalence of CV health from which the effectiveness ofprograms guided by the AHA 2020 Strategic Impact Goals andtheir influence on population rates of CV disease can bemonitored and compared. The fact that all components of CVhealth are modifiable through treatment and lifestyle shouldgenerate optimism for the new strategic directions for the AHAin its research, clinical, public health, and advocacy programs forCV health promotion and disease prevention.
AcknowledgmentsThe findings and conclusions in this report are those of the authorsand do not necessarily represent the official position of the Centersfor Disease Control and Prevention.
Sources of FundingThis study was supported by grant T32 HL 069771-07 from theNational Heart, Lung, and Blood Institute (principal investigator, DrDaviglus).
DisclosuresNone.
References1. Lloyd-Jones DM, Hong Y, Labarthe D, Mozaffarian D, Appel LJ, Van
Horn L, Greenlund K, Daniels S, Nichol G, Tomaselli GF, Arnett DK,Fonarow GC, Ho PM, Lauer MS, Masoudi FA, Robertson RM, Roger V,Schwamm LH, Sorlie P, Yancy CW, Rosamond WD; American HeartAssociation Strategic Planning Task Force and Statistics Committee.Defining and setting national goals for cardiovascular health pro-motion and disease reduction: the American Heart Association’sstrategic impact goal through 2020 and beyond. Circulation. 2010;121:586 – 613.
2. 2008 Physical Activity Guidelines for Americans. Washington, DC: USDepartment of Health and Human Services; 2008.
3. The DASH Diet. Dietary approaches to stop hypertension. LippincottsPrimary Care Practice. 1998;2:536–538.
4. Folsom AR, Yatsuya H, Nettleton JA, Lutsey PL, Cushman M,Rosamond WD. Community prevalence of ideal cardiovascular health,by the American Heart Association definition, and relationship withcardiovascular disease incidence. J Am Coll Cardiol. 2011;57:1690 –1696.
5. Centers for Disease Control and Prevention. National Health andNutrition Examination Survey Data. Hyattsville, MD: National Center forHealth Statistics (NCHS). 2003–2008.
6. Werko L. End of the road for the diet-heart theory? Scand Cardiovasc J.2008;42:250–255.
7. Britten P, Marcoe K, Yamini S, Davis C. Development of food intakepatterns for the MyPyramid Food Guidance System. J Nutr Educ Behav.2006;38(suppl):S78–S92.
8. Executive summary of the Third Report of the National CholesterolEducation Program (NCEP) Expert Panel on Detection, Evaluation, andTreatment of High Blood Cholesterol in Adults (Adult Treatment PanelIII). JAMA. 2001;285:2486–2497.
9. Executive summary: standards of medical care in diabetes—2011.Diabetes Care. 2011;34(suppl 1):S4–S10.
10. Chobanian AV, Bakris GL, Black HR, Cushman WC, Green LA, Izzo JLJr, Jones DW, Materson BJ, Oparil S, Wright JT Jr, Roccella EJ. TheSeventh Report of the Joint National Committee on Prevention,Detection, Evaluation, and Treatment of High Blood Pressure: the JNC 7report. JAMA. 2003;289:2560–2572.
11. Rose G. The Strategy of Preventive Medicine. Oxford, UK: OxfordUniversity Press; 1992.
12. Whelton PK, Brancati FL. Hypertension management in populations. ClinExp Hypertens. 1993;15:1147–1156.
13. Stamler J. Established major coronary risk factors. In: Marmot M, ElliottP, eds. Coronary Heart Disease Epidemiology: From Aetiology to PublicHealth. New York, NY: Oxford University Press; 1992:35–66.
14. Bambs C, Kip KE, Dinga A, Mulukutla SR, Aiyer AN, Reis SE. Lowprevalence of “ideal cardiovascular health” in a community-based popu-lation: the Heart Strategies Concentrating on Risk Evaluation (HeartSCORE) study. Circulation. 2011;123:850–857.
15. Physical activity guidelines for Americans. Okla Nurse. 2008;53:25.16. Knoops KT, de Groot LC, Kromhout D, Perrin AE, Moreiras-Varela O,
Menotti A, van Staveren WA. Mediterranean diet, lifestyle factors, and10-year mortality in elderly European men and women: the HALE proj-ect. JJAMA. 2004;292:1433–1439.
17. Hu FB, Manson JE, Stampfer MJ, Colditz G, Liu S, Solomon CG, WillettWC. Diet, lifestyle, and the risk of type 2 diabetes mellitus in women.N Engl J Med. 2001;345:790–797.
18. The 2004 United States Surgeon General’s Report: The health conse-quences of smoking. N S W Public Health Bull. 2004;15:107.
19. Stampfer MJ, Hu FB, Manson JE, Rimm EB, Willett WC. Primaryprevention of coronary heart disease in women through diet and lifestyle.N Engl J Med. 2000;343:16–22.
20. Akesson A, Weismayer C, Newby PK, Wolk A. Combined effect oflow-risk dietary and lifestyle behaviors in primary prevention ofmyocardial infarction in women. Arch Intern Med. 2007;167:2122–2127.
21. Chiuve SE, McCullough ML, Sacks FM, Rimm EB. Healthy lifestylefactors in the primary prevention of coronary heart disease among men:Benefits among users and nonusers of lipid-lowering and antihyper-tensive medications. Circulation. 2006;114:160–167.
22. Chiuve SE, Rexrode KM, Spiegelman D, Logroscino G, Manson JE,Rimm EB. Primary prevention of stroke by healthy lifestyle. Circulation.2008;118:947–954.
23. Mozaffarian D, Kamineni A, Carnethon M, Djousse L, Mukamal KJ,Siscovick D. Lifestyle risk factors and new-onset diabetes mellitus inolder adults: the Cardiovascular Health Study. Arch Intern Med. 2009;169:798–807.
24. US Department of Health and Human Services and US Department ofAgriculture. Dietary Guidelines for Americans, 2005. 6th ed. Wash-ington, DC: US Government Printing Office; 2005.
25. Clinical Guidelines on the Identification, Evaluation, and Treatment ofOverweight and Obesity in Adults. Bethesda, MD: National Heart, Lung,and Blood Institute; 1998.
26. Samet JM. Smoking bans prevent heart attacks. Circulation. 2006;114:1450–1451.
27. Sargent RP, Shepard RM, Glantz SA. Reduced incidence of admissionsfor myocardial infarction associated with public smoking ban: Before andafter study. BMJ. 2004;328:977–980.
28. Vital signs: Nonfatal, motor vehicle-occupant injuries (2009) and seat beltuse (2008) among adults: United States. MMWR Morb Mortal Wkly Rep.2011;59:1681–1686.
29. Dinh-Zarr TB, Sleet DA, Shults RA, Zaza S, Elder RW, Nichols JL,Thompson RS, Sosin DM. Reviews of evidence regarding inter-ventions to increase the use of safety belts. Am J Prev Med. 2001;21:48 – 65.
30. Kromhout D, Menotti A, Kesteloot H, Sans S. Prevention of coronaryheart disease by diet and lifestyle: evidence from prospective cross-cultural, cohort, and intervention studies. Circulation. 2002;105:893–898.
31. Report of the Dietary Guidelines Advisory Committee dietary guidelinesfor Americans, 1995. Nutr Rev. 1995;53:376–379.
Shay et al Prevalence of CV Health in US Adults 55
by guest on July 13, 2018http://circ.ahajournals.org/
Dow
nloaded from

32. Institute of Medicine. A Population-Based Policy and Systems ChangeApproach to Prevent and Control Hypertension. Washington, DC:National Academics Press; 2010.
33. He FJ, MacGregor GA. A comprehensive review on salt and health andcurrent experience of worldwide salt reduction programmes. J HumHypertens. 2009;23:363–384.
34. Bibbins-Domingo K, Chertow GM, Coxson PG, Moran A, LightwoodJM, Pletcher MJ, Goldman L. Projected effect of dietary saltreductions on future cardiovascular disease. N Engl J Med. 2010;362:590 –599.
35. Shephard RJ. Limits to the measurement of habitual physical activity byquestionnaires. Br J Sports Med. 2003;37:197–206.
CLINICAL PERSPECTIVEThe American Heart Association has committed to the goal of improving the cardiovascular health of all Americans by20% by the year 2020. In this article, we estimate the current status of cardiovascular health in the United States accordingto age, sex, and race/ethnicity groups. These data highlight the very high prevalence of unfavorable lifestyle (eg, adversediet and physical activity trends contributing to epidemic obesity, ongoing smoking) and environmental factors (eg, excesssodium in the food supply) in the United States and the resulting adverse distributions of key health factors such as bloodglucose, total cholesterol, and blood pressure. Clearly, both public health policy initiatives and renewed emphasis onindividual patient behavior change are needed to improve the adverse levels of cardiovascular health. These estimates mayassist clinicians and policymakers in identifying components of cardiovascular health that currently need improvement inspecific patient populations. Data suggest that improvements in even a single component (such as through weight loss ormodest increases in physical activity) can result in enhancements in multiple other aspects of cardiovascular health. Thus,clinical emphasis on taking components of cardiovascular health 1 step forward from poor to intermediate health throughlifestyle and/or medication use or from intermediate to ideal health through lifestyle can result in important benefits for theindividual and substantial shifts in the population burden of disease resulting in greater achievement of healthy longevity.Clinicians and patients can assess their personal cardiovascular health and receive advice on improving it from theAmerican Heart Association at www.mylifecheck.org.
56 Circulation January 3/10, 2012
by guest on July 13, 2018http://circ.ahajournals.org/
Dow
nloaded from

Chiuve, Kurt J. Greenlund, Martha L. Daviglus and Donald M. Lloyd-JonesChristina M. Shay, Hongyan Ning, Norrina B. Allen, Mercedes R. Carnethon, Stephanie E.
2008−Health and Nutrition Examination Surveys (NHANES) 2003 Status of Cardiovascular Health in US Adults: Prevalence Estimates From the National
Print ISSN: 0009-7322. Online ISSN: 1524-4539 Copyright © 2011 American Heart Association, Inc. All rights reserved.
is published by the American Heart Association, 7272 Greenville Avenue, Dallas, TX 75231Circulation doi: 10.1161/CIRCULATIONAHA.111.035733
2012;125:45-56; originally published online November 17, 2011;Circulation.
http://circ.ahajournals.org/content/125/1/45World Wide Web at:
The online version of this article, along with updated information and services, is located on the
http://circ.ahajournals.org/content/suppl/2011/11/17/CIRCULATIONAHA.111.035733.DC1Data Supplement (unedited) at:
http://circ.ahajournals.org//subscriptions/
is online at: Circulation Information about subscribing to Subscriptions:
http://www.lww.com/reprints Information about reprints can be found online at: Reprints:
document. Permissions and Rights Question and Answer this process is available in the
click Request Permissions in the middle column of the Web page under Services. Further information aboutOffice. Once the online version of the published article for which permission is being requested is located,
can be obtained via RightsLink, a service of the Copyright Clearance Center, not the EditorialCirculationin Requests for permissions to reproduce figures, tables, or portions of articles originally publishedPermissions:
by guest on July 13, 2018http://circ.ahajournals.org/
Dow
nloaded from
1
SUPPLEMENTAL MATERIALS
STATUS OF CARDIOVASCULAR HEALTH IN U.S. ADULTS:
PREVALENCE ESTIMATES FROM THE NATIONAL HEALTH AND NUTRITION
EXAMINATION SURVEYS (NHANES) 2003-2008
Christina M Shay PhD MA, Hongyan Ning MD MS, Norrina B Allen PhD MPH,
Mercedes R Carnethon PhD, Stephanie E Chiuve ScD, Kurt J Greenlund PhD,
Martha L Daviglus MD PhD, Donald M Lloyd-Jones MD ScM
SUPPLEMENTAL TABLES
Supplemental Table 1. Characteristics and Prevalence of Cardiovascular Health Behaviors and
Factors in Non-Hispanic White U.S. WOMEN by Age Group: National Health and Nutrition
Examination Surveys 2003-2008
Supplemental Table 2. Characteristics and Prevalence of Cardiovascular Health Behaviors and
Factors in Non-Hispanic Black U.S. WOMEN by Age Group: National Health and Nutrition
Examination Surveys 2003-2008
Supplemental Table 3. Characteristics and Prevalence of Cardiovascular Health Behaviors and
Factors in Mexican American U.S. WOMEN by Age Group: National Health and Nutrition
Examination Surveys 2003-2008

2
Supplemental Table 4. Characteristics and Prevalence of Cardiovascular Health Behaviors and
Factors in Non-Hispanic White U.S. MEN by Age Group: National Health and Nutrition
Examination Surveys 2003-2008
Supplemental Table 5. Characteristics and Prevalence of Cardiovascular Health Behaviors and
Factors in Non-Hispanic Black U.S. MEN by Age Group: National Health and Nutrition
Examination Surveys 2003-2008
Supplemental Table 6. Characteristics and Prevalence of Cardiovascular Health Behaviors and
Factors in Mexican American U.S. MEN by Age Group: National Health and Nutrition
Examination Surveys 2003-2008
SUPPLEMENTAL FIGURES
Supplemental Figure 1. Number of Ideal Cardiovascular Health Components in Non-Hispanic
White U.S. WOMEN by > 20 Years by Age Group: National Health and Nutrition Examination
Surveys 2003-2008
Supplemental Figure 2. Number of Ideal Cardiovascular Health Components in Non-Hispanic
Black U.S. WOMEN > 20 Years by Age Group: National Health and Nutrition Examination
Surveys 2003-2008

3
Supplemental Figure 3. Number of Ideal Cardiovascular Health Components in Mexican
American U.S. WOMEN > 20 Years by Age Group: National Health and Nutrition Examination
Surveys 2003-2008
Supplemental Figure 4. Number of Ideal Cardiovascular Health Components in Non-Hispanic
White U.S. MEN by > 20 Years by Age Group: National Health and Nutrition Examination
Surveys 2003-2008
Supplemental Figure 5. Number of Ideal Cardiovascular Health Components in Non-Hispanic
Black U.S. MEN > 20 Years by Age Group: National Health and Nutrition Examination Surveys
2003-2008
Supplemental Figure 6. Number of Ideal Cardiovascular Health Components in Mexican
American U.S. MEN > 20 Years by Age Group: National Health and Nutrition Examination
Surveys 2003-2008

4
Supplemental Table 1. Characteristics and Prevalence of Cardiovascular Health Behaviors and Factors in Non-Hispanic
White U.S. WOMEN by Age Group: National Health and Nutrition Examination Surveys 2003-2008
Characteristics
Young Age
20-39 years
(n=925)
Middle Age
40-64 years
(n=1,375)
Older Age
65+ years
(n=1,230)
Percent
Prevalence
(95% C.I.)
Population
Estimates
(millions)
Percent
Prevalence
(95% C.I.)
Population
Estimates
(millions)
Percent
Prevalence
(95% C.I.)
Population
Estimates
(millions)
Educational Attainment
<High school 9.8 (7.0-12.6) 2.3 9.4 (6.6-12.1) 3.3 24.8 (20.2-29.4) 4.2
High school graduate 21.7 (18.2-25.2) 5.0 26.5 (23.7-29.3) 9.3 35.7 (33.1-38.4) 6.0
> High school 68.5 (64.0-72.9) 15.8 64.1 (59.9-68.3) 22.4 39.5 (35.4-43.5) 6.7
Annual income
<$45,000 43.8 (39.8-47.8) 8.6 38.4 (33.8-42.9) 11.0 72.3 (67.7-76.8) 11.2
> $45,000 56.2 (52.2-60.2) 11.0 61.6 (57.1-66.2) 17.7 27.7 (23.2-32.3) 4.3
Smoking Status (n=925) (n=1,375) (n=1,230)

5
Poor 32.4 (28.8-36.1) 7.5 22.6 (19.7-25.5) 7.9 8.7 (7.1-10.2) 1.5
Intermediate 4.7 (3.5-5.8) 1.1 2.3 (1.5-3.2) 0.8 1.0 (0.5-1.6) 0.2
Ideal 62.9 (58.9-66.9) 14.5 75.1 (72.2-77.9) 26.3 90.3 (88.8-91.9) 15.3
Body Mass Index (n=917) (n=1,352) (n=1,193)
Poor 27.5 (23.2-31.7) 6.3 37.3 (34.4-40.3) 12.9 28.7 (26.0-31.5) 4.7
Intermediate 22.0 (19.0-24.9) 5.0 27.1 (24.1-30.1) 9.3 36.9 (33.4-40.3) 6.0
Ideal 50.6 (45.6-55.6) 11.6 35.5 (31.9-39.1) 12.2 34.4 (31.0-37.9) 5.6
Physical Activity Level (n=925) (n=1,375) (n=1,230)
Poor 21.2 (18.2-24.3) 4.9 29.5 (25.9-33.1) 10.3 49.7 (45.7-53.6) 8.4
Intermediate 23.8 (20.4-27.2) 5.5 25.4 (22.8-28.0) 8.9 22.0 (19.4-24.6) 3.7
Ideal 55.0 (50.4-59.6) 12.7 45.1 (41.4-48.8) 15.8 28.4 (24.7-32.0) 4.8
Healthy Diet Score (n=925) (n=1,375) (n=1,230)
Poor 83.1 (80.4-85.7) 16.1 70.5 (66.3-74.7) 22.6 61.1 (58.0-64.2) 9.2
Intermediate 16.6 (13.9-19.3) 3.2 28.7 (24.5-32.9) 9.2 36.5 (33.6-39.4) 5.5
Ideal 0.3 (0.0-0.7) <0.1 0.8 (0.4-1.3) 0.3 2.4 (1.6-3.3) 0.4
Total Cholesterol (n=857) (n=1,329) (n=1,152)

6
Poor 9.2 (7.4-11.0) 2.0 21.3 (18.9-23.7) 7.2 22.2 (19.4-25.0) 3.5
Intermediate 23.0 (20.2-25.8) 4.9 43.9 (41.6-46.2) 14.9 55.3 (52.7-58.0) 8.8
Ideal 67.8 (64.6-71.0) 14.5 34.8 (31.7-37.8) 11.8 22.5 (20.0-24.9) 3.6
Blood Pressure (n=838) (n=1,263) (n=1,110)
Poor 1.3 (0.5-2.1) 0.3 15.5 (13.6-17.3) 4.9 40.4 (37.3-43.4) 6.2
Intermediate 19.0 (15.4-22.6) 4.0 45.8 (43.1-48.4) 14.6 47.2 (44.0-50.4) 7.3
Ideal 79.7 (76.1-83.3) 16.8 38.8 (35.8-41.8) 12.4 12.5 (9.9-15.0) 1.9
Fasting Blood Glucose (n=237) (n=374) (n=310)
Poor 1.2 (0.0-2.7) 0.2 4.2 (2.3-6.1) 1.0 16.6 (11.8-21.4) 1.7
Intermediate 10.9 (7.1-14.8) 1.6 29.3 (23.5-35.1) 7.0 40.3 (34.0-46.5) 4.2
Ideal 87.8 (83.6-92.1) 13.1 66.5 (60.2-72.7) 15.8 43.1 (37.0-49.3) 4.5
Percentages may not equal 100% due to rounding. Population estimates may not be equal across groups due to unavailable data.

7
Supplemental Table 2. Characteristics and Prevalence of Cardiovascular Health Behaviors and Factors in Non-Hispanic
Black U.S. WOMEN by Age Group: National Health and Nutrition Examination Surveys 2003-2008
Characteristics
Young Age
20-39 years
(n=514)
Middle Age
40-64 years
(n=728)
Older Age
65+ years
(n=331)
Percent
Prevalence
(95% C.I.)
Population
Estimates
(millions)
Percent
Prevalence
(95% C.I.)
Population
Estimates
(millions)
Percent
Prevalence
(95% C.I.)
Population
Estimates
(millions)
Educational Attainment
<High school 20.4 (16.5-24.2) 1.0 23.9 (20.0-27.8) 1.4 54.5 (48.6-60.4) 1.0
High school graduate 23.1 (19.3-26.9) 1.2 22.8 (19.3-26.4) 1.3 19.4 (15.1-23.6) 0.3
> High school 56.6 (51.4-61.7) 2.9 53.2 (49.2-57.2) 3.1 26.1 (21.5-30.8) 0.5
Annual income
<$45,000 65.2 (59.9-70.6) 3.0 59.4 (53.0-65.7) 3.0 78.5 (72.0-85.0) 1.3
> $45,000 34.8 (29.4-40.1) 1.6 40.6 (34.3-47.0) 2.1 21.5 (15.0-28.0) 0.4
Smoking Status (n=514) (n=728) (n=331)

8
Poor 20.7 (16.9-24.6) 1.0 24.7 (20.6-28.8) 1.4 8.4 (5.3-11.5) 0.1
Intermediate 1.4 (0.3-2.6) 0.1 2.3 (1.2-3.3) 0.1 1.5 (0.1-2.9) 0.0
Ideal 77.8 (73.9-81.8) 3.9 73.1 (69.0-77.2) 4.2 90.1 (86.8-93.4) 1.6
Body Mass Index (n=508) (n=718) (n=309)
Poor 48.5 (44.5-52.5) 2.4 54.3 (50.8-57.8) 3.1 52.7 (47.4-58.1) 0.9
Intermediate 26.6 (22.9-30.3) 1.3 28.4 (25.0-31.8) 1.6 25.7 (21.0-30.3) 0.4
Ideal 24.9 (21.4-28.3) 1.2 17.3 (14.5-20.1) 1.0 21.6 (17.5-25.7) 0.4
Physical Activity Level (n=514) (n=728) (n=331)
Poor 37.0 (32.9-41.1) 1.9 46.5 (43.1-49.8) 2.7 64.5 (58.4-70.6) 1.2
Intermediate 20.9 (16.8-24.9) 1.1 22.3 (19.4-25.2) 1.3 16.6 (11.6-21.6) 0.3
Ideal 42.1 (37.4-46.8) 2.1 31.2 (27.7-34.7) 1.8 18.9 (14.3-23.6) 0.3
Healthy Diet Score (n=514) (n=728) (n=331)
Poor 88.9 (85.4-92.3) 3.7 80.2 (76.8-83.6) 4.0 57.6 (51.7-63.6) 0.8
Intermediate 10.9 (7.4-14.3) 0.5 18.2 (14.8-21.5) 0.9 40.4 (34.3-46.5) 0.6
Ideal 0.2 (0.2-0.3) <0.1 1.6 (0.8-2.5) 0.1 2.0 (0.5-3.4) <0.1
Total Cholesterol (n=458) (n=653) (n=228)

9
Poor 5.2 (2.8-7.7) 0.2 15.8 (13.4-18.3) 0.8 21.8 (16.3-27.3) 0.3
Intermediate 22.2 (18.6-25.8) 1.0 40.3 (37.3-43.2) 2.1 46.7 (39.5-53.9) 0.7
Ideal 72.6 (68.2-77.0) 3.3 43.9 (40.7-47.0) 2.3 31.5 (25.0-38.0) 0.5
Blood Pressure (n=458) (n=643) (n=287)
Poor 6.7 (4.3-9.2) 0.3 27.6 (24.4-30.8) 1.4 46.5 (39.5-53.5) 0.7
Intermediate 26.2 (22.5-29.8) 1.2 47.3 (42.9-51.7) 2.4 49.1 (41.2-56.9) 0.7
Ideal 67.1 (63.0-71.2) 3.0 25.2 (20.6-29.7) 1.3 4.4 (2.1-6.8) 0.1
Fasting Blood Glucose (n=134) (n=176) (n=78)
Poor 1.1 (0.0-3.3) 0.0 10.9 (6.5-15.3) 0.4 19.3 (12.3-26.3) 0.2
Intermediate 14.7 (7.6-21.7) 0.5 35.9 (29.7-42.2) 1.3 39.6 (29.0-50.2) 0.5
Ideal 84.3 (76.4-92.1) 2.7 53.2 (46.0-60.3) 2.0 41.1 (31.3-50.9) 0.5
Percentages may not equal 100% due to rounding. Population estimates may not be equal across groups due to unavailable data.

10
Supplemental Table 3. Characteristics and Prevalence of Cardiovascular Health Behaviors and Factors in Mexican American
U.S. WOMEN by Age Group: National Health and Nutrition Examination Surveys 2003-2008
Characteristics
Young Age
20-39 years
(n=458)
Middle Age
40-64 years
(n=558)
Older Age
65+ years
(n=274)
Percent
Prevalence
(95% C.I.)
Population
Estimates
(millions)
Percent
Prevalence
(95% C.I.)
Population
Estimates
(millions)
Percent
Prevalence
(95% C.I.)
Population
Estimates
(millions)
Educational Attainment
<High school 44.0 (38.4-49.7) 1.6 48.6 (43.3-54.0) 1.4 75.4 (71.0-79.8) 0.5
High school graduate 23.1 (19.4-26.7) 0.8 20.6 (16.0-25.3) 0.6 15.2 (10.7-19.7) 0.1
> High school 32.9 (26.6-39.2) 1.2 30.7 (26.6-34.9) 0.9 9.4 (5.4-13.3) 0.1
Annual income
<$45,000 69.1 (63.3-75.0) 2.3 62.0 (56.8-67.3) 1.5 83.9 (77.0-90.8) 0.5
> $45,000 30.9 (25.0-36.7) 1.0 38.0 (32.7-43.2) 0.9 16.1 (9.2-23.0) 0.1
Smoking Status (n=457) (n=558) (n=274)

11
Poor 12.3 (9.1-15.5) 0.4 15.2 (12.0-18.4) 0.4 9.5 (5.5-13.5) 0.1
Intermediate 4.0 (2.1-5.9) 0.1 1.7 (0.5-2.8) 0.0 0.0 (0.0-0.0) 0
Ideal 83.7 (79.8-87.6) 3.0 83.1 (79.7-86.5) 2.3 90.5 (86.5-94.5) 0.6
Body Mass Index (n=451) (n=459) (n=260)
Poor 37.8 (33.4-42.2) 1.3 49.3 (44.0-54.6) 1.4 37.8 (32.3-43.3) 0.2
Intermediate 31.0 (27.2-34.8) 1.1 31.1 (27.0-35.2) 0.9 35.8 (31.0-40.5) 0.2
Ideal 31.2 (26.4-36.0) 1.1 19.6 (16.1-23.1) 0.5 26.5 (22.0-30.9) 0.2
Physical Activity Level (n=458) (n=558) (n=274)
Poor 41.3 (34.9-47.7) 1.5 52.8 (46.7-58.9) 1.5 69.8 (63.0-76.6) 0.5
Intermediate 22.2 (16.9-27.6) 0.8 21.2 (17.2-25.2) 0.6 17.4 (11.9-23.0) 0.1
Ideal 36.5 (31.8-41.2) 1.3 26.0 (20.2-31.7) 0.7 12.8 (8.8-16.8) 0.1
Healthy Diet Score (n=458) (n=558) (n=274)
Poor 83.0 (79.9-86.2) 2.5 69.3 (63.6-74.9) 1.7 60.7 (54.1-67.2) 0.3
Intermediate 16.3 (13.1-19.4) 0.5 29.9 (24.3-35.4) 0.7 35.8 (29.1-42.4) 0.2
Ideal 0.7 (0.0-1.7) <0.1 0.9 (0.1-1.6) <0.1 3.6 (0.9-6.2) <0.1
Total Cholesterol (n=436) (n=539) (n=255)
12
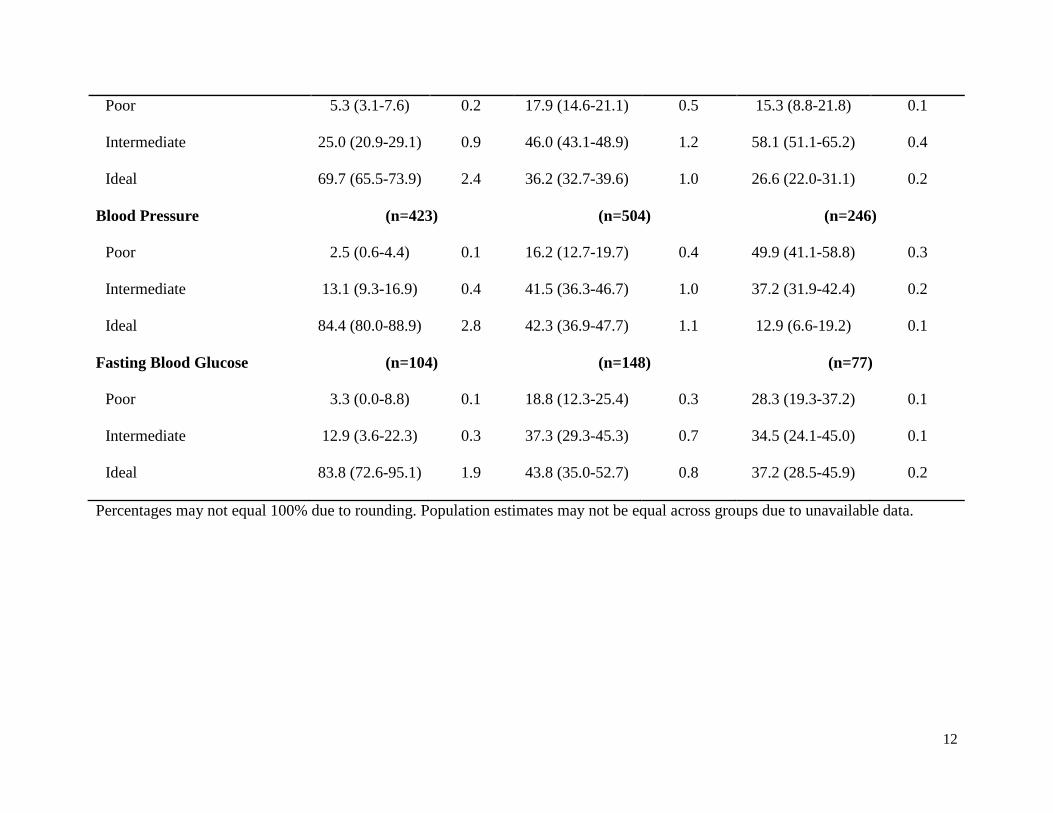
Poor 5.3 (3.1-7.6) 0.2 17.9 (14.6-21.1) 0.5 15.3 (8.8-21.8) 0.1
Intermediate 25.0 (20.9-29.1) 0.9 46.0 (43.1-48.9) 1.2 58.1 (51.1-65.2) 0.4
Ideal 69.7 (65.5-73.9) 2.4 36.2 (32.7-39.6) 1.0 26.6 (22.0-31.1) 0.2
Blood Pressure (n=423) (n=504) (n=246)
Poor 2.5 (0.6-4.4) 0.1 16.2 (12.7-19.7) 0.4 49.9 (41.1-58.8) 0.3
Intermediate 13.1 (9.3-16.9) 0.4 41.5 (36.3-46.7) 1.0 37.2 (31.9-42.4) 0.2
Ideal 84.4 (80.0-88.9) 2.8 42.3 (36.9-47.7) 1.1 12.9 (6.6-19.2) 0.1
Fasting Blood Glucose (n=104) (n=148) (n=77)
Poor 3.3 (0.0-8.8) 0.1 18.8 (12.3-25.4) 0.3 28.3 (19.3-37.2) 0.1
Intermediate 12.9 (3.6-22.3) 0.3 37.3 (29.3-45.3) 0.7 34.5 (24.1-45.0) 0.1
Ideal 83.8 (72.6-95.1) 1.9 43.8 (35.0-52.7) 0.8 37.2 (28.5-45.9) 0.2
Percentages may not equal 100% due to rounding. Population estimates may not be equal across groups due to unavailable data.

13
Supplemental Table 4. Characteristics and Prevalence of Cardiovascular Health Behaviors and Factors in Non-Hispanic
White U.S. MEN by Age Group: National Health and Nutrition Examination Surveys 2003-2008
Characteristics
Young Age
20-39 years
(n=1,057)
Middle Age
40-64 years
(n=1,397)
Older Age
65+ years
(n=1,273)
Percent
Prevalence
(95% C.I.)
Population
Estimates
(millions)
Percent
Prevalence
(95% C.I.)
Population
Estimates
(millions)
Percent
Prevalence
(95% C.I.)
Population
Estimates
(millions)
Educational Attainment
<High school 10.4 (7.4-13.4) 2.6 11.0 (8.2-13.9) 3.8 22.9 (18.6-27.2) 2.9
High school graduate 29.2 (25.3-33.1) 7.3 27.2 (24.5-29.8) 9.3 27.7 (23.8-31.7) 3.5
> High school 60.4 (54.8-66.0) 15.0 61.8 (57.4-66.2) 21.1 49.4 (43.5-55.3) 6.3
Annual income
<$45,000 39.3 (34.7-43.9) 8.4 32.8 (28.4-37.2) 9.1 63.7 (59.4-68.1) 7.4
> $45,000 60.7 (56.1-65.3) 12.9 67.2 (62.8-71.6) 18.6 36.3 (31.9-40.6) 4.2
Smoking Status (n=1,057) (n=1,397) (n=1,273)

14
Poor 38.3 (35.0-41.6) 9.6 27.1 (24.0-30.2) 9.3 7.5 (5.8-9.3) 1.0
Intermediate 5.5 (4.1-6.9) 1.4 2.1 (1.2-3.0) 0.7 1.7 (0.8-2.7) 0.2
Ideal 56.2 (53.1-59.2) 14.0 70.8 (67.7-73.9) 24.2 90.7 (88.7-92.8) 11.6
Body Mass Index (n=1,047) (n=1,380) (n=1,236)
Poor 26.0 (22.5-29.5) 6.4 37.0 (33.6-40.5) 12.5 31.1 (28.2-34.1) 3.9
Intermediate 35.5 (32.2-38.8) 8.8 42.2 (38.8-45.5) 14.2 44.9 (40.9-49.0) 5.6
Ideal 38.5 (35.3-41.8) 9.5 20.8 (18.2-23.4) 7.0 24.0 (21.3-26.6) 3.0
Physical Activity Level (n=1,057) (n=1,397) (n=1,273)
Poor 17.5 (14.2-20.8) 4.4 29.4 (25.7-33.1) 10.0 40.8 (37.6-44.0) 5.2
Intermediate 21.8 (19.1-24.5) 5.4 19.9 (17.2-22.5) 6.8 16.6 (14.1-19.0) 2.1
Ideal 60.7 (57.0-64.5) 15.1 50.8 (47.1-54.4) 17.3 42.6 (38.6-46.6) 5.5
Healthy Diet Score (n=1,057) (n=1,397) (n=1,273)
Poor 92.5 (90.2-94.9) 19.2 82.3 (80.0-84.5) 24.8 69.6 (67.1-72.0) 8.1
Intermediate 7.5 (5.1-9.8) 1.5 17.3 (15.1-19.4) 5.2 29.3 (27.1-31.5) 3.4
Ideal 0.0 (0.0-0.0) 0.0 0.5 (0.1-0.9) 0.1 1.1 (0.4-1.9) 0.1
Total Cholesterol (n=996) (n=1,348) (n=1,225)

15
Poor 10.8 (8.1-13.5) 2.5 20.1 (17.9-22.3) 6.6 9.1 (7.6-10.6) 1.1
Intermediate 27.6 (24.9-30.4) 6.5 45.0 (42.2-47.7) 14.9 55.0 (51.6-58.3) 6.8
Ideal 61.5 (58.5-64.6) 14.4 34.9 (31.9-38.0) 11.6 35.9 (32.6-39.2) 4.4
Blood Pressure (n=979) (n=1,318) (n=1,169)
Poor 7.3 (5.2-9.4) 1.7 18.5 (16.1-20.9) 5.9 31.1 (28.0-34.3) 3.7
Intermediate 41.5 (37.9-45.0) 9.6 52.4 (49.2-55.5) 16.8 52.6 (49.9-55.3) 6.3
Ideal 51.2 (47.0-55.5) 11.8 29.2 (26.3-32.0) 9.4 16.3 (13.0-19.5) 1.9
Fasting Blood Glucose (n=282) (n=391) (n=348)
Poor 1.7 (0.1-3.4) 0.3 7.9 (4.4-11.4) 1.8 16.3 (11.8-20.8) 1.4
Intermediate 25.4 (20.4-30.5) 4.3 44.4 (36.3-52.5) 9.9 53.0 (47.1-58.8) 4.4
Ideal 72.8 (67.6-78.0) 12.4 47.7 (39.8-55.5) 10.7 30.7 (26.2-35.2) 2.6
Percentages may not equal 100% due to rounding. Population estimates may not be equal across groups due to unavailable data.

16
Supplemental Table 5. Characteristics and Prevalence of Cardiovascular Health Behaviors and Factors in Non-Hispanic
Black U.S. MEN by Age Group: National Health and Nutrition Examination Surveys 2003-2008
Characteristics
Young Age
20-39 years
(n=557)
Middle Age
40-64 years
(n=658)
Older Age
65+ years
(n=316)
Percent
Prevalence
(95% C.I.)
Population
Estimates
(millions)
Percent
Prevalence
(95% C.I.)
Population
Estimates
(millions)
Percent
Prevalence
(95% C.I.)
Population
Estimates
(millions)
Educational Attainment
<High school 23.2 (18.9-27.6) 1.1 26.5 (22.6-30.3) 1.3 51.1 (44.0-58.2) 0.6
High school graduate 31.4 (26.9-36.0) 1.5 25.0 (21.6-28.4) 1.2 20.9 (15.2-26.5) 0.2
> High school 45.3 (39.8-50.8) 2.1 48.5 (44.2-52.8) 2.3 28.0 (21.6-34.4) 0.3
Annual income
<$45,000 57.2 (51.4-63.1) 2.4 52.6 (47.5-57.7) 2.2 75.0 (68.0-82.0) 0.8
> $45,000 42.8 (36.9-48.6) 1.8 47.4 (42.3-52.5) 2.0 25.0 (18.0-32.0) 0.3
Smoking Status (n=557) (n=658) (n=467)

17
Poor 30.0 (26.4-33.6) 1.4 35.8 (31.7-39.9) 1.7 20.7 (15.4-26.0) 0.2
Intermediate 2.8 (1.3-4.3) 0.1 2.5 (1.2-3.7) 0.1 2.4 (0.3-4.4) 0.0
Ideal 67.2 (63.4-71.0) 3.1 61.7 (57.4-66.0) 3.0 77.0 (72.0-81.9) 0.9
Body Mass Index (n=457) (n=646) (n=300)
Poor 35.5 (31.4-39.6) 1.6 36.7 (32.3-41.0) 1.7 34.9 (28.9-40.8) 0.4
Intermediate 31.2 (27.2-35.1) 1.4 36.5 (33.8-39.2) 1.7 36.1 (30.5-41.8) 0.4
Ideal 33.4 (28.5-38.3) 1.5 26.9 (22.6-31.1) 1.3 29.0 (23.2-34.7) 0.3
Physical Activity Level (n=557) (n=658) (n=316)
Poor 24.5 (21.0-28.0) 1.1 39.2 (34.8-43.7) 1.9 56.9 (52.5-61.4) 0.7
Intermediate 13.4 (11.1-15.6) 0.6 20.2 (16.8-23.7) 1.0 16.5 (13.2-19.7) 0.2
Ideal 62.1 (57.9-66.4) 2.9 40.6 (36.1-45.0) 1.9 26.6 (21.2-32.0) 0.3
Healthy Diet Score (n=557) (n=658) (n=316)
Poor 93.4 (91.1-95.7) 3.4 87.3 (83.6-91.0) 3.4 68.8 (62.8-74.8) 0.7
Intermediate 6.6 (4.3-8.9) 0.2 12.1 (8.5-15.6) 0.5 30.2 (24.3-36.1) 0.3
Ideal 0.0 (0.0-0.0) 0.0 0.6 (0.0-1.4) <0.1 1.0 (0.0-2.4) <0.1
Total Cholesterol (n=497) (n=598) (n=287)

18
Poor 8.2 (5.9-10.5) 0.3 14.0 (10.9-17.1) 0.6 9.5 (6.0-12.9) 0.1
Intermediate 25.5 (22.1-28.8) 1.0 42.5 (38.0-47.1) 1.8 49.5 (43.5-55.5) 0.5
Ideal 66.3 (62.7-70.0) 2.7 43.4 (38.6-48.3) 1.9 41.0 (33.9-48.2) 0.4
Blood Pressure (n=509) (n=591) (n=283)
Poor 10.5 (8.1-12.9) 0.4 30.0 (26.0-34.0) 1.3 39.0 (34.4-43.6) 0.4
Intermediate 46.0 (41.2-50.8) 2.0 47.3 (42.1-52.4) 2.0 50.9 (45.8-56.1) 0.5
Ideal 43.5 (38.4-48.6) 1.8 22.7 (17.5-27.9) 1.0 10.1 (6.3-13.8) 0.1
Fasting Blood Glucose (n=151) (n=141) (n=85)
Poor 4.0 (0.6-7.4) 0.1 12.4 (7.2-17.7) 0.3 24.5 (15.4-33.6) 0.2
Intermediate 18.5 (10.1-26.9) 0.6 39.6 (32.2-47.0) 1.1 37.0 (24.7-49.2) 0.3
Ideal 77.6 (70.5-84.7) 2.6 48.0 (40.8-55.2) 1.3 38.6 (26.7-50.5) 0.3
Percentages may not equal 100% due to rounding. Population estimates may not be equal across groups due to unavailable data.

19
Supplemental Table 6. Characteristics and Prevalence of Cardiovascular Health Behaviors and Factors in Mexican American
U.S. MEN by Age Group: National Health and Nutrition Examination Surveys 2003-2008
Characteristics
Young Age
20-39 years
(n=577)
Middle Age
40-64 years
(n=544)
Older Age
65+ years
(n=260)
Percent
Prevalence
(95% C.I.)
Population
Estimates
(millions)
Percent
Prevalence
(95% C.I.)
Population
Estimates
(millions)
Percent
Prevalence
(95% C.I.)
Population
Estimates
(millions)
Educational Attainment
<High school 53.1 (47.9-58.3) 2.9 55.1 (50.3-60.0) 1.6 73.6 (66.0-81.3) 0.4
High school graduate 25.7 (21.8-29.6) 1.4 15.7 (12.9-18.5) 0.5 10.6 (7.8-13.5) 0.1
> High school 21.2 (16.4-25.9) 1.2 29.1 (23.3-34.9) 0.9 15.7 (9.0-22.5) 0.1
Annual income
<$45,000 72.4 (67.6-77.2) 3.5 66.0 (61.7-70.3) 1.7 82.6 (76.4-88.8) 0.4
> $45,000 27.6 (22.8-32.4) 1.3 34.0 (29.7-38.3) 0.9 17.4 (11.2-23.6) 0.1
Smoking Status (n=577) (n=544) (n=260)

20
Poor 29.2 (26.3-32.2) 1.6 24.8 (21.2-28.5) 0.7 15.3 (12.0-18.7) 0.1
Intermediate 5.9 (4.1-7.7) 0.3 3.8 (2.1-5.4) 0.1 3.0 (0.0-6.0) 0.0
Ideal 64.9 (61.9-67.8) 3.6 71.4 (67.7-75.1) 2.1 81.7 (76.7-86.7) 0.4
Body Mass Index (n=570) (n=538) (n=253)
Poor 30.1 (25.1-35.1) 1.6 33.2 (28.0-38.4) 1.0 28.9 (22.0-35.8) 0.1
Intermediate 42.4 (38.1-46.8) 2.3 49.2 (45.7-52.7) 1.4 43.9 (37.6-50.2) 0.2
Ideal 27.5 (22.9-32.1) 1.5 17.6 (14.1-21.1) 0.5 27.2 (21.1-33.3) 0.1
Physical Activity Level (n=577) (n=544) (n=260)
Poor 36.0 (31.1-41.0) 2.0 45.5 (40.1-50.8) 1.3 60.8 (54.3-67.3) 0.3
Intermediate 15.9 (12.8-19.0) 0.9 13.3 (10.7-16.0) 0.4 14.7 (10.9-18.5) 0.1
Ideal 48.1 (42.5-53.7) 2.6 41.2 (36.6-45.8) 1.2 24.5 (18.1-30.8) 0.1
Healthy Diet Score (n=577) (n=544) (n=260)
Poor 93.2 (90.8-95.5) 3.9 89.6 (86.9-92.4) 2.2 74.3 (68.6-79.9) 0.3
Intermediate 6.8 (4.5-9.2) 0.3 10.2 (7.5-12.9) 0.2 25.3 (19.7-30.8) 0.1
Ideal 0.0 (0.0-0.0) 0 0.2 (0.0-0.5) <0.1 0.5 (0.0-1.0) <0.1
Total Cholesterol (n=541) (n=522) (n=249)

21
Poor 12.4 (9.7-15.0) 0.6 21.0 (16.8-25.2) 0.6 15.7 (11.0-20.4) 0.1
Intermediate 30.9 (26.9-34.8) 1.6 42.8 (37.7-47.9) 1.2 47.6 (39.9-55.2) 0.2
Ideal 56.8 (52.7-60.8) 2.9 36.1 (31.0-41.3) 1.0 36.7 (29.5-44.0) 0.2
Blood Pressure (n=529) (n=510) (n=241)
Poor 6.9 (5.4-8.5) 0.3 13.0 (10.4-15.7) 0.4 31.7 (25.4-37.9) 0.2
Intermediate 39.9 (34.6-45.1) 2.0 48.9 (44.0-53.7) 1.3 53.2 (46.8-59.6) 0.3
Ideal 53.2 (47.4-59.0) 2.7 38.1 (32.3-43.8) 1.1 15.1 (10.1-20.1) 0.1
Fasting Blood Glucose (n=153) (n=145) (n=83)
Poor 4.9 (1.2-8.5) 0.2 17.0 (10.4-23.7) 0.3 23.7 (12.7-34.7) 0.1
Intermediate 31.6 (23.4-39.8) 1.1 40.6 (36.3-45.0) 0.8 38.0 (27.9-48.1) 0.1
Ideal 63.5 (55.0-72.0) 2.3 42.4 (35.2-49.6) 0.8 38.3 (25.9-50.7) 0.1
Percentages may not equal 100% due to rounding. Population estimates may not be equal across groups due to unavailable data.

22
SUPPLEMENTAL FIGURE LEGENDS
Supplemental Figure 1. Number of Ideal Cardiovascular Health Components in Non-Hispanic White U.S. WOMEN by > 20 Years by
Age Group: National Health and Nutrition Examination Surveys 2003-2008
Supplemental Figure 2. Number of Ideal Cardiovascular Health Components in Non-Hispanic Black U.S. WOMEN > 20 Years by
Age Group: National Health and Nutrition Examination Surveys 2003-2008
Supplemental Figure 3. Number of Ideal Cardiovascular Health Components in Mexican American U.S. WOMEN > 20 Years by Age
Group: National Health and Nutrition Examination Surveys 2003-2008
Supplemental Figure 4. Number of Ideal Cardiovascular Health Components in Non-Hispanic White U.S. MEN by > 20 Years by
Age Group: National Health and Nutrition Examination Surveys 2003-2008
Supplemental Figure 5. Number of Ideal Cardiovascular Health Components in Non-Hispanic Black U.S. MEN > 20 Years by Age
Group: National Health and Nutrition Examination Surveys 2003-2008

23
Supplemental Figure 6. Number of Ideal Cardiovascular Health Components in Mexican American U.S. MEN > 20 Years by Age
Group: National Health and Nutrition Examination Surveys 2003-2008

24
Supplemental Figure 1. Number of Ideal Cardiovascular Health Components in Non-Hispanic White U.S. WOMEN by > 20 Years by
Age Group: National Health and Nutrition Examination Surveys 2003-2008
05
101520253035404550
0 1 2 3 4 5 6 7
Prev
alen
ce (%
)
Number of Ideal Cardiovascular Health Components
20-39 Years
40-64 Years
65+ Years

25
Supplemental Figure 2. Number of Ideal Cardiovascular Health Components in Non-Hispanic Black U.S. WOMEN > 20 Years by
Age Group: National Health and Nutrition Examination Surveys 2003-2008
05
101520253035404550
0 1 2 3 4 5 6 7
Prev
alen
ce (%
)
Number of Ideal Cardiovascular Health Components
20-39 Years
40-64 Years
65+ Years

26
Supplemental Figure 3. Number of Ideal Cardiovascular Health Components in Mexican American U.S. WOMEN > 20 Years by Age
Group: National Health and Nutrition Examination Surveys 2003-2008
05
101520253035404550
0 1 2 3 4 5 6 7
Prev
alen
ce (%
)
Number of Ideal Cardiovascular Health Components
20-39 Years
40-64 Years
65+ Years

27
Supplemental Figure 4. Number of Ideal Cardiovascular Health Components in Non-Hispanic White U.S. MEN by > 20 Years by
Age Group: National Health and Nutrition Examination Surveys 2003-2008
05
101520253035404550
0 1 2 3 4 5 6 7
Prev
alen
ce (%
)
Number of Ideal Cardiovascular Health Components
20-39 Years
40-64 Years
65+ Years

28
Supplemental Figure 5. Number of Ideal Cardiovascular Health Components in Non-Hispanic Black U.S. MEN > 20 Years by Age
Group: National Health and Nutrition Examination Surveys 2003-2008
05
101520253035404550
0 1 2 3 4 5 6 7
Prev
alen
ce (%
)
Number of Ideal Cardiovascular Health Components
20-39 Years
40-64 Years
65+ Years

29
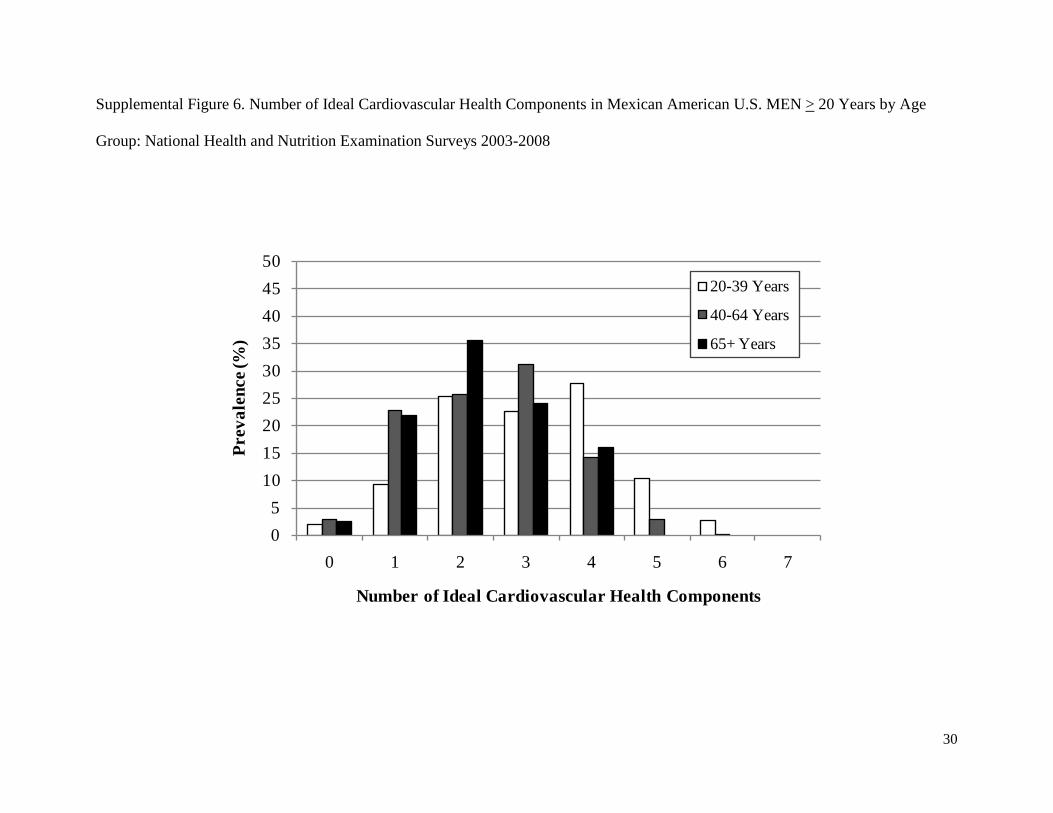
30
Supplemental Figure 6. Number of Ideal Cardiovascular Health Components in Mexican American U.S. MEN > 20 Years by Age
Group: National Health and Nutrition Examination Surveys 2003-2008
05
101520253035404550
0 1 2 3 4 5 6 7
Prev
alen
ce (%
)
Number of Ideal Cardiovascular Health Components
20-39 Years
40-64 Years
65+ Years