status of and prospects for smallholder milk production
TRANSCRIPT
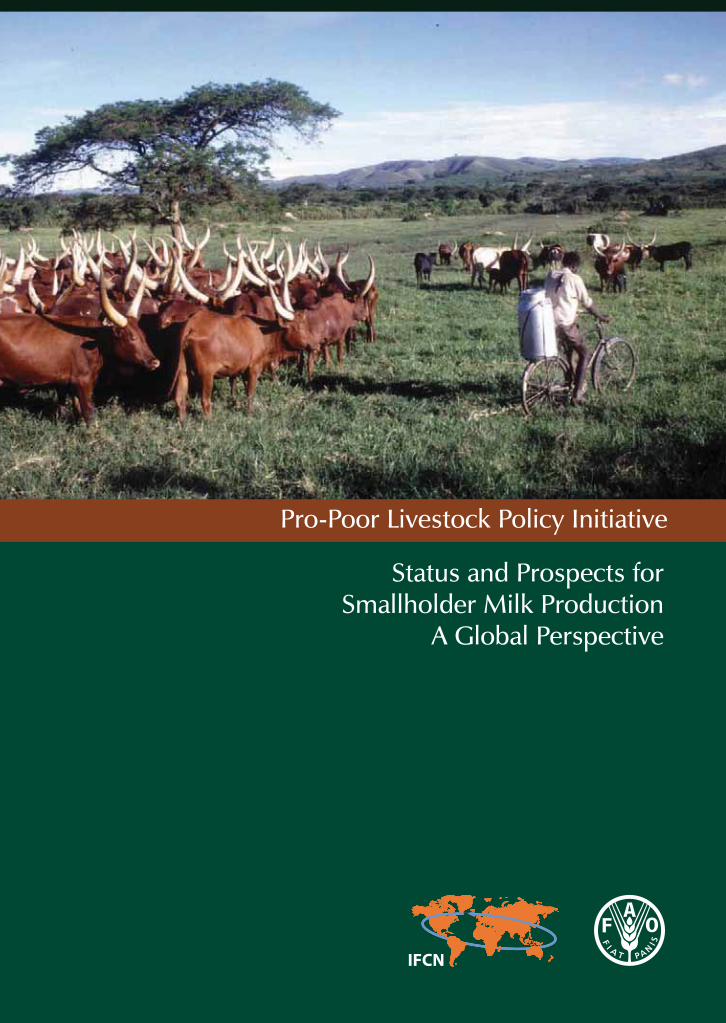
Status and Prospects forSmallholder Milk Production
A Global Perspective
Pro-Poor Livestock Policy Initiative


A Living from Livestock
Pro-Poor Livestock Policy Initiative
Status and Prospects forSmallholder Milk Production
A Global Perspective
Editors:Torsten Hemme
Joachim Otte
FOOD AND AGRICULTURE ORGANIZATION OF THE UNITED NATIONSRome, 2010
iv © IFCN 2008
Editors
Torsten HemmeIFCN Dairy Research Center at University Kiel, www.ifcndairy.org Schauenburgerstr. 116, 24118 Kiel, Germany [email protected]
Joachim OttePro-Poor Livestock Policy Initiative, www.fao.org/ag/pplpi.html FAO Animal Production and Health Division Rome, Italy [email protected]
Recommended citation
FAO 2010: Status of and Prospects for Smallholder Milk Production – A Global Perspective, by T. Hemme and J. Otte. Rome
Credits
The photographs were provided by IFCN researchers and Katja Seifert Cover photo 19312_R.FaiduttiDesign, layout & image editing: Katja Seifert Cover design: S. Villicana
The designations employed and the presentation of material in this information product do not imply the expression of any opinion whatsoever on the part of the Food and Agriculture Organization of the United nations (FAO) or the International Farm Comparison Network (IFCN) concerning the legal or development status of any country, territory, city or area or of its authorities, or concerning the delineation of its frontiers or boundaries. The mention of specific companies or products of manufacturers, whether or not these have been patented, does not imply that these have been endorsed or recommended by FAO or IFCN in preference to others of similar nature that are not mentioned. The views expressed in this information product are those of the authors and do not necessarily reflect the views of FAO.
All rights reserved. Reproduction and dissemination of material in this information product for educational or other non-commercial purposes are authorized without any prior written permission from the copyright holders provided the source is fully acknowledged. Reproduction of material in this information product for resale or other commercial purposes is prohibited without prior permission of the copyright holders. Applications for such permission should be addressed to:
ChiefElectronic Publishing Policy and Support BranchCommunication Division
FAOViale delle terme di Caracalla, 00153 Rome, Italyor by e-mail to:[email protected]
ISBN 978-92-5-106545-7

© IFCN 2008 1
Preface
Of an estimated 2.6 billion people in the developing world surviving on less than US$2 per day, some 1.4 billion are classified as ‘extremely’ poor inasmuch as they live on less than US$1.25/day. Although the incidence of extreme poverty is highest in sub-Saharan Africa (50 percent), Asia is home to the majority of the extremely poor (933 million). Poverty is closely associated with malnutrition, particularly under-nutrition; the Food and Agriculture Organization of the United Nations (FAO) estimates that, in 2009, some 1.02 billion people, or one sixth of the world’s population, were under-nourished.
More than three quarters of these 1.4 billion extremely poor live in rural areas and partly or wholly depend on agriculture for their livelihoods; almost half a billion of them also partly depend on livestock. Given that it is impossible for the expansion of agricultural land to keep pace with population growth in most developing countries, it is not easy to expand agricultural production horizontally. Rather, productivity gains that result in increased value of output per hectare of land are essential for the purpose of improving rural incomes.
Livestock have a number of characteristics that contribute to sustainable rural development: among other things, livestock provide marketable products (generally of a higher value and less vulnerable to critical harvest timing than many crops) that can be produced by small-scale, household production systems. Judicious development of the livestock sector could thus make a substantial contribution to raising nutrition levels, increasing agricultural productivity, improving the lives of rural people, contributing to growth of the world economy and achieving the Millennium Development Goal of eradicating extreme poverty and hunger.
It is estimated that almost 150 million farm households, i.e. more than 750 million people, are engaged in milk production, the majority of them in developing countries. Annual milk consumption growth rates in these countries averaged 3.5 to 4.0 percent over the decade 1995-2005, at least double the growth rates of 1.4 to 2.0 percent for major staple foods over the same period. Therefore, if properly directed, dairy sector development could serve as a powerful tool for reducing poverty.
The aim of the present publication is to provide an overview of the global dairy sector and of the forces shaping its development vis-à-vis the characteristics of ‘typical’ dairy farming systems. In this way, it is hoped to facilitate a better understanding of the opportunities available for improvement, as well as the constraints/threats faced by smallholder dairy producers in a rapidly changing world. It also attempts to chart an approach to dairy sector development that will allow smallholder producers to participate in the growing market for milk and milk products.
Samuel Jutzi Director, Animal Production and Health Division, FAO

2 © IFCN 2008
Page No.
Abbreviations and acronyms 4
Note of the editors and acknowledgements 5
Executive Summary 6
1 Introduction 10
2 Global Dairy Sector: Status and Trends 2.1 Summary 16
2.2 Global price trends for feed and dairy products 18
2.3 Milk production trends 20
2.4 Farmers’ milk prices and milk:feed price ratio 22
2.5 Dairy farm numbers world wide 24
2.6 Pattern of dairy trade and milk processing 26
2.7 Milk consumption and its drivers 28
3 Milk Production and Dairy Sector Profiles 3.1 Summary 34
3.2 India 38
3.3 Pakistan 42
3.4 Bangladesh 46
3.5 Thailand 50
3.6 Viet Nam 54
3.7 China 58
3.8 Uganda 62
3.9 Cameroon 66
3.10 Morocco 70
3.11 Peru 74
3.12 Germany 78
3.13 United States of America 82
3.14 New Zealand 86
4 International Competitiveness of ‘Typical’ Dairy Farms 4.1 Summary 94
4.2 Overview of selected dairy farm types 96
4.3 Overview of the whole farm 98
4.4 Farm income, profits and returns to labour 100
4.5 Asset structure and returns on investments 102
4.6 Producer milk prices and non-milk returns 104
4.7 Costs of milk production only; milk prices 106
4.8 Total milk production costs and returns to the dairy enterprise 108
4.9 Cost component: labour 110
4.10 Cost component: land 112
4.11 Cost component: capital (excluding land and quota) 114
Table of Contents

© IFCN 2008 3
Table of Contents
5 Special Studies 5.1 Summary 120
5.2 Impact analysis of dairy development programmes in Andhra Pradesh, India 122
5.3 Impact analysis of dairy development programmes in Uganda 124
5.4 Farm development strategies for dairy farms in Haryana (India) 126
5.5 Policy impact analysis for dairy farms in Thailand and Viet Nam 128
5.6 Comparison of dairy chains in Karnal, India 130
5.7 Cost of ‘quality milk’ in Karnataka, India: a case study 132
5.8 The competitiveness of skim milk powder from Uganda 134
5.9 The dairy feed chain in Peru: a case study 136
5.10 A comparison of dairy farming systems in India 138
5.11 A comparison of rural & peri-urban milk production systems in South Asia 140
5.12 Comparison of small- and large-scale dairy farming systems in India & US 142
5.13 Comparing household, whole farm and dairy enterprise levels in India 144
5.14 Methodological approach for guiding dairy development activities 146
5.15 Comparison of IFCN and Extrapolate approaches to impact analysis 148
5.16 Assessing the risks faced by dairy farms 150
5.17 Incorporating risk in dairy development strategy formulation 152
5.18 Carbon footprints of dairy farming systems 154
6 Conclusions and Recommendations for Smallholder Dairy Development 160
7 References 165
AnnexesA1 The International Farm Comparison Network (IFCN) 168
A2 FAO’s Pro-Poor Livestock Policy Initiative (PPLPI) 169
A3 Further reading / papers by IFCN and PPLPI 171
A4 Researchers who have contributed 172
A5 Farm description 176
A6 Description of data collection for typical dairy farms 178
A7 Exchange rates 1996 – 2007 179
A8 Assumptions for the calculations – farm economic indicators 180

4 © IFCN 2008
Abbreviations and acronyms
Currencies
ALL Albanian Lek ARS Argentine Peso AUD Australian Dollar BDT Bangladeshi Taka BGL Bulgarian Lev BRL Brazilian Real BYR Belarus Rouble CAD Canadian Dollar CHF Swiss Franc CLP Chilean Peso CNY Chinese Renminbi Yuan CSK Czech Koruna DKK Danish Krone ECS Ecuador Sucre EEK Estonian Kroon EGP Egyptian Pound ETB Ethiopian Birr EUR European Euro GBP British Pound GTQ Guatemalan Quetzal HUF Hungarian Forint IDR Indonesian Rupiah ILS Israeli New Shekel INR Indian Rupee IRR Iranian Rial JOD Jordanian Dinar JPY Japanese Yen KRW South Korean Won KZT Kazakhstan Tenge LKR Sri Lankan Rupee LTL Lithuanian Litas
Countries
AL Albania AM Armenia AR Argentina AT Austria AU Australia AZ Azerbaijan BA Bosnia and Herzegovina BD Bangladesh BE Belgium BG Bulgaria BR Brazil BY Belarus CA Canada CH Switzerland CL Chile CM Cameroon CN China CY Cyprus CZ Czech Republic DE Germany DK Denmark EC Ecuador EE Estonia EG Egypt ES Spain ET Ethiopia FI Finland FR France GB United Kingdom GR Greece GT Guatemala HR Croatia HU Hungary ID Indonesia IE Ireland IL Israel IN India IR Iran IS Iceland IT Italy
Units
ct cent Cwt hundredweight = 100 Ib (45.36 kg) ECM Energy corrected milk 4% fat, 3.3% protein g gram h hour ha hectare Ib Pound (453.59 g) kg kilogram l litre MCAL Mega calorie ml millilitre NE Net energy ppl pence per litre Snf Solids non-fat t metric tons yr year
Others
AI Artificial insemination CAP Common Agricultural Policy (in EU) CIF Cost, insurance, freight CIS Commonwealth of Independent States (Countries of the former Soviet Union) CPI Consumer Price Index FAO Food and Agricultural Organisation FOB Free on board GDP Gross Domestic Product HH household IDF International Dairy Federation IFCN International Farm Comparison Network IMF International Monetary Fund ME Milk Equivalent OECD Organisation for Economic Co-operation and Development P&L Profit and loss account PAM Policy analysis matrix PPLPI Pro Poor Livestock Policy Initiative sbm soya bean meal SMP Skim milk powder TIPI-CAL Technology Impact and Policy Impact Calculation Model UHT Ultra High Temperature (milk) VAT Value added tax WTO World Trade Organization ZMP Zentrale Markt- und Preisberichtstelle (Germany)
JO Jordan JP Japan KR Korea, Republic of KZ Kazakhstan LK Sri Lanka LT Lithuania LU Luxembourg LV Latvia MA Morocco MD Moldova MK Macedonia MM Myanmar MN Mongolia MX Mexico NG Nigeria NL The Netherlands NO Norway NZ New Zealand PE Peru PH Philippines PK Pakistan PL Poland PT Portugal RO Romania RU Russian Federation SA Saudi Arabia SD Sudan SE Sweden SI Slovenia SK Slovakia SY Syria TH Thailand TR Turkey TW Taiwan UA Ukraine UG Uganda US USA UY Uruguay UZ Uzbekistan VN Viet Nam ZA South Africa
LVL Latvian Lats MAD Moroccan Dirham MMK Myanmar Kyat MNT Mongolian Tugrik MXN Mexican Peso NGN Nigerian Naira NOK Norwegian Kroner NZD New Zealand Dollar PEN Peruvian Nuevo Sol PHP Philippine Peso PKR Pakistan Rupee PLN Polish Zloty RON Romanian New Lei RUB Russian Rouble SAR Saudi Riyal SDD Sudanese Dinar SEK Swedish Krona SIT Sloveniaan Tolar SKK Slovak Koruna SYP Syrian Pound THB Thai Baht TRL Turkish Lira TWD Taiwan Dollar UAH Ukraine Hryvnia UGX Uganda Shilling USD US Dollar UYP Uruguayan Peso UZS Uzbekistani Soum VND Viet Namese Dong XAF Communaute Financiere Africaine Franc ZAR South African Rand
© IFCN 2008 5
Note of the editors and acknowledgements
Why dairy?
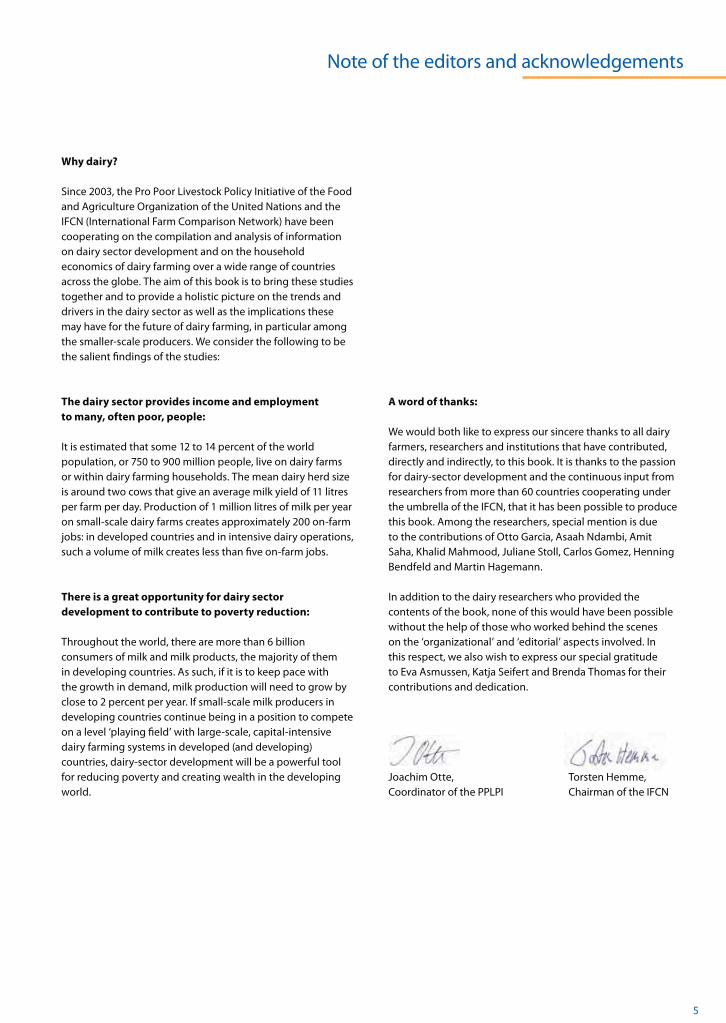
Since 2003, the Pro Poor Livestock Policy Initiative of the Food and Agriculture Organization of the United Nations and the IFCN (International Farm Comparison Network) have been cooperating on the compilation and analysis of information on dairy sector development and on the household economics of dairy farming over a wide range of countries across the globe. The aim of this book is to bring these studies together and to provide a holistic picture on the trends and drivers in the dairy sector as well as the implications these may have for the future of dairy farming, in particular among the smaller-scale producers. We consider the following to be the salient findings of the studies:
The dairy sector provides income and employment to many, often poor, people:
It is estimated that some 12 to 14 percent of the world population, or 750 to 900 million people, live on dairy farms or within dairy farming households. The mean dairy herd size is around two cows that give an average milk yield of 11 litres per farm per day. Production of 1 million litres of milk per year on small-scale dairy farms creates approximately 200 on-farm jobs: in developed countries and in intensive dairy operations, such a volume of milk creates less than five on-farm jobs.
There is a great opportunity for dairy sector development to contribute to poverty reduction:
Throughout the world, there are more than 6 billion consumers of milk and milk products, the majority of them in developing countries. As such, if it is to keep pace with the growth in demand, milk production will need to grow by close to 2 percent per year. If small-scale milk producers in developing countries continue being in a position to compete on a level ‘playing field’ with large-scale, capital-intensive dairy farming systems in developed (and developing) countries, dairy-sector development will be a powerful tool for reducing poverty and creating wealth in the developing world.
A word of thanks:
We would both like to express our sincere thanks to all dairy farmers, researchers and institutions that have contributed, directly and indirectly, to this book. It is thanks to the passion for dairy-sector development and the continuous input from researchers from more than 60 countries cooperating under the umbrella of the IFCN, that it has been possible to produce this book. Among the researchers, special mention is due to the contributions of Otto Garcia, Asaah Ndambi, Amit Saha, Khalid Mahmood, Juliane Stoll, Carlos Gomez, Henning Bendfeld and Martin Hagemann.
In addition to the dairy researchers who provided the contents of the book, none of this would have been possible without the help of those who worked behind the scenes on the ‘organizational’ and ‘editorial’ aspects involved. In this respect, we also wish to express our special gratitude to Eva Asmussen, Katja Seifert and Brenda Thomas for their contributions and dedication.
Joachim Otte, Torsten Hemme, Coordinator of the PPLPI Chairman of the IFCN

6 © IFCN 2008
Executive summary
It is estimated that, throughout the world, almost 150 million farm households are engaged in milk production, the majority of them in developing countries where annual growth rates in milk consumption averaged 3.5 to 4.0 percent in the decade 1995-2005. This is at least double the growth rates of 1.4 to 2.0 percent for major staple foods over the same period. Therefore, if properly directed, dairy sector development could serve as a powerful tool for reducing poverty.
With this in mind, the aim of the present publication is to provide an overview of the global dairy sector and the forces shaping its development with a focus on the characteristics of, and implications for, ‘typical’, mostly smallholder, dairy farming systems in developing countries.
Status and trends in the global dairy sector
Based on milk equivalents (ME), average per capita global milk consumption amounts to about 100 kg of milk per year, with very significant differences between countries/regions. Per capita consumption in Western Europe is in excess of 300 kg of milk per year compared with less than 30 kg (and even sometimes as little as 10 kg) in some African and Asian countries. In the past, increases in global milk demand have been mainly driven by population growth, whereas nowadays they are increasingly also fuelled by rising per capita milk consumption in some highly populated developing countries. Increasing income levels are expected to raise the demand for milk and dairy products by more than 1.8 percent per annum. Should increases in milk production not follow suit, dairy prices will rise significantly over past levels.
South Asia and EU-25 are the most important dairy regions, accounting for 44 percent of global milk production. In the period 2002 to 2007, world milk production grew by 13 percent, or by an average of 15 million tons of energy-corrected milk (ECM) per year – mainly through production increases in China, India and Pakistan. Overall, therefore, developing countries, which rely predominantly on smallholder dairy production systems, have increased their share in world milk production.
Milk is likely to become one of the most volatile agricultural commodities owing to: (a) the strong influence that small changes in the quantities available internationally have on world market prices; (b) the length of time required for milk production to increase in response to rising prices; and (c) the delayed reaction of consumer demand to changing dairy commodity prices.
A key determinant of milk prices is the cost of feed, which directly affects milk production through increased production costs and, indirectly, higher land values. Demand for grain, an ingredient of dairy rations, is driven by the need for food, feed and fuel of a growing world population. Higher incomes in
developing countries raise the demand for food derived from livestock, leading to more demand for animal feed. Higher energy prices and policies that promote bio-fuels lead to an increased use of crops for energy production and, thereby, push up the prices of feed and land. The Organisation for Economic Co-operation and Development (OECD) and the Food and Agricultural Policy Research Institute (FAPRI) forecast that, in the long term, feed price levels will increase to about 50 percent above those of 2002-2006.
The milk:feed price ratio is one of the main factors determining the choice of dairy production system. The highest milk:feed price ratio (more than 2.5) is seen in North America, where, as a likely consequence, the most intensive milk production systems are found. Farming systems with lower milk yields, making little use of compound feed, are generally observed in countries with a milk:feed price ratio of less than 1.5.
Very few countries are self-sufficient with regard to milk. The main milk-surplus countries are Argentina, Australia, New Zealand, USA, Uruguay and countries of the European Union (EU) and Eastern Europe. The main milk-deficit countries are Algeria, China, Japan, Mexico, the Philippines and Russia. Over the period1990-2004, global milk exports increased from 4.4 to 7.1 percent of production, while the share delivered to formal milk processors increased from 14 to 24 percent.
International competitiveness of ‘typical’
dairy farms
Farms representative of various dairy farming systems in Bangladesh, Cameroon, China, India, Morocco, Pakistan, Peru, Thailand, Uganda and Viet Nam were subjected to detailed technical and economic analyses. For industrialized countries, similar analyses were conducted for farms in Germany, New Zealand and the USA.
Milk returns account for 55 to 95 percent of the returns of all farm types analysed and range from US$12 to US$36/100 kg of ECM. Non-milk returns range from US$2 to 38/100 kg ECM. Non-milk returns were very low for the farms in India whereas they were very high in Germany and Morocco.
Average milk production costs in the three industrialized countries covered by the study stand at US$31.4/100 kg, or 56 percent above the average production cost of US$20.2/100 kg calculated for the ten developing countries while the average price of milk in the three industrialized countries (US$31.2/100 kg) is only 30 percent higher than that in the developing countries (US$24.0/100 kg). Thus, the overall profitability of milk production appears to be higher in developing than in industrialized countries, which may be one of the reasons why developing countries are increasing their shares in global dairy production.

© IFCN 2008 7
Given the major differences in agricultural wage rates between industrialized and developing countries, it could be assumed that in the latter farms have a labour cost advantage. However, this was found not to be the case when comparing labour costs per litre of milk, mainly because countries with higher salaries also tend to have a significantly higher level of labour productivity. Per litre of milk, the labour costs of a nine-cow dairy farm in Punjab, India, are similar to those of a 350-cow farm in the USA. The main cost advantage of smallholder dairy farming lies in the use of low(er)-cost feed and the overall ‘low-tech’ approach to milk production. Cows fed on crop residues, such as straw, are significantly lower-cost producers of milk than high-yielding, grain-fed dairy cows.
Given the rapid increases in feed prices over the recent past, it is important to consider how this trend affects the competitiveness of small-scale dairy farmers in developing countries. As these smallholder dairy systems normally use much less compound feed per kilogram of milk than dairy farms in industrialized countries, rising feed prices increase the cost of milk production in the latter to a larger extent than in the low-yield systems predominating in developing countries. Thus, as feed prices increase, ‘typical’ smallholder dairy farms become more cost-competitive.
For dairy farming to remain sustainable, it must be able to compete for labour on local labour markets. If the ‘return to labour’ in dairy farming (i.e. the ‘value-added’ per hour of labour put into dairy farming) is higher than the average local wage rate, the dairy farming system can pay competitive wages and should be sustainable from the labour standpoint. The average return to labour observed in the developing countries covered by this study is US$0.45/hour, which is 45 percent higher than the average local wage of US$0.31/hour. In the three industrialized countries covered, the average return to labour is US$16.30/hour, which is still 22 percent above the average estimated wage of US$13.30/hour. These figures indicate that it would be possible for dairy farming to compete on local labour markets in both groups of countries. However, milk production quickly loses its competitive advantage when local wages rise faster than labour productivity.
Conclusions for smallholder dairy development
The various analyses and case studies presented in this document indicate that:
small-scale milk production not only improves the food security of milk-producing households but also helps to create numerous employment opportunities throughout the dairy chain, i.e. for small-scale rural processors and intermediaries; and
small-scale milk producers incur low production costs. Thus, if well organized, they should be able to compete with large-scale, capital-intensive ‘high-tech’ dairy farming systems in industrialized (and developing) countries.
Dairy development may therefore serve as a powerful tool for reducing poverty. Devising a viable dairy development strategy for smallholders calls for a detailed analysis of strengths, weaknesses, opportunities and threats posed by the external environment. The strengths of smallholder dairy systems are low production costs; high profit margins; low liabilities; limited liquidity risk; and relative resilience to rising feed prices – strengths that enable smallholders to serve as a competitive source of milk supply. However, smallholder milk producers are also beset by a number of weaknesses: lack of knowledge and technical know-how; poor access to support services; low capital reserves and limited access to credit; low (labour) productivity; and poor milk quality – all of which limit their ability to take advantage of market opportunities.
Major opportunities for smallholder producers engaged in dairy production are: (i) growing demand for dairy products in developing countries; (ii) probable milk price increases; (iii) potential to increase milk yields through relatively few additional inputs; (iv) potential to increase dairy labour productivity; and (v) employment generation in the dairy value chain (for example, absorbing family labour released by higher on-farm labour productivity). However, smallholders in developing countries also face major threats, namely (a) policy support for (and competition from) dairy farmers in OECD countries; (b) increased consumer demand for food safety; (c) environmental concerns (low-yield dairy systems are estimated to have higher carbon footprints per 100 kg of milk produced than high-yield systems); (d) increasing local wage rates; (e) intergenerational discontinuity (children of the better-performing farmers leave the system); (f) under-investment in dairy chain infrastructure; and (g) inappropriate dairy development policies and investment plans.
Given the increasing ‘interconnectedness’ of global agriculture, the ability of smallholder milk producers to participate in the dairy market in a profitable manner will depend not only on their own competitiveness, mainly determined by production costs, but also, and to an increasing extent, on the efficiency of the dairy chains of which they are part. Therefore, recommendations for smallholder dairy development must include strategies to increase the competitiveness in all segments of the dairy chain, namely, input supply, milk production, processing, distribution and retailing. In other words, to be successful, any dairy development strategy must be based on the principle of ‘creating value’ in each and every segment of the dairy chain. This makes formulation of a dairy development strategy a complex task, involving a large number of stakeholders and requiring comprehensive analysis and continuous reassessment.
Executive summary
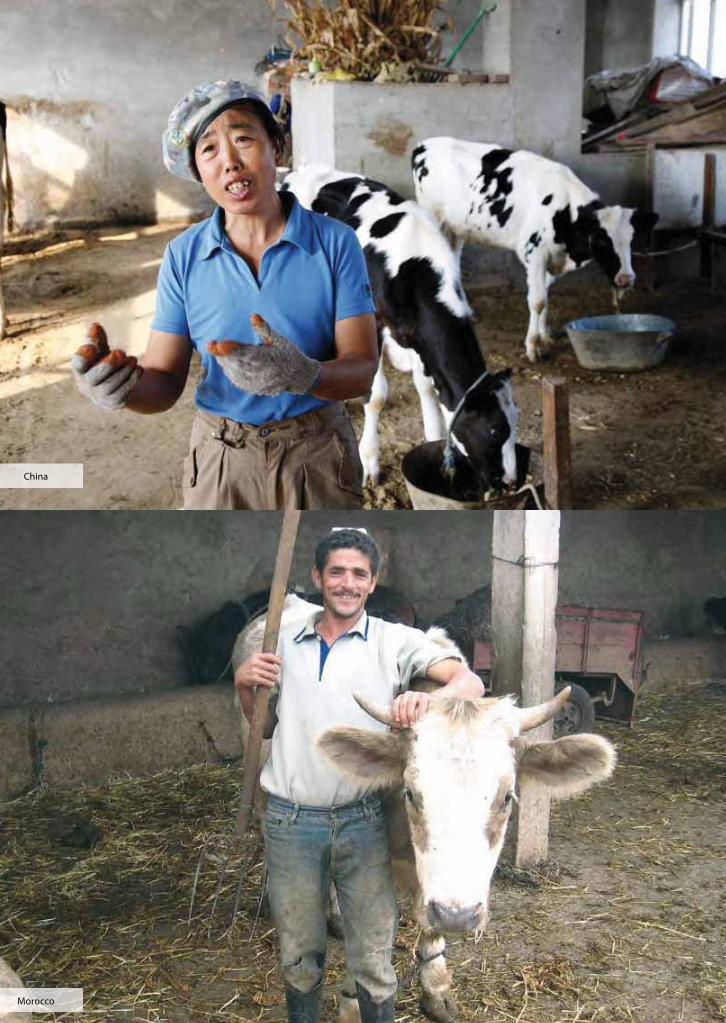
China
Morocco

Chapter 1Introduction
Pakistan
Pictures: Farmers with their animals (Pictures by: Katja Seifert, Otto Garcia, Khalid Mahmood)

10 © IFCN 2008
1.1 Introduction
It has been estimated that in 2005 some 1.4 billion people lived in absolute poverty1 and that almost 1 billion of them were affected by chronic mal- or under-nutrition. Recent food price increases are expected to have pushed many more people – perhaps as many as 100 million – even further into that dire situation. The fight against poverty and hunger is thus a major global concern. Indeed, at the United Nations Millennium Summit of September 2000, world leaders pledged, inter alia, to halve by 2015 the proportion of people living in extreme poverty and hunger.
An estimated 75 percent of the world’s poor live in rural areas, and at least 600 million of these people keep livestock to produce food, generate cash income, manage risks and build up assets. With the valuable contribution livestock makes to sustaining livelihoods, especially in rural areas, the development of small-scale livestock enterprises must be seen as a key element of any efforts to eradicate extreme poverty and hunger.
Milk production is an important livestock-sector activity. According to data gathered by the International Farm Comparison Network (IFCN), in 2005 around 149 million farm households throughout the world were engaged in milk production. On average, these households keep two milking cows (or buffaloes) yielding about 11 litres/day. Assuming a mean household size of five to six, some 750 to 900 million people (or 12-14 percent of the world population) rely on dairy farming to some extent.
In view of the above, it is important to assess whether:
small-scale milk production can contribute to significantly reducing poverty and improving nutrition and food security; and
small-scale milk producers will be able to compete with large-scale, capital-intensive ‘high-tech’ dairy farming systems such as those in the USA and other developed countries.
If the answer to both questions is in the affirmative, the promotion of small-scale dairy production may well serve as an important tool for achieving the above-mentioned Millennium Development Goal. Should the response to the second question be negative, however, it is not clear what will happen to the large numbers of people currently making at least part of their living from milk production.
1 Surviving on an income below the international poverty line of $1.25/day.
© IFCN 2008 11
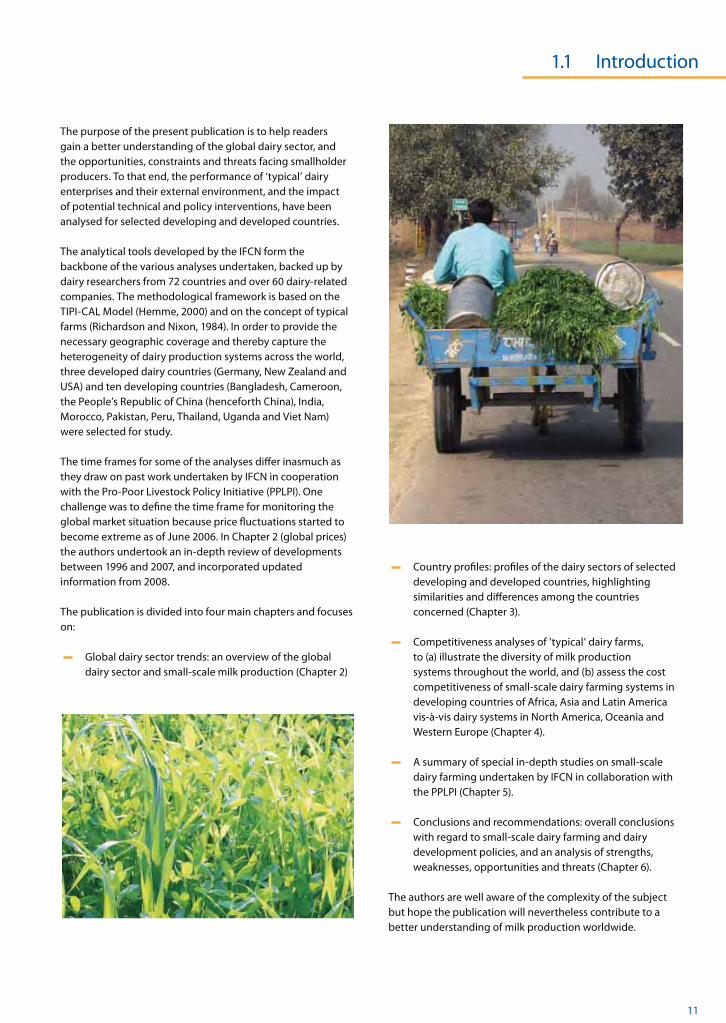
The purpose of the present publication is to help readers gain a better understanding of the global dairy sector, and the opportunities, constraints and threats facing smallholder producers. To that end, the performance of ‘typical’ dairy enterprises and their external environment, and the impact of potential technical and policy interventions, have been analysed for selected developing and developed countries.
The analytical tools developed by the IFCN form the backbone of the various analyses undertaken, backed up by dairy researchers from 72 countries and over 60 dairy-related companies. The methodological framework is based on the TIPI-CAL Model (Hemme, 2000) and on the concept of typical farms (Richardson and Nixon, 1984). In order to provide the necessary geographic coverage and thereby capture the heterogeneity of dairy production systems across the world, three developed dairy countries (Germany, New Zealand and USA) and ten developing countries (Bangladesh, Cameroon, the People’s Republic of China (henceforth China), India, Morocco, Pakistan, Peru, Thailand, Uganda and Viet Nam) were selected for study.
The time frames for some of the analyses differ inasmuch as they draw on past work undertaken by IFCN in cooperation with the Pro-Poor Livestock Policy Initiative (PPLPI). One challenge was to define the time frame for monitoring the global market situation because price fluctuations started to become extreme as of June 2006. In Chapter 2 (global prices) the authors undertook an in-depth review of developments between 1996 and 2007, and incorporated updated information from 2008.
The publication is divided into four main chapters and focuses on:
Global dairy sector trends: an overview of the global dairy sector and small-scale milk production (Chapter 2)
Country profiles: profiles of the dairy sectors of selected developing and developed countries, highlighting similarities and differences among the countries concerned (Chapter 3).
Competitiveness analyses of ‘typical’ dairy farms, to (a) illustrate the diversity of milk production systems throughout the world, and (b) assess the cost competitiveness of small-scale dairy farming systems in developing countries of Africa, Asia and Latin America vis-à-vis dairy systems in North America, Oceania and Western Europe (Chapter 4).
A summary of special in-depth studies on small-scale dairy farming undertaken by IFCN in collaboration with the PPLPI (Chapter 5).
Conclusions and recommendations: overall conclusions with regard to small-scale dairy farming and dairy development policies, and an analysis of strengths, weaknesses, opportunities and threats (Chapter 6).
The authors are well aware of the complexity of the subject but hope the publication will nevertheless contribute to a better understanding of milk production worldwide.
1.1 Introduction

India
Pakistan
New Zealand
Germany

China
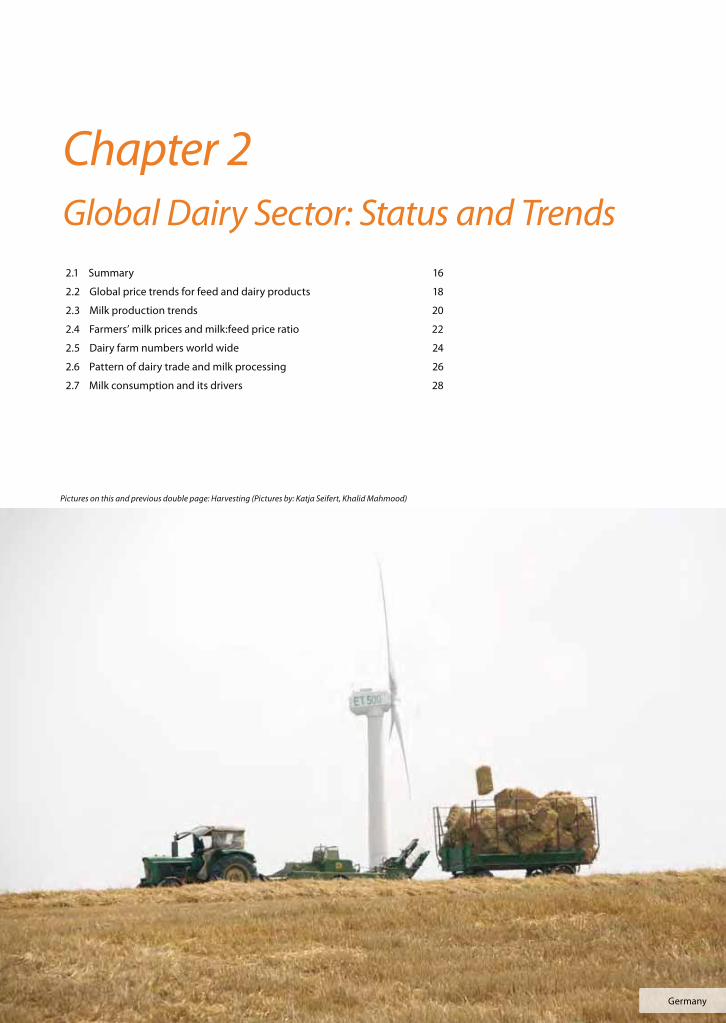
Chapter 2Global Dairy Sector: Status and Trends
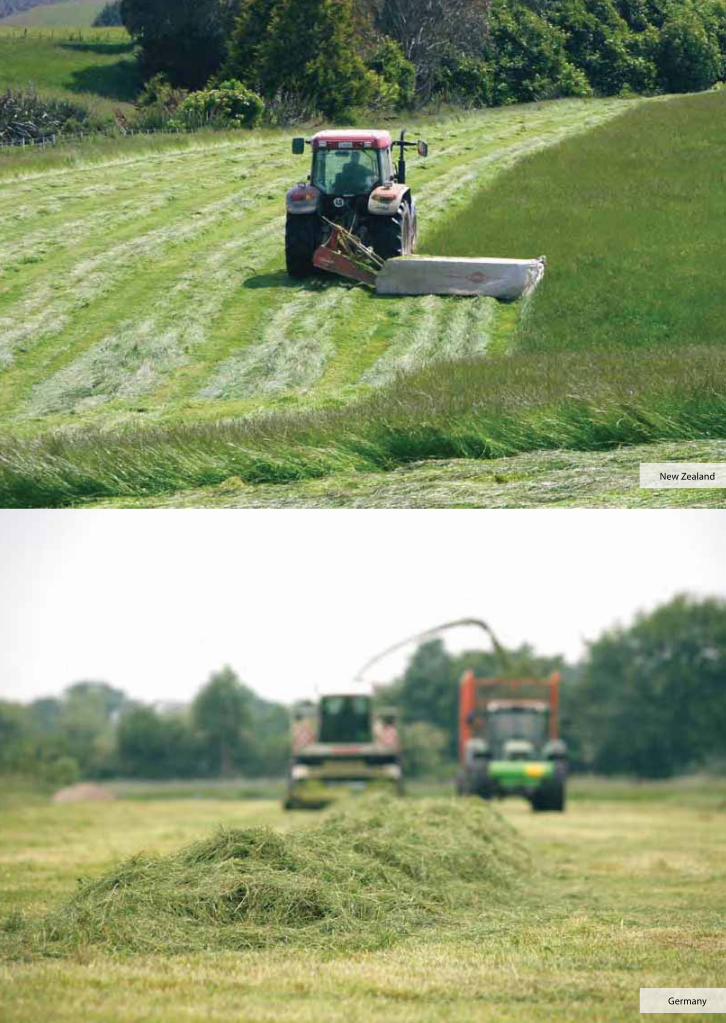
Photos previous pages: Harvesting grass in India, Egypt, New Zealand and Germany (Photos: Katja Seifert)Germany
Pictures on this and previous double page: Harvesting (Pictures by: Katja Seifert, Khalid Mahmood)
2.1 Summary 16
2.2 Global price trends for feed and dairy products 18
2.3 Milk production trends 20
2.4 Farmers’ milk prices and milk:feed price ratio 22
2.5 Dairy farm numbers world wide 24
2.6 Pattern of dairy trade and milk processing 26
2.7 Milk consumption and its drivers 28
16 © IFCN 2008
2.1 Summary
Introduction
This chapter contains an analytical overview of major global trends in milk and feed prices, milk supply, dairy sector structures, trade in dairy products and consumption.
World market prices for feed and dairy products
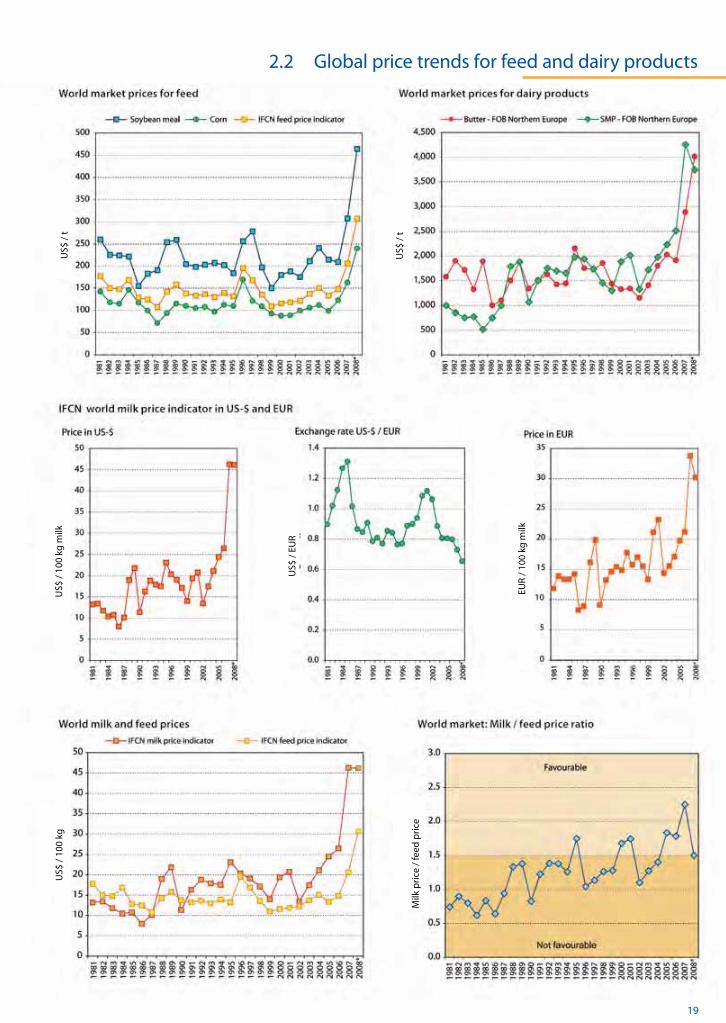
During the period 1981 to 2005, the calculated world market price for milk ranged between US$10/ton or and US$25/ton. However, in 2007, it increased rapidly by 75 percent to more than US$45/ton as a result of the rise in price of skimmed milk powder (SMP) and butter from US$1 000 to 2 000/ton to US$4 000/ton in response to a shortfall in milk availability relative to world demand.
In the past, increases in demand were driven mainly by population growth, whereas they are now increasingly fuelled by rising per capita milk consumption in developing countries (see Section 2.7). The deficit in world milk production since 2004 did not have a major effect on prices at first as additional supplies of about 2 million tons/year were available from stocks in the United States of America (USA) and the European Union (EU). However, prices increased dramatically once these supplies were exhausted (SMP: end-2006; butter: mid-2007). Climatic events and policy interventions (hindering of exports) may also be seen as determinants of this price development. IFCN estimates the additional volume of milk needed to ’balance’ the markets at lower price levels as 2 to 4 million tons/year or about 0.5 percent of world milk production.
Milk will likely become one of the most volatile agricultural commodities in future. This is because of: (a) the strong influence that small changes in the quantities available internationally have on world market prices; (b) the length of time before there are increases in milk production as a result of price changes; and (c) delayed reaction of the demand to changing dairy commodity prices. The key challenges to making a reliable forecast of world market prices for milk are the nature of consumer reaction to rising milk prices and the response of dairy farmers with regard to supply, especially in low-cost dairy regions. Another key determinant of milk prices is feed, which directly affects milk production through increased costs and, indirectly, higher land prices.
World market prices for feed
In 2006, the world market price of the IFCN feed price indicator, which is based on prices of soybean meal and corn, was US$128/ton, and ranged from US$115/ton in Belarus to US$467/ton in the Republic of Korea.
In 2007 the IFCN feed price indicator increased by 48 percent from its historical level of US$150/ton. By June 2008, it had reached US$350/ton, representing an increase of 133 percent over the levels of 1981 to 2006.
The fact that growth in world supplies of grain has not kept up with growing demand has led to historically high prices. Demand for grain is driven by the need for food, feed and fuel, and the nutriment needs of the ever-growing world population. Higher incomes in developing countries push up the demand for animal-based food, which leads to greater need for feed. Higher energy prices and policies that promote bio energy drive the use of crops for energy production and, thereby, push up the prices of feed and land.
The Organisation for Economic Co-operation and Development (OECD) and the Food and Agricultural Policy Research Institute (FAPRI) forecast that, over the long term, feed price levels will be about 50 percent higher than those of 2002 to 2006. It follows, therefore, that, compared with June 2008, grain prices will fall by about 30 percent in the coming years.
2 The world market price for milk was calculated based on world market prices for butter and SMP and assumptions from ZMP on processing costs and technical coefficients.
© IFCN 2008 17
2.1 Summary
Global milk production
South Asia and EU-25 are the most important dairy regions, accounting for 44 percent of global milk production. In the period 2002 to 2007, world milk production grew by 13 percent, or by an average of 15 million tons of energy-corrected milk (ECM) per year – mainly driven by production increases in China, India and Pakistan. Overall, therefore, developing countries relying predominantly on smallholder dairy production systems have increased their shares in world milk production.
Producer milk prices in selected world regions
Section 2.4 illustrates the extent to which domestic milk prices mirror/follow world market prices. As a general rule, prices in Eastern Europe, Latin America, Oceania and indeed in most developing countries, closely follow world market levels. In contrast, milk prices in the USA and countries of the EU, which have tariffs ranging from 50 percent to 120 percent, have been historically 50 to 150 percent above the world market price. Other countries that protect their dairy markets are Canada, Japan, Republic of Korea, Norway and Switzerland, where milk prices exceed US$50/100 kg. Nevertheless, milk prices vary from country to country, determined by local milk supply and demand and degrees of integration into the world dairy market. The lowest milk prices (less than US$20/100 kg) were observed in Argentina, Belarus, Indonesia, Pakistan, Uganda and Uruguay.
Milk:feed price ratios
The milk:feed price ratio is defined as the price of milk divided by that of compound feed. The highest milk:feed price ratio (more than 2.5) was observed in North America, where, as a likely consequence, the most intensive milk production systems are found. Farming systems that have lower milk yields and make little use of compound feed are observed in countries with a milk:feed price ratio of less than 1.5. However, it should be borne in mind that this rule does not apply to all the countries covered by the analysis.
Trade in dairy products and self sufficiency
Very few countries are self-sufficient with regard to milk. The main milk-surplus countries are Argentina, Australia, New Zealand, USA, Uruguay and countries of the EU and Eastern Europe. The main milk-deficit countries are Algeria, China, Japan, Mexico, the Philippines and Russia. In the period 1990 to 2004, overall milk exports increased from 4.4 percent to 7.1 percent of total production while the share delivered to formal milk processors increased from 14 percent to 24 percent.
Global milk consumption
The majority of the world’s population lives in developing countries, particularly in Asia. Population growth was the main driver of increased demand for dairy products over the period analysed. However, per capita consumption increased significantly in a few but highly populated countries, among them China, Indonesia and Viet Nam.
Based on milk equivalent (ME), average per capita global milk consumption amounts to about 100 kg of milk/year, with very significant differences between countries/regions. Per capita consumption in Western Europe is in excess of 300 kg of milk/year compared with less than 30 kg (and even sometimes as little as 10 kg) in some African and Asian countries. It may be expected that increasing income levels will stimulate the demand for milk and dairy products, meaning that future milk production will need to increase by more than 1.8 percent per annum. Should this not be the case, dairy prices will rise significantly over past levels.

18 © IFCN 2008
2.2 Global price trends for feed and dairy products
Introduction
The key determinants of milk production are world market prices for milk and feed, as illustrated in this section.
World market prices for feed
Prices for corn, as energy feed, and soybean meal, as protein feed, have been used for the purpose of this analysis. In 1981-2006, the world corn price averaged US$109/ton, fluctuating between US$90/ton and US$120/ton. It rose to US$162/ton in 2007 and, in the first six months of 2008, to US$241/ton or 121 percent above the 1981 to 2006 average and 48 percent over the 2007 price. The time series shows that high prices were recorded in 1996, 2007 and 2008 because of strong demand for food, feed and fuel.
The average world market price of soybean meal in 1981-2006 ranged between US$150/ton and US$260/ton, averaging US$212/ton. After the peak in 2004, it stayed close to US$200/ton until it rose to US$307/ton in 2007 and averaged US$457/ton in 2008 (January to June).
The IFCN feed price indicator - combining corn and soybean meal prices - shows an average of US$140/ton for the period 1981-2006. It rose to US$206/ton in 2007 and to US$305/ton in 2008 (January-June). In 2004, 2007 and 2008 prices were significantly above the historical average compared with relatively low levels in the period 1999 to 2003.
World market prices for dairy products
The average world market price of butter in 1981-2006 was US$1 580/ton, fluctuating between US$1 000/ton and US$2 000/ton. It shot up to US$2 886/ton in 2007 and, in the first six months of 2008, increased further to US$4 021/ton.
Development of the average world market price for SMP showed levels of less than US$1 000/ton between 1981 and 1987; moderate prices of US$1 000 to 2 000/ton, similar to those of 1988 to 2004; and record prices of close to US$2 500/ton in 2006, US$4 250/ton in 2007 and US$3 750/ton in the first six months of 2008. Prices of SMP in 2006 and 2007 were significantly higher than those of butter but fell below in the first half of 2008.
Butter and SMP prices can be converted into prices per kilogram of fresh milk based on assumptions of the processing cost and technical coefficients provided by the Zentrale Markt- und Preisberichtstelle GmbH (Central Market and Price Reporting Agency, ZMP). Expressed in United States dollars, three periods of ‘world market’ prices of liquid milk can be distinguished:
Very low – 1981 to 1987: US$8-13/100 kg Volatile – 1988 to 2006: US$12-26/100 kg New levels since 2007: more than US$46/100 kg
Expressed in Euro, milk prices stayed at around €15/100 kg, with significant increases in 1989, 2000 and 2001, and with major drops in 1986, 1987 and 1990 (see below for €/US$ exchange rate fluctuations).
Milk:feed price ratios
From 1981 to 2007, milk prices were more volatile than those of feed. The milk:feed price ratio, which indicates how much feed a dairy farmer can buy with the proceeds of one kilogram of milk, increased steadily from 0.7 kg in 1981 to 2.3 kg in 2007. The price of milk stabilized in the first half of 2008 while that of feed continued to rise and the milk:feed price ratio fell back to 1.5, a level at which low-input milk production systems become more favourable. Milk prices and farm profits were ‘high’ in 2007 but fell back in 2008, as the milk price development was overtaken by feed price increases, especially in high-input systems. With the new level of milk and feed prices, the milk:feed price ratio will need to be updated.
United States dollar/Euro exchange rate
developments
As far as exchange rates are concerned, this long-term series shows that there was a slight devaluation of the United States dollar against the Euro until 2001 and a stronger one since then. The US dollar was very strong in the periods 1983 to 1985 and 2000 to 2002 but weakened in 2007 and 2008 when it fell below the historic lows of 1992 and 1995.
Conclusions on future world market prices of milk
World milk prices have reached a record high, and a significant degree of volatility may be expected in the future. This means that future world milk prices may well range between US$15 and US$50/100 kg milk.Explanation of variables/sources of data
2008*: Average January-June 2008. Feed prices: World Bank. Soybean meal: CIF Rotterdam, Corn: FOB USA Gulf. Butter and SMP prices: United States Department of Agriculture AMS Dairy Market News 2008, Oceania prices: SMP (1.25 percent fat), butter (82 percent fat). IFCN feed price indicator: Calculation: 0.3 kg soybean meal price + 0.7 kg corn price.Exchange rates: www.oanda.com, 2008. Exchange rates before introduction of the Euro are estimates based on the EU currencies.
Adapted from IFCN Dairy Report 2008, Chapter 2.2
© IFCN 2008 19
US$
/ t
US$
/ t
US$
/ 10
0 kg
milk
US$
/ EU
R
EUR
/ 100
kg
milk
US$
/ 10
0 kg
Milk
pric
e / f
eed
pric
e
2.2 Global price trends for feed and dairy products
20 © IFCN 2008
2.3 Milk production trends
Introduction
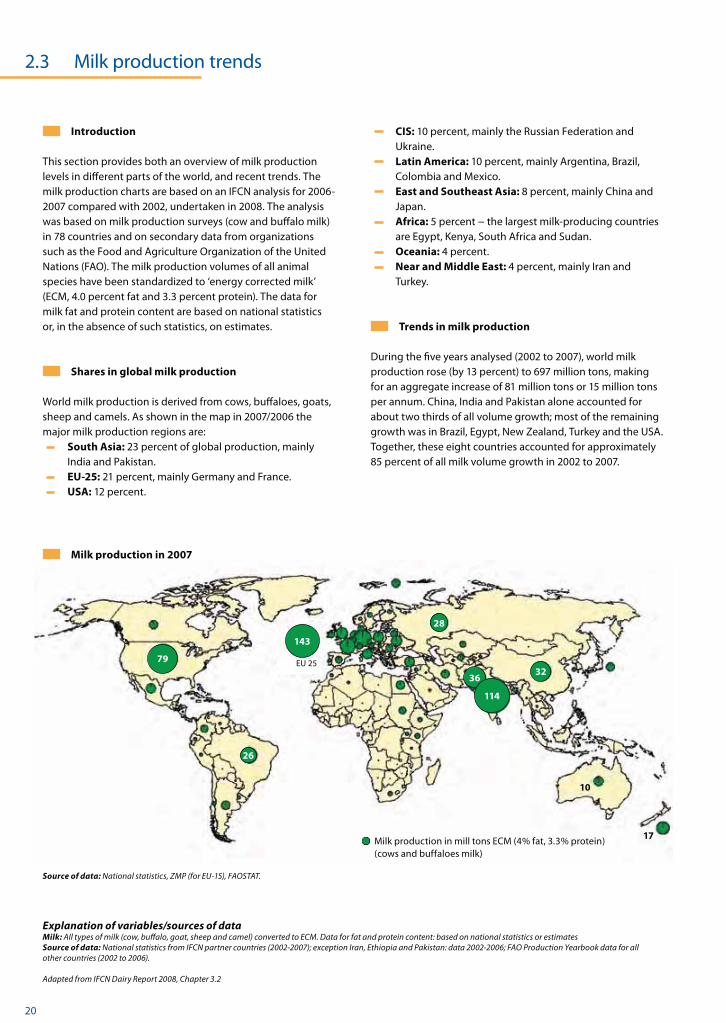
This section provides both an overview of milk production levels in different parts of the world, and recent trends. The milk production charts are based on an IFCN analysis for 2006-2007 compared with 2002, undertaken in 2008. The analysis was based on milk production surveys (cow and buffalo milk) in 78 countries and on secondary data from organizations such as the Food and Agriculture Organization of the United Nations (FAO). The milk production volumes of all animal species have been standardized to ‘energy corrected milk’ (ECM, 4.0 percent fat and 3.3 percent protein). The data for milk fat and protein content are based on national statistics or, in the absence of such statistics, on estimates.
Shares in global milk production
World milk production is derived from cows, buffaloes, goats, sheep and camels. As shown in the map in 2007/2006 the major milk production regions are:
South Asia: 23 percent of global production, mainly India and Pakistan.
EU-25: 21 percent, mainly Germany and France. USA: 12 percent.
CIS: 10 percent, mainly the Russian Federation and Ukraine.
Latin America: 10 percent, mainly Argentina, Brazil, Colombia and Mexico.
East and Southeast Asia: 8 percent, mainly China and Japan.
Africa: 5 percent − the largest milk-producing countries are Egypt, Kenya, South Africa and Sudan.
Oceania: 4 percent. Near and Middle East: 4 percent, mainly Iran and
Turkey.
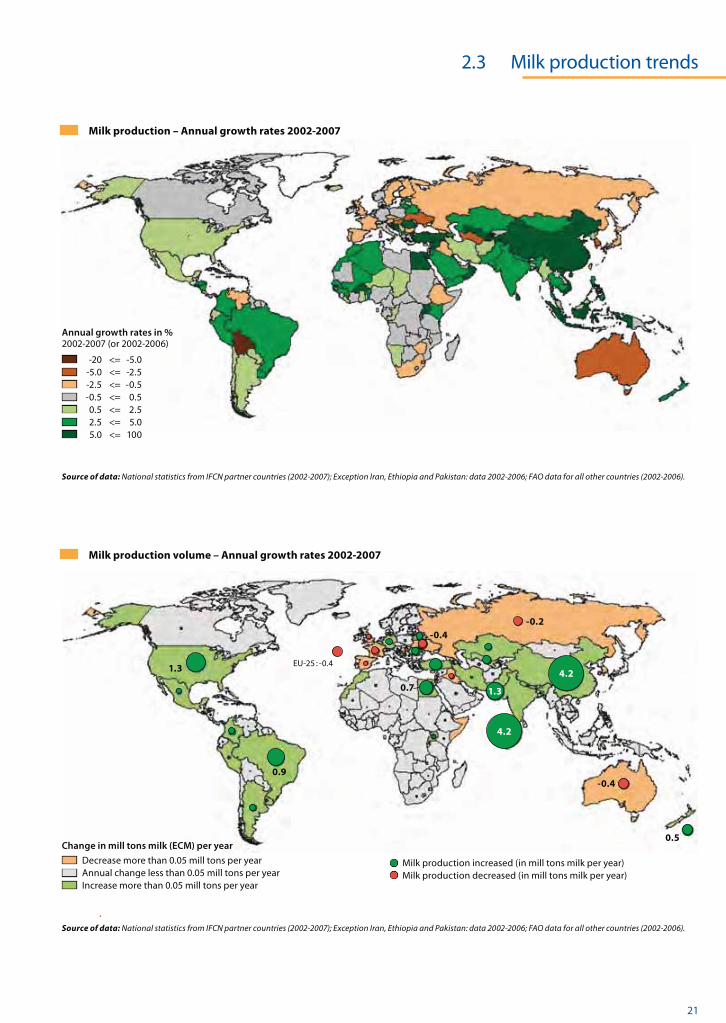
Trends in milk production
During the five years analysed (2002 to 2007), world milk production rose (by 13 percent) to 697 million tons, making for an aggregate increase of 81 million tons or 15 million tons per annum. China, India and Pakistan alone accounted for about two thirds of all volume growth; most of the remaining growth was in Brazil, Egypt, New Zealand, Turkey and the USA. Together, these eight countries accounted for approximately 85 percent of all milk volume growth in 2002 to 2007.
Explanation of variables/sources of dataMilk: All types of milk (cow, buffalo, goat, sheep and camel) converted to ECM. Data for fat and protein content: based on national statistics or estimatesSource of data: National statistics from IFCN partner countries (2002-2007); exception Iran, Ethiopia and Pakistan: data 2002-2006; FAO Production Yearbook data for all other countries (2002 to 2006).
Adapted from IFCN Dairy Report 2008, Chapter 3.2
Source of data: National statistics, ZMP (for EU-15), FAOSTAT.
Milk production in 2007
�� Milk production in mill tons ECM (4% fat, 3.3% protein) (cows and buffaloes milk)
EU 25
143
79
26
114
3632
28
10
17
© IFCN 2008 21
� -20 <= -5.0� -5.0 <= -2.5� -2.5 <= -0.5� -0.5 <= 0.5� 0.5 <= 2.5� 2.5 <= 5.0� 5.0 <= 100
Annual growth rates in %2002-2007 (or 2002-2006)
Source of data: National statistics from IFCN partner countries (2002-2007); Exception Iran, Ethiopia and Pakistan: data 2002-2006; FAO data for all other countries (2002-2006).
Milk production volume – Annual growth rates 2002-2007
Milk production – Annual growth rates 2002-2007
Source of data: National statistics from IFCN partner countries (2002-2007); Exception Iran, Ethiopia and Pakistan: data 2002-2006; FAO data for all other countries (2002-2006).
�� Milk production increased (in mill tons milk per year)�� Milk production decreased (in mill tons milk per year)
���Decrease more than 0.05 mill tons per year���Annual change less than 0.05 mill tons per year���Increase more than 0.05 mill tons per year
Change in mill tons milk (ECM) per year
EU-25 : -0.4
-0.2
-0.4
0.5
1.3
0.9
-0.4
0.7
4.2
1.3
4.2
2.3 Milk production trends

22 © IFCN 2008
2.4 Farmers’ milk prices and milk:feed price ratio
Introduction
For dairy farmers, the most important factor is the producer price for milk. Therefore this section deals with national milk prices and their relation to feed prices in the countries analysed by the IFCN. The analysis covers 2006, the last year before the start of significant increases in world commodity prices.
Milk prices per country 2006
Milk prices per country range from US$15 to 74/100 kg ECM and can be grouped into five categories:
< US$20: New Zealand, Argentina, Uruguay, Paraguay, Uganda, Belarus, Ukraine, Pakistan and Indonesia.
US$20 to 25: Australia, Uzbekistan, Nigeria, Brazil, Chile, Bolivia, Peru, India and Lithuania.
US$25 to 30: China, Viet Nam, Poland, Bulgaria, Romania, Turkey, Russia, Kazakhstan, Kenya, South Africa, Colombia, Ecuador and a number of Central American countries.
US$30 to 40: USA, Mexico, Venezuela, most EU countries, Hungary, the Czech Republic, Estonia, Slovenia, Slovakia, Israel, Iran, Mongolia, Morocco, Algeria, Tunisia, Ethiopia, Cameroon, Thailand, Myanmar, Malaysia and The Philippines.
> US$40: Canada, Iceland, Norway, Finland, Switzerland, Italy, Greece, Egypt, Sudan, Saudi Arabia, Mozambique, Taiwan, South-Korea and Japan.
Method milk:feed price ratio
The milk:feed price ratio as defined by IFCN as the milk price divided by the price of purchased feed. In simplified form, it indicates how much feed (in kilograms of concentrate) it is possible for a farmer to buy with the sale proceeds from one kilogram of milk. The higher the ratio, the more economical it is to use concentrates to feed the dairy cows. Currently IFCN regards the ratio as favourable for the use of concentrates when it is higher than 1.5, which is when high-input high-yield dairy systems become profitable.
High milk:feed price ratios (more than 2.5)
Highly favourable milk: feed price ratios of more than 2.5 are found in Canada, Egypt, Greece, Kazakhstan, Mongolia, Saudi Arabia, Sudan and the USA. In most cases, the cause of a high milk:feed price ratio is a very high milk price (up to US$30/100 kg) while in a few cases it is caused by feed prices significantly below the world market level (such as in Kazakhstan).
Intermediate milk:feed price ratios (1.5-2.5)
Most countries of Europe and the Commonwealth of Independent States (CIS) fall into this category, as well as Argentina, Brazil, Ecuador, Ethiopia, India, Japan, Republic of Korea, Mexico, Morocco and Viet Nam.
Low milk: feed price ratios (less than 1.5)
Very unfavourable milk:feed price ratios (of less than 1.0) have been observed in Cameroon, Guatemala, Indonesia, Nigeria and Uganda, whereas they are slightly better (1.0 to 1.5) in Australia, China, Chile, Ireland, Myanmar, New Zealand, Norway, Pakistan, Peru, South Africa, Switzerland, Thailand, Turkey and Uruguay. In most cases, the causes of unfavourable milk:feed price ratios are low milk prices (less than US$20/100 kg). In a few cases, they are caused by feed prices significantly above the world market level, such as in Switzerland and Norway.
Conclusions
From the milk:feed price ratio, it is possible to obtain an indication of which types of dairy farming systems fit best into a given country or region. For instance, a high milk feed:price ratio indicates that it may be profitable to intensify a farming system. Once the milk:feed price ratio starts to fall – driven either by falling milk prices or increasing feed prices – ‘extensification’ of the system might be preferable.
Explanation of variables/sources of dataMilk prices: Average annual price paid per 100 kg milk with 4 percent fat and 3.3 percent protein (excluding VAT).Source: The results are based on national statistics, FAO and in certain cases based on estimates made by IFCN. Feed prices: Based on the IFCN feed price indicator : Calculation: 0.3 kg soybean meal price + 0.7 kg corn price, prices for corn/barley and soybean meal are based on national statistics provided by IFCN scientists; FAO; Eurostat. National statistics, surveys, and, in some cases, estimates of the IFCN.Milk:feed price ratio: Milk price divided by the calculated feed price.
Adapted from IFCN Dairy Report 2007, Chapter 2.2 and 2.5

© IFCN 2008 23
Milk:feed price ratio 2006
Source of data: National statistics/surveys, in some cases estimations.
Milk:feed price ratio (2006)
0.5 <= 1
> 1 <= 1.5
> 1.5 <= 2
> 2 <= 2.5
> 2.5
no data
Milk prices in US$ per 100 kg milk ECM in 2006
Source of data: National statistics/surveys, in some cases estimations.
US$/100 kg milk (ECM) in 2006
> 40
> 30 =< 40
> 25 =< 30
> 20 =< 25
<= 20
2.4 Farmers’ milk prices and milk:feed price ratio

24 © IFCN 2008
2.5 Dairy farm numbers world wide
Average dairy herd size
Cows per farm
<= 10
> 10 <= 30
> 30 <= 50
> 50 <= 100
> 100
no data
Data: Data refer to the year 2005 if available. If not available other years or estimates were taken. Source of data: National statistics.
Introduction
This section describes the structure of the dairy sector in selected countries, in terms of farm numbers and average dairy herd size. The aim of this chapter is to analyse the number of dairy farms / farming households world wide and also identify trends in farm numbers. This analysis is based on the latest data available coving the year 2005.
Dairy farm numbers
In 2005, there were some 115 million dairy farms in the 73 countries for which the IFCN has detailed information. Based on this number IFCN estimated a total number of dairy farms for 2005 of 149 million considering all countries. Assuming that the average farm household comprises five to six persons, about 750 to 895 million people, or 12 to 14 percent of the world population, directly depend to some extent on dairy farming.
The number of dairy farms is highest in India and Pakistan (75 and 14 million, respectively), followed by Brazil, China, Ethiopia, Iran, Romania, Russia, Turkey, Ukraine and Uzbekistan with 1.0 to 2.5 million dairy farms each. Farm numbers in the EU-15 countries (533 851) and the USA (78 300) seem rather low in comparison.
The development of dairy farm numbers shows two trends. In Argentina, Australia, Brazil, Europe, Japan, New Zealand, South Africa and the USA, numbers dropped by 2 to 10 percent per annum between 2000 and 2005 compared with annual increases of 0.5 to 10 percent in most developing countries.
The development of dairy farm numbers shows two trends. In Argentina, Australia, Brazil, Europe, Japan, New Zealand, South Africa and the USA, numbers dropped by 2-10 percent per annum between 2000 and 2005 compared with annual increases of 0.5-10 percent in most developing countries.
Dairy herd sizes
IFCN estimates that, globally, the average dairy herd size is 2.4 cows. In most countries, especially in Africa, Asia, Eastern Europe and parts of Latin America, the vast majority of dairy farms comprise less than ten cows, and only 15 countries have an average dairy herd size of more than 50 cows. The six countries with average dairy herds comprising more than 100 cows are: Argentina, Australia, Czech Republic, New Zealand, South Africa and the USA.
In most countries, average dairy herd sizes (0 to 5 additional cows per farm) did not change significantly in 2000-2005. The greatest increases during that period were observed in New Zealand (+79), Australia (+42), USA (+28), Denmark (+25), South Africa (+19), Israel (+16) and the Netherlands (+10).
Adapted from IFCN Dairy Report 2007, Chapter 3.6

© IFCN 2008 25
PK 14 mill
IN 75 mill
EU 25
78,300
13,000
9,200
12,300
4.6 mill .
1.29 mill
1.5 mill
Number of dairy farms 2005
Number of dairy farms – Annual growth rates 2000 -2005
Number of dairy farms in 2005
Annual growth rates in %
<= -10
> -10 <= -5
> -5 <= -1
> -1 <= 1
> 1
no data
Data: Data refer to the year 2005 if available. If not available other years or estimates were taken. Source of data: National statistics.
Data: Data refer to the year 2000 and 2005 if available. If not available other years or estimates were taken. Source of data: National statistics.
2.5 Dairy farm numbers world wide

26 © IFCN 2008
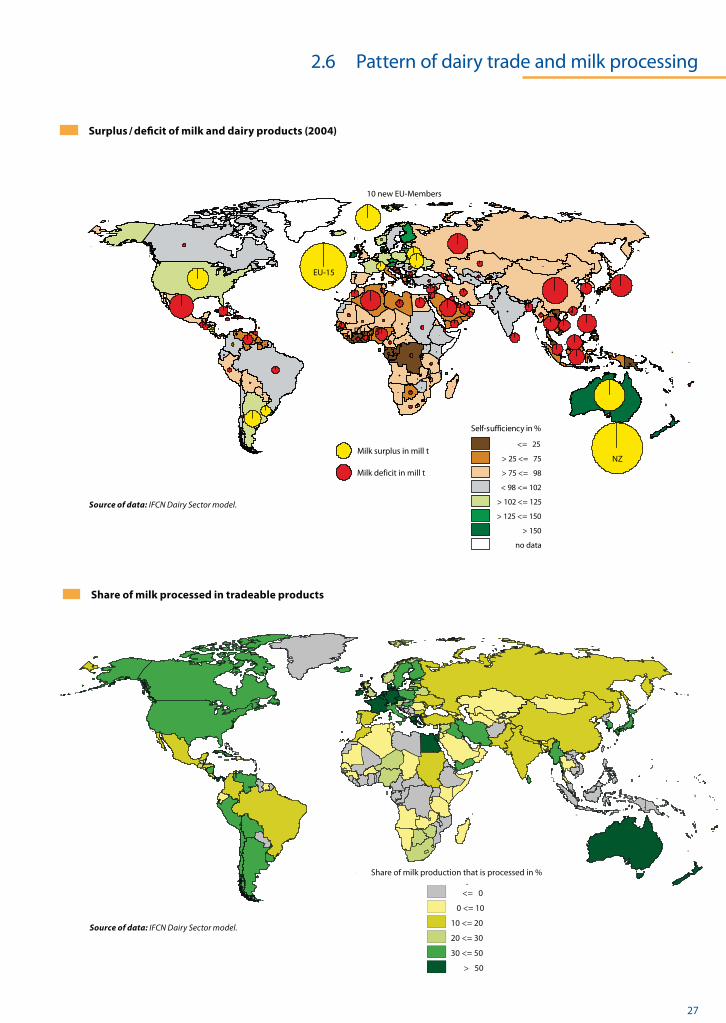
2.6 Pattern of dairy trade and milk processing
Introduction
This section describes the pattern of world dairy trade, the purpose being to identify the major dairy exporters and importers and illustrate the degree of self sufficiency and milk processing structure by country. The analysis is based on that of the IFCN undertaken in 2006 covering the period 1990 to 2004. It should be mentioned, however, that the core competence of the IFCN relates more to milk production rather than to trade and milk consumption.
Top ten net exporting/importing countries
The following table shows the largest net milk exporters/importers in 2003-2004. It should be noted that the list is based on net trade figures, that is, the balance of exports of milk after subtracting the quantities imported converted to ME.
Net exporters Net importers1 New Zealand China2 EU-15 Mexico3 Australia Japan4 EU-10 New members Algeria5 USA Russian Federation6 Argentina Philippines7 Ukraine Saudi Arabia8 Belarus Indonesia9 Uruguay Nigeria10 Switzerland Viet Nam
Milk self-sufficiency, surplus and deficit
Few countries are self-sufficient in milk, which means they import more dairy products than they export. Very low self-sufficiency rates in milk (less than 25 percent) were observed in Bahrain, Democratic Republic of the Congo, Côte d’Ivoire, Gabon, Gambia, Ghana, Jamaica, Kuwait, Liberia, Malaysia, Papua New Guinea, Philippines, United Arab Emirates and Viet Nam.
Share of milk processed in tradable dairy products
Tradable dairy products comprise condensed milk, cheese, dry milk products, butter/ghee, which, due to processing are far less perishable (and bulky) than liquid milk. A high share of tradable dairy products in relation to national milk production indicates that a considerable amount of milk passes through the formal sector, but also that the national dairy industry is exposed to competition from other countries in a liberal agricultural trade environment. Globally, countries can be divided into three groups with respect to the shares of milk processed into tradable products:
High shares (more than 50 percent): Australia, Belgium, Czech Republic, Denmark, France, Germany, Ireland, Netherlands and New Zealand convert more than 50 percent of their milk production into tradable dairy products.
Moderate shares (30-50 percent): Results of around 30 to 50 percent were observed for Argentina, Chile, Estonia, Italy, Finland, Hungary, Iceland, Japan, Republic of Korea, Lithuania, North America, Peru, Poland, Sweden, Switzerland and Venezuela.
Low shares (less than 30 percent): In developing countries the share of milk processed into tradable dairy products is rather low (0 to 20 percent), as seen for instance in Africa, Asia and countries of Latin America. Low shares have been also observed for Spain, Ukraine and Russia.
Share of milk production traded
Based on the analysis 2004 about 7.1 percent or world milk production is traded internationally (Intra-EU trade excluded). With respect to milk delivered to milk processors, we estimate the share traded internationally to be in the order of 24 percent.
Explanation of method/sources of dataSources of data: FAO, ZMP, USDA, EUROSTAT, national statistics or estimates; for some cases no statistics were available.Analysis: The IFCN dairy sector model for 2006, using the milk equivalent ‘total solids’ concept. Milk production was adjusted to ECM. Milk processing: These data are based on the IFCN survey doe in 2006 based 2004 data. Data for milk delivered to processors was based on national statistics. Tradable dairy products comprise condensed milk, cheese, dry milk products, butter/ghee.Self-sufficiency in milk production: National milk production/milk consumption.
Adapted from the IFCN Dairy Report 2006, Chapter 3.4, IFCN Dairy Report 2005 4.19
© IFCN 2008 27
EU-15
10 new EU-Members
Self-sufficiency in %
<= 25
> 25 <= 75
> 75 <= 98
< 98 <= 102
> 102 <= 125
> 125 <= 150
> 150
no data
Milk surplus in mill t
Milk deficit in mill t
EU-15
NZ
Surplus / deficit of milk and dairy products (2004)
NZ
Share of milk processed in tradeable products
Share of milk production that is processed in %
<= 0
0 <= 10
10 <= 20
20 <= 30
30 <= 50
> 50
2.6 Pattern of dairy trade and milk processing
Source of data: IFCN Dairy Sector model.
Source of data: IFCN Dairy Sector model.

28 © IFCN 2008
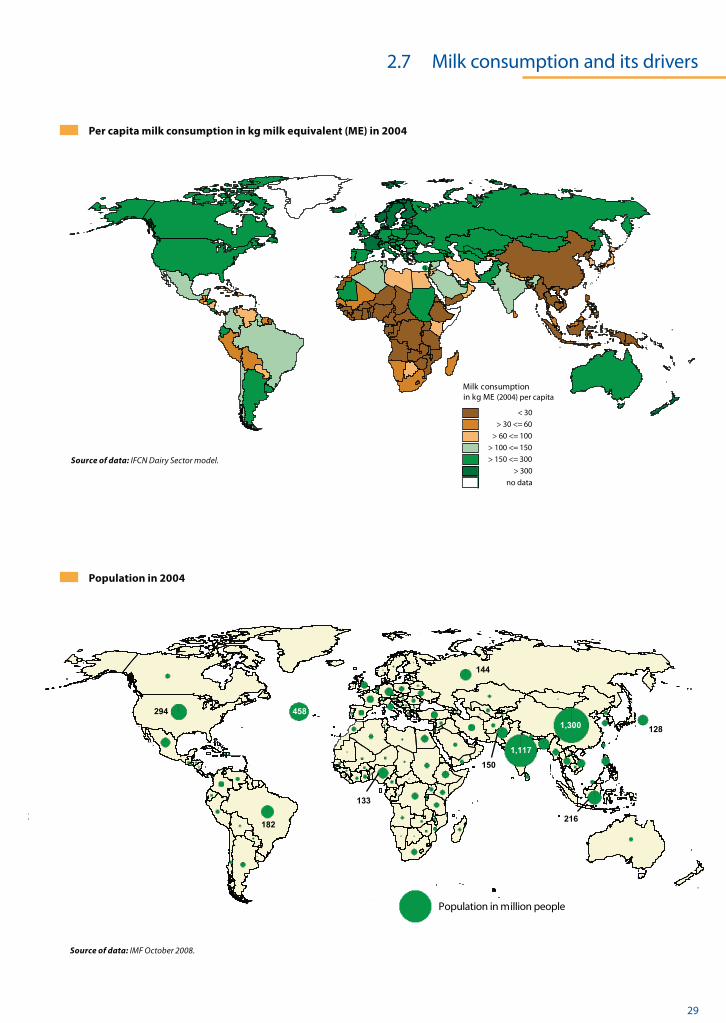
2.7 Milk consumption and its drivers
Introduction
Milk demand is driven by two factors: per capita milk consumption and population. The aim of this section is to give a global overview of both indicators via world maps, with a description of country-specific differences. The analysis covers the year 2004 as it refers to the trade analysis shown in Section 2.6.
Method – Per capita milk consumption
The method used to calculate per capita consumption is described in the IFCN Dairy Report 2004, which is based on ‘milk equivalents’ (MEs) so as to account for the consumption of milk in its different forms, such as yoghurt or cheese, in addition to liquid milk. The per capita consumption was calculated as follows: milk production (in ME) minus exports (in ME) plus imports (in ME) plus/minus changes in stocks (in ME) divided by human population. The ‘total solids’ method was used to convert dairy products into ME. It should be mentioned that the results differ significantly when alternative methods for ME conversion are used. For details, see Chapter 3.6 of the IFCN Dairy Report 2004.
Per capita milk consumption per country
As a general rule milk consumption is high in developed countries and low in the developing ones, and appears to be particularly low in tropical and subtropical climates. Based on country-specific estimates of per capita milk consumption, the following three categories have been defined:
High, more than 150 kg per capita/year: Argentina, most CIS countries, Costa Rica, Ecuador, Europe , Honduras, Israel, Lebanon, North America, Oceania, Turkey, Uruguay and others such as Pakistan and Sudan.
Medium, 30-150 kg per capita/year: India, Japan, Republic of Korea, North and Southern Africa, most countries of the Middle East and Latin America (except Argentina, Ecuador and Uruguay).
Low, less than 30 kg per capita/year: China, Ethiopia, Yemen and most countries of Central Africa and East and Southeast Asia
Population status 2004 and trends
About 60 percent of the world population live in South, East and South-East Asia, with China and India alone accounting for about 38 percent. Another 14 percent is to be found in Africa. In all these countries (except India, Pakistan and some African countries), milk consumption is generally below 30 kg of milk (ME) per capita. Western Europe and North America account for 11 percent of the world population with an average per capita consumption of approximately 300 kg of milk (ME) per year.
Examples of milk demand growth
Some simple examples illustrate how milk demand can develop: once milk consumption in China (2004 = 22 kg of milk (ME) per capita) increases to the level of Japan (78 kg of milk (ME) per capita) it will require about 72 million tons of milk, which is almost equal to the production volume of the USA. Once milk consumption all over India increases from 93 kg milk per capita to the level typical of the richer states of Punjab and Haryana (IFCN estimate 200 to 250 kg milk per capita), this will call for an additional 17 million tons of milk − which is more than the EU-25 was producing in 2006.
The two drivers of milk demand
In past years, milk consumption has risen by 10 to 20 million tons per year, one driver being human population growth. A global population growth rate of 1.2 to 1.3 percent per year means 75 to 80 million more people each year. Using the world average per capita milk consumption, this would mean that population growth accounts for an increase in milk consumption of 7 to 9 million tons per year. The second driver of milk consumption is increasing per capita consumption. However, this driver in turn depends largely on per capita income developments, especially in developing countries.
Explanation of method/sources of dataMethod: The ’total solids’ method was used to convert dairy products into ME Source of data: IFCN Dairy Sector model, Analysis done in 2006
Adapted from IFCN Dairy Report 2006, Chapter 3.6
© IFCN 2008 29
IL
Milk consumption in kg ME (2004) per capita
< 30
> 30 <= 60
> 60 <= 100
> 100 <= 150
> 150 <= 300
> 300
no data
Population in 2004
Per capita milk consumption in kg milk equivalent (ME) in 2004
458
1,117
1,300
144
294
182
133
150
128
216
Population in million people
2.7 Milk consumption and its drivers
Source of data: IMF October 2008.
Source of data: IFCN Dairy Sector model.
India
Uganda

China

India

Chapter 3Milk Production and Dairy Sector Profiles
Germany
Pictures on this and previous double page: Kids on farms (Pictures by: Amit Saha, Asaah Ndambi and Katja Seifert)
3.1 Summary 34
3.2 India 38
3.3 Pakistan 42
3.4 Bangladesh 46
3.5 Thailand 50
3.6 Viet Nam 54
3.7 China 58
3.8 Uganda 62
3.9 Cameroon 66
3.10 Morocco 70
3.11 Peru 74
3.12 Germany 78
3.13 United States of America 82
3.14 New Zealand 86

34 © IFCN 2008
3.1 Summary
Introduction
This chapter contains a country-by-country analysis of the status of, and developments in, national dairy sectors and provides the wider perspective for the detailed farm-level analysis in the following Chapter. Because the availability and quality of data in most developing countries is problematic, the time frame chosen for this analysis, 1996 to 2005, relates to information contained in the IFCN Dairy Reports, 2006 and 2007. The country profiles provide an overview of a number of indicators illustrating the trends and drivers for milk supply and demand, and the dairy chain. The intention is to give each country’s dairy sector a ’face’. In all cases, it has been attempted to make the indicators comparable between the countries.
For the purpose of this analysis, ten developing countries were chosen as well as three developed dairy countries (Germany, New Zealand and USA) to put the developing countries analysed into a global context. The developing countries are Bangladesh, Cameroon, the People’s Republic of China (henceforth China), India, Morocco, Pakistan, Peru, Thailand, Uganda and Viet Nam. Comparable data were available because the IFCN is well established there.
India
With an annual production of 108 million tons of ECM, 65 percent of which is produced by buffaloes, and a national herd of 113 million head of cattle/buffaloes, India is the world’s largest milk-producing country. Some 75 million dairy farming households, with an average of 1.5 adult female cows or buffaloes per farm, are engaged in the sector each producing
about 4 litres of milk per farm/day. During the period under review, production rose by 3 to 4 percent per annum or approximately 4 million tons, thanks to higher milk yields and more cows and buffaloes.
The predominant dairy production systems may be classified as low-input/low-yield systems (956 litres/cow/year). Feeding is based mainly on crop residues such as straw and green fodder, supplemented by small quantities of low-cost compound feed. Milking is done by hand and the milk transported to village collection centres or collected by local milkmen. About 45 percent of the milk is used by the farming households and only 15 to 20 percent is delivered to formal milk processors.
Annual per capita milk consumption increased by 1.5 to 2.4 percent per annum from 1990, reaching 98 kg in 2005.
Previously, rising demand for milk was mainly driven by population growth whereas increases in per capita consumption have now become an additional driver. India has always been 100 percent self-sufficient in milk, with total imports/exports of only 0.3 million tons per annum; it may thus be considered as almost unconnected with the world dairy market.
Pakistan
With a production of 34.4 million tons of ECM, Pakistan was the world’s third largest producer of milk in 2005, with buffaloes accounting for 75 percent of production. Milk is produced by
approximately 15 million dairy farming households with an average of 1.8 adult cows or buffaloes per farm producing approximately 6.4 litres of milk per farm/day. Between 2000 and 2005, production grew by 2.9 percent per annum, thanks more to increased numbers of milking animals than to higher milk yields.
Dairy production systems in Pakistan are similar to those in India. Most (50 percent) of the milk is consumed by the farming households or sold on the informal market (40 percent); less than 10 percent is delivered to formal milk processors.
By 2005, yearly milk consumption in Pakistan had reached 230 kg per capita, significantly higher than in India. Increased demand for milk was mainly driven by population growth (from 2.0 to 2.2 percent per annum). Like India, Pakistan has always been completely self-sufficient in milk, with imports/exports of only 0.22 million tons per annum.
Bangladesh
Dairy production systems in Bangladesh are similar to those in India and Pakistan. However, milk production and yields (2.8 million
tons ECM from cows and buffaloes, and 711 kg of ECM per cow/per day, respectively) are significantly lower than in India and Pakistan.
Most of the milk is consumed by farming households or sold on the informal market, and less than 20 percent is delivered to formal milk processors. In 2005, per capita milk
© IFCN 2008 35
3.1 Summary
consumption stood at only 32 kg/year. Bangladesh is 85 percent self-sufficient in milk and imports 0.4 million tons per annum.
Thailand
In 2005, Thailand produced 0.8 million tons of ECM, less than 1 percent of that produced by India. Nevertheless, with an annual increase of 8.4 percent, production has increased rapidly since
2000, mainly thanks to greater numbers of cows.
With an average of 20 cows per farm, Thailand’s dairy herds are significantly larger than those in Bangladesh, India and Pakistan. Moreover, the country’s dairy farming systems are more intensive than in other parts of South Asia owing to its development policy and high milk prices (about 30 to 40 percent above those in India). Dairy production relies mostly on Holstein cows that have higher milk yields than the buffaloes or local cows used in Bangladesh, India and Pakistan. Milking is mainly done by machine and about 95 percent of the milk is delivered to formal milk processors.
In 2005, yearly milk consumption stood at 21 kg per capita. Thanks to its substantially increased production, the country’s milk self-sufficiency increased from 33 percent in 1996 to 47 percent in 2005. Nevertheless, Thailand’s annual milk deficit stands at approximately 1 million tons.
Viet Nam
With a production level of 0.23 million tons of ECM in 2005, Viet Nam is the smallest milk producer of the Asian countries covered by the analysis. However, during the period
under review, milk production grew by more than 20 percent per annum, mainly driven by increasing milk yields that had reached 1.73 tons per cow/year by 2005.
On average, dairy farms in Viet Nam have 6.9 cows producing 32 litres of milk per farm/day. Production is mainly based on imported dairy cattle or crossbreds with local cattle. As in Thailand, about 95 percent of Viet Nam’s milk is delivered to formal milk processors.
Per capita milk consumption increased from 4 litres in 1996
to 10 litres in 2005. Viet Nam is currently 25 percent self-sufficient in milk, and imports about 0.6 to 0.8 million tons per year.
China
In 2005, China was the world’s fifth largest producer of milk, accounting for 24.5 million tons of ECM from cows and (to a lesser degree) buffaloes. Based on yearly increases of
27.2 percent in the production of cow’s milk over the period 2000 to 2005, China should rapidly become the world’s third largest milk producer. Moreover, as most of the milk is sent to formal processors, China will soon rank second in terms of milk processing volumes. Production growth has been driven mainly by increased numbers of cows rather than increased milk yields.
With an average of 3.7 tons per cow/annum, China’s milk yields are the highest of all the Asian countries covered by the analysis. While the average herd size stands at 6.7 cows, Chinese dairy farms fall into two categories: small farms with 1 to 40 cows; and large farms with more than 200 cows. The small farms usually deliver their milk to a local collection point, take their cows to village milking centres or belong to a ‘dairy garden’ for which investors have provided the basic dairy infrastructure. The larger farms are either operated by the state (mainly in the southeast) or by private investors with close ties to the major dairy companies. As most dairy farms in China have insufficient land, farmers are obliged to purchase compound feed and roughage, the latter mainly in the form of corn silage.
Annual per capita milk consumption increased from 8 litres in 2000 to 22 litres in 2005 and to an estimated 28 litres in 2007. Of all the milk consumed in China, 86 percent is produced within the country.
Uganda
In 2005, Uganda’s 0.8 million dairy farmers, with an average of 2 cows/farm yielding 3.6 litres of milk per farm/day, produced 1.4 million tons of ECM. Annual milk production has risen by 13.1
percent since 2000, mainly thanks to increased milk yields
36 © IFCN 2008
3.1 Summary
(from 510 kg/cow/year in 2000 to 800 kg/cow/year in 2005). Milk supply in Uganda is very seasonal, peaking in April with 125 percent of the yearly average and at its lowest in June/July with only 65 percent of the yearly average.
Uganda’s dairy farming systems may be classified as low-input/low-yield. Feeding is based mainly on grazing supplemented by small quantities of low-cost compound feed. Milking is done by hand and the milk transported to milk collection centres in villages or collected by local milkmen. About 30 percent is consumed on-farm.
In 2005, annual per capita milk consumption stood at 50 kg, increasing by 4 to 6 percent per annum. As yearly population growth is in excess of 3 percent, it follows that national milk demand is increasing by 8 to 10 percent per annum. Uganda is currently self-sufficient in milk and neither imports nor exports significant volumes. Only 2 percent is delivered to milk formal processors.
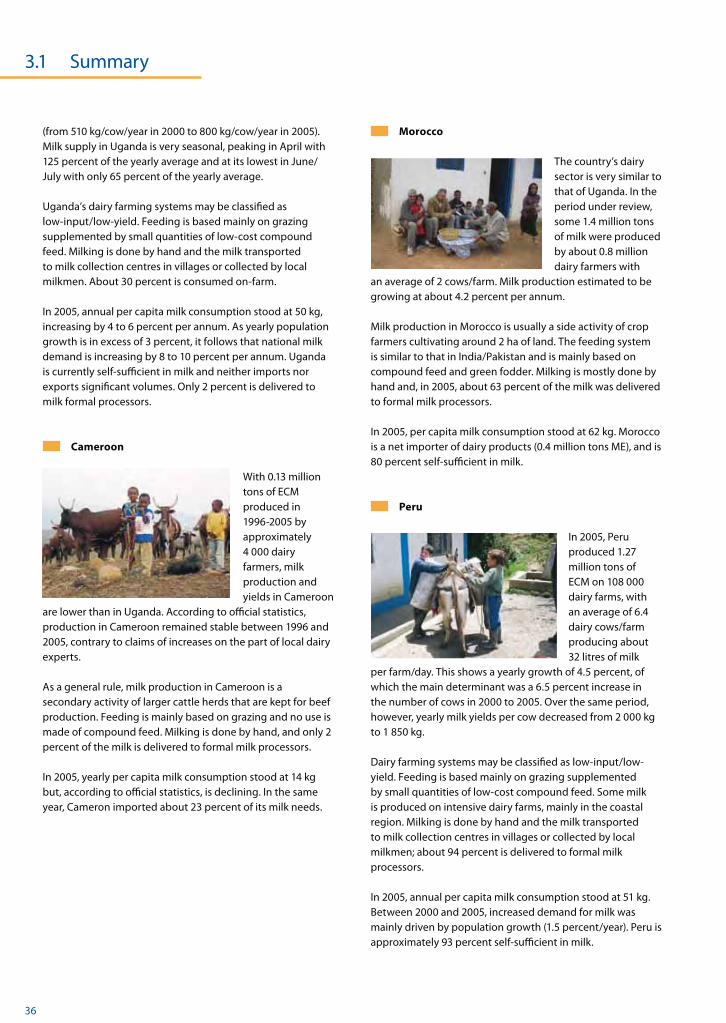
Cameroon
With 0.13 million tons of ECM produced in 1996-2005 by approximately 4 000 dairy farmers, milk production and yields in Cameroon
are lower than in Uganda. According to official statistics, production in Cameroon remained stable between 1996 and 2005, contrary to claims of increases on the part of local dairy experts.
As a general rule, milk production in Cameroon is a secondary activity of larger cattle herds that are kept for beef production. Feeding is mainly based on grazing and no use is made of compound feed. Milking is done by hand, and only 2 percent of the milk is delivered to formal milk processors.
In 2005, yearly per capita milk consumption stood at 14 kg but, according to official statistics, is declining. In the same year, Cameron imported about 23 percent of its milk needs.
Morocco
The country’s dairy sector is very similar to that of Uganda. In the period under review, some 1.4 million tons of milk were produced by about 0.8 million dairy farmers with
an average of 2 cows/farm. Milk production estimated to be growing at about 4.2 percent per annum.
Milk production in Morocco is usually a side activity of crop farmers cultivating around 2 ha of land. The feeding system is similar to that in India/Pakistan and is mainly based on compound feed and green fodder. Milking is mostly done by hand and, in 2005, about 63 percent of the milk was delivered to formal milk processors.
In 2005, per capita milk consumption stood at 62 kg. Morocco is a net importer of dairy products (0.4 million tons ME), and is 80 percent self-sufficient in milk.
Peru
In 2005, Peru produced 1.27 million tons of ECM on 108 000 dairy farms, with an average of 6.4 dairy cows/farm producing about 32 litres of milk
per farm/day. This shows a yearly growth of 4.5 percent, of which the main determinant was a 6.5 percent increase in the number of cows in 2000 to 2005. Over the same period, however, yearly milk yields per cow decreased from 2 000 kg to 1 850 kg.
Dairy farming systems may be classified as low-input/low-yield. Feeding is based mainly on grazing supplemented by small quantities of low-cost compound feed. Some milk is produced on intensive dairy farms, mainly in the coastal region. Milking is done by hand and the milk transported to milk collection centres in villages or collected by local milkmen; about 94 percent is delivered to formal milk processors.
In 2005, annual per capita milk consumption stood at 51 kg. Between 2000 and 2005, increased demand for milk was mainly driven by population growth (1.5 percent/year). Peru is approximately 93 percent self-sufficient in milk.

© IFCN 2008 37
Germany
Germany was the world’s fourth largest producer of milk in 2005, accounting for 29.5 million tons of ECM, and the second largest milk processor (behind
the USA). Milk is produced by 110 000 dairy farmers with average herds of 37.6 cows producing 732 kg of milk/day (19.5 kg/cow). National milk production has been stable since 1990 because of the milk quota system. Yields increased by 2 percent per annum in 2000 to 2005, although the number of dairy cows decreased by 2 percent per annum over the same period.
The country’s dairy production systems may be classified as high-input/high-output (7 100 litres per cow/year). Feeding is based mainly on grass/corn silage and compound feed. Milking is done by machine, after which the milk is stored on-farm in cooling tanks and collected by local milk processors every two days. About 95 percent is delivered to milk processors; the remainder is either used on the farms (for home consumption or for feeding calves) or is sold directly to consumers.
Having remained stable since 1996, the country’s annual per capita consumption stood at 309 kg of ECM in 2005. As a member of the EU, Germany exports about 40 percent of its milk and imports some 30 percent of its consumption needs. The country is 116 to 127 percent self-sufficient in milk, which translates into a surplus of 4 to 6 million tons per annum.
United States of America
The USA produces 76 million tons of ECM/year, generated by 78 000 dairy farms with average dairy herds of 115 cows producing 2 643 litres/day (or 23 litres/cow). Since
1975, national milk production has grown steadily by 1.1 percent per annum, driven by yield increases of 1.5 percent and a 0.3 percent reduction in the number of dairy cows.
The country’s dairy production systems may be classified
as high-input/high-output (8 400 litres per cow/year). As in Germany, feeding is based mainly on grass/corn silage and compound feed. The cows are milked by machine, mainly in milking parlours, and the milk is stored on-farm in cooling tanks before being sent to formal processors. About 99 percent is delivered to processors.
Since 2000, annual per capita milk consumption has remained stable at around 250 kg of ECM. In 2005, the USA exported about 3.4 percent of its milk and imported 2.8 percent of its internal demand. Self-sufficiency stood at around 104 percent in 2000 to 2005, translating into an annual milk surplus of 3 to 5 million tons.
New Zealand
In 2005, New Zealand produced 15.8 million tons of ECM, corresponding to about 20 percent of that in the USA. This was produced by 12 300 dairy farmers with average dairy herds of 315 cows yielding 3 526 kg/day (or 11.2 kg/cow).
Production increased by 4.6 percent per annum in 2000 to 2005, mainly driven by increased numbers of cows,
The country’s dairy production systems may be defined as intermediate-input/intermediate-output (3 868 litres per cow/year). Feeding is based mainly on grazing. Milk production is therefore seasonal, peaking in November (180 percent of the annual average) and at its lowest in June and July (5 to 10 percent). Milking usually takes place in swing-over parlours or rotary milking systems, after which the milk is stored in cooling tanks on-farm and subsequently collected by local milk processors. Almost 100 percent of the milk is delivered to formal milk processors.
New Zealand exports about 95 percent of its milk production and, with an export volume of about 15 million tons, it is the world’s largest exporter of the commodity.
3.1 Summary

India
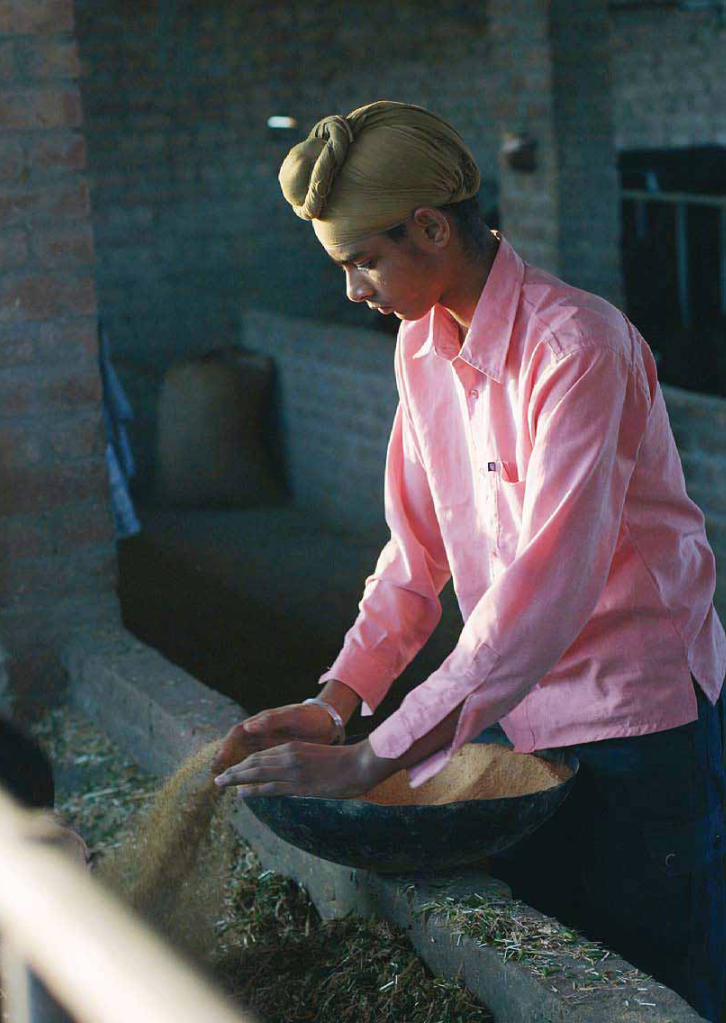

40 © IFCN 2008
Milk pricing and quality
Production vs demand Export / Import profilein Mill tons ME
Processing profile in % of milk produced
Consumption pattern in kg ME / capita / year
Status and key developments
Milk prices and tariffs The chain for liquid milk
Trade ratios
Seasonality profile 2004
Self-sufficiency in milkExports / nat. productionImports / nat. consumption
in Mill tons ME
Surplus / deficit
Milk productionDemand Imports
Exports
year average = 100
Milk price monthlyMilk production monthly
Published in IFCN Dairy Report 2006, Chapter 3.
50
60
70
80
90
100
110
120
130
140
150
Milk price monthlyMilk production monthly
Dec
NovOct
Sep
Au
gJu
lJu
nM
ayA
pr
Mar
Feb
Jan
0
200
400
600
800
1,000
1,200
1,400
1,600
2004
2003
2002
2001
2000
1999
1998
1997
1996
Consumer price
Margin (Processor, retailer, VAT)»Farmers' milk price« (ECM)
0
200
400
600
800
1,000
1,200
1,400
1,600
1,800
World market price + 2004 tariffs
World market price (SMP/butter)Milk price in the country
2004
2003
2002
2001
2000
1999
1998
1997
1996
0
20
40
60
80
100
120
2004
2003
2002
2001
2000
1999
1998
1997
1996
1995
1994
1993
1992
1991
1990
0 %
10 %
20 %
30 %
40 %
50 %
60 %
70 %
80 %
90 %
100 %
2004
2003
2002
2001
2000
1999
1998
1997
1996
1995
1994
1993
1992
1991
1990
0.00
0.05
0.10
0.15
0.20
0.25
0.30
0.35
2004
2003
2002
2001
2000
1999
1998
1997
1996
1995
1994
1993
1992
1991
1990
-20
0
20
40
60
80
100
120
2004
2003
2002
2001
2000
1999
1998
1997
1996
1995
1994
1993
1992
1991
1990
Status 2004
- Tariff bounds (out of quotas): Butter 40 %, SMP 60 %- Share of farmers‘ price on consumer price: 77 % - VAT on consumer price: 0 %- Milk consumption: 99 kg ME per capita / year- Self-sufficiency in milk production: 100 %
Key developments 1990 - 2004 - Milk production: +3.88 % per year- Milk consumption per capita: +2.06 % per year- Population: +1.77 % per year- Self-sufficiency: Increased by 0.2 % points
in INR / 100 kg milk ECM in INR / 100 kg milk
ExplanationsMethod: See IFCN Dairy Report 2006, Chapter 3.1 - 3.10 for details. * Residual: Fresh milk products. Consumer product: Toned milk with 3 % fat, and 8.5 % solid non fat. Sources: International statistics (FAO, ZMP, USDA, EUROSTAT, FAPRI, AMAD, MAD, UNSTAD-TRAINS) and national statistics. Estimates done for: Fat / protein content (buffalos 6.0 % / 4.2 %; cows 4 % / 3.2 %); HH / on farm use (FAO, PPLPI), seasonality profile, milk pricing & quality.
1990 1992 1994 1996 1998 2000 2001 2002 2003 2004
100 % 100 % 100 % 100 % 100 % 100 % 100 % 100 % 100 % 100 % 0 % 0 % 0 % 0 % 0 % 0 % 0 % 0 % 0 % 0 % 0 % 0 % 0 % 0 % 0 % 0 % 0 % 0 % 0 % 0 %
Milk pricing of a »typical« processor
Producer Price (INR / litre)
Region Milk Types Cow Buffalo Mix Northern 9.31 12.51 11.32 (4.4/8.2)* (6.6/8.6) (6.0/8.6)Southern 10.11 12.69 9.35 (4.3/8.2) (6.9/8.9) (4.2/8.5)Eastern 9.58 11.55 10.18 (4.3/8.4) (6.2/8.88) (5.0/8.5)Western 9.08 13.43 -- (4.0/8.5) (7.0/9.1) --All India 9.59 12.85 9.99 (4.2/8.4) (6.8/8.8) (4.8/8.5)
* Figure in brackets refers to fat and SNF in percentage
Milk of the informal market + the milk of the formal market (processed)HH/on farm use
3.2 India – Milk production and dairy sector profile
Pictures on previous double page by Katja Seifert.

© IFCN 2008 41
Key variables
Farm structure 2005
Milk production in ECM Production (mill t)Cows (in 1,000’s )Yield (t / cow / year)
Farm structure No. of dairy farms (in 1,000’s)Average farm size (cow s / farm)Milk per farm (t milk / farm / year) Prices in national currencyCull cow price (EUR / kg live weight)Land price – buy (EUR / ha)Quota price (EUR / kg milk)
Farm structure Milk and feed price Milk / feed price ratio
Status and key developments
Size classes
% of dairy farms in size classes % of cows in size classes
% of cows in size classes EUR / 100 kg Milk price / feed price
Cows per size classFarms per size class
Milk / barley price ratioMilk / feed price ratio
World feed price (nominal)
Milk price (nominal) Milk price (real)Feed price (nominal)
Published in IFCN Dairy Report 2007, Chapter 3.
Change in milk production (% per year)
1.2
2.7
2.8 1.43.3
1.81.3
3.2 4.6
15.3
6.5
2.7
7.7
3.1
1.42.5
2.7
1.8
2.38.0
8.91.6
5.7
5.5
0.0-9.03.0
6.7
-2.64.5
0.0
-4.62.2 3.0
-1.9
3.2 India – Milk production and dairy sector profile
0 %
10 %
20 %
30 %
40 %
50 %
60 %
70 %
80 %
90 %
100 %
Total female bovines
Total male bovines
All
milk
spec
ies
Bu
ffal
o
Ind
igen
ou
sco
w
Cro
ssb
red
cow
2005
2004
2003
2002
2001
2000
1999
1998
1997
1996
0
100
200
300
400
500
600
700
800
900
1,000Favourable
Not favourable
0.0
0.5
1.0
1.5
2.0
2.5
3.0
2005
2004
2003
2002
2001
2000
1999
1998
1997
1996
Annual growth rates 1996 1998 2000 2001 2002 2003 2004 2005 2000 - 2005
83 90 94 96 98 103 108 3.8% 103 104 105 106 105 110 113 1.7% 0.8 0.9 0.9 0.9 0.9 0.9 1.0 2.1% IFCN estimate: increasing number of dairy farms 75 decreasing average farm size 1.5 1.4 10.5 11.0 11.5 12.0 12.3 12.5 13.0 13.2 2.8% 700,000 715,000 750,000 785,000 800,000 810,000 850,000 833,333 2.1%
INR / 100 kg
Milk / corn price ratio
0 %
10 %
20 %
30 %
40 %
50 %
60 %
70 %
80 %
90 %
100 %
In-milk
Dry
All
milk
sp
ecie
s
Bu
ffal
o
Ind
igen
ou
sco
w
Cro
ssb
red
cow
Annual changes in %-100 <= -5
> -5 <= -2.5> -2.5 <= -0.5> -0.5 <= 0.5
> 0.5 <= 2.5> 2.5 <= 5
> 5 <= 100no data
Status 2005
- No. of dairy farms: 75 mill- Average farm size: 1.5 cows per farm- Milk / feed price ratio: 1.5
Key developments 2000 - 2005 - Milk price: + 2.1 % per year- Feed prices: - 1.4 % per year- Milk / feed price ratio: stable- Land prices: + 2.1 % per year- Cull cow prices: + 2.8 % per year
Cull cow price (INR / kg live weight)Land price – buy (INR / ha)
ExplanationsMilk map details: Data base 2000 - 2005.Remark: Milk price is based on cows milk with 4.5% fat and 3.5% protein. Please note: 1996 refers to 1996 - 97 (April to March) and so on. Cull cow price: Selling price of unprodutive buffalo. Cull cow and land price: Average prices based on the states Punjab, Maharashtra, West Bengal and Kanataka.Estimate: Fat and protein content to calculate the national milk production into ECM. Source: National statistics, FAO, Eurostat, USDA, ZMP, IDF and estimations. Milk / feed price ratio: Method see Chapter 2. Milk prices are shown in ECM.
Cows and buffaloes (in mill)
Herd composition
% of cows dry % of cows in milk
Herd composition
% of female and male bovines
No. of dairy farms (in mill)
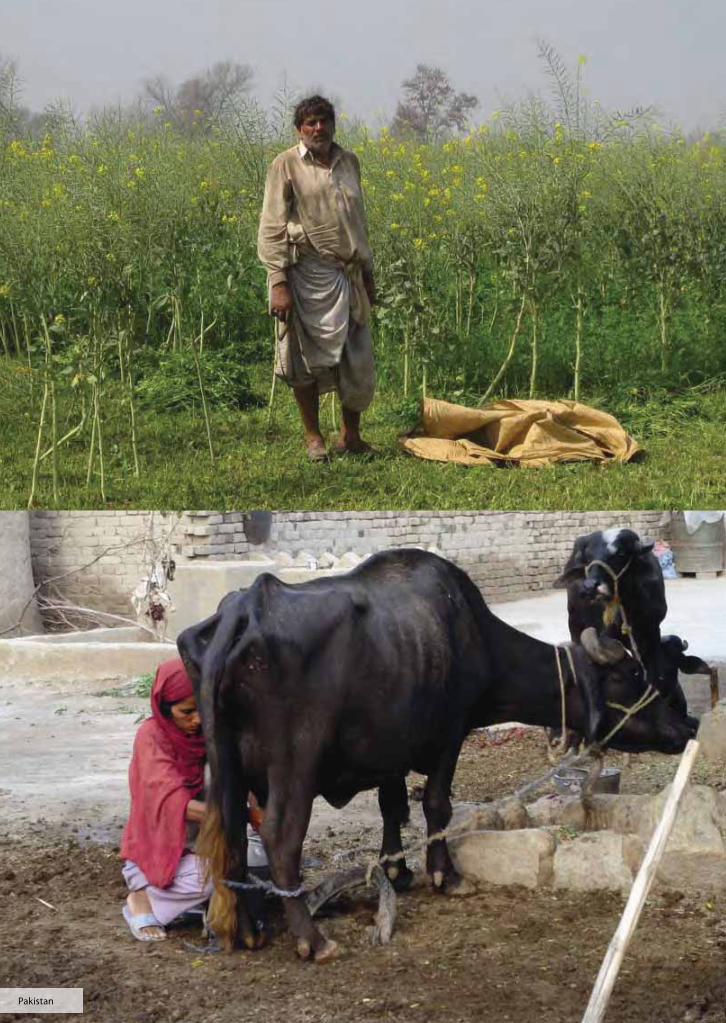
Pakistan

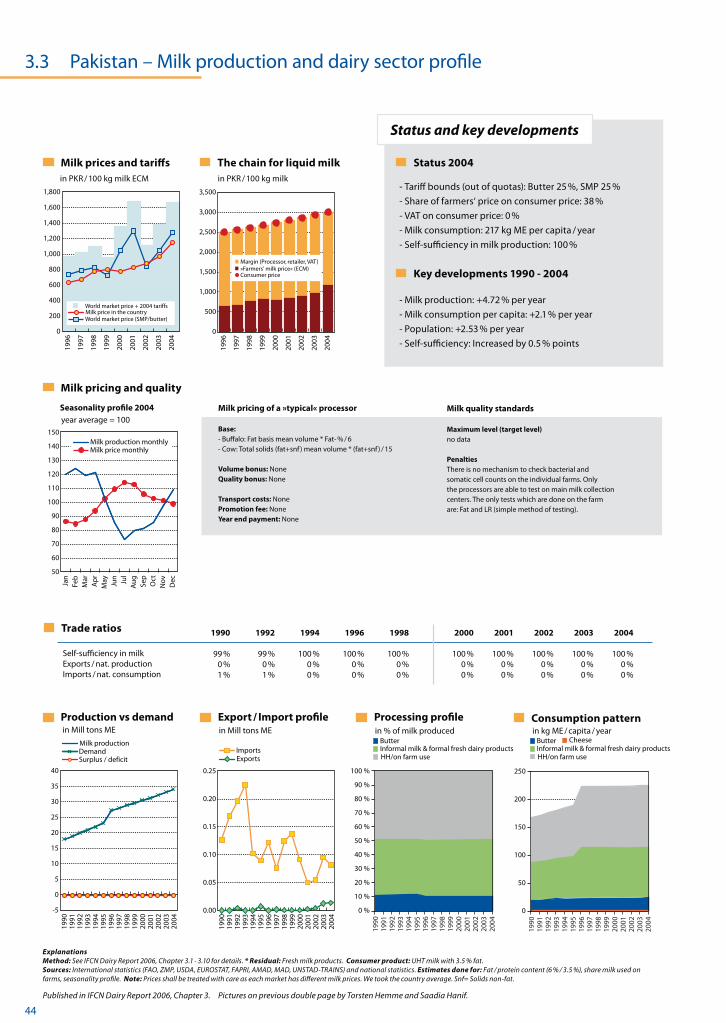
44 © IFCN 2008
Milk pricing and quality
Production vs demand Export / Import profilein Mill tons ME
Processing profile in % of milk produced
Consumption pattern in kg ME / capita / year
Status and key developments
Milk prices and tariffs The chain for liquid milk
Trade ratios
Seasonality profile 2004
Self-sufficiency in milkExports / nat. productionImports / nat. consumption
in Mill tons ME
Surplus / deficit
Milk productionDemand Imports
Exports
year average = 100
Milk price monthlyMilk production monthly
Published in IFCN Dairy Report 2006, Chapter 3.
0
500
1,000
1,500
2,000
2,500
3,000
3,500
2004
2003
2002
2001
2000
1999
1998
1997
1996
Consumer price
Margin (Processor, retailer, VAT)»Farmers' milk price« (ECM)
0
200
400
600
800
1,000
1,200
1,400
1,600
1,800
World market price + 2004 tariffs
World market price (SMP/butter)Milk price in the country
2004
2003
2002
2001
2000
1999
1998
1997
1996
in PKR / 100 kg milk ECM in PKR / 100 kg milk
3.3 Pakistan – Milk production and dairy sector profile
50
60
70
80
90
100
110
120
130
140
150
Milk price monthlyMilk production monthly
Dec
NovOct
Sep
Au
gJu
lJu
nM
ayA
pr
Mar
Feb
Jan
0
50
100
150
200
250
2004
2003
2002
2001
2000
1999
1998
1997
1996
1995
1994
1993
1992
1991
1990
0 %
10 %
20 %
30 %
40 %
50 %
60 %
70 %
80 %
90 %
100 %
2004
2003
2002
2001
2000
1999
1998
1997
1996
1995
1994
1993
1992
1991
1990
0.00
0.05
0.10
0.15
0.20
0.25
2004
2003
2002
2001
2000
1999
1998
1997
1996
1995
1994
1993
1992
1991
1990
-5
0
5
10
15
20
25
30
35
40
2004
2003
2002
2001
2000
1999
1998
1997
1996
1995
1994
1993
1992
1991
1990
Status 2004
- Tariff bounds (out of quotas): Butter 25 %, SMP 25 %- Share of farmers‘ price on consumer price: 38 % - VAT on consumer price: 0 %- Milk consumption: 217 kg ME per capita / year- Self-sufficiency in milk production: 100 %
Key developments 1990 - 2004 - Milk production: +4.72 % per year- Milk consumption per capita: +2.1 % per year- Population: +2.53 % per year- Self-sufficiency: Increased by 0.5 % points
ExplanationsMethod: See IFCN Dairy Report 2006, Chapter 3.1 - 3.10 for details. * Residual: Fresh milk products. Consumer product: UHT milk with 3.5 % fat.Sources: International statistics (FAO, ZMP, USDA, EUROSTAT, FAPRI, AMAD, MAD, UNSTAD-TRAINS) and national statistics. Estimates done for: Fat / protein content (6 % / 3.5 %), share milk used on farms, seasonality profile. Note: Prices shall be treated with care as each market has different milk prices. We took the country average. Snf= Solids non-fat.
1990 1992 1994 1996 1998 2000 2001 2002 2003 2004
99 % 99 % 100 % 100 % 100 % 100 % 100 % 100 % 100 % 100 % 0 % 0 % 0 % 0 % 0 % 0 % 0 % 0 % 0 % 0 % 1 % 1 % 0 % 0 % 0 % 0 % 0 % 0 % 0 % 0 %
Milk pricing of a »typical« processor
Base: - Buffalo: Fat basis mean volume * Fat- % / 6- Cow: Total solids (fat+snf ) mean volume * (fat+snf ) / 15
Volume bonus: NoneQuality bonus: None
Transport costs: NonePromotion fee: NoneYear end payment: None
Milk quality standards
Maximum level (target level)no data
PenaltiesThere is no mechanism to check bacterial and somatic cell counts on the individual farms. Onlythe processors are able to test on main milk collectioncenters. The only tests which are done on the farmare: Fat and LR (simple method of testing).
Informal milk & formal fresh dairy productsButter
HH/on farm useInformal milk & formal fresh dairy productsButter
HH/on farm use
Cheese
Pictures on previous double page by Torsten Hemme and Saadia Hanif.
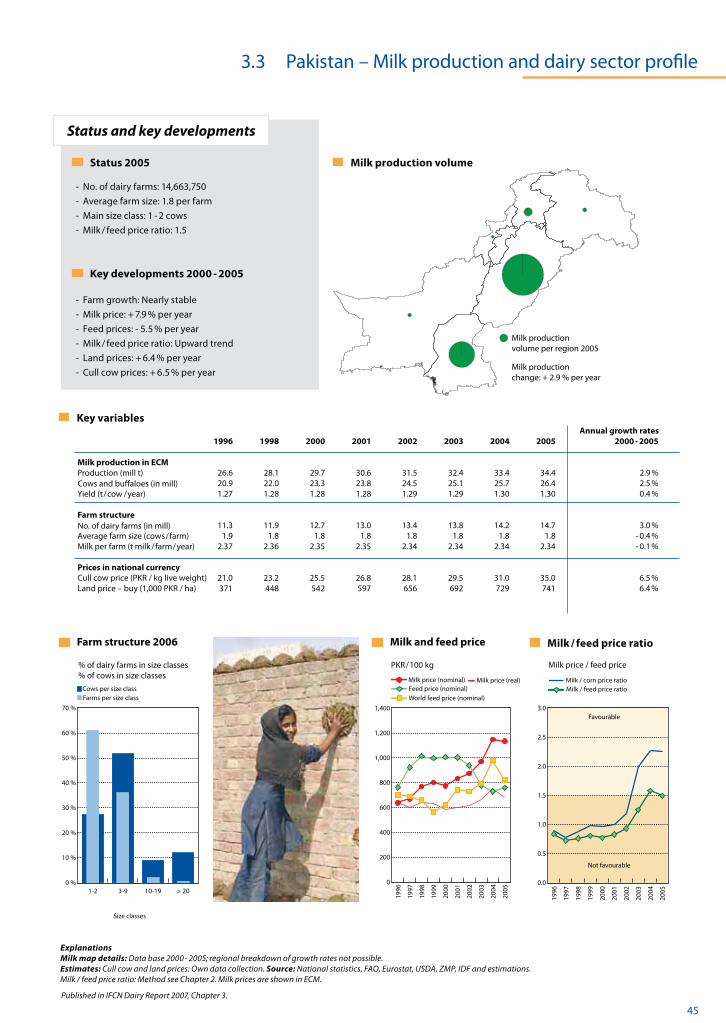
© IFCN 2008 45
Key variables
Farm structure 2005
Milk production in ECM Production (mill t)Cows (in 1,000’s )Yield (t / cow / year)
Farm structure No. of dairy farms (in 1,000’s)Average farm size (cow s / farm)Milk per farm (t milk / farm / year) Prices in national currencyCull cow price (EUR / kg live weight)Land price – buy (EUR / ha)Quota price (EUR / kg milk)
Farm structure Milk and feed price Milk / feed price ratio
Status and key developments
Size classes
% of dairy farms in size classes % of cows in size classes
% of cows in size classes EUR / 100 kg Milk price / feed price
Cows per size classFarms per size class
Milk / barley price ratioMilk / feed price ratio
World feed price (nominal)
Milk price (nominal) Milk price (real)Feed price (nominal)
Published in IFCN Dairy Report 2007, Chapter 3.
3.3 Pakistan – Milk production and dairy sector profile
0 %
10 %
20 %
30 %
40 %
50 %
60 %
70 %
80 %
90 %
100 %
16 - 25
> 40
6 - 15
26 - 40
1 - 5
2003
2002
2001
2000
1999
1998
1997
1996
2005
2004
2003
2002
2001
2000
1999
1998
1997
1996
0
200
400
600
800
1,000
1,200
1,400Favourable
Not favourable
0.0
0.5
1.0
1.5
2.0
2.5
3.0
2005
2004
2003
2002
2001
2000
1999
1998
1997
1996
0 %
10 %
20 %
30 %
40 %
50 %
60 %
70 %
> 2010-193-91-2
Milk production volume per region 2005
Milk production change: + 2.9 % per year
Annual growth rates 1996 1998 2000 2001 2002 2003 2004 2005 2000 - 2005
26.6 28.1 29.7 30.6 31.5 32.4 33.4 34.4 2.9 % 20.9 22.0 23.3 23.8 24.5 25.1 25.7 26.4 2.5 % 1.27 1.28 1.28 1.28 1.29 1.29 1.30 1.30 0.4 % 11.3 11.9 12.7 13.0 13.4 13.8 14.2 14.7 3.0 % 1.9 1.8 1.8 1.8 1.8 1.8 1.8 1.8 - 0.4 % 2.37 2.36 2.35 2.35 2.34 2.34 2.34 2.34 - 0.1 % 21.0 23.2 25.5 26.8 28.1 29.5 31.0 35.0 6.5 % 371 448 542 597 656 692 729 741 6.4 %
Status 2005
- No. of dairy farms: 14,663,750- Average farm size: 1.8 per farm- Main size class: 1 - 2 cows- Milk / feed price ratio: 1.5
Key developments 2000 - 2005 - Farm growth: Nearly stable- Milk price: + 7.9 % per year- Feed prices: - 5.5 % per year- Milk / feed price ratio: Upward trend- Land prices: + 6.4 % per year- Cull cow prices: + 6.5 % per year
Milk production volume
ExplanationsMilk map details: Data base 2000 - 2005; regional breakdown of growth rates not possible.Estimates: Cull cow and land prices: Own data collection. Source: National statistics, FAO, Eurostat, USDA, ZMP, IDF and estimations. Milk / feed price ratio: Method see Chapter 2. Milk prices are shown in ECM.
Cull cow price (PKR / kg live weight)Land price – buy (1,000 PKR / ha)
Cows and buffaloes (in mill)
PKR / 100 kg
Milk / corn price ratio
Farm structure 2006
No. of dairy farms (in mill)

Bangladesh


48 © IFCN 2008
Milk pricing and quality
Production vs demand Export / Import profilein Mill tons ME
Processing profile in % of milk produced
Consumption pattern in kg ME / capita / year
Status and key developments
Milk prices and tariffs The chain for liquid milk
Trade ratios
Seasonality profile 2004
Self-sufficiency in milkExports / nat. productionImports / nat. consumption
in Mill tons ME
Surplus / deficit
Milk productionDemand Imports
Exports
year average = 100
Milk price monthlyMilk production monthly
Published in IFCN Dairy Report 2006, Chapter 3.
3.4 Bangladesh – Milk production and dairy sector profile
0
200
400
600
800
1,000
1,200
1,400
1,600
1,800
2,000
World market price + 2004 tariffs
World market price (SMP/butter)Milk price in the country
2004
2003
2002
2001
2000
1999
1998
1997
1996
Status 2004
- Tariffs: Butter 30 %, SMP 30 %- Share of farmers‘ price on consumer price: 61 % - VAT on consumer price: 15 % - Milk consumption: 18 kg ME per capita / year- Self-sufficiency in milk production: 85 %
Key developments 1990 - 2004 - Milk production: +2.55 % per year- Milk consumption per capita: +0.35 % per year- Population: +2.26 % per year- Self-sufficiency: Decreased by -0.9 % points
in BDT / 100 kg milk (ECM)
ExplanationsMethod: See IFCN Dairy Report 2006, Chapter 3.1 - 3.10 for details. * Residual: Fresh milk products. Consumer product: Pasteurised liquid milk, per litreSources: International statistics (FAO, ZMP, USDA, EUROSTAT, FAPRI, IDF, EU Commission, OECD, AMAD, MAD, UNSTAD-TRAINS) and national statistics.Estimates done for: Fat / protein content of milk produced.Comments: Milk companies impose indirect tax which was taken as VAT.
0
500
1,000
1,500
2,000
2,500
3,000
3,500
2004
2003
2002
2001
2000
1999
1998
1997
1996
Consumer price
Margin (Processor, retailer, VAT)»Farmers' milk price« (ECM)
VAT (2004 only)
in BDT / 100 kg milk
0
2
4
6
8
10
12
14
16
18
20
2004
2003
2002
2001
2000
1999
1998
1997
1996
1995
1994
1993
1992
1991
1990
0 %
10 %
20 %
30 %
40 %
50 %
60 %
70 %
80 %
90 %
100 %
2004
2003
2002
2001
2000
1999
1998
1997
1996
1995
1994
1993
1992
1991
1990
0.00
0.05
0.10
0.15
0.20
0.25
0.30
0.35
0.40
0.45
2004
2003
2002
2001
2000
1999
1998
1997
1996
1995
1994
1993
1992
1991
1990
-1.0
-0.5
0.0
0.5
1.0
1.5
2.0
2.5
3.0
2004
2003
2002
2001
2000
1999
1998
1997
1996
1995
1994
1993
1992
1991
1990
HH/on farm use/informal milk & formal fresh dairy products
ButterCheeseCondensed milk
Dry productsButterCheese
HH/on farm use/informal milk & formal fresh dairy products
HH/on farm use/informal milk & formal fresh dairy
1990 1992 1994 1996 1998 2000 2001 2002 2003 2004
92% 94% 96% 97% 96% 94% 95% 93% 95% 93% 0% 0% 0% 0% 0% 0% 0% 0% 0% 0% 8% 6% 4% 3% 4% 6% 5% 7% 5% 7%
Pictures on previous double page by Mohammad Mohi Uddin.

© IFCN 2008 49
Key variables
Farm structure 2005
Milk production in ECM Production (mill t)Cows (in 1,000’s )Yield (t / cow / year)
Farm structure No. of dairy farms (in 1,000’s)Average farm size (cow s / farm)Milk per farm (t milk / farm / year) Prices in national currencyCull cow price (EUR / kg live weight)Land price – buy (EUR / ha)Quota price (EUR / kg milk)
Farm structure Milk and feed price Milk / feed price ratio
Status and key developments
Size classes
% of dairy farms in size classes % of cows in size classes
% of cows in size classes EUR / 100 kg Milk price / feed price
Cows per size classFarms per size class
Milk / barley price ratioMilk / feed price ratio
World feed price (nominal)
Milk price (nominal) Milk price (real)Feed price (nominal)
Published in IFCN Dairy Report 2007, Chapter 3.
3.4 Bangladesh – Milk production and dairy sector profile
2005
2004
2003
2002
2001
2000
1999
1998
1997
1996
0
500
1,000
1,500
2,000
2,500Favourable
Not favourable
0.0
0.5
1.0
1.5
2.0
2.5
3.0
2005
2004
2003
2002
2001
2000
1999
1998
1997
1996
Milk production volume per region 2003
Milk production change: + 0.5 % per year
Milk production volume
Status 2005
- Milk / feed price ratio: 1.8
Key developments 2000 - 2005 - Milk price: + 6.3 % per year- Feed prices: + 5.3 % per year- Milk / feed price ratio: Stable- Cull cow prices: + 12.9 % per year
Annual growth rates 1996 1998 2000 2001 2002 2003 2004 2005 2000 - 2005 2.7 2.7 2.7 2.8 2.8 2.8 2.8 2.8 0.5 % 3,785 3,705 3,835 3,866 3,896 3,926 3,926 3,926 0.5 % 0.7 0.7 0.7 0.7 0.7 0.7 0.7 0.7 0.1 % no statistics available no statistics available no statistics available 50 55 60 60 60 80 90 110 12.9 % no statistics available
Cows and buffaloes (in 1,000’s)
ExplanationsMilk map details: Data base 2003; regional breakdown of growth rates not possible; production estimate based on cow numbers.Milk/feed price: Corn price 2004 - 2005: Trend based on world market prices. Estimates: Fat and protein content to calculate milk production into ECM. Source: National statistics, FAO, Eurostat, USDA, ZMP, IDF and estimations. Milk / feed price ratio: Method see Chapter 2. Milk prices are shown in ECM. Photos: Milk production in Bangladesh (A.R. Khan).
BDT / 100 kg
Milk / corn price ratio
Cull cow price (BDT / kg live weight)Land price – buy (BDT / ha)

50 © IFCN 2008Thailand

© IFCN 2008 51

52 © IFCN 2008
Milk pricing and quality
Production vs demand Export / Import profilein Mill tons ME
Processing profile in % of milk produced
Consumption pattern in kg ME / capita / year
Status and key developments
Milk prices and tariffs The chain for liquid milk
Trade ratios
Seasonality profile 2004
Self-sufficiency in milkExports / nat. productionImports / nat. consumption
in Mill tons ME
Surplus / deficit
Milk productionDemand Imports
Exports
year average = 100
Milk price monthlyMilk production monthly
Published in IFCN Dairy Report 2006, Chapter 3.
0
5
10
15
20
25
30
35
2004
2003
2002
2001
2000
1999
1998
1997
1996
1995
1994
1993
1992
1991
1990
0 %
10 %
20 %
30 %
40 %
50 %
60 %
70 %
80 %
90 %
100 %
2004
2003
2002
2001
2000
1999
1998
1997
1996
1995
1994
1993
1992
1991
1990
0.0
0.2
0.4
0.6
0.8
1.0
1.2
1.4
1.6
2004
2003
2002
2001
2000
1999
1998
1997
1996
1995
1994
1993
1992
1991
1990
-1.5
-1.0
-0.5
0.0
0.5
1.0
1.5
2.0
2004
2003
2002
2001
2000
1999
1998
1997
1996
1995
1994
1993
1992
1991
1990
3.5 Thailand – Milk production and dairy sector profile
HH/on farm use/informal milk & formal fresh dairy
0
200
400
600
800
1,000
1,200
1,400
1,600
World market price + 2004 tariffs
World market price (SMP/butter)Milk price in the country
2004
2003
2002
2001
2000
1999
1998
1997
1996
in THB / 100 kg milk (ECM)
1990 1992 1994 1996 1998 2000 2001 2002 2003 2004
22% 18% 22% 30% 39% 42% 54% 64% 55% 63% 20% 30% 46% 22% 22% 21% 49% 78% 37% 46% 83% 88% 88% 76% 70% 67% 73% 86% 65% 66%
ExplanationsMethod: See IFCN Dairy Report 2006, Chapter 3.1 - 3.10 for details. * Residual: Fresh milk products. Sources: International statistics (FAO, ZMP, USDA, EUROSTAT, FAPRI, IDF, EU Commission, OECD, AMAD, MAD, UNSTAD-TRAINS) and national statistics.
Pictures on previous double page by Torsten Hemme.
Status 2004
- Tariffs: Butter 42 %, SMP 42 % - VAT on consumer price: 0 % - Milk consumption: 28 kg ME per capita / year- Self-sufficiency in milk production: 47 %
Key developments 1990 - 2004 - Milk production: +14.26 % per year- Milk consumption per capita: +5.12 % per year- Population: +1.11 % per year- Self-sufficiency: Increased by 30 % points
HH/on farm use/informal milk & formal fresh dairy products
Condensed milkCheese
Condensed milkDry productsButterCheese
HH/on farm use/informal milk & formal fresh dairy products
HH/on farm use/informal milk & formal fresh dairy

© IFCN 2008 53
Key variables
Farm structure 2005
Milk production in ECM Production (mill t)Cows (in 1,000’s )Yield (t / cow / year)
Farm structure No. of dairy farms (in 1,000’s)Average farm size (cow s / farm)Milk per farm (t milk / farm / year) Prices in national currencyCull cow price (EUR / kg live weight)Land price – buy (EUR / ha)Quota price (EUR / kg milk)
Farm structure Milk and feed price Milk / feed price ratio
Status and key developments
Size classes
% of dairy farms in size classes % of cows in size classes
% of cows in size classes EUR / 100 kg Milk price / feed price
Cows per size classFarms per size class
Milk / barley price ratioMilk / feed price ratio
World feed price (nominal)
Milk price (nominal) Milk price (real)Feed price (nominal)
Published in IFCN Dairy Report 2007, Chapter 3.
3.5 Thailand – Milk production and dairy sector profile
0 %
10 %
20 %
30 %
40 %
50 %
60 %
70 %
80 %
90 %
100 %
2005
2004
2003
2002
2001
2000
1999
1998
1997
1996
> 200 - 10 11 - 20
2005
2004
2003
2002
2001
2000
1999
1998
1997
1996
0
200
400
600
800
1,000
1,200
1,400Favourable
Not favourable
0.0
0.5
1.0
1.5
2.0
2.5
3.0
2005
2004
2003
2002
2001
2000
1999
1998
1997
1996
Annual growth rates 1996 1998 2000 2001 2002 2003 2004 2005 2000 - 2005
0.43 0.52 0.58 0.65 0.73 0.74 0.77 8.4 % 295 307 343 358 380 408 478 9.3 % 1.47 1.68 1.70 1.83 1.91 1.81 1.62 - 0.8 % 17.5 17.7 17.9 20.1 23.4 23.4 6.0 % 17.5 19.4 20.0 18.9 17.4 20.4 3.1 % 29.5 32.9 36.6 36.1 31.6 33.0 2.3 % 27.0 30.0 1,300 1,300
Status 2005
- No. of dairy farms: 23,390- Average farm size: 20.4 cows per farm- Main size class: 0 - 10 cows- Milk / feed price ratio: 1.5
Key developments 2000 - 2005 - Farm growth: + 2.3 % milk per farm and year- Milk price: + 0.5 % per year- Feed prices: + 4.5 % per year- Milk / feed price ratio: Downward trend
ExplanationsMilk map details: Data base 2000 - 2005.Source: National statistics, FAO, Eurostat, USDA, ZMP, IDF and estimations. Milk / feed price ratio: Method see Chapter 2. Milk prices are shown in ECM.
THB / 100 kg
Milk / corn price ratio
-4.5
11.0
10.4
16.3
10.0
-4.5
11.0
10.4
16.3
10.0
Change in milk production (% per year)
Annual changes in %-100 <= -5
> -5 <= -2.5> -2.5 <= -0.5> -0.5 <= 0.5
> 0.5 <= 2.5> 2.5 <= 5
> 5 <= 100no data
Cull cow price (THB / kg live weight)Land price – buy (1,000 THB / ha)

Viet Nam

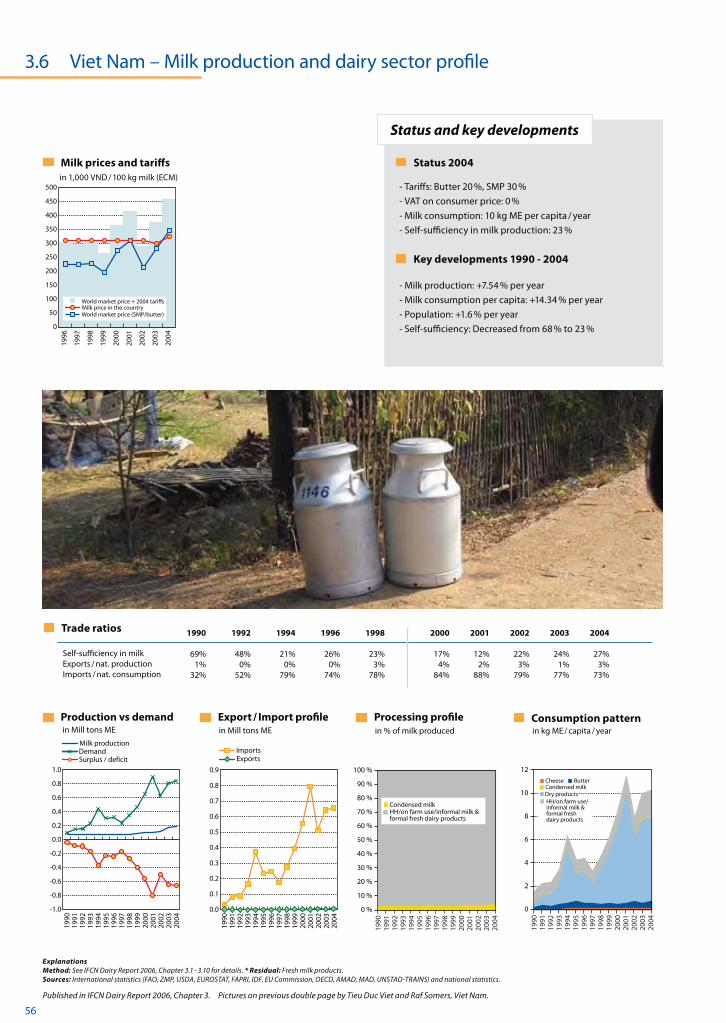
56 © IFCN 2008
Milk pricing and quality
Production vs demand Export / Import profilein Mill tons ME
Processing profile in % of milk produced
Consumption pattern in kg ME / capita / year
Status and key developments
Milk prices and tariffs The chain for liquid milk
Trade ratios
Seasonality profile 2004
Self-sufficiency in milkExports / nat. productionImports / nat. consumption
in Mill tons ME
Surplus / deficit
Milk productionDemand Imports
Exports
year average = 100
Milk price monthlyMilk production monthly
Published in IFCN Dairy Report 2006, Chapter 3.
3.6 Viet Nam – Milk production and dairy sector profile
ExplanationsMethod: See IFCN Dairy Report 2006, Chapter 3.1 - 3.10 for details. * Residual: Fresh milk products. Sources: International statistics (FAO, ZMP, USDA, EUROSTAT, FAPRI, IDF, EU Commission, OECD, AMAD, MAD, UNSTAD-TRAINS) and national statistics.
0
2
4
6
8
10
12
2004
2003
2002
2001
2000
1999
1998
1997
1996
1995
1994
1993
1992
1991
1990
0 %
10 %
20 %
30 %
40 %
50 %
60 %
70 %
80 %
90 %
100 %
2004
2003
2002
2001
2000
1999
1998
1997
1996
1995
1994
1993
1992
1991
1990
0.0
0.1
0.2
0.3
0.4
0.5
0.6
0.7
0.8
0.9
2004
2003
2002
2001
2000
1999
1998
1997
1996
1995
1994
1993
1992
1991
1990
-1.0
-0.8
-0.6
-0.4
-0.2
0.0
0.2
0.4
0.6
0.8
1.0
2004
2003
2002
2001
2000
1999
1998
1997
1996
1995
1994
1993
1992
1991
1990
HH/on farm use/informal milk & formal fresh dairy products
Condensed milk
Condensed milkButterCheese
Dry productsHH/on farm use/informal milk & formal fresh dairy products
0
50
100
150
200
250
300
350
400
450
500
World market price + 2004 tariffs
World market price (SMP/butter)Milk price in the country
2004
2003
2002
2001
2000
1999
1998
1997
1996
in 1,000 VND / 100 kg milk (ECM)
1990 1992 1994 1996 1998 2000 2001 2002 2003 2004
69% 48% 21% 26% 23% 17% 12% 22% 24% 27% 1% 0% 0% 0% 3% 4% 2% 3% 1% 3% 32% 52% 79% 74% 78% 84% 88% 79% 77% 73%
Status 2004
- Tariffs: Butter 20 %, SMP 30 %- VAT on consumer price: 0 % - Milk consumption: 10 kg ME per capita / year- Self-sufficiency in milk production: 23 %
Key developments 1990 - 2004 - Milk production: +7.54 % per year- Milk consumption per capita: +14.34 % per year- Population: +1.6 % per year- Self-sufficiency: Decreased from 68 % to 23 %
Pictures on previous double page by Tieu Duc Viet and Raf Somers, Viet Nam.

© IFCN 2008 57
Key variables
Farm structure 2005
Milk production in ECM Production (mill t)Cows (in 1,000’s )Yield (t / cow / year)
Farm structure No. of dairy farms (in 1,000’s)Average farm size (cow s / farm)Milk per farm (t milk / farm / year) Prices in national currencyCull cow price (EUR / kg live weight)Land price – buy (EUR / ha)Quota price (EUR / kg milk)
Farm structure Milk and feed price Milk / feed price ratio
Status and key developments
Size classes
% of dairy farms in size classes % of cows in size classes
% of cows in size classes EUR / 100 kg Milk price / feed price
Cows per size classFarms per size class
Milk / barley price ratioMilk / feed price ratio
World feed price (nominal)
Milk price (nominal) Milk price (real)Feed price (nominal)
Published in IFCN Dairy Report 2007, Chapter 3.
3.6 Viet Nam – Milk production and dairy sector profile
0 %
10 %
20 %
30 %
40 %
50 %
60 %
70 %
80 %
90 %
100 %
2005
2004
2003
2002
2001
2000
1999
1998
1997
1996
6 - 9
3 - 5
2
1 > 10
2005
2004
2003
2002
2001
2000
1999
1998
1997
1996
0
50
100
150
200
250
300
350
400
450Favourable
Not favourable
0.0
0.5
1.0
1.5
2.0
2.5
3.0
2005
2004
2003
2002
2001
2000
1999
1998
1997
1996
0 %
5 %
10 %
15 %
20 %
25 %
30 %
35 %
40 %
> 10 6-9 3-5 21
20
276
15
184
5
38
20
43
Annual changes in %
0 <= 2020 <= 5050 <= 300
Annual growth rates 1996 1998 2000 2001 2002 2003 2004 2005 2000 - 2005
0.07 0.07 0.09 0.10 0.12 0.16 0.19 0.23 20.9 % 79 71 98 105 87 110 127 135 6.6 % 0.93 0.97 0.92 0.96 1.33 1.48 1.48 1.73 13.4 % 200 - 2005 13.3 14.9 16.5 18.0 19.6 10.2 % 7.9 5.8 6.7 7.0 6.9 -3.3 % 7.6 7.8 9.9 10.4 11.9 12.0 % no statistical information available no statistical information available
Status 2005
- No. of dairy farms: 19,600- Average farm size: 6.9 cows per farm- Main size class: 3 - 5 cows- Milk / feed price ratio: 1.9
Key developments 2000 - 2005 - Farm growth: + 12.0 % milk per farm and year- Milk price: + 5.0 % per year- Feed prices: + 6.1 % per year- Milk / feed price ratio: Up in 2005
Change in milk production (% per year)
ExplanationsMilk map details: Data base 2000 - 2005.Milk/feed price: Since no statistical information on feed prices are available the world market prices are only used.Source: National statistics, FAO, Eurostat, USDA, ZMP, IDF and estimations. Milk / feed price ratio: Method see Chapter 2. Milk prices are shown in ECM.
Cull cow price (VND / kg live weight)Land price – buy (VND / ha)
2001
Cows and buffaloes (in 1,000’s)
1,000 VND / 100 kg
Milk / corn price ratio
Annual changes in %-100 <= -5
> -5 <= -2.5> -2.5 <= -0.5> -0.5 <= 0.5
> 0.5 <= 2.5> 2.5 <= 5
> 5 <= 100no data
World feed price (nominal) = Feed price
Milk price (nominal) Milk price (real)

China


60 © IFCN 2008
Milk pricing and quality
Production vs demand Export / Import profilein Mill tons ME
Processing profile in % of milk produced
Consumption pattern in kg ME / capita / year
Status and key developments
Milk prices and tariffs The chain for liquid milk
Trade ratios
Seasonality profile 2004
Self-sufficiency in milkExports / nat. productionImports / nat. consumption
in Mill tons ME
Surplus / deficit
Milk productionDemand Imports
Exports
year average = 100
Milk price monthlyMilk production monthly
Published in IFCN Dairy Report 2006, Chapter 3.
0
50
100
150
200
250
300
350
400
450
500
Consumer price
Margin (Processor, retailer, VAT)»Farmers' milk price« (ECM)
VAT (2004 only)
2004
2003
2002
2001
2000
1999
1998
1997
1996
0
50
100
150
200
250
World market price + 2004 tariffs
World market price (SMP/butter)Milk price in the country
2004
2003
2002
2001
2000
1999
1998
1997
1996
in CNY / 100 kg milk (ECM) in CNY / 100 kg milk
3.7 China – Milk production and dairy sector profile
50
70
90
110
130
150
170
Milk price monthlyMilk production monthly
Dec
NovOct
Sep
Au
gJu
lJu
nM
ayA
pr
Mar
Feb
Jan
0
5
10
15
20
25
2004
2003
2002
2001
2000
1999
1998
1997
1996
1995
1994
1993
1992
1991
1990
0 %
10 %
20 %
30 %
40 %
50 %
60 %
70 %
80 %
90 %
100 %
2004
2003
2002
2001
2000
1999
1998
1997
1996
1995
1994
1993
1992
1991
1990
0.0
0.5
1.0
1.5
2.0
2.5
3.0
3.5
4.0
4.5
2004
2003
2002
2001
2000
1999
1998
1997
1996
1995
1994
1993
1992
1991
1990
-10
-5
0
5
10
15
20
25
30
2004
2003
2002
2001
2000
1999
1998
1997
1996
1995
1994
1993
1992
1991
1990
Status 2004
- Tariffs: Butter 19 %, SMP 11 %- Share of farmers‘ price on consumer price: 42 % - VAT on consumer price: 17 % - Milk consumption: 21 kg ME per capita / year- Self-sufficiency in milk production: 87 %
Key developments 1990 - 2004 - Milk production: +8.47 % per year- Milk consumption per capita: +7.41 % per year- Population: +0.92 % per year- Self-sufficiency: Increased by 0.8 % points
ExplanationsMethod: See IFCN Dairy Report 2006, Chapter 3.1 - 3.10 for details. * Residual: Fresh milk products. Consumer product: 1 kg fresh milk.Sources: International statistics (FAO, ZMP, USDA, EUROSTAT, FAPRI, IDF, EU Commission, OECD, AMAD, MAD, UNSTAD-TRAINS) and national statistics.Estimates done for: Household consumption according to calve weaning on one typical farm (CN-9) (by S. Shi).
1990 1992 1994 1996 1998 2000 2001 2002 2003 2004
86 % 87 % 85 % 86 % 84 % 78 % 82 % 83 % 85 % 87 % 2 % 3 % 6 % 6 % 6 % 4 % 3 % 2 % 1 % 1 % 15 % 15 % 21 % 19 % 21 % 25 % 20 % 19 % 16 % 14 %
Milk pricing of a »typical« processor
Base: 3.1 % fat, 2.9 % protein, per kgFat: No dataProtein: No data
Volume bonus: + 5 - 10 % for milk sold more than contractQuality bonus: + 0.04 CNY / kg if bact. cell countis lower than 100,000 cells / ml
Transport costs: NonePromotion fee: NoneYear end payment: None
Other: Fresh milk is the main product therefore milk price is 20 % lower in Jul - Aug (milk consumption decrease)
Milk quality standards
Maximum level (target level)Bacterial cell count: < 400,000 cells / mlSomatic cell count: < 500,000 cells / mlAntibiotics: Not allowed
PenaltiesBacterial cell count: Grading system (up to -0.08 CNY / kg)Somatic cell count: Grading systemAntibiotics: Rejected milk after finding antibiotics
OtherStandard freezing point: - 0.546 to - 0.508 °CStandard nitrite: < 0.2 mg / kg milk
Informal milkResidual*Condensed milkButterCheese
HH/on farm useResidual*Condensed milk
Dry productsButterCheese
HH/on farm useInformal milk
Pictures on previous double page by Katja Seifert.

© IFCN 2008 61
Key variables
Farm structure 2005
Milk production in ECM Production (mill t)Cows (in 1,000’s )Yield (t / cow / year)
Farm structure No. of dairy farms (in 1,000’s)Average farm size (cow s / farm)Milk per farm (t milk / farm / year) Prices in national currencyCull cow price (EUR / kg live weight)Land price – buy (EUR / ha)Quota price (EUR / kg milk)
Farm structure Milk and feed price Milk / feed price ratio
Status and key developments
Size classes
% of dairy farms in size classes % of cows in size classes
% of cows in size classes EUR / 100 kg Milk price / feed price
Cows per size classFarms per size class
Milk / barley price ratioMilk / feed price ratio
World feed price (nominal)
Milk price (nominal) Milk price (real)Feed price (nominal)
Published in IFCN Dairy Report 2007, Chapter 3.
Annual changes in %
-5 <= 00 <= 10
10 <= 2020 <= 60
hina
2035
3618
57
33
15
23
-2
27
22
22
1517
42
40
24
44
730
30
1115
17
20
8
32
17
3
21
18
20
3536
18
57
33
15
23
-2
27
22
22
1517
42
40
24
44
730
30
11
15
17
20
8
32173
21
18
Annual changes in %
-5 <= 00 <= 10
10 <= 2020 <= 60
Annual changes
-5 <=0 <=
10 <=20 <=
Annual changes in %
-5 <= 00 <= 10
10 <= 2020 <= 60
Change in milk production (% per year)
3.7 China – Milk production and dairy sector profile
0 %
10 %
20 %
30 %
40 %
50 %
60 %
70 %
80 %
90 %
100 %
> 200
100 - 200
20 - 100
1 - 20
different statistics
2005
2004
2003
2002
2001
2000
1999
1998
1997
1996
2005
2004
2003
2002
2001
2000
1999
1998
1997
1996
0
20
40
60
80
100
120
140
160
180
200Favourable
Not favourable
0.0
0.5
1.0
1.5
2.0
2.5
3.0
2005
2004
2003
2002
2001
2000
1999
1998
1997
1996
0 %
20 %
40 %
60 %
80 %
100 %
> 200100-20020-1001-20
Status 2005
- No. of dairy farms: 0.98 mill- Average farm size: 6.7 cows per farm- Main size class: 1-20 cows- Milk / feed price ratio: 1.1
Key developments 2000 - 2005 - Farm growth: 1.4 % milk per farm and year- Milk price: + 0.4 % per year- Feed prices: + 5.9 % per year- Milk / feed price ratio: Downward trend- Land prices: + 6.9 % per year- Cull cow prices: + 6.6 % per year
Annual growth rates 1996 1998 2000 2001 2002 2003 2004 2005 2000 - 2005 5.6 5.9 7.4 9.1 11.6 15.6 20.1 24.5 27.2 % 2,414 2,303 2,639 3,057 3,711 4,823 5,983 6,567 20.0 % 2.3 2.6 2.8 3.0 3.1 3.2 3.4 3.7 6.0 % 370 373 404 506 600 690 868 980 19.4 % 6.5 6.2 6.5 6.0 6.2 7.0 6.9 6.7 0.5 % 23.3 24.6 26.9 25.0 25.2 27.8 27.4 28.7 1.4 %
5.8 6.0 6.5 7.0 7.6 8.0 6.6 % 359 400 428 446 471 503 6.9 %
ExplanationsChina has about 3.6 mill t buffalo milk (ECM) and about 5.3 buffaloes (Source FAO).Milk map details: Data base 2000 - 2005.Estimates: Cow number, farm number and farm structure data. Fat and protein content for calculating the milk production into ECM. Land prices: Estimated on land rent contracts running 80 years. Price estimate 2000: 300 CNY / Mu * 80 years = 359,000 CNY / ha.2000 - 2005 estimates based on land price index »other« representing non construction land.Source: National statistics, FAO, Eurostat, USDA, ZMP, IDF and estimations. Milk / feed price ratio: Method see Chapter 2. Milk prices are shown in ECM.
CNY / 100 kg
Milk / corn price ratio
Size classes
Cull cow price( CNY / kg live weight)Land price – buy (1,000 CNY / ha)

62 © IFCN 2008Uganda

© IFCN 2008 63

64 © IFCN 2008
Milk pricing and quality
Production vs demand Export / Import profilein Mill tons ME
Processing profile in % of milk produced
Consumption pattern in kg ME / capita / year
Status and key developments
Milk prices and tariffs The chain for liquid milk
Trade ratios
Seasonality profile 2004
Self-sufficiency in milkExports / nat. productionImports / nat. consumption
in Mill tons ME
Surplus / deficit
Milk productionDemand Imports
Exports
year average = 100
Milk price monthlyMilk production monthly
Published in IFCN Dairy Report 2006, Chapter 3.
0
20,000
40,000
60,000
80,000
100,000
120,000
2004
2003
2002
2001
2000
1999
1998
1997
1996
Consumer price
Margin (Processor, retailer)»Farmers' milk price« (ECM)
0
5,000
10,000
15,000
20,000
25,000
30,000
35,000
40,000
45,000
50,000World market price + 2004 tariffs
World market price (SMP/butter)
Milk price in the country
2004
2003
2002
2001
2000
1999
1998
1997
1996
in UGX / 100 kg milk (ECM) in UGX / 100 kg milk
3.8 Uganda – Milk production and dairy sector profile
50
60
70
80
90
100
110
120
130
140
150
Milk price monthlyMilk production monthly
Dec
NovOct
Sep
Au
gJu
lJu
nM
ayA
pr
Mar
Feb
Jan
0
10
20
30
40
50
60
2004
2003
2002
2001
2000
1999
1998
1997
1996
1995
1994
1993
1992
1991
1990
0 %
10 %
20 %
30 %
40 %
50 %
60 %
70 %
80 %
90 %
100 %
2004
2003
2002
2001
2000
1999
1998
1997
1996
1995
1994
1993
1992
1991
1990
0.000
0.002
0.004
0.006
0.008
0.010
0.012
0.014
0.016
0.018
2004
2003
2002
2001
2000
1999
1998
1997
1996
1995
1994
1993
1992
1991
1990
-0.2
-0.0
0.2
0.4
0.6
0.8
1.0
1.2
1.4
2004
2003
2002
2001
2000
1999
1998
1997
1996
1995
1994
1993
1992
1991
1990
Status 2004
- Tariffs: Butter 16 %, SMP 16 %- Share of farmers‘ price on consumer price: 23 % - VAT on consumer price: 0 % - Milk consumption: 49 kg ME per capita / year- Self-sufficiency in milk production: 100 %
Key developments 1990 - 2004 - Milk production: +6.75 % per year- Milk consumption per capita: +3.34 % per year- Population: +3.11 % per year- Self-sufficiency: Increased by 2.5 % points
ExplanationsMethod: See IFCN Dairy Report 2006, Chapter 3.1 - 3.10 for details. * Residual: Fresh milk products. Consumer product: Milk with fat: 3.2 %, protein: 3.3 %.Sources: International statistics (FAO, ZMP, USDA, EUROSTAT, FAPRI, IDF, EU Commission, OECD, AMAD, MAD, UNSTAD-TRAINS) and national statistics.Estimates done for: Household / on farm use and milk delivered.
1990 1992 1994 1996 1998 2000 2001 2002 2003 2004
97 % 98 % 99 % 99 % 99 % 100 % 100 % 99 % 99 % 100 % 0 % 0 % 0 % 0 % 1 % 0 % 0 % 0 % 0 % 0 % 3 % 2 % 2 % 1 % 1 % 0 % 0 % 1 % 1 % 0 %
Milk pricing of a »typical« processor
Base: Volume of whole milk (Litres)Fat: NoneProtein: None
Volume bonus: NoneQuality bonus: NoneContribution to dairy cooperative: UGX 70 (US$ 0.039) / l
Transport costs: 50 UGX (0.028 USD) / litre of milk deliveredPromotion fee: None Year end payment: None
Milk quality standards
Maximum level (target level)No checking for antibiotics, bact. and som. cell counts.Farmers deliver milk to a collection centre where simple platform tests are carried out. If quality isacceptable, the volume is measured in litres.
PenaltiesOnly lactometer reading 28-32 and alchol test (68-80 %) are used in the field. Total rejectionof milk which does not conform to these tests.
Informal milkResidual*Condensed milkButter
HH/on farm useResidual*Condensed milk
Dry productsButterCheese
HH/on farm useInformal milk
Pictures on previous double page by Ndambi Asaah.
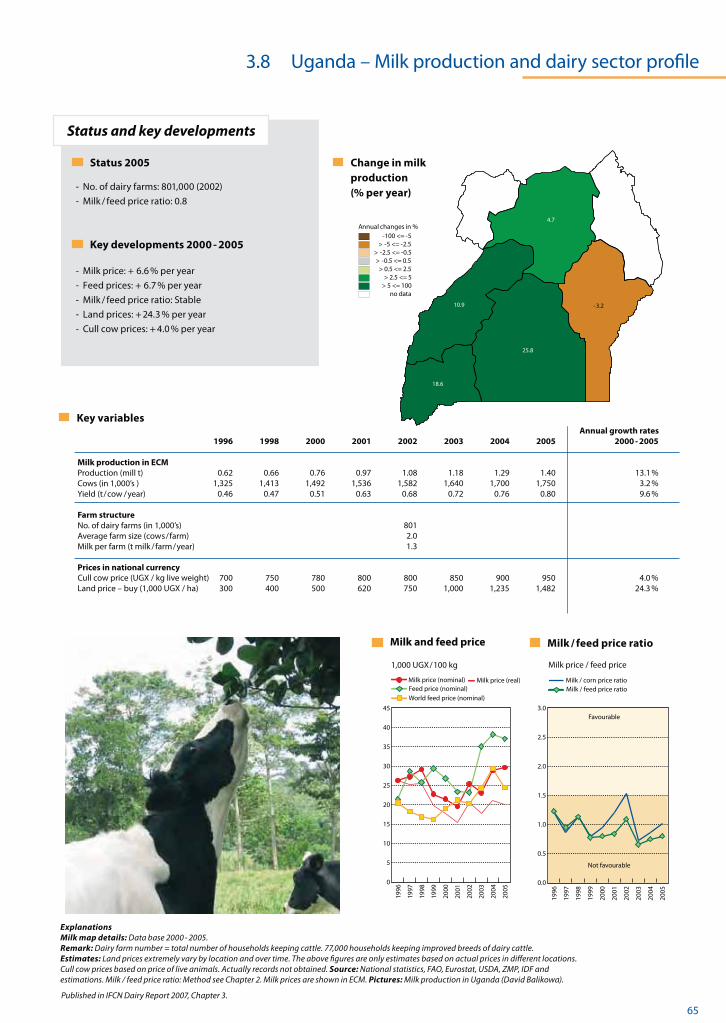
© IFCN 2008 65
Key variables
Farm structure 2005
Milk production in ECM Production (mill t)Cows (in 1,000’s )Yield (t / cow / year)
Farm structure No. of dairy farms (in 1,000’s)Average farm size (cow s / farm)Milk per farm (t milk / farm / year) Prices in national currencyCull cow price (EUR / kg live weight)Land price – buy (EUR / ha)Quota price (EUR / kg milk)
Farm structure Milk and feed price Milk / feed price ratio
Status and key developments
Size classes
% of dairy farms in size classes % of cows in size classes
% of cows in size classes EUR / 100 kg Milk price / feed price
Cows per size classFarms per size class
Milk / barley price ratioMilk / feed price ratio
World feed price (nominal)
Milk price (nominal) Milk price (real)Feed price (nominal)
Published in IFCN Dairy Report 2007, Chapter 3.
3.8 Uganda – Milk production and dairy sector profile
2005
2004
2003
2002
2001
2000
1999
1998
1997
1996
0
5
10
15
20
25
30
35
40
45Favourable
Not favourable
0.0
0.5
1.0
1.5
2.0
2.5
3.0
2005
2004
2003
2002
2001
2000
1999
1998
1997
1996
-3.2
-100.0
-100.0
4.7
25.8
18.6
10.9 -3.2
-100.0
-100.0
4.7
25.8
18.6
10.9
Annual growth rates 1996 1998 2000 2001 2002 2003 2004 2005 2000 - 2005
0.62 0.66 0.76 0.97 1.08 1.18 1.29 1.40 13.1 % 1,325 1,413 1,492 1,536 1,582 1,640 1,700 1,750 3.2 % 0.46 0.47 0.51 0.63 0.68 0.72 0.76 0.80 9.6 % 801 2.0 1.3 700 750 780 800 800 850 900 950 4.0 % 300 400 500 620 750 1,000 1,235 1,482 24.3 %
Status 2005
- No. of dairy farms: 801,000 (2002)- Milk / feed price ratio: 0.8
Key developments 2000 - 2005 - Milk price: + 6.6 % per year- Feed prices: + 6.7 % per year- Milk / feed price ratio: Stable- Land prices: + 24.3 % per year- Cull cow prices: + 4.0 % per year
Change in milk production (% per year)
ExplanationsMilk map details: Data base 2000 - 2005.Remark: Dairy farm number = total number of households keeping cattle. 77,000 households keeping improved breeds of dairy cattle.Estimates: Land prices extremely vary by location and over time. The above figures are only estimates based on actual prices in different locations. Cull cow prices based on price of live animals. Actually records not obtained. Source: National statistics, FAO, Eurostat, USDA, ZMP, IDF and estimations. Milk / feed price ratio: Method see Chapter 2. Milk prices are shown in ECM. Pictures: Milk production in Uganda (David Balikowa).
Cull cow price (UGX / kg live weight)Land price – buy (1,000 UGX / ha)
1,000 UGX / 100 kg
Milk / corn price ratio
Annual changes in %-100 <= -5
> -5 <= -2.5> -2.5 <= -0.5> -0.5 <= 0.5
> 0.5 <= 2.5> 2.5 <= 5
> 5 <= 100no data

66 © IFCN 2008Cameroon

© IFCN 2008 67

68 © IFCN 2008
Milk pricing and quality
Production vs demand Export / Import profilein Mill tons ME
Processing profile in % of milk produced
Consumption pattern in kg ME / capita / year
Status and key developments
Milk prices and tariffs The chain for liquid milk
Trade ratios
Seasonality profile 2004
Self-sufficiency in milkExports / nat. productionImports / nat. consumption
in Mill tons ME
Surplus / deficit
Milk productionDemand Imports
Exports
year average = 100
Milk price monthlyMilk production monthly
Published in IFCN Dairy Report 2006, Chapter 3.
3.9 Cameroon – Milk production and dairy sector profile
40
50
60
70
80
90
100
110
120
130
140
150
Milk price monthly
Milk production monthly
Dec
NovOct
Sep
Au
gJu
lJu
nM
ayA
pr
Mar
Feb
Jan
0
20
40
60
80
100
120
140
160
180
2004
2003
2002
2001
2000
1999
1998
1997
1996
Consumer price
Margin (Processor, retailer)»Farmers' milk price« (ECM)
0
5
10
15
20
25
World market price + 2004 tariffs
World market price (SMP/ butter)Milk price in the country
2004
2003
2002
2001
2000
1999
1998
1997
1996
0
5
10
15
20
25
2004
2003
2002
2001
2000
1999
1998
1997
1996
1995
1994
1993
1992
1991
1990
0 %
10 %
20 %
30 %
40 %
50 %
60 %
70 %
80 %
90 %
100 %
2004
2003
2002
2001
2000
1999
1998
1997
1996
1995
1994
1993
1992
1991
1990
0.00
0.01
0.02
0.03
0.04
0.05
0.06
0.07
2004
2003
2002
2001
2000
1999
1998
1997
1996
1995
1994
1993
1992
1991
1990
-0.10
-0.05
0.00
0.05
0.10
0.15
0.20
0.25
0.30
2004
2003
2002
2001
2000
1999
1998
1997
1996
1995
1994
1993
1992
1991
1990
Status 2004
- Tariffs: Butter 10 %, SMP 30 %- Share of farmers‘ price on consumer price: 12 % - VAT on consumer price: 0 %- Milk consumption: 16 kg ME per capita / year- Self-sufficiency in milk production: 76 %
Key developments 1990 - 2004 - Milk production: +0.44 % per year- Milk consumption per capita: -1.29 % per year- Population: +2.42 % per year- Self-sufficiency: Decreased by -7.3 % points
in 1,000 XAF / 100 kg milk (ECM) in 1,000 XAF / 100 kg milk
ExplanationsMethod: See IFCN Dairy Report 2006, Chapter 3.1 - 3.10 for details. * Residual: Fresh milk products. Consumer product: Yogurt, prepared at small scale processing units .Sources: International statistics (FAO, ZMP, USDA, EUROSTAT, FAPRI, IDF, EU Commission, OECD, AMAD, MAD, UNSTAD-TRAINS) and national statistics.Estimates done for: Household / on farm use and milk delivered, fat / protein content of milk produced.
1990 1992 1994 1996 1998 2000 2001 2002 2003 2004
84 % 89 % 89 % 87 % 85 % 82 % 78 % 89 % 77 % 76 % 0 % 0 % 0 % 0 % 2 % 2 % 1 % 1 % 1 % 1 % 16 % 11 % 11 % 13 % 17 % 20 % 22 % 12 % 24 % 24 %
Milk pricing of a »typical« processor
Base: Milk is paid by volume.Milk is measured in litres.
Milk quality assessed by colour and odour.
Payment is done upon delivery or every second weekif the milk is going to the processing unit.
Milk quality standards
Maximum level (target level)- No quality standards as of now.- No tests for fat, protein and antibiotics.
Penalties- Milk is rejected after sensory tests (smell, colour, taste, etc.).
Informal milkResidual*
HH/on farm useResidual*Condensed milk
Dry productsButterCheese
HH/on farm useInformal milk
Pictures on previous double page by Marianne Kurzweil.
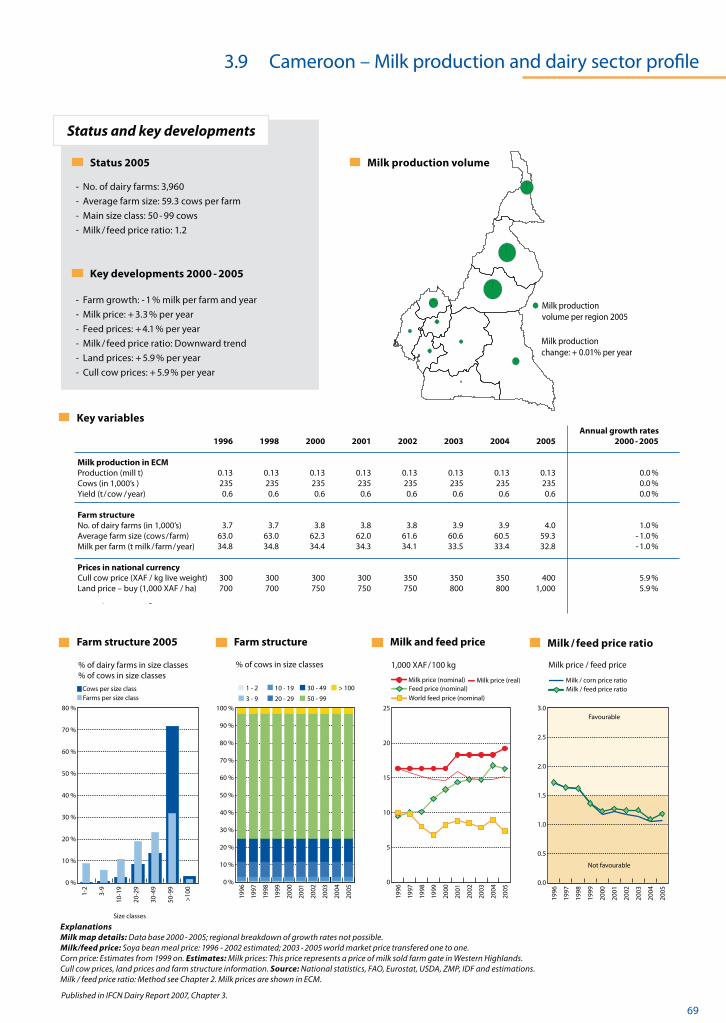
© IFCN 2008 69
Key variables
Farm structure 2005
Milk production in ECM Production (mill t)Cows (in 1,000’s )Yield (t / cow / year)
Farm structure No. of dairy farms (in 1,000’s)Average farm size (cow s / farm)Milk per farm (t milk / farm / year) Prices in national currencyCull cow price (EUR / kg live weight)Land price – buy (EUR / ha)Quota price (EUR / kg milk)
Farm structure Milk and feed price Milk / feed price ratio
Status and key developments
Size classes
% of dairy farms in size classes % of cows in size classes
% of cows in size classes EUR / 100 kg Milk price / feed price
Cows per size classFarms per size class
Milk / barley price ratioMilk / feed price ratio
World feed price (nominal)
Milk price (nominal) Milk price (real)Feed price (nominal)
Published in IFCN Dairy Report 2007, Chapter 3.
3.9 Cameroon – Milk production and dairy sector profile
0 %
10 %
20 %
30 %
40 %
50 %
60 %
70 %
80 %
90 %
100 %
2005
2004
2003
2002
2001
2000
1999
1998
1997
1996
20 - 29
10 - 19
3 - 9
1 - 2 > 100
50 - 99
30 - 49
2005
2004
2003
2002
2001
2000
1999
1998
1997
1996
0
5
10
15
20
25Favourable
Not favourable
0.0
0.5
1.0
1.5
2.0
2.5
3.0
2005
2004
2003
2002
2001
2000
1999
1998
1997
1996
0 %
10 %
20 %
30 %
40 %
50 %
60 %
70 %
80 %
>10
0
50-9
9
30-4
9
20-2
9
10-1
9
3-9
1-2
Milk production volume per region 2005
Milk production change: + 0.01% per year
Annual growth rates 1996 1998 2000 2001 2002 2003 2004 2005 2000 - 2005
0.13 0.13 0.13 0.13 0.13 0.13 0.13 0.13 0.0 % 235 235 235 235 235 235 235 235 0.0 % 0.6 0.6 0.6 0.6 0.6 0.6 0.6 0.6 0.0 % 3.7 3.7 3.8 3.8 3.8 3.9 3.9 4.0 1.0 % 63.0 63.0 62.3 62.0 61.6 60.6 60.5 59.3 - 1.0 % 34.8 34.8 34.4 34.3 34.1 33.5 33.4 32.8 - 1.0 % 300 300 300 300 350 350 350 400 5.9 % 700 700 750 750 750 800 800 1,000 5.9 %
Cull cow price (XAF / kg live weight)Land price – buy (1,000 XAF / ha)
ExplanationsMilk map details: Data base 2000 - 2005; regional breakdown of growth rates not possible.Milk/feed price: Soya bean meal price: 1996 - 2002 estimated; 2003 - 2005 world market price transfered one to one. Corn price: Estimates from 1999 on. Estimates: Milk prices: This price represents a price of milk sold farm gate in Western Highlands. Cull cow prices, land prices and farm structure information. Source: National statistics, FAO, Eurostat, USDA, ZMP, IDF and estimations. Milk / feed price ratio: Method see Chapter 2. Milk prices are shown in ECM.
Milk production volume Status 2005
- No. of dairy farms: 3,960- Average farm size: 59.3 cows per farm- Main size class: 50 - 99 cows- Milk / feed price ratio: 1.2
Key developments 2000 - 2005 - Farm growth: - 1 % milk per farm and year- Milk price: + 3.3 % per year- Feed prices: + 4.1 % per year- Milk / feed price ratio: Downward trend- Land prices: + 5.9 % per year- Cull cow prices: + 5.9 % per year
1,000 XAF / 100 kg
Milk / corn price ratio
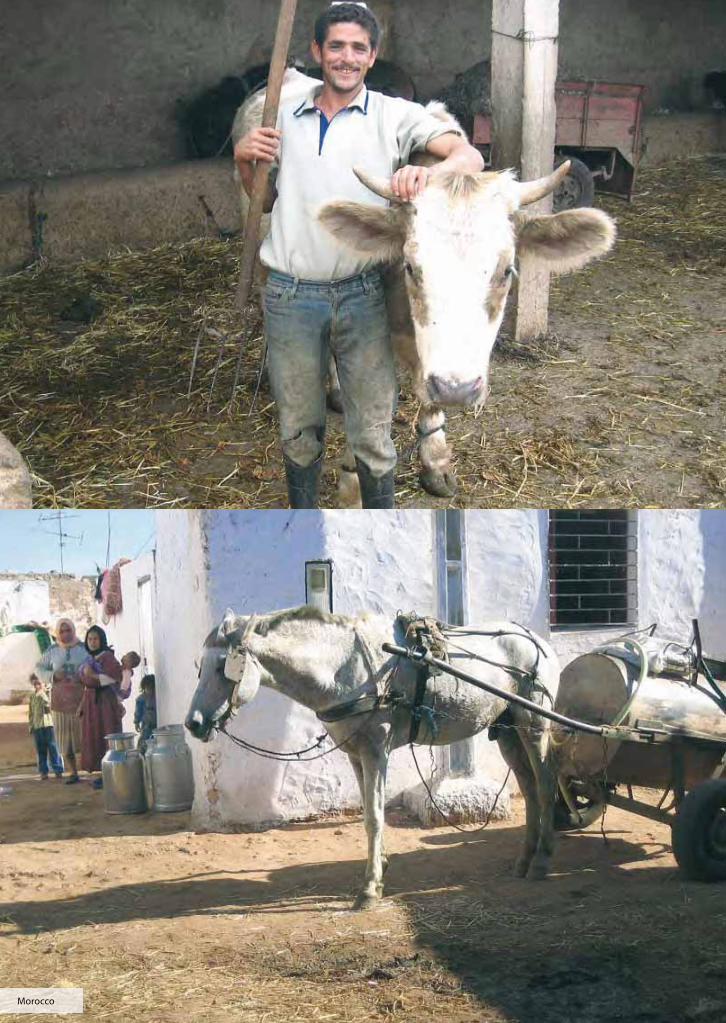
70 © IFCN 2008Morocco

© IFCN 2008 71

72 © IFCN 2008Morocco

© IFCN 2008 73
Key variables
Farm structure 2005
Milk production in ECM Production (mill t)Cows (in 1,000’s )Yield (t / cow / year)
Farm structure No. of dairy farms (in 1,000’s)Average farm size (cow s / farm)Milk per farm (t milk / farm / year) Prices in national currencyCull cow price (EUR / kg live weight)Land price – buy (EUR / ha)Quota price (EUR / kg milk)
Farm structure Milk and feed price Milk / feed price ratio
Status and key developments
Size classes
% of dairy farms in size classes % of cows in size classes
% of cows in size classes EUR / 100 kg Milk price / feed price
Cows per size classFarms per size class
Milk / barley price ratioMilk / feed price ratio
World feed price (nominal)
Milk price (nominal) Milk price (real)Feed price (nominal)
Published in IFCN Dairy Report 2007, Chapter 3.
3.10 Morocco – Milk production and dairy sector profile
0 %
10 %
20 %
30 %
40 %
50 %
60 %
70 %
80 %
90 %
100 %
2005
2004
2003
2002
2001
2000
1999
1998
1997
1996
> 101 - 2 3 - 9
2005
2004
2003
2002
2001
2000
1999
1998
1997
1996
0
50
100
150
200
250
300
350
400Favourable
Not favourable
0.0
0.5
1.0
1.5
2.0
2.5
3.0
2005
2004
2003
2002
2001
2000
1999
1998
1997
1996
0 %
10 %
20 %
30 %
40 %
50 %
60 %
70 %
80 %
90 %
> 103-91-2
Milk production volume per region 2005
Milk production change: + 4.2 % per year
Annual growth rates 1996 1998 2000 2001 2002 2003 2004 2005 2000 - 2005
0.84 1.01 1.14 1.09 1.19 1.19 1.34 1.40 4.2 % 1,500 1,300 1,308 1,250 1,350 1,370 1,380 1,500 2.8 % 0.56 0.78 0.87 0.87 0.88 0.87 0.97 0.93 1.3 % 769 2.0 1.1 25 25 25 25 25 25 25 25 0.0 % 80 80 90 100 100 100 120 120 5.9 %
Status 2005
- No. of dairy farms: 768,900 (1996)- Main size class: 1 - 2 cows- Milk / feed price ratio: 1.7
Key developments 2000 - 2005 - Milk price: + 0.7 % per year- Feed prices: - 1.7 % per year- Milk / feed price ratio: Stable- Land prices: + 5.9 % per year- Cull cow prices: Stable
Milk production volume
ExplanationsMilk map details: Data base 2005; regional breakdown of growth rates not possible. Milk/feed price: Since no statistical information on soya bean meal prices are available the world market price is used. Estimates: Cull cow prices based on 360 kg live weight at 25 MAD / kg live weight. Land prices: Own observations based on »irrigated land« and sub-urban areas with own »ground water« irrigation installations.Source: National statistics, FAO, Eurostat, USDA, ZMP, IDF and estimations. Milk / feed price ratio: Method see Chapter 2. Milk prices are shown in ECM.
Cull cow price (MAD / kg live weight)Land price – buy (1,000 MAD / ha)
MAD / 100 kg
Farm structure 1996
Pictures on previous pages by Otto Garcia.
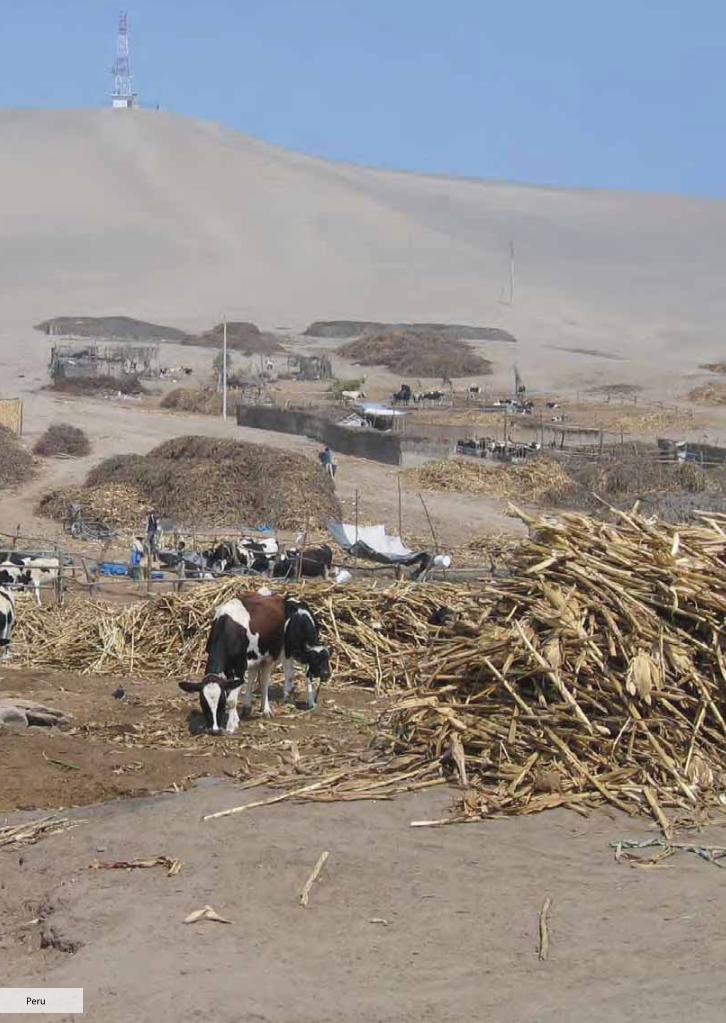
74 © IFCN 2008Peru

© IFCN 2008 75

76 © IFCN 2008
Milk pricing and quality
Production vs demand Export / Import profilein Mill tons ME
Processing profile in % of milk produced
Consumption pattern in kg ME / capita / year
Status and key developments
Milk prices and tariffs The chain for liquid milk
Trade ratios
Seasonality profile 2004
Self-sufficiency in milkExports / nat. productionImports / nat. consumption
in Mill tons ME
Surplus / deficit
Milk productionDemand Imports
Exports
year average = 100
Milk price monthlyMilk production monthly
Published in IFCN Dairy Report 2006, Chapter 3.
0
50
100
150
200
250
300
2004
2003
2002
2001
2000
1999
1998
1997
1996
Consumer price
Margin (Processor, retailer, VAT)»Farmers' milk price« (ECM)
VAT (2004 only)
0
10
20
30
40
50
60
70
80
90
100
World market price + 2004 tariffs
World market price (SMP/butter)Milk price in the country
2004
2003
2002
2001
2000
1999
1998
1997
1996
in PEN / 100 kg milk (ECM) in PEN / 100 kg milk
3.11 Peru – Milk production and dairy sector profile
50
60
70
80
90
100
110
120
130
140
150
Milk price monthlyMilk production monthly
Dec
NovOct
Sep
Au
gJu
lJu
nM
ayA
pr
Mar
Feb
Jan
0
10
20
30
40
50
60
2004
2003
2002
2001
2000
1999
1998
1997
1996
1995
1994
1993
1992
1991
1990
0 %
10 %
20 %
30 %
40 %
50 %
60 %
70 %
80 %
90 %
100 %
2004
2003
2002
2001
2000
1999
1998
1997
1996
1995
1994
1993
1992
1991
1990
0.00
0.05
0.10
0.15
0.20
0.25
0.30
0.35
0.40
2004
2003
2002
2001
2000
1999
1998
1997
1996
1995
1994
1993
1992
1991
1990
-0.6
-0.4
-0.2
-0.0
0.2
0.4
0.6
0.8
1.0
1.2
1.4
1.6
2004
2003
2002
2001
2000
1999
1998
1997
1996
1995
1994
1993
1992
1991
1990
Status 2004
- Tariffs: Butter 20 %, SMP 20 %- Share of farmers‘ price on consumer price: 29 % - VAT on consumer price: 18 % - Milk consumption: 49 kg ME per capita / year- Self-sufficiency in milk production: 91 %
Key developments 1990 - 2004 - Milk production: +3.48 % per year- Milk consumption per capita: +0.97 % per year- Population: +1.71 % per year- Self-sufficiency: Increased by 9.3 % points
ExplanationsMethod: See IFCN Dairy Report 2006, Chapter 3.1 - 3.10 for details. * Residual: Fresh milk products. Consumer product: Fresh milk with 3.6 % fat and 3.4 % protein.Sources: International statistics (FAO, ZMP, USDA, EUROSTAT, FAPRI, IDF, EU Commission, OECD, AMAD, MAD, UNSTAD-TRAINS) and national statistics.Estimates done for: Milk delivered and household / on farm use are estimated values (by C. Gomez and M. Fernandez).
1990 1992 1994 1996 1998 2000 2001 2002 2003 2004
82 % 78 % 69 % 70 % 73 % 80 % 83 % 85 % 91 % 91 % 0 % 0 % 0 % 0 % 0 % 1 % 1 % 2 % 3 % 6 % 18 % 22 % 31 % 30 % 28 % 21 % 18 % 17 % 12 % 14 %
Milk pricing of a »typical« processor
Base: Total solids, Fat: + / - 0.07 PEN per + / - 1 % point fatProtein: None
Bonfication is variable between 0.02 - 0.1 PEN. It considers bonus for free of tuberculosis and brucellosis+ bonus for volume + bonus for cold storage of milk.
Transport costs: NonePromotion fee: NoneYear end payment: None
Milk quality standards
Maximum level (target level)No bacterial cell count is considered neither somaticcelll count or antibiotics for pricing.
Formal fresh dairy products & informal milkCondensed milkButterCheese
HH/on farm useFormal fresh dairy products & informal milk
Condensed milkButterCheese
HH/on farm use Dry products
Pictures on previous double page by Otto Garcia and Carlos A. Gomez.

© IFCN 2008 77
Key variables
Farm structure 2005
Milk production in ECM Production (mill t)Cows (in 1,000’s )Yield (t / cow / year)
Farm structure No. of dairy farms (in 1,000’s)Average farm size (cow s / farm)Milk per farm (t milk / farm / year) Prices in national currencyCull cow price (EUR / kg live weight)Land price – buy (EUR / ha)Quota price (EUR / kg milk)
Farm structure Milk and feed price Milk / feed price ratio
Status and key developments
Size classes
% of dairy farms in size classes % of cows in size classes
% of cows in size classes EUR / 100 kg Milk price / feed price
Cows per size classFarms per size class
Milk / barley price ratioMilk / feed price ratio
World feed price (nominal)
Milk price (nominal) Milk price (real)Feed price (nominal)
Published in IFCN Dairy Report 2007, Chapter 3.
23.1
-0.4
-5.2
3.9
-8.7
7.4
5.7-0.2
13.5
2.7
0.7
7.7
1.9
7.7
17.2
-0.8
1.7
4.2
-5.4
17.5
18.0
-3.0
-7.0
41.2
23.1
-0.4
-5.2
3.9
-8.7
7.4
5.7-0.2
13.5
2.7
0.7
7.7
1.9
7.7
17.2
-0.8
1.7
4.2
-5.4
17.5
18.0
-3.0
-7.0
41.2
3.11 Peru – Milk production and dairy sector profile
0 %
10 %
20 %
30 %
40 %
50 %
60 %
70 %
80 %
90 %
100 %
2005
2004
2003
2002
2001
2000
1999
1998
1997
1996
> 100< 20 20 - 100
2005
2004
2003
2002
2001
2000
1999
1998
1997
1996
0
10
20
30
40
50
60
70
80
90Favourable
Not favourable
0.0
0.5
1.0
1.5
2.0
2.5
3.0
2005
2004
2003
2002
2001
2000
1999
1998
1997
1996
0 %
20 %
40 %
60 %
80 %
100 %
> 10020-100< 20
Annual growth rates 1996 1998 2000 2001 2002 2003 2004 2005 2000 - 2005
0.87 0.96 1.02 1.07 1.14 1.18 1.21 1.27 4.5 % 553 520 504 538 628 635 657 690 6.5 % 1.57 1.84 2.03 1.99 1.82 1.85 1.85 1.85 - 1.8 % 91 86 83 89 104 105 106 108 5.4 % 6.1 6.1 6.1 6.1 6.1 6.1 6.2 6.4 1.0 % 9.5 11.2 12.3 12.1 11.1 11.2 11.4 11.8 - 0.8 % 2.5 2.5 2.5 2.5 2.5 2.5 2.5 2.5 0.0 % 24,950 26,223 27,693 27,963 28,230 28,630 29,133 29,700 1.4 %
Status 2005
- No. of dairy farms: 108,000- Average farm size: 6.4 cows per farm- Main size class: < 20 cows- Milk / feed price ratio: 1.1
Key developments 2000 - 2005 - Farm growth: - 0.8 % milk per farm and year- Milk price: + 4.6 % per year- Feed prices: + 1 % per year- Milk / feed price ratio: Upward trend- Land prices: + 1.4 % per year- Cull cow prices: stable
Cull cow price (PEN / kg live weight)Land price – buy (PEN / ha)
ExplanationsMilk map details: Data base 2000 - 2005.Estimates: No. of cows per size class is estimated based on average farm size: 5; 50; 150 cows per farm.Source: National statistics, FAO, Eurostat, USDA, ZMP, IDF and estimations. Milk / feed price ratio: Method see Chapter 2. Milk prices are shown in ECM.
PEN / 100 kg
Milk / corn price ratio
Change in milk production (% per year)
Annual changes in %-100 <= -5
> -5 <= -2.5> -2.5 <= -0.5> -0.5 <= 0.5
> 0.5 <= 2.5> 2.5 <= 5
> 5 <= 100no data

78 © IFCN 2008Germany

© IFCN 2008 79

80 © IFCN 2008
Milk pricing and quality
Production vs demand Export / Import profilein Mill tons ME
Processing profile in % of milk produced
Consumption pattern in kg ME / capita / year
Status and key developments
Milk prices and tariffs The chain for liquid milk
Trade ratios
Seasonality profile 2004
Self-sufficiency in milkExports / nat. productionImports / nat. consumption
in Mill tons ME
Surplus / deficit
Milk productionDemand Imports
Exports
year average = 100
Milk price monthlyMilk production monthly
Published in IFCN Dairy Report 2006, Chapter 3.
3.12 Germany – Milk production and dairy sector profile
50
60
70
80
90
100
110
120
130
140
150
Milk price monthlyMilk production monthly
Dec
NovOct
Sep
Au
gJu
lJu
nM
ayA
pr
Mar
Feb
Jan
0
10
20
30
40
50
60
70
Consumer price
Retailer marginProcessor margin»Farmers' milk price« (ECM)
VAT
2004
2003
2002
2001
2000
1999
1998
1997
1996
0
5
10
15
20
25
30
35
40
45
50
World market price + 2004 tariffs
World market price (SMP/butter)Milk price in the country
2004
2003
2002
2001
2000
1999
1998
1997
1996
0
50
100
150
200
250
300
350
2004
2003
2002
2001
2000
1999
1998
1997
1996
1995
1994
1993
1992
1991
1990
0 %
10 %
20 %
30 %
40 %
50 %
60 %
70 %
80 %
90 %
100 %
2004
2003
2002
2001
2000
1999
1998
1997
1996
1995
1994
1993
1992
1991
1990
0
2
4
6
8
10
12
14
2004
2003
2002
2001
2000
1999
1998
1997
1996
1995
1994
1993
1992
1991
1990
0
5
10
15
20
25
30
35
2004
2003
2002
2001
2000
1999
1998
1997
1996
1995
1994
1993
1992
1991
1990
in EUR / 100 kg milk (ECM) in EUR / 100 kg milk
Status 2004
- Tariffs: Butter 116 %, SMP 72 %- Share of farmers‘ price on consumer price: 48 % - VAT on consumer price: 7 % - Milk consumption: 285 kg ME per capita / year- Self-sufficiency in milk production: 124 %
Key developments 1990 - 2004 - Milk production: -0.52 % per year- Milk consumption per capita: -1.09 % per year- Population: +0.27 % per year- Self-sufficiency: Increased by 5.1 % points
ExplanationsMethod: See IFCN Dairy Report 2006, Chapter 3.1 - 3.10 for details. * Residual: Fresh milk products. Consumer product: Fresh milk; 1 litre packing with 3.5 % fatSources: International statistics (FAO, ZMP, USDA, EUROSTAT, FAPRI, IDF, EU Commission, OECD, AMAD, MAD, UNSTAD-TRAINS) and national statistics.Comments: ZMP shows a self-sufficiency rate of 101 % in 2004 for Germany.
1990 1992 1994 1996 1998 2000 2001 2002 2003 2004
119 % 116 % 123 % 125 % 124 % 125 % 127 % 117 % 120 % 124 % 25 % 34 % 34 % 34 % 34 % 36 % 37 % 30 % 38 % 42 % 15 % 18 % 19 % 19 % 19 % 21 % 21 % 21 % 26 % 27 %
Milk pricing of a »typical« processor
Base: 3.7 % fat, 3.4 % protein, per kgFat: + / - 2.2 EUR ct / 1 % pointProtein: + / - 5.0 EUR ct / 1 % point
Volume bonus: > 400 tons / year ( 0.5 EUR ct / kg)Quality bonus: + 0.5 EUR ct / kg if < 10,000 bacterial and < 250,000 somatic cell count
Transport costs: Charge of 120 EUR / month / farmPromotion fee: 0.122 EUR / 100 kgYear end payment: 1.6 % of total milk return
Other: 28 EUR ct / kg over quota levy in 2004 / 2005Volume bonus depends on dairy, some have a »stop - fee«.
Milk quality standards
Maximum level (target level)- Bacterial cell count: < 100,000 cells / ml- Somatic cell count: < 400,000 cells / ml- Antibiotics: Not allowed
Penalties- Bacterial cell count: - 2 EUR ct / kg if > 100,000 cells / ml- Somatic cell count: - 1 EUR ct / kg if > 400,000 cells / ml- Antibiotics: - 5 EUR ct / month if found
Other- Standard freezing point: < - 0.515 °C
Residual*Condensed milkDry productsButterCheese
HH/on farm useInformal milkResidual*Condensed milk
Dry productsButterCheese
HH/on farm useInformal milk
Pictures on previous double page by Torsten Hemme.

© IFCN 2008 81
Key variables
Farm structure 2005
Milk production in ECM Production (mill t)Cows (in 1,000’s )Yield (t / cow / year)
Farm structure No. of dairy farms (in 1,000’s)Average farm size (cow s / farm)Milk per farm (t milk / farm / year) Prices in national currencyCull cow price (EUR / kg live weight)Land price – buy (EUR / ha)Quota price (EUR / kg milk)
Farm structure Milk and feed price Milk / feed price ratio
Status and key developments
Size classes
% of dairy farms in size classes % of cows in size classes
% of cows in size classes EUR / 100 kg Milk price / feed price
Cows per size classFarms per size class
Milk / barley price ratioMilk / feed price ratio
World feed price (nominal)
Milk price (nominal) Milk price (real)Feed price (nominal)
Published in IFCN Dairy Report 2007, Chapter 3.
-0.9-0.6
-0.1-0.3 -0.5
-0.7
-0.8
-0.9
-0.8
-0.4
0.1
0.0
-0.8
0.8
1.4
1.6
-0.8
-0.7
0.8
0.5
-2.4
-1.1
0.2
0.4
1.1
0.3
0.2 -0.9
0.0
-0.5
1.2
-0.70.4
0.1
-0.31.0
-0.2
-1.0
-0.5
0.8
-0.8
-0.9- 0.6
-0.1-0.3 -0.5
-0.7
-0.8
-0.9
-0.8
-0.4
0.1
0.0
-0.8
0.8
1.4
1.6
-0.8
-0.7
0.8
0.5
-2.4
-1.1
0.2
0.4
1.1
0.3
0.2 -0.9
0.0
-0.51.2
-0.70.4
0.1
-0.31.0
-0.2
-1.0
- 0.5
0.8
-0.8
Change in milk production (% per year)
Annual changes in %-100 <= -5
> -5 <= -2.5> -2.5 <= -0.5> -0.5 <= 0.5
> 0.5 <= 2.5> 2.5 <= 5
> 5 <= 100no data
3.12 Germany – Milk production and dairy sector profile
0 %
10 %
20 %
30 %
40 %
50 %
60 %
70 %
80 %
90 %
100 %
2005
2004
2003
2002
2001
2000
1999
1998
1997
1996
30 - 49
20 - 29
10 - 19
1 - 9
> 100
50 - 99
2005
2004
2003
2002
2001
2000
1999
1998
1997
1996
0
5
10
15
20
25
30
35
40Favourable
Not favourable
2005
2004
2003
2002
2001
2000
1999
1998
1997
1996
0.0
0.5
1.0
1.5
2.0
2.5
3.0
3.5
0 %
5 %
10 %
15 %
20 %
25 %
30 %
35 %
> 1
00
50-9
9
30-4
9
20-2
9
10-
19 1-9
Annual growth rates 1996 1998 2000 2001 2002 2003 2004 2005 2000 - 2005
29.9 29.4 29.4 29.2 28.9 29.5 29.2 29.5 0.1 % 5,195 4,833 4,564 4,475 4,373 4,338 4,287 4,150 - 1.9 % 5.8 6.1 6.4 6.5 6.6 6.8 6.8 7.1 2.0 % 185.9 163.8 142.3 131.8 126.7 121.6 116.0 110.4 - 4.9 % 27.9 29.5 32.1 34.0 34.5 35.7 37.0 37.6 3.2 % 160.8 179.7 206.4 221.5 228.3 242.6 251.6 267.3 5.3 % 1.11 1.18 1.17 0.85 0.94 0.98 1.06 1.25 1.4 % 10,880 9,908 8,939 9,081 9,416 9,604 9,148 8,692 - 0.6 % 0.82 0.85 0.57 0.72 0.72 0.47 0.43 0.43 - 5.3 %
Status 2005
- No. of dairy farms: 110,400- Average farm size: 37.6 cows per farm- Main size class: 50 - 99 cows- Milk / feed price ratio: 2.2
Key developments 2000 - 2005 - Farm growth: + 5.3 % milk per farm and year- Milk price: - 1.7 % per year- Feed prices: - 2.7 % per year- Milk / feed price ratio: Stable- Land prices: - 0.6 % per year- Cull cow prices: + 1.4 % per year- Quota prices: - 5.3 % per year
ExplanationsMilk map details: Data base 2000 - 2005.Estimates: Quota price 1996 - 2000: based on typical farms.Source: National statistics, FAO, Eurostat, USDA, ZMP, IDF and estimations. Milk / feed price ratio: Method see Chapter 2. Milk prices are shown in ECM.

82 © IFCN 2008United States

© IFCN 2008 83
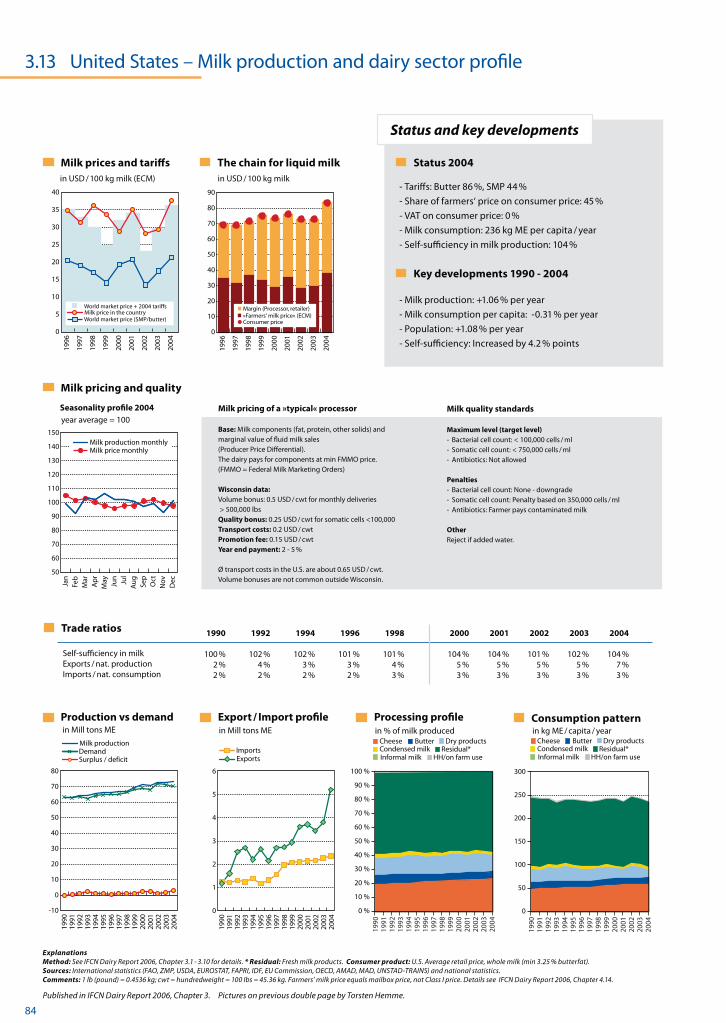
84 © IFCN 2008
Milk pricing and quality
Production vs demand Export / Import profilein Mill tons ME
Processing profile in % of milk produced
Consumption pattern in kg ME / capita / year
Status and key developments
Milk prices and tariffs The chain for liquid milk
Trade ratios
Seasonality profile 2004
Self-sufficiency in milkExports / nat. productionImports / nat. consumption
in Mill tons ME
Surplus / deficit
Milk productionDemand Imports
Exports
year average = 100
Milk price monthlyMilk production monthly
Published in IFCN Dairy Report 2006, Chapter 3.
0
10
20
30
40
50
60
70
80
90
2004
2003
2002
2001
2000
1999
1998
1997
1996
Consumer price
Margin (Processor, retailer)»Farmers' milk price« (ECM)
0
5
10
15
20
25
30
35
40
World market price + 2004 tariffs
World market price (SMP/butter)Milk price in the country
2004
2003
2002
2001
2000
1999
1998
1997
1996
in USD / 100 kg milk (ECM) in USD / 100 kg milk
3.13 United States – Milk production and dairy sector profile
50
60
70
80
90
100
110
120
130
140
150
Milk price monthlyMilk production monthly
Dec
NovOct
Sep
Au
gJu
lJu
nM
ayA
pr
Mar
Feb
Jan
0
50
100
150
200
250
300
2004
2003
2002
2001
2000
1999
1998
1997
1996
1995
1994
1993
1992
1991
1990
0 %
10 %
20 %
30 %
40 %
50 %
60 %
70 %
80 %
90 %
100 %
2004
2003
2002
2001
2000
1999
1998
1997
1996
1995
1994
1993
1992
1991
1990
0
1
2
3
4
5
6
2004
2003
2002
2001
2000
1999
1998
1997
1996
1995
1994
1993
1992
1991
1990
-10
0
10
20
30
40
50
60
70
80
2004
2003
2002
2001
2000
1999
1998
1997
1996
1995
1994
1993
1992
1991
1990
Status 2004
- Tariffs: Butter 86 %, SMP 44 %- Share of farmers‘ price on consumer price: 45 % - VAT on consumer price: 0 % - Milk consumption: 236 kg ME per capita / year- Self-sufficiency in milk production: 104 %
Key developments 1990 - 2004 - Milk production: +1.06 % per year- Milk consumption per capita: -0.31 % per year- Population: +1.08 % per year- Self-sufficiency: Increased by 4.2 % points
ExplanationsMethod: See IFCN Dairy Report 2006, Chapter 3.1 - 3.10 for details. * Residual: Fresh milk products. Consumer product: U.S. Average retail price, whole milk (min 3.25 % butterfat).Sources: International statistics (FAO, ZMP, USDA, EUROSTAT, FAPRI, IDF, EU Commission, OECD, AMAD, MAD, UNSTAD-TRAINS) and national statistics.Comments: 1 lb (pound) = 0.4536 kg; cwt = hundredweight = 100 Ibs = 45.36 kg. Farmers’ milk price equals mailbox price, not Class I price. Details see IFCN Dairy Report 2006, Chapter 4.14.
1990 1992 1994 1996 1998 2000 2001 2002 2003 2004
100 % 102 % 102 % 101 % 101 % 104 % 104 % 101 % 102 % 104 % 2 % 4 % 3 % 3 % 4 % 5 % 5 % 5 % 5 % 7 % 2 % 2 % 2 % 2 % 3 % 3 % 3 % 3 % 3 % 3 %
Milk pricing of a »typical« processor
Base: Milk components (fat, protein, other solids) andmarginal value of fluid milk sales (Producer Price Differential).The dairy pays for components at min FMMO price.(FMMO = Federal Milk Marketing Orders)
Wisconsin data:Volume bonus: 0.5 USD / cwt for monthly deliveries > 500,000 lbsQuality bonus: 0.25 USD / cwt for somatic cells <100,000Transport costs: 0.2 USD / cwt Promotion fee: 0.15 USD / cwtYear end payment: 2 - 5 %
Ø transport costs in the U.S. are about 0.65 USD / cwt.Volume bonuses are not common outside Wisconsin.
Milk quality standards
Maximum level (target level)- Bacterial cell count: < 100,000 cells / ml- Somatic cell count: < 750,000 cells / ml- Antibiotics: Not allowed
Penalties- Bacterial cell count: None - downgrade- Somatic cell count: Penalty based on 350,000 cells / ml- Antibiotics: Farmer pays contaminated milk
OtherReject if added water.
Residual*Condensed milkDry productsButterCheese
HH/on farm useInformal milkResidual*Condensed milk
Dry productsButterCheese
HH/on farm useInformal milk
Pictures on previous double page by Torsten Hemme.

© IFCN 2008 85
Key variables
Farm structure 2005
Milk production in ECM Production (mill t)Cows (in 1,000’s )Yield (t / cow / year)
Farm structure No. of dairy farms (in 1,000’s)Average farm size (cow s / farm)Milk per farm (t milk / farm / year) Prices in national currencyCull cow price (EUR / kg live weight)Land price – buy (EUR / ha)Quota price (EUR / kg milk)
Farm structure Milk and feed price Milk / feed price ratio
Status and key developments
Size classes
% of dairy farms in size classes % of cows in size classes
% of cows in size classes EUR / 100 kg Milk price / feed price
Cows per size classFarms per size class
Milk / barley price ratioMilk / feed price ratio
World feed price (nominal)
Milk price (nominal) Milk price (real)Feed price (nominal)
Published in IFCN Dairy Report 2007, Chapter 3.
3.13 United States – Milk production and dairy sector profile
0 %
10 %
20 %
30 %
40 %
50 %
60 %
70 %
80 %
90 %
100 %
2005
2004
2003
2002
2001
2000
1999
1998
1997
1996
50 - 99
30 - 49
500 - 999
200 - 499 >2,000
1 - 29 100 - 199 1,000 - 1,999
2005
2004
2003
2002
2001
2000
1999
1998
1997
1996
0
5
10
15
20
25
30
35
40Favourable
Not favourable
0
1
2
3
4
5
6
2005
2004
2003
2002
2001
2000
1999
1998
1997
1996
0 %
5 %
10 %
15 %
20 %
25 %
30 %
> 2
,000
1,0
00-1
,999
500
-999
200
-499
100
-199
50-
99
30-
49
1-2
9
Annual growth rates 1996 1998 2000 2001 2002 2003 2004 2005 2000 - 2005
66 67 72 71 73 73 73 76 1.1 % 9,372 9,151 9,199 9,103 9,139 9,083 9,012 9,041 -0.3 % 7.0 7.3 7.8 7.8 8.0 8.0 8.1 8.4 1.5 % 131 117 105 98 92 86 81 78 -5.7 % 72 78 87 93 99 105 111 115 5.7 % 503 572 680 723 790 844 896 965 7.2 % 0.63 0.75 0.74 0.83 0.67 0.82 0.94 1.21 10.5 % 2,964 3,310 3,606 3,730 3,927 4,100 4,372 5,212 7.6 %
Status 2005
- No. of dairy farms: 78,300- Average farm size: 115.5 cows per farm- Main size class: > 2,000 cows- Milk / feed price ratio: 3.3
Key developments 2000 - 2005 - Farm growth: + 7.2 % milk per farm and year- Milk price: + 4.2 % per year- Feed prices: + 1.7 % per year- Milk / feed price ratio: Fluctuating around 3.0- Land prices: + 7.6 % per year- Cull cow prices: + 10.5 % per year
Cull cow price (USD / kg live weight)Land price – buy (USD / ha)
ExplanationsMilk map details: Data base 2000 - 2005.Estimates: The cull cow prices are based on Wisconsin typical farms.Source: National statistics, FAO, Eurostat, USDA, ZMP, IDF and estimations. Milk / feed price ratio: Method see Chapter 2. Milk prices are shown in ECM.
USD / 100 kg
Milk / corn price ratio
US -
USA
-8.4
-9.34.3
3.14.1
-4.4
0.0-2.2
-1.6
-0.5
0.5
7.1
-1.3 5.5
8.1-4.2
-9.1
-5.1
-3.4
-2.3
3.4
-2.9
-3.6
-6.7
1.9
-3.2
-7.4
-3.0
-0.7
-4.7
5.8
2.6
0.3
1.2
-1.2
6.8
-1.2
-7.8
-4.9
-0.5
-4.7
2.3
-0.3
-1.3
-0.3
0.1
-0.3
-6.0
-0.8
-
-4.3
3.14.1
-1.6
-0.5
0.5
7.1
-1.3 5.5
8.1-
- 9.1
-
-2.3
3.4
-2.9
-
-
1.9
-3.2
-7.4
-3.0
-0.7
-4.7
-
-4.3
3.14.1
- 4.4
0.0
-2.2
-1.6
-
0.5
7.1
-1.3 5.5
8.1-
-
-5.1
-3.4
-2.3
3.4
-
-
-
1.9
-
-
-
-0.7
-4.72.6
0.3
1.2
-1.2
6.8
-1.2
-7.8
-
-
-
2.3
-0.3
-1.3
-0.3
0.1
-
-6.0
-
8.4
9.3
4.23.6
6.7
3.2
7.4
3.0
4.9
0.5
4.7
0.3
0.8
5.8
Change in milk production (% per year)
Annual changes in %-100 <= -5
> -5 <= -2.5> -2.5 <= -0.5> -0.5 <= 0.5
> 0.5 <= 2.5> 2.5 <= 5
> 5 <= 100no data

86 © IFCN 2008New Zealand
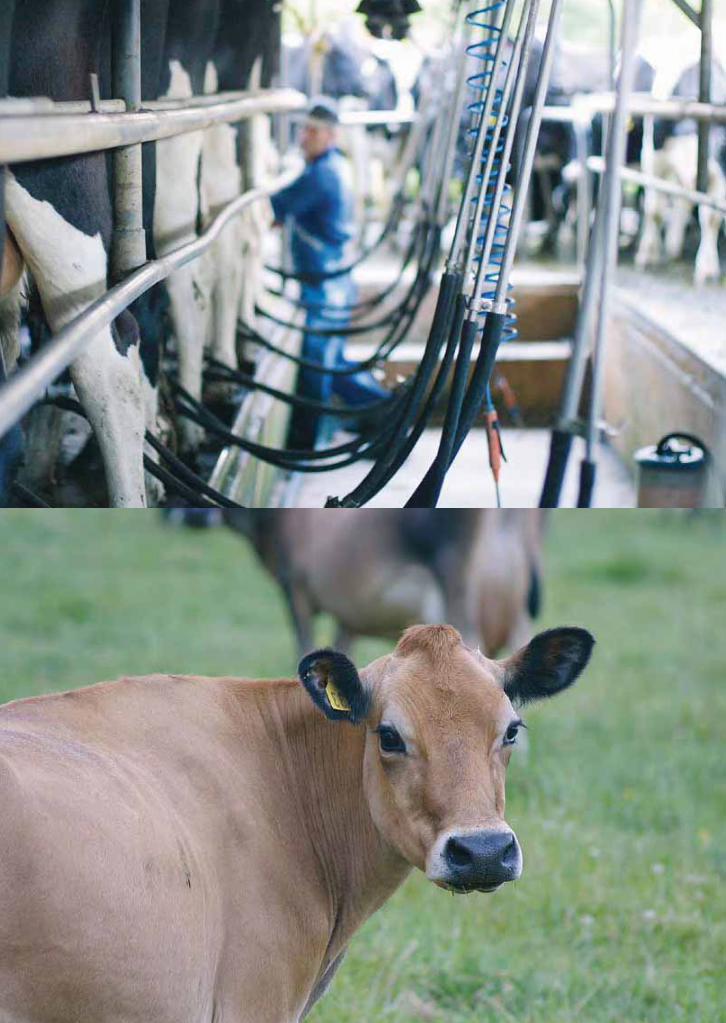
© IFCN 2008 87

88 © IFCN 2008
Milk pricing and quality
Production vs demand Export / Import profilein Mill tons ME
Processing profile in % of milk produced
Consumption pattern in kg ME / capita / year
Status and key developments
Milk prices and tariffs The chain for liquid milk
Trade ratios
Seasonality profile 2004
Self-sufficiency in milkExports / nat. productionImports / nat. consumption
in Mill tons ME
Surplus / deficit
Milk productionDemand Imports
Exports
year average = 100
Milk price monthlyMilk production monthly
Published in IFCN Dairy Report 2006, Chapter 3.
3.14 New Zealand – Milk production and dairy sector profile
0
20
40
60
80
100
120
140
160
180
200Milk production monthly
Dec
NovOct
Sep
Au
gJu
lJu
nM
ayA
pr
Mar
Feb
Jan
0
50
100
150
200
250
300
350
400
450
2004
2003
2002
2001
2000
1999
1998
1997
1996
1995
1994
1993
1992
1991
1990
0 %
10 %
20 %
30 %
40 %
50 %
60 %
70 %
80 %
90 %
100 %
2004
2003
2002
2001
2000
1999
1998
1997
1996
1995
1994
1993
1992
1991
1990
0
2
4
6
8
10
12
14
16
2004
2003
2002
2001
2000
1999
1998
1997
1996
1995
1994
1993
1992
1991
1990
0
2
4
6
8
10
12
14
16
18
2004
2003
2002
2001
2000
1999
1998
1997
1996
1995
1994
1993
1992
1991
1990
Status 2004
- Tariffs: Butter 0 %, SMP 5 %- Share of farmers’ price on consumer price: 21 % - VAT on consumer price: 12.5 % - Milk consumption: 171 kg ME per capita / year- Self-sufficiency in milk production: 2,443 %
Key developments 1990 - 2004 - Milk production: +4.69 % per year- Milk consumption per capita decreased- Population: +1.08 % per year- Self-sufficiency: Increased significantly
0
20
40
60
80
100
120
140
160
180
2004
2003
2002
2001
2000
1999
1998
1997
1996
Consumer price
Margin (Processor, retailer)»Farmers' milk price« (ECM)
VAT on consumer price
0
10
20
30
40
50
60
World market price + 2004 tariffs
World market price (SMP/butter)Milk price in the country
2004
2003
2002
2001
2000
1999
1998
1997
1996
in NZD / 100 kg milk in NZD / 100 kg milk
ExplanationsMethod: See IFCN Dairy Report 2006, Chapter 3.1 - 3.10 for details. * Residual: Fresh milk products. Consumer product: Fresh milk 2 l milk bottle (Statistic New Zealand).Sources: International statistics (FAO, ZMP, USDA, EUROSTAT, FAPRI, IDF, EU Commission, OECD, AMAD, MAD, UNSTAD-TRAINS) and national statistics.Comments: Year 2004: Oceania = Season 2003 / 2004; Usage of milk on farm and informal milk very low; Estimates for informal sector are between 1 - 2 %.Modified calculation: Consumption / capita based on FAPRI data. All other variables adjusted to this modification.
1990 1992 1994 1996 1998 2000 2001 2002 2003 2004
635 % 774 % 870 % 1,097 % 1,352 % 1,924 % 2,153 % 2,238 % 2,305 % 2,443 % 84 % 87 % 89 % 91 % 93 % 95 % 96 % 96 % 97 % 96 % 1 % 2 % 3 % 5 % 4 % 13 % 19 % 12 % 32 % 12 %
Milk pricing of a »typical« processor
Base: Milk solids; formula: A + B + / - C where : »A« = NZD cents per kg of milk fat, »B« = NZD cents per kg of protein and »C« = volume adjustment charge.
If a supplier has a milk solids % equal to the company‘s average milk solids %, then »C« = 0, otherwise the »C« acts as a bonus or penalty.
The shareholder of the cooperative must hold oneshare for every kg of milk solids they produceduring the season.
Penalties have to be paid if too high milk volume(0.06 NZD / extra litre).
Milk quality standards
Maximum level (target level)- Maximum level (target level)- Bacterial cell count: < 50,000 cells / ml- Somatic cell count: < 400,000 cells / ml- Antibiotics: <0.003 IU / ml
PenaltiesPenalty for poor milk quality.
Other- Bacterial cell count: Follow-up testing until 3 clear- Somatic cell count: tested daily- Antibiotics: 12 month daily testing post positive result
Residual*Condensed milkDry productsButterCheese
Residual*Dry productsButterCheese
Pictures on previous double page by Katja Seifert.

© IFCN 2008 89
Key variables
Farm structure 2005
Milk production in ECM Production (mill t)Cows (in 1,000’s )Yield (t / cow / year)
Farm structure No. of dairy farms (in 1,000’s)Average farm size (cow s / farm)Milk per farm (t milk / farm / year) Prices in national currencyCull cow price (EUR / kg live weight)Land price – buy (EUR / ha)Quota price (EUR / kg milk)
Farm structure Milk and feed price Milk / feed price ratio
Status and key developments
Size classes
% of dairy farms in size classes % of cows in size classes
% of cows in size classes EUR / 100 kg Milk price / feed price
Cows per size classFarms per size class
Milk / barley price ratioMilk / feed price ratio
World feed price (nominal)
Milk price (nominal) Milk price (real)Feed price (nominal)
Published in IFCN Dairy Report 2007, Chapter 3.
land
-1.3
-0.9
4.81.1
8.7
7.9-0.2
0.8
0.8
6.5
11.7
5.69.3
1.7
1.7
1.7
-1.3
- 0.9
4.81.1
8.7
7.9-0.20.8
0.8
6.5
11.7
5.6
9.3
1.7
1.7
1.7
Change in milk production (% per year)
Annual changes in %-100 <= -5
> -5 <= -2.5> -2.5 <= -0.5> -0.5 <= 0.5
> 0.5 <= 2.5> 2.5 <= 5
> 5 <= 100no data
3.14 New Zealand – Milk production and dairy sector profile
0 %
10 %
20 %
30 %
40 %
50 %
60 %
70 %
80 %
90 %
100 %
2005
2004
2003
2002
2001
2000
1999
1998
1997
1996
200 - 249
150 - 199
100 - 149
10 - 99
300 - 349
250 - 299 350 - 449
> 450
2005
2004
2003
2002
2001
2000
1999
1998
1997
1996
0
5
10
15
20
25
30
35
40
45Favourable
Not favourable
0.0
0.5
1.0
1.5
2.0
2.5
3.0
2005
2004
2003
2002
2001
2000
1999
1998
1997
1996
0 %
5 %
10 %
15 %
20 %
25 %
30 %
35 %
40 %
> 4
50
350-
449
300-
349
250-
299
200-
249
150-
199
100-
149
10-9
9
Status 2005
- No. of dairy farms: 12,271- Average farm size: 315 cows per farm- Main size class: > 450 cows- Milk / feed price ratio: 1.4
Key developments 2000 - 2005 - Farm growth: + 7.2 % milk per farm and year- Milk price: 4 % per year- Feed prices: - 3.5 % per year- Milk / feed price ratio: Up since 2003- Land prices: + 14.4 % per year- Cull cow prices: - 1.9 % per year- Share prices: + 12.9 % per year
Cull cow price (NZD / kg live weight)Land price – buy (NZD / ha)Share price (NZD / kg milk)
ExplanationsMilk map details: Data base 2000 - 2005.Milk/feed price: Since no statistical information on soya bean meal prices are available the world market price is used. Trend of world corn price used for the years 2004 - 2005.Estimates: Cull cow price per kg live weight = 45 % of price per carcass weight.Source: National statistics, FAO, Eurostat, USDA, ZMP, IDF and estimations. Milk / feed price ratio: Method see Chapter 2. Milk prices are shown in ECM.
NZD / 100 kg
Milk / corn price ratio
Annual growth rates 1996 1998 2000 2001 2002 2003 2004 2005 2000 - 2005
10.8 12.0 12.6 14.3 15.0 15.5 16.3 15.8 4.6 % 2,936 3,223 3,269 3,486 3,693 3,741 3,851 3,868 3.4 % 3.7 3.7 3.9 4.1 4.1 4.1 4.2 4.1 1.1 % 14.7 14.7 13.9 13.9 13.6 13.2 12.8 12.3 - 2.4 % 199 220 236 251 271 283 302 315 6.0 % 731 819 910 1,029 1,099 1,171 1,281 1,287 7.2 % 0.57 0.82 1.19 1.48 1.42 0.98 0.98 1.08 - 1.9 % 13,187 11,076 10,740 13,959 14,658 16,498 18,287 21,085 14.4 % Share price was not seperated from the land price 0.32 0.37 0.39 0.46 12.9 %

Pakistan
Uganda

China
Thailand

China

Chapter 4International Competitiveness of ‘Typical‘ Dairy Farms
Pictures on this and previous double page: Housing (Pictures by: Katja Seifert, Otto Garcia and Torsten Hemme)
4.1 Summary 94
4.2 Overview of selected dairy farm types 96
4.3 Overview of the whole farm 98
4.4 Farm income, profits and returns to labour 100
4.5 Asset structure and returns on investments 102
4.6 Producer milk prices and non-milk returns 104
4.7 Costs of milk production only; milk prices 106
4.8 Total milk production costs and returns to the dairy enterprise 108
4.9 Cost component: labour 110
4.10 Cost component: land 112
4.11 Cost component: capital (excluding land and quota) 114

94 © IFCN 2008
4.1 Summary
Introduction
This chapter compares the international competitiveness of ‘typical’ dairy farming systems in selected countries, with special focus on the cost of milk production and main determinants thereof. It also seeks to determine whether small-scale dairy farms in developing countries are in a position to compete with large-scale dairy farming systems in industrialized countries.
Farm types and data
Thirty dairy farm types from 13 countries have been compared using the standard IFCN methodology. Farms representative of various dairy farming systems were selected in Bangladesh, Cameroon, China, India, Morocco, Pakistan, Peru, Thailand, Uganda and Viet Nam and subjected to detailed analysis. For the industrialized countries, similar analyses were conducted for farms in Germany, New Zealand and the USA. In general, the first farm ‘type’ represents the current ‘average’ farm, while the second represents either a larger farm type or a different, but relevant, dairy production system. A detailed description of the farms appears in Annex 5.
While production data usually refer to the calendar year 2005, data for the farms in Africa and China were obtained in 2006 when they entered the IFCN data collection system. For the farms in India (Orissa and Karnataka), Thailand and Viet Nam, the data were obtained in 2004. In order to make use of available information, 2005 exchange rates were applied to all financial farm data.
Comparison of dairy returns
Dairy farm returns derive from milk and/or non-milk items (sales of cattle and manure, government payments, etc.). Milk returns account for 55 to 95 percent of the returns of all farm types analysed, and range from US$12 to US$36/100 kg of ECM. These returns are mainly determined by three categories of farmgate milk prices, which were:
Less than US$20/100 kg: Observed in Pakistan and Uganda.
US$20-30/100 kg: Although most farms receive prices in this range, those in India, New Zealand Viet Nam are at the lower end of the range whereas prices in Bangladesh and Thailand are at the higher end.
More than US$30/100 kg: Farmers in Cameroon, Germany, Morocco and the USA all obtained similar milk prices of about US$36/100 kg of ECM.
Non-milk items account for US$2 to 38/100 kg ECM of the returns of the dairy farm types analysed. The main determinants of non-milk returns were the cattle/beef price levels; culling rates and, related to that, strategies for selling calves and surplus heifers; yields per lactation; the level of government payments coupled to milk production; and use of manure on the farm. Based on these factors, non-milk returns were very low for the farms in India and very high in Germany and Morocco.
Comparison of the cost of milk production
Lowest milk production costs (less than US$12/100 kg) were observed for both farm types in Uganda and for the larger farm type in Cameroon. Production costs on all farm types in China, New Zealand, Peru, Thailand and the USA were slightly higher (US$22 to 30/100 kg), but were highest in Germany (over US$35/100 kg).
Given major differences in agricultural wage rates between developed and developing countries, it might be assumed that developing country farms have a labour cost advantage. It is, however, interesting to note that this was found not to be the case when comparing labour costs per litre of milk, mainly because as a general rule regions with higher salaries also have a significantly higher level of labour productivity. Expressed in terms of per litre of milk, the labour costs of a nine-cow dairy farm in Punjab, India, are similar to those of a 350-cow farm in the USA. The key cost advantage of smallholder dairy farming is the use of low-cost feed and the overall ‘low-tech’ approach to milk production. Cows fed on crop residues, such as straw, are lower-cost producers of milk than high-yielding, grain-fed dairy cows.
Economies of scale
In general, comparison of farm types within and across countries and regions supports the hypothesis that economies of scale exist in milk production. It was observed that in Thailand and Uganda lower milk production costs were incurred only by the smaller farm types, mainly because of their significantly higher non-milk returns per 100 kg of milk.

© IFCN 2008 95
Cost comparison between developed and
developing countries
To obtain a clearer understanding of their comparative position in terms of international and local competitiveness, a simple average of key indicators of competitiveness was calculated for farmers in both developing and developed countries. Although the method is very crude and there are very large variations within each group, the comparison is most informative.
Average milk production costs in the three developed countries covered by this study (Germany, New Zealand and the USA) stand at US$31.4/100 kg, or 56 percent above the average production cost of US$20.2/100 kg calculated for the ten developing countries (Bangladesh, Cameroon, China, India, Morocco, Pakistan, Peru, Thailand, Uganda and Viet Nam). The average price of milk in the three aforementioned developed countries (US$31.2/100 kg) is only 30 percent higher than that of the developing countries (US$24.0/100 kg). Thus, the overall profitability of milk production appears to be higher in developing countries than in the developed ones, which may be one of the reasons why developing countries are increasing their shares in global dairy production.
Returns to labour
If dairy farming is to be sustainable, it is essential that it should be able to compete for labour on the local labour market. The indicator ‘return to labour’ quantifies the ‘value-added’ per hour of labour put into dairy farming. If this return is higher than the average local wage rate, then the farming system can afford to pay competitive wages and should be sustainable from the labour standpoint. The average return to labour observed in the developing countries covered by this study is US$0.45/hour, which is 45 percent higher than the average local wage of US$0.31/hour. In the three developed countries, the average return to labour is US$16.30/hour, which is still 22 percent above the average estimated wage of US$13.30/hour. These figures indicate that dairy farming can compete on the local labour market in both groups of countries. However, despite these favourable returns to labour from dairy farming, the figures also show that milk production can quickly lose its competitive advantage if local wages rise faster than labour productivity.
Impact of increasing feed prices on competitiveness
Given the rapid increases in feed prices over the recent past, it is important to consider how this affects the small-scale dairy farmers in developing countries in terms of competitiveness. In general, as these smallholder dairy systems normally use much less compound feed per kilogram of milk produced than dairy farms in the EU and the USA, rising feed prices increase the cost of milk production in the latter countries much faster than in the low-yield systems predominating in the developing countries. As a result, small scale dairy farming becomes even more competitive as feed prices increase.
0
5
10
15
20
25
30
35
40
45
50
Indi
a
Paki
stan
Ban
glad
esh
Thai
land
Viet
nam
Chi
na
Uga
nda
Cam
eroo
n
Mor
occo
Peru
Ger
man
y
USA
New
Zea
land
US-
$/10
0 kg
milk
(EC
M) min
max
Cost range
4.1 Summary
Cost ranges of typical farms analysed
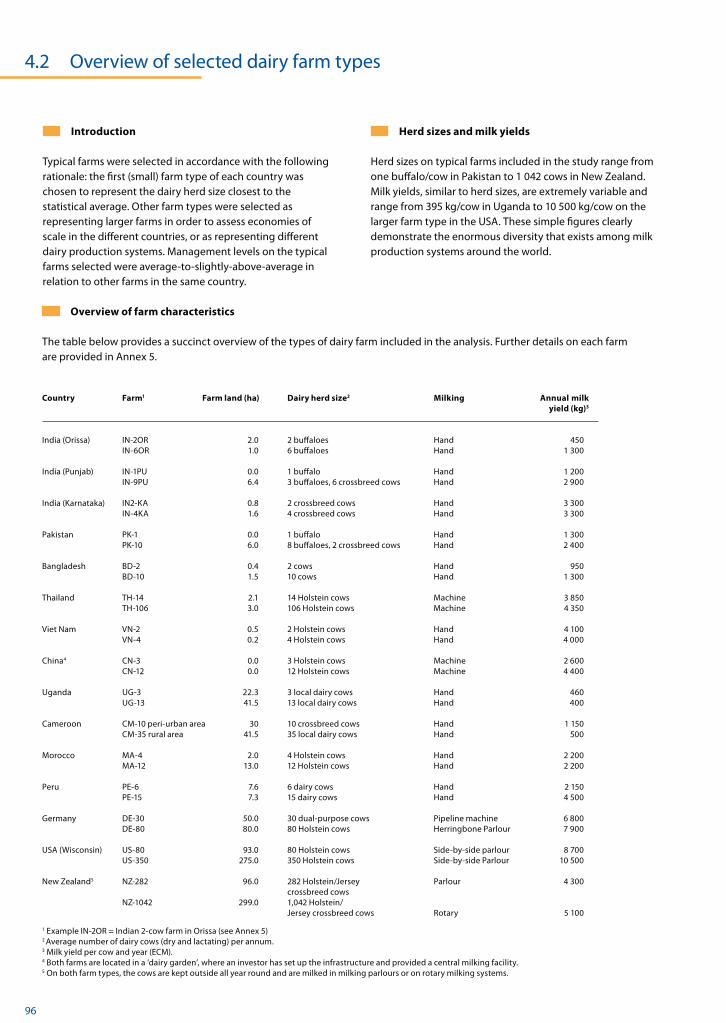
96 © IFCN 2008
4.2 Overview of selected dairy farm types
Introduction
Typical farms were selected in accordance with the following rationale: the first (small) farm type of each country was chosen to represent the dairy herd size closest to the statistical average. Other farm types were selected as representing larger farms in order to assess economies of scale in the different countries, or as representing different dairy production systems. Management levels on the typical farms selected were average-to-slightly-above-average in relation to other farms in the same country.
Overview of farm characteristics
The table below provides a succinct overview of the types of dairy farm included in the analysis. Further details on each farm are provided in Annex 5.
Country Farm1 Farm land (ha) Dairy herd size2 Milking Annual milk yield (kg)3
India (Orissa) IN-2OR 2.0 2 buffaloes Hand 450 IN-6OR 1.0 6 buffaloes Hand 1 300
India (Punjab) IN-1PU 0.0 1 buffalo Hand 1 200 IN-9PU 6.4 3 buffaloes, 6 crossbreed cows Hand 2 900
India (Karnataka) IN2-KA 0.8 2 crossbreed cows Hand 3 300 IN-4KA 1.6 4 crossbreed cows Hand 3 300 Pakistan PK-1 0.0 1 buffalo Hand 1 300 PK-10 6.0 8 buffaloes, 2 crossbreed cows Hand 2 400 Bangladesh BD-2 0.4 2 cows Hand 950 BD-10 1.5 10 cows Hand 1 300 Thailand TH-14 2.1 14 Holstein cows Machine 3 850 TH-106 3.0 106 Holstein cows Machine 4 350 Viet Nam VN-2 0.5 2 Holstein cows Hand 4 100 VN-4 0.2 4 Holstein cows Hand 4 000 China4 CN-3 0.0 3 Holstein cows Machine 2 600 CN-12 0.0 12 Holstein cows Machine 4 400 Uganda UG-3 22.3 3 local dairy cows Hand 460 UG-13 41.5 13 local dairy cows Hand 400 Cameroon CM-10 peri-urban area 30 10 crossbreed cows Hand 1 150 CM-35 rural area 41.5 35 local dairy cows Hand 500 Morocco MA-4 2.0 4 Holstein cows Hand 2 200 MA-12 13.0 12 Holstein cows Hand 2 200 Peru PE-6 7.6 6 dairy cows Hand 2 150 PE-15 7.3 15 dairy cows Hand 4 500 Germany DE-30 50.0 30 dual-purpose cows Pipeline machine 6 800 DE-80 80.0 80 Holstein cows Herringbone Parlour 7 900 USA (Wisconsin) US-80 93.0 80 Holstein cows Side-by-side parlour 8 700 US-350 275.0 350 Holstein cows Side-by-side Parlour 10 500 New Zealand5 NZ-282 96.0 282 Holstein/Jersey Parlour 4 300 crossbreed cows NZ-1042 299.0 1,042 Holstein/ Jersey crossbreed cows Rotary 5 100
1 Example IN-2OR = Indian 2-cow farm in Orissa (see Annex 5) 2 Average number of dairy cows (dry and lactating) per annum. 3 Milk yield per cow and year (ECM). 4 Both farms are located in a ‘dairy garden’, where an investor has set up the infrastructure and provided a central milking facility. 5 On both farm types, the cows are kept outside all year round and are milked in milking parlours or on rotary milking systems.
Herd sizes and milk yields
Herd sizes on typical farms included in the study range from one buffalo/cow in Pakistan to 1 042 cows in New Zealand. Milk yields, similar to herd sizes, are extremely variable and range from 395 kg/cow in Uganda to 10 500 kg/cow on the larger farm type in the USA. These simple figures clearly demonstrate the enormous diversity that exists among milk production systems around the world.

© IFCN 2008 97
Farm types
NZ
-104
2
NZ
-282
US-
350W
I
US-
80W
I
DE-
80N
DE-
30S
PE-1
5
PE-6
MA
-12
MA
-4
CM
-35
CM
-10
UG
-13
UG
-3
CN
-12
CN
-3
VN
-4
VN
-2
TH-1
06
TH-1
4
BD
-10
BD
-2
PK-1
0
PK-1
IN-4
KA
IN-2
KA
IN-9
PU
IN-1
PU
IN-6
OR
IN-2
OR-
B
NZ
-104
2
NZ
-282
US-
350W
I
US-
80W
I
DE-
80N
DE-
30S
PE-1
5
PE-6
MA
-12
MA
-4
CM
-35
CM
-10
UG
-13
UG
-3
CN
-12
CN
-3
VN
-4
VN
-2
TH-1
06
TH-1
4
BD
-10
BD
-2
PK-1
0
PK-1
IN-4
KA
IN-2
KA
IN-9
PU
IN-1
PU
IN-6
OR
IN-2
OR-
B
No. of cows / farm
1,000 kg milk (ECM) / cow / year
Size of typical farm
Size of typical farms
Milk yield
0
20
40
60
80
100350106 282
1,042
0
1
2
3
4
5
6
7
8
9
10
11
4.2 Overview of selected dairy farm types

98 © IFCN 2008
4.3 Overview of the whole farm
Returns structure of the whole farm
Most of the farm types included in the assessment were specialized dairy farms obtaining more than 60 percent of their returns from dairy activities. Non-specialized dairy farms (with less than 60 percent of their returns from dairying) were observed in Bangladesh (Sirajgani), India (Orissa and Punjab), Pakistan (Layyah) and Uganda (Kayunga), mainly because dairying is a supplementary occupation in mixed farming systems.
Many dairy farms also have crop enterprises that produce mainly cash crops. Other typical non-dairy activities include sheep- or goat-raising (PK-1, BD-2, UG-13, PE-6): poultry production (IN-4KA, PK, BD-2, TH-14, UG-3); pig-raising (UG); fish-farming (BD-10); contract labour/custom work (DE-30S, US-80WI); and forestry (DE-30S). Off-farm activities are very common on small farms in Bangladesh, India, Morocco, Pakistan, Thailand, Viet Nam and Uganda. The DE-30S farm obtained additional income from renting out houses.
Capital structure of the whole farm
The chart shows the share of liabilities on total assets, which range from 0 percent to 65 percent. These liabilities can be grouped into four share categories:
Very high – more than 50 percent: CN-3. Medium – 30 to 50 percent: US-350WI and New
Zealand farm types. Low – 0 to 30 percent: Half of the farms fall into in this
range. No liabilities: While individual farms with no liabilities
were found in all developing countries (except China), all farms in industrialized countries have some liabilities.
These differences can be explained by the following:
Production systems require different capital inputs. Growth under a quota regime calls for large
investments in quota. Farm history: Farmers who have recently invested in
setting up or expanding a farm need credit. Land ownership: Farmers who historically own land or
have expanded their farms by renting more land have chances of investing only in livestock, machinery and buildings without taking on high debts. In New Zealand, where farms grow by means of land purchases, debt levels are relatively high and restrict growth.
Access to capital markets: Liabilities are low in Asia and Africa because it is difficult to obtain capital for farming activities.
Profit margins
Profit margins range from -36 percent to +70 percent. As a general rule, margins are high (more than 25 percent) on small family farms because they are run without hired labour and have limited liabilities.
Explanation of variablesFarm codes: Example DE-30S= German 30-cow farm in the south (for details see Annex 5). Returns: All cash receipts plus value of products consumed by household plus change in inventory (e.g. livestock). Dairy returns: Milk sales, cull cows, heifers, calves, direct payments, and also marketable milk consumed on-farm. Cash crops: Sales of surplus crops such as grain, soybean, etc. (plus related crop payments). Other returns: Beef fattening, forestry, poultry, etc. Liabilities: Total year-end liabilities (leasing and operating loans not included).Equity: Total assets (book value of machinery, buildings, market values of livestock, land and quota) − liabilities. Farm income: Total returns minus costs from the profit and loss (P&L) account (cash costs + depreciation + balance of input inventory).Profit margin (share of farm income on total returns): Farm income divided by farm returns. This figure provides an idea of how vulnerable a farm may be to changes in farm costs or returns. If the margin is small, the farm has no risk buffer.

© IFCN 2008 99
NZ
-104
2
NZ
-282
US-
350W
I
US-
80W
I
DE-
80N
DE-
30S
PE-1
5
PE-6
MA
-12
MA
-4
CM
-35
CM
-10
UG
-13
UG
-3
CN
-12
CN
-3
VN
-4
VN
-2
TH-1
06
TH-1
4
BD
-10
BD
-2
PK-1
0
PK-1
IN-4
KA
IN-2
KA
IN-9
PU
IN-1
PU
IN-6
OR
IN-2
OR-
B
Farm types
NZ
-104
2
NZ
-282
US-
350W
I
US-
80W
I
DE-
80N
DE-
30S
PE-1
5
PE-6
MA
-12
MA
-4
CM
-35
CM
-10
UG
-13
UG
-3
CN
-12
CN
-3
VN
-4
VN
-2
TH-1
06
TH-1
4
BD
-10
BD
-2
PK-1
0
PK-1
IN-4
KA
IN-2
KA
IN-9
PU
IN-1
PU
IN-6
OR
IN-2
OR-
B
NZ
-104
2
NZ
-282
US-
350W
I
US-
80W
I
DE-
80N
DE-
30S
PE-1
5
PE-6
MA
-12
MA
-4
CM
-35
CM
-10
UG
-13
UG
-3
CN
-12
CN
-3
VN
-4
VN
-2
TH-1
06
TH-1
4
BD
-10
BD
-2
PK-1
0
PK-1
IN-4
KA
IN-2
KA
IN-9
PU
IN-1
PU
IN-6
OR
IN-2
OR-
B
0 %
10 %
20 %
30 %
40 %
50 %
60 %
70 %* = profit margin negative
* *
Liabilities Equity
Other activities Cash crops Dairy
Capital structure of the whole farm
Return structure of the whole farm
Profit margin of the whole farm (share of farm income on total returns)
0 %
20 %
40 %
60 %
80 %
100 %
0 %
20 %
40 %
60 %
80 %
100 %
4.3 Overview of the whole farm
100 © IFCN 2008
4.4 Farm income, profits and returns to labour
Farm income
The ‘farm income’ indicator describes a farm’s income based on the profit and loss (P&L) account. On family farms, this income provides the basis for covering family livelihoods and asset or capital growth. Salaries are deducted for farms that have hired labour. Farm income ranges from US$3/100 kg of milk to US$38/100 kg of milk. Smaller farms tend to have higher farm incomes per 100 kg of milk because of the higher proportion of family labour, which is not deducted. In Cameroon and Viet Nam, however, larger farms with hired labour generate higher farm incomes than the smaller farms, mainly because the former obtain higher output prices (Viet Nam) or have low wage costs for hired labour (several larger farms in Cameroon share a herdsman).
Entrepreneur profit
The ‘entrepreneur profit’ indicator shows whether farms cover their full economic costs. If the indicator is positive, all costs shown in the P&L account can be covered and family-owned production factors (labour, land, capital and quota) can be paid at market price (opportunity cost). In this case, farming systems are financially sustainable. Entrepreneur profits range from -US$15/100 kg of milk to +US$34/100 kg of milk; some 73 percent of the farms make a positive entrepreneur profit. Negative profits (losses) are found on the smaller farm types in Morocco, New Zealand, Pakistan and Peru, and on both farm types in China and Germany. In nearly all countries except Thailand and Uganda, the larger farm types earn greater profits per 100 kg of milk than the smaller ones. As mentioned earlier, the main reasons why the smaller farm types in Thailand and Uganda make higher profits predominantly relate to their higher non-milk returns due to high prices for cattle (and beef).
Returns to labour
The ‘returns to labour’ indicator shows the ‘value’ created (per hour) by a farm labourer and indicates the potential wage that can be paid. A comparison of returns to labour with the wage rate in the region concerned shows whether a farm can compete on the local labour market and cover its full economic costs. Farms unable to compete with wage levels in their regions may stay in business until a generation change takes place or as long as farmers are satisfied with the ‘wages’ they obtain for their work. For reasons of simplification, three general levels can be defined:
Less than US$1/hour: All farm types in the developing countries, except the larger farm types in Cameroon and Peru, have returns to labour of less than US$1.00/hour to put back into the dairy farm enterprise. This group represents 73 percent of the farms analysed here.
Between US$1 to 10/hour: Farms CM-35, PE-15, DE-30S and NZ-282.
More than US$10/hour: The larger farm types in Germany and New Zealand and both farm types in the USA.
Competitiveness on the labour market
Farms are competitive on the local labour market if their returns to labour input exceed wage levels in their regions. In Asia, the large farm types and both small and large farm types in Thailand and Viet Nam have competitive returns to labour but neither of the Chinese farms can compete on the local labour market, mainly due to the relatively high wage levels in the region. Diversity of local wage levels is large in Africa, as are returns to labour. Returns to labour in dairy farming are locally competitive only in Cameroon due to the grazing practices that keep labour costs low and because of the relatively high amount of beef/livestock sales that make a huge impact on dairy profitability. In Peru, the larger peri-urban farm type generates competitive returns to labour in relation to the local wage rate.
In the industrialized countries, the larger farm types generate higher returns to labour than the smaller ones and are thus more competitive on the local labour market. The most profitable farms were found in the USA, followed by the large farm type in New Zealand. Both farm types in Germany would need to undergo major restructuring if they are to generate locally competitive returns to labour. The overall difference between the highest- and lowest-performing dairy farms in terms of returns to labour input, is in the order of US$32.6/hour (US-350WI with US$33/hour and IN-9PU with US$0.4/hour).
Explanation of variablesFarm codes: Example DE-30S = German 30-cow farm in the south (details see Annex 5). Returns of the dairy enterprise: All dairy enterprise returns (as described in Annex 8). Farm income: Returns minus costs in dairy enterprise’s P&L account.Entrepreneur’s profit: Total returns minus full economic costs (costs from P&L account + opportunity costs) of dairy enterprise.Returns to labour: Entrepreneur’s profit plus labour costs divided by total labour input. Average farm wages: This figure represents the gross salary + social fees (insurance, taxes, etc.) that the employer is obliged to cover. Calculation: Total labour costs (wages paid plus opportunity costs) divided by the total hours worked. For this calculation, an estimate has been made of the number of hours worked by family members and employees.

© IFCN 2008 101
Farm types
NZ
-104
2
NZ
-282
US-
350W
I
US-
80W
I
DE-
80N
DE-
30S
PE-1
5
PE-6
MA
-12
MA
-4
CM
-35
CM
-10
UG
-13
UG
-3
CN
-12
CN
-3
VN
-4
VN
-2
TH-1
06
TH-1
4
BD
-10
BD
-2
PK-1
0
PK-1
IN-4
KA
IN-2
KA
IN-9
PU
IN-1
PU
IN-6
OR
IN-2
OR-
B
NZ
-104
2
NZ
-282
US-
350W
I
US-
80W
I
DE-
80N
DE-
30S
PE-1
5
PE-6
MA
-12
MA
-4
CM
-35
CM
-10
UG
-13
UG
-3
CN
-12
CN
-3
VN
-4
VN
-2
TH-1
06
TH-1
4
BD
-10
BD
-2
PK-1
0
PK-1
IN-4
KA
IN-2
KA
IN-9
PU
IN-1
PU
IN-6
OR
IN-2
OR-
B
0.0
0.2
0.4
0.6
0.8
1.0
1.2
1.4
1.6
1.8
2.02.0
Entrepreneur's profit Returns of the dairy enterprise Farm income
Returns and profits
Return to labour
US$ / 100 kg milk (ECM)
US$ / hour Average wages on the farm Return to labour
-20
-10
0
10
20
30
40
50
60
70
0
2
4
6
8
10
12
14
16
18
20
22
24
26
28
30
32
34
36
4.4 Farm income, profits and returns to labour
102 © IFCN 2008
4.5 Asset structure and returns on investments
Capital assets/investment per 100 kg milk
An analysis of asset structure and returns on investment provides indications of where best to invest profitably in dairy farming. This variable details the level of investments per 100 kg of milk required by the respective farm type. The return on investment is shown in order to rank the farming systems based on how efficiently they use their capital to generate profit.
With regard to assets, the capital input per 100 kg of milk ranges from US$20 to US$370 for the farm types assessed and may be grouped as follows:
More than US$200: Germany (DE-30S), India (IN-9PU and IN-2KA), Morocco (MA-12) and Peru. The main investment factors are land prices, livestock value, machinery and quota owned.
Between US$100 and 200: Some Asian farmers who own land and have cross- or purebred dairy animals and small dairy herds fall into this group. Purebred dairy cows and quota bring assets up to this level in MA-4 and DE-80N, respectively.
Less than US$100: About half the farms fall into this category, mainly because they own little or no land. Most Asian farms allocate little, if any, land to dairying itself but rely heavily on agricultural residues and purchased inputs. In Viet Nam, farmers are not allowed to own land; in China, farmers rent barn facilities, purchase all farm inputs and practise fully-confined dairying. For grazing, most African farmers depend on public land for which they pay a small fee. In the USA, large herd sizes and heavy purchases of feedstuff (leading to less land requirements) greatly reduce the farmers’ asset base per 100 kg milk.
Asset composition
Quota: High quota shares were found on the German farms.
Land: Land values (sometimes reaching as much as 90 percent) dominate asset composition in Oceania and Western Europe, and in dairy production systems in Bangladesh, India, Pakistan, Peru and Thailand operating on own land.
Livestock: Livestock values form the major asset in farms operating with little or no owned land, such as IN-1PU, PK-1 and farms in China, Uganda, and Viet Nam.
‘Other’ assets: For most farms these consist of circulating capital, the share of which is too small to appear on the graph. In New Zealand, ‘other assets’ are shares in a dairy cooperative and account for 15-25 percent of farm assets.
Within-country/between-farm differences in
asset composition
Peru: The larger farm is located near an urban centre, which increases both land prices and pressure to invest in productivity improvements.
India: Differences in assets are determined by the production systems themselves (with or without land). (The situation in Pakistan is similar.)
China: The two Chinese farms have very little or no machinery and building assets, as they are part of a cooperative and pay for the use of the machinery and buildings.
Cameroon: The smaller farm has dairy cows, cultivates fodder crops on its own land and provides housing for the animals. The larger farm owns local beef cattle that graze on public land and are occasionally milked.
Morocco: The smaller farm type is a typical example of small landholders diversifying into dairying; on the bigger dairy farm, a large landholder and crop farmer engage in dairying as a way of adding value to crop outputs.
Germany: Differences in assets are determined by the production systems themselves: the small farm participates in and benefits from direct payments from environmental protection initiatives; the larger farm is run along purely commercial lines.
Returns on investments
Returns on investments (ROIs) range between -18 and +40 percent. Most farms fall into the -3 to +5 percent range. High ROIs (more than 10 percent) were found in Cameroon (CM-35), India (IN-6OR), Viet Nam (VN-4) and the USA (US-350WI). It is important to note that in eight of the 13 countries, that is China, Germany, Morocco, New Zealand, Pakistan, Peru, Thailand and Uganda, neither of the two farm types evaluated had ROIs above 5 percent.
Inflation rates in all countries range between 1 percent and 9 percent (source: International Monetary Fund (IMF)). The highest rates, 7 to 9 percent, were observed in Bangladesh, Pakistan and Uganda.
Explanation of variablesFarm codes: Example DE-30S = German 30-cow farm in the south (details see Annex 5). Calculation of farm assets: Land, livestock, cooperative shares and quota at market price, machinery and buildings by book values. ROI: (Entrepreneur’s profit + estimated interest (on non-land, non-quota assets) + interest on quota + opportunity cost of land (by land rents)/all farm assets minus inflation rate for the year 2005. Changes in asset values (land, livestock, etc.) have not (yet) been included. Inflation rate: IMF World Economic Outlook 2004/ 2005/ 2006, gross domestic product deflator for developed countries, CPI (consumer Price Index) for the other countries. http://www.imf.org/external/pubs/ft/weo/ for 2004-2006.

© IFCN 2008 103
Farm types
NZ
-104
2
NZ
-282
US-
350W
I
US-
80W
I
DE-
80N
DE-
30S
PE-1
5
PE-6
MA
-12
MA
-4
CM
-35
CM
-10
UG
-13
UG
-3
CN
-12
CN
-3
VN
-4
VN
-2
TH-1
06
TH-1
4
BD
-10
BD
-2
PK-1
0
PK-1
IN-4
KA
IN-2
KA
IN-9
PU
IN-1
PU
IN-6
OR
IN-2
OR-
B
NZ
-104
2
NZ
-282
US-
350W
I
US-
80W
I
DE-
80N
DE-
30S
PE-1
5
PE-6
MA
-12
MA
-4
CM
-35
CM
-10
UG
-13
UG
-3
CN
-12
CN
-3
VN
-4
VN
-2
TH-1
06
TH-1
4
BD
-10
BD
-2
PK-1
0
PK-1
IN-4
KA
IN-2
KA
IN-9
PU
IN-1
PU
IN-6
OR
IN-2
OR-
B
QuotaLivestockMachineryBuildingsLand Other
Asset structure of the dairy enterprise
Return on investment
US$ / 100 kg milk (ECM)
Inflation rateROI - Return on investment (real)
0
50
100
150
200
250
300
350
400
-15 %
-10 %
-5 %
0 %
5 %
10 %
15 %
20 %
25 %
30 %
-18 %
40 %30 %
4.5 Asset structure and returns on investments
104 © IFCN 2008
4.6 Producer milk prices and non-milk returns
Milk prices – overview
Milk prices per 100 kg of ECM range from US$12 to US$36 and may be grouped into the following categories:
Less than US$20/100 kg: Observed in Pakistan and Uganda for farms far from urban centres and in areas with poor infrastructure. The lowest price was observed in Ugandan farms at US$12/100 kg of ECM
Between US$20 to 30/100 kg: The majority of the farms studied receive milk prices that fall into this category. Farmers in India, New Zealand and Viet Nam are at the lower end of the scale, whereas farmers in Bangladesh and Thailand obtain prices at the higher end. In Peru, one farm is located in a peri-urban area and the other in a rural area, which explains the very significant price differences within the country.
More than US$30/100 kg: Farmers in Cameroon, Germany, Morocco and the USA all obtain milk prices of around US$35/100 kg of ECM.
A dual milk price structure appears to exist at the global level, with most farms obtaining prices around the world market level. (The ‘world’ market price for milk can be calculated by taking the average world market price for butter and SMP, multiplying it by technical coefficients and subtracting processing costs. In 2006, this price stood at around US$26.5/100 kg.) The Moroccan and Cameroonian farms analysed receive prices above those of the world market, similar to those received by their German and US American counterparts. In Morocco, the key driver is the tariff protection, which is similar to that in the EU. Cameroon appears to represent as a special supply/demand situation with regard to fresh milk.
Milk prices – explanations/details
Bangladesh/Thailand: These countries are large net importers of milk, and have restricted imports of dairy products by means of tariffs (Bangladesh, 35 percent) and import quotas (Thailand).
Pakistan: Both farms are located in rural areas in the southern part of Punjab, which is a new dairy region far away from large consumer markets.
China (north): These farms are part of a cooperative. Milk prices are dictated by the investor who set up the farm infrastructure.
Africa: Milk prices in Cameroon and Morocco are the highest, while those in Uganda are the lowest.
Peru: The larger farm received higher prices because it is part of a government-sponsored school milk programme.
New Zealand: The prices received by farmers were a combination of advance payments for the 2004/2005 season and deferred payments from the previous one.
Non-milk returns
In addition to the income received from milk sales, dairy farms also obtain revenue by means of direct payments, sales of livestock, and sales of manure as fertilizer and household fuel for domestic use (South Asia). These non-milk returns range from US$1.6 to US$35/100 kg of ECM and contribute from 6 to 51 percent of total farm returns. High shares were observed in China (CN-3), Morocco (both farm types) and Uganda (UG-3), mainly as a result of high prices for beef and heifers (China and Morocco) and very low milk yields (Uganda).
Direct farm support
Among the farms studied, direct payments are found only in Germany and the USA, where the level of support is US$6.5 to 11.0 and US$0.7/100 kg of ECM, respectively. No direct support payments are received by farmers in Africa, Asia, Latin America and Oceania.
Germany: Farms in southern Germany were found to receive higher direct payments. These farms are located in less favourable areas and receive payments for extensive use of grassland or for farming in hilly areas.
USA: Dairy farmers cultivating feed grains or soybean receive various subsidies in the form of fixed and deficiency payments. For maize, these payments represented about 40 percent of the market price in 2005.
Support for investments in dairy farming
In many countries, the government and/or non-governmental institutions provide support to the dairy sector by means of investment aid or subsidized interest rates. Although many specific support programmes for dairy development have been set up in both the industrialized and developing countries, there also appears to be a large number of ‘not-so-evident’ programmes in most countries studied. Thus, direct payments constitute only a small part of measures in support of dairy farming.
Explanation of variablesFarm codes: Example DE-30S = German 30-cow farm in the south (details see Annex 5). Milk prices: Average milk prices adjusted to ECM, excluding value-added tax (VAT).Cattle returns: Returns from sales of cull cows, calves and surplus heifers +/- livestock inventory changes. Direct payments: All government payments including coupled and decoupled payments. VAT balance: Farms that do not balance the VAT with the tax department have either a positive or a negative balance depending on if the VAT on farm returns is more or less than that on farm costs respectively.

© IFCN 2008 105
Farm types
NZ
-104
2
NZ
-282
US-
350W
I
US-
80W
I
DE-
80N
DE-
30S
PE-1
5
PE-6
MA
-12
MA
-4
CM
-35
CM
-10
UG
-13
UG
-3
CN
-12
CN
-3
VN
-4
VN
-2
TH-1
06
TH-1
4
BD
-10
BD
-2
PK-1
0
PK-1
IN-4
KA
IN-2
KA
IN-9
PU
IN-1
PU
IN-6
OR
IN-2
OR-
B
NZ
-104
2
NZ
-282
US-
350W
I
US-
80W
I
DE-
80N
DE-
30S
PE-1
5
PE-6
MA
-12
MA
-4
CM
-35
CM
-10
UG
-13
UG
-3
CN
-12
CN
-3
VN
-4
VN
-2
TH-1
06
TH-1
4
BD
-10
BD
-2
PK-1
0
PK-1
IN-4
KA
IN-2
KA
IN-9
PU
IN-1
PU
IN-6
OR
IN-2
OR-
B
US$ / 100 kg milk (ECM)
Milk prices
Non-milk returns
US$ / 100 kg milk (ECM) Other returns (manure, surplus feed) Direct payments + VAT balanceCattle returns
0
5
10
15
20
25
30
35
40
0
5
10
15
20
2535
4.6 Producer milk prices and non-milk returns

106 © IFCN 2008
4.7 Costs of milk production only; milk prices
Costs of milk production only, 2005 – overview
The variable ‘cost of milk production only’ includes all costs incurred by the dairy enterprise. However, the non-milk returns (e.g. returns from the sale of calves, heifers and cull cows) have been deducted from these to allow for a ‘fair’ comparison of milk production costs across different milk production systems. Three categories of milk production costs, expressed in United States dollars per 100 kg of ECM, were identified with regard to the countries and farm types analysed:
Less than US$15/100 kg: The larger farm types in Cameroon, Pakistan and Uganda.
Between US$15 and 30/100 kg: Farms in Bangladesh, New Zealand and the USA, most farms in India, the smaller farm type in Pakistan, and the larger ones in China and Peru.
More than US$30/100 kg: Farms in Germany, Morocco and the small farm types in China and Peru.
Costs of milk production only, 2005 –
explanations/details
Cameroon: The costs incurred by the small farm type (with Holstein Friesian cows) are comparatively higher owing to expensive feed and low productivity. The large farm type, on the other hand, is a cow-calf operation where some of the cows are milked. A large part of the milk is retained on-farm for feeding calves.
Peru: Costs are relatively higher than those in the Asian countries owing to (relatively) higher wage levels.
India (Orissa): Farm IN-2OR-B shows the highest degree of complexity of all farm types analysed (very low milk yield, high share of non-cash transactions, wide range of outputs from the dairy enterprise). It was very difficult to estimate the opportunity costs of family labour for this farm, and they may have been overestimated due to the method used (the method has subsequently been modified to ensure more accurate analysis of labour inputs in subsistence farming).
In almost all countries (with the exception of Thailand and Uganda), the cost of milk production only was lower in the larger farm types compared to their smaller national counterpart, suggesting that further structural changes in the dairy sector will take place in all regions in future.
Most cost-competitive milk producers by region
Based on the price in United States dollars per 100 kg of milk, the lowest-cost producing dairy farming systems in the various regions were:
Africa (Cameroon, Morocco, Uganda) 3-cow herd in Uganda* US$10
Southeast Asia (China, Thailand, Viet Nam) 4-cow herd in Viet Nam US$13
South Asia (Bangladesh, India, Pakistan) 10-cow herd in Pakistan US$14
Oceania (New Zealand) 1 042-cow herd US$21
Latin America (Peru) 15-cow herd US$23
North America (USA) 350-cow herd US$26
Western Europe (Germany) 80-cow herd US$38
It should be noted that for the last four regions, the table is based on two typical farms from one country only.
Explanation of variablesFarm codes: Example DE-30S = German 30-cow farm in the south (details see Annex 5). Other costs - non-milk returns: Costs from the P&L account minus non-milk returns (cattle returns and direct payments, excluding VAT). Opportunity costs: Costs for using own production factors within the enterprise (own land and capital, family labour).Quota costs: Quota rents paid plus opportunity cost of quota owned (3 percent interest on quota value).Milk price: Average milk prices adjusted to ECM, excluding VAT. * Although imputed costs of milk production were lower on CM-35, milk is a by-product of cattle-raising for beef production, and thus this farm is not considered to be the most competitive.

© IFCN 2008 107
Farm types
US$ / 100 kg milk (ECM)
Costs of milk production only
In order to estimate the cost of milk production in a way that allows direct comparison with the milk price, the non-milk returns (cattle returns and direct payments) have been subtracted from the total costs of the dairy enterprise. The figure shows the details of the calculation.
Opportunitycosts
Returns = Milk price
Opportunity
costs
Costs fromP&L account- Non-milk
returns
Costs fromP&L account
Costs of milkproduction only
Costs of thedairy enterprise
Returns of the dairy enterprise
Returns& Costs
US$ /100 kg
milk(ECM)
Non-milkreturns
Entrepreneur's profit
Opportunitycosts
Quota costs*
Quota costs*
* Rent and opportunity costs for quota.
Method
Milk price Opportunity costs (excl. quota) Costs from P&L account - non-milk returns Quota costs (rent and opportunity costs)
0
5
10
15
20
25
30
35
40
45
50
NZ
-104
2
NZ
-282
US-
350W
I
US-
80W
I
DE-
80N
DE-
30S
PE-1
5
PE-6
MA
-12
MA
-4
CM
-35
CM
-10
UG
-13
UG
-3
CN
-12
CN
-3
VN
-4
VN
-2
TH-1
06
TH-1
4
BD
-10
BD
-2
PK-1
0
PK-1
IN-4
KA
IN-2
KA
IN-9
PU
IN-1
PU
IN-6
OR
IN-2
OR-
B
4.7 Costs of milk production only; milk prices

108 © IFCN 2008
4.8 Total milk production costs and returns to the dairy enterprise
Introduction
The previous section provided a simplified picture of the cost of milk production only, whereas this section considers the total costs of the dairy enterprise per 100 kg of milk and relates them to three different return items: milk returns; returns from sales of cull cows, calves and heifers; and other dairy enterprise returns, e.g. from sales of manure and direct payments. To provide an overview of farm dependence on the various return items, the graph on the next page shows the following: (i) milk price only; (ii) milk price plus returns from sales of cull cows, etc., plus other returns; and (iii) the previous two, plus direct payments received. This overview facilitates an understanding of how different farm types might be affected by variations in milk and non-milk returns.
Vulnerability to reductions in cattle and beef prices
Some farms would be badly affected by a sharp drop in cattle and beef prices:
Moroccan farms that receive US$21 to 35/100 kg ECM (Energy Corrected Milk) from cattle sales.
Cameroonian farms that obtain US$11 to 13/100 kg ECM from cattle sales.
Farms in China, Peru and Viet Nam that receive about US$11/100 kg ECM.
India IN-2OR-B, which receives US$11/100 kg ECM. However, this farm does not really depend on beef prices in the strict sense, as most of its non-milk returns are derived from sales of lactating buffaloes. It would appear, therefore, that this farm type is highly dependent on prices for live animals.
Vulnerability to reductions in direct payments
German dairy farm incomes would decrease by 40 to 50 percent if farmers did not receive direct payments. This is because instead of incomes of US$18 or US$12 per 100 kg of ECM, farmers would obtain only US$10 or US$6 per 100 kg of ECM.
Resilience to reductions in non-milk returns
Some farms would be affected only slightly by a sharp drop in non-milk returns, namely, the farms in New Zealand and in the Indian state of Karnataka, because beef and cattle prices are low and farmers do not receive any direct payments. Furthermore, profit margins are sufficiently high on the majority of the smaller family farm types analysed in this chapter to ensure that there would be no losses in the P&L account in the event of a large reduction in non-milk returns.
Comparison of milk production cost calculations
The calculations of production costs for 100 kg ECM given in this section and in Section 4.8 differ, especially for farms with high non-milk returns. The method employed in Section 4.7, referred to as ‘cost of milk production only’, shows whether the milk price received by the farmer covers the net cost (i.e. the full economic costs minus the non-milk returns) of producing it. The method used in this section provides information on the full economic costs of the dairy enterprise. As set out in the following table, the cost difference between German and USA dairy farms based on the latter method is US$18/100 kg ECM compared with US$12/100 kg ECM using the first method. The conclusion reached with both methods is the same: at a full economic cost of US$50/100 kg of milk, production on the farm in Germany costs US$18 more per 100 kg of milk than in the USA and, after allowing for non-milk returns (US$12 in Germany and US$8 in the USA), costs only US$8 more.
Cost of ‘milk Non-milk ‘Full cost’ production only’ returns of the dairy enterprise (US$ per 100 kg of milk)
Farm: DE-80N 38 12 50 Farm: US-80WI 30 8 38 Difference 8 4 12
Explanation of variablesFarm codes: Example: DE-30S = German 30-cow farm in the south (details see Annex 5). Cash costs: Purchased feed, fertilizer, seed, fuel, maintenance, land rents, interest on liabilities, wages paid, veterinary services plus medicine, water, insurance, accounting, etc. (excluding VAT).Depreciation: Annual decrease of the purchase price of buildings, machinery based on lifespan (excluding VAT).Opportunity costs: Costs for using own production factors (land owned, family labour input, equity including quota).Milk price: Average milk prices adjusted to ECM, excluding VAT. These would be the returns in the event all direct payments and all beef returns were nil. Milk price plus non-milk returns without direct payments: Milk price + cull cow, calves, heifer returns + changes in livestock inventory + other returns, such as sales of manure. These would be the returns in the event no direct payments were made. Milk price plus all non-milk returns, including direct payments: This represents the current return structure of the farms.
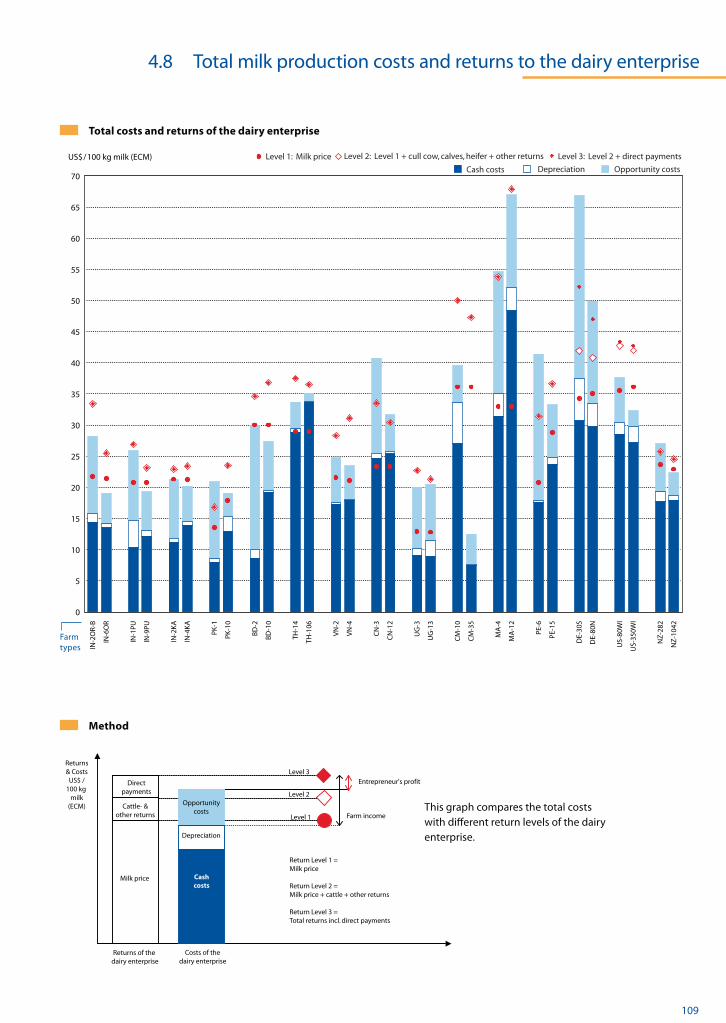
© IFCN 2008 109
0
5
10
15
20
25
30
35
40
45
50
55
60
65
70
Total costs and returns of the dairy enterprise
This graph compares the total costs with different return levels of the dairy enterprise.
Milk price
Opportunitycosts
Other costs
Costs of thedairy enterprise
Returns of the dairy enterprise
Returns& Costs
US$ /100 kg
milk(ECM)
Directpayments
Entrepreneur's profit
Farm incomeCattle- &
other returns
Depreciation
Cashcosts
Level 1
Level 2
Level 3
Return Level 1 = Milk price
Return Level 2 = Milk price + cattle + other returns
Return Level 3 = Total returns incl. direct payments
Method
US$ / 100 kg milk (ECM)Opportunity costsDepreciationCash costs
Level 1: Milk price Level 2: Level 1 + cull cow, calves, heifer + other returns Level 3: Level 2 + direct payments
Farm types N
Z-1
042
NZ
-282
US-
350W
I
US-
80W
I
DE-
80N
DE-
30S
PE-1
5
PE-6
MA
-12
MA
-4
CM
-35
CM
-10
UG
-13
UG
-3
CN
-12
CN
-3
VN
-4
VN
-2
TH-1
06
TH-1
4
BD
-10
BD
-2
PK-1
0
PK-1
IN-4
KA
IN-2
KA
IN-9
PU
IN-1
PU
IN-6
OR
IN-2
OR-
B
4.8 Total milk production costs and returns to the dairy enterprise
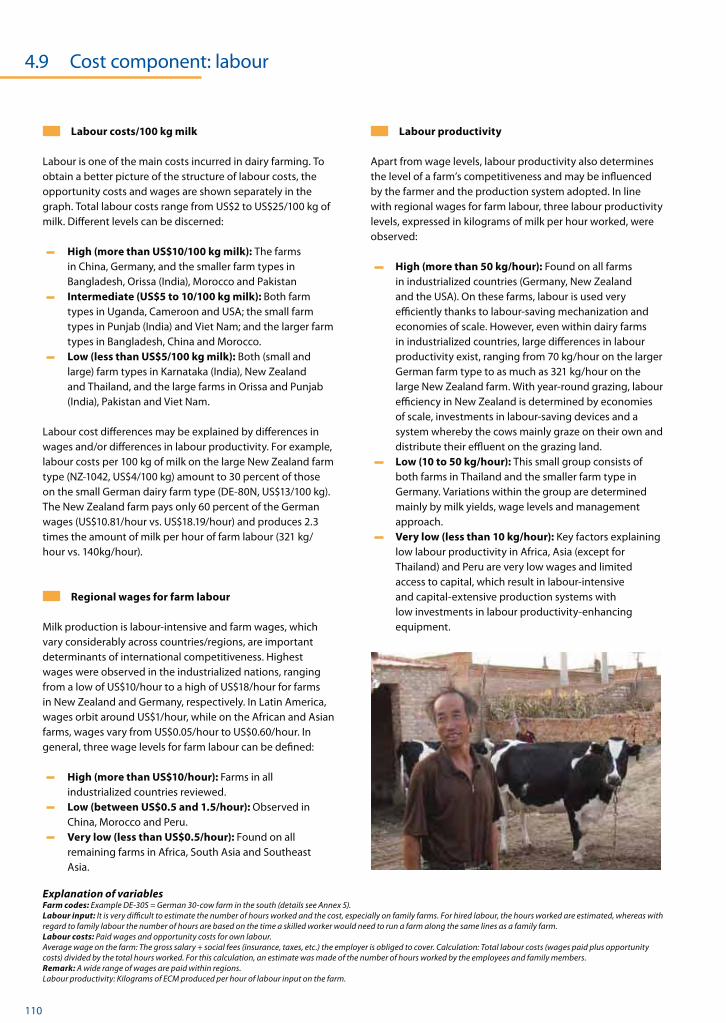
110 © IFCN 2008
4.9 Cost component: labour
Labour costs/100 kg milk
Labour is one of the main costs incurred in dairy farming. To obtain a better picture of the structure of labour costs, the opportunity costs and wages are shown separately in the graph. Total labour costs range from US$2 to US$25/100 kg of milk. Different levels can be discerned:
High (more than US$10/100 kg milk): The farms in China, Germany, and the smaller farm types in Bangladesh, Orissa (India), Morocco and Pakistan
Intermediate (US$5 to 10/100 kg milk): Both farm types in Uganda, Cameroon and USA; the small farm types in Punjab (India) and Viet Nam; and the larger farm types in Bangladesh, China and Morocco.
Low (less than US$5/100 kg milk): Both (small and large) farm types in Karnataka (India), New Zealand and Thailand, and the large farms in Orissa and Punjab (India), Pakistan and Viet Nam.
Labour cost differences may be explained by differences in wages and/or differences in labour productivity. For example, labour costs per 100 kg of milk on the large New Zealand farm type (NZ-1042, US$4/100 kg) amount to 30 percent of those on the small German dairy farm type (DE-80N, US$13/100 kg). The New Zealand farm pays only 60 percent of the German wages (US$10.81/hour vs. US$18.19/hour) and produces 2.3 times the amount of milk per hour of farm labour (321 kg/hour vs. 140kg/hour).
Regional wages for farm labour
Milk production is labour-intensive and farm wages, which vary considerably across countries/regions, are important determinants of international competitiveness. Highest wages were observed in the industrialized nations, ranging from a low of US$10/hour to a high of US$18/hour for farms in New Zealand and Germany, respectively. In Latin America, wages orbit around US$1/hour, while on the African and Asian farms, wages vary from US$0.05/hour to US$0.60/hour. In general, three wage levels for farm labour can be defined:
High (more than US$10/hour): Farms in all industrialized countries reviewed.
Low (between US$0.5 and 1.5/hour): Observed in China, Morocco and Peru.
Very low (less than US$0.5/hour): Found on all remaining farms in Africa, South Asia and Southeast Asia.
Labour productivity
Apart from wage levels, labour productivity also determines the level of a farm’s competitiveness and may be influenced by the farmer and the production system adopted. In line with regional wages for farm labour, three labour productivity levels, expressed in kilograms of milk per hour worked, were observed:
High (more than 50 kg/hour): Found on all farms in industrialized countries (Germany, New Zealand and the USA). On these farms, labour is used very efficiently thanks to labour-saving mechanization and economies of scale. However, even within dairy farms in industrialized countries, large differences in labour productivity exist, ranging from 70 kg/hour on the larger German farm type to as much as 321 kg/hour on the large New Zealand farm. With year-round grazing, labour efficiency in New Zealand is determined by economies of scale, investments in labour-saving devices and a system whereby the cows mainly graze on their own and distribute their effluent on the grazing land.
Low (10 to 50 kg/hour): This small group consists of both farms in Thailand and the smaller farm type in Germany. Variations within the group are determined mainly by milk yields, wage levels and management approach.
Very low (less than 10 kg/hour): Key factors explaining low labour productivity in Africa, Asia (except for Thailand) and Peru are very low wages and limited access to capital, which result in labour-intensive and capital-extensive production systems with low investments in labour productivity-enhancing equipment.
Explanation of variablesFarm codes: Example DE-30S = German 30-cow farm in the south (details see Annex 5). Labour input: It is very difficult to estimate the number of hours worked and the cost, especially on family farms. For hired labour, the hours worked are estimated, whereas with regard to family labour the number of hours are based on the time a skilled worker would need to run a farm along the same lines as a family farm. Labour costs: Paid wages and opportunity costs for own labour.Average wage on the farm: The gross salary + social fees (insurance, taxes, etc.) the employer is obliged to cover. Calculation: Total labour costs (wages paid plus opportunity costs) divided by the total hours worked. For this calculation, an estimate was made of the number of hours worked by the employees and family members. Remark: A wide range of wages are paid within regions. Labour productivity: Kilograms of ECM produced per hour of labour input on the farm.

© IFCN 2008 111
NZ
-104
2
NZ
-282
US-
350W
I
US-
80W
I
DE-
80N
DE-
30S
PE-1
5
PE-6
MA
-12
MA
-4
CM
-35
CM
-10
UG
-13
UG
-3
CN
-12
CN
-3
VN
-4
VN
-2
TH-1
06
TH-1
4
BD
-10
BD
-2
PK-1
0
PK-1
IN-4
KA
IN-2
KA
IN-9
PU
IN-1
PU
IN-6
OR
IN-2
OR-
B
Farm types
NZ
-104
2
NZ
-282
US-
350W
I
US-
80W
I
DE-
80N
DE-
30S
PE-1
5
PE-6
MA
-12
MA
-4
CM
-35
CM
-10
UG
-13
UG
-3
CN
-12
CN
-3
VN
-4
VN
-2
TH-1
06
TH-1
4
BD
-10
BD
-2
PK-1
0
PK-1
IN-4
KA
IN-2
KA
IN-9
PU
IN-1
PU
IN-6
OR
IN-2
OR-
B
NZ
-104
2
NZ
-282
US-
350W
I
US-
80W
I
DE-
80N
DE-
30S
PE-1
5
PE-6
MA
-12
MA
-4
CM
-35
CM
-10
UG
-13
UG
-3
CN
-12
CN
-3
VN
-4
VN
-2
TH-1
06
TH-1
4
BD
-10
BD
-2
PK-1
0
PK-1
IN-4
KA
IN-2
KA
IN-9
PU
IN-1
PU
IN-6
OR
IN-2
OR-
B
Labour costs
Average wages on the farm
Labour productivity
US$ / hour
US$ / 100 kg milk (ECM)
kg milk (ECM) / hour
Calc. costs for family labour Wages paid
0
5
10
15
20
25
30
0.0
0.2
0.4
0.6
0.8
1.0
1.217.5 18.2 10.6 10.811.1 11.7
0
5
10
15
2070 140 253 321125 206
4.9 Cost component: labour
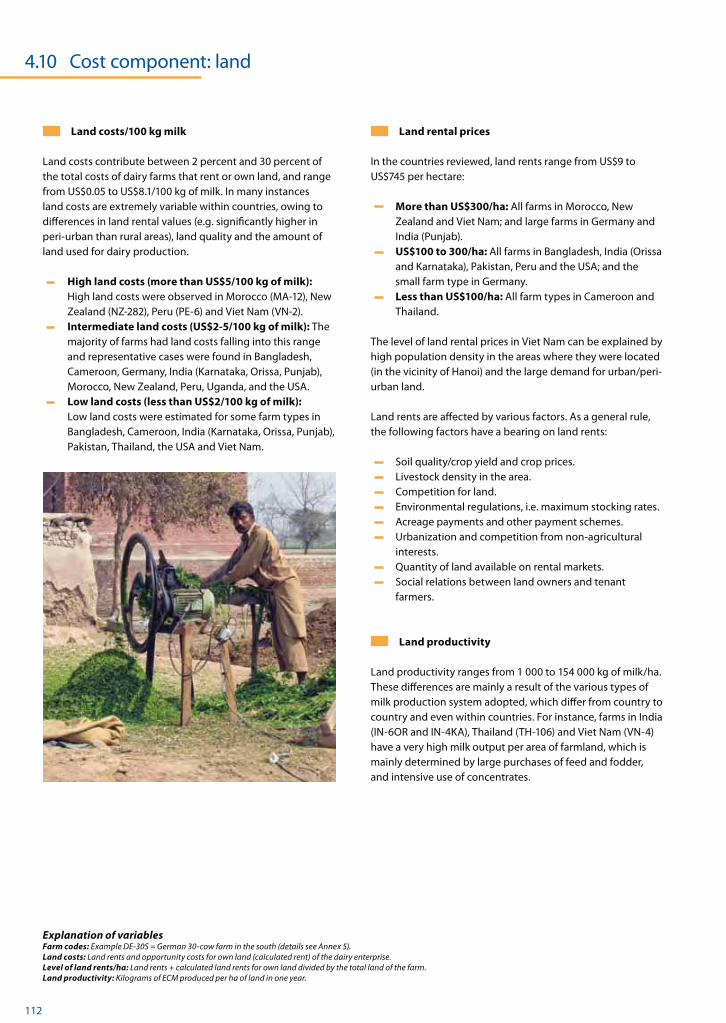
112 © IFCN 2008
4.10 Cost component: land
Land costs/100 kg milk
Land costs contribute between 2 percent and 30 percent of the total costs of dairy farms that rent or own land, and range from US$0.05 to US$8.1/100 kg of milk. In many instances land costs are extremely variable within countries, owing to differences in land rental values (e.g. significantly higher in peri-urban than rural areas), land quality and the amount of land used for dairy production.
High land costs (more than US$5/100 kg of milk): High land costs were observed in Morocco (MA-12), New Zealand (NZ-282), Peru (PE-6) and Viet Nam (VN-2).
Intermediate land costs (US$2-5/100 kg of milk): The majority of farms had land costs falling into this range and representative cases were found in Bangladesh, Cameroon, Germany, India (Karnataka, Orissa, Punjab), Morocco, New Zealand, Peru, Uganda, and the USA.
Low land costs (less than US$2/100 kg of milk): Low land costs were estimated for some farm types in Bangladesh, Cameroon, India (Karnataka, Orissa, Punjab), Pakistan, Thailand, the USA and Viet Nam.
Land rental prices
In the countries reviewed, land rents range from US$9 to US$745 per hectare:
More than US$300/ha: All farms in Morocco, New Zealand and Viet Nam; and large farms in Germany and India (Punjab).
US$100 to 300/ha: All farms in Bangladesh, India (Orissa and Karnataka), Pakistan, Peru and the USA; and the small farm type in Germany.
Less than US$100/ha: All farm types in Cameroon and Thailand.
The level of land rental prices in Viet Nam can be explained by high population density in the areas where they were located (in the vicinity of Hanoi) and the large demand for urban/peri-urban land.
Land rents are affected by various factors. As a general rule, the following factors have a bearing on land rents:
Soil quality/crop yield and crop prices. Livestock density in the area. Competition for land. Environmental regulations, i.e. maximum stocking rates. Acreage payments and other payment schemes. Urbanization and competition from non-agricultural
interests. Quantity of land available on rental markets. Social relations between land owners and tenant
farmers.
Land productivity
Land productivity ranges from 1 000 to 154 000 kg of milk/ha. These differences are mainly a result of the various types of milk production system adopted, which differ from country to country and even within countries. For instance, farms in India (IN-6OR and IN-4KA), Thailand (TH-106) and Viet Nam (VN-4) have a very high milk output per area of farmland, which is mainly determined by large purchases of feed and fodder, and intensive use of concentrates.
Explanation of variablesFarm codes: Example DE-30S = German 30-cow farm in the south (details see Annex 5). Land costs: Land rents and opportunity costs for own land (calculated rent) of the dairy enterprise.Level of land rents/ha: Land rents + calculated land rents for own land divided by the total land of the farm.Land productivity: Kilograms of ECM produced per ha of land in one year.

© IFCN 2008 113
NZ
-104
2
NZ
-282
US-
350W
I
US-
80W
I
DE-
80N
DE-
30S
PE-1
5
PE-6
MA
-12
MA
-4
CM
-35
CM
-10
UG
-13
UG
-3
CN
-12
CN
-3
VN
-4
VN
-2
TH-1
06
TH-1
4
BD
-10
BD
-2
PK-1
0
PK-1
IN-4
KA
IN-2
KA
IN-9
PU
IN-1
PU
IN-6
OR
IN-2
OR-
B
Farm types
NZ
-104
2
NZ
-282
US-
350W
I
US-
80W
I
DE-
80N
DE-
30S
PE-1
5
PE-6
MA
-12
MA
-4
CM
-35
CM
-10
UG
-13
UG
-3
CN
-12
CN
-3
VN
-4
VN
-2
TH-1
06
TH-1
4
BD
-10
BD
-2
PK-1
0
PK-1
IN-4
KA
IN-2
KA
IN-9
PU
IN-1
PU
IN-6
OR
IN-2
OR-
B
NZ
-104
2
NZ
-282
US-
350W
I
US-
80W
I
DE-
80N
DE-
30S
PE-1
5
PE-6
MA
-12
MA
-4
CM
-35
CM
-10
UG
-13
UG
-3
CN
-12
CN
-3
VN
-4
VN
-2
TH-1
06
TH-1
4
BD
-10
BD
-2
PK-1
0
PK-1
IN-4
KA
IN-2
KA
IN-9
PU
IN-1
PU
IN-6
OR
IN-2
OR-
B
Land costs
Land productivity
Level of land rents
US$ / ha
US$ / 100 kg milk (ECM)
1,000 kg milk (ECM) / ha
Land rents calculated for land ownedLand rents paid
0
1
2
3
4
5
66.7 8.1
0
100
200
300
400
500
600
700
800
0
5
10
15
20
25
30
35
40119 154
4.10 Cost component: land

114 © IFCN 2008
4.11 Cost component: capital (excluding land and quota)
Capital costs/100 kg milk
It is often difficult to estimate capital costs incurred in dairy farming because any cost comparison is challenged by differences in depreciation schemes, land valuation, levels of inflation, capital structure and interest rates. A method that yields sufficiently accurate results for most cases is to calculate interest on liabilities at 6 percent and for own capital at 3 percent. For some countries, among them China, this method slightly overestimates capital costs; for others, including India and Pakistan, the method produces slight underestimates.
Capital costs contribute approximately 3 to 29 percent of the total costs of the dairy farms studied, and thereby explain more or less as much as land costs on total cost differences. Capital costs range from US$0.8 to US$5.7/100 kg of milk, but for most farms they are in the order of US$1 to 2/100 kg of milk.
High capital costs (more than US$3/100 kg) were observed for all Moroccan, New Zealand and Ugandan dairy farm types and for the small farm types in Cameroon, Germany and India.
Low capital costs (less than US$1/100 kg of milk) were observed for the larger farm types in China and in Pakistan.
The considerable capital costs in New Zealand can be explained by high land prices and cost of shares in the cooperatives.
The smaller dairy farm in Germany (DE-30S) has high capital costs due to large investments in buildings and machinery (two and four times, respectively, that of DE-80N for each 100 kg of ECM produced). The main determinant of the high capital costs in Uganda and Morocco is low capital productivity.
Capital input/cow
Capital costs per 100 kg of milk are a cost component of dairy production but do not provide information on the capital intensity of a dairy farm because, to a large extent, they are determined by the level of farm liabilities. The indicator ‘capital input/cow’, which only takes account of the capital embedded in the dairy herd, buildings and machinery and cooperative shares, gives a better sense of the ‘capital-intensity’ of a dairy farm. The different levels observed on the farms under study were as follows:
High (more than US$2 500/cow): All farms in Germany, Morocco, New Zealand and the USA.
Intermediate (US$1 000 to 2 500/cow): All farm types in Thailand and Viet Nam; the large farm type in Peru and the small one in Cameroon.
Low (less than US$1 000 US$/cow): All farm types in Bangladesh, China, India, Pakistan and Uganda; the large farm type in Cameroon and the small one in Peru.
Explanation of variablesFarm codes: Example DE-30S = German 30-cow farm in the south (details see Annex 5). Capital costs: Interest on liabilities (6 percent) and opportunity costs for own capital (3 percent). This is an estimate of the real interest rate for the international capital market. To justify using the real interest rate (instead of the nominal one), see Isermeyer, 1988. Liabilities: Figures from the dairy enterprise’s balance sheet. In New Zealand, liabilities exceed the sum of non-land and non-quota assets. In this case, the surplus is not deducted because it is already covered by the other calculations. Example: land costs are calculated on the basis of the rental price and not as interest on the land value. Capital input per cow: Total capital input, except land and quota/number of cows. Values for buildings, machinery, livestock and other operating capital (estimated as 10 percent of variable costs of a crop and dairy enterprise). Land is not included, as land cost is calculated on the basis of the rental price. Quota values are not included here. Capital productivity: Kilograms of ECM produced divided by capital input (except land and quota).

© IFCN 2008 115
NZ
-104
2
NZ
-282
US-
350W
I
US-
80W
I
DE-
80N
DE-
30S
PE-1
5
PE-6
MA
-12
MA
-4
CM
-35
CM
-10
UG
-13
UG
-3
CN
-12
CN
-3
VN
-4
VN
-2
TH-1
06
TH-1
4
BD
-10
BD
-2
PK-1
0
PK-1
IN-4
KA
IN-2
KA
IN-9
PU
IN-1
PU
IN-6
OR
IN-2
OR-
B
Farm types
NZ
-104
2
NZ
-282
US-
350W
I
US-
80W
I
DE-
80N
DE-
30S
PE-1
5
PE-6
MA
-12
MA
-4
CM
-35
CM
-10
UG
-13
UG
-3
CN
-12
CN
-3
VN
-4
VN
-2
TH-1
06
TH-1
4
BD
-10
BD
-2
PK-1
0
PK-1
IN-4
KA
IN-2
KA
IN-9
PU
IN-1
PU
IN-6
OR
IN-2
OR-
B
NZ
-104
2
NZ
-282
US-
350W
I
US-
80W
I
DE-
80N
DE-
30S
PE-1
5
PE-6
MA
-12
MA
-4
CM
-35
CM
-10
UG
-13
UG
-3
CN
-12
CN
-3
VN
-4
VN
-2
TH-1
06
TH-1
4
BD
-10
BD
-2
PK-1
0
PK-1
IN-4
KA
IN-2
KA
IN-9
PU
IN-1
PU
IN-6
OR
IN-2
OR-
B
Capital productivity per asset (land and quota value not included)
Capital costs
Capital input per cow (land and quota value not included)
US$ / 100 kg milk (ECM)
1,000 US$ / cow
kg milk (ECM) / 1,000 US$
0
1
2
3
4
5
6
0
1
2
3
4
5
6
0
1,000
2,000
3,000
4,000
5,000
6,000
4.11 Cost component: capital (excluding land and quota)

Uganda
Cameroon

Germany

China

Chapter 5Special Studies
Pictures on this and previous double page: Breeds (Pictures by: Ndambi Asaah, Katja Seifert and Torsten Hemme)
5.1 Summary 120
5.2 Impact analysis of dairy development programmes in Andhra Pradesh, India 122
5.3 Impact analysis of dairy development programmes in Uganda 124
5.4 Farm development strategies for dairy farms in Haryana (India) 126
5.5 Policy impact analysis for dairy farms in Thailand and Viet Nam 128
5.6 Comparison of dairy chains in Karnal, India 130
5.7 Cost of ‘quality milk’ in Karnataka, India: a case study 132
5.8 The competitiveness of skim milk powder from Uganda 134
5.9 The dairy feed chain in Peru: a case study 136
5.10 A comparison of dairy farming systems in India 138
5.11 A comparison of rural & peri-urban milk production systems in South Asia 140
5.12 Comparison of small- and large-scale dairy farming systems in India & US 142
5.13 Comparing household, whole farm and dairy enterprise levels in India 144
5.14 Methodological approach for guiding dairy development activities 146
5.15 Comparison of IFCN and Extrapolate approaches to impact analysis 148
5.16 Assessing the risks faced by dairy farms 150
5.17 Incorporating risk in dairy development strategy formulation 152
5.18 Carbon footprints of dairy farming systems 154
120 © IFCN 2008
5.1 Summary
Introduction
This chapter consists of a number of in-depth studies on different aspects of small-scale dairy production. The studies fall roughly into four thematic groups: (i) studies comparing selected aspects of dairy farming systems; (ii) ex ante assessments of the impacts of selected dairy development strategies and policies; (iii) reviews of milk marketing and value chains; and (iv) methodological developments.
Group 1: Farming system comparisons
Dairy production systems vary enormously throughout the world in terms of farm size, agro-climatic zones and socio-economic and political settings. Given current trends of globalization and trade liberalization, only the most competitive farms will remain viable in future milk markets.
Studies in this section compare the strengths and weaknesses of rural vs. peri-urban systems, small vs. large-scale systems, and production systems in different regions of a given country. One study examines how the household, whole farm and farmer’s dairy enterprise can be separated from each other in order to obtain a better understanding of the economics of small-scale dairy farms.
The results show that small-scale systems incur the lowest milk production costs, especially in rural areas where the costs are even lower. Despite the low cost of milk production on small-scale farms, mainly because of their low input costs, both milk yields and the efficiency with which farm inputs are used are very limited.
Group 2: Impact assessments
A large number of potential interventions, farm development strategies and dairy support policies have been promoted and / or implemented in different parts of the world, with the aim of increasing national milk supplies, improving farm incomes and safeguarding food security. Given the complexity of dairy farming and the array of objectives of dairy development programmes there is an urgent need for a comprehensive, evidence-based, ex ante assessment of the likely impact of private or public interventions in the dairy sector.
Three of the impact assessments undertaken use the TIPI-CAL (Technology Impact Policy Impact Calculations) model to rank dairy development programmes, policies and management alternatives in India and Uganda. Another study uses a combination of the TIPI-CAL and PAM (Policy Analysis Matrix) models to analyse the impact of trade policies on the economics of typical farms in Thailand and Viet Nam.
The studies clearly indicate that policies and programmes that improve dairy farm management and the genetic potential of the dairy herd are likely to lead to higher farm outputs and thereby give farmers access to better marketing outlets. The latter in turn enables them to increase their dairy earnings and provides the means to invest in further dairy enterprise improvements.

© IFCN 2008 121
Group 3: Milk marketing and the value chain
Studies in this section analyse the economics of alternative marketing channels for a major farm input (feed) and major outputs (milk and cream), and show how milk quality determines the market for dairy products. One study describes a local community approach to addressing the problem of poor-quality milk produced by small-scale farmers.
The analysis of a pilot scheme in India to improve milk quality shows that it is possible to do so through adopting a community approach at very low additional costs. Improving milk quality helps capture new markets and increases household income, which is also affected by the dairy chain for both farm inputs and outputs. An inefficient input system will result in limited input use; sub-optimal milk yields; and limited income generation from dairying. Finally, if farmers are given the chance to select their milk marketing channels, they can increase their earnings from dairying and are likely to strive to improve on the quality of their milk through private and/or communal initiatives provided they help them to access ‘external‘, higher-value markets. However, if the costs involved are too high, farmers will instead focus on local markets on which their products are still acceptable.
Group 4: New methods in dairy analysis
Dairying is a complex activity, the analysis of which calls for well-adapted methodologies. Small-scale dairying is particularly complex owing to its interaction with household activities and, worse still, because smallholder dairy farmers rarely keep records of their activities.
Studies in this section expand on the different methods developed by the IFCN for analysing and ranking programme and policy impacts, defining a sequential ‘dairy development ladder’, integrating risk assessment into farm economics and policy analysis, and evaluating the carbon footprint of dairy farms (a parameter that has given rise to concern in recent years).
The methods that have been applied represent pragmatic approaches to analysing the complexity of dairy farms, which can produce robust results without relying on data from large surveys which are usually very expensive. Thus, they are also suitable for small-scale dairy farms that do not keep records. However, these studies show that there is still a great need for the further development of the currently available analytical tools to better understand the complexity of small-scale farming systems.
5.1 Summary

122 © IFCN 2008
5.2 Impact analysis of dairy development programmes in Andhra Pradesh, IN
Introduction
Dairy development policies and programmes promoted in different dairy regions can have a significant impact on dairy sector development. However, policy-makers, development practitioners and farmers often find it difficult to select the policy or programme(s) that best satisfy their interests and economic and social needs. The situation is usually even more complicated for small-scale farmers owing to their limited access to resources. The aim of the present study was to rank potential dairy development programmes in Andhra Pradesh, India, with a view to facilitating decision-making on the part of both farmers and policy-makers.
Methodology
This study relies heavily on IFCN methodology. First, two main indicators of programme outcome were chosen: (i) household per capita income (as indicator for family livelihood), and (ii) cost of milk production (as indicator for dairy competitiveness and thus enterprise sustainability). Second, the most frequent farm type (MN-3, a three-buffalo farm) was selected for an ex ante assessment of the likely impact of major dairy development programmes and other potential interventions for dairy development in the district of Mahboobnagar (Andhra Pradesh) in India. Third, data on and estimates of the consequences for the selected farming system to participate in each of the 45 proposed dairy development programmes was elicited from a panel of dairy experts. And, fourth, the results were validated and ranked by the expert panel.
Impact on family income (livelihood indicator)
Current situation: The MN-3 household currently earns a total income of US$0.8 per capita/day. Dairy activities contribute US$0.13, or 16 percent, to total household income. With this income from dairying, the household cannot meet its daily living needs without off-farm income.
Impact: The dairy development programmes assessed have the potential to increase household per capita income by as much as 27 percent above the current level.
Ranking of programmes: Three programmes are expected to result in a significant improvement in income, when: (a) the farm produces fodder for sale (assuming a fodder market and more off-farm work); (b) the three local buffaloes are replaced with two well-managed grade buffaloes; and (c) the herd size is increased to five grade buffaloes.
Impact on production costs
(dairy competitiveness indicator)
Current situation: The full economic costs of milk production are US$24 per 100 kg of ECM, while the milk price received stands at only US$16.5.
Impact: Except for four of them, all programmes decrease the cost of producing milk by as much as 33 percent below the current level.
Ranking of programmes: The most promising programmes are those in which (a) the farmer has access to more fodder from public land; (b) he attends a drought-relief cattle camp; and (c) he increases his herd to five well-managed grade buffaloes. On the other hand, the estimated cost of milk production increases when the farmer purchases (costly) livestock life insurance; when it takes him a long time to access veterinary services; and when he/she is member of a cooperative (which means he/she obtains a lower price for his/her milk).
Conclusions
Two main conclusions can be drawn from these simulation results:
Given its assets, resources and the dairy development programmes assessed, an MN-3 type household would not be able to reach an income of US$1 per capita per day. This is because of the low share of dairy income (only 16 percent) in the total household income.
However, some of the assessed dairy development programmes could lift this predominant farm type to the competitiveness of a five grade-buffalo farm, a degree of dairy competitiveness that is as strong as the best farms in India, and even worldwide.
In general, while the assessed programmes may render the family dairy enterprise highly competitive, total household income would not increase significantly. One alternative would be for some farms to increase their dairy productivity and expand in size, while others would remain the same or eventually exit from the dairy sector and rely on off-farm income. Interestingly, the option of fodder sales shows a potential alternative for farming households that may wish to quit dairy farming (and thus earn more off-farm income) but specialize in supplying fodder to other households in a position to increase their dairy herd. A prerequisite for this scenario would be organized local fodder markets.
The ranking shows widely different impacts for different programmes. Fodder sales (and an organized fodder market) may create a highly lucrative alternative that would encourage both farm specialization and intensification in the dairy sector.This study was conducted by O. Garcia, A. Saha, K. Mahmood and T. Hemme of
IFCN Dairy Research Center and published as ‘Benchmarking 45 dairy development activities in Andhra Pradesh, India’ in the IFCN Dairy Report 2006.
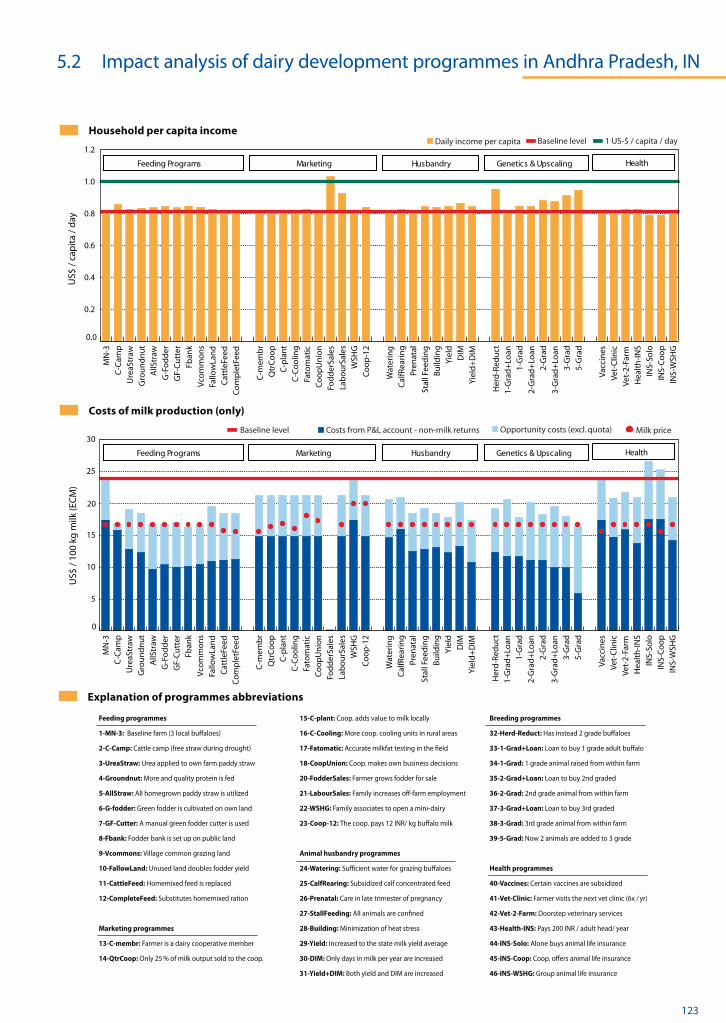
© IFCN 2008 123
0.0
0.2
0.4
0.6
0.8
1.0
1.2 Baseline level Daily income per capita 1 US-$ / capita / day
Feeding Programs Marketing Husbandry Genetics & Upscaling Health
INS-
WSH
GIN
S-C
oo
pIN
S-So
loH
ealt
h-I
NS
Vet-
2-Fa
rmVe
t-C
linic
Vacc
ines
5-G
rad
3-G
rad
3-G
rad
+Lo
an2-
Gra
d2-
Gra
d+
Loan
1-G
rad
1-G
rad
+Lo
anH
erd
-Red
uct
Yiel
d+
DIM
DIM
Yiel
dB
uild
ing
Stal
l Fee
din
gPr
enat
alC
alfR
eari
ng
Wat
erin
g
Co
op
-12
WSH
GLa
bo
urS
ales
Fod
der
Sale
sC
oo
pU
nio
nFa
tom
atic
C-C
oo
ling
C-p
lan
tQ
trC
oo
pC
-mem
br
Co
mp
letF
eed
Cat
tleF
eed
Fallo
wLa
nd
Vco
mm
on
sFb
ank
GF-
Cu
tter
G-F
od
der
AllS
traw
Gro
un
dn
ut
Ure
aStr
awC
-Cam
pM
N-3
US$
/ 10
0 kg
milk
(ECM
)
Household per capita income
US$
/ ca
pita
/ da
y
Costs of milk production (only)
0
5
10
15
20
25
30 Milk price Opportunity costs (excl. quota) Costs from P&L account - non-milk returns Baseline level
Feeding Programs Marketing Husbandry Genetics & Upscaling Health
INS-
WSH
GIN
S-C
oo
pIN
S-So
loH
ealt
h-I
NS
Vet-
2-Fa
rmVe
t-C
linic
Vacc
ines
5-G
rad
3-G
rad
3-G
rad
+Lo
an2-
Gra
d2-
Gra
d+
Loan
1-G
rad
1-G
rad
+Lo
anH
erd
-Red
uct
Yiel
d+
DIM
DIM
Yiel
dB
uild
ing
Stal
l Fee
din
gPr
enat
alC
alfR
eari
ng
Wat
erin
g
Co
op
-12
WSH
GLa
bo
urS
ales
Fod
der
Sale
sC
oo
pU
nio
nFa
tom
atic
C-C
oo
ling
C-p
lan
tQ
trC
oo
pC
-mem
br
Co
mp
letF
eed
Cat
tleF
eed
Fallo
wLa
nd
Vco
mm
on
sFb
ank
GF-
Cu
tter
G-F
od
der
AllS
traw
Gro
un
dn
ut
Ure
aStr
awC
-Cam
pM
N-3
Feeding programmes
1-MN-3: Baseline farm (3 local buffaloes)
2-C-Camp: Cattle camp (free straw during drought)
3-UreaStraw: Urea applied to own farm paddy straw
4-Groundnut: More and quality protein is fed
5-AllStraw: All homegrown paddy straw is utilized
6-G-fodder: Green fodder is cultivated on own land
7-GF-Cutter: A manual green fodder cutter is used
8-Fbank: Fodder bank is set up on public land
9-Vcommons: Village common grazing land
10-FallowLand: Unused land doubles fodder yield
11-CattleFeed: Homemixed feed is replaced
12-CompleteFeed: Substitutes homemixed ration
Marketing programmes
13-C-membr: Farmer is a dairy cooperative member
14-QtrCoop: Only 25 % of milk output sold to the coop.
15-C-plant: Coop. adds value to milk locally
16-C-Cooling: More coop. cooling units in rural areas
17-Fatomatic: Accurate milkfat testing in the field
18-CoopUnion: Coop. makes own business decisions
20-FodderSales: Farmer grows fodder for sale
21-LabourSales: Family increases off-farm employment
22-WSHG: Family associates to open a mini-dairy
23-Coop-12: The coop. pays 12 INR/ kg buffalo milk
Animal husbandry programmes
24-Watering: Sufficient water for grazing buffaloes
25-CalfRearing: Subsidized calf concentrated feed
26-Prenatal: Care in late trimester of pregnancy
27-StallFeeding: All animals are confined
28-Building: Minimization of heat stress
29-Yield: Increased to the state milk yield average
30-DIM: Only days in milk per year are increased
31-Yield+DIM: Both yield and DIM are increased
Breeding programmes
32-Herd-Reduct: Has instead 2 grade buffaloes
33-1-Grad+Loan: Loan to buy 1 grade adult buffalo
34-1-Grad: 1 grade animal raised from within farm
35-2-Grad+Loan: Loan to buy 2nd graded
36-2-Grad: 2nd grade animal from within farm
37-3-Grad+Loan: Loan to buy 3rd graded
38-3-Grad: 3rd grade animal from within farm
39-5-Grad: Now 2 animals are added to 3 grade
Health programmes
40-Vaccines: Certain vaccines are subsidized
41-Vet-Clinic: Farmer visits the next vet clinic (6x / yr)
42-Vet-2-Farm: Doorstep veterinary services
43-Health-INS: Pays 200 INR / adult head/ year
44-INS-Solo: Alone buys animal life insurance
45-INS-Coop: Coop. offers animal life insurance
46-INS-WSHG: Group animal life insurance
Explanation of programmes abbreviations
5.2 Impact analysis of dairy development programmes in Andhra Pradesh, IN

124 © IFCN 2008
5.3 Impact analysis of dairy development programmes in Uganda
Impact on cost of milk production
The policies have little impact on the present cost of milk production with local cows. Exceptionally, when the farmer spends more hours fetching water, opportunity costs increase by up to 20 percent owing to increased family labour for which there are very limited opportunities for alternative economic uses. With cross-bred dairy animals, the total cost is 40 percent higher than with local cows, and cash costs stand at US$6 per 100 kg of ECM instead of practically nil.
Impact on return to labour
The policies analysed could lead to an increase or decrease return to dairy labour of between +40 percent and -20 percent on the farm with local cows. None of the analysed policies brings the return to labour from working on the dairy farm to what the farmer would earn from working off-farm. This means that, whenever there is an off-farm job alternative, producing milk for sales under the same conditions will not be attractive. With cross-bred cows, however, dairy farming becomes a highly attractive alternative for the use of family labour since the return to labour would now be expected to be 40 percent above local wages.
Conclusions
The policies analysed seem to only have a minor impact on the household income and dairy competitiveness of farms with local breeds. However, the impact is more evident when policies are combined with genetic improvements that boost milk yields because this change requires more inputs. An adequate dairy development plan will therefore require improvements in the genetics of the dairy cows, which will in turn strengthen the impact of other policies on small-scale dairying.
Introduction
Policy-makers and private investors wishing to increase the efficiency of the dairy sector call for ex ante assessments of the impact of intended interventions. The aim of the present study was to analyse the potential outcome of various development strategies on the most widespread typical dairy farming system in Uganda and contribute to building up a knowledge bank to help policy-makers to prioritize development strategies for the Ugandan dairy sector. Compared with the previous study, the present one goes a step further by first assessing the impact of the same policies and strategies on the typical farm with local cows and then on a farm with genetically improved dairy cows.
Methodology
A policy impact analysis was made for the most predominant dairy farming system: extensive smallholder dairy farming with a herd of three local cows. The calculations were based on the simulation model, TIPI-CAL (Technology Impact and Policy Impact Calculation Model), version 4.0, which was further developed for application to small-scale dairy farms. Scenarios and input parameters for the model were developed in consultation with a panel of local dairy experts, followed by validation on typical farms through farm visits and interviews with producers.
The first 13 scenarios apply to policies on the farm as it is now (with local cows), while the last 11 assess the impact of the same policies but assume that the farmer has three pure exotic or cross-bred cows rather than local cows.
Impact on household income
Upgrading from local to cross-bred animals had a marked effect on household income, leading to an increase by 63 percent. Depending on changes in the milk price, the policies analysed either increased or decreased the daily per capita household income. Low impacts were generally observed because the farm had little access to input and output markets. However, if both genetics and management were to be improved, the policy impact would be as much as threefold.
Programme and scenario descriptionsKY-3 (baseline): The household head is an agricultural labourer who owns about 2 ha of land and has access to another 20 ha for grazing. Milk is sold to a local trader from the farm once daily. Graded: Farmer uses exotic cows that are stall-fed with elephant grass and concentrates. Sch-milk: Farmers join together to provide milk for the local school milk programme. >Demand: Demand for milk increases; farmgate milk price increases. >Q+price: Quality control against adulteration of milk results in higher farm milk prices. >Q-price: Quality control against milk adulteration results in lower farm milk prices because the traders (who are no longer able to adulterate the milk) wish to maintain their profit margins. Cooler-coop: Farmer delivers to his cooperative and obtains additional yearly benefits from dividends. Cooler-private: Farmer delivers to a private collection centre at 12.5 percent higher price. Private-vet: Several entities support private veterinary services in the area. >Vet-med: This type of farmer rarely has access to veterinary services. Vet-med disc: A 30 percent discount is offered for purchases of all veterinary products. >Credit: More access is provided to credit facilities at national interest rates. FeedP-30%: Major feed suppliers have agreed to 30 percent discount on bulk purchases of feed. >Water: Additional water is supplied to the cows in the evenings.
This study was conducted by A. Ndambi, O. Garcia and T. Hemme of the IFCN Dairy Research Center and by D. Balikowa of the Ugandan Dairy Development Authority in Kampala. It was published as ‘IFCN policy impact analysis for dairy farms in Uganda’ in the IFCN Dairy Report 2007.

© IFCN 2008 125
0
5
10
15
20
25 Opportunity costs Costs from P&L account - non-milk returns Milk price
Internationally Competitive Milk Price
Local cow Grade cow
>W
ater
Feed
P-30
%
>C
red
it
Vet-
Med
Dis
c
Co
ole
r-Pr
ivat
Co
ole
r-C
oo
p
>Q
-Pri
ce
>Q
+Pr
ice
>D
eman
d
Sch
-Milk
Gra
ded
>W
ater
Feed
P-30
%
>C
red
it
Vet-
Med
Dis
c
>Ve
t-M
ed
Priv
at-v
et
Co
ole
r-Pr
ivat
Co
ole
r Co
op
>Q
-Pri
ce
>Q
+Pr
ice
>D
eman
d
Sch
-Milk
KY
-3
0.00
0.05
0.10
0.15
0.20
0.25 Wage paid to hired labour Return to dairy labour Local wage level
>W
ater
Feed
P-30
%
>C
red
it
Vet-
Med
Dis
c
Co
ole
r-Pr
ivat
Co
ole
r-C
oo
p
>Q
-Pri
ce
>Q
+Pr
ice
>D
eman
d
Sch
-Milk
Gra
ded
>W
ater
Feed
P-30
%
>C
red
it
Vet-
Med
Dis
c
>Ve
t-M
ed
Priv
at-v
et
Co
ole
r-Pr
ivat
Co
ole
r Co
op
>Q
-Pri
ce
>Q
+Pr
ice
>D
eman
d
Sch
-Milk
KY
-3
Local cow Grade cow
0.0
0.1
0.2
0.3
0.4
0.5
0.6
0.7
0.8
0.9
1.0 Baseline level Household income
Market Scenarios
Market Scenarios
Input Scenarios
Input Scenarios
Local cow Grade cow
>W
ater
Feed
P-30
%
>C
red
it
Vet-
Med
Dis
c
Co
ole
r-Pr
ivat
Co
ole
r-C
oo
p
>Q
-Pri
ce
>Q
+Pr
ice
>D
eman
d
Sch
-Milk
Gra
ded
>W
ater
Feed
P-30
%
>C
red
it
Vet-
Med
Dis
c
>Ve
t-M
ed
Priv
at-v
et
Co
ole
r-Pr
ivat
Co
ole
r Co
op
>Q
-Pri
ce
>Q
+Pr
ice
>D
eman
d
Sch
-Milk
KY
-3
Household income
Cost of milk production
Return to labour
US$
/ cap
ita /
day
US$
/ ho
urU
S$ /
100
kg E
CM5.3 Impact analysis of dairy development programmes in Uganda

126 © IFCN 2008
5.4 Farm development strategies for dairy farms in Haryana (IN)
Introduction
Previous studies in this section have assessed the impact of ‘genetic upgrading’ with a view to increasing the household income of family dairy farms. However, owing to social and economic restrictions, it is often difficult for smallholder farmers to ‘upgrade’ their dairy herd. Another way of increasing farm household income is to improve farm management. The aim of the present study was to analyse the impact of alternative management scenarios on small-scale dairy farms in India, currently the world’s largest dairy producer.
Methodology
The effects of four different dairy farm development strategies / scenarios on the outcome variables ‘household income’, ‘cost of milk production’ and ‘return to labour’ were analysed against the baseline of a typical two-cow farm (IN-2) in Haryana (India). The four assessed strategies / scenarios were as follows: (i) ‘Yield’ – the farm obtains a 20 percent increase in milk yield per buffalo without additional inputs as a result of better management, (ii) ‘Loan’ – the farm has more equity and does not need to take a loan from the milkman, which results in a better milk price and reduces interest payments to zero; (iii) ‘2Lact’ – the farmer manages to obtain one calf per buffalo per year instead of one every second year and thereby has two buffaloes in lactation, which doubles milk production; and (iv) ‘IN2-Top’ – to estimate the potential of a two-cow operation in Haryana, a top managed two buffalo farm was included in the assessment.
Impact on household income
All scenarios result in increases in household income in the range of US$60-500 per annum. Household income is doubled in scenario ‘IN2-Top’. The key factor of the IN2-Top scenario is the higher milk price the farm obtains and its higher milk output (higher milk yield + two cows in lactation/year).
Impact on cost of milk production
The 2Lact and IN2-Top scenarios reduce milk production costs by approximately 40 percent, thus bringing them to US$15/100 kg which is comparable with those of the larger farms in Haryana (IN-4, IN-22) and with milk prices in Oceania. This means that the 2Lact and IN2-Top farms have are competitive vis-a-vis imports of dairy products. The 2Lact scenario doubles the farm’s milk production and almost triples the quantity of milk sold.
Impact on return to labour
To compete over the long term with other farms or off-farm activities, the wages the family earns through the dairy enterprise (return to labour) should be equal to, or higher than, the region’s wage level. So far, the IN-2 farm (baseline) obtains a ‘salary’ of US$0.1/hour, or 50 percent of the region’s wage level. The IN2-Top farm obtains a salary of US$0.3/hour, which makes dairy farming more profitable than working as a non-farm labourer in the region. This clearly shows the potential of dairy farming as a source of employment and for improving living standards in the region.
Conclusions
Compared with the baseline dairy enterprise, all of the assessed scenarios are deemed to improve the farming family’s household income, albeit to different extents. Smallholder dairy farmers in Haryana can thus improve their household income without public policy interventions. However, the potential increases are likely to be greater if combined with such interventions.
Explanation of variables, year and sources of dataFarm codes: Example IN-2 = Two-cow farm in India. Farm data refers to the year 2002, published in the IFCN Dairy Report 2003.Baseline: Reference scenario - typical IN-2 farm situation as observed. Cumulative: A combination of the various scenarios but without the IN2-Top scenario.Household income: Includes cash and non-cash income from farm and off-farm activities. Costs of milk production only, return to labour: For definitions, see Section 4.7.
This study was carried out by O. Garcia, A. Saha and T. Hemme, IFCN Dairy Research Center, and was published as the study ’Strategy analysis for a two-cow farm in India/Haryana’ in IFCN Dairy Report 2003.
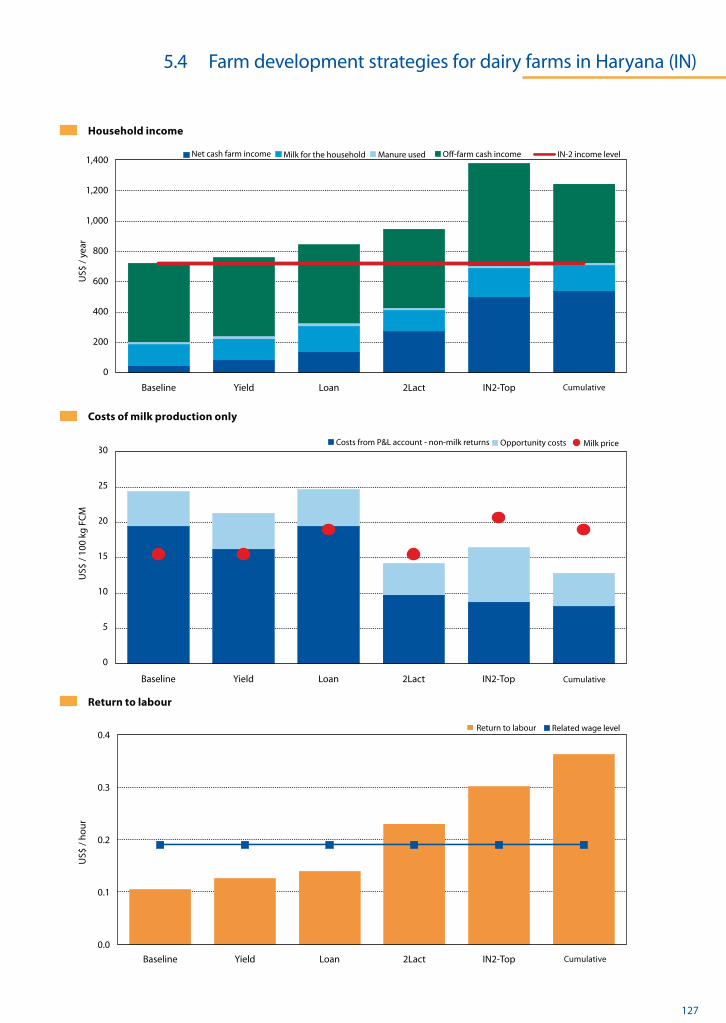
© IFCN 2008 127
0
200
400
600
800
1,000
1,200
1,400
AccumulativeIN2-Top2LactLoanYieldBaseline
IN-2 income level Off-farm cash income Manure used Milk for the household Net cash farm income
Return to labour
Household income
Costs of milk production only
0.0
0.1
0.2
0.3
0.4
AccumulativeIN2-Top2LactLoanYieldBaseline
Related wage level Return to labour
0
5
10
15
20
25
30
AccumulativeIN2-Top2LactLoanYieldBaseline
Milk price Opportunity costs Costs from P&L account - non-milk returns
US$
/ ye
ar
US$
/ ho
urU
S$ /
100
kg F
CM
5.4 Farm development strategies for dairy farms in Haryana (IN)
Cumulative
Cumulative
Cumulative
128 © IFCN 2008
5.5 Policy impact analysis for dairy farms in Thailand and Viet Nam
Introduction
The consumption of milk and livestock products is expanding rapidly in East Asia. Governments have responded by resorting to a wide variety of policy instruments to support and protect domestic dairy production, which is dominated by small-scale systems. However, in an increasingly open economy, one key question is: how profitable and competitive are these farms with and without current policy interventions? The aim of the present study was to analyse the profitability of East Asian dairy farms with and without current policy interventions.
Methodology
To address the above question, the main policies and their impact on farm outputs/inputs were first identified (for summary, see graphs 1 and 3). Secondly, the policy impact was eliminated by decreasing/increasing prices by the estimated effect of the ‘support’/’tax’ on these farms. For example, for Thailand, it was estimated that the farm milk price (of US$29/100 kg) would be 27 percent lower without policy support. For fertilizer, farm prices would decrease by 17 percent if taxes were eliminated. Lastly, the Policy Analysis Matrix (PAM) developed by Monke & Pearson (1989) was used to quantify the policy impact on selected farm types.
Thailand: policies and dairy farm profitability
As the first graph shows, under the current policy regime, Thai farmers obtain higher returns on their farm outputs, pay lower prices for domestic inputs, and pay higher prices (taxes) on internationally tradable inputs than would otherwise be the case. The overall impact of the combination of the policies in place is that farmers make a profit from their dairy farms. However, once these policies are eliminated, both farm types make losses. The high costs incurred by farm TH-117 (under current policies) can be attributed to heavy use of taxable inputs (e.g. feeds, medicine, etc.).
Viet Nam: policies and dairy farm profitability
Vietnamese dairy farmers obtain higher returns on their farm outputs, pay lower prices for labour and capital, but pay taxes on internationally tradable inputs. Land is not privately owned but rented; and government seems to keep rent prices high.
The results of the analysis indicate that dairy farmers benefit from current policies and that the dairy enterprise generates profits. However, once the policy support is eliminated, only the larger farm (VN-4) remains profitable, mostly owing to its higher labour and capital (two highly subsidized inputs) productivity. Farm type VN-4 sells more cattle per 100 kg of milk produced than VN-2, which explains the difference in returns (once current policy interventions are removed).
Producer support estimates
The producer support estimates (PSEs) show the share of the farm profits attributable to policy interventions as part of the farm returns. For typical dairy farms in both countries, the PSE levels orbit around 20 percent.
Conclusions
This study shows that both countries combine policy instruments, albeit in different ways, that on the one hand support and on the other hand tax their dairy farmers. The PSE levels show that Viet Namese dairy farms benefit slightly more than those in Thailand from their national policy frameworks. However, from a policy standpoint, the Thai farmers are more encouraged to expand their dairy enterprises. The Thai policies do this by supporting a high milk price and by keeping prices for domestic resources (labour, land and capital) low. On the other hand, Viet Namese farmers have access to highly subsidized loans, which they take to raise beef animals as for them, any dairy expansion would require more reliance on machinery, land and feed, which are heavily-taxed inputs. A beef animal eats local feed (less taxed inputs) and sells for an attractive price. Finally, Viet Nam’s land market policies may have effects that have not been detected in this study.
The combination of applied policy instruments differs between countries, and determines farmer prices for various types of inputs and outputs, which in turn strongly influence the level of dairy farm intensification.
Methods and data challenges
Policy distortions have been quantified mainly using the applied tariffs for farm outputs (milk and beef) and inputs. If, instead of tariffs, world prices had been used, the results would have differed significantly.
Explanation of variablesFarm data: The farm data refers to the year 2003, published in the IFCN Dairy Report 2004. Monke, E. A. and S. R. Pearson, 1989. Costs and returns with current policies are based on the actual prices obtained by these farmers in calendar year 2003. Costs and returns without current policies are calculated by eliminating the effects of policies on the prices obtained by these farmers in calendar year 2003. Exchange rates: US$1 = 42 Thai Baht; and US$1 = 16,067 VN Dong. Producer support estimates (PSE) = [profits (with policies) - profits (with no policies)]/returns (with policies). Method comment: Moreover, estimating distortions in prices of production factors was a very complex exercise and was done on the basis of expert estimations.
This study was undertaken by O. Garcia of the IFCN Dairy Research Center and by J. Stoll of the Justus-Liebig-University in Giessen. It was published as ‘Policy analysis for typical dairy farms in Thailand and Viet Nam’ in the IFCN Dairy Report 2005.

© IFCN 2008 129
0 %
5 %
10 %
15 %
20 %
25 %
30 %
VN-4VN-2TH-117TH-14
Reference Line) PSE
Producer support estimates (PSE)
% o
f ret
urns
/ 10
0 kg
milk
(ECM
)
Viet Nam policy impacts on prices
0
5
10
15
20
25
30
35
40
VN-4VN-2
Costs Returns
No policies With policies No policies With policies
Vietnamese farm profitability levels
0
5
10
15
20
25
30
35
40
No policies With policies No policies With policies
TH-14 TH-117
Costs Returns
US$
/ 10
0 kg
milk
(ECM
)
Thai farm profitability levels
0 % 20 % 40 % 60 % 80 % 100 % 120 %
Electricity
Vet. medicine
Feedstuffs
Fuel
Fertilizer
Machinery
Capital
Land
Labour
Beef
Milk 27 %
50 %
50 %
50 %
17 %
17 %
7 %
Supporting the farms ** Taxing the farms***
12 %
12 %
37 %
Thailand policy impacts on prices
0 % 20 % 40 % 60 % 80 % 100 % 120 %
Electricity
Vet. medicine
Feedstuffs
Fuel
Fertilizer
Machinery
Capital
Land rent
Labour
Beef
Milk 20 %
20 %
50 %
50 %
100 %
20 %
5 %
10 %
18 %
10 %
11 %
Supporting the farms ** Taxing the farms***
US$
/ 10
0 kg
milk
(ECM
)
** Supporting farms in %: Technically is equal to price with no policy / price with policy minus 1. A Thai example: Without policy intervention (tariffs), the milk price received by Thai farmers would be 27 % lower. A Vietnamese example: Without policy intervention (subsidized loans), Vietnamese farmers would pay 100 % higher interest rates (doubling). *** Taxing farms in %: Without policy interventions (import taxes for fertilizers), the fertilizer price for the Thai farmers would be 12 % lower.
5.5 Policy impact analysis for dairy farms in Thailand and Viet Nam

130 © IFCN 2008
5.6 Comparison of dairy chains in Karnal, India
Introduction
The previous study shows that milk quality is a determinant for the selection of markets for milk products. Marketing of milk and milk products might also go through different channels, depending on the processors involved and the nature of the final product. The aim of the present study was to analyse the marketing costs involved in the various channels and the returns from processing milk and cream from 1 kg of milk (6 percent fat).
Methodology
In this study, the first step taken was to analyse the dairy chains / channels in India (Karnal). Each channel is then assumed to purchase 1 kg of raw milk (6 percent fat) from the farmer and process it into milk and fresh cream, if applicable. The returns from this 1 kg of milk (milk and cream), costs (farmer’s milk prices) and margins were then calculated.
Six marketing chains / channels were identified. The cooperative represents the formal sector, while the remaining channels represent the informal sector. The channels are defined as follows:
Coop 1.5 percent: Cooperative buying milk at 6 percent fat and selling at 1.5 percent fat.
Coop 3 percent: Cooperative buying milk at 6 percent fat and selling at 3 percent fat.
Creamery 3 percent: Private processor buying milk at 6 percent fat and selling at 3 percent fat.
Milkman 3 percent: Private person, collecting milk at 6 percent fat and selling at 3 percent fat.
Direct sale 6 percent: Dairy farms, such as IN-37, selling directly to the consumer with 6 percent fat.
Farmer milk prices
Milk prices paid by the cooperatives are slightly (9 percent) lower than those paid by the ’creameries’. The milkman pays the lowest milk price to farmers (but covers collection and transportation costs to the town and for home delivery).
Consumer milk prices
The formal sector receives slightly lower consumer prices than the informal sector. By having a more conveniently located point for delivering milk to the customers (often daily home delivery), the informal sector can demand a higher price for its milk. The higher price of ‘direct sale of farm-fresh milk with 6 percent fat’ and the lower price of ‘processed milk with 1.5 percent fat’ reflects the difference in the fat content of milk sold to the consumer and customers’ preference for milk with a high fat content.
The cream business
Most marketing channels extract cream from the milk bought from the farmer. This cream (30 percent fat) is either sold directly (by the informal sector) or further processed into butter or ghee. A processor’s calculation is as follows:
US$0.23/kg milk: Purchase of milk from the farmer (6 percent fat),
US$0.24/kg milk: Sale of milk to the consumer (3 percent fat),
US$0.17/kg milk: Sale of extracted cream to the consumer (0.1 kg * US$1.7/kg).
The price paid to the farmer for milk with 6 percent fat is similar to that which the consumer pays for 3 percent fat milk. Thus, the cream extracted and sold by the processor covers the processing cost and retail margin in the dairy chain.
Margins (consumer prices - input value
of raw materials)
The margins for milk processing and retailing vary from US$0.06 to US$0.21 per kilogram of milk. The cooperative’s 1.5 percent fat milk has the highest margins. Farms selling the milk directly have the lowest margins as they do not participate in the ‘cream business’. The margins of the cooperative and milkman, at US$0.21/kg of milk, are similar. The margins observed in Karnal are half those of dairy chains in Europe (US$0.5/kg).
Conclusions
The cost and returns from milk and cream vary both between products and between the different marketing channels selected for the purpose of this study. Prices do not vary much for the raw milk purchased from farmers, but once milk is processed its share in the consumer price varies by 50 to 80 percent.
Explanation of variables, year and sources of dataValue of raw material input: Farmgate price of whole milk. Margin: Represents transport, processing and retail costs.Source of data: Data collection and interviews, October 2002.
This study was undertaken by T. Hemme, O. Garcia and A. Saha of the IFCN Dairy Research Center, and published as “Method approach – Analysis of dairy chains in India/Karnal” in the IFCN Dairy Report 2003.

© IFCN 2008 131
Input cost of the dairy chain Basis: 1 kg milk from the farmer (6 % fat)
Margins (output - input value)
Consumer prices (1.5 % - 6 % fat) Farmer prices (6 % fat)
Returns of the dairy chain Basis: 1 kg milk from the farmer (6 % fat)
Margins and farmers shares
0.0
0.1
0.2
0.3
0.4
0.5Input 1: Milk from the farmer
Dir
ect
Sale
6 %
Milk
man
3 %
Cre
amer
y 3
%
Co
op
3 %
Co
op
1.5
%
0.0
0.1
0.2
0.3
0.4
0.5Output 2: Cream sold Output 1: Milk sold
Dir
ect
Sale
6 %
Milk
man
3 %
Cre
amer
y 3
%
Co
op
3 %
Co
op
1.5
%
0.0
0.1
0.2
0.3
0.4
Dir
ect
Sale
6 %
Milk
man
3 %
Cre
amer
y 3
%
Co
op
3 %
Co
op
1.5
%
0.0
0.1
0.2
0.3
0.4
Dir
ect
Sale
6 %
Milk
man
3 %
Cre
amer
y 3
%
Co
op
3 %
Co
op
1.5
%
0.00
0.05
0.10
0.15
0.20
0.25
Dir
ect
Sale
6 %
Milk
man
3 %
Cre
amer
y 3
%
Co
op
3 %
Co
op
1.5
%
0 %
10 %
20 %
30 %
40 %
50 %
60 %
70 %
80 %
90 %
100 % Margins processing / retailing Farmers milk price
Dir
ect
Sale
6 %
Milk
man
3 %
Cre
amer
y 3
%
Co
op
3 %
Co
op
1.5
%
US$
/ kg
milk
US$
/ kg
milk
US$
/ kg
milk
6 %
fat
US$
/ kg
milk
as
spec
ified
US$
/ kg
5.6 Comparison of dairy chains in Karnal, India
132 © IFCN 2008
5.7 Cost of ‘quality milk’ in Karnataka, India: a case study
Introduction
The quality of milk products largely depends on the quality of the milk from which they are derived. This has become ever more important recently, especially following inter alia the melamine scandal/crisis in China. Small-scale farmers face a considerable challenge in adhering to high milk-quality standards because their small scale of operations makes it difficult to devise economically feasible investments for ensuring milk quality. The aim of the present study was to assess a community-based approach to improving the quality of milk delivered by small-scale dairy farmers, and to quantify the additional costs involved.
Pilot case study
In collaboration with the Technology Information, Forecasting & Assessment Council, Department of Science and Technology, Government of India (TIFAC) and the district milk union, an innovative project in Karnataka in the Kolar region of India attempts to address milk-quality through community involvement in milking operations and doorstep delivery of veterinary and breeding services. The concept adopted was to consider the whole village as a single dairy herd.
The community milking centre (CMC) of the district milk cooperative producers’ society provides diverse services to its farmer members. Milking is undertaken at the CMC twice daily in a 4x1 milking parlour and farmers bring their animals for milking in accordance with a fixed schedule. An emergency diesel generator supplies sufficient power for the two milking operations per day. The milk goes directly to the bulk-milk cooling centre, thereby preventing any contamination or adulteration. The secretary of the CMC supervises the milking operations and passes on requests from farmers for emergency veterinary health services to a veterinarian serving some nine villages. The capital investment for setting up the cold chain is made by the district milk producers’ milk union (cooperatives) in the region.
To assess the financial viability of the investment into the milking parlour bulk milk cooling centre, the costs of installation, machinery and their equipment and their maintenance were calculated. The assessment was then divided into two parts:
Machine milking and cooling services
Taking advantage of the producers society’s building, fixed costs relate only to machinery (milking parlour, milking machine, motorcycle, generator, and a bulk-milk cooler for 2 000 litres) and equipment (milk testing machine, weighing scale, computer). Using depreciation rates of 15 percent and 10 percent for machinery and equipment respectively and setting maintenance costs at 5 percent, the cost of milking and cooling services comes to US$1.96 (89 INR) per 100 litres of milk. Fuel and electricity account for 70 percent of the variable costs while machinery and equipment account for for 26 percent and for 4 percent.
Animal health and breeding services
The dairy cooperative milk union provides animal health and breeding services at the farmers’ doorstep. The union has established a network of about 46 veterinarians to cover its 400 villages in the milk shed area. Services are provided through animal health and vaccination camps and, in response to telephone requests in the case of artificial insemination and emergencies. Charges to farmers are subsidized by as much as 35 percent. In 1993-94, the cost of providing these services amounted to US$0.46 (21.05 INR) per 100 litres of milk procured. The fixed expenses of veterinary facilities and buildings are not included in the calculation. The major share of costs relates to medicine (65 percent) followed by services (camps) (21 percent), salaries (10 percent) and equipment (3 percent).
Conclusions
The cost of producing quality milk in the case reviewed involved an expenditure of US$2.42 per 100 kg of milk procured by the milk collection centre. The improvement in the quality of milk is evident from the somatic cell bacterial counts as determined by standard laboratory procedures, which both were significantly below the average recorded in India. The milk quality obtains the highest score for low coliform count. As a side-effect, with the drudgery of milking being reduced farmers are inclined to keep higher-quality dairy animals.
In conclusion, it appears that smallholder dairy farmers can produce high quality milk and that a community-based approach can work well to improve the quality of milk delivered by small-scale dairy producers at a relatively low cost.
This study, undertaken by A. Saha of the IFCN Dairy Research Center, was published as ‘Cost for ‘quality milk’ in India: A case study’ in the IFCN Dairy Report 2005.

© IFCN 2008 133
Community milking centre Bulk milk cooling facilities
Milking costs Veterinary expenses Milk collection centre data
Milk collection per day per centre = 900 litres
Number of farm members per centre = 50
Milking investment cost per 100 kg milk = 5.57 US$
Kolar Milkshed data
Number of villages covered by veterinary services = 400
Number of veterinarians = 46 Villages with CMC = 30 Villages with BMC = 106
Milk quality status (Mean of 10 milk collection centres)
Cost economies of quality milk (US$ / 100 kg ECM)
Date 13.11.2004 16.11.2004
SPC (cfu/ml) 800,000 670,000
CC (cfu/ml) 37,500 29,000
MBRT (hrs) 4.62 4.79
Adulterants 0 0
SPC: Standard plate count. CC: Coliform count. MBRT: Methylene Blue Reduction Test. cfu: colony forming unit. 1 US$ = 45.34 Indian Rupees in 2004
Variable expenses (1.38 US$)
Equipment (0.07 US$)
Machinery (0.51 US$)
Equipment (0.02 US$)
Medicines (0.31 US$)
Labour (0.05 US$)
Veterinary services (0.46 US$)
Milking and cooling (1.96 US$)
Veterinary expenses (0.27 US$)
0.00
0.05
0.10
0.15
0.20
0.25
0.30
0.35
0.40
0.45
0.50
0.0
0.2
0.4
0.6
0.8
1.0
1.2
1.4
1.6
1.8
2.0
FarmerMilk union
0.0
0.5
1.0
1.5
2.0
2.5
Services (0.10 US$)
5.7 Cost of ‘quality milk’ in Karnataka, India: a case study

134 © IFCN 2008
5.8 The competitiveness of skim milk powder from Uganda
costs include the cost of the milking machine, cooling and other costs incurred by each of the two farm types to achieve CODEX milk quality standards are thus very significant.
When using the milk from KY-13 and KY-3 to attain the EU quality level for SMP, the costs in Kayunga would be three and four times the current EU cost of producing EU-compliant SMP. This is clearly an unrealistic business alternative for processors in Kayunga.
Competitiveness of Kayunga SMP, 1996-2007
Over the last decade, production costs of SMP in Kayunga have been lower than its price in Uganda and probably also throughout the COMESA (Common Market of Eastern and Southern Africa) region. For the world market, however, Kayunga SMP production costs would be higher than the world market price (20 percent higher in 2006). These cost increases would be mainly the result of investments required at the farm and collection centres for producing/maintaining milk to the CODEX standard. For the EU market, stringent milk-quality requirements would bring the cost of Kayunga SMP to about 2.5 times the EU market price in 2006. It is interesting to note that, in 2007, the world price for SMP surpassed the US$4 000 mark (about 1.5 times the Kayunga production costs in 2006). This study strongly underpins the widely expressed opinion of dairy experts in Uganda that, under past and current economic and trading conditions, Kayunga dairy products will not be competitive within the EU.
Conclusions
This study supports the following conclusions: (1) farm size has a strong impact on the final cost of SMP; (2) Kayunga SMP is competitive on the present Ugandan market and in neighbouring countries; (3) Kayunga SMP can be competitive in the world market with raw milk supplied by the larger typical farms; (4) Kayunga SMP has no foreseeable chance of meeting EU requirements; and (5) to enhance the competitiveness of Kayunga SMP milk quality needs to be enhanced at the farm level.
It is economically feasible to produce SMP from milk produced by small-scale farmers in Uganda for the local market. It costs significantly more to produce SMP to recommended standards for world and EU markets than for local markets.
ExplanationsCost of cooling facilities/collection centre: This cost includes operating and investment costs of a typical Kayunga collection centre; in the EU and world scenarios, it includes cooling costs on the farm. Cost of transport cooling tank – processor: This cost includes cost of transport from the cooling centre to the processor’s gate in Kayunga. In the EU and world scenarios, this means transport from the farm to the processor. Cost of transport farm - cooling tank): Normally the farmer or milk trader delivers to a collection centre (therefore it costs assumed to be nothing). SMP processing costs: EU Level of US$363/ton of SMP is assumed due to lack of data and access to accurate information. Transport costs Kayunga - trading ports: These costs are not included in the calculations. However, shipping 1 kg of SMP from Kayunga to Rotterdam costs US$0.20 per ton (quotation in February 2007 by SDV Transami Uganda, for a full 20 ton container). Similarly, the cost of transporting 1 kg of SMP to the nearest world port (Mombasa, Kenya) would be US$0.12 per ton, while from Kayunga to Kampala it would be US$0.10 per ton.
This study was conducted by A. Ndambi, O. Garcia and T. Hemme of the IFCN Dairy Research Center and published as ‘How competitive is skim milk powder from Uganda’ in the IFCN Dairy Report 2008.
Introduction
Small-scale dairy production systems in Africa, Asia and South America are ‘low-cost’ compared with those in the European Union (EU) and the United States (as described in chapter 4). If this advantage were transferred to the whole dairy chain, there might be a chance of producing competitive dairy products for the world market. The aim of the present study was to explore the possibility of transforming low-cost milk produced by smallholder dairy farmers in Uganda into skim milk powder (SMP) for sale on three distinct markets, namely Uganda itself, the international market and the EU.
Methodology
For the purpose of this study, several panels of dairy experts were established to review the condition of the dairy chain in Uganda and to identify the changes necessary for SMP from Kayunga to enter the three markets in question. Major methodological challenges emerged as a result of the lack of data and of dairy processing experience. To circumvent the latter, several estimations and assumptions had to be made based on available data from neighbouring regions.
Competitiveness of Kayunga SMP on Uganda,
World and EU markets in 2006
Both graphs on the top of next page, in principle, display the same results. The first gives the costs of SMP production in United States dollars per ton of SMP (of interest for processors and traders). The second graph gives the results in United States dollars per 100 kg of milk equivalent (of interest for producers and processors). In 2006, the cost of producing SMP in Kayunga was about 20 percent lower than the ‘world cost’, which, combined with high Ugandan import tariffs of 60 percent for SMP, put Kayunga SMP in a strong competitive position on the domestic market.
If Kayunga SMP were obliged to meet the CODEX standards for raw milk quality to enter the world market, the cost of producing SMP would rise to 67 percent above the world cost for raw milk procured from the small Ugandan farm type KY-3 and to 14 percent above the world cost for raw milk procured from the medium-sized farm type KY-13. This significant cost increase is a result of having to improve milk quality at both the farm and collection centre levels. The additional

© IFCN 2008 135
Competitiveness of SMP in Uganda, World and EU markets in 2006
Competitiveness of Kayunga SMP 1996 - 2007
EU marketUganda market World market
ExplanationsEU scenario: Represents the case of a typical farm in Germany supplying to an average SMP processor.World scenario: Is based on the economics of a typical New Zealand farm, whose milk is converted into SMP.UG-3 now scenario: Represents current costs on the Kayunga farm for milk production + collection, at current milk quality and used for SMP.Processing costs kept constant (at EU levels) for all scenarios due to lack of data/ expertise/ access to better information.
Key assumptions in the time period 1996 - 2007SMP price in Uganda scenario: SMP world price plus Ugandan import tariff s in 2006. Tariff s kept constant for 1996-2007.Kayunga milk price 1996-2007: Linked to Uganda milk price 1996-2007 based on the Kayunga-Uganda milk price relation in 2006.
Non-IFCN sources: CODEX Standards for milk powders and cream powders, at http://www.codexalimentarius.net/ web/standard_list.jsp For milk quality standards, see Codex Stan 207; page 2); http://www.unctad-trains.org, consulted on February 2007 for the Ugandan tariffs for dairy imports; http://www.zmp.de for some dairy commodity prices, processing costs for SMP and butter, and conversion factors for milk into both SMP and butter; and personal interviews with dairy experts (farmers, veterinarians, NGO and government staff, dairy processors, milk transport services and retailers) operating in Kayunga, Kampala, Mukono and Mbarara, during the summer of 2006 and in February 2007.
5.8 The competitiveness of skim milk powder from Uganda

136 © IFCN 2008
Feed prices paid by dairy farmers
Farmers in Polloc pay US$0.27, US$0.17 and US$0.29 per kilogram, respectively, for their most common balanced feed mix, wheat middling and cottonseed meal. These prices do not include the cost of farmers’ labour and transportation from the distributor to the farmgate, which was estimated at between US$0.02 and US$0.05 per kilogram, respectively. Therefore, the average farmgate price for feed is US$0.27/kg, about double the IFCN world feed price estimate. Using the milk price of farm PE-6, the milk:feed price ratio is very low at 0.68. This means that with the proceeds of 1 kg of milk it is possible to purchase 0.68 kg of feed, which is one of the lowest figures found in the 34 countries analysed by the IFCN.
Transportation costs and retail margins
The transportation costs and margins of retailing (farmers’ prices - primary distributor price) were estimated as US$0.06, US$0.05 and US$0.08/kg, respectively, for the balanced feed mix, wheat middling and cottonseed meal. Transportation costs and margins for intermediaries along the chain thus amount to 22 to 29 percent of farmers’ feed prices in Polloc. The prices paid by the primary distributors in Lima represent about 60 to 70 percent of farmers’ final feed prices.
Conclusions
Dairy feed is very expensive in Cajamarca. Therefore, with the current milk prices, it is not generally economical to use concentrates on dairy farms. However, more efficient feed distribution chains could improve the milk:feed price ratio and thereby encourage use of concentrates, which would in turn increase milk yields and thereby household incomes.
It should be noted that this study was conducted in 2005, when feed prices were relatively stable. However, they increased from 2006 until they peaked in June 2008 and then started falling again. IFCN predicts that feed prices will remain volatile, a situation that needs to be considered in interpreting the results.
5.9 The dairy feed chain in Peru: a case study
Explanation of variablesWheat middling: Wheat middlings are a by-product of the flour and semolina (pasta) industry. They contain bran, germ and small amounts of starch, and are used widely in the feed industry as basic ingredients in commercial protein supplements, creep feeds and other feed products. IFCN estimate for world market price for feed: 0.3*soya bean meal price (CIF Rotterdam) and 0.7*corn price (FOB Gulf). Situation in 2005 (season 2004/05): SBM=US$239/ton; corn= US$98/ton = IFCN feed price estimate=US$138/ton.Transport cost from Polloc to the farm: Range US$0.02- 0.05/kg; US$0.035/kg used in the graphs.
This study was conducted by C. Gomez and M. Fernández of Universidad Nacional Agraria La Molina, Lima, Peru, and O. Garcia of the IFCN Dairy Research Center. It was published as ‘Analysis of the Peruvian feed chain: The case of Cajamarca’ in the IFCN Dairy Report 2006.
Introduction
Dairying does not just involve milk production and marketing but also includes the supply chain for farm inputs. As feed is both a major input to, and the largest cost item of, most dairy farms, it can be hypothesized that any improvement of feed distribution will not only have a significant influence on the cost of milk production but will also determine the intensity of feed use in milk production. The aim of the present study was to assess the economics of the various distribution channels for the most common concentrates used in Cajamarca, Peru.
Methodology
The study is based on information collected in 2005 from feed suppliers, farm managers and feed advisors in the region of Cajamarca. Data collection took place in a representative dairy site in a high valley area (Polloc) and covered the three most commonly-fed supplementary feeds: (i) a balanced dairy feed mix (16 percent protein and 1.6 Mcal/kg); (ii) wheat middling; and (iii) cottonseed meal.
Feed prices in Lima
The Cajamarcan feed chains start with primary distributors in Lima, who mostly use imported ingredients and sell balanced dairy feed mixes and/or wheat middling and cottonseed meal (as single feedstuffs) for US$0.21, US$0.12 and US$0.21/kg, respectively (prices at their warehouses in Lima). The IFCN estimated the world market price of balanced feeds in 2005 at US$0.138/kg. On the basis of this, the cost of bringing feed from world trading points (US-Gulf/Rotterdam) to Lima would be about US$0.07/kg.

© IFCN 2008 137
Farmer feed prices (Farm gate in Polloc, Cajamarca)
The feed chain for a dairy farmer (Polloc, Cajamarca)
0.00
0.05
0.10
0.15
0.20
0.25
0.30
0.35
Cotton seed meal Wheat middlingBalanced feed mix
0.138: IFCN estimate of world market »feed« price
Distributor feed prices (Lima)
US$
/ kg
Margins from Lima to the farm gate (Starting at distributor prices in Lima)
0.00
0.05
0.10
0.15
0.20
0.25
0.30
0.35
Cotton seed meal Wheat middlingBalanced feed mix
0.00
0.02
0.04
0.06
0.08
0.10
0.12
Cotton seed meal Wheat middlingBalanced feed mix
Transport cost to the farm (PE-6)Margin f. Lima to Polloc
0 %
20 %
40 %
60 %
80 %
100 %
Cotton seed meal Wheat middlingBalanced feed mix
Transport cost to the farm (PE-6)Margin f. Lima to PollocDistributors' Prices in Lima
US$
/ kg
US$
/ kg
5.9 The dairy feed chain in Peru: a case study

138 © IFCN 2008
5.10 A comparison of dairy farming systems in India
WB
BI
PU
HA
PU
PU
JK
RA
GU
MA
AP
TN
HP
OR
MP
KA
UP
KEKE
WB
BI
PU
HA
PU
PU
JK
RA
GU
MA
AP
TN
HP
OR
MP
KA
UP
KEKE
PU
HA
PU
OR
KA
HARYANAIN-2HAIN-4HA
MaharashtraIN-2MA°IN-2MA
Andhra PradeshIN-1AP-MNIN-3AP-MN
IN-1AP-GRIN-2AP-GR
PU
HA
PU
OR
KA
HaryanaIN-2HAIN-4HA
MaharashtraIN-2MA°IN-2MA
Andhra PradeshKarnataka
OrissaIN-2OR-CIN-2OR-B
OrissaIN-2OR-CIN-2OR-B
IN-1MNIN-3MN
IN-1GRIN-2GR
IN-1KAIN-2KAIN-4KA
Introduction
Dairy farms vary considerably in terms of their distance to consumption centres and their surrounding agro-climatic, socio-economic and political settings. India has the world’s largest dairy animal population spread across the vast nation and it is likely that variation in the above factors across India has an influence its on dairy production systems and their productivity. The aim of the present study was to assess the variation in dairy farming and dairy farm economics across different regions of India.
Selection of the study areas
India’s dairy production systems / areas can roughly be classified as ‘progressive’, ‘average’ and below ‘average’. The ‘progressive’ systems / areas are found in the states of Punjab and Haryana, while the ‘below-average’ systems dominate in the states of Orissa, Madhya Pradesh, Karnataka, Himachal Pradesh and all the north-eastern states except Mizoram and Sikkim. Dairy production systems in the remaining states of India can be classified as ‘average’ or as in between ‘progressive’ and ‘below-average’. Correspondingly, for this comparison, typical farms from Haryana were chosen to represent the ‘progressive’ systems / areas; farms from Maharashtra and Andhra Pradesh to represent the ‘average’, and farms from Orissa and Karnataka to represent the ‘below-average’ systems / areas. (‘Progressive’ systems can be found in areas where ‘below-average’ systems predominate and vice-versa. For example, within the ‘lagging’ regions of Karnataka, pockets of dairy zones with very high milk yields were identified.)
Household economics
Most of the dairy farming systems are operated by part-time farmers who earn between 8 and 30 percent of their income from dairying, the exceptions being the farms in Karnataka, IN-2KA and IN-4KA, which earn 40 and 48 percent of their income from dairying. Thus dairy farming is mostly an activity of part-time farmers who also depend on off-farm income for their livelihood. The vast majority of dairy farm households earn less than US$1 per capita/day. Most landless dairy farm households only make US$0.2-0.4 per capita/day. (It should be noted that these estimates of household income are not adjusted for purchasing power parity and thus are not comparable with the internationally used poverty lines.)
Dairy enterprise economics
The cost of milk production ranges from US$15.7 to US$28.3 per 100 kg of ECM. The cost of producing milk is relatively lower on farms with access to land compared with farms that have no such access. However, all farms find ways to generate a positive income from dairying and most make a return to labour similar to the wage level in their area. The landless farms − IN-1MN, IN-1GR, IN-1KA and IN-2HA − do not achieve this wage level, but will continue their dairy operations until such time as an alternative, better employment opportunities become available.
Conclusions
The economics of dairy farming are greatly affected by regional variations in resource quality and access and scale of production. Milk is mostly produced by low-income farm households; hence, dairy farming is mainly intended to improve livelihoods rather than as business venture. Regional variations in the cost of milk production are compensated by differences in land costs, wage rates and input productivity.
Explanation of variablesResult variables: See Chapter 4. Year of data collection: 2004. Source: Survey of the regions indicated in the map.
This study was undertaken by A. Saha of the IFCN Dairy Research Center and published as ‘An inter-regional evaluation of dairy farming systems in India’ in the IFCN Dairy Report 2005.
Typical dairy farms analysed in India

© IFCN 2008 139
Farm 2HA° 4HA 2MA° 2MA 2OR 2OR-B 1KA° 2KA 4KA 1AP°-GR 2AP-GR 1AP°-MN 3AP-MN
Haryana Maharashtra Orissa Karnataka Andhra Pradesh
Region Karnal Kolhapur Ganjam Kolar Guntur Mahboobnagar
Production system Rural L Rural PU Rural Rural G Rural Rural Rural Rural Rural-SG Rural Rural G Rural
Animal type Buffalo MB /CBH Buffalo Buffalo LC LB CBJ CBH CBH UB UB LC LB
Yield (kg/animal/year) 800 1,238 1,250 1,410 256 430 3,015 3,450 4,050 1,050 1,365 680 730
Fat (%) 6.5 6 8 7.5 3.6 5 3.5 3.5 3.6 5.5 7.2 4.0 6
Landholding (ha) 0 3.7 0 0.9 0.8 2 0 0.8 1.6 0 0.8 0 3
Arable land rent (US$/ha) - 276 - 221 221 221 - 221 193 - 221 - 165
Wage rate (US$/hour) 0.13 0.16 0.07 0.09 0.05 0.05 0.09 0.10 0.10 0.13 0.13 0.13 0.13
IN-3
MN
IN-1
MN
IN-2
GR
IN-1
GR
IN-4
KA
IN-2
KA
IN-1
KA
IN-2
OR-
B
IN-2
OR
IN-2
MA
IN-2
MA
°
IN-4
HA
IN-2
HA0.0
0.5
1.0
1.5
2.0
2.5
0.3
2.2
1.0
0.7
0.2
0.8
0.30.3
2.4
0.4
0.9
0.4
0.7
US$
/ 100
kg
milk
(ECM
)U
S$ /
capi
ta /
day
Dairy enterprise economics
Household economics
0 %
10 %
20 %
30 %
40 %
50 %
60 %
70 %
80 %
90 %
100 % Other farm income Off-farm income Dairy income
IN-3
MN
IN-1
MN
IN-2
GR
IN-1
GR
IN-4
KA
IN-2
KA
IN-1
KA
IN-2
OR-
B
IN-2
OR
IN-2
MA
IN-2
MA
°
IN-4
HA
IN-2
HA
Average wages on the farm Return to labour
0.00
0.05
0.10
0.15
0.20
0.25
0.30
0.35
0.40
IN-3
MN
IN-1
MN
IN-2
GR
IN-1
GR
IN-4
KA
IN-2
KA
IN-1
KA
IN-2
OR-
B
IN-2
OR
IN-2
MA
IN-2
MA
°
IN-4
HA
IN-2
HA0
5
10
15
20
25
30 Opportunity cost Milk price Costs- non-milk returns
IN-3
MN
IN-1
MN
IN-2
GR
IN-1
GR
IN-4
KA
IN-2
KA
IN-1
KA
IN-2
OR-
B
IN-2
OR
IN-2
MA
IN-2
MA
°
IN-4
HA
IN-2
HA
US$
/ hou
r
Income per capita per day Household income share
Costs of milk production only Return to labour
Farm description
Farm IN-2HA IN-4HA IN-2MA° IN-2MA IN-2OR IN-2OR-B IN-1KA IN-2KA IN-4KA IN-1GR IN-2GR IN-1MN IN-3MN
Roughage Wheat straw Sugarcane tops Paddy straw Jowar and Ragi straw Paddy straw Paddy and jowar straw
Milking system Hand Hand Hand Machine Hand Hand
Rainfall 1,100 mm 1,300 mm 850 mm 900 mm 853 mm 604 mm
L = Landless; G = Grazing; SG=Semi grazing; PU = Peri-Urban; MB / CBH= Murrah Buffalo + Crossbred cows (Holstein); CBJ = Crossbred cows (Jersey); CBH = Crossbred cows (Holstein); LB = Local buffalo; UB = Upgraded buffalo; LC=Local cow; Rainfall data from various published sources.
5.10 A comparison of dairy farming systems in India
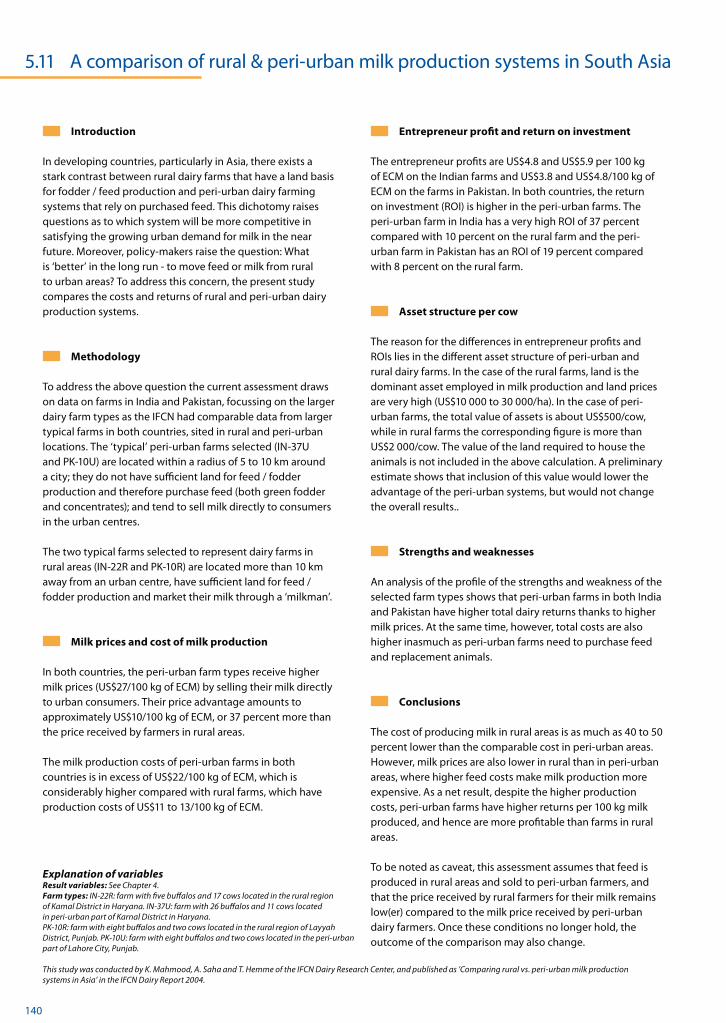
140 © IFCN 2008
5.11 A comparison of rural & peri-urban milk production systems in South Asia
Explanation of variablesResult variables: See Chapter 4. Farm types: IN-22R: farm with five buffalos and 17 cows located in the rural region of Kamal District in Haryana. IN-37U: farm with 26 buffalos and 11 cows located in peri-urban part of Karnal District in Haryana. PK-10R: farm with eight buffalos and two cows located in the rural region of Layyah District, Punjab. PK-10U: farm with eight buffalos and two cows located in the peri-urban part of Lahore City, Punjab.
This study was conducted by K. Mahmood, A. Saha and T. Hemme of the IFCN Dairy Research Center, and published as ’Comparing rural vs. peri-urban milk production systems in Asia’ in the IFCN Dairy Report 2004.
Introduction
In developing countries, particularly in Asia, there exists a stark contrast between rural dairy farms that have a land basis for fodder / feed production and peri-urban dairy farming systems that rely on purchased feed. This dichotomy raises questions as to which system will be more competitive in satisfying the growing urban demand for milk in the near future. Moreover, policy-makers raise the question: What is ‘better’ in the long run - to move feed or milk from rural to urban areas? To address this concern, the present study compares the costs and returns of rural and peri-urban dairy production systems.
Methodology
To address the above question the current assessment draws on data on farms in India and Pakistan, focussing on the larger dairy farm types as the IFCN had comparable data from larger typical farms in both countries, sited in rural and peri-urban locations. The ‘typical’ peri-urban farms selected (IN-37U and PK-10U) are located within a radius of 5 to 10 km around a city; they do not have sufficient land for feed / fodder production and therefore purchase feed (both green fodder and concentrates); and tend to sell milk directly to consumers in the urban centres.
The two typical farms selected to represent dairy farms in rural areas (IN-22R and PK-10R) are located more than 10 km away from an urban centre, have sufficient land for feed / fodder production and market their milk through a ‘milkman’.
Milk prices and cost of milk production
In both countries, the peri-urban farm types receive higher milk prices (US$27/100 kg of ECM) by selling their milk directly to urban consumers. Their price advantage amounts to approximately US$10/100 kg of ECM, or 37 percent more than the price received by farmers in rural areas.
The milk production costs of peri-urban farms in both countries is in excess of US$22/100 kg of ECM, which is considerably higher compared with rural farms, which have production costs of US$11 to 13/100 kg of ECM.
Entrepreneur profit and return on investment
The entrepreneur profits are US$4.8 and US$5.9 per 100 kg of ECM on the Indian farms and US$3.8 and US$4.8/100 kg of ECM on the farms in Pakistan. In both countries, the return on investment (ROI) is higher in the peri-urban farms. The peri-urban farm in India has a very high ROI of 37 percent compared with 10 percent on the rural farm and the peri-urban farm in Pakistan has an ROI of 19 percent compared with 8 percent on the rural farm.
Asset structure per cow
The reason for the differences in entrepreneur profits and ROIs lies in the different asset structure of peri-urban and rural dairy farms. In the case of the rural farms, land is the dominant asset employed in milk production and land prices are very high (US$10 000 to 30 000/ha). In the case of peri-urban farms, the total value of assets is about US$500/cow, while in rural farms the corresponding figure is more than US$2 000/cow. The value of the land required to house the animals is not included in the above calculation. A preliminary estimate shows that inclusion of this value would lower the advantage of the peri-urban systems, but would not change the overall results..
Strengths and weaknesses
An analysis of the profile of the strengths and weakness of the selected farm types shows that peri-urban farms in both India and Pakistan have higher total dairy returns thanks to higher milk prices. At the same time, however, total costs are also higher inasmuch as peri-urban farms need to purchase feed and replacement animals.
Conclusions
The cost of producing milk in rural areas is as much as 40 to 50 percent lower than the comparable cost in peri-urban areas. However, milk prices are also lower in rural than in peri-urban areas, where higher feed costs make milk production more expensive. As a net result, despite the higher production costs, peri-urban farms have higher returns per 100 kg milk produced, and hence are more profitable than farms in rural areas.
To be noted as caveat, this assessment assumes that feed is produced in rural areas and sold to peri-urban farmers, and that the price received by rural farmers for their milk remains low(er) compared to the milk price received by peri-urban dairy farmers. Once these conditions no longer hold, the outcome of the comparison may also change.
© IFCN 2008 141
Buildings and machinery OtherLivestockLand
0
500
1,000
1,500
2,000
2,500
3,000
PK-10UPK-10RIN-37UIN-22R
0
5
10
15
20
25
30
Milk price Opportunity costs Costs from P&L account - non-milk returns
PK-1
0U
PK-1
0R
IN-3
7U
IN-2
2R
0
1
2
3
4
5
6
PK-1
0U
PK-1
0R
IN-3
7U
IN-2
2R
Cost of milk production only Location of dairy farms Entrepreneur‘s profit
Profile of strengths and weaknesses
Return on investment (nominal) Asset structure per cow
US$
/ 100
kg
ECM
US$
/ 100
kg
ECM
US$
/ cow
Peri-urban FarmsLocated in 5-10 km
Radius of town
UrbanArea
All Feed bought
PK-U IN-U
Rural FarmsLocated more than 10 km from
peri-urban ring, produce their own fodder
PK-R IN-R
-15 -10 -5 0 5 10 15Return to labour
Entrepreneur's profitFamily farm income
Other costsCapital costsLabour costs
Land costsVet., Med. & A.I.
Building costsFuel, Energy, Water
Machinery costsAnimals purchased
Feed costsTotal costs
Other returnsCattle returns
Milk returnsTotal returns
WeakStrong
US$/100 kg ECM
IN-37 urban vs IN-22 rural farm PK-10 urban vs PK-10 rural farm
5 %
10 %
15 %
20 %
25 %
30 %
35 %
40 %
PK-10UPK-10RIN-37UIN-22R
-15 -10 -5 0 5 10 15Return to labour
Entrepreneur's profitFamily farm income
Other costsCapital costsLabour costs
Land costsVet., Med. & A.I.
Building costsFuel, Energy, Water
Machinery costsAnimals purchased
Feed costsTotal costs
Other returnsCattle returns
Milk returnsTotal returns
WeakStrong
US$/100 kg ECM
5.11 A comparison of rural & peri-urban milk production systems in South Asia
Strength Weakness
Strength Weakness

142 © IFCN 2008
5.12 Comparison of small- and large-scale dairy farming systems in India & US
Explanation of variablesFarm codes: IN-2HA = two-cow farm in Haryana, US-2400TX = USA 2 400-cow farm in Texas (farm data refer to the year 2003).Results variables: Similar to those described in Section 4.Labour efficiency: Amount of ECM produced per unit of labour.Feed costs: Cost of purchased feeds, land and variable costs of forage production (seeds, fertilizer, etc.).Feed ‘price’: Total feed costs/total quantity of dry matter of feed calculated per 100 kg of ECM produced.Feed efficiency: Amount of ECM milk produced per kg of dry matter consumed.
This study was conducted by A. Saha and T. Hemme of the IFCN Dairy Research Center and published as ‘Comparison between the farms IN-2 and US-2400’ in the IFCN Dairy Report 2004.
Introduction
In South Asia, as in most developing countries, dairy farming is predominantly a smallholder, family-based, mixed crop-livestock farming operation. Farmers feed their cattle with crop residues, mainly straw, and natural grasses (often from common land). Milk yields per cow and year are usually low. By contrast, capital-intensive dairy farms, operating with hired labour, predominate in the United States. The purpose of the present assessment was to compare small- and large-scale dairy farming systems in order to determine their relative strengths and weaknesses.
Methodology
IFCN methodology was used to estimate and compare costs of milk production. The farms chosen for the comparative analysis were a typical two-buffalo farm in Haryana, India (1 058 kg of ECM per buffalo cow and year) and a 2 400-cow farm in Texas, United States (8 589 kg of ECM per cow per year). The farm data refers to the year 2003. The cost of milk production was subdivided into feed, labour and ‘other’ costs.
Cost of milk production
The cost of milk production minus the non-milk returns was lower on the farm in India while the full economic cost of US$28 per 100 kg of ECM was similar on both dairy farms. Feed costs account for 30 percent of production costs on the Indian farm and for 60 percent on the United States farm while labour costs account for 50 percent of total costs on the Indian farm and for only 10 percent on the US American farm.
Labour cost component
Labour costs are higher on the Indian farm (US$17 per 100 kg of ECM) compared with only US$3.5 per 100 kg of ECM on the US American farm. This can be explained by the higher labour productivity on the US American farm (255 times higher!!) while the wage rate is only 50 times higher. In terms of labour efficiency, the above corresponds to 5 kg of ECM per minute of farm labour on the US American farm against only 0.02 kg of ECM on the Indian farm. (Conversely, it takes 12 seconds of farm labour to produce one litre of milk on the US
American farm compared with 51 minutes on the Indian farm to produce the same amount.) The farm in Texas invests 5 minutes of farm labour time per cow/day, while on the Indian it is 2.5 hours per animal/day.
Feed cost component
The feed costs on the Indian farm are US$10 per 100 kg of ECM compared with US$19 on the US American farm. This can be explained by feed prices of US$0.18 per kilogram of dry matter on the US American farm compared with only US$0.03 for the same amount on the farm in India. The United States farm uses better-quality forage (sorghum and corn silage, alfalfa hay) and a high proportion of concentrates (50 per- cent). The Indian farm feeds mostly grasses, sugarcane tops (free-of-charge), wheat/paddy straw and 120 grams of concentrates (cotton seed/mustard seed cake) per buffalo per day.
The impact of the difference in feed quality is evident: feed efficiency is 3.6 times higher on the US American farm, with 0.97 kg of ECM produced per kilogram of dry matter against only 0.27 kg of ECM on the Indian farm. The US American farm uses 1 kg of dry matter to produce 1 kg of milk whereas the Indian farm needs 3.6 kg of dry matter for the same quantity of milk.
Conclusions
The cheap feed source compensates for lower feed efficiency on the typical, two-buffalo landless farm in Indian. The wages paid in India are very low (US$0.2/hour) but the very low productivity of labour stills results in high labour costs per kg of milk produced compared with those of the large-scale US American farm. The key cost advantage of the Indian system thus lies in the low feed costs (crop residues such as straw) in combination with low milk yields. The maximum daily feed intake capacity of about 15 kg of dry matter limits the milk yield per animal on the Indian farm.

© IFCN 2008 143
0
5
10
15
20
US-2400TXIN-2HA
Hired labour costsFamily labour costs
0
5
10
15
20
US-2400TXIN-2HA0.0
0.2
0.4
0.6
0.8
1.0
1.2
US-2400TXIN-2HA
0
1
2
3
4
5
6
US-2400TXIN-2HA
0.02
5.0
0
2
4
6
8
10
12
US-2400TXIN-2HA
0.00
0.02
0.04
0.06
0.08
0.10
0.12
0.14
0.16
0.18
0.20
US-2400TXIN-2HA
0 %
20 %
40 %
60 %
80 %
100 %
US-2400TXIN-2HA
Feed costs Labour costs Other costs
Cost of milk production
Average wages on the farm Labour costs
Share of cost components
US$
/ 100
kg
ECM
US$
/ 100
kg
ECM
US$
/ hou
r
Labour efficiency
Feed price Feed costs Feed efficiency
kg E
CM / m
inut
e
US$
/ 100
kg
ECM
US$
/ kg
dry
mat
ter
kg E
CM / k
g dr
y m
atte
r
0
5
10
15
20
25
30
35
US-2400TXIN-2HA
Milk price Opportunity costs
Costs from P&L account - non-milk returns
5.12 Comparison of small- and large-scale dairy farming systems in India & US
144 © IFCN 2008
5.13 Comparing household, whole farm and dairy enterprise levels in India
Introduction
In small-scale, family run dairy production systems, the economics of the household, whole farm, and the dairy enterprise are intimately interlinked and difficult to disentangle one from the other. However, to be meaningful, farm economic analysis requires a precise separation of the three levels.
Methodology
The aim of the present study was to analyse the economics of small-scale dairy farms in India at the dairy enterprise, whole farm, and household level. This analysis attempts to illustrate the different aspects and complexity of the farming household system. Three farm types in India were chosen for this analysis and purpose. In addition to the data on the dairy farming system detailed data had been collected on economic aspects of the household and the whole farm.
Household activities and income
Total annual household income differs significantly between the three households (US$700 to 7 800/year) and increases in accordance with herd size. The smallest farm, IN-2, dedicates a large proportion of its family labour to off-farm activities, which contribute 75 percent to total household income. The remaining 25 percent of total household income are returns from milk and manure. The household covers all cash expenses with the farm receipts and has milk and manure for heating as a surplus to improve family living conditions. By contrast, on the large farm, IN-22, 100 percent of the family labour is used for on-farm work. The situation is somewhat between these extremes on the intermediate size farm, IN-4, which dedicates 30 percent of its family labour to off-farm activities.
Farm activities, returns and income
The IN-2 farm type may be considered as a specialized dairy farm while the two larger farm types also generate returns from selling cash crops. The IN-4 farm rents out machinery to other farmers. Total farm returns range from US$300 to US$20 000 per annum while the corresponding net cash farm
incomes range from US$160 to US$7 800. The share of the net cash farm income in farm returns is approximately 50 percent on the smallest farm and 37 percent on the largest farm.
Dairy enterprise, returns and competitiveness
Total annual returns from the dairy enterprise range from US$300 to US$26 000. The estimate of the return to (family) labour provides an indication of how competitive the dairy enterprise is on the local labour market. Both larger farms are very competitive as they generate ‘salaries’ that are above the local wage level. Without major improvements in labour productivity, the IN-2 farm type will find it difficult to compete with the larger farm types over the long term. However, as in most other countries, farmers will keep their dairy cows as long as no alternative employment opportunities are available.
The cost of milk production ranges from US$12 to US$22/100 kg milk and provides a measure of a farm’s competitiveness on the milk market. Economies of size are evident. The larger farm types (IN-4, IN-22) have milk production costs similar to those in Oceania and South America. With the existence of a competitive dairy chain in India, these farms would be able to compete against imports and should even be able to produce milk for export.
Conclusions
While there is a strong interrelation between the three levels of economic analysis, the applied methodology offers a chance to reasonably distinguish between them. The smallest farm type has higher milk production costs than the larger ones, but its actual cash expenses per kilogram of milk produced are less than half those of the larger farm types. A large part of the production costs on the smallest farm type consists of opportunity costs for family-owned resources, mainly family labour. If a family member working in the dairy enterprise actually has the opportunity to work off-farm the milk production cost will be as high as shown. However, in case no opportunity for off-farm work exists, the opportunity cost of family labour will be zero which means a small-scale dairy farm can be more competitive than the larger farm types analysed.
Explanation of variablesFarm codes: Example IN-2 = Indian two-cow farm. The farm data refers to the year 2002.Labour use: All family labour used to generate income.Household income: Includes cash and non-cash income from farm and off-farm activities.Off-farm income: Include all salaries for all family members.Net cash farm income: Total farm returns (including milk and manure used in the household) minus total farm expenses.Method challenge: Once the opportunity to work off-farm is not there the opportunity costs for labour could be zero.
This study was conducted by T. Hemme, O. Garcia and A. Saha, IFCN Dairy Research Center, and published as ’India: Household, whole farm and dairy enterprise level analysis’ in IFCN Dairy Report 2003.

© IFCN 2008 145
0 %
10 %
20 %
30 %
40 %
50 %
60 %
70 %
80 %
90 %
100 %
IN-22IN-4IN-2
Off-farm activities Farm / household work
0
1
2
3
4
5
6
7
8
9
Non-cash farm benefits from the farm
Off-farm incomeCash income from the farm
IN-22IN-4IN-2
0.7
7.7
5.0
0 %
10 %
20 %
30 %
40 %
50 %
60 %
70 %
80 %
90 %
100 %
IN-22IN-4IN-2
Other returns Cash crops Dairy
0
5
10
15
20
25
Net cash farm income
IN-22IN-4IN-2
20.6
7.8
0.3
7.7
4.4
0.16
Farm returns Cash expenses
0
5
10
15
20
25
30
IN-22IN-4IN-2
Milk price Opportunity costs
Costs from P&L account - non-milk returns
0.0
0.2
0.4
0.6
0.8
1.0
1.2
1.4
1.6
IN-22IN-4IN-2
Average wages on the farm Return to labour
Labour utilization
Costs of milk production only
Net cash farm income Return structure
Household income
Return to labour
1,00
0 U
S$ /
farm
US$
/100
kg
milk
(ECM
)
US$
/ ho
ur1,
000
US$
/ fa
rm
5.13 Comparing household, whole farm and dairy enterprise levels in India
146 © IFCN 2008
5.14 Methodological approach for guiding dairy development activities
Developing an action plan
All but three of the possible interventions reduce MN-3’s milk production costs. Some of the interventions individually have a major impact and bring milk productions costs down to the target of US$16/100 kg of ECM. However, it would be advisable for dairy development programmes to rely on combining the strengths of different interventions.
A panel of experts combined interventions into a programme that first improves the management of MN-3 (here referred to as MN3-Top). A secondly step foresees breed improvements from local to grade (cross-bred) and then to pure Murrah buffaloes. And, thirdly, they agreed that MN-3 would subsequently be in a position to increase its herd size to five, and then ten, well-managed and productive animals. This sequence was referred to as ‘dairy development ladder’.
The sequential combination of the selected interventions shows that MN-3 can reach the target of US$0.15/hour simply by improving its management. Improving the genetic potential and increasing the size of the herd is predicted to result in a return to labour of US$0.25 (5.3 times its current level). Similarly, the programme also reduces MN-3’s milk production costs from US$23 to US$16/100 kg of ECM − a 30 percent reduction.
Conclusions
The above approach proved very helpful in assisting dairy stakeholders to (1) gain a clearer understanding of the economics of local dairy production systems and of ‘business’ targets for dairy development (2) assess the farm-level impact of various potential interventions to improve dairy farm profitability and competitiveness, and (3) bring together diverse stakeholders to jointly formulate an action plan for local dairy development.
The importance of the intense participation of local dairy stakeholders in this approach cannot be over-emphasized. They identify the farms that are typical for the area, set the performance targets, assess on-farm resources and off-farm dairy development opportunities and, finally, combine all potential interventions into a clear development strategy.
Introduction
In today’s rapidly-changing dairy sectors, farmers require strategies for the development of their dairy enterprise that are based on business approaches to enterprise management. Crafting such strategies draws on the critical managerial tasks of defining business performance targets (the ends) and action plans to achieve them (the means). The major challenge here is that few dairy stakeholders have sufficient knowledge of their own dairy sector and trends and the entrepreneurial skills to either set adequate targets or design action plans to achieve them. The present study is an example of an approach to assist dairy stakeholders to set realistic business targets and to develop a plan for meeting them.
Methodology
This exercise was carried out in the District of Mahboobnagar (Andhra Pradesh) in India and focused on developing a strategy to improve the predominant milk production system − a dairy farm with three local buffaloes (MN-3). Among the economic outcome variables, return to labour and cost of milk production were selected to guide the farm development strategy. In a sequential approach, the three most prominent dairy farm types in the region were benchmarked (performance targets) and potential dairy development interventions for MN-3 identified and ranked in accordance with their expected impact on MN-3’s competitiveness. A panel of local experts then combined the interventions into a development programme and action plan to improve MN-3’s dairy competitiveness.
Setting performance targets
Although the returns to labour on all three farm types in the region are quite low by international standards, the larger farm type achieves 3.3 times the return to labour of MN-3 (and MN-1). With respect to the cost of milk production, the larger farm produces at about 50 percent and 70 percent of the costs of MN-1 and MN-3 respectively. These comparative results indicate that MN-3 needs to improve its return to labour (dairy profitability) from US$0.047 to US$0.15/hour and has to reduce the cost of milk production from US$23 to US$16/100 kg of ECM (increasing dairy competitiveness) in order to maintain its position in the market.
Explanation of variables & sourcesFor abbreviations of the dairy development programmes, see Section 5.2 ‘Policy analysis for dairy farming in Andhra Pradesh, India’.MN-3: A three- local buffalo farm; Top-MN3: A well-managed, three-buffalo farm; 3-Grade: A well-managed farm with three-grade-buffaloes; 3-Murrah: A well-managed farm with three-Murrah buffaloes, and so for five- and ten-Murrah farms. ECM: Energy Corrected Milk, 4 percent fat, 3.3 percent protein.
This study was conducted by O. Garcia, A. Saha, K. Mahmood and T. Hemme of the IFCN Dairy Research Center and published as ‘IFCN research approach to guide dairy development activities’ in the IFCN Dairy Report 2006.

© IFCN 2008 147
0
5
10
15
20
25
30
35
MN-14MN-3MN-1
US$
/ 10
0 kg
milk
(ECM
)
0.00
0.02
0.04
0.06
0.08
0.10
0.12
0.14
0.16
MN-14MN-3MN-1
Regional wage LevelReturn to Labour
Establishing performance targets Return to labour Costs of milk production (only)
US$
/ ho
ur
US$
/ ho
ur
The dairy ladder Return to labour Costs of milk production (only)
Comparing progammes Dairy development programmes & ideas: Impact analysis – Costs of milk production (only)
US$
/ 10
0 kg
milk
( EC
M)
0
5
10
15
20
25
10-Murrah5-Murrah3-Murrah3-GradedTop-MN3MN-3
US$
/ 10
0 kg
milk
(ECM
)
0.00
0.05
0.10
0.15
0.20
0.25
10-Murrah5-Murrah3-Murrah3-GradedTop-MN3MN-3
Regional wage LevelReturn to Labour
0
5
10
15
20
25
30
INS-
WSH
GIN
S-C
oo
pIN
S-So
loH
ealt
h-I
NS
Vet-
2-Fa
rmVe
t-C
linic
Vacc
ines
5-G
rad
3-G
rad
3-G
rad
+Lo
an2-
Gra
d2-
Gra
d+
Loan
1-G
rad
1-G
rad
+Lo
anH
erd
-Red
uct
Yiel
d+
DIM
DIM
Yiel
dB
uild
ing
Stal
l Fee
din
gPr
enat
alC
alfR
eari
ng
Wat
erin
g
Co
op
-12
WSH
GLa
bo
urS
ales
Fod
der
Sale
sC
oo
pU
nio
nFa
tom
atic
C-C
oo
ling
C-p
lan
tQ
trC
oo
pC
-mem
br
Co
mp
letF
eed
Cat
tleF
eed
Fallo
wLa
nd
Vco
mm
on
sFb
ank
GF-
Cu
tter
G-F
od
der
AllS
traw
Gro
un
dn
ut
Ure
aStr
awC
-Cam
pM
N-3
Milk price Opportunity costs (excl. quota) Costs from P&L account - non-milk returns
Feeding Programs Marketing Husbandry Genetics & Upscaling Health
Baseline level
Costs from P&L account - non-milk returns
Opportunity costs (excl. quota)
Milk price
Costs from P&L account - non-milk returns
Opportunity costs (excl. quota) Milk price
5.14 Methodological approach for guiding dairy development activities

148 © IFCN 2008
5.15 Comparison of the IFCN and Extrapolate approaches to impact analysis
Introduction
Different analytical tools have been developed and applied for the analysis of small-scale agricultural systems − which are very complex economic units − and of the impacts of policy and / or technological interventions on these systems. The main aim of this study was to compare the applicability of two models for dairy sector policy analysis. It also aimed to identify policies that have an influence on dairy farming in Uganda and to analyse their impact on milk-producing households.
Methodology
Two models were used to assess the impact of various policies on typical dairy farms in Uganda. Identification of stakeholders and policies affecting dairying, followed by ranking of these policies, was done by using the EXTRAPOLATE (EX-ante Tool for Ranking Policy Alternatives) model (Thorne et al, 2005). Deeper policy impact assessment was done using the IFCN’s TIPI-CAL (Technology Impact Policy Impact Calculations) model (Hemme, 2000). These two models were selected for their broad applicability, especially in areas with limited background data and knowledge. Data collection was carried out in two steps: firstly, through a panel approach whereby stakeholders and researchers provided and inserted data into the models, and, secondly, through on-farm visits and farmer interviews using a semi-structured questionnaire with open-ended questions. Since the EXTRAPOLATE analysis used livelihood status for ranking policies, household income was selected as a similar parameter for ranking policies using the typical model. These two parameters are compared in Table 1; the policies analysed are described in Table 2 on the next page.
Comparison of policy impacts
A comparison of the extent of policy impacts on the initial farm (status quo) using the two models is shown in Figure 1. Policies that favour better marketing outlets for milk and improved milk consumption had strong impacts on households when using both models. Marketing is usually a serious constraint for smallholder farmers because they live far from the consumers, in areas with poor roads, and produce such small amounts of milk that they do not consider it worth delivering it to the milk collection centres. They therefore deliver their milk to local milk traders at lower prices. Compared with the TIPI-CAL model, policy impact appears greater with the EXTRAPOLATE model.
Ranking of policy impacts
Details of the policy impacts are shown in Table 3, expressed as percentage change with respect to the initial situation. Ranking of impacts on households by the two methods showed extreme diversion for two policies (genetic and vet services).The other policies (3-7) were ranked in the same order by the two models. The EXTRAPOLATE model ranked provision of veterinary services as the intervention with the largest positive impact on livelihoods, while TIPI-CAL ranked it as the intervention with the lowest impact on household income. This is because the panels in the TIPI-CAL approach also consider the feasibility of a policy adoption and only assesses policy impact on a specific farm type.
In this particular case, the TIPI-CAL model describes the situation on the most common farm type in a production system with average management and performance, while the EXTRAPOLATE model assesses impacts based on a general situation across a broad variety of stakeholders. This implies that any policy / intervention that affects the top or bottom 5 percent of stakeholders is likely to be reflected in the results of the EXTRAPOLATE model, whereas the TIPI-CAL model presents only impacts that occur in the most common (majority of) cases. For the same reason, the TIPI-CAL model does not foresee any impact from the provision of credit facilities to farmers compared with the improvement in livelihood status foreseen in the EXTRAPOLATE case. According to the TIPI-CAL model, a typical small-scale extensive dairy farmer in Uganda is unlikely to take up credit. A more detailed comparison of both models is shown in Table 4.
Conclusions
Both methods make a significant contribution to ex ante policy analysis, although each has strengths and weaknesses. EXTRAPOLATE shows a more general picture, with greater emphasis on societal benefits. TIPI-CAL has a more specific target on farmers and produces more detailed and quantitative results by assessing impacts in real value terms. A combination of both approaches is likely to produce results that cover more scope and will be more useful for policy-making.
This study was conducted by A. Ndambi, O. Garcia and T. Hemme of the IFCN Dairy Research Center, and by D. Balikowa of the Dairy Development Authority in Kampala, Uganda. It was published as ‘Policy analysis by EXTRAPOLATE and TIPI-CAL Models in Uganda’ in the IFCN Dairy Report 2008.
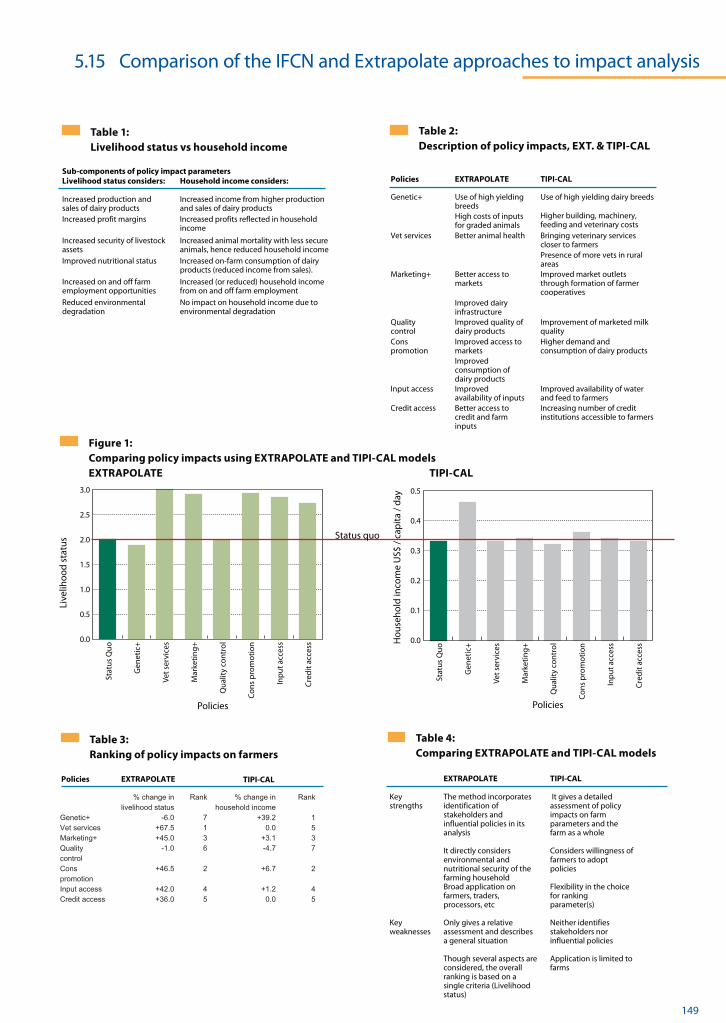
© IFCN 2008 149
% change in Rank % change in Rank livelihood status household income
Genetic+ -6.0 7 +39.2 1Vet services +67.5 1 0.0 5Marketing+ +45.0 3 +3.1 3Quality -1.0 6 -4.7 7controlCons +46.5 2 +6.7 2promotionInput access +42.0 4 +1.2 4Credit access +36.0 5 0.0 5
EXTRAPOLATE Policies
0.0
0.5
1.0
1.5
2.0
2.5
3.0
Cre
dit
acc
ess
Inp
ut
acce
ss
Co
ns
pro
mo
tio
n
Qu
alit
y co
ntr
ol
Mar
keti
ng
+
Vet
serv
ices
Gen
etic
+
Stat
us
Qu
o 0.0
0.1
0.2
0.3
0.4
0.5
Cre
dit
acc
ess
Inp
ut
acce
ss
Co
ns
pro
mo
tio
n
Qu
alit
y co
ntr
ol
Mar
keti
ng
+
Vet
serv
ices
Gen
etic
+
Stat
us
Qu
o Figure 1:
Comparing policy impacts using EXTRAPOLATE and TIPI-CAL models EXTRAPOLATE TIPI-CAL
Live
lihoo
d st
atus
Hou
seho
ld in
com
e U
S$ /
capi
ta /
day
Policies Policies
Table 2: Description of policy impacts, EXT. & TIPI-CAL
Table 1: Livelihood status vs household income
Table 4: Comparing EXTRAPOLATE and TIPI-CAL models
Table 3: Ranking of policy impacts on farmers
Sub-components of policy impact parameters Livelihood status considers: Household income considers:
Increased production and sales of dairy products
Increased income from higher production and sales of dairy products
Increased profit margins Increased profits reflected in household income
Increased security of livestock assets
Increased animal mortality with less secure animals, hence reduced household income
Improved nutritional status Increased on-farm consumption of dairy products (reduced income from sales).
Increased on and off farm employment opportunities
Increased (or reduced) household income from on and off farm employment
Reduced environmental degradation
No impact on household income due to environmental degradation
Policies EXTRAPOLATE TIPI-CAL
Genetic+ Use of high yielding breeds
Use of high yielding dairy breeds
EXTRAPOLATE TIPI-CAL
Key strengths
The method incorporates identification of stakeholders and influential policies in its analysis It directly considers environmental and nutritional security of the farming household Broad application on farmers, traders, processors, etc
It gives a detailed assessment of policy impacts on farm parameters and the farm as a whole Considers willingness of farmers to adopt policies Flexibility in the choice for ranking parameter(s)
Key weaknesses
Only gives a relative assessment and describes a general situation Though several aspects are considered, the overall ranking is based on a single criteria (Livelihood status)
Neither identifies stakeholders nor influential policies Application is limited to farms
Higher building, machinery, feeding and veterinary costs
High costs of inputs for graded animals
Vet services Better animal health
Bringing veterinary services closer to farmers Presence of more vets in rural areas
Marketing+ Better access to markets
Improved market outlets through formation of farmer cooperatives
Improved dairy infrastructure
Quality control
Improved quality of dairy products
Improvement of marketed milk quality
Cons promotion
Improved access to markets
Higher demand and consumption of dairy products
Improved consumption of dairy products
Input access Improved availability of inputs
Improved availability of water and feed to farmers
Credit access Better access to credit and farm inputs
Increasing number of credit institutions accessible to farmers
Status quo
5.15 Comparison of the IFCN and Extrapolate approaches to impact analysis
TIPI-CAL
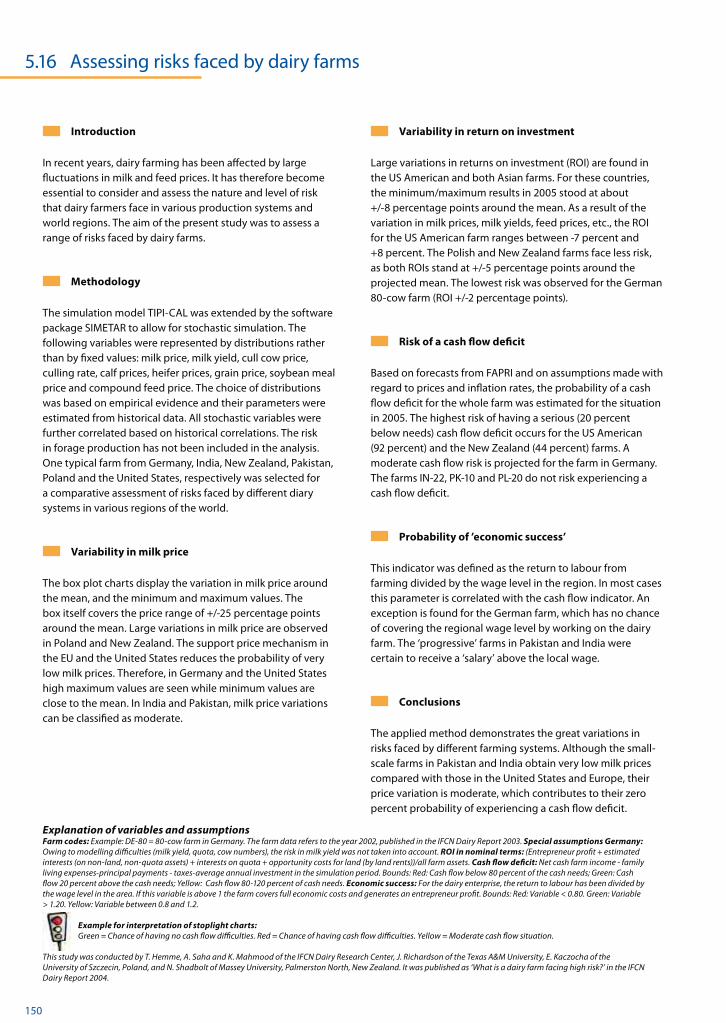
150 © IFCN 2008
5.16 Assessing risks faced by dairy farms
Introduction
In recent years, dairy farming has been affected by large fluctuations in milk and feed prices. It has therefore become essential to consider and assess the nature and level of risk that dairy farmers face in various production systems and world regions. The aim of the present study was to assess a range of risks faced by dairy farms.
Methodology
The simulation model TIPI-CAL was extended by the software package SIMETAR to allow for stochastic simulation. The following variables were represented by distributions rather than by fixed values: milk price, milk yield, cull cow price, culling rate, calf prices, heifer prices, grain price, soybean meal price and compound feed price. The choice of distributions was based on empirical evidence and their parameters were estimated from historical data. All stochastic variables were further correlated based on historical correlations. The risk in forage production has not been included in the analysis. One typical farm from Germany, India, New Zealand, Pakistan, Poland and the United States, respectively was selected for a comparative assessment of risks faced by different diary systems in various regions of the world.
Variability in milk price
The box plot charts display the variation in milk price around the mean, and the minimum and maximum values. The box itself covers the price range of +/-25 percentage points around the mean. Large variations in milk price are observed in Poland and New Zealand. The support price mechanism in the EU and the United States reduces the probability of very low milk prices. Therefore, in Germany and the United States high maximum values are seen while minimum values are close to the mean. In India and Pakistan, milk price variations can be classified as moderate.
Variability in return on investment
Large variations in returns on investment (ROI) are found in the US American and both Asian farms. For these countries, the minimum/maximum results in 2005 stood at about +/-8 percentage points around the mean. As a result of the variation in milk prices, milk yields, feed prices, etc., the ROI for the US American farm ranges between -7 percent and +8 percent. The Polish and New Zealand farms face less risk, as both ROIs stand at +/-5 percentage points around the projected mean. The lowest risk was observed for the German 80-cow farm (ROI +/-2 percentage points).
Risk of a cash flow deficit
Based on forecasts from FAPRI and on assumptions made with regard to prices and inflation rates, the probability of a cash flow deficit for the whole farm was estimated for the situation in 2005. The highest risk of having a serious (20 percent below needs) cash flow deficit occurs for the US American (92 percent) and the New Zealand (44 percent) farms. A moderate cash flow risk is projected for the farm in Germany. The farms IN-22, PK-10 and PL-20 do not risk experiencing a cash flow deficit.
Probability of ’economic success’
This indicator was defined as the return to labour from farming divided by the wage level in the region. In most cases this parameter is correlated with the cash flow indicator. An exception is found for the German farm, which has no chance of covering the regional wage level by working on the dairy farm. The ‘progressive’ farms in Pakistan and India were certain to receive a ‘salary’ above the local wage.
Conclusions
The applied method demonstrates the great variations in risks faced by different farming systems. Although the small-scale farms in Pakistan and India obtain very low milk prices compared with those in the United States and Europe, their price variation is moderate, which contributes to their zero percent probability of experiencing a cash flow deficit.
Explanation of variables and assumptionsFarm codes: Example: DE-80 = 80-cow farm in Germany. The farm data refers to the year 2002, published in the IFCN Dairy Report 2003. Special assumptions Germany: Owing to modelling difficulties (milk yield, quota, cow numbers), the risk in milk yield was not taken into account. ROI in nominal terms: (Entrepreneur profit + estimated interests (on non-land, non-quota assets) + interests on quota + opportunity costs for land (by land rents))/all farm assets. Cash flow deficit: Net cash farm income - family living expenses-principal payments - taxes-average annual investment in the simulation period. Bounds: Red: Cash flow below 80 percent of the cash needs; Green: Cash flow 20 percent above the cash needs; Yellow: Cash flow 80-120 percent of cash needs. Economic success: For the dairy enterprise, the return to labour has been divided by the wage level in the area. If this variable is above 1 the farm covers full economic costs and generates an entrepreneur profit. Bounds: Red: Variable < 0.80. Green: Variable > 1.20. Yellow: Variable between 0.8 and 1.2.
Example for interpretation of stoplight charts: Green = Chance of having no cash flow difficulties. Red = Chance of having cash flow difficulties. Yellow = Moderate cash flow situation.
This study was conducted by T. Hemme, A. Saha and K. Mahmood of the IFCN Dairy Research Center, J. Richardson of the Texas A&M University, E. Kaczocha of the University of Szczecin, Poland, and N. Shadbolt of Massey University, Palmerston North, New Zealand. It was published as ‘What is a dairy farm facing high risk?’ in the IFCN Dairy Report 2004.

© IFCN 2008 151
-10 % 0 % 10 % 20 % 30 %-5 % 5 % 15 % 25 %
US-1710 PL-20DE-80
Legend:
minmeanmax
-5 % 0 % 5 % 10 % 15 % 20 % 25 % 30 %
IN-22 PK-10NZ-246
Return on investment (nominal) for the dairy enterprise
Stoplight charts: Cash flow situation and economic success
0 %
10 %
20 %
30 %
40 %
50 %
60 %
70 %
80 %
90 %
100 %
PK-10IN-22NZ-246PL-20US-1710DE-80
20 % 92 % 100 % 44 %
80 %
8 %
8 %
48 %
100 % 100 %
0 %
10 %
20 %
30 %
40 %
50 %
60 %
70 %
80 %
90 %
100 %
PK-10IN-22NZ-246PL-20US-1710DE-80
100 % 36 % 23 % 59 %
48 % 77 % 14 %
16 % 27 %
100 % 100 %
Variability in milk prices and return on investment
Milk prices: Box plot chart
Probability of a positive cash flow for the whole farm Probability of ‘economic success’ of the dairy enterprise
Milk prices : Box plot chart
10
15
20
25
30
35
PL-20US-1710DE-8010
15
20
25
30
35
IN-22PK-10NZ-246
max
mean
min
50 % box
Return on investment (nominal) for the dairy enterprise
Return on investment Return on investment
Prob
abili
ty
Prob
abili
ty
Red= low, Yellow= moderate, Green= highRed= low, Yellow= moderate, Green= high
US$
/ kg
ECM
US$
/ kg
ECM
5.16 Assessing risks faced by dairy farms

152 © IFCN 2008
Thirty-eight of the 45 interventions increase the return to labour to US$0.12/hour, which is higher than the local wage. In the case of the Fbank (fodder bank) intervention the predicted increase approaches nearly 250 percent. If one considers that women and children are the ones doing the work of dairy farming, this means that these family members would end up with a higher return to labour than that of the household head who works as an agricultural labourer in the area.
In general, the feeding interventions have the highest impact in terms of reducing the risk of achieving a lower return to labour than in the baseline situation. Purchasing livestock insurance for local buffaloes, stall-feeding local buffaloes and joining the local cooperative (which leads to receiving lower milk prices) clearly increases the risk of not even achieving MN-3’s current return to labour.
Risk after combining interventions
Even better results can be achieved by a combination of the dairy development interventions analysed. Improving management and genetic potential can decrease the risk of falling below US$ 0.05/man-hour from 45 percent to practically nil (1 to 2 percent). At the same time, the probability of reaching a return to labour equal to the regional wage level can rise from 0 percent to as much as 84 percent. Hence, the existing and potential interventions can be combined into a programme in such a way that the predominant farm type (MN-3) not only makes attractive profits but also significantly improves its risk profile.
Conclusions
This study clearly shows dairy development interventions can be combined and implemented in a way that significantly increases the dairy farm returns to labour while at the same time improving the risk profile of the same farm type. Both achievements (higher return to labour and reduced farm risks) would certainly drive dairy development forward, particularly in Mahboobnagar (Andhra Pradesh) in India.
Risk is a vital consideration for ranking dairy development programmes. It is possible to implement programmes that both have a significant effect on dairy development and reduce the risk in small-scale dairy farming.
Explanation of variablesFor abbreviations of the 45 dairy development programmes, see Section 5.2 ‘Impact analysis of dairy development programmes in Andhra Pradesh, India’MN-3: a farm with three local buffaloes; Top-MN3: a well-managed, three-buffalo farm; 3-Grade: a well-managed, farm three- grade buffaloes 3-Murrah: a well-managed farm with three-Murrah buffaloes, and so for the five- and ten-Murrah farms. Man hour equivalent: Refers to a standard work hour for an adult man. Labour from other family members was converted into this unit.
This study was conducted by O. Garcia, A. Saha, K. Mahmood and T. Hemme of the IFCN Dairy Research Center and published as ‘Consideration of farm risk and uncertainty in dairy development’ in the IFCN Dairy Report 2006.
Introduction
As a result of increased volatility, it is essential to consider the risks involved when deciding on the best policy alternatives for dairy farms. This means that the analysis should not only consider a static situation but should also incorporate dynamic aspects. The aim of the present study was to incorporate risk and uncertainties in the ranking of dairy development programmes.
Methodology
This study builds on the process of formulating a dairy development strategy for Andhra Pradesh, India (See Sections 5.2 and 5.14). Once the current economics of the target farm type (MN-3) were assessed, a panel of local experts (farmers, extension agents, NGO and government officers, etc.) listed all the major dairy development interventions and activities in the area which might be suitable for the farm in question. The panel then discussed the qualitative and quantitative implications of participation of the selected farm type in each one of the listed initiatives. More than 45 initiatives / programmes were analysed. Finally, the panel reviewed its results and made modifications were it deemed appropriate. ‘Return to labour’ was chosen as the key variable for assessing the impact of the potential dairy development programmes.
Baseline risk
Applying its current dairy production practices the farming family has a 55 percent probability of making a dairy labour return of US$0.05/man-hour or more. Conversely, the family has a 45 percent probability of obtaining a return to labour below this figure.
Risk after single interventions
Most of the dairy interventions analysed reduce the probability of MN-3 making a return to labour below the baseline situation, from 45 percent to a low 10 percent. However, seven interventions increase the probability of MN-3 achieving a lower level of return to labour. It is also interesting to note that approximately five interventions increase the probability of MN-3’s return to labour surpassing the regional wage level by up to 30 percent.
5.17 Incorporating risk in dairy development strategy formulation
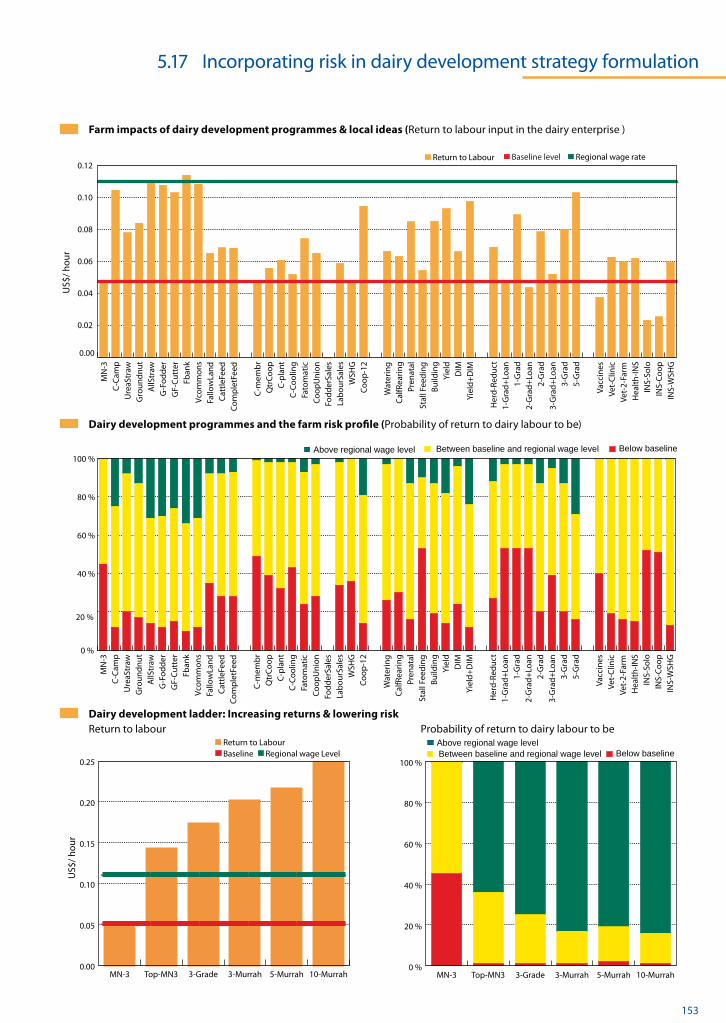
© IFCN 2008 153
0 %
20 %
40 %
60 %
80 %
100 %Above regional wage level Between baseline and regional wage level Below baseline
INS-
WSH
GIN
S-C
oo
pIN
S-So
loH
ealt
h-I
NS
Vet-
2-Fa
rmVe
t-C
linic
Vacc
ines
5-G
rad
3-G
rad
3-G
rad
+Lo
an2-
Gra
d2-
Gra
d+
Loan
1-G
rad
1-G
rad
+Lo
anH
erd
-Red
uct
Yiel
d+
DIM
DIM
Yiel
dB
uild
ing
Stal
l Fee
din
gPr
enat
alC
alfR
eari
ng
Wat
erin
g
Co
op
-12
WSH
GLa
bo
urS
ales
Fod
der
Sale
sC
oo
pU
nio
nFa
tom
atic
C-C
oo
ling
C-p
lan
tQ
trC
oo
pC
-mem
br
Co
mp
letF
eed
Cat
tleF
eed
Fallo
wLa
nd
Vco
mm
on
sFb
ank
GF-
Cu
tter
G-F
od
der
AllS
traw
Gro
un
dn
ut
Ure
aStr
awC
-Cam
pM
N-3
0 %
20 %
40 %
60 %
80 %
100 %
10-Murrah5-Murrah3-Murrah3-GradeTop-MN3MN-3
Above regional wage levelBetween baseline and regional wage level Below baseline
0.00
0.02
0.04
0.06
0.08
0.10
0.12 Baseline level Return to Labour Regional wage rate
INS-
WSH
GIN
S-C
oo
pIN
S-So
loH
ealt
h-I
NS
Vet-
2-Fa
rmVe
t-C
linic
Vacc
ines
5-G
rad
3-G
rad
3-G
rad
+Lo
an2-
Gra
d2-
Gra
d+
Loan
1-G
rad
1-G
rad
+Lo
anH
erd
-Red
uct
Yiel
d+
DIM
DIM
Yiel
dB
uild
ing
Stal
l Fee
din
gPr
enat
alC
alfR
eari
ng
Wat
erin
g
Co
op
-12
WSH
GLa
bo
urS
ales
Fod
der
Sale
sC
oo
pU
nio
nFa
tom
atic
C-C
oo
ling
C-p
lan
tQ
trC
oo
pC
-mem
br
Co
mp
letF
eed
Cat
tleF
eed
Fallo
wLa
nd
Vco
mm
on
sFb
ank
GF-
Cu
tter
G-F
od
der
AllS
traw
Gro
un
dn
ut
Ure
aStr
awC
-Cam
pM
N-3
Farm impacts of dairy development programmes & local ideas (Return to labour input in the dairy enterprise )
US$
/ hou
r
US$
/ hou
r
Dairy development ladder: Increasing returns & lowering risk Return to labour Probability of return to dairy labour to be
Dairy development programmes and the farm risk profile (Probability of return to dairy labour to be)
0.00
0.05
0.10
0.15
0.20
0.25
10-Murrah5-Murrah3-Murrah3-GradeTop-MN3MN-3
BaselineReturn to Labour
Regional wage Level
5.17 Incorporating risk in dairy development strategy formulation
154 © IFCN 2008
5.18 Carbon footprints of dairy farming systems
Carbon footprints of dairy farming systems
In the chart, the emissions per 100 kg of milk from the typical 80-cow farm in Germany are taken as point of reference (= 100). Half of the farm types analysed had carbon footprints of +/- 20 percentage points with respect to the reference farm. The low-yield farming systems in Africa and South Asia showed the highest carbon footprints per 100 kg of milk, while high-yield farming systems showed significantly lower emissions.
Emission by types of gases
The most important gas was methane (CH4), which contributed 50 to 70 percent of the greenhouse gas emissions calculated as CO2 equivalents. The emissions from N2O and CO2 together accounted for 30 to 50 percent of total emissions. The amounts of N2O and CO2 varied, depending on emissions from manure handling and on the amount of purchased feed, fertilizer and energy use.
Emission by activities
The main source of GHG emissions was the digestion in the rumen, which accounted for about 50 to 70 percent of the total. Therefore the key determinant of the carbon footprints of dairy systems is milk production by body weight, i.e. the higher the milk production per kg bodyweight (weight productivity), the lower the carbon footprints. Therefore, low-yield dairy farming systems have more emissions per kg of milk than high-yield systems. Depending on the farming system, the next-ranked sources of GHG emission were manure handling and storage at 10 to 20 percent, the volume of purchased feed at 5 to 10 percent, and fertilizer use at up to 10 percent. The use of energy in the form of electricity and fuel accounted for only 5 to 10 percent of GHGs.
Conclusion
This study represents a first attempt to estimate the carbon footprints of dairy farming systems on the basis of IFCN’s farm data. The strength of the approach does not lie in producing exact carbon footprints, but in providing a range in which the footprints could fall. The results show significant differences among farm types and indicate that ‘weight productivity’ is the key determinant.
Explanation of variablesSources: IPCC (2007), FAO (2006) ,Kirchgeßner et al (1992)’. Sector estimate based on IPCC: Greenhouse gases agriculture = 13.5 percent, all cattle = 7 percent, share of dairy cattle in total cattle population = 35 percent (calculation based on FAO cattle numbers), -> dairy cattle contribute 2.5 percent of greenhouse gases. Carbon footprints from deforestation not included for dairy farming. Sector estimate based on FAO: Greenhouse gases livestock = 18 percent, approximately 6 percent points arise from deforestation, which means the residual is 12 percent. Assuming, similar to the IPCC, that cattle contribute 52 percent and dairy cattle account for 35 percent of the total cattle population means that dairy cattle contribute 2.2 percent of all global greenhouse gas emissions. Coefficients of CO2 equivalents: 1 kg CO2 = 1 kg CO2 ; 1 kg CH4 = 23 kg CO2 ; 1 kg N2O = 296 kg CO2. This study was conducted by H. Bendfeld, M. Hagemann and T. Hemme of the IFCN Dairy Research Center and published as ’Carbon footprints of dairy farming systems in 38 countries’ in the IFCN Dairy Report 2008.
Introduction
As climate change has gained in prominence in the international debate environmental sustainability and greenhouse gas (GHG) emissions of dairy farming systems are becoming increasingly important aspects of dairy production, even for small-scale systems. Measurement and attribution of GHG emissions is challenging and the aim of the present study was to initiate the development of a methodology to estimate GHG emissions from typical dairy production systems. Because dairy cows are seen as a major contributor of global GHG emissions, an attempt was made to estimate their share in the global total.
Methodology
Estimates of the contribution of dairy farming to global GHG emissions were made based on IPCC and FAO reports. For details, see the explanations below. The estimates of GHG emissions by dairy farming system draws on the IFCN database of typical dairy farms and uses key variables such as number of cows, number of heifers, milk yield, use of fertilizer, electricity, fuel and purchased feed, and live weight of cows. Ratios such as amounts of fuel or of compound feed used per 100 kg of milk were then derived from these figures. Next, emissions of CO2, CH4 and N2O were estimated. For example, the CH4 emission from the rumen was estimated based on the function CH4 (kg) = 55 + 4.5* milk yield per day (kg milk/cow/day) + 1.2 * (metabolic weight) (Kirchgessner et al., 1992). Similarly, gas emissions from manure handling, concentrates, fuel and energy use, fertilizer production, buildings and machinery, etc. were estimated and attributed to the system. This approach thus includes the GHG emissions from purchased feed, heifer raising, and all inputs used.Moreover the analysis has considered the output of beef and livestock from the dairy farm as credits. GHGs from (long-distance) transport of concentrates, replacement heifers reared on other farms were not considered in this analysis. Finally, the emissions of the different gases were converted into CO2 equivalents by using the coefficients shown below. Forty-six typical dairy farms in 38 countries were included in for the analysis.
Global carbon footprint of milk production
The two simple calculations of global share of GHG emissions from dairy farming, based on IPCC and FAO data indicate that dairy cows contribute between 2.2 and 2.5 percent of all global GHG emissions. It should be noted that these figures are based on very simple calculations and do not attribute deforestation to dairy farming

© IFCN 2008 155
Digestion Manure Fertilizer Energy Purchase feed Others
range +/- 20%
Global sources of carbon emissions Global sources of carbon emissions
Emission by activities Emission by gases ‘Weight productivity’
5.18 Carbon footprints of dairy farming systems
Source: IPCC Report 2007. Source: Estimates IFCN 2008.
Carbon footprints of 46 typical dairy farms from 38 countries
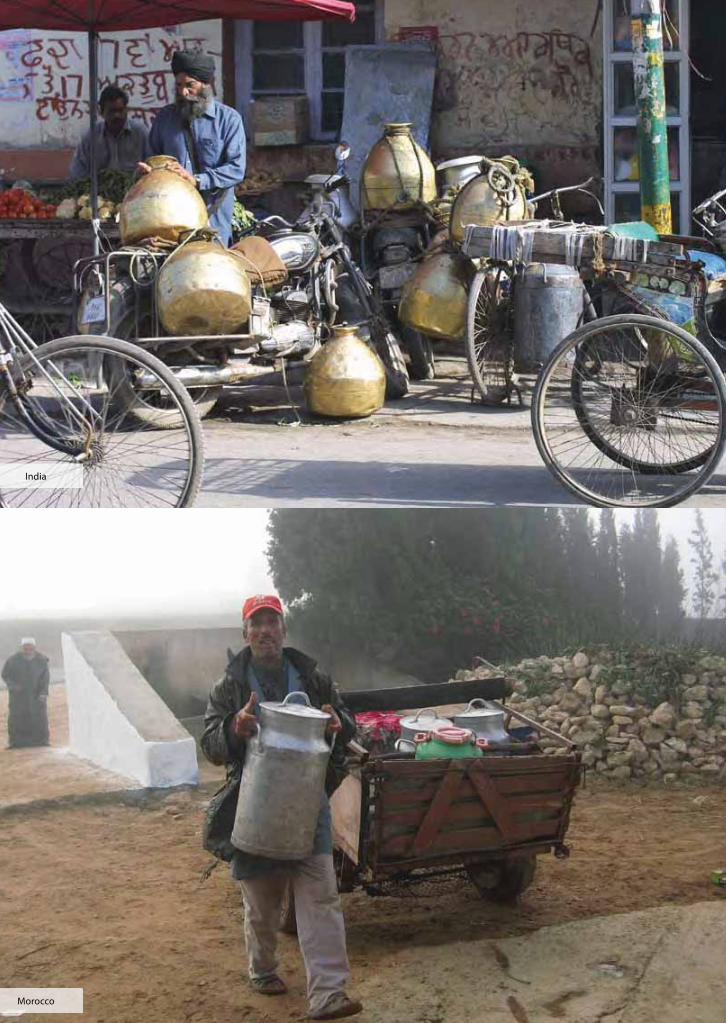
India
Morocco

Pakistan
Thailand

China

Chapter 6Conclusions and recommendations for smallholder dairy development
Pictures on this and previous double page: Transportation (Pictures by: Torsten Hemme, Otto Garcia and Katja Seifert)

160 © IFCN 2008
6 Conclusions and recommendations for smallholder dairy development
Strengths
Low production costs: despite their low-yield farming systems, smallholder dairy farmers are among the world’s lowest-cost milk producers.
High farm income margins: with very few exceptions, smallholders achieve comparatively high farm income margins (20 to 65 percent) on their farm returns.
Low liabilities: except for China, smallholders in all the developing countries covered by the study operate their dairy farms with less than 10 percent liabilities.
Low liquidity risk: smallholders incur low production costs and face little risk of cash flow deficits for the dairy enterprise.
Relative resilience to rising feed prices: as a general rule, small-scale farming systems use only small amounts of purchased feed. As a result, they are more resilient to price fluctuations for dairy feed compared with their larger-scale high-input/high-yield competitors (mainly in developed countries).
Summing up: small-scale dairy farming systems are cost-competitive and resilient to market fluctuations/shocks, which gives them a unique opportunity to serve as a competitive source of milk supply.
Weaknesses
Lack of knowledge and technical know-how: smallholders lack the skills to manage their farms as ‘enterprises’
Poor access to support services: farmers in developed countries have access to support services ranging from production and marketing advice to support in family issues, which enables them to focus on what they do best and to buy-in the knowledge and skills they lack. Such services are usually lacking in developing countries or are difficult for small-scale farmers to gain access to.
Low capital reserves and limited access to credit: the household absorbs the dairy income to cover its basic needs, leaving the farm with little or no capital to reinvest in the dairy enterprise or other profitable activities. Formal financial institutions tend to consider smallholders as high-risk/low-return clients. Therefore, as a general rule, the only way for smallholders to obtain credit is to resort to local moneylenders with their high interest rates.
Low (labour) productivity: small herd sizes, which do not warrant investments in labour-saving equipment, combined with low milk yields result in poor labour productivity on smallholder dairy farms.
Conclusions
It is estimated that some 12-14 percent of the world population, or 750 to 900 million people, live on dairy farms or within dairy farming households. According to a recent report (Chen and Ravallion, 2008), in 2005 about 2.6 billion people in the developing world (48 percent of the total population) were surviving on less than US$2 per day and about 149 million farm households, mostly smallholders, kept livestock for the purpose of producing milk for self-consumption or sale. Against this background, the current study set out to assess whether:
small-scale milk production can contribute to significantly reducing poverty and improving nutrition and food security; and
small-scale milk producers will be able to compete with large-scale, capital-intensive ‘high-tech’ dairy farming systems, such as those in the USA and other developed countries.
The various analyses and case studies conducted indicate that:
small-scale milk production not only improves the food security of milk-producing households but also helps to create numerous employment opportunities throughout the entire dairy chain, i.e. for small-scale rural processors and intermediaries. As such, dairy development may serve as a powerful tool for reducing poverty and creating wealth in rural areas; and
as small-scale milk producers incur low production costs, if well organized, they should be able to compete with large-scale, capital-intensive ‘high-tech’ dairy farming systems in developed countries.
Given the increasing ‘interconnectedness’ of global agriculture, the ability of smallholder milk producers to participate in the dairy market in a profitable manner depends not only on their own competitiveness, mainly determined by their production costs, but also on the efficiency of the dairy chains to which they belong. Therefore, recommendations for smallholder dairy development must perforce include strategies to develop and increase competitiveness in all segments of the dairy chain, namely, input supply, milk production, processing, distribution and retailing.
The best way to plan and subsequently implement any dairy development strategy for smallholders is to use a practical, step-by-step approach that breaks the complex task down into manageable components to be addressed in a logical sequence. The SWOT (strengths, weaknesses, opportunities, threats) analysis is a strategic planning tool widely used for ex ante assessments of projects or business ventures. Based on the information collated in this publication, a SWOT analysis of smallholder dairy farming identifies the following:

© IFCN 2008 161
6 Conclusions and recommendations for smallholder dairy development
Poor milk quality: the practices and conditions under which smallholders and their dairy chains operate make it difficult to deliver high-quality milk to dairy plants.
Summing up: the overall weakness of small-scale dairy farmers is that they have been unable so far to take advantage of existing market opportunities.
Opportunities
Growing consumer demand for dairy products in developing countries: driven by population growth and rising per capita consumption, the demand for dairy products in developing countries is increasing rapidly.
Likelihood of increased milk prices: there is an indication that, in the long run, world market prices for dairy products will be higher than in 1996-2005. This will generate opportunities for dairy farming in general.
Major potential to increase labour productivity: while labour productivity on smallholder dairy farms is currently low, it could be easily improved (above local wage rates) by adopting better farm management practices, expanding dairy herd sizes and increasing milk yields.
Potential to increase milk yields: milk yields from smallholder dairy systems are generally rather low. However, there is significant potential for increasing yields and thereby boosting production efficiency, for example, by means of better feed rations, improved farm management practices, genetic upgrading, etc.
Employment generation: compared with many other agricultural activities such as growing rice or wheat, milk production and small-scale processing are labour-intensive. This means that a significant number of employment opportunities could be generated along dairy chains in rural areas.
Summing up: significant opportunities for improving both demand (quantity and price of milk) and supply (major potential for improving the farming systems) appear to exist, which smallholder dairy farmers could tap into.
Threats
Policy support for dairy farmers in OECD countries: massive policy interventions (price support, milk quotas, direct payments, investment support programmes, export subsidies, etc.) in developed countries create a competitive advantage for the OECD dairy sector. This penalizes dairy farmers in developing countries, where governments cannot afford to provide such policy support and are without the means to implement other protective measures to create a level ‘playing field’.
Exposure to competitive business forces: trade liberalization increasingly exposes smallholder dairy farmers to competition from large-scale corporate dairy enterprises that are able to more rapidly respond to changes in the market environment and with greater flexibility.
Under-investment in dairy chain infrastructure: development of a sustainable ‘milk shed’ requires both a long-term perspective and substantial investments in the organization of the dairy supply chain. The risk is that initial investors may lose a large share of benefits accruing from their investments in the event other milk processors are able to take advantage of established infrastructures and simply give farmers better milk prices. This may discourage potential investors, to the detriment of smallholders.
Unsuitable dairy development plans: from our observations, the majority of public dairy development plans tend to follow ‘fashions’ rather than a structured and strategic approach. The failure of any dairy development programme reduces the willingness of government organizations and NGOs to provide resources for dairy development projects.
Environmental concerns: low-yield dairy systems in Africa and South Asia are estimated to have higher carbon footprints per 100 kg of milk produced than high-yield systems in the USA and Western Europe. The question of environmental sustainability is gaining ever-greater importance in agriculture, and the regulation of greenhouse gas emissions may pose a threat to smallholder systems.
Increasing consumer demand for food safety: consumers in developing countries are becoming increasingly aware of food safety issues. The low milk volumes produced by smallholders lead to relatively high costs for meeting milk quality standards in view of the high fixed costs for dairy equipment investments. However, there are ways for smallholders to produce high-quality milk while at the same time containing production costs, an example being the village milk-quality project in Karnataka, India.
Succession on dairy farms: it was found that farmers who had established a successful dairy enterprise had normally generated some wealth, part of which was usually invested in better education for their children. As a result, it is financially more attractive and more prestigious for the successive generation to seek alternative employment outside the sector rather than to develop the dairy farm into its next phase. Therefore, the dairy sector may well lose well-educated farmers with the necessary capital for further dairy development.
Increasing local wage rates: labour costs become a constraint for small-scale dairy farmers when increases in dairy labour productivity do not match rising wage levels in their respective area. In that case, small-scale dairy farming becomes uncompetitive on the labour market.
Summing up: most of above-mentioned threats explain why small-scale dairy farming is not reaching its full potential. The last four threats in particular may constitute a significant challenge to small-scale milk production systems in the future.

162 © IFCN 2008
Recommendations
Global milk demand is growing by 15 million tons per year, mostly in developing countries. Once this increased volume of milk is being produced by small-scale dairy farmers, approximately 3 million jobs per year may be created in primary production. This presents a unique opportunity for building up a sustainable dairy chain that sources milk from smallholder dairy farmers to meet not only the demands of local consumers but also those of the world market. While capitalizing on this opportunity could generate significant wealth in rural areas and provide benefits to all stakeholders involved in the dairy value chain, it calls for a sound dairy development strategy.
To be successful, any dairy development strategy should be based on the principle of ‘creating value’ in every segment of the dairy chain. This means that every player in the chain (farmer, farm input supplier, milk traders, processors, retailers, etc.) makes a profit, i.e. the returns are higher than the costs. A well-functioning dairy chain also provides benefits to the consumer: she/he will be able to obtain more dairy products for the same amount of money or will need to spend less for the dairy products she/he consumes.
The formulation of a dairy development strategy is a complex task that involves a large number of stakeholders and calls for careful sequencing:
Status quo analysis: the first step would be a status quo analysis of the dairy region of interest. This should include a review of development trends in milk production, current economics of the prevailing dairy farming system(s) and configuration of the dairy chain. An assessment of the milk production potential under certain conditions will be needed, and it would be useful also to compare the dairy region of interest with other dairy regions. This would facilitate the analysis of the status quo and identification of the (relative) strengths and weaknesses, threats and opportunities of the region.
Stakeholder consultation: a critical issue here is to agree on goals for each segment of the dairy chain that ‘fit together’ and are mutually supportive. Once the strategic goals (especially of farmers and processors) are in line with each other, it would be desirable for local governments, NGOs and other potential partners to become involved and their capacities and roles in supporting the development process be considered.
Ex ante assessment of dairy development programmes: before implementing any specific dairy development programme, a systematic ex ante assessment should be made of all aspects of the envisaged programme. This assessment should explore the benefit(s) and risks the programme would create for the target beneficiaries and identify elements that ensure the best input/output ratio. If systematically carried out, this step would significantly improve returns to investments in dairy development.
Risk management: given the increasing volatility of milk and feed prices, there is a pressing need to incorporate risk management systems into dairy development strategies. This is especially important for the dairy farmers once they move from small-scale/low-yield operations to larger farms with more intensive production practices.
Monitoring, evaluation and continuous strategy improvement: the world is rapidly evolving, and agricultural development is very dynamic with regard to farm structure, input prices, prices for milk and dairy products, consumer perceptions, etc. It is therefore not sufficient to start a dairy development programme with a sound strategy: it is also necessary to constantly re-assess the chosen strategy against changing external factors. A strategy that was successful in the past might lead to failure in the future.
There is a need for regular evaluations of each part of the dairy chain in a ‘milk shed’, and for comparison with counterparts in other dairy regions. This calls for professionals with backgrounds in dairy supply chain management and dairy farm economics. The knowledge created through such comparative studies should be translated into continuous adaptation of the dairy chain to changing circumstances so as to ensure the future prosperity of all the actors involved in the dairy sector.
6 Conclusions and recommendations for smallholder dairy development

© IFCN 2008 163
6 Conclusions for Small Holder Milk Production
India
Thailand
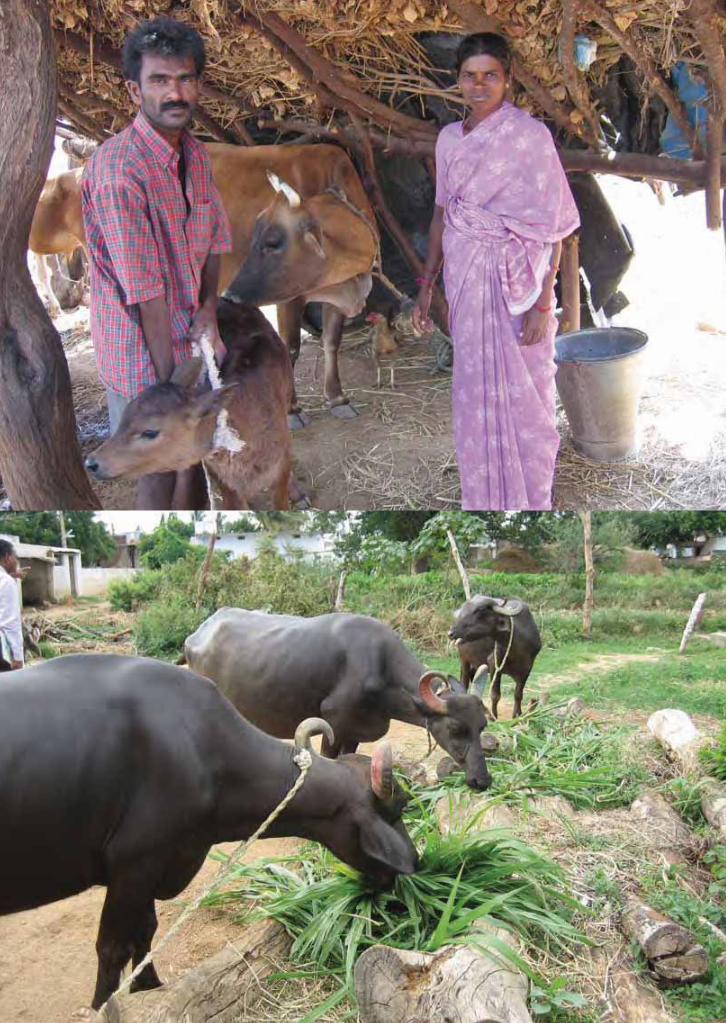
164 © IFCN 2008

© IFCN 2008 165
7 References
CHEN S AND RAVALLION M (2008): The Developing World Is Poorer Than We Thought, But No Less Successful in the Fight against Poverty. Washington, D.C.: World Bank (Policy Research Working Paper 4703).
FAO (2006): Livestock’s long shadow - Environmental issues and options, Rome, Italy
HEMME T (2000): IFCN - A concept for international analysis of the policy and technology impacts in agriculture. Ein Konzept zur international vergleichenden Analyse von Politik- und Technikfolgen in der Landwirtschaft. Landbauforschung Völkenrode, Sonderheft 215, Braunschweig. (Dissertation)
IPCC (2007): Intergovernmental Panel on Climate Change (IPCC): Climate Change 2007: Synthesis Report. Summary for Policymakers, Valencia: 2007a.
ISERMEYER F (1988): Produktionsstrukturen, Produktionskosten und Wettbewerbsstellung der Milchproduktion in Nordamerika, Neuseeland und der EG, Wissenschaftsverlag Vauk, Kiel.
KIRCHGESSNER ET AL (1992): Tierernährung, 8. Auflage, Frankfurt/Main, Verlag DLG.
MONKE E A AND PEARSON S R (1989): The policy analysis matrix for agricultural development. Cornell University Press, Ithaca and London.
RICHARDSON J W AND NIXON C J (1986): Description of Flipsim V: A General Firm Level Policy Simulation Model. Agricultural & Food Policy Center, Department of Agricultural Economics, Texas Agricultural Experiment Station, USA.
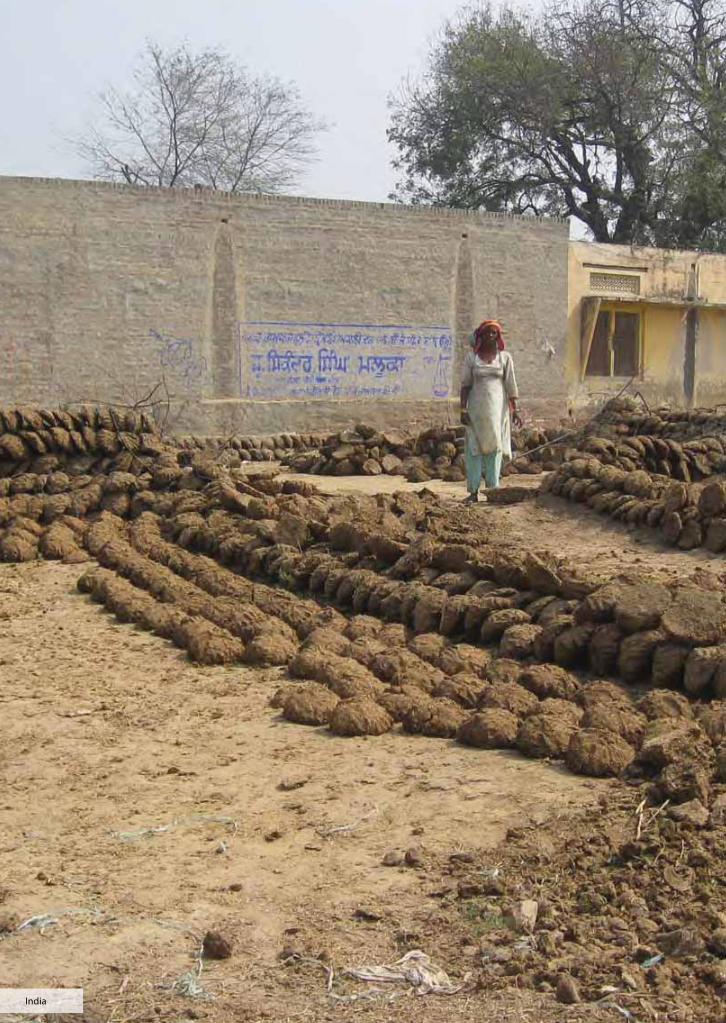
India

Annexes
Pictures on this and previous double page: Manure handling (Pictures by: Torsten Hemme and Katja Seifert)
A1 The International Farm Comparison Network (IFCN) 168
A2 FAO’s Pro-Poor Livestock Policy Initiative (PPLPI) 169
A3 Further reading / papers by IFCN and PPLPI 171
A4 Researchers who have contributed 172
A5 Farm description 176
A6 Description of data collection for typical dairy farms 178
A7 Exchange rates 1996 – 2007 179
A8 Assumptions for the calculations – farm economic indicators 180

168 © IFCN 2008
What is IFCN?
IFCN stands for International Farm Comparison Network and has the vision to develop a global research network which links farm economic researchers. The Dairy branch of the IFCN was founded in 1997 and is well established. Our mission is to create a better understanding of milk production world-wide.
Why is the IFCN useful for a dairy region?
To have a prospering dairy region, a clear strategy of all stakeholders is required. The participation in IFCN provides information about the global developments of the dairy sector and the competitive position of a dairy region in it. Moreover, it identifies potential points for improvement.
What are the values of the IFCN?
IFCN is an open scientific system for the exchange of ideas and the creation of knowledge. IFCN is independent from third parties (policy makers, lobby groups, industry) and committed to truth, science and reliable results.
What are the IFCN research activities?
Global benchmarking of dairy farming systems Monitoring of prices and farm structure Analysing dairy farm and dairy sector developments Supporting dairy development in specific regions Policy impact analysis
What are the priorities in IFCN?
1. Sustainability of the network infrastructure. 2. Reliability of data and quality of the results. 3. Inclusion of more countries and farms. 4. In-depth analysis and special projects.
How is the IFCN organised?
The IFCN Dairy Research Center, being linked to Kiel University, coordinates the scientific work and provides a professional management for the network. The network co-ordination is mainly funded by the consortium fees from the participating research organisations, partnership with agribusiness and institutional partners. All partners have agreed on the vision, mission, values and priorities of IFCN.
Who benefits from the IFCN work?
1. Dairy farmers: Dairy farmers benefit from knowing about their competitiveness in a globalized dairy world. Moreover, they get access to information about alternative production systems.
2. Milk processors: Information about the production costs in specific milk regions is a key element for the competitiveness of the milk processor.
3. Farm input suppliers: Information about farm economics and global dairy developments are very good tools to guide strategic discussion and decisions within the company.
4. Policy makers: The link with the IFCN knowledge provides the policy makers with facts and figures for political discussions. Moreover, the IFCN tools permit the evaluation of alternative policy scenarios.
5. Research organisations: Cooperation with IFCN offers access to methods, models and data which increases the capacity in dairy research and teaching.
Partnership with the IFCN network
The IFCN offers different kinds of partnership for the various stakeholders of the dairy chain.
Research partnership
The participation in the IFCN is based on the win-win idea and offers 2 levels of partnership: A) Associated Partner and B) Consortium Partner. So far researchers / institutions from over 70 countries have joined the IFCN.
Agribusiness partnership
For agribusiness companies the IFCN provides access to its knowledge in various forms such as reports, conferences, e-mail hotline, newsletter, power-point material, etc. The IFCN offers two levels of partnership: A) Main supporting partners for one company per branch and B) IFCN Supporter status. So far more than 60 companies have become partners of the IFCN.
A.1 The International Farm Comparison Network (IFCN)
© IFCN 2008 169
A.2 FAO’s Pro-Poor Livestock Policy Initiative (PPLPI)
With the adoption of the Millennium Development Goals, the international community made the eradication of extreme poverty and hunger one of its primary targets. Livestock contribute to the livelihoods of an estimated 70% of the world’s 800 million rural poor by providing a small but steady stream of food and income, raising whole farm productivity, increasing assets and diversifying risks. Livestock also have an important role in improving the nutritional status of low-income households, confer status, are of cultural importance, and create employment opportunities within and beyond the immediate household.
The increasing demand for animal protein in low- and middle-income countries provides an opportunity for the rural poor to improve their livelihoods. However, the nature of livestock farming is determined by policy and institutional frameworks that rarely favour of the poor. Therefore, in 2001, the Food and Agricultural Organisation (FAO) of the United Nations launched the Pro-Poor Livestock Policy Initiative (PPLPI) to facilitate and support the formulation and implementation of livestock-related policies and institutional changes that have a positive impact on the world’s poor. To achieve this goal, the Initiative combines stakeholder engagement with research and analysis, information dissemination, and capacity strengthening.
A central facility of the PPLPI, funded by the UK Department for International Development, has been established at FAO headquarters in Rome with the responsibility of guiding and co-ordinating the Initiative’s activities, and with the ambition to become a point of reference for livestock-related pro-poor policy development. In order to cover the different levels of policy-making, extending from international, through regional and national to sub-national levels, and to engage directly with relevant stakeholders, the Initiative complements the work of the central facility with active participation in selected policy processes in a number of strategically chosen ‘focus countries’.
Livestock sector development has far-reaching externalities that give rise to conflict at many levels. Global concerns are increasingly influencing national agendas, while national concerns may become the subject of international debate. Informed public policy-making is therefore becoming increasingly complex, and the processes of negotiation around livestock and public goods issues need to be adapted such that they combine stakeholder engagement and negotiation with research and analysis. To assist policy makers in tackling poverty through evidence-based policy and institutional reforms the PPLPI compiles information on livestock–poverty relationships and conducts and commissions research in four interrelated thematic areas.
The first thematic area encompasses the role of livestock in the household, community, and in national economies. A clear understanding of the role of livestock at various levels is essential to appreciate the choices made by the various actors at these levels, and to identify development pathways that are most likely to offer pro-poor benefits.
Second, the PPLPI conducts research into the political economy of livestock sector-related policy making. A detailed appreciation of actual vs. stated policies, their impacts, and the interests and influence of various players is a prerequisite for the project’s engagement in policy and institutional reform processes.
The third thematic area relates to markets and standards, which are key determinants of the balance between subsistence and market-oriented production. Markets provide the crucial link between sectors and sub-sectors and between rural and urban populations. Linking poor livestock keepers to expanding urban markets is likely to be one of the most promising avenues for rural poverty reduction.
The fourth major thematic area covers livestock services. These constitute a wide variety of basic inputs to livestock production, such as feeds, dugs, health services, credit and insurance, which are often not accessible to poor livestock keepers.
The PPLPI compiles information and conducts research and analysis relevant to these themes both in support of specific policy processes in selected countries, and generically, to enhance decision-making by the national and international livestock and rural development communities.

170 © IFCN 2008China

© IFCN 2008 171
A.3 Further reading / papers by IFCN and PPLPI
IFCN method in general
HEMME T (2000): IFCN - A concept for international analysis of the policy and technology impacts in agriculture. Ein Konzept zur international vergleichenden Analyse von Politik- und Technikfolgen in der Landwirtschaft. Landbauforschung Völkenrode, Sonderheft 215, Braunschweig. (Dissertation)
Important IFCN publications 1996 - 2005
IAAE: HEMME T, CHRISTOFFERS K, DEEKEN E (2003): Competitiveness of Dairy Farming - Farm Level Analysis of 21 Countries (IFCN). Poster Presentation at International Conference of Agricultural Economists (IAAE), Durban, South Africa
AAEA: OCHOA RF, ANDERSON, DP, KNUTSON RD, HEMME T (1999): International Farm Level Competitiveness in Dairy. Annual meeting, American Agricultural Economics Association (AAEA), Nashville/Tennessee, USA
EAAE: REYES E, MILÁN MJ, BAUCELLS J, CALSAMIGLIA S (2002): An evaluation of the financial performance of Spanish dairy farms using IFCN methodological approach. Poster presentation at 10th Congress of the European Association of Agricultural Economists (EAAE)– August 2002 in Zaragoza Spain
GEWISOLA: HEMME T, DEBLITZ C, GOERTZ D, ISERMEYER F, KNUTSON RD, ANDERSON DP (1998): Politik und Technikfolgenanalysen für typische Betriebe im Rahmen des »International Farm Comparison Network (IFCN)«. Schr Ges Wirtsch Sozialwiss Landbau 35:157-164, German Association of Agricultural Economist conference (GEWISOLA) 30.9. - 2.10.1998
BUIATRICS: HEMME T (2002): Comparison of dairy farming systems world-wide. Poster at XXII World Buiatrics Congress: Hanover, Germany, 18-23 August 2002; abstracts, pp 1
HEWPEM: SAHA A, HEMME T (2003): Technical Efficiency and Cost Competitiveness of Milk Production by Dairy Farms in Main Milk Producing Countries. Paper at 2nd Hellenic Workshop on Productivity & Efficiency Measurement (HE.W.P.E.M.), Athens Greece 30.5 - 1. 6.2003.
IDF: HEMME T, HOLZNER J (2001): Costs of milk production: A world-wide study (invited paper) at IDF – International Dairy Federation- World Dairy Summit: Farming Conference; Farming for Profit from Fresh Pasture; Auckland, New Zealand, 27.10. - 1.11.2001 / Proceedings. Brussels, Belgium: International Dairy Federation
IDF: HEMME T ET AL. (2003): (R)evolution dairy farming, (invited paper) at IDF – International Dairy Federation – World Dairy Summit & Centenary, conference on The Dairy (R)evolution - 100 years of change. Brugge 7-12 September 2003
IFMA: HEMME T, DEEKEN E (2005): Selected results of the IFCN Dairy Network. Milk prices and costs of milk production in 2003. In: 15th Congress of the International Farm Management Association, 14-19 August 2005, Campinas, Sao Paulo, Brazil
IAMA: HEMME T (2006): IFCN Dairy Network. Invited paper at IAMA (International Food and Agribusiness Management Association) 16th Annual World Forum and Symposium, June 10-13, 2006 Buenos Aires
EAAP: HEMME T (2006): Global trends in beef and dairy production. Invited paper at EAAP European Federation of Animal Science, Cattle workshop, 15.09.2006, Antalya, Turkey
IAMO: RAMANOVICH M, HEMME T (2006): How competitive is milk production in the Central and Eastern European countries in comparison to Western Europe? In: Agriculture in the Face of Changing Markets, Institutions and Policies, Challenges and Strategies, Studies on the Agricultural and Food Sector in Central and Eastern Europe, Vol. 33, pp. 271-282, IAMO, Halle, Germany
FAO publications
GARCIA, O.; HEMME, T.; REIL, A.; STOLL, J. (2007) Predicted Impact of Liberalisation on Dairy Farm Incomes in Germany, Vietnam, Thailand and New Zealand. FAO-PPLPI Working Paper 42. http://www.fao.org/ag/againfo/programmes/en/pplpi/docarc/execsumm_wp42.pdf http://www.fao.org/ag/againfo/programmes/en/pplpi/docarc/wp42.pdf
GARCIA, O.; SAHA, A.; MAHMOOD, K.; NDAMBI, A.; HEMME, T. (2006) Policies Dairy Development Programs in Andhra Pradesh, India: Impacts and Risks for Small-scale Dairy Farms. FAO-PPLPI Working Paper 38. http://www.fao.org/ag/againfo/programmes/en/pplpi/docarc/execsumm_wp38.pdf http://www.fao.org/ag/againfo/programmes/en/pplpi/docarc/wp38.pdf
GARCIA, O.; GOMEZ, C.A. (2006) The Economics of Milk Production in Cajamarca, Peru, with Particular Emphasis on Small-scale Producers. FAO-PPLPI Working Paper 34. http://www.fao.org/ag/againfo/programmes/en/pplpi/docarc/execsumm_wp34.pdf; http://www.fao.org/ag/againfo/programmes/en/pplpi/docarc/wp34.pdf
GARCIA, O.; HEMME, T.; TAT NHO, L.; THI HUONG TRA, H. (2006) The Economics of Milk Production in Hanoi, Vietnam, with Particular Emphasis on Small-scale Producers. FAO-PPLPI Working Paper 33. http://www.fao.org/ag/againfo/programmes/en/pplpi/docarc/execsumm_wp33.pdf http://www.fao.org/ag/againfo/programmes/en/pplpi/docarc/wp33.pdf
GARCIA, O.; HEMME, T.; ROJANASTHIEN, S.; YOUNGGAD, J. (2005) The Economics of Milk Production in Chiang Mai, Thailand, with Particular Emphasis on Small-scale Producers. FAO-PPLPI Working Paper 20. http://www.fao.org/ag/againfo/programmes/en/pplpi/docarc/execsumm_wp20.pdf http://www.fao.org/ag/againfo/programmes/en/pplpi/docarc/wp20.pdf
GARCIA, O.; MAHMOOD, K.; HEMME, T. (2003) A Review of Milk Production in Pakistan with Particular Emphasis on Small-scale Producers. FAO-PPLPI Working Paper 3. http://www.fao.org/ag/againfo/programmes/en/pplpi/docarc/execsumm_wp03.pdf; http://www.fao.org/ag/againfo/programmes/en/pplpi/docarc/wp3.pdf
HEMME, T.; GARCIA, O.; KHAN, A.R. (2004) A Review of Milk Production in Bangladesh with Particular Emphasis on Small-scale Producers. FAO-PPLPI Working Paper 7. http://www.fao.org/ag/againfo/programmes/en/pplpi/docarc/execsumm_wp07.pdf http://www.fao.org/ag/againfo/programmes/en/pplpi/docarc/wp7.pdf
HEMME, T.; GARCIA, O.; SAHA, A. (2003) A Review of Milk Production in India with Particular Emphasis on Small-scale Producers. FAO-PPLPI Working Paper 2. http://www.fao.org/ag/againfo/programmes/en/pplpi/docarc/execsumm_wp02.pdf http://www.fao.org/ag/againfo/programmes/en/pplpi/docarc/wp2.pdf
KNIPS, V. (2006) Developing Countries and the Global Dairy Sector, Part II: Country Case Studies. FAO-PPLPI Working Paper 31. http://www.fao.org/ag/againfo/programmes/en/pplpi/docarc/execsumm_wp31.pdf; http://www.fao.org/ag/againfo/programmes/en/pplpi/docarc/wp31.pdf
KNIPS, V. (2005) Developing Countries and the Global Dairy Sector, Part I: Global Overview. FAO-PPLPI Working Paper 30. http://www.fao.org/ag/againfo/programmes/en/pplpi/docarc/execsumm_wp30.pdf; http://www.fao.org/ag/againfo/programmes/en/pplpi/docarc/wp30.pdf
STAAL, S.J.; NIN PRATT, A.; JABBAR, M. (2008) Dairy Development for the Resource Poor - A Comparison of Dairy Policies and Development in South Asia and East Africa. (3 part series) FAO-PPLPI Working Paper 44. http://www.fao.org/ag/againfo/programmes/en/pplpi/docarc/execsumm_wp44.pdf Part 1: A Comparison of Dairy Policies and Development in South Asia and East Africa. http://www.fao.org/ag/againfo/programmes/en/pplpi/docarc/wp44_1.pdf Part 2: Kenya and Ethiopia Dairy Development Case Studies. http://www.fao.org/ag/againfo/programmes/en/pplpi/docarc/wp44_2.pdf Part 3: Pakistan and India Dairy Development Case Studies. http://www.fao.org/ag/againfo/programmes/en/pplpi/docarc/wp44_3.pdf
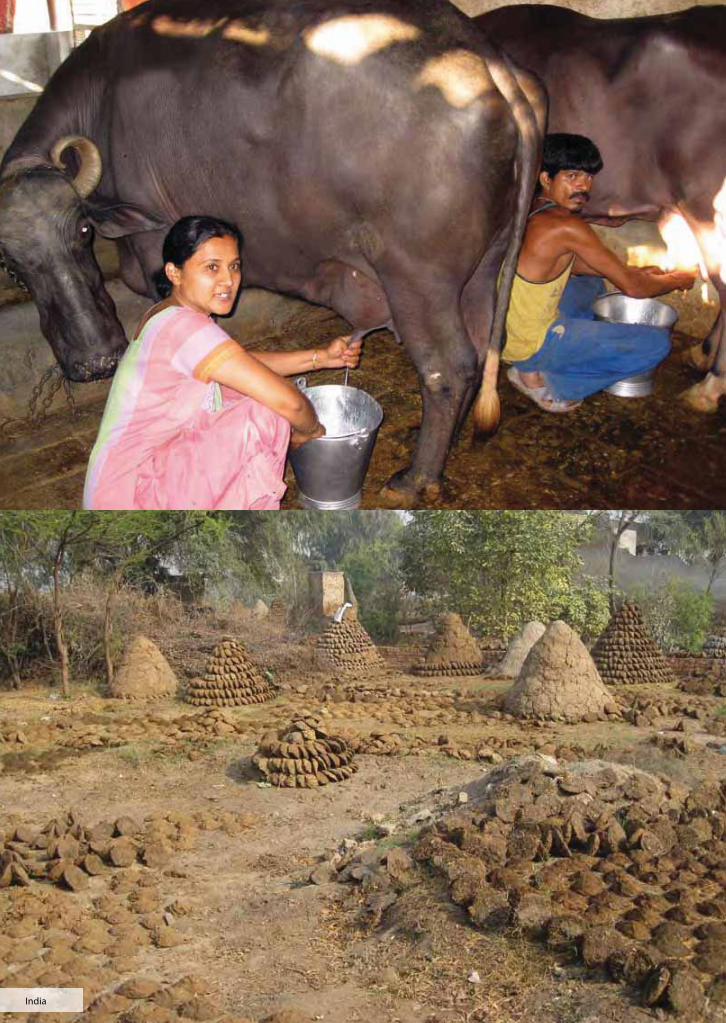
© IFCN 2008 172India
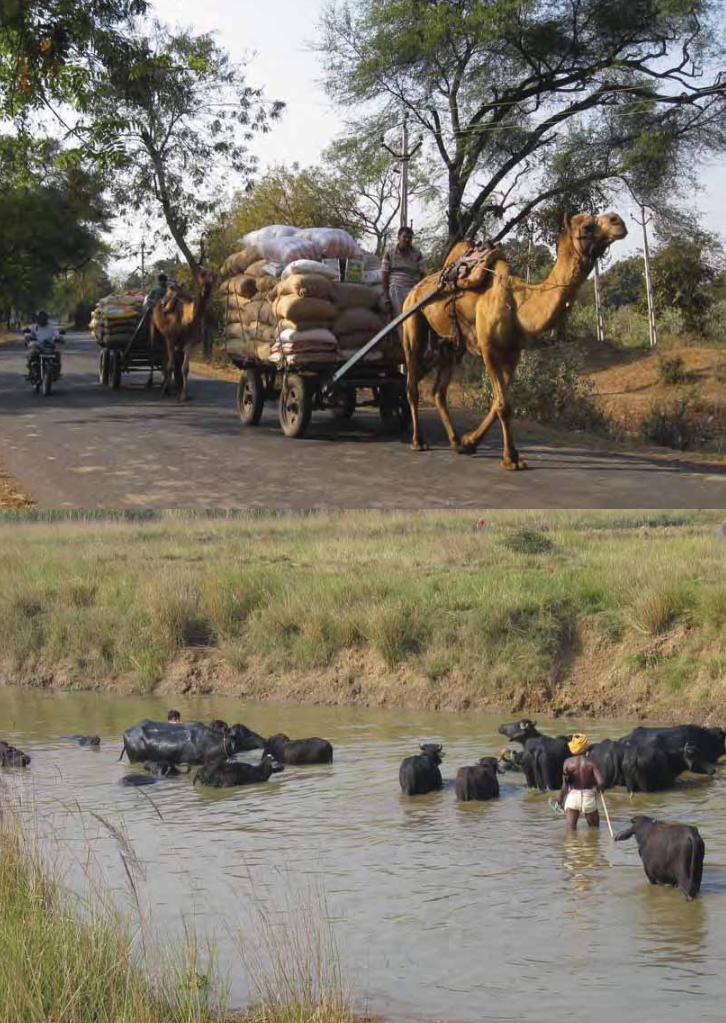
© IFCN 2008 173
174 © IFCN 2008
A.4 Researchers who have contributed
Western Europe
78 research institutions from 72 Countries
Baldur Helgi BenjaminssonAssociation of Icelandic Dairy and Beef Cattle Farmers, Reykjavik, Iceland
Ola Flaten, Bjørn Gunnar HansenNILF – Norwegian Agricultural Economics Research Institute; TINE, Norwegian Dairies, Oslo, Norway
Christian GazzarinAgroscope Reckenholz-Tänikon Research Station (ART), Agricultural Economics, Tänikon, Switzerland
Sami Ovaska, Timo Sipiläinen, Matti RyhänenAgrifood Research Finland, MTT Economic Research, Hel-sinki, Finland Seinäjoki University of Applied Sciences, School of Agriculture and Forestry, Ilmajoki, Finland
Leopold KirnerFederal Institute of Agricultural Economics, Vienna, Austria
Henrike Burchardi IFCN Dairy Research Center, Kiel, Germany
Michel de HaanAnimal Sciences Group, Wageningen-UR, Lelystad, The Netherlands
Simone AdamMinistère de l’Agriculture, Service d’Economie Rurale, Luxembourg
Jean-Luc ReuillonInstitut de l’Èlevage, Département Actions Régionales, Aubière, France
Ernesto ReyesAnimal Health and Livestock Services, TRAGSEGA, Madrid, Spain
Alberto MenghiCRPA – Centro Ricerche Produzioni Animali, Reggio Emilia, Italy
Kay CarsonDairyCo, Cirencester, England, United Kingdom
Fiona ThorneRural Economy Research Centre, Teagasc, Dublin, Ireland
Michael Friis PedersenDanish Agricultural Advisory Service, National Centre, Aarhus, Denmark
Agneta HjellströmSwedish Dairy Association, Stockholm, Sweden
Michal Switlyk, Malgorzata KarolewskaUniversity of Agriculture in Szczecin, Department of Management, Szczecin, Poland
Iveta BoskováVUZE – Research Institute of Agricultural Economics, Prague, Czech Republic
Zlatan D. VassilevPhD student University Hohenheim, Germany; Bulgaria
Rade PopovicUniversity of Novi Sad, Faculty of Economics, Subotica, Serbia
Olga KozakNational Scientifi c Centre “Institute of Agrarian Economics”, Kyiv, Ukraine
Mikhail RamanovichIFCN Dairy Research Center, Kiel, Germany, Belarus
Evgeny Smirnov Russian Dairy Union, Moscow, Russian Federation
Galiya AkimbekovaScientifi c Research Institute of Agricultural Economics, Almaty, Kazakhstan
Cagla Yuksel Kaya-KuyululuCattle Breeders‘ Association of Turkey, Ankara, Turkey
Liron TamirIsrael Dairy Board, Rishon-Le´Zion, Israel
Othman AlqaisiIFCN Dairy Research Center, Kiel, Germany, Jordan
Central and Eastern Europe and Middle East
Africa
David BalikowaDairy Development Authority, Kampala, Uganda
Asaah Ndambi, Henri Bayemi IFCN Dairy Research Center, Kiel, Germany; Institute of Agricul-tural Research for Development (IRAD) Bambui, Cameroon
Koos CoetzeeMilk Producers‘ Organisation, Pretoria, South Africa

© IFCN 2008 175
For references of the Dairy Report use: Hemme et al. (2008): IFCN Dairy Report 2008, International Farm Comparison Network, IFCN Dairy Research Center, Kiel, Germany. For references in the special studies or the country reports use f.e.: Gazzarin, C. (2008): Switzerland – Country report. In: Hemme et al. (2008), IFCN Dairy Report 2008, Internatio-nal Farm Comparison Network, IFCN Dairy Research Center, Kiel, p. 146.
Richard Sanchez, Geneviève Rainville, Dairy Farmers of Canada, Ottawa, Canada; FPLQ, Quebec, Canada
Ed JesseBabcock Institute for International Dairy Research and Development, University of Wisconsin-Madison, USA
Jaime Jurado ArredondoUniversidad Autonoma de Chihuahua, Chihuahua, Mexico
Hugo QuattrochiUnión Productores de Leche Cuenca Mar y Sierras, Argentina
Bernardo OstrowskiUniversidad Buenos Aires (UBA), Cátedra de Administraci-ón Rural, Facultad de Agronomia, Buenos Aires, Argentina
Fernando FerreiraUniversity of Applied Science of Weihenstephan, Germany; Paraguay
Mario E. Olivares Cooprinsem, Osorno, Chile
Lorildo A. Stock, Glauco R. CarvalhoEmbrapa Gado de Leite (Embrapa Dairy Cattle), Juiz de Fora, Minas Gerais, Brazil
Carlos A. GomezUniversidad Nacional Agraria La Molina, Lima, Peru
North and South America
CL Dadhich, TN Datta, AK SahaNational Dairy Development Board, Anand, India
Saadia Hanif ASLP Dairy Improvement Project, Livestock and Dairy Deve-lopment Board, Lahore, Pakistan
A. R. KhanBangladesh Agricultural University Mymensingh, Bangladesh
IstiqomahFakultas Ekonomi Universitas Jenderal Soedirman Purwokerto Central Java, Indonesia
Yang Weimin, Dinghuan Hu, Sam ShiChinese Academy of Agricultural Sciences, Institute of Agri-cultural Economics and Development, Beijing, China; Dairy Consultant, Beijing, China
Andrew Weinert Department of Agriculture, Perth, Western Australia
Nicola ShadboltCollege of Sciences, Massey University, Palmerston North, New Zealand
Asia
Oceania
Ilir KapajAgriculture University of Tirana,Tirana, Albania
Vardan UrutyanInternational Center for Agribusiness, Research and Education (ICARE), Yerevan, Armenia
Anatoli TakunInstitute of Economics of the National Academy of Sciences, Minsk, Belarus
René A. Pérez R.DMV U.N., CNLM, Colombia
Otto SuárezAgrícola Ganadera Reysahiwal AGR S.A., Guayaquil, Ecuador
Adel KhattabTanta University, Tanta, Egypt
Zelalem YilmaEthiopian Institute of Agricultural Research (EIAR),Addis Ababa, Ethiopia
Eva VönekiResearch Institute for Agricultural Economics,Budapest, Hungary
Farhad MirzaeiPh. D Scholar at N.D.R.I /Deemed University, India; Iran
Researchers participating only in the country profi le analysis
Maasoomeh Nasrollah ZadehFood Industry Department of Ferdosi University, Iran
Nobuhiro Suzuki The University of Tokyo, Japan
Youseon ShinKorea Rural Economic Institute, Seoul, Korea
Agnese KrievinaLatvian State Institute of Agrarian Economics, Riga, Latvia
Deiva MikelionyteLithuanian Institute of Agrarian Economics, Vilnius,Lithuania
Blagica SekovskaVeterinary Faculty, Institute for Food, Skopje, Macedonia
Badre El HimdyInstitut Agronomique et Vétérinaire Hassan II, Rabat, Morocco
Eustace A. IyayiUniversity of Ibadan, Ibadan, Nigeria
Aminu ShittuUsmanu Danfodiyo University, Sokoto, Nigeria
Victor M. PerezProlacsa, Panama
Naomi K. TorretaNational Dairy Authority, Quezon City, Philippines
António Moitinho RodriguesSchool of Agriculture - Polytechic Institute of Castelo Branco, Portugal
Michel NoordmanDairy Farmer, S.C. Boes Lapte S.R.L., Romania
Ben MoljkAgricultural Institute of Slovenia, Ljubljana, Slovenia
Margita StefanikovaSlovak Association of Milk Producers (SZPM), Nitra, Slovakia
Hemali KothalawalaDepartment of Animal Production and Health,Peradeniya, Sri Lanka
Xenia HsiaoForefront Enterprise Co., Ltd., Taipei, Taiwan, ROC
Pius Y. KavanaLivestock Research Centre, Tanga, Tanzania
Adul VangtalThai Holstein Friesian Association (T.H.A.), Thailand
Jorge AlvarezUniversidad de la Republica, Montevideo, Uruguay
Evelina BudjurovaUniversity Giessen, Germany; Uzbekistan
Tieu Duc VietNational Institute of Animal Husbandry, Hanoi, Vietnam
A.4 Researchers who have contributed
Dairy Viet Nam, Hanoi, Viet Nam
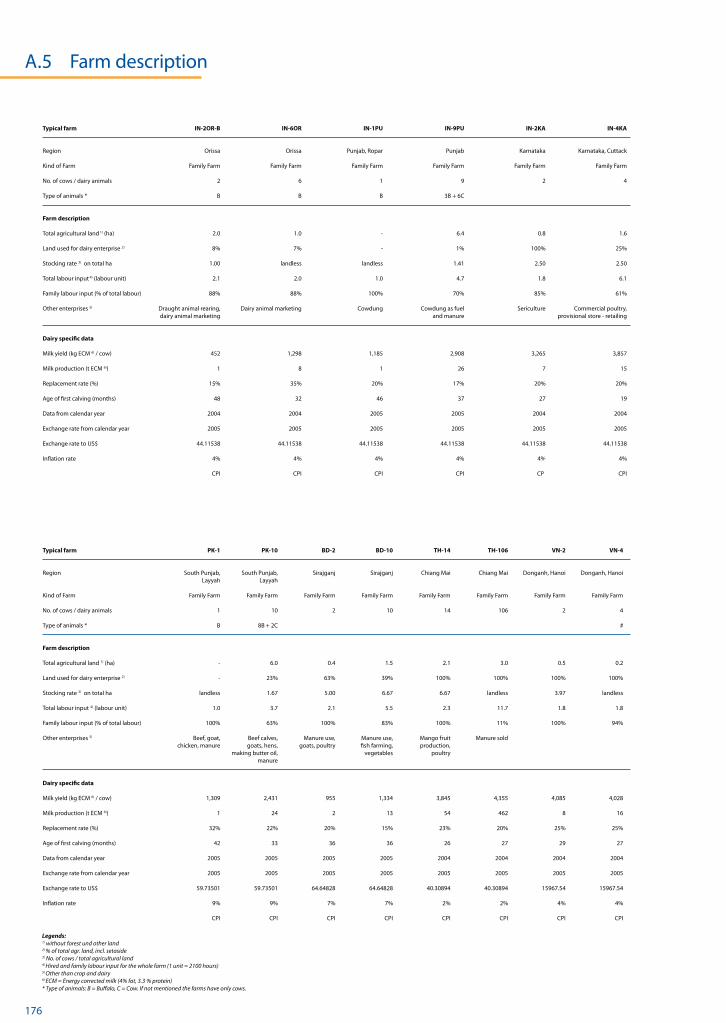
176 © IFCN 2008
A.5 Farm description
Typical farm IN-2OR-B IN-6OR IN-1PU IN-9PU IN-2KA IN-4KA
Region Orissa Orissa Punjab, Ropar Punjab Karnataka Karnataka, Cuttack
Kind of Farm Family Farm Family Farm Family Farm Family Farm Family Farm Family Farm
No. of cows / dairy animals 2 6 1 9 2 4
Type of animals * B B B 3B + 6C
Farm description
Total agricultural land 1) (ha) 2.0 1.0 - 6.4 0.8 1.6
Land used for dairy enterprise 2) 8% 7% - 1% 100% 25%
Stocking rate 3) on total ha 1.00 landless landless 1.41 2.50 2.50
Total labour input 4) (labour unit) 2.1 2.0 1.0 4.7 1.8 6.1
Family labour input (% of total labour) 88% 88% 100% 70% 85% 61%
Other enterprises 5) Draught animal rearing, Dairy animal marketing Cowdung Cowdung as fuel Sericulture Commercial poultry, dairy animal marketing and manure provisional store - retailing
Dairy specific data
Milk yield (kg ECM 6) / cow) 452 1,298 1,185 2,908 3,265 3,857
Milk production (t ECM 6)) 1 8 1 26 7 15
Replacement rate (%) 15% 35% 20% 17% 20% 20%
Age of first calving (months) 48 32 46 37 27 19
Data from calendar year 2004 2004 2005 2005 2004 2004
Exchange rate from calendar year 2005 2005 2005 2005 2005 2005
Exchange rate to US$ 44.11538 44.11538 44.11538 44.11538 44.11538 44.11538
Inflation rate 4% 4% 4% 4% 4% 4%
CPI CPI CPI CPI CPI CPI
Legends:1) without forest und other land2) % of total agr. land, incl. setaside 3) No. of cows / total agricultural land4) Hired and family labour input for the whole farm (1 unit = 2100 hours)5) Other than crop and dairy6) ECM = Energy corrected milk (4% fat, 3.3 % protein)* Type of animals: B = Buffalo, C = Cow. If not mentioned the farms have only cows.
Typical farm PK-1 PK-10 BD-2 BD-10 TH-14 TH-106 VN-2 VN-4
Region South Punjab, South Punjab, Sirajganj Sirajganj Chiang Mai Chiang Mai Donganh, Hanoi Donganh, Hanoi Layyah Layyah
Kind of Farm Family Farm Family Farm Family Farm Family Farm Family Farm Family Farm Family Farm Family Farm
No. of cows / dairy animals 1 10 2 10 14 106 2 4
Type of animals * B 8B + 2C #
Farm description
Total agricultural land 1) (ha) - 6.0 0.4 1.5 2.1 3.0 0.5 0.2
Land used for dairy enterprise 2) - 23% 63% 39% 100% 100% 100% 100%
Stocking rate 3) on total ha landless 1.67 5.00 6.67 6.67 landless 3.97 landless
Total labour input 4) (labour unit) 1.0 3.7 2.1 5.5 2.3 11.7 1.8 1.8
Family labour input (% of total labour) 100% 63% 100% 83% 100% 11% 100% 94%
Other enterprises 5) Beef, goat, Beef calves, Manure use, Manure use, Mango fruit Manure sold chicken, manure goats, hens, goats, poultry fish farming, production, making butter oil, vegetables poultry manure
Dairy specific data
Milk yield (kg ECM 6) / cow) 1,309 2,431 955 1,334 3,845 4,355 4,085 4,028
Milk production (t ECM 6)) 1 24 2 13 54 462 8 16
Replacement rate (%) 32% 22% 20% 15% 23% 20% 25% 25%
Age of first calving (months) 42 33 36 36 26 27 29 27
Data from calendar year 2005 2005 2005 2005 2004 2004 2004 2004
Exchange rate from calendar year 2005 2005 2005 2005 2005 2005 2005 2005
Exchange rate to US$ 59.73501 59.73501 64.64828 64.64828 40.30894 40.30894 15967.54 15967.54
Inflation rate 9% 9% 7% 7% 2% 2% 4% 4%
CPI CPI CPI CPI CPI CPI CPI CPI

© IFCN 2008 177
A.5 Farm description
Typical farm PE-6 PE-15 DE-30S DE-80N US-80WI US-350WI NZ-282 NZ-1042
Region Cajamarca, Cajamarca, Baden-Württemberg; Schleswig-Holstein, Wisconsin Wisconsin Waikato Polloc Campiña Schwäb. Wald Geestrücken Central South Island
Kind of Farm Family Farm Family Farm Family Farm Family Farm Family Farm Family Farm Family Farm Family Farm, equity partnership
No. of cows / dairy animals 6 15 30 80 80 350 282 1042
Type of animals *
Farm description
Total agricultural land 1) (ha) 7.6 7.3 50.0 80.0 93.1 275.2 96.0 299.0
Land used for dairy enterprise 2) 83% 100% 93% 87% 100% 100% 100% 100%
Stocking rate 3) on total ha 0.79 2.05 0.60 1.00 0.86 1.27 2.94 3.48
Total labour input 4) (labour unit) 1.9 3.7 1.5 2.3 2.6 8.5 2.3 7.9
Family labour input (% of total labour) 100% 29% 100% 96% 54% 23% 50% 19%
Other enterprises 5) Sheep - Direct sales distillery, Steers Custom work - - - contract labour, forestry
Dairy specific data
Milk yield (kg ECM 6) / cow) 2,153 4,459 6,813 7,926 8,703 10,445 4,299 5,114
Milk production (t ECM 6)) 13 67 204 634 696 3,656 1,212 5,329
Replacement rate (%) 22% 19% 34% 38% 40% 40% 20% 22%
Age of first calving (months) 32 27 30 30 27 27 24 24
Data from calendar year 2005 2005 2005 2005 2005 2005 2005 2005
Exchange rate from calendar year 2005 2005 2005 2005 2005 2005 2005 2005
Exchange rate to US$ 3.30838 3.30838 0.80453 0.80453 1 1 1.42065 1.42065
Inflation rate 2% 2% 1% 1% 3% 3% 2% 2%
CPI CPI GDP Deflator GDP Deflator GDP Deflator GDP Deflator GDP Deflator GDP Deflator
Typical farm CN-3 CN-12 UG-3 UG-13 CM-10 CM-35 MA-4 MA-12
Region North China, Hebei North China, Hebei Kayunga District Kayunga District Western Highlands Western Highlands Doukkala, Benihlel Doukkala, Benihlel
Kind of Farm Family Farm Family Farm Family Farm Family Farm Family Farm Family Farm Family Farm Family Farm
No. of cows / dairy animals 3 12 3 13 10 35 4 12
Type of animals *
Farm description
Total agricultural land 1) (ha) landless landless 22.3 41.5 30.0 43.0 2.0 13.0
Land used for dairy enterprise 2) landless landless 91% 98% 33% 68% 27% 37%
Stocking rate 3) on total ha landless landless 0.13 0.31 0.33 0.81 2.00 0.92
Total labour input 4) (labour unit) 0.9 2.7 2.0 3.6 1.7 2.3 1.4 2.9
Family labour input (% of total labour) 100% 89% 39% 49% 5% 48% 100% 54%
Other enterprises 5) - - Pig, poultry Goats, pigs - Steers Steers -
Dairy specific data
Milk yield (kg ECM 6) / cow) 2,583 4,399 460 395 1,157 488 2,214 2,211
Milk production (t ECM 6)) 8 53 1 5 12 17 9 27
Replacement rate (%) 34% 9% 35% 25% 15% 24% 26% 21%
Age of first calving (months) 27 26 39 39 35 35 30 28
Data from calendar year 2006 2006 2006 2006 2006 2006 2006 2006
Exchange rate from calendar year 2005 2005 2005 2005 2005 2005 2005 2005
Exchange rate to US$ 8.2 8.2 1777.28 1777.28 532.75 532.75 8.96 8.96
Inflation rate 2% 2% 7% 7% 5% 5% 3% 3%
CPI CPI CPI CPI CPI CPI CPI CPI

178 © IFCN 2008
Farm Data Year collection analysed
IN-2OR-B 1/3 2004IN-6OR 1/3 2004
IN-1PU 1/3 2005IN-9PU 1/3 2005
IN-2KA 1/3 2004IN-4KA 1/3 2004
PK-1 2/3 2005PK-10 2/3 2005
BD-2 2/3 2005BD-10 2/3 2005
TH-14 1/3 2004TH-106 1/3 2004
VN-2 1/3 2004VN-4 1/3 2004
CN-3 3 2006CN-12 3 2006
UG-3 3/1 2006UG-13 3/1 2006
CM-10 3 2006CM-35 3 2006
MA-4 3/1 2006MA-12 3/1 2006
PE-6 1/3 2005PE-15 1/3 2005
DE-30S 1/2 2005DE-80N 1/2 2005
US-80WI 2 2005US-350WI 2 2005
NZ-282 2 2005NZ-1042 2 2005
Classification of typical farms by data collection procedure
1. Panel approach: A panel (farmer, advisor and scientist) discussed the data and agreed on the results of the typical farm.
2. Statistical approach only: The data were taken mainly from accounting statistics and were discussed among dairy experts to create a typical farm.
3. Single farm approach only: The data were taken mainly from a single farm and were discussed among dairy experts to create a typical farm.
4. Single farm case: The data were taken from a single farm. The data represent this single case rather than a type of dairy farm in the region.
A.6 Description of data collection for typical dairy farms

© IFCN 2008 179
A.7 Exchange rates 1996–2007
Country Currency 1996 1997 1998 1999 2000 2001 2002 2003 2004 2005 2006 2007Albania AL ALL 101.56 147.71 152.44 138.64 144.82 145.87 145.44 126.34 106.80 102.93 102.91 92.57
Argentina AR ARS 1.00 1.00 1.00 1.00 1.00 1.00 3.11 2.99 2.96 2.93 3.09 3.13
Armenia AM ADM 79,874 90,026 159.02 388.63 438.23 454.14 488.36 477.53 448.31 440.16 422.99 339.50
Australia AU AUD 1.28 1.35 1.59 1.55 1.73 1.93 1.84 1.54 1.36 1.31 1.33 1.19
Bangladesh BD BDT 41.90 44.01 47.05 49.19 52.34 56.77 59.63 60.06 60.88 64.65 70.29 70.33
Belarus BY BYR 13,608 25,039 43,569 276,661 800 1,420 1,804 2,051 2,160 2,150 2,152 2,152
Brazil BR BRL 1.00 1.08 1.16 1.82 1.83 2.38 2.97 3.12 2.93 2.43 2.18 1.93
Bulgaria BG BGL 179.45 1,645.66 1,753.92 1,849.30 875.97 2.18 2.07 1.73 1.58 1.57 1.57 1.43
Cameroon CM XAF 512.49 584.26 590.21 616.02 713.46 741.47 724.61 590.97 549.16 532.75 553.41 489.78
Canada CA CAD 1.36 1.38 1.48 1.49 1.49 1.55 1.57 1.40 1.30 1.21 1.13 1.07
Chile CL CLP 412.37 419.51 460.67 509.19 539.67 642.62 703.77 702.97 621.67 561.81 539.39 520.69
China CN CNY 8.31 8.29 8.28 8.28 8.28 8.28 8.29 8.29 8.29 8.20 7.98 7.60
Colombia CO COP 1,036 1,143 1,428 1,762 2,093 2,324 2,580 2,938 2,676 2,332 2,424 2,104
Czech Republic CZ CSK 27.14 31.75 32.27 34.63 38.64 38.04 32.81 28.23 25.73 23.99 22.63 20.23
Denmark DK DKK 5.80 6.60 6.70 6.98 8.09 8.32 7.88 6.58 5.99 6.00 5.94 5.42
Ecuador EC ECS 3,251 4,066 5,654 13,096 25,000 25,000 25,000 25,000 25,000 25,000 25,000 25,652
Egypt EG EGP 3.41 3.40 3.42 3.42 3.55 4.06 4.66 5.91 6.24 5.83 5.82 5.71
Estonia EE EEK 11.90 13.87 14.08 14.69 17.01 17.47 16.60 13.86 12.60 12.59 12.47 11.40
Euro EUR 0.77 0.89 0.90 0.94 1.09 1.12 1.06 0.89 0.81 0.80 0.80 0.73
Ethiopia ET ETB 5.84 6.50 6.99 7.81 8.08 8.42 8.79 8.79 8.89 8.83 9.02 9.22
Hungary HU HUF 149.45 186.85 214.49 237.40 282.89 286.59 258.08 224.50 202.93 199.94 210.83 182.95
Iceland IS ISK 66.80 71.10 71.20 72.40 78.90 97.69 91.67 76.78 70.26 62.92 70.10 63.66
India IN INR 35.44 36.34 41.29 43.06 44.95 47.23 48.68 46.66 45.34 44.12 45.32 41.08
Indonesia ID IDR 2,328 2,904 10,285 7,877 8,416 10,294 9,350 8,593 8,946 9,722 9,184 9,145
Iran IR IRR 1,585 2,399 3,297 4,195 5,094 5,992 6,890 7,900 7,900 8,283 9,492 9,524
Israel IL ILS 3.19 3.45 3.81 4.15 4.09 4.21 4.74 4.55 4.49 4.50 4.47 4.10
Japan JP JPY 108.83 121.04 130.88 113.81 107.86 121.56 125.30 115.98 108.17 110.12 116.34 117.58
Jordan JO JOD 0.71 0.71 0.71 0.71 0.71 0.72 0.71 0.71 0.71 0.71 0.71 0.71
Kazakhstan KZ KZT 67.87 75.63 78.64 119.83 142.31 147.55 150.77 151.91 140.81 134.17 130.59 125.41
Kenya KE KES 57.17 58.92 60.54 70.42 76.28 78.75 79.15 76.32 79.55 75.75 72.62 67.82
Korea, Republic of KR KRW 805 954 1,402 1,190 1,131 1,291 1,250 1,195 1,151 1,028 970 934
Latvia LV LVL 0.55 0.58 0.59 0.59 0.61 0.63 0.62 0.57 0.54 0.56 0.56 0.51
Lithuania LT LTL 4.00 4.00 4.00 4.00 4.00 4.00 3.66 3.06 2.78 2.78 2.75 2.52
Macedonia MK MKD 49.84 57.41 58.27 60.83 70.27 72.35 68.72 57.35 52.14 52.11 50.31 45.52
Mexico MX MXN 7.60 7.93 9.15 9.56 9.47 9.35 9.68 10.81 11.31 10.90 10.92 10.94
Morocco MA MAD 8.71 9.53 9.62 9.81 10.64 11.32 11.07 9.69 8.97 8.96 8.91 8.22
New Zealand NZ NZD 1.46 1.51 1.87 1.89 2.20 2.38 2.16 1.72 1.51 1.42 1.54 1.35
Nigeria NG NGN 81.86 82.19 86.46 96.00 105.14 116.95 126.40 133.07 133.56 132.10 132.44 128.22
Norway NO NOK 6.46 7.08 7.55 7.80 8.80 8.99 7.98 7.08 6.74 6.44 6.42 5.82
Pakistan PK PKR 36.00 41.08 48.73 51.40 53.94 62.63 62.26 59.89 60.01 59.74 60.25 60.78
Panama PA PAB 1.00 1.00 1.00 1.00 1.00 1.00 1.00 1.00 1.00 1.01 1.04 1.02
Paraguay PY PYG 2,038 2,165 2,690 3,112 3,485 4,054 5,561 6,367 5,861 6,246 5,843 5,148
Peru PE PEN 2.45 2.66 2.93 3.38 3.49 3.55 3.66 3.60 3.51 3.31 3.36 3.19
Philippines PH PHP 26.23 29.63 41.00 39.15 44.34 51.17 51.73 54.31 56.19 55.14 51.41 45.95
Poland PL PLN 2.70 3.28 3.49 3.97 4.35 4.10 4.07 3.89 3.65 3.24 3.11 2.75
Romania RO RON 0.31 0.72 0.89 1.54 2.17 2.93 3.41 3.41 3.34 2.94 2.82 2.43
Russian Federation RU RUB 5,134 5,787 10.22 24.98 28.17 29.19 31.39 30.70 28.82 28.29 27.19 25.49
Saudi Arabia SA SAR 3.75 3.75 3.75 3.75 3.75 3.75 3.75 3.75 3.75 3.75 3.75 3.75
Serbia RS RSD 4.92 5.00 8.99 10.92 11.61 48.31 63.53 57.68 58.96 67.07 69.36 59.50
Slovakia SK SKK 30.68 33.65 35.31 41.46 46.39 48.38 45.31 36.77 32.29 31.09 29.71 24.55
Slovenia SI SIT 135.57 160.27 166.63 183.14 225.16 244.59 243.59 210.39 195.50 193.33 191.09 EUR
South Africa ZA ZAR 4.30 4.61 5.55 6.12 6.94 8.62 10.53 7.57 6.46 6.38 6.79 7.06
Sri Lanka LK LKR 55.31 58.98 64.91 70.77 76.92 89.61 95.78 96.55 101.24 100.59 104.29 111.19
Sweden SE SEK 6.71 7.64 7.95 8.27 9.17 10.33 9.72 8.08 7.35 7.47 7.38 6.74
Switzerland CH CHF 1.24 1.45 1.45 1.50 1.69 1.69 1.56 1.35 1.24 1.25 1.25 1.20
Syria SY SYP 41.95 41.89 41.85 42.29 63.93 55.21 52.29 48.51 52.18 52.98 54.21 53.13
Taiwan TW TWD 32.31 31.26 33.98 34.58 34.48 33.47 32.19 32.55 32.89
Tanzania TZ TZS 614 619 660 749 804 887 994 1,063 1,113 1,150 1,286 1,265
Thailand TH THB 25.36 31.18 41.35 37.88 40.20 44.54 43.07 41.60 40.31 40.31 37.99 32.26
Turkey TR TRL 81,806 152,752 262,205 420,649 624,754 1,240,942 1,542,022 1,528,854 1,448,899 1.35 1.44 1.30
Uganda UG UGX 1,051 1,088 1,247 1,472 1,655 1,788 1,738 1,845 1,807 1,777 1,847 1,736
Ukraine UA UAH 1.52 1.87 2.61 4.35 5.50 5.38 5.49 5.51 5.47 5.16 5.22 5.17
United Kingdom GB GBP 0.64 0.61 0.60 0.62 0.66 0.69 0.67 0.61 0.55 0.55 0.54 0.50
Uruguay UY UYP 8.03 9.50 10.53 11.26 11.40 12.84 21.32 28.24 28.69 24.46 24.93 23.98
USA US USD 1.00 1.00 1.00 1.00 1.00 1.00 1.00 1.00 1.00 1.00 1.00 1.00
Uzbekistan UZ UZS 94.79 124.64 237.20 941.65 1,012.60 1,095.90 1,028.84 1,010.14 970.73 910.20
Vietnam VN VND 11,036 11,705 13,267 13,945 14,177 15,031 15,934 16,068 16,175 15,968 16,436 16,412
1 US-$ = ... national currency, Source: www.oanda.com
Euro: In Austria, Belgium, Finland, France, Germany, Greece, Ireland, Italy, Luxembourg, The Netherlands, Portugal, Spain since 2002 the currency is the EURO.
The years before the exchange rates have been quite similar. In the table the exchange rate of the German currency are shown converted into EUR.

180 © IFCN 2008
Land costs
For rented land, rents currently paid by the farmers were used. Regional rent prices provided by the farmers were used for owned land. In those countries with limited rental markets (like NZ), the land market value was capitalised at 4.5 % annual interest to obtain a theoretical rent price.
Capital costs
Own capital is defined as assets, without land and quota (calculation: assets for buildings, machinery, livestock and other), plus circulating capital (10 % of all dairy related variable expenses). For borrowed funds, a real interest rate of 6 % was used in all countries; for owner’s capital, the real interest rate was assumed to be 3 %.
Quota costs
Rent values were used for rented or leased quota. Opportunity costs for own quota are calculated based on the quota value * 3 % interest rate. Depreciation of quota based on national depreciation scheme is deducted to calculate farm income.
Depreciation
Machinery and buildings were depreciated using a straight line schedule on purchase prices with a residual value of zero.
Adjustment of VAT
All cost components and returns are stated without value added tax (VAT).
Adjustment of milk ECM
The milk output per farm is adjusted to 4 % fat, 3.3 % protein. Formula: ECM milk = (milk production * ((0.383 * % fat + 0.242
* % protein + 0.7832) / 3.1138). Source: DLG (2001), unpublished.
Cost calculation
The cost calculations are based on dairy enterprises that consist of the following elements:
milk production raising of replacement heifers forage production.
The analysis results in a comparison of returns and total costs per kilogram of milk. Total costs consist of expenses from the profit and loss account (cash costs, depreciation, etc.), and opportunity costs for farm-owned factors of production (family labour, own land, own capital). The estimation of these opportunity costs must be considered carefully because the potential income of farm owned factors of production in alternative uses is difficult to determine. In the short run, the use of own production factors on a family farm can provide flexibility in the case of low returns when the family can chose to forgo income. However, in the long run opportunity costs must be considered because the potential successors of the farmer will, in most cases, make a decision on the alternative use of own production factors, in particular their own labour input, before taking over the farm. To indicate the effects of opportunity costs we have separated them from the other costs in most of the figures.
For the estimations and calculations the following assumptions were made:
Labour costs
For hired labour, cash labour costs currently incurred were used. For unpaid family labour, the wage rate per hour for a qualified full-time worker in the region multiplied with the working time of a skilled worker was used. For India and Pakistan we used the approach of individual opportunity wage levels for family members multiplied with their working time in the farm.
A.8 Assumptions for the calculations – farm economic indicators
Mom
ents
in 2
007

© IFCN 2008 181
A.8 Assumptions for the calculations – farm economic indicators
= Entrepreneur's profit
+ Total receipts =
- Total expenses =
+ crop (wheat, barley, etc.)
+ dairy (milk, cull cows, calves, etc.)
+ government payments
+ variable costs crop
+ variable costs dairy
+ fixed cash costs
+ paid wages
+ paid land rent
+ paid interest on liabilities
= Net cash farm income
+ Non-cash adjustments =
- depreciation
+/- change in inventory
+/- capital gains / losses
= Farm income
- Opportunity costs =
(incl. quota depreciation)
+ calc. interest on own capital+ calc. cost for own quota - quota depreciation+ calc. rent on land+ calc. cost for own labour

Status and Prospects for Smallholder Milk ProductionA Global Perspective
In 2005, some 1.4 billion people lived in absolute poverty and that nearly 1 billion were affected by chronic mal- or undernutrition. An estimated 75 percent of the world’s poor live in rural areas, and at least 600 million of these keep livestock that enable them to produce food, generate cash income, manage risks and build up assets. With the valuable contribu-tion that livestock makes to sustaining livelihoods, especially in rural areas, the develop-ment of small-scale livestock enterprises could be a key element of efforts to eradicate extreme poverty and hunger.
Milk production is an important livestock-sector activity and it is estimated that nearly 150 million farm households throughout the world are engaged in milk production. Small-scale milk production not only improves food security of milk producing households but also creates significant amounts of employment in the entire dairy chain, which comprises many small-scale rural processors and intermediaries. On the other hand, demand for milk and milk products is steadily growing, particularly in developing countries. If supply is to keep pace with the growth in demand, milk production will need to grow by close to 2 percent per year.
The aim of this book is to provide a holistic picture on the trends and drivers in the dairy sector as well as the implications these may have for the future of dairy farming, in particular among the smaller-scale, rural producers.
Across the countries analysed, small-scale milk producers have very competitive production costs and thus, if organized, have the potential to compete with large-scale, capital-intensive ‘high-tech’ dairy farming systems in developed and developing countries. Dairy sector development can therefore be a potent tool for poverty reduction. However, gainful participation of smallholder milk producers in the dairy market not only depends on their own competitiveness, but also on the efficiency of the dairy chains of which they are part. Therefore, smallholder dairy development strategies must not exclusively focus on dairy producers but must increase competitiveness in each and every segment of the dairy chain.