status and condition of corporatization strategies of
TRANSCRIPT

Journal of Public Administration and Governance
ISSN 2161-7104
2018, Vol. 8, No. 2
http://jpag.macrothink.org 286
Status and Condition of Corporatization Strategies of
State Universities and Colleges (SUCs) in Region III in
the Philippines
Dr. Arneil G. Gabriel (Corresponding author)
Program Chair, Department of Public Administration, NEUST, Philippines
Dr. Jocelyn B Cruz
Dean, Graduate School, NEUST, Philippines
Received: April 25, 2018 Accepted: June 5, 2018 Online published: June 18, 2018
doi:10.5296/jpag.v8i2.13294 URL: https://doi.org/10.5296/jpag.v8i2.13294
Abstract
The right to free access to quality education of citizens extends to tertiary level education.
This Constitutional provision creates increasing demands for State Universities and Colleges
(SUC’s) which in turn exerts pressure on the budgetary capacity of the government to finance
such education. To strike the balance between equity of access and quality of education,
SUCs employed corporatization strategies to generate income and finance its operations. The
study looks into the strategies employed by SUCs in Region III in the Philippines and
analyzes matters related to the practice of corporatization principles. By using descriptive
correlation design, the study showed that respondent SUCs in Region III are: a) diverse in
many aspects of their operations, b) vary in the modes of generating income, descriptively
measured from “sometimes” to “often” except the collection of tuition fees which has been
rated as “very often” applied as corporatization strategy, c) have variety in income utilization
ranging from 46 percent to 51 percent; d) stakeholders are found “very satisfied” in the
manner SUCs in Region III used their income, e) are rated with varying interpretations in
terms of corporatization strategies and performance of their fourfold functions, e) have
marked differences in terms of income utilization except in corporatization activities which
marked as “not significant”. Finally, it was found that employees’ satisfaction and the
performance of the four fold functions of instruction, research, extension and production are
significantly correlated. It is recommended that stakeholders’ engagement in planning and
organizing programs and projects of SUCs in Region III be enhanced.
Keywords: Corporatization, State Universities and Colleges, SUCs, Educational

Journal of Public Administration and Governance
ISSN 2161-7104
2018, Vol. 8, No. 2
http://jpag.macrothink.org 287
Management, Public Institution, the Philippines
1. Introduction
Education in the Philippines is an expression of parental love. That explains why every parent
in the country dreams of sending their children to college and why parents are willing to
sacrifice for their children to earn a degree.
The high value that parents place on education is embedded in Filipino culture. So much so
that lawmakers made it explicit in Article 14, Section 1 that the State shall promote and
protect the right of all citizen to quality education at all levels and shall take appropriate
action to make such step accessible to all (Alvaran, 2002).
The number of SUCs in the country however does not suffice for the growing number of
enrolees in the college level. Consequently, more SUCs were put up requiring a huge budget
allocation exerting pressure to the country’s treasury. Today, the Philippine higher education
is at a crossroads to economic globalization where privatization, deregulation and
corporatization are the guiding principles of new global economic order (Fronda et al., 2017).
Thus, SUCs find themselves in a more competitive and challenging local and global
environments. The challenges emanated from: First, liberalization policies of the Commission
on Higher Education (CHED) as shown by the lifting of moratorium in the course offered .
Secondly, the increase in the number of SUCs has affected the budget allocation from the
government for each of the institution (Villabroza, 2002).
It was then that the idea of corporatization came about. Corporatization of SUCs in the
Philippines is stipulated under Republic Act 8292, also known as the Higher Education Act of
1997. It allows SUCs to engage in corporate activities in order to generate revenues. It
empowers the governing boards of SUCs to retain income and enter into joint ventures with
business and industry. The statute further provides the means by which SUCs exercise the
powers granted to a Board of Directors of a corporation under the Corporate Code of the
Philippines (Batasan Pambansa Number 68). This is in preparation for the gradual withdrawal
of government support to the SUCs Maintenance and Other Operating Expenses (MOOE) or
the allocated budget for the SUCs maintenance and other operating expenses which used to
be shouldered by the government.
While corporatization is perceived as a means of financial autonomy, it is also believed that it
may have impact on the schools delivery of services, although its effects and influences have
yet to be ascertained.
On the other hand there were indications that corporatization did no good in the education
system. Public opinion supports this, to wit:
“The most significant change has been higher education’s attempt to
become a lean and mean money-making ‘industry’ instead of an
institution with an important social and educational mission that
served the nation and the world. The corporatization of the university
is the end of the public university (I say ‘public’ because I think that

Journal of Public Administration and Governance
ISSN 2161-7104
2018, Vol. 8, No. 2
http://jpag.macrothink.org 288
private institutions, less battered by political winds and the funding
whims of state legislatures, will probably maintain some semblance of
this mission). The mission of the higher education institutions that I
was educated to teach in was not to produce trained cogs for the
corporate machine, but to produce independent, critical thinkers who
are equipped to leave the world better than they found it.
(http://www.insidehighered.com)
Another critique of corporatization is the increase in the number of administrators. According
to Mills (2002), the number of full-time faculty at colleges and universities in the United
States has grown by 50 percent over the 40 years. This is because of the increase in student
enrolment. However, the number of administrators has risen by 85 percent and the number of
staff required to help the administrators has increased by 240 percent. There is no doubt that
there are so many policy decisions at colleges and universities which are made without
faculty inputs. The dramatic increase in the number of school administrators in the US is
different from the Philippine Experience.
The Philippines as a state provides free education in the elementary and high school levels.
This is explicitly stated in Article 14, Section 2 of the 1987 Philippine Constitution.
Education in these levels is free because it is the government that provides for the budget
necessary for their operation( Gabriel and Claudio,2016). In tertiary education, however,
government support is not as intensive although there are also SUCs that cater to the need of
education in the tertiary level. Tuition and miscellaneous fees are not free in the SUCs but
definitely these are way below compared with the tuition and miscellaneous fees in private
colleges and universities because these institutions are subsidized by the government.
The study was borne out of the proponent’s feeling that there was a need for a study that
would show the connection between corporatization strategies of SUCs and the SUCs generic
function as a means of transfer of knowledge. In this study, the researcher attempted to:
describe the SUCs according to number of their programs, enrolment size, number of
teaching and non-teaching personnel and average income for the past five years; attempt to
determine the income generation strategies of SUCs which included the following:
outsourcing or importing services from outside the school, merger which could either be
buying or surrendering stocks, joint venture or pooling resources with other parties, school
fees like tuition and other fees, and fund raising activities like ticket selling, raffles or the
likes; look into the income utilization of the SUCs on the basis of their priorities, namely:
instruction, research, extension, production, administrative services, and mandatory reserve;
determine the degree of respondents’ satisfaction with the way their respective income was
utilized; and relate the SUCs performance on the basis of the SUCS fourfold functions,
namely: instruction, research, extension and production out of the researcher’s desire to
determine whether the income utilization has something to do with the way the SUCs
perform according to their mandated tasks.
2. Methodology
The study used the descriptive correlational research design as much as it attempted to

Journal of Public Administration and Governance
ISSN 2161-7104
2018, Vol. 8, No. 2
http://jpag.macrothink.org 289
describe the status and condition of corporatization at SUCs and correlate the variables of
satisfaction with income utilization to the description of the state universities and colleges’
four-fold functions. Explicitly, the study measured the following sub variables: a) to describe
the profile of the respondents; in terms of a.1 number of programs, a.2 enrolment size,a.3
number of teaching personnel, a.4 number of non-teaching personnel, and a.5 average income
in the past five years; b) describe the modes of income generation being utilized by the state
universities and colleges; c) state the ways on how the SUCs utilize their income; and
measure the level of satisfaction of the stakeholders with the income utilization of the state
universities and colleges; d) describe the four-fold functions of state universities and
colleges;e) determine whether there is significant difference among the state universities and
colleges in Region III on the basis of their profile, income generation, and income utilization;
and respondents’ satisfaction in income utilization and their rating for the SUCs performance
along their four-fold functions. The respondents to the study are presented below:
Table 1. The Respondents of Study
Meantime, the table below shows the profile of the State Colleges and Universities income
utilization ,condition and status, to wit;
Table 2. Summary of SUC Profile
SUC No. of
Programs
Enrolment
Size
No. Of
Teaching
Personnel
No of
Non-Teaching
personnel
Average Income
Generated in the
Last Five Years
(Php)
CLSU 50 10,296 533 631 175,800,000
NEUST 42 19,681 300 137 91,775,000
PAC 30 4,097 187 208 18,000,000
DHVTSU 25 13, 138 333 88 113,073,000
PhilSCA 12 1,428 112 78 35,000,000
BSU 55 24,211 385 92 286,260,000
BASC 15 2,900 270 81 19,290,000
TCA 24 3,905 122 128 49,842,000
TSU 80 14,136 249 222 156,968,000
Province State Universities and
Colleges
Administrators Department Head
for Research, Extension
and Training
Academic Area
Heads
Nueva
Ecija
CLSU
NEUST
3
3
3
3
10
10
Pampanga PAC
DHVTSU
PhilSCA
3
3
3
3
3
3
10
10
10
Bulacan BSU
BSAU
3
3
3
3
10
10
Tarlac TCA
TSU
3
3
3
3
10
10
Zambales RMTU
PMMA
BPSU
3
3
3
3
3
3
10
10
10
Aurora ASCOT 3 3 10
Total 13 39 39 130

Journal of Public Administration and Governance
ISSN 2161-7104
2018, Vol. 8, No. 2
http://jpag.macrothink.org 290
RMTU 45 9,137 246 102 72,350,000
BPSU 25 13,233 492 302 208,836,000
PMMA 21 2,170 58 47 42,300,000
ASCOT 32 2,498 102 71 10,200,000
Grand Total 456 107,692 3389 2187 1,279,694,000
Grand Mean 35.08 8284 260.692 168.231 98,438,000
In this study, the following null hypotheses were tested stating that there was no significant
difference among state universities and colleges in Region III in terms of profile, income
generation, and income utilization and the respondents’ description of the fourfold function of
SUCs was not significantly influenced by the respondents’ satisfaction in terms of income
utilization.
To answer all the problems in this research study, a questionnaire was crafted by the
researchers. This questionnaire was prepared and validated by research consultant and
experts.
The said questionnaire contained of 5 parts:
Part I described the profile of state universities and colleges;
Part II described the corporatization strategies employed in the university;
Part III described how the revenues from corporatization were utilized;
Part IV described the performance of the college or university along the four-fold mandated
functions of the state universities and colleges; and
Part V described the satisfaction level of the respondents with the income utilization in their
respective college or university.
The researchers also used frequency and percentage in describing the SUC profile, a mean in
describing satisfaction level on income utilization and ANOVA in determining the differences
among state universities and colleges in Region III on the basis of profile, income generation,
and income utilization. When it comes to the relationship between the employees’ satisfaction
and the four-fold SUCs functions, the Pearson’s r Correlation was employed.
To support the respondents’ answers in the questionnaire, an interview was conducted. Do
During the interview, the researchers asked the following questions: what are the possible
IGPs that your school is doing; where does the income of your school come from; are you
required to submit your subject syllabi; are the faculty in your university required to undergo
researches; are the faculty members provided enough trainings, workshops, and seminars for
personal and professional update; and so on.
The researchers also utilized interview technique in clarifying or verifying data. For other
data which might prove to be necessary in her study, she also used content analysis using
reports and written materials like annual reports, brochures and handouts which the SUCs
freely allowed for public consumption.

Journal of Public Administration and Governance
ISSN 2161-7104
2018, Vol. 8, No. 2
http://jpag.macrothink.org 291
2.1 Research Model
Figure 1. The Model of the Study
5. Findings and Discussion
Table 3 shows the profile of respondent State Colleges and Universities in Region III. As the
table indicates, SUCs in region III generated a total of 1,279,694,000PhP of income in the
last five years. The smallest income generated is that of Aurora State College of Technology
with only 10,200,000.00 income while the highest income is realized by Bulacan State
University with 286,260,000.00. The number of students catered by the SUCs varies
depending on the size and number of programs. The profile of SUC’s in region III in the
Philippines is presented below.
Table 3. Summary Table of SUC Profile
SUC No. of
Programs
Enrolment
Size
No. Of Teaching
Personnel
No of Non-Teaching
personnel
Average Income Generated in
the Last Five Years (Php)
CLSU 50 10,296 533 631 175,800,000
NEUST 42 19,681 300 137 91,775,000
PAC 30 4,097 187 208 18,000,000
DHVTSU 25 13, 138 333 88 113,073,000
PhilSCA 12 1,428 112 78 35,000,000
BSU 55 24,211 385 92 286,260,000
BASC 15 2,900 270 81 19,290,000
TCA 24 3,905 122 128 49,842,000
TSU 80 14,136 249 222 156,968,000
RMTU 45 9,137 246 102 72,350,000
BPSU 25 13,233 492 302 208,836,000
PMMA 21 2,170 58 47 42,300,000
ASCOT 32 2,498 102 71 10,200,000
Grand Total 456 107,692 3389 2187 1,279,694,000
Grand Mean 35.08 8284 260.692 168.231 98,438,000
Income utilization
Instruction
Research Extension
Production
Administrative Services
Mandatory reserve
Modes of Income Generation
Outsourcing Merger
Joint venture Use of economic assets
School fees and fund raising
Four-fold functions of the University
( Instruction, Research, training and extension,
production)
1. Instruction
2. Research
3. Extension
4. Production
Profile of SUCs
Number of programs
Number of enrollees
Number of
administrative staff
Income in the past
five years

Journal of Public Administration and Governance
ISSN 2161-7104
2018, Vol. 8, No. 2
http://jpag.macrothink.org 292
The top state universities which offered the most number of courses were: Tarlac State
University (TSU), with the highest number of programs offered with 80 courses; Bulacan
State University with 55 courses offered; and Central Luzon State University with 50 courses
offered. Philippine State College of Aeronautics got the least number of courses offered (12
courses).As to the size of enrolment, the state universities and colleges varied. Bulacan State
University (BSU) got the highest number of enrollees with a total population of 24, 211
students; Nueva Ecija University of Science and Technology (NEUST) with a total of 19, 681
students; and Tarlac State University (TSU) with 14, 136 students. PhilSCA got the least
number of enrollees, 1,428 students. In terms of the number of personnel, the result also
varied. The Central Luzon State University or CLSU had the highest number with 533;
Bataan Peninsula State University (BPSU) got 492 faculty members; Bulacan State
University (BSU) had 385; and the institution with least number of personnel wasthe “The
Philippine Merchants Marine Academy (PMMA)” with 58 teaching personnel. As to the
number of administrative personnel, the 13 state universities and colleges in region 3 also
varied. Central Luzon State University (CLSU) still got the highest number of non-teaching
personnel with 631; Bataan Peninsula State University (BPSU), 302; Tarlac State University
(TSU), 222; and the least was Philippine Merchants Marine Academy (PMMA) with 47
non-teaching personnel. In the amount of income earned, the university with the highest
average income in the past five years was Bulacan State University (BSU) with Php. 286,260
000.00; next to it was Bataan Peninsula State University (BPSU) with Php. 208,836,000.00;
the 3rd was the Central Luzon State University (CLSU) with Php. 175,800,000.00; and
Aurora State College of Technology (ASCOT) had the lowest average income in the past five
years with Php.10,200,000.00.
Table 4 presents the manner SUCs in the Region use their income generated from its
operations. Income from the collection of school fees remains the largest source of SUC
income for the past five years. The complete modes and manner of generating income of
SUCs in the region is presented below.
Table 4. Summary of Modes of Income Generation Utilized by State Universities and
Colleges
Modes Mean Interpretation
1. Outsourcing services for the following:
a. catering 4.16 Often
b. security 3.21 Sometimes
c. janitorial 2.11 Seldom
d. electrical maintenance 3.20 Sometimes
Mean 3.17 Sometimes
2. Joint venture with other sectors in terms of the following:
a. Instruction 4.32 Very Often
b. Research 3.85 Often
c. Extension 2.93 Sometimes
d. Production 3.15 Sometimes
Mean 3.56 Often
3. Use of economic assets thru the following. IGPs:
a. Space rental 4.24 Very Often
b. Garment Production 2.71 Sometimes

Journal of Public Administration and Governance
ISSN 2161-7104
2018, Vol. 8, No. 2
http://jpag.macrothink.org 293
c. Food Processing 2.93 Sometimes
d. Agricultural Production 4.25 Very Often
e. Computing and Printing services 4.35 Very Often
f. Consultancy services 2.87 Sometimes
g. Technical Services 4.32 Very Often
h. Catering Services 2.54 Sometimes
Mean 3.53 Often
4. Income from school fees
a. Tuition Fee 4.49 Very Often
b. Miscellaneous Fee 4.35 VeryOften
c. Parents Teachers Association (PTA) 4.22 VeryOften
d. Student Government Fee 4.31 VeryOften
e. Laboratory Fee 4.44 VeryOften
f. Athletics Fee 4.36 VeryOften
g. Cultural Fee 2.76 Sometimes
Mean 4.13 Very Often
5. Fund raising
a. Cultural Shows 4.32 Very Often
b. Raffle 3.14 Sometimes
c. Money Contest 1.92 Seldom
d. Solicitations 2.10 Seldom
e. Auctions 2.09 Seldom
Mean 2.71 Sometimes
Legend: 4. 21 – 5.00 - Very Often
3.41 – 4.20 - Often
2.61 – 3.41 - Sometimes
1.81 – 2.60 - Seldom
1.80 and below - Never
The above mentioned findings show that still, it is through the collection of school fees where
the state universities and colleges gather more savings. No wonder why there had been moves
to increase students’ tuition fee in state universities and colleges in the last several years. It
could be recalled that enrolling in state universities and colleges was more difficult in the past.
Screening was tough that only a few could qualify. Now that students collection has proven
the most efficient way to earn income, there is likelihood that state universities and colleges
get a little elasticity in their enrolment policies and increase tuition fees or else they will have
a trivial chance to earn income for other programs and projects.
The current need of SUCs to increase their enrolment also pause a problem for private higher
education institutions which have been partners of the governments in educating the nation
from the beginning of the history of higher education. They are not receiving any financial
support from the government except for the handful Financial Assistance to Private Education
(FAPE) and now, they are being threatened by the realities of promotional campaigns of
SUCs who could offer education for much lower tuition fees even though they may
occasionally increase tuition.
In general, the 13 state colleges and universities generate income mostly from tuition fees,
joint venture, and through the use of economic assets. They also resort to outsourcing and
fund raising activities but is frequently done.

Journal of Public Administration and Governance
ISSN 2161-7104
2018, Vol. 8, No. 2
http://jpag.macrothink.org 294
Table 5. Summary Table for State Universities and Colleges Percentage Income Utilization
State Universities and Colleges
CLSU NEUST PAC DHVTSU PhilSCA BSU BASC TCA TSU RMTU BPSU PMMA ASCOT
1. Instruction
a. Faculty
and Staff
Development
14 13 13 12 13 12.5 12.5 12 12.5 11 12 13 12
b.Curriculum
Development
13 14 10 11 13 12.5 12.5 12 12.5 12 12 12 11
c.Student
Development
11 12 10 11 11.5 12.5 12.5 12 12.5 11 11 13 12
d.Facilities
Development
12 12 13 12.5 12 12.5 12.5 12 12.5 12 12 11 13
Mean 50 51 46 46.5 49.5 50 50 48 50 46 47 49 48
2. Research
Services
11 11 12.5 11 10 10 10 11 10 11 10 11 10
3. Extension
Services
10 11 12 11 10 10 10 11 10 11 10 10 10
4. Production 11 9 12 11 10.5 10 10 10 10 11 13 10 12
5.
Administrative
Services
9 9 9 10.5 10 10 10 10 10 11 10 10 10
6. Mandatory
Reserve
9 9 8.5 10 10 10 10 10 10 10 10 10 10
Total 100 100 100 100 100 100 100 100 100 100 100 100 100
For income utilization, Central Luzon State University (CLSU) allocates half of its income
tothe following (according to rank): instruction, faculty and staff development, curriculum,
facilities and student development. Only minimal amount was allotted to extension, research,
production, administration, and mandatory reserve.
The Nueva Ecija University of Science and Technology (NEUST) utilized most of its income
to instruction, with the following distribution according to rank: curriculum, faculty and staff,
students, and facilities development. In terms of research and extension, administration
services, production, and mandatory reserve, NEUST only allotted minimal budget in these
areas.
Pampanga Agricultural College (PAC) shared most of its income to instruction with the
following distribution according to rank: faculty and staff development and facilities
development. The remaining portion of their income was allotted for research, production,
administration and mandatory reserve.
In the case of Don Honorio Ventura Technological State University (DHVTSU), majority of
the income were allotted to instruction distributed according to rank: facilities, faculty and
staff development, curriculum, and student development, and only minimal was allotted to
research, extension, and production as well as to administrative services and only minimal to
mandatory reserve.
PhilSCA allotted its income mostly for instruction. Next to it was intended for faculty, staff,
curriculum, and student development. Production was given the least allotment, followed by
research, extension, administrative services and mandated reserve.

Journal of Public Administration and Governance
ISSN 2161-7104
2018, Vol. 8, No. 2
http://jpag.macrothink.org 295
For Bulacan State University (BSU), Bulacan Agricultural State College (BASC), and Tarlac
State University (TSU), majority of their income were allotted appropriately to instruction
which was divided equally to the faculty and staff development, curriculum, student
development and facilities. They allotted the remaining budget to research, extension,
production, administrative services, and mandatory reserve.
Tarlac College of Agriculture’s (TCA) allocation for instruction was equally distributed
among faculty and staff development, curriculum, student development, and facilities. Next
to it was extension and production, followed by research, administrative services, and
mandatory reserve.
Ramon Magsaysay Technological University (RMTU) gave the highest generated income to
instruction - curriculum and facilities, faculty and staff development, for student development,
research, extension, production, and administrative services. The least was allotted to
mandatory reserve.
For Bataan Peninsula State University (BPSU), most of the budget was allocated for
instruction- faculty and staff development, curriculum, facilities,and student development.
Sharing equal allotments out of the remaining income were apportionedto research, extension,
administrative services, and mandated reserve.
On the part of the Philippine Merchants Marine Academy (PMMA), appropriated amount for
instruction was divided according to rank: faculty, staff, student, curriculum, and facilities
development. The remaining income was allocated to research, extension, production,
administrative services, and mandated reserve.
For Aurora State College of Technology (ASCOT), most of the income was allotted to
instruction in terms of facilities, faculty, staff, student, and curriculum developments.
Production received the largest allotment from the remaining areas for income priorities.
As a general finding, the 13 SUC respondents found to be allotting the largest portion of their
income to areas that would strengthen instruction like faculty and staff, curriculum, students,
and facilities development.
Table 6. Stakeholders Satisfaction Level on Income Utilization
SUC Mean Interpretation
CLSU 4.65 Very Satisfied
NEUST 4.80 Very Satisfied
PAC 4.32 Very Satisfied
DHVTSU 4.22 Very Satisfied
PhilSCA 4.21 Very Satisfied
BSU 4.56 Very Satisfied
BASC 4.67 Very Satisfied
TCA 4.51 Very Satisfied
TSU 4.68 Very Satisfied
RMTU 4.30 Very Satisfied
BPSU 4.44 Very Satisfied
PMMA 4.25 Very Satisfied
ASCOT 4.21 Very Satisfied
Grand Mean 4.45 Very Satisfied

Journal of Public Administration and Governance
ISSN 2161-7104
2018, Vol. 8, No. 2
http://jpag.macrothink.org 296
Legend:
4.21-5:00 - Very Satisfied
3.41-4.20 - Satisfied
2.61-3.40 - Moderately Satisfied
1.81-2.60 - Slightly Satisfied
1.80 below - Not Satisfied at all
The table 6 shows that all the stakeholder-respondents were very satisfied about the way the
state universities and colleges utilized their income. Among the state universities and colleges
which obtained the highest mean were the Nueva Ecija University of Science and Technology
(NEUST), 4.80; Tarlac State University (TSU), 4.68; Bulacan Agricultural State College
(BASC), 4.67; Central Luzon State University (CLSU), 4.65, and Bulacan State University
(BSU), 4.56. The overall mean of the satisfaction level of all the respondents from the
different state universities and colleges is 4.45 which can be verbally interpreted as very
satisfied.
The satisfaction of the stakeholders in the way the income of the university is utilized tells so
much about the effectiveness of handling the state universities and colleges income resources.
This being the case, it can be deduced that as a whole the income utilization in the subject
schools were very satisfactory as evidenced by their well-rounded curricular design, modern
technology-based instructional materials, faculty and student development programs and
facilities improvement.
When summarized, all of them were found to be very satisfied about the way the income of
the state universities and colleges were utilized. Among them were Nueva Ecija University of
Science and Technology (NEUST), Tarlac State University (TSU), Bulacan Agricultural State
College (BASC), Central Luzon State University (CLSU), and Bulacan State University
(BSU).PhilSCA and ASCOT were the least satisfied among the 13 colleges and universities
in Region 3.
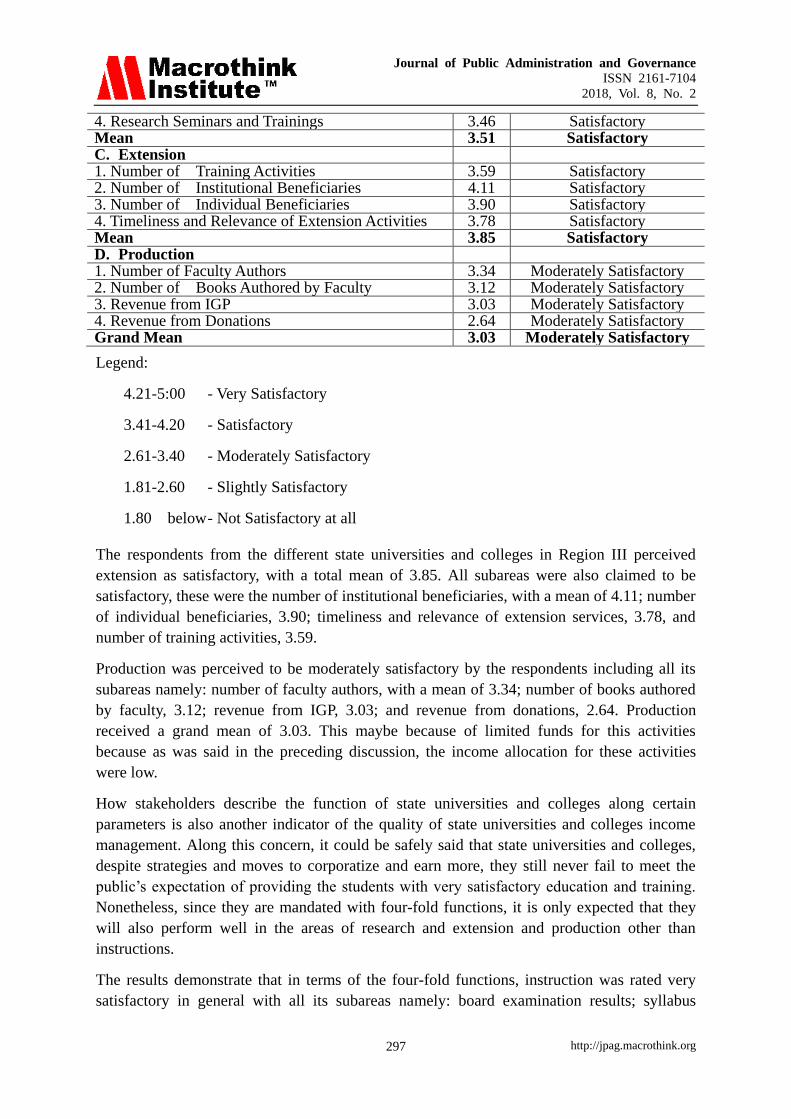
Table 7. Performance of the State Universities and Colleges in Region 3 in Terms of the
Four-fold Functions
Functions Mean Interpretation A. Instruction 1. Board Examination Result 4.42 Very Satisfactory 2. Test Construction 4.24 Very Satisfactory 3. Syllabus Preparation 4.33 Very Satisfactory 4. Academic Competitions 4.29 Very Satisfactory Mean 4.32 Very Satisfactory B. Research 1. Research Programs 3.48 Satisfactory 2. Research Projects 3.69 Satisfactory 3. Research Dissemination (Publication & Presentation)
3.41 Satisfactory
Journal of Public Administration and Governance
ISSN 2161-7104
2018, Vol. 8, No. 2
http://jpag.macrothink.org 297
4. Research Seminars and Trainings 3.46 Satisfactory Mean 3.51 Satisfactory C. Extension 1. Number of Training Activities 3.59 Satisfactory 2. Number of Institutional Beneficiaries 4.11 Satisfactory 3. Number of Individual Beneficiaries 3.90 Satisfactory 4. Timeliness and Relevance of Extension Activities 3.78 Satisfactory Mean 3.85 Satisfactory D. Production 1. Number of Faculty Authors 3.34 Moderately Satisfactory 2. Number of Books Authored by Faculty 3.12 Moderately Satisfactory 3. Revenue from IGP 3.03 Moderately Satisfactory 4. Revenue from Donations 2.64 Moderately Satisfactory Grand Mean 3.03 Moderately Satisfactory
Legend:
4.21-5:00 - Very Satisfactory
3.41-4.20 - Satisfactory
2.61-3.40 - Moderately Satisfactory
1.81-2.60 - Slightly Satisfactory
1.80 below - Not Satisfactory at all
The respondents from the different state universities and colleges in Region III perceived
extension as satisfactory, with a total mean of 3.85. All subareas were also claimed to be
satisfactory, these were the number of institutional beneficiaries, with a mean of 4.11; number
of individual beneficiaries, 3.90; timeliness and relevance of extension services, 3.78, and
number of training activities, 3.59.
Production was perceived to be moderately satisfactory by the respondents including all its
subareas namely: number of faculty authors, with a mean of 3.34; number of books authored
by faculty, 3.12; revenue from IGP, 3.03; and revenue from donations, 2.64. Production
received a grand mean of 3.03. This maybe because of limited funds for this activities
because as was said in the preceding discussion, the income allocation for these activities
were low.
How stakeholders describe the function of state universities and colleges along certain
parameters is also another indicator of the quality of state universities and colleges income
management. Along this concern, it could be safely said that state universities and colleges,
despite strategies and moves to corporatize and earn more, they still never fail to meet the
public’s expectation of providing the students with very satisfactory education and training.
Nonetheless, since they are mandated with four-fold functions, it is only expected that they
will also perform well in the areas of research and extension and production other than
instructions.
The results demonstrate that in terms of the four-fold functions, instruction was rated very
satisfactory in general with all its subareas namely: board examination results; syllabus

Journal of Public Administration and Governance
ISSN 2161-7104
2018, Vol. 8, No. 2
http://jpag.macrothink.org 298
preparation, academic competitions, and test construction. Research with all its sub-areas
namely: research projects, research programs, research seminars and trainings, and research
dissemination were all rated satisfactory Extension was rated satisfactory. Production was
rated “moderately satisfactory” in terms of the following items: number of faculty authors got
a mean of 3.34; number of books authored by faculty, 3.12; revenue from IGP, 2.64; and
revenue from donations, 2.64. As its general mean, production got a mean of 3.03.
The results show that in terms of production or IGP, the different universities and colleges
have enough income because they have enough faculty book authors, enough number of
books authored by the faculty, enough profits coming from IGP, and coming from donations.
This only indicates that the universities and colleges have self-sustaining capacity to operate.
This also signifies that the faculty are satisfied inasmuch as they have extra-income received
from the books authored by them.
Table 8. Comparison among State Universities and Colleges in Terms of their Profile,
Average Income Generated in the Past Five Years, and their Income Utilization
Point of Comparison
ANOVA Value
Decision Tabular Value df @ 0.01 **
Interpretation
No. of Programs Offered
34.05 Greater 26.217 Significant
Enrolment Size
41.91 Greater 26.217 Significant
No. of Teaching Personnel
32.88 Greater 26.217 Significant
No. of Non- Teaching Personnel
34.44 Greater 26.217 Significant
Average Income Generated in the Last Five (5) Years
40.11 Greater 26.217 Significant
Income Generation 38.23 Greater 26.217 Significant Income Utilization 7.28 Lesser 26.217 Not Significant
Table 8 shows the difference among the state universities and colleges in Region III in terms
of their profile, namely: number of programs, enrolment size, number of teaching and
non-teaching personnel, and their average income generated in the past five years, and
income utilization.
An ANOVA t- value of 34.05 is obtained from the comparison of the number of programs
offered by the state universities and colleges in Region III. The t- value is greater than the
tabular value of 26.217 which was significant at 0.01 level. This means that the number of
programs offered by the state universities and colleges significantly vary. The null
hypothesis therefore is rejected. There is a significant difference between the number of
programs offered by the state universities and colleges. This also means that there are SUCs
offering significantly fewer programs than their other SUC counterparts. Partly, this could be
accounted to the nature of specialization the SUC was mandated to offer in the first place.
The PhilsCa and the BulSu were two good examples. The programs that PhilsCa should offer
to the public must be limited only to those related to aeronautics and there are only few. In

Journal of Public Administration and Governance
ISSN 2161-7104
2018, Vol. 8, No. 2
http://jpag.macrothink.org 299
brief, the range of courses that PhilsCa could offer is not as wide as those that BulSu could
offer. BulSu could offer HRM or Criminology or BS Chemistry; PhilsCa could not because it
is an aeronautics school. NEUST is another example. Before its conversion to a university, it
offered technical and vocational courses only as what its former name implied, Central Luzon
Polytechnic College or CLPC, which was mandated by the state to offer varied courses along
technical field only. It was only after its conversion into a university that it was allowed to
offer courses along the arts sciences area.
The t- value (ANOVA) of 41.91 is derived from comparison of the size of the enrolment of
the state universities and colleges in Region III was greater than the tabular value of 26.217
and significant at 0.01 level. The value implied that enrolment size among the state
universities and colleges significantly differed. Therefore the null hypothesis was rejected.
There was a significant difference between the state universities and colleges in terms of
enrolment size. This was because number of enrolment tended to go with the number of
program offerings too.
The t- value of 32.88 is derived from the comparison of the number of teaching personnel of
the state universities and colleges which is greater than the tabular value and significant at
0.01 level. This means that state universities and colleges significantly differed in the number
of teaching personnel. Therefore, the null hypothesis was rejected. There was a significant
difference among the state universities and colleges in terms of the number of their teaching
personnel.
The same finding as above was true with the number of non-teaching teaching personnel
wherein a t- value of 34.33 was obtained from the comparison of the number of non-teaching
personnel among the state universities and colleges. The t- value was greater than the tabular
value and significant at 0.01 level. This means that the state universities and colleges
significantly differed in the number of teaching personnel. Therefore, the null hypothesis was
rejected. There was a significant difference among the state universities and colleges in terms
of the number of their non- teaching personnel.
In terms of average income generated in the past 5 years, a t- value of 40.11 is derived. It is
greater than the tabular value and significant at 0.01 level. Therefore, the null hypothesis is
rejected. There is a significant difference among the state universities and colleges in terms of
their average income in the last five years.
The significant differences observed among SUCS in terms of the above mentioned variables
of program offerings, size of enrolment, number of teaching and non teaching personnel as
well as income earnings brought the researches to think that these variables were generically
or basically dependent upon the SUC’s nature or basic mandate.
In terms of the modes for income generation, a t- value of 38.23 was derived which was
greater than the tabular value of 26.217. This means that there is a significant difference
among the state universities and colleges in terms of mode of income generations.
On income utilization, a t- value of 7.28 is obtained which is lesser than the tabular value. It
indicates that there was no significant difference among the SUCs in terms of income

Journal of Public Administration and Governance
ISSN 2161-7104
2018, Vol. 8, No. 2
http://jpag.macrothink.org 300
utilization. Therefore, the null hypothesis was accepted. The SUCs concerned tended to have
similarities in the way they prioritize when utilizing their income. This could be because
SUCS were bound by common rules and expectations that they tended to be similar in focus
and prioritization; unlike in the other profile variable where differences were inherent and
evident from the beginning.
Table 9. Correlation between the Employees Satisfaction Level and the Described State
Universities and Colleges’ Performance in terms of their Four-Fold Functions
The table below shows the correlation between the employees’ satisfaction level and the
universities and colleges’ performance in terms of instruction, research, extension, and
production.
Correlation Employees’ Satisfaction in Income Utilization
Interpretation
Instruction
0.894** Significantly Correlated @ 0.01 level
Research 0.419** Significantly Correlated @ 0.01 level
Extension 0.527** Significantly Correlated @ 0.01 level
Production 0.771** Significantly Correlated @ 0.01 level
Based on the findings in terms of the relationship between the employees’ satisfaction and the
fourfold SUC functions, between the performance of the state universities and colleges in
terms of instruction and the employees’ satisfaction when it comes to income utilization, an r
value of 0.894 was obtained which was significant at 0.01 level; between the performance in
research and the satisfaction of the employees in income utilization, there was an r value of
0.419 obtained and significant at 0.01 and with a high level of correlation.
There was an r value of 0.527 derived from the relationship between extension performance
of the state universities and colleges and the satisfaction of the employees in income
utilization was significant at 0.01 level; and lastly, between the performance of the state
universities and colleges in terms of production and the employees’ satisfaction level, an r
value of 0.771 was obtained which was significant at 0.01 level.
Based on the findings from the above, it was concluded that the SUCs in Region III varied in
terms of their program offerings, enrolment size, number of teaching personnel, number of
non-teaching personnel, and average income in the last five years. They generate income
mostly from tuition fees, joint venture, and use of economic assets. It was only sometimes
that they made outsourcing, and fund raising activities. They were found to be allocating the
largest portion of their income to areas that would strengthen instruction like, faculty and
staff, curriculum students and facilities development. The areas of research, extension and
production tend to be given lesser priority.
The respondents were very satisfied with the income utilization in their respective SUCs.
However those from Nueva Ecija University of Science and Technology (NEUST),Tarlac
State University (TSU), Bulacan Agricultural State College (BASC), Central Luzon State

Journal of Public Administration and Governance
ISSN 2161-7104
2018, Vol. 8, No. 2
http://jpag.macrothink.org 301
University (CLSU), and Bulacan State University (BSU) were the most satisfied; while those
from PhiSCA and ASCOT were the least satisfied.
There is a need to improve the performance of the SUCs in Region 3 primarily along the line
of production, research and extension.
The hypothesis of no significant difference among SUCs in terms of profile variable is
rejected. SUCS differ significantly in terms of their respective profiles and income utilization
is not significantly different..
The relationship between the employees’ satisfaction and the four fold functions of state
universities and colleges showed that there was a significant link between the performance of
the state universities and colleges and the employees’ satisfaction. The satisfaction level of
the respondents could be an indicator of their perception of the SUCs performance along their
four-fold functions.
6. Conclusion and Recommendations
From the conclusions drawn, the following are highly recommended: that the different
colleges and universities must employ mode of income generation that is most fitted for them;
SUCs which could not possibly have bigger size of enrolment due to constraints of mandated
program offering must not rely on school fees alone to earn income; they should be more
resourceful and aggressive in trying other modes such as utilization of economic assets fund
raising or joining venture with other institutions; they should also strengthen their link up
with other sponsoring agencies or beneficiaries and must likewise activate their alumni or
PTA association for major projects programs and activities; SUCs in region 3 should invest
more to intensify their research programs and projects as research may also result to
additional income; extension programs should also be given more priority as the community
can also be a potential partner in sourcing out income where both the school and the
community can be benefited; it may also be beneficial to invest more in production as in the
principle of money begets money. All the SUCs have to intensify their production activities
by first identifying a more lucrative production investment and by utilizing a workable,
functional and effective marketing plan.
Since Nueva Ecija University of Science and Technology (NEUST),Tarlac State University
(TSU), Bulacan Agricultural State College (BASC), Central Luzon State University (CLSU),
and Bulacan State University (BSU) were found to be the most satisfied with their respective
school’s income utilization, other SUCs may ask advice from them following the principle of
peer mentoring likeadopting the attitude of openness to mentoring; organizing themselves
together in the form of a regional association focusing alone on corporatization strategies
with the aim of developing a more satisfactory income generation and utilization among
SUCs. The association can be like the SCUAA or State Colleges and Universities Athletic
Association in principle. This may be termed as SUCs 3 Association for Corporate
Development (SUCS 3 ACD)
Since it was concluded that SUCs need to improve performance along the line of production,
research and extension, it is suggested that more administrative support be given to these
Journal of Public Administration and Governance
ISSN 2161-7104
2018, Vol. 8, No. 2
http://jpag.macrothink.org 302
areas: that state universities and colleges utilize their respective income in the direction of
research and extension. Income may also be used to fund researches and extension activities.
This may likewise be used as incentive for the faculty so as to motivate them to do researches
or involve themselves in extension activities; that there should be an initiative coming from
school administrators to shift the paradigm of the stakeholders who seemed to be contented
with how the income of their respective schools was being utilized. This only goes to show
that they do not believe much in research, which should not be the case because these two
were also indicators of quality instruction; and that the state universities and colleges should
assign a focal person or a director that oversees the production of the school. It should always
be remembered that production like research and extension is also an indicator of quality of
instruction.
Since the SUCs in Region 3 differ significantly in terms of their respective profile, it is
strongly recommended that the SUCs must create a committee to study potential approaches
to intensify their corporatization strategy according to their unique characteristics and to
devise a research-based corporatization plan; and that there should be another study to
explain the impact of significant difference among the number of programs offered by the
state universities and colleges.
The study proved that there was a significant link between the performance of the state
universities and colleges and the employees’ satisfaction. Therefore, they should be involved
in planning and organizing programs and projects in terms of the four-fold functions of the
state universities and colleges. The study showed that there is a correlation between
employees’ satisfaction and the manner SUCs utilized their income from private- like
operations. However, the study focused only on the four fold functions and linked the same to
their potential impact on motivations. Other studies in higher education corporatization
strategies may be done by other researchers using as variables: salaries received, wages,
packaged of benefits and other fringe benefits having direct rewards on the employees. The
potential sources of which are from income generated from corporatization strategies but
have direct influence on employees’ motivations which the present study failed to measure.
References
Alvaran, A. (2002). Resource Generation of Selected State Universities and Colleges: An
assessment
Bok, D. (2003). Universities in the Marketplace: The Commercialization of Higher Education.
Princeton, NJ: Princeton University Press, 2003.
Buchbinder, H. (1990). Social knowledge and market knowledge: universities in the
information age. Gannett Center Journal, 5, 17-29.
Duka, C. (2005). Review for the Licensure Examination for Teachers, Manila Review
Institute, Inc. Manila, Philippines
Fronda, J., Gabriel, A., & Loria, S. (2018). The Philippines at the Crossroads to Economic
Globalization. Open Journal of Social Sciences, 6, 128-151.

Journal of Public Administration and Governance
ISSN 2161-7104
2018, Vol. 8, No. 2
http://jpag.macrothink.org 303
https://doi.org/10.4236/jss.2018.61010
Gabriel, A. G., & Claudio, E. G. (2016) Study Manual on Politics, Governance and
Government with Philippine Constitution, Nueva Ecija University of Science and Technology
Printing Press, Cabanatuan City, Philippines.
Ginsberg, B. (2011). The Fall of the Faculty: The Rise of the All-Administrative University
and Why It Matters. New York: Oxford U P, 2011.
Malate, R. (2009). Impact of Corporatization on Higher Education
Mills, N. (2002). The Corporatization of Higher Education
Padua, R.N. (2003). International higher education quality assurance practices: Situating the
Philippine system.
Steck, H. (2003). Corporatization of the University: Seeking Conceptual Clarity. Annals of
the American Academy of Political and Social Science, 585(Jan.2003), 66-83.
https://doi.org/10.1177/0002716202238567
Villabroza, J. M. P. (2002). Rationalization of public higher institutions: towards greater
Efficiency http://www.insidehighered.com.
Copyright Disclaimer
Copyright for this article is retained by the author(s), with first publication rights granted to
the journal.
This is an open-access article distributed under the terms and conditions of the Creative
Commons Attribution license (http://creativecommons.org/licenses/by/4.0/).