statistics problems and review. types of statistics descriptive used to measure a trait or...
Post on 20-Dec-2015
220 views
TRANSCRIPT
Statistics Problems and Review
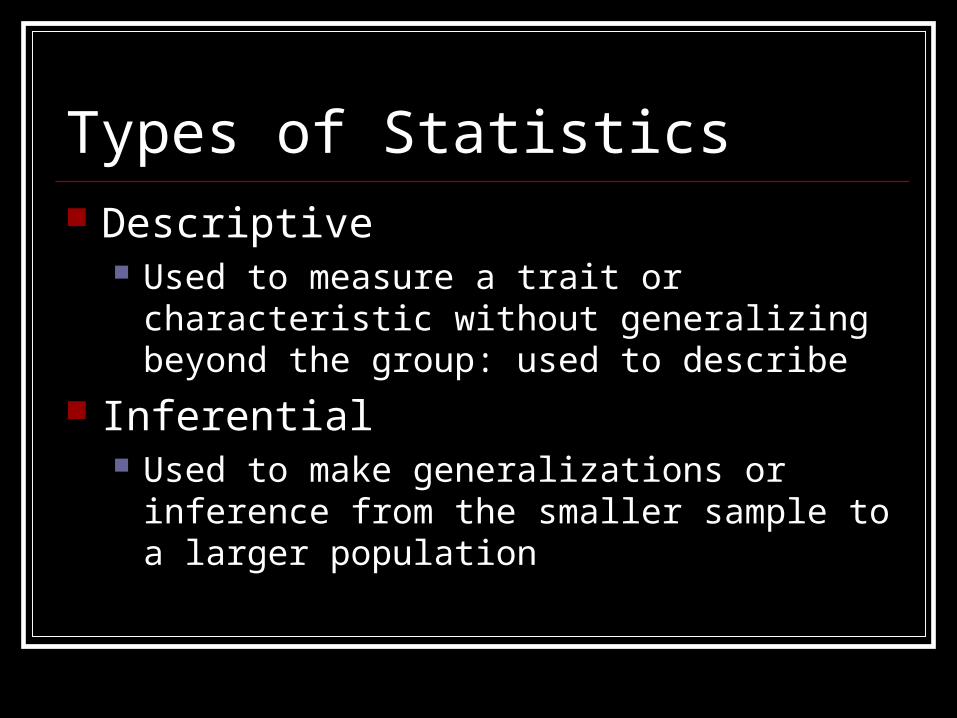
Types of Statistics Descriptive
Used to measure a trait or characteristic without generalizing beyond the group: used to describe
Inferential Used to make generalizations or inference from
the smaller sample to a larger population
0123456789
10#
of o
bser
vati
ons
0-99
100-
199
200-
299
300-
399
400-
499
500-
599
600-
699
700-
799
800-
899
Prolactin (ng/mL)
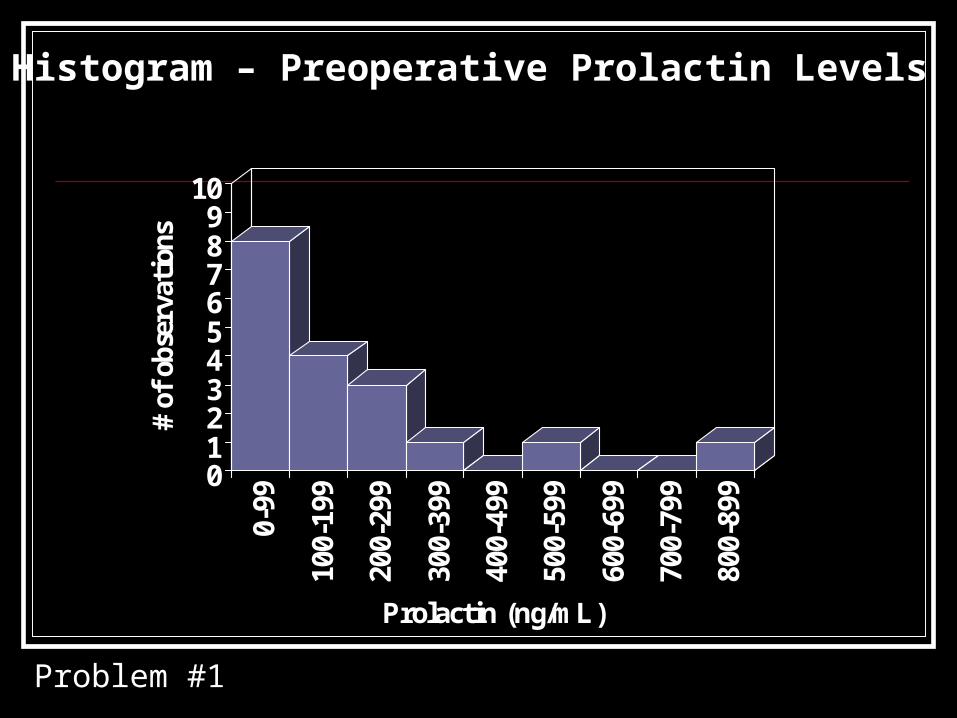
Histogram – Preoperative Prolactin Levels
Problem #1
0123456789
10#
of o
bser
vati
ons
0-99
100-
199
200-
299
300-
399
400-
499
500-
599
600-
699
700-
799
800-
899
Prolactin (ng/mL)
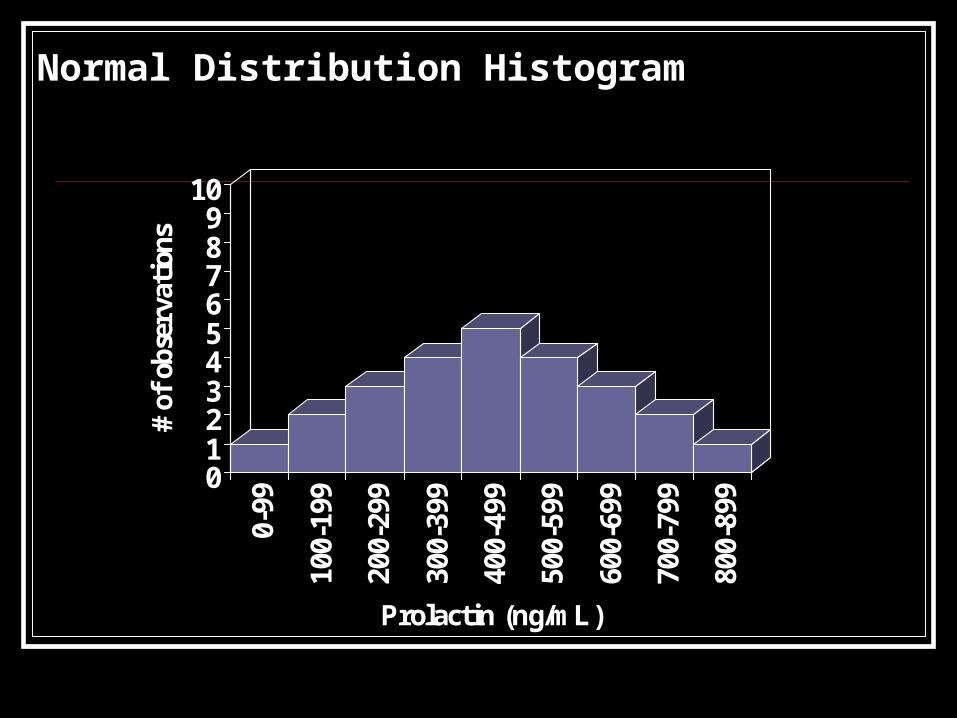
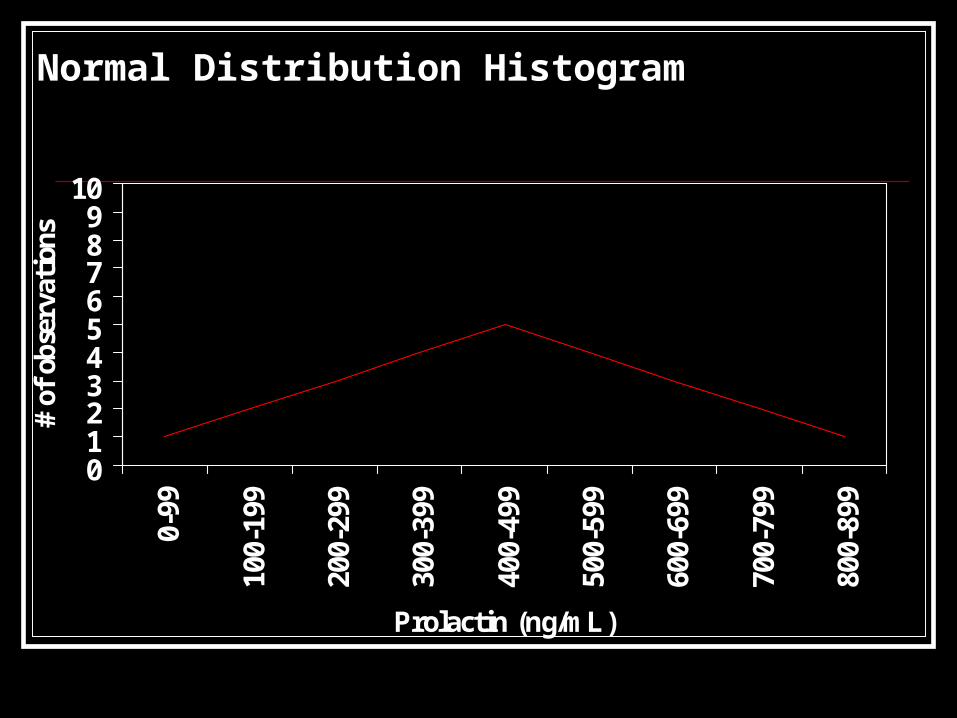
Normal Distribution Histogram
0123456789
100-
99
100-
199
200-
299
300-
399
400-
499
500-
599
600-
699
700-
799
800-
899
Prolactin (ng/mL)
# of
obs
erva
tion
sNormal Distribution Histogram
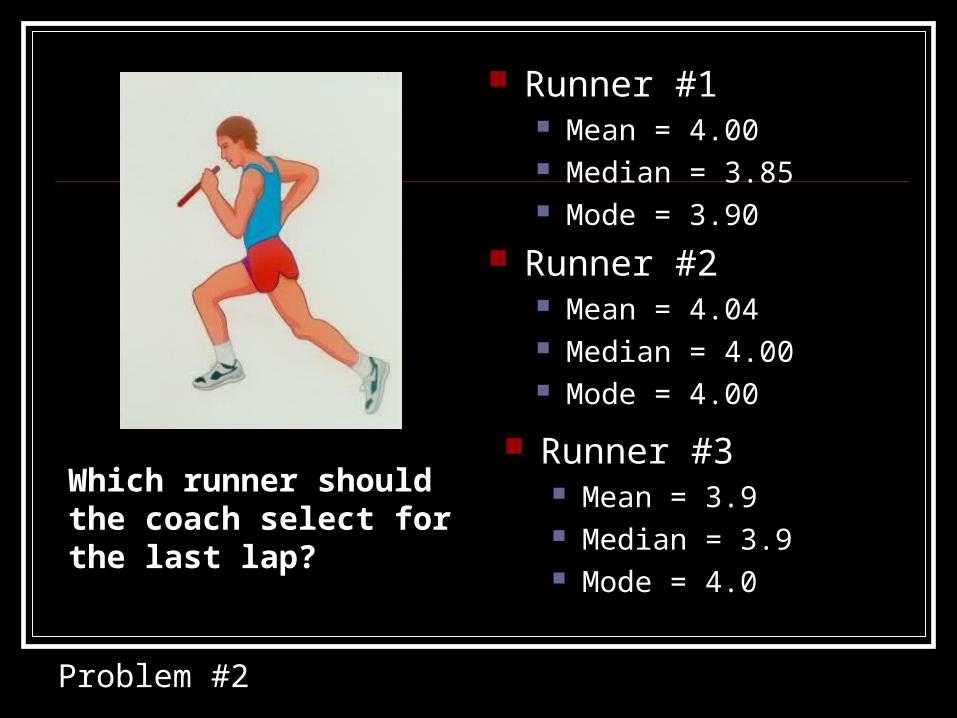
Runner #1 Mean = 4.00 Median = 3.85 Mode = 3.90
Runner #2 Mean = 4.04 Median = 4.00 Mode = 4.00
Runner #3 Mean = 3.9 Median = 3.9 Mode = 4.0
Which runner should the coach select for the last lap?
Problem #2
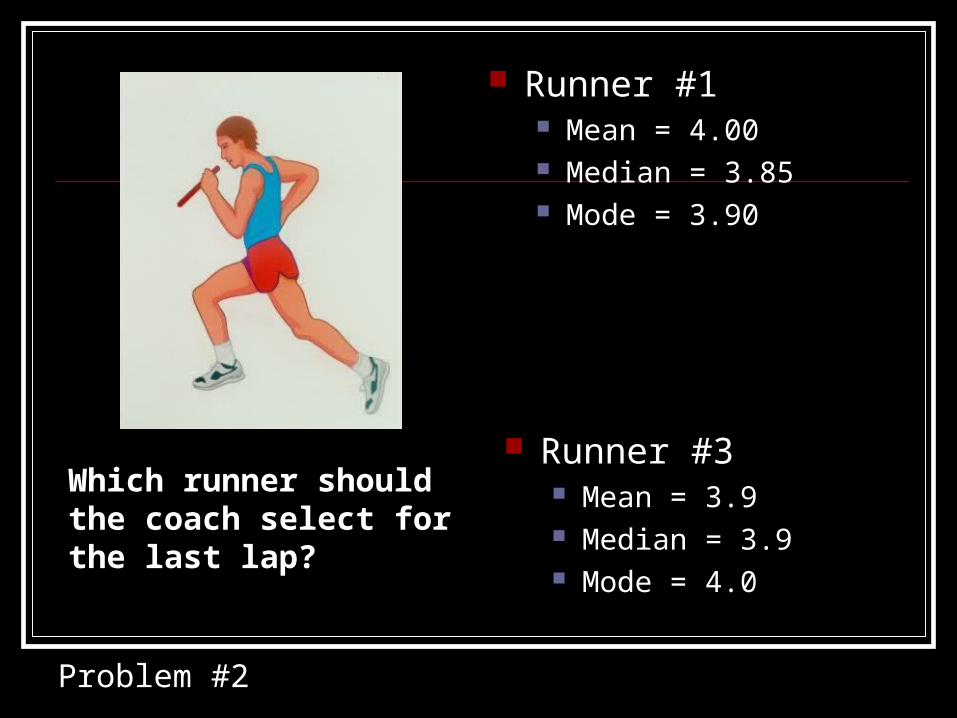
Runner #1 Mean = 4.00 Median = 3.85 Mode = 3.90
Runner #3 Mean = 3.9 Median = 3.9 Mode = 4.0
Which runner should the coach select for the last lap?
Problem #2

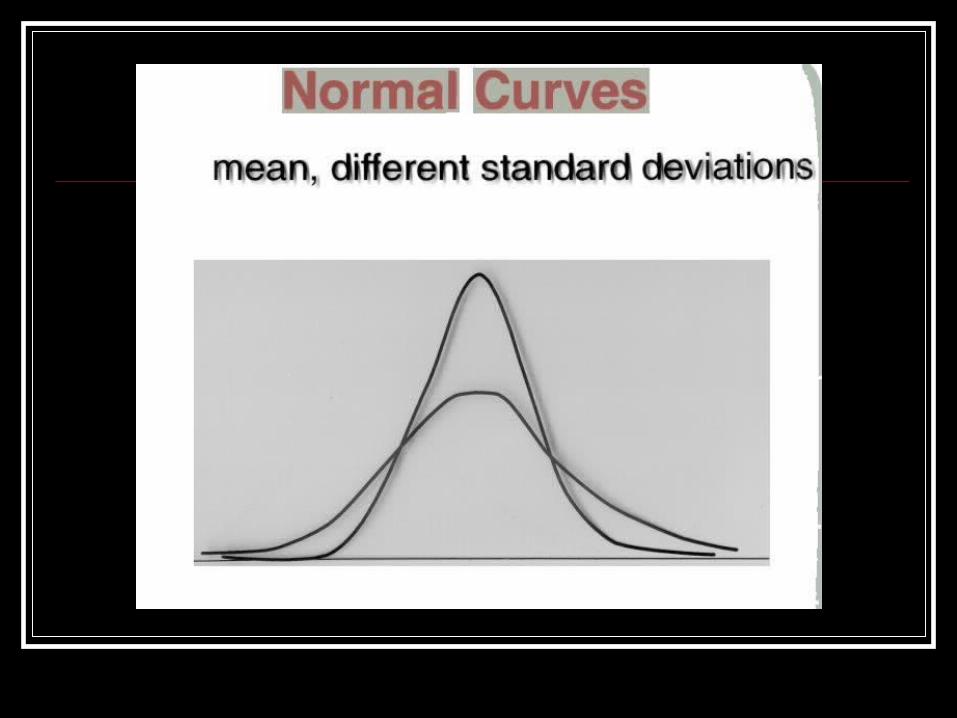
(a) Mean – 1 std dev includes 34.1% of the values. Values less than 1 std dev would be 50 – 34.1 or 15.9% times 300 in our sample = 47.7
Problem #3
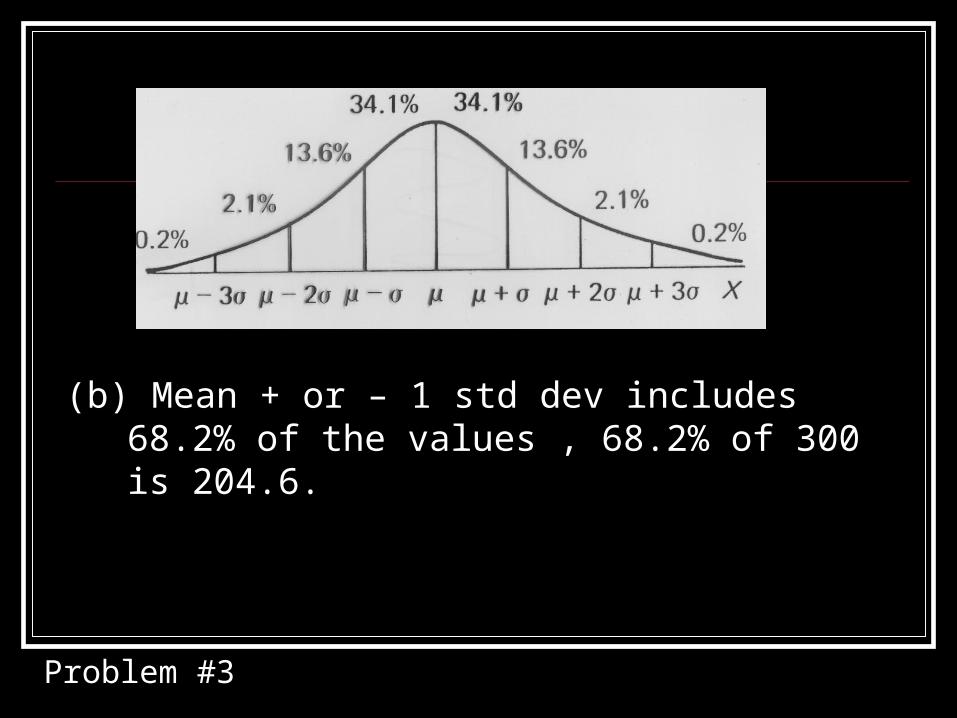
(b) Mean + or – 1 std dev includes 68.2% of the values , 68.2% of 300 is 204.6.
Problem #3
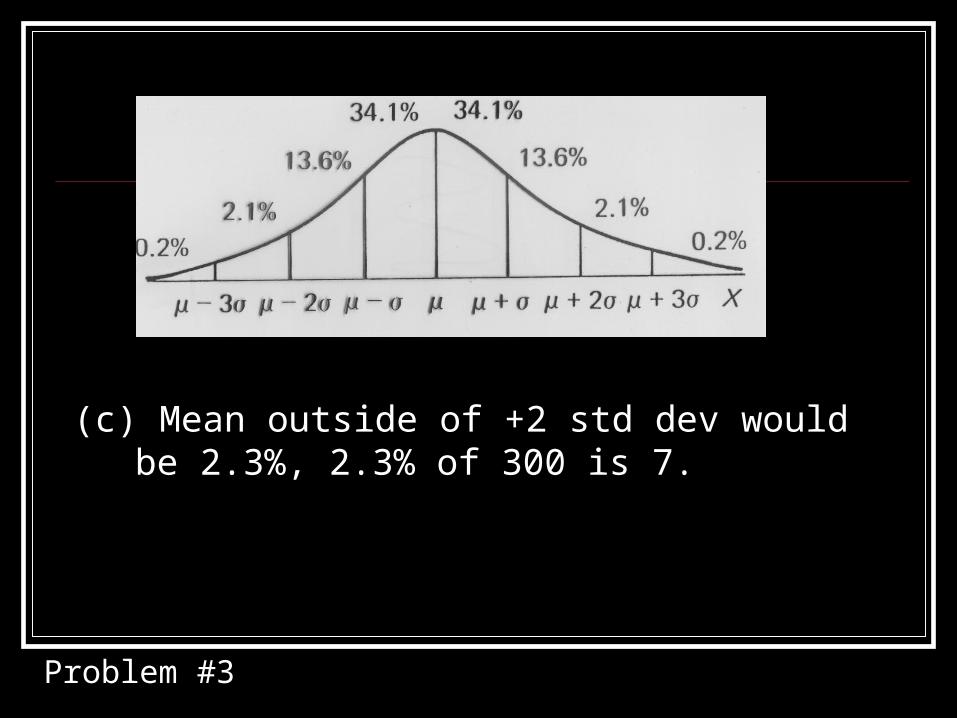
(c) Mean outside of +2 std dev would be 2.3%, 2.3% of 300 is 7.
Problem #3
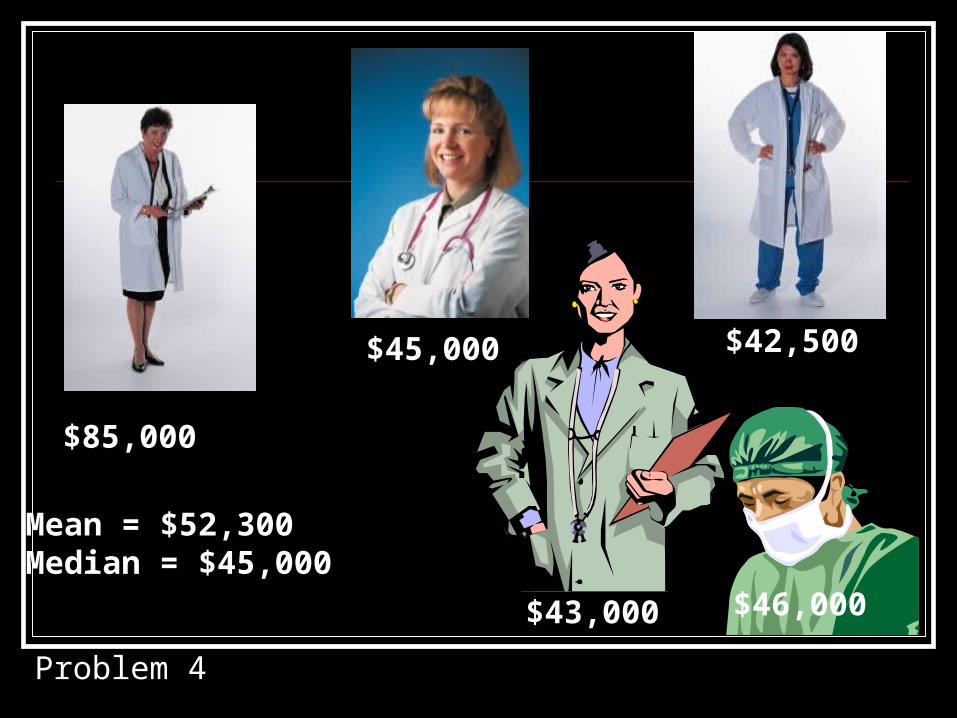
$85,000
$45,000 $42,500
$43,000 $46,000
Mean = $52,300Median = $45,000
Problem 4

Problem #5Old Method New Method
25 27
43 44
37 39
26 24
27 30
55 55
47 51
34 36
58 59
32 33
Wilcoxan Signed Rank Test
Null: No difference
Alter: Methods different
Test statistic = 2.14, p 0.068
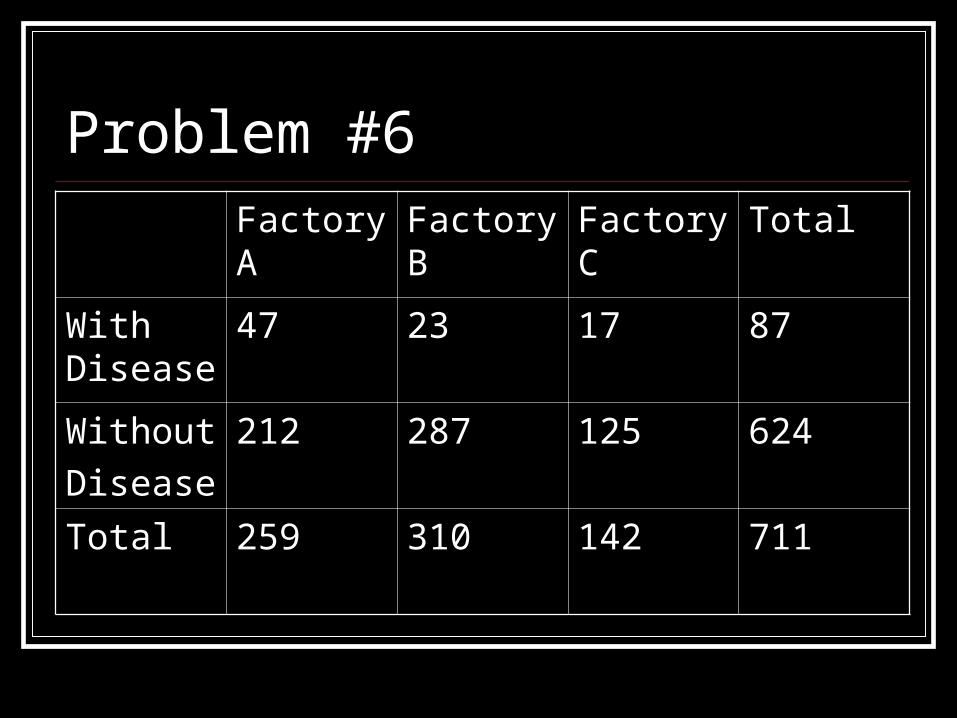
Problem #6Factory A
Factory B
Factory C
Total
With Disease
47 23 17 87
Without
Disease
212 287 125 624
Total 259 310 142 711
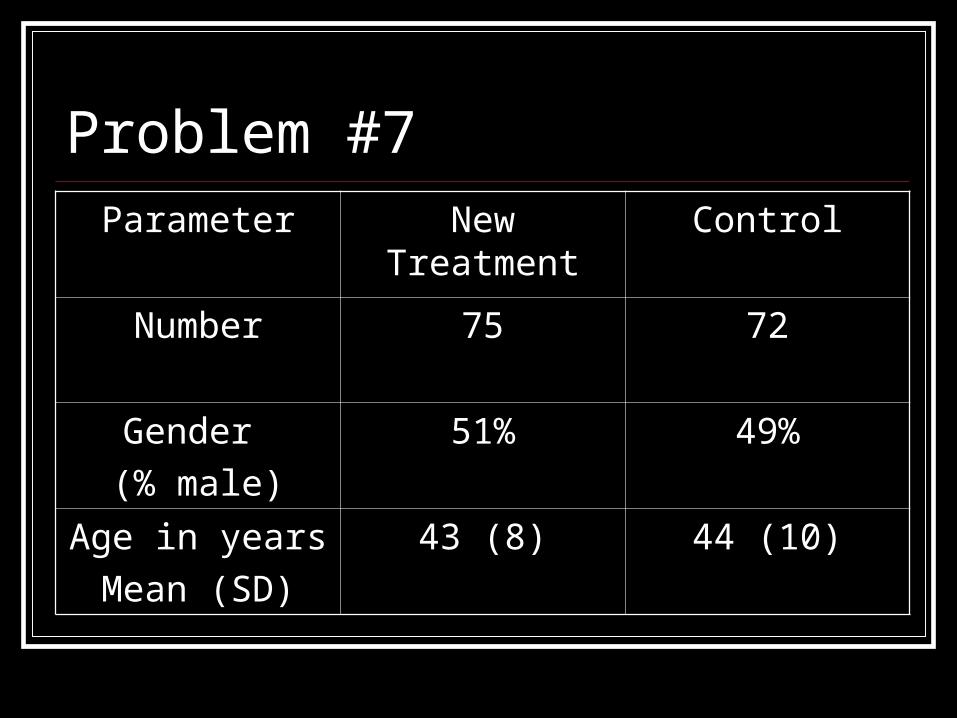
Problem #7Parameter New Treatment Control
Number 75 72
Gender
(% male)
51% 49%
Age in years
Mean (SD)
43 (8) 44 (10)
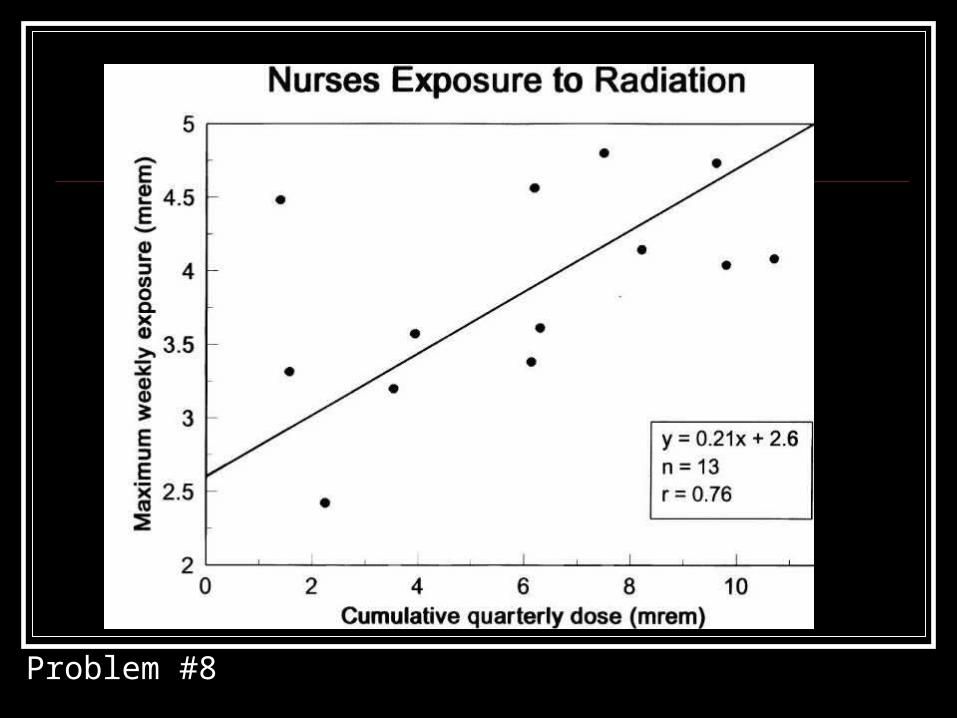
Problem #8

Perfect Correlation
0
1
2
3
4
5
6
0 1 2 3 4 5
Control
Exp
erim
enta
l
r = 1.00Slope = 1.00
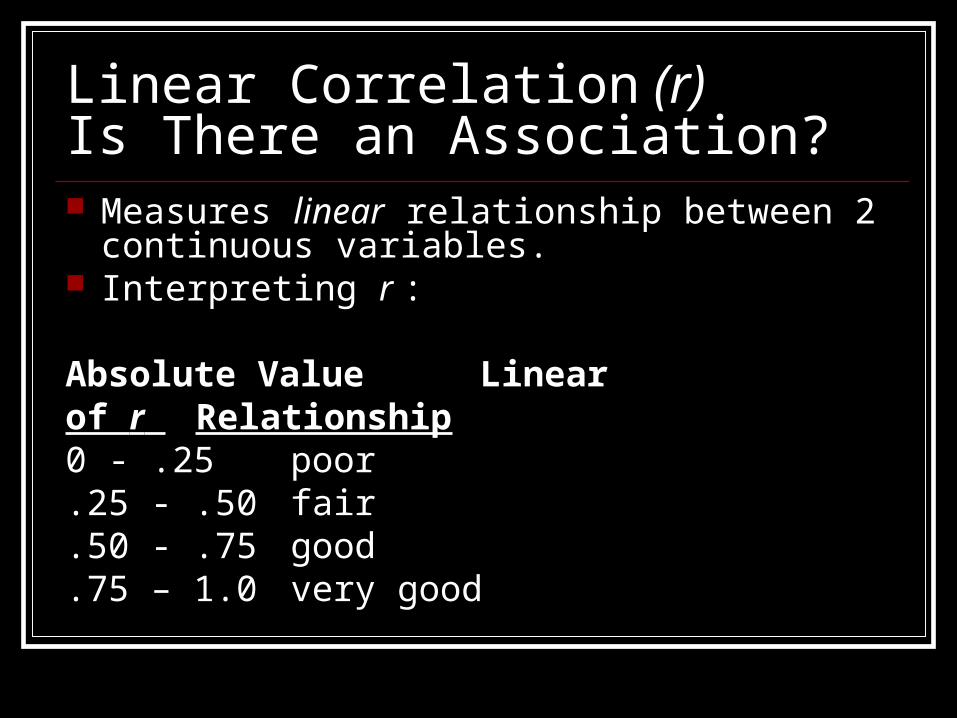
Linear Correlation (r)Is There an Association? Measures linear relationship between 2
continuous variables. Interpreting r :
Absolute Value Linearof r Relationship0 - .25 poor.25 - .50 fair.50 - .75 good.75 – 1.0 very good
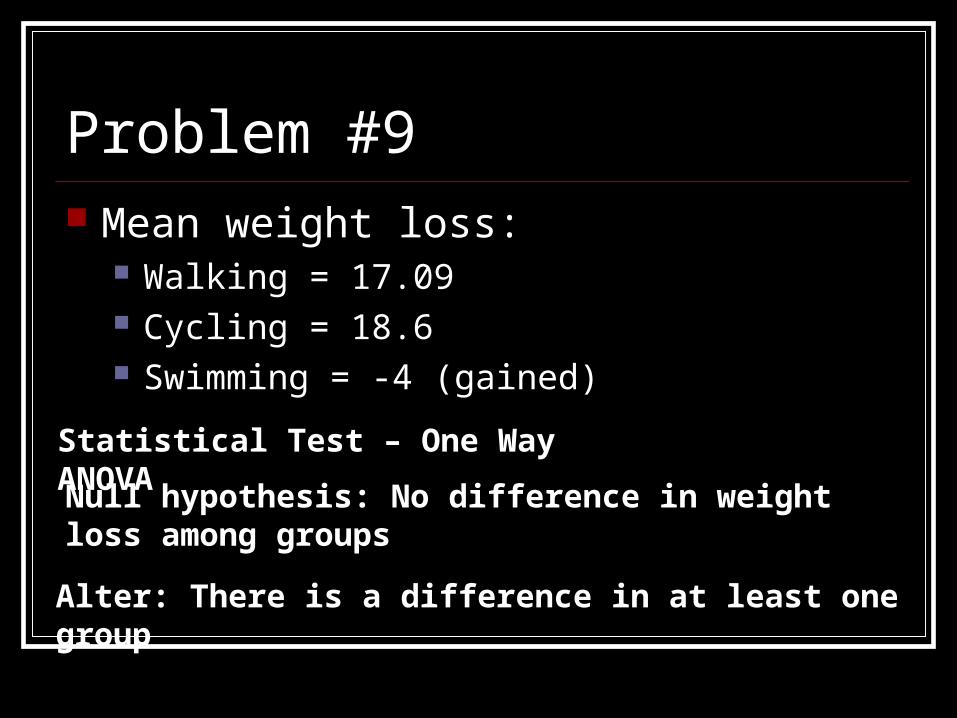
Problem #9 Mean weight loss:
Walking = 17.09 Cycling = 18.6 Swimming = -4 (gained)
Statistical Test – One Way ANOVA
Null hypothesis: No difference in weight loss among groups
Alter: There is a difference in at least one group