statistics brief · organisation for economic co-operation and development ... eip collects...
TRANSCRIPT
ww
Organisation for Economic Co-operation and Development
STATISTICS BRIEF
2 The impact of the crisis on enterprise creation
5 …and on business closures
6 Harmonised business demography data...
6 ...for the analysis of enterprise survival
8 ...and employment dynamism from firm birth and death
12 Further reading
12 Sponsors
50
60
70
80
90
100
110
120
130
Q1-
2006
Q2-
2006
Q3-
2006
Q4-
2006
Q1-
2007
Q2-
2007
Q3-
2007
Q4-
2007
Q1-
2008
Q2-
2008
Q3-
2008
Q4-
2008
Q1-
2009
Q2-
2009
Q3-
2009
Q4-
2009
Q1-
2010
Q2-
2010
AustraliaDenmarkFinlandFranceGermanyItaly
50
60
70
80
90
100
110
120
130
Q1-
2006
Q2-
2006
Q3-
2006
Q4-
2006
Q1-
2007
Q2-
2007
Q3-
2007
Q4-
2007
Q1-
2008
Q2-
2008
Q3-
2008
Q4-
2008
Q1-
2009
Q2-
2009
Q3-
2009
Q4-
2009
Q1-
2010
Q2-
2010
Netherlands
Norway
Spain
United Kingdom
USA
Measuring Entrepreneurship The OECD-Eurostat Entrepreneurship Indicators Programme
by Mariarosa Lunati, Jeroen Meyer zu Schlochtern and Gueram Sargsyan
The recent global crisis has heightened interest in entrepreneurship as an essential element to foster economic recovery and employment growth throughout the world. But, in order to understand and promote entrepreneurship, government analysts and policymakers require sound statistical indicators, preferably comparable across countries. The OECD-Eurostat Entrepreneurship Indicators Programme (EIP) develops measures of entrepreneurship with the aim of providing a solid foundation for policy formulation and monitoring in this area. This issue of Statistics Brief presents some of the key entrepreneurship indicators developed by the EIP, along with basic information on the methodologies for their collection, and
November 2010 - No. 15
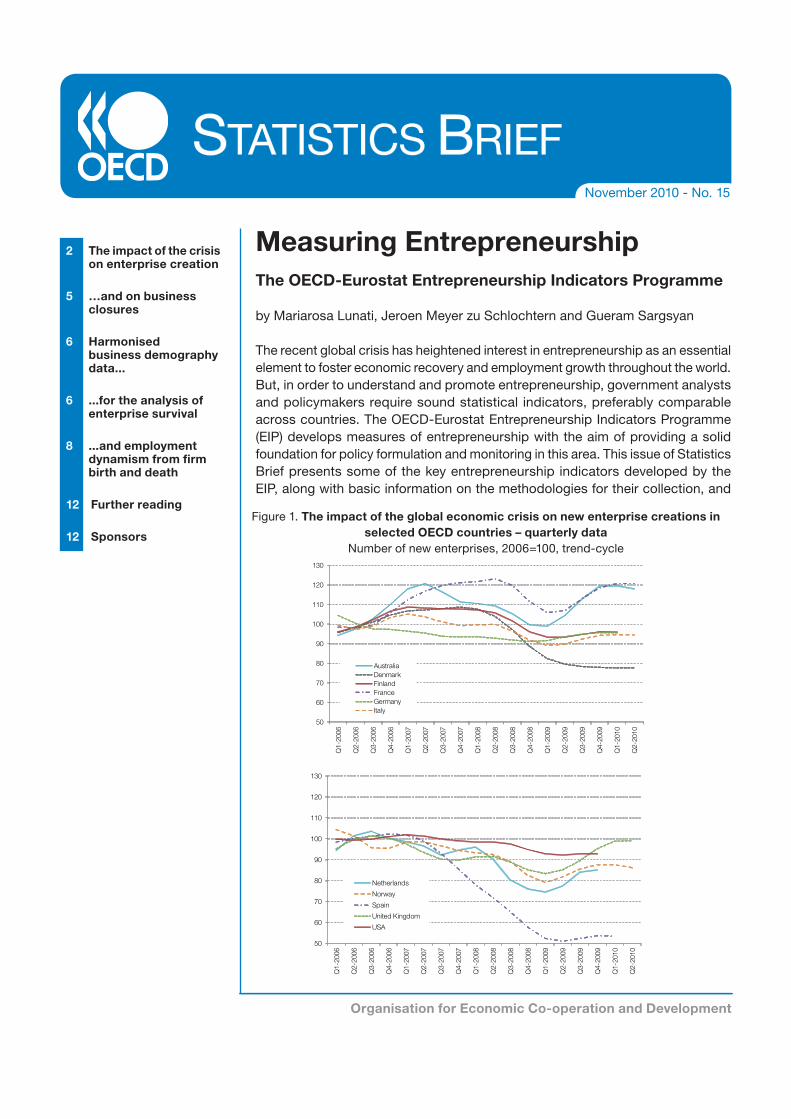
Figure 1. The impact of the global economic crisis on new enterprise creations in selected OECD countries – quarterly data
Number of new enterprises, 2006=100, trend-cycle

2Statistics Brief - November 2010 - No. 15
explains the policy context for their use. While the EIP collects different measures of entrepreneur-ship and its determinants, this Brief focuses on indicators based on business demography sta-tistics. The first part focuses on recent statistics collected from various national sources, while the second part presents indicators from the OECD Structural and Demographic Business Statistics database, which contains harmonised data from official government statistics sources.
The impact of the crisis on enterprise creation
Since new and young firms contribute critically to job creation, innovation and growth, observing recent trends of firm formation provides valuable information to policy makers. The impacts of economic cycles on new firm creation can be analysed through as up-to-date as possible data on business demography. To facilitate the review and cross-country comparison of firm creation sensitivity to the business cycle, the EIP has built a database of timely data on enterprise creations and destructions for selected countries where recent data are available. As explained in Box 1, which sets out the methodology for compiling the “Timely Indicators” database, timely series are only reliable for direct comparisons across countries in terms of trends, but not in levels. With this in mind, Figure 1 shows that the recent eco-nomic and financial crisis has had an important impact on the creation of new enterprises: after a significant decrease in the second half of 2008, or earlier in some countries (e.g. Australia and Spain), the number of new enterprises started to recover around the first half of 2009, although not in Denmark and the United Stated. However, by the second quarter of 2010, the number of newly created enterprises was still below its pre-crisis level in most countries (except Australia, France and the United Kingdom). In many countries, the decline in the creation of new enterprises occurred at the same time as the decline in real GDP.
A comparison of annual changes by country (Figure 2) complements the insights from the
quarterly data trends. It indicates that in 2008 the number of enterprises diminished in all countries for which data were available, except France. The size of the decrease, however, varied considerably across countries. The decline continued in 2009 in most countries, though a few showed small increases. Only in Germany and Sweden did the 2009 levels equal those of 2007. The differences between yearly averages and quarterly profiles are related to the differences in the timing of the crisis and recovery across countries.
The timely indicators database contains monthly and quarterly data for the total economy and also, for a number of countries, by industry. This
Figure 2. Change in new enterprise creations - annual data
Number of new enterprisesPercentage changes from previous year
-30.0 -20.0 -10.0 0.0
France
Sweden
Finland
USA
Austria
Germany
Belgium
Iceland
Italy
Norway
Denmark
Netherlands
Australia
New Zealand
UK
Spain
2008/07
2009/08

3 November 2010 - No. 15 - Statistics Brief
Timely Indicators of Entrepreneurship
Most of the OECD countries produce data on business demography on an annual basis. Data come from national business registers for statistical purposes, typically managed by National Statistical Offices (NSOs). These statistical business registers are compiled from information from various administrative records and surveys and both the quality and comprehensiveness of the data drawn from them are high. But often quality is achieved at the expense of timeliness, as data processing, cross-checking and control take time. Yet, events such as the global economic crisis demand immediate access to up-to-date indicators. Policy analysts need to understand the impact of such events on entrepreneurship and respond promptly with policy initiatives.
Thus the EIP has supplemented its register-based data with a new set of timely indicators of entrepreneurship. The compilation process focuses on timeliness as the indicators are based on monthly and quarterly data on enterprise creations and failures that are available through the internet. The sources used are among those employed for business registers. For most countries, a single source is exploited; for firm creation it is normally an administrative file or a register from a chamber of commerce; for firm closures, the source is mainly bankruptcy records.
There are two important qualifications concerning the data collected through these alternative sources. First, since a single source is used, rather than the multiple sources used for national business registers, the population of enterprises is often incomplete. Depending on the country, the chosen single source may not cover certain legal forms of enterprises (e.g., sole proprietor) or sectors of activity (e.g. agri-culture or education) or enterprises below a certain turnover or employment threshold. Second, the concepts of enterprise “creation” and “failure” reflected in the data series differ across countries. Some of the national sources selected for the timely indicators use the concept of creation, while others that of enterprise birth. The latter concept is more restrictive as it refers to a legal entity that appears for the first time with no other enterprise involved in the creation process. It excludes firm creations resulting from mergers or changes of name, type of activity or ownership. The notions of failure are also different. The sources may record the opening of bankruptcy procedures or actual liquidations. Finally, attention is drawn to specific data issues in three countries. In France, enterprise creations are recorded at the date of the data treatment and not at the real date of enterprise creation; in Spain, the administrative source includes new enterprises registered but non-active; and, for the United States, new creations refer to establishments and not to enterprises.
To address the issues above, and before their inclusion in the database, a number of adjustments have been made to the series. In addition, the monthly and quarterly data have been seasonally adjusted. Metadata, explaining the characteristics and adjustments made to each single data series, are accessible on the OECD website (http://www.oecd.org/dataoecd/60/15/46346883.pdf). Data can be found online in OECD . Stat: http://stats.oecd.org >> Industry and Services >> Timely Indicators of Enterpreneurship
While indicator levels are not strictly comparable across countries in the timely series, comparisons in terms of trends and growth rates are valid. Trends in countries’ adjusted series on firm creation and bankruptcies show a remarkably similar pattern across countries.

4Statistics Brief - November 2010 - No. 15
Table 1: Enterprise creations by activityyear-on-year growth rates in percentage
ActivitiesISIC rev. 4 / Nace rev. 2
Finland Germany Italy Norway USA
2009Q1/ 2008Q1
2010Q1/ 2009Q1
2009Q1/ 2008Q1
2010Q1/ 2009Q1
2009Q1/ 2008Q1
2010Q1/ 2009Q1
2009Q1/ 2008Q1
2010Q1/ 2009Q1
2009Q1/ 2008Q1
2009Q4/ 2008Q4
10_33: Manufacturing -22 2 13 -10 -4 -4 -24 11 -4 6
41_43: Construction -36 18 6 3 -16 -7 -30 14 -8 4
45_47: Wholesale and retail trade; repair of motor vehicles and motorcycles -13 2 4 -2 -1 5 -11 23 -6 -5
49_53: Transportation and storage -22 -15 -5 -9 -3 -6 -29 20 -6 -2
55_56: Accommodation and food service activities 3 10 8 -4 7 -4 -2 6 -4 -12
58_63: Information and communication -10 -5 -7 4 .. 4 4 11 6 -11
64_66: Financial and insurance activities -19 -1 6 -6 -11 2 -37 27 -14 -2
68: Real estate activities -26 -4 -5 -5 -21 -2 -37 16 -8 -4
69_82: Professional, scientific, technical and other business support activities -11 4 3 -5 -3 4 -7 5 -2 1
85_88: Education, health and social work activities -9 9 13 -13 7 -3 -8 21 0 3
90_96: Arts, entertainment and other serv-ice activities -10 6 8 -3 10 3 -9 6 -2 -3
01_99: Grand Total -14 2 4 -2 -9 4 -14 12 -10 2
Figure 3. Number of bankruptcies - quarterly dataAverage 2006 = 100, Trend-cycle
50
100
150
200
250
300
350
2006
Q1
2006
Q2
2006
Q3
2006
Q4
2007
Q1
2007
Q2
2007
Q3
2007
Q4
2008
Q1
2008
Q2
2008
Q3
2008
Q4
2009
Q1
2009
Q2
2009
Q3
2009
Q4
2010
Q1
2010
Q2
Australia
Canada
Denmark
Japan
Finland
50
100
150
200
250
300
350
2006
Q1
2006
Q2
2006
Q3
2006
Q4
2007
Q1
2007
Q2
2007
Q3
2007
Q4
2008
Q1
2008
Q2
2008
Q3
2008
Q4
2009
Q1
2009
Q2
2009
Q3
2009
Q4
2010
Q1
2010
Q2
France
Netherlands
Norway
United Kingdom
USA
Notes: Italy: Change in the industry classification in 2009. ATECO 2002 has been replaced by ATECO 2007.
USA: Derived from the 3-digit North American Industrial Classification System (NAICS)

5 November 2010 - No. 15 - Statistics Brief
allows an assessment of impacts at the sectoral level. The distribution by industrial activity of new enterprises did not change significantly during the crisis. An exception is the construction industry whose share of new enterprises decreased signifi-cantly in several countries, most notably in Spain, though not in the United States. Other industrial sectors have generally maintained their proportions in most countries.
Table 1 shows the year-on-year changes of enterprise creation by activity. In construction, trade and transport the drop in the creation of new enterprises were particularly severe during the crisis. Finance and real estate also experienced significant declines in the number of new enter-prises. This was especially evident in Norway and
Countries Sources of timely indicators
Australia » Australian Securities & Investments Commission (ASIC) - New company registrations and Insolvency statistics (Companies entering external administration), Incorporated companies only
Austria » Wirtschaftskammer Österreich (WKO) - The Austrian Federal Economic Chamber
Belgium » SPF Economie, DGSIE, Dynamique de la population des entreprises - VAT registrations
Denmark » The (Danish) Central Business Register (CVR) - Number of new registrations in market industries. Bankruptcy data are taken from The Danish Official Gazette (Statstidende) and the Statistical Business Register (Statistics Denmark). After the implementation of the registry-based method in 2009 only bankruptcies of enterprises are counted, i.e. bankruptcies associated with a CVR number.
Finland » Statistics Finland’s Business Register - Number of enterprise “openings”. Bankruptcy cases instigated and decided by district courts (Statistics Finland).
France » INSEE, SIRENE - Number of births. Data exclude registrations of self-employed in order to mitigate the bias due to the implementation in 2009 of a new enterprise status (régime de l’auto-entrepreneur). Data on bankruptcies are coming from the BODACC (data processed by INSEE) and refer to the openings of insolvency proceedings.
Germany » Statistiches Bundesamt - Destatis - Unternehmen und Arbeitsstätten, Gewerbeanzeigen, number of new establishments (main offices and secondary establishments). All activities are taken into account
Hungary » Hungarian Central Statistical Office (HCSO/KSH) - Number of newly registered economic corporations and unincorporated enterprises
Iceland » Statistics Iceland - New registrations of limited liability companies and Insolvencies of Icelandic enterprises, including personal bankruptcies
Italy » InfoCamere, Movimprese - Business register of Italian Chambers of Commerce. Number of entries (iscritte)
Japan » Tokyo Shoko Research, Ltd., Business Failure News - Number of SME bankruptcies, Incorporated companies only
Netherlands » Centraal Bureau voor de Statistiek (CBS) - Business Register. Number of establisment births (Data are only available for Industry, trade and market services). Number of bankruptcies pronounced by Dutch courts (Excluding individuals without a sole proprietorship)
Norway » Statistics Norway - Number of newly established enterprises (excluding primary industries). Bankruptcy proceedings including personal bankruptcies
Portugal » Formation and dissolution of companies, Ministry of Justice - Incoporated companies only
Spain » Instituto Nacional de Estadistica de Espana (INE) - The Mercantile Companies (MC), quarterly data are taken from the “Mercantile Companies” register which includes information on incorporated enterprises only. Annual data are taken from the Companies Central Directory (CCD)
Sweden » Swedish Agency for Growth Analysis and Statistics Sweden- Number of new enterprises (genuine new businesses i.e. births), Number of bankruptcies
United Kingdom » Companies House - New registrations and Total insolvencies (Including compulsory liquidations, creditors’ voluntary liquidations, admin orders converted to Cred. Excluding Members’ voluntary liquidations). Incorporated companies only
United States » Bureau of Labor Statistics (BLS) - Business Employment Dynamics (BED), unemployment insurance (UI) records, number of establishments with at least one employee. United States Courts - Statistics on bankruptcy petition filings are provided by the United States Courts, total business filings (chapters 7, 11, 12 and 13)
Detailed sources and definitions are available on the OECD website at: http://www.oecd.org/dataoecd/60/15/46346883.pdf
in the United States where these two sectors were the worst performing in terms of the relative reduc-tion of newly created enterprises.
…and on business closures
National Statistical Offices usually publish data on enterprise deaths two or three years after the respective reference year. This delay is necessary in order to ensure that a cessation is not reversed by the reactivation of the enterprise. The Eurostat-OECD Manual on Business Demography Statistics indicates that an enterprise death occurs only if the unit has been inactive for at least two years. For this reason, it is difficult to obtain updated statistics on business closures, despite the policy relevance of this information. The EIP timely indicators database

6Statistics Brief - November 2010 - No. 15
includes information on bankruptcy procedures as an alternative indicator of firm cessations. Recent information on bankruptcies is available in several OECD countries, as shown in Figure 3, and reveals similar patterns across countries: between the first quarter of 2008 and the second quarter of 2009, the number of bankruptcy procedures increased considerably across countries and continued at high levels until the second quarter of 2010, par-ticularly in Denmark.
The use of bankruptcy data as an alternative indicator of enterprise closures requires some qualifications. Firm closures can be due to different reasons, and only some consist of liquidations following bankruptcy. Also, the institutional context and bankruptcy legislation (e.g. creditor-friendly or debtor-friendly regimes) affect bankruptcy rates across countries. For instance, in Ireland bankruptcy is very rare. The financial literature has highlighted that countries differ in terms of the probabilities of firms being involved in bankruptcy or other insolvency procedures, and also in the final results of these procedures. The proportion of bankruptcy procedures that end up in actual liquidations of the companies, and not in reorgani-sations, varies across countries depending on the bankruptcy code.
The EIP is working actively to expand and improve the database of timely indicators of entrepreneurship to cover additional countries and to improve comparability. Eurostat is also investigating the use of the alternative sources of data on firm entries and exits to estimate official business demography data. Work is under way to assess the correlation of the timely indicators with the harmonised business demography data to be published later by the OECD and Eurostat.
Harmonised business demography data...
The previous sections of the Brief presented a new database built by the Entrepreneurship Indicators Programme focusing on data that are timely but not harmonised. The core activity of
the EIP, though, remains the collection of harmo-nised data on business demography in coopera-tion with National Statistical Offices. The following sections present indicators of entrepreneurship drawn from the harmonised OECD Structural and Demographic Business Statistics (SDBS) database. These indicators cover the survival rates of enter-prises, the relationship between survival and birth rates, and the employment dynamism associated with enterprise birth and death.
The advantage of the database is the high level of cross-country comparability of the indicators it contains. While information from official statistical sources exists at the national level in many OECD countries on one or more dimensions of business demography, the EIP collection is the first ever to contain official statistics comparable across European countries and the United States. Data on business demography collected by the EIP refer to “employer enterprises”, i.e., those with at least one employee. They differ from indicators that cover all enterprises. The latter include non-employer firms most of which are self-employed individuals and are typically very numerous. The number of non-employers also tends to be more sensitive to the coverage of business registers. Furthermore, the employer enterprises are economically more relevant than non-employer firms and more closely related to the notion of entrepreneurship as a driver of job creation and innovation.
The rationale for developing entrepreneurship indicators is to help policy makers understand how the policies they implement will affect entrepreneurship and, eventually, higher level objectives such as job creation, economic growth and employability. Comparability is paramount; in order for countries to benefit from the experience of others, it is essential that the indicators allow for international comparisons.
...for the analysis of enterprise survival
Encouraging the birth of new enterprises is a key element of policies promoting entrepre-neurship. A relevant piece of information that

7 November 2010 - No. 15 - Statistics Brief
30
40
50
60
70
80
90
100
2004 Cohort
1 year 2 year 3 year 4 year
%
AUT BGR CAN CZE DNK ESP
30
40
50
60
70
80
90
100
2004 Cohort
1 year 2 year 3 year 4 year
%EST FIN HUN ITA LUX
30
40
50
60
70
80
90
100
2004 Cohort
1 year 2 year 3 year 4 year
%NLD NZL ROU SVK USA
Manufacturing (%)
30
40
50
60
70
80
90
100
2004 Cohort
1 year 2 year 3 year 4 year
%
AUT BGR CAN CZE DNK ESP
30
40
50
60
70
80
90
100
2004 Cohort
1 year 2 year 3 year 4 year
%EST FIN HUN ITA LUX
30
40
50
60
70
80
90
100
2004 Cohort
1 year 2 year 3 year 4 year
%NLD NZL ROU SVK USA
Services (%)
Figure 4: Enterprise survival rates in manufacturing and services

8Statistics Brief - November 2010 - No. 15
business demography can provide to policy makers concerns a firm’s life after its birth. How long do start-ups survive after creation? Are there substantive differences in survival rates of enterprises across countries and industries? The survival rates after one, two, three and four years of life are represented in Figure 4 for cohorts of employer enterprises born in 2004 in the manufacturing and services sectors respectively. Indicators are presented for selected countries. The survival rates of employer enterprises in the manufacturing sector are typically higher than in the services sector and the difference persists in every year after birth; Canada is an exception, with the survival rates almost identical across the two sectors. On average, the survival rates after one year are around 85 to 90% in manufactur-ing and 75 to 80% in services, and they continue to drop constantly in the following years. In the Netherlands and New Zealand, survival rates in the manufacturing and services sectors are consist-ently lower than in the other countries for which data are available. Empirical studies looking at the survival performance of firms across countries have pointed to the role of sectoral composition to explain cross-country differences in the aggregate data.
Figure 5a and b shows the rates of birth and sur-vival of countries’ cohorts of enterprises born in 2005. High rates of employer enterprise birth are associated with low rates of survival both in the manufacturing and in the services sectors across countries, with the exception of Romania. Also, birth rates (and death rates) are higher in the services sector, reflecting the lower cost of entry in this sector, on average, compared to manufactur-ing. It is likely that national business environments that present fewer barriers to creating start-ups tend to encourage entry by relatively more firms, with many of them then displaying poor post-entry performance. A full understanding of these pat-terns is only possible by analysing the correlation of birth and survival rates with country-specific explanatory factors such as the determinants of entrepreneurship (e.g. regulatory framework, market conditions, access to finance etc.) identified in the conceptual framework of the EIP.
...and employment dynamism from firm birth and death
A much debated question in the empirical literature is the comparative impact on the net creation of jobs by small enterprises compared with large firms. While there exists much evidence in support
Figure 5a and b. Employer enterprise survival rate versus birth rate
NOR
AUT
ITA
FIN BGRHUN
LUX
DNK
ESP
LTU
EST
NZL
SVK
ROU
CANISR
55
60
65
70
75
80
85
90
95
4 6 8 10 12 14 16 18
1-ye
ar s
urvi
val
rate
, em
plo
yer
ente
rpri
ses
crea
ted
in 2
005
Employer enterprise birth rate in 2005
Trend line w/o Romania
y = -3.8456x + 108.89R² = 0.5757
Manufacturing
NOR
AUTITA
FIN
BGR
HUN
LUX
DNK
ESPLTU
EST
NZL
SVK
ROU
CAN
ISR
55
60
65
70
75
80
85
90
95
4 6 8 10 12 14 16 18
1-ye
ar s
urvi
val
rate
, em
plo
yer
ente
rpri
ses
crea
ted
in 2
005
Employer enterprise birth rate in 2005
1-year survival rate (2005 cohort) Trend line w/o Romania
y = -2.1948x + 104.62R² = 0.2753
Services

9 November 2010 - No. 15 - Statistics Brief
Figure 6. Employment churning in employer enterprises (as % of total employment destruction and creation)
NORLUX
AUT BGR
ESPITAEST
ROU
HUN
DNKFIN
SVK
NOR
LUX
AUT
BGR
ESPITA
EST
ROU
HUN
DNK
FIN
SVK
0.0
1.0
2.0
3.0
4.0
5.0
6.0
7.0
8.0
9.0
0.0 1.0 2.0 3.0 4.0 5.0 6.0 7.0 8.0 9.0
Em
plo
ymen
t d
estr
ucti
on
by
emp
loye
r en
terp
rise
dea
ths
Employment creation by new employer enterprises
Manufacturing Services 45° line
Manufacturingy = 0.7165x + 0.6713R² = 0.206
Servicesy = 0.8053x - 0.0827R² = 0.6159
45°
of, alternatively, the dominance of small or larger firms in net employment growth, recent research in the United States has brought to the attention the fact that the age of enterprises could be more relevant than their size in determining their contri-bution to employment growth. In particular, young enterprises seem to be responsible for a large proportion of employment churning, i.e. creation and destruction of jobs in the economy, because they are more volatile: as shown in the previous section, start-ups have higher probabilities of exit-ing the market in their first years of life.
In Figure 6, employment creation by new enter-prises, expressed as a percentage of total employ-ment creation, is plotted against employment destruction of enterprises that die, also expressed as a percentage of total employment destruc-tion. Overall, there is a higher level of churning in
services than in the manufacturing sector across countries. That is, both employment creation and destruction due to firm birth and death are higher in services than in manufacturing. Furthermore, coun-tries with higher rates of employment creation by enterprise birth, such as Denmark and the Slovak Republic, are also those with the higher rates of employment destruction by enterprise death.
More insights on the employment creation by enter-prise birth and death can be gained by analysing, in addition to aggregate data, the distribution by size of the new created firms and of the firms that exit the market. This type of analysis is relevant, among others, for the study of creative destruction, i.e. the entry in the market of start-ups, the failure of many new firms and the expansion of the more efficient enterprises.
Austria (AUT), Bulgaria (BGR), Canada (CAN), the Czech Republic (CZE), Denmark (DNK), Spain (ESP), Estonia (EST), Finland (FIN), Hungary (HUN), Italy (ITA), Luxembourg (LUX), the Netherlands (NLD), New Zealand (NZL), Romania (ROU), the Slovak Republic (SVK) and the United States (USA).

10Statistics Brief - November 2010 - No. 15
The OECD-Eurostat Entrepreneurship Indicators Programme
In 2006, the OECD launched the Entrepreneurship Indicators Programme (EIP) aimed at developing indicators of entrepreneurship that are both internationally comparable and policy-relevant. The programme became in 2007 a joint OECD-Eurostat activity. Despite the increasing importance of entrepreneurship and associated policies, measurement of the phenomenon, particularly at the international level, has long been deficient. Most entrepreneurship research relied on ad-hoc data compilations developed to support a single project, and although a few initiatives also existed at the international level, consistent, comparable data were scarce. Moreover, virtually no “official” statistics on the subject existed, because the concept of entrepreneurship was not recognised by National Statistical Offices.
The first challenge for the EIP was to develop a definition of entrepreneurial activity that would provide the basis for collection and comparison of valid indicators across countries. While entrepreneurship is a complex concept that manifests itself in many different ways, some fundamental concepts had to be agreed upon so that statisticians would be guided in the collection of relevant indicators that would allow analysts and policy-makers to better understand the factors that influence the rate and type of entrepreneurial activity, as well as the outcomes or impacts of entrepreneurship. A wide variety of definitions were identified and examined in an EIP Working Paper (Ahmad and Seymour, 2008), revealing that theoreticians have explored aspects such as the entrepreneur’s characteristics, resources, activities and impacts or results. Though varied, the definitions generally used in the literature broadly converge on the following points: entrepreneurship is about enterpris-ing human activity or identifying and acting upon opportunities that create value, be that economic, cultural or social value. Typically, entrepreneurial activities require the leveraging of resources and capabilities through innovation, but the opportunities themselves always relate to the identification of new products, new processes or new markets. Building on this analysis, the EIP elaborated the following three definitions:
Entrepreneurs are those persons (business owners) who seek to generate value, through the creation or expan-sion of economic activity, by identifying and exploiting new products, processes or markets.
Entrepreneurial activity is the enterprising human action in pursuit of the generation of value, through the creation or expansion of economic activity, by identifying and exploiting new products, processes or markets.
Entrepreneurship is the phenomenon associated with entrepreneurial activity.
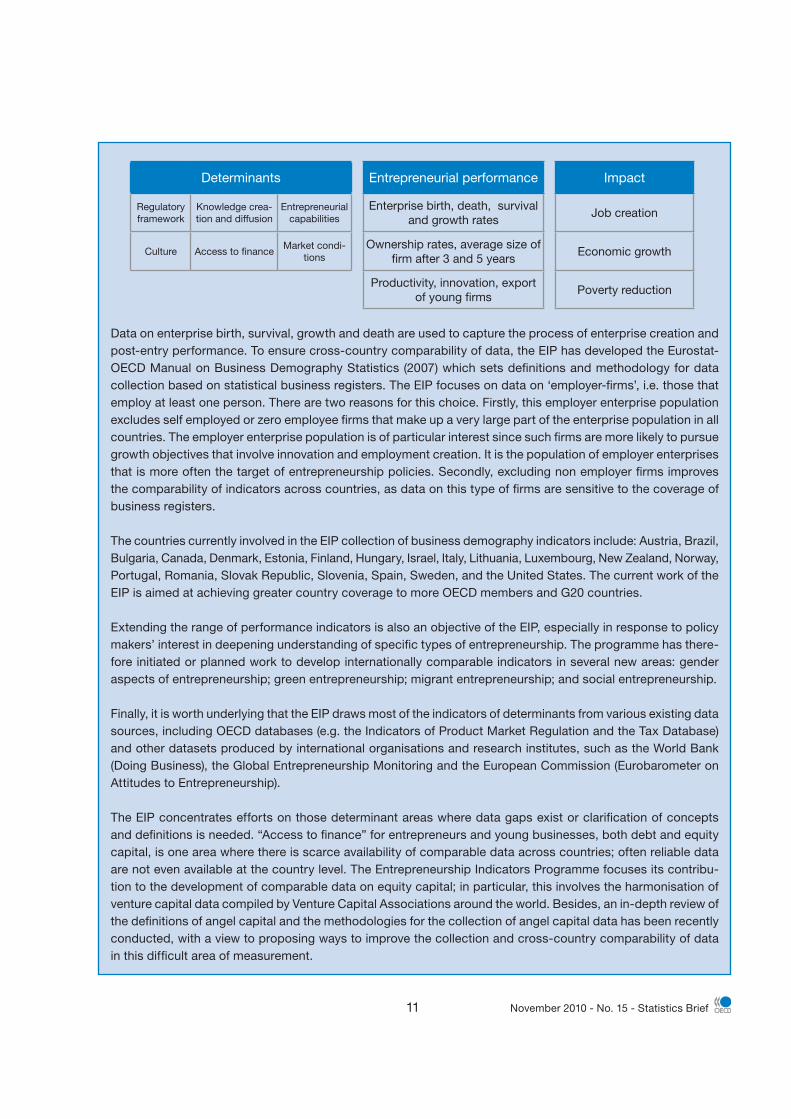
Simultaneously to the development of definitions, the EIP defined a conceptual framework for addressing and measuring entrepreneurship (Ahmad and Hoffman, 2008). This framework distinguishes between determinants, performance and impact of entrepreneurship. For each of these dimensions the EIP does not propose any sin-gle measure but identifies instead a range of relevant indicators to analyse different types of entrepreneurship.
Though the framework encompasses three dimensions, the collection of data concerns two categories of indica-tors only, i.e. performance indicators, which measure the amount and type of entrepreneurship that takes place in a country, and indicators of determinants, which measure the factors affecting entrepreneurship.
The basis for measuring core indicators of entrepreneurial performance is business demography. This approach results from the operationalisation of the above definition of entrepreneurial activity: the themes of enterpris-ing human activity that creates value through leveraging of resources and capabilities in some new way were matched with indicator topics such as firm creation and destruction, and a variety of measures of survival, growth and innovation and performance.
11 November 2010 - No. 15 - Statistics Brief
Data on enterprise birth, survival, growth and death are used to capture the process of enterprise creation and post-entry performance. To ensure cross-country comparability of data, the EIP has developed the Eurostat-OECD Manual on Business Demography Statistics (2007) which sets definitions and methodology for data collection based on statistical business registers. The EIP focuses on data on ‘employer-firms’, i.e. those that employ at least one person. There are two reasons for this choice. Firstly, this employer enterprise population excludes self employed or zero employee firms that make up a very large part of the enterprise population in all countries. The employer enterprise population is of particular interest since such firms are more likely to pursue growth objectives that involve innovation and employment creation. It is the population of employer enterprises that is more often the target of entrepreneurship policies. Secondly, excluding non employer firms improves the comparability of indicators across countries, as data on this type of firms are sensitive to the coverage of business registers.
The countries currently involved in the EIP collection of business demography indicators include: Austria, Brazil, Bulgaria, Canada, Denmark, Estonia, Finland, Hungary, Israel, Italy, Lithuania, Luxembourg, New Zealand, Norway, Portugal, Romania, Slovak Republic, Slovenia, Spain, Sweden, and the United States. The current work of the EIP is aimed at achieving greater country coverage to more OECD members and G20 countries.
Extending the range of performance indicators is also an objective of the EIP, especially in response to policy makers’ interest in deepening understanding of specific types of entrepreneurship. The programme has there-fore initiated or planned work to develop internationally comparable indicators in several new areas: gender aspects of entrepreneurship; green entrepreneurship; migrant entrepreneurship; and social entrepreneurship.
Finally, it is worth underlying that the EIP draws most of the indicators of determinants from various existing data sources, including OECD databases (e.g. the Indicators of Product Market Regulation and the Tax Database) and other datasets produced by international organisations and research institutes, such as the World Bank (Doing Business), the Global Entrepreneurship Monitoring and the European Commission (Eurobarometer on Attitudes to Entrepreneurship).
The EIP concentrates efforts on those determinant areas where data gaps exist or clarification of concepts and definitions is needed. “Access to finance” for entrepreneurs and young businesses, both debt and equity capital, is one area where there is scarce availability of comparable data across countries; often reliable data are not even available at the country level. The Entrepreneurship Indicators Programme focuses its contribu-tion to the development of comparable data on equity capital; in particular, this involves the harmonisation of venture capital data compiled by Venture Capital Associations around the world. Besides, an in-depth review of the definitions of angel capital and the methodologies for the collection of angel capital data has been recently conducted, with a view to proposing ways to improve the collection and cross-country comparability of data in this difficult area of measurement.
Determinants Entrepreneurial performance Impact
Regulatory framework
Knowledge crea-tion and diffusion
Entrepreneurial capabilities
Enterprise birth, death, survival and growth rates
Job creation
Culture Access to financeMarket condi-
tionsOwnership rates, average size of
firm after 3 and 5 yearsEconomic growth
Productivity, innovation, export of young firms
Poverty reduction

12 November 2010 - No. 15 - Statistics Brief
The Statistics Brief is published by the OECD Statistics Directorate.
This issue and previous issues can be downloaded from the OECD website at: www.oecd.org/std/statisticsbrief
Editor in chief: Martine DurandEditor: Tim DavisEditorial Team: Mariarosa Lunati, Jeroen Meyer zu Schlochtern, Gueram SargsyanTechnical assistants: Sonia Primot, Ingrid Herrbach
For further information contact the Editor at [email protected]
STATISTICS BRIEF
Further reading
» N. Ahmad and A. Hoffman (2008), A framework for addressing and measuring entrepreneurship, OECD Statistics Working Paper, No° 2008/02.http://dx.doi.org/10.1787/243160627270
» N. Ahmad and R. Seymour (2008), Defining Entrepreneurial Activity, OECD Statistics Working Paper, No° 2008/01.http://dx.doi.org/10.1787/243164686763
» OECD-Eurostat (2007), Eurostat-OECD Manual on Business Demography Statistics, Pariswww.oecd.org/document /34/0,3343,en_2649_34233_39913698_1_1_1_1,00.html
» OECD (2010), Structura l and Demographic Business Statistics, Paris www.oecd.org/document /17/0,3343,en_2649_34233_36938705_1_1_1_1,00.html
» OECD (forthcoming), Entrepreneurship at a Glance, Paris
» Eurostat (2010), Estimation of recent business demography data, DOC.06/EN/EUROSTAT/G2/BD/JUN10.
» The OECD Entrepreneurship website www.oecd.org/std/entrepreneurship
Sponsors
The OECD-Eurostat Entrepreneurship Indicators Programme has benefi ted from sponsorship by the Ewing Marion Kauffman Foundation of the United States and FORA, Danish Enterprise and Construction Authority.