statistics on post-school education and training in south
TRANSCRIPT

Statistics onPost-School Education
and Trainingin South Africa: 2012


i
Statistics on Post-School Education
and Training in South Africa: 2012
2014

ii
Department of Higher Education and Training
123 Francis Baard Street
Pretoria
South Africa
Private Bag X174
Pretoria
0001
Tel.: 0800 87 22 22
Published by the Department of Higher Education and Training (DHET).
www.dhet.gov.za
© Department of Higher Education and Training, 2014
This publication may be used in part or as a whole, provided that the Department of Higher Education and Training is
acknowledged as the source of information.
The Department of Higher Education and Training does all it can to accurately consolidate and integrate national education
information, but cannot be held liable for incorrect data and for errors in conclusions, opinions and interpretations
emanating from the information. Furthermore, the Department of Higher Education and Training cannot be held liable
for any costs, losses or damage that may arise as a result of any misuse, misunderstanding or misinterpretation of the
statistical content of the publication.
ISBN: 978-1-77018-711-5
This report is available on the Department of Higher Education and Training’s website: www.dhet.gov.za
Enquiries:
Tel: +27(012) 312 5212
Fax: +27 (012) 326 2069
Email: [email protected]
Statistics on Post-School Education and Training in South Africa: 2012

iii
FOREWORD
It is my pleasure to present to you the third issue of Statistics on Post-School Education and Training in South Africa. The two previous reports published by the Department of Higher Education and Training can be found on the department’s website at www.dhet.gov.za.
Post-school education and training covers public and private Higher Education Institutions (HEIs), public and private Further Education and Training (FET) Colleges, public and private Adult Education and Training(AET) Centres, and workplace-based education and training facilitated by Sector Education and Training Authorities (SETAs).
The report provides statistical information on student enrolment, graduationand certification, and institutional staffing levels at post-school education and training institutions, as well as information about workplace-based education and training. For the first time, this publication reports on funding in the post-school education and training sector, providing selected time series financial information from 2010 to 2012, including the distribution of expenditure across the different components of the post-school education and training sector.
The report is an important resource for planning and for the allocation of budgetary resources in the post-school education and training sector. It is a reference document for reporting processes in government, including the monitoring and evaluation of post-school education and training. In addition, it provides evidence for use in policy research and decision-making at the different levels of the system. It therefore makes a crucial contribution to the achievement of the goals of the post-school sector.
The Department is striving to make this report more accurate and more responsive to stakeholders’ needs. Feedback, including suggestions for improvement, can be emailed to: [email protected]
Gwebinkundla QondeDirector-General: Department of Higher Education and TrainingPretoria, South Africa
Foreword

iv
ACKNOWLEDGEMENTS
The Department of Higher Education and Training wishes to thank the heads and staff members of the nine provincial Education Management Information System (EMIS) units, Higher Education Institutions, Further Education and Training Colleges, Adult Education and Training Centres, Sector Education and Training Authorities, National Artisan Moderation Body, National Student Financial Aid Scheme, and National Skills Fund – for making this publication possible.
Acknowledgements

v
TABLE OF CONTENTS
LIST OF TABLES .......................................................................................................................................................... viiiLIST OF FIGURES ixABRREVIATIONS x
1. INTRODUCTION 12. THE PROVISIONING OF POST-SCHOOL EDUCATION AND TRAINING: AN OVERVIEW 23. HIGHER EDUCATION AND TRAINING: AN OVERVIEW 43.1. INTRODUCTION 43.2. PUBLIC HEIs 53.2.1 Introduction 53.2.2 Enrolments in HEIs 53.2.3 Graduates in public HEIs 123.2.4 Staffing in public HEIs 173.3. PRIVATE HEIs 18 3.3.1 Introduction 183.3.2 Enrolments in HEIs 184. FURTHER EDUCATION AND TRAINING (FET) COLLEGES: AN OVERVIEW 194.1. INTRODUCTION 194.2. PUBLIC FET COLLEGES 214.2.1 Introduction 214.2.2 Enrolment in public FET Colleges 224.2.3 Staffing in public FET Colleges 24 4.3. PRIVATE FET COLLEGES 264.3.1 Introduction 264.3.2 Enrolment in private FET Colleges 264.3.3 Staffing in private FET Colleges 27 4.4 EXAMINATION RESULTS IN PUBLIC AND PRIVATE FET Colleges 284.4.1 Introduction 284.4.2 Examination results in public and private FET Colleges 285. ADULT EDUCATION AND TRAINING (AET): AN OVERVIEW 335.1 INTRODUCTION 335.2 PUBLIC AET CENTRES 345.2.1 Introduction 345.2.2 Overview of public AET Centres 345.2.3 Staffing in public AET Centres 365.3 PRIVATE AET CENTRES 375.3.1 Introduction 37 5.3.2 Overview of private AET Centres 37 5.3.3 Staffing in private AET Centres 395.4 EXAMINATION RESULTS IN THE PUBLIC AND PRIVATE AET CENTRES 406. SECTOR EDUCATION AND TRAINING AUTHORITY (SETA) SUPPORTED LEARNING PROGRAMMES 416.1 INTRODUCTION 416.2 REGISTRATION AND CERTIFICATION IN SETA-SUPPORTED LEARNING PROGRAMMES: TREND DATA 42
Table of contents
........................................................................................................................................................
................................................................................................................................................
.................................................................................................................................................................................................................................................................................
.................................................................................................................................................
.......................................................................................................................................................................................................................................................
................................................................................................................................................
.............................................................................................................................................
....................................................................................................................................................................................................................................
......................................................................
...........
...................................................................................................................
..........................................................................................................................................................
..............................................................................................................................................................................................................................................................................................
........................................................................................................................................................
...........................................................................................................................................
.................................................................................................................................................
................................................................................................................................................................................................................................................................................................
..............................................................................................................................................................................................................................................................................
................................................................................................................................................................................................................................................................
....................................................................................................................................................................................................................................................
................................................................................................................................................
.................................................................
....................................................................................................................................................................................................................................
..........................................................................................................................................................................................
....................................................................................................................................................................................................................................................................
..................................................................................................................................
................................................................................................................

vi
6.2.1 Workers registered for SETA-supported learning programmes 436.2.2 Workers certificated in SETA-supported learning programmes 446.2.3 Unemployed persons registered for SETA-supported learning programmes 456.2.4 Unemployed persons certificated in SETA-supported learning programmes 466.3. ARTISANS 476.3.1 Introduction 476.3.2 Learners entering artisanal learning programmes 486.3.3 Learners completing artisanal learning programmes 487. FUNDING IN THE POST-SCHOOL EDUCATION AND TRAINING SECTOR 507.1 INTRODUCTION 507.2 FUNDING OF KEY POST-SCHOOL EDUCATION AND TRAINING PUBLIC INSTITUTIONS 507.3 NATIONAL STUDENT FINANCIAL AID SCHEME (NSFAS) 517.3.1 Introduction 517.3.2 NSFAS beneficiaries and amount provided 517.3.3 The Funza Lushaka Bursary scheme 527.4 THE SKILLS LEVY 537.4.1 Introduction 537.4.2 Distribution of the skills levy 537.5 GRANTS PROVIDED BY THE NATIONAL SKILLS FUND (NSF) 547.5.1 Introduction 547.5.2 Number of projects supported by the NSF and number of beneficiaries 547.5.3 NSF infrastructure grants 568. EXPLANATORY NOTES 578.1 INTRODUCTION 578.2 SCOPE 578.3 METHODOLOGY 578.4 RESPONSE RATE 579. GLOSSARY 5810. CONTACT DETAILS 64
Table of contents
....................................................................
........................................................................................................................................................................................................................................................................................................
............................................................................................................................................
.................................................................................................................................................
.............................................................................................................................................................................................................................................................................................
........................................................................................................................
.............................................................................................................
..........................................................................
....................................................................................................................................................................................
..............................................................................................................................................................................................................................................................................
.............................................................................................................................................
.............................................................................................................................................
...........................................................................................................................................................
................................................................................................................................................................................................................................................................................................
.................................................................................................................................................
...................................................................................................
................................................................................
..........................................................................................................................................................................
......................................................
.................................
....................................................................................................................................................................

vii
LIST OF TABLES
Table 1: Overview of post-school education and training institutions, in 2012 2Table 2: Number of workers and unemployed persons registered for and certificated in SETA-supported learning programmes, by programme type, in 2012 3Table 3: Number of students enrolled in public HEIs, by major field of study, qualification type and institution, in 2012 6Table 4: Number of students enrolled in public HEIs, by attendance mode, population group, gender and institution, in 2012 9Table 5: Full-time equivalent student enrolment in public HEIs by attendance mode, major field of study and institution, in 2012 11Table 6: Number of students who graduated from public HEIs by major field of study, qualification type and by institution, in 2011 13Table 7: Summaries of graduation rates in public HEIs, in 2012 14Table 8: Undergraduate success rates of students in public HEIs by population group, attendance mode and institution, in 2012 15Table 9: Number and percentage of permanent staff in public HEIs, by institution, in 2012 17Table 10: Number of students enrolled in private HEIs by gender, from 2010 to 2012 18Table 11: Number of students enrolled in private HEIs by population group and nationality, from 2010 to 2012 18Table 12: Overview of student enrolment in the FET College sector by institutional type, qualifications and province, in 2012 20Table 13: Number of students, lecturers and institutions in public FET Colleges, by province, in 2012 21Table 14: Number of students enrolled in public FET Colleges, by college and qualification category, in 2012 22Table 15: Full-Time Equivalent student enrolment in public FET Colleges, by qualification category and College, in 2012 23Table 16: Number of staff and students in public FET Colleges, in 2012 24Table 17: Number of staff in FET Colleges, by staff category and College, in 2012 25Table 18: Number of students enrolled in private FET Colleges, by qualification category and gender, in 2012 26Table 19: Number of students in private FET Colleges by occupational programme, in 2012 27Table 20: Number of staff in private FET Colleges, by category and gender, in 2012 27Table 21: Number and percentage of students in public and private FET Colleges who wrote and passed, by qualification type, from 2011 to 2012 28Table 22: Number of public and private FET College students who entered, wrote and passed NC (V) examinations, by province, in 2012 29Table 23: Number of public and private FET College students who entered, wrote and passed the Report 191 N1-N3 December 2012 examinations for engineering studies, by province, in 2012 30Table 24: Number of public and private FET College students who entered, wrote and passed the Report 191 N4-N6 December 20 examinations for engineering studies, by province, in 2012 31Table 25: Number of public and private FET College students who entered, wrote and passed the Report 191 N4-N6 December 2012 examinations for business studies, by province, in 2012 32
List of tables
..........................................................................
......................................................

viii
Table 26: Learner enrolment in public and private AET Centres by institutional type and programme type, in 2012 33Table 27: Number of learners, educators and institutions in public AET Centres by province, in 2012 34Table 28: Number of learners in public AET Centres by province and programme, in 2012 35Table 29: Number of staff in public AET Centres by province, category and gender, in 2012 36Table 30: Number of learners, educators and institutions in private AET Centres by province, in 2012 37Table 31: Number of learners enrolled in private AET Centres by programme, in 2012 38Table 32: Number of staff in private AET Centres by province, category and gender, in 2012 39Table 33: Number of public and private AET Centre learners who entered, wrote and passed the GETC-ABET Level 4 examinations, from 2010 to 2012 40Table 34: Number of public and private AET Centre learners who entered, wrote and passed the GETC-ABET Level 4 examinations, by province, in 2012 40Table 35: Number of workers and unemployed persons registered and certificated in SETA supported learning programmes by programme type, from 2010/11 to 2012/13 42Table 36: Number of workers registered for SETA-supported learning programmes, by programme type, in 2012/13 43 Table 37: Number of workers certificated in SETA –supported learning programmes, by programme type, in 2012/13 44Table 38: Number of unemployed persons registered for SETA-supported learning programmes, by programme type, in 2012/13 45Table 39: Number of unemployed persons certificated in SETA –supported learning programmes, by programme type, in 2012/13 46Table 40: Number of learners entering artisanal learning programmes, from 2011/12 to 2012/13 48Table 41: Number of learners completing artisanal learning programmes, from 2011/12 to 2012/13 49Table 42: Transfers to key post-school education and training institutions, from 2010/11 to 2012/13 50Table 43: Number of students who have received loans/bursaries from the National Student Financial Aid Scheme (NSFAS) and the amount provided, by sub-sector, from 2010 to 2012 51Table 44: Number of HEI students who received a Funza Lushaka bursary and the amount provided, from 2010 to 2012 52Table 45: Distribution of the skills levy fund, from 2010/11 to 2012/13 53Table 46: Number of NSF funded projects and beneficiaries by province, from 2010/11 to 2012/13 55Table 47: Distribution of national skills funds across key projects and number of beneficiaries, from 2010/11 to 2012/13 55Table 48: Distribution of NSF infrastructure budget, in 2012/13 56
List of tables

ix
LIST OF FIGURES
Figure 1: Percentage distribution of student enrolments in post-school education and training institutions, in 2012 3Figure 2: Number of students enrolled in public and private HEIs, from 2008 to 2012 4Figure 3: Number of students enrolled in public HEIs by attendance mode, from 2008 to 2012 5Figure 4: Number of students enrolled in public HEIs by major field of study, from 2010 to 2012 7Figure 5: Percentage distribution of student enrolment in public HEIs, by qualification type, in 2012 8Figure 6: Percentage distribution of student enrolment in public HEIs, by attendance mode and gender, in 2012 10Figure 7: Number of graduates in public HEIs by major field of study, from 2010 to 2012 12Figure 8: Percentage distribution of average undergraduate success rates in public HEIs, by contact education programmes and population group, in 2012 16
ABBREVIATIONS
ABET Adult Basic Education and TrainingAET Adult Education and TrainingAGRISETA Agriculture Sector Education and Training AuthorityAPP Annual Performance PlanBANKSETA Banking Sector Education and Training AuthorityCATHSSETA Culture, Arts, Tourism, Hospitality and Sports Sector Education and Training AuthorityCETA Construction Education and Training AuthorityCHIETA Chemical Industries Education and Training AuthorityDHET Department of Higher Education and TrainingEMIS Education Management Information SystemETDP SETA Education, Training and Development Practices Sector Education and Training AuthorityEWSETA Energy and Water Sector Education and Training Authority FASSET Finance and Accounting Services Sector Education and Training AuthorityFET Further Education and TrainingFETMIS Further Education and Training Management Information System FOODBEV Food and Beverages Manufacturing Industry Sector Education and Training AuthorityFP&MSETA Fibre Processing and Manufacturing Sector Education and Training AuthorityFTE Full-Time EquivalentGETC General Education and Training CertificateHE Higher EducationHEI Higher Education InstitutionHEMIS Higher Education Management Information SystemHEQSF Higher Education Qualifications Sub-FrameworkHWSETA Health and Welfare Sector Education and Training AuthorityINDLELA Institute for the National Development of Learnerships, Employment Skills and Labour AssessmentsINSETA Insurance Sector Education and Training Authority IPAP Industrial Policy Action PlanJHB Johannesburg
List of figures and Abbreviations

x
LGSETA Local Government Sector Education and Training AuthoritymerSETA Manufacturing, Engineering and Related Services Sector Education and Training AuthorityMICT SETA Media, Information and Communication Technologies Sector Education and Training AuthorityMQA Mining Qualifications Authority NADSC National Artisan Development Support CentreNAMB National Artisan Moderation BodyNATED National Technical EducationNC (V) National Certificate (Vocational)NDP National Development PlanNGP New Growth PathNID National Institute for the DeafNQF National Qualifications FrameworkNRF National Research FoundationNSA National Skills AuthorityNSC National Senior Certificate NSDS National Skills Development StrategyNSF National Skills FundNSFAS National Student Financial Aid SchemeOFO Organising Framework for OccupationsPED Provincial Education DepartmentPSETA Public Service Sector Education and Training AuthorityQCTO Quality Council for Trades and OccupationsRPL Recognition of Prior LearningRSA Republic of South AfricaSASSETA Safety and Security Sector Education and Training AuthoritySERVICES SETA Services Sector Education and Training AuthoritySET Science, Engineering and TechnologySETA Sector Education and Training Authority TETA Transport Education and Training AuthorityW&RSETA Wholesale and Retail Sector Education and Training Authority
Abbreviations

1
1. INTRODUCTION
The Department of Higher Education and Training (DHET) has oversight over three main categories of post-school education and training institutions, namely: Higher Education Institutions (HEIs); Further Education and Training (FET) Colleges and Adult Education and Training (AET) Centres. In addition, it is responsible for ensuring that funds generated through the skills development levy are utilised appropriately and optimally to develop skills needed for the economy and general development.
This report provides institutional, student, programme, staffing and (for the first time) funding statistics on post-school education and training as at 2012. It also presents information about registered and certificated artisans, as well as projects approved by the National Skills Fund (NSF). It covers post-school education and training for which the Department has oversight. It therefore does not provide information about post-school education and training that is managed by other government departments and state entities. Neither does it include statistics on education and training undertaken by private providers who are not registered with the Department.
The Department draws its data from a number of internal and external databases, as well as from management reports provided by Departmental entities. These include:
• The Higher Education Management Information System (HEMIS), which contains data provided to the Depart ment by public HEIs;
• Annual reports submitted by registered private HEIs;• The Further Education and Training Management Information System (FETMIS), which contains data provided to the
Department by public FET Colleges and registered private FET Colleges; • The database on AET Centres , which contains data provided to the Department by provincial education departments
and annual reports submitted by private AET Centres; • The Sector Education and Training Authority (SETA) Learner Management System, which contains data provided
to the Department by SETAs;• Quarterly Reports provided to the Department by SETAs;• Data provided to the Department by the National Artisan Moderation Body (NAMB); • Reports provided to the Department by the National Skills Fund (NSF); and• The National Examination Database, which contains administrative data about student examinations and certifi-
cation for GETC-ABET, National Certificate (Vocational) and “N” qualifications.
The Department is committed to ensuring that the data it receives from education and training institutions and public entities is valid and reliable. Its data quality assurance processes are therefore continuously being improved.
Introduction

2
2. THEPROVISIONINGOFPOST-SCHOOLEDUCATIONANDTRAINING:ANOVERVIEW
The formal provisioning of post-school education and training in South Africa occurs mainly through three main types of public and private education and training institutions, namely: HEIs; FET Colleges and AET Centres. In addition, work-place-based education and training occurs through a range of learning programmes that are supported and facilitated through SETAs.
Table1:Overviewofpost-schooleducationandtraininginstitutions,in2012
Public HEIs Private HEIs Public FET Colleges
Private FET Colleges
Public AET Centres
Private AET Centres Total
Numberofinstitutions 23 119 50 536 3 150 150 4 028
Numberofstudentsenrolled 953 373 97 487 657 690 115 586 306 378 8 690 2 139 204
Numberofstaff 48 340 - 16 928 6 846 19 569 476 92 159
Sources:Public Higher Education Institutions: 2012 HEMIS database, extracted in October 2013.Private Higher Education Institutions: Annual reports submitted by private HEIs to the DHET, August 2013.Public FET Colleges: 2012 Annual Survey of Public FET Colleges.Private FET Colleges: 2012 Annual Survey of Private FET Colleges.Public and Private AET Centres: 2012 Annual Survey of AET Centres.Public and Private AET Centres: 2012 Annual Survey of AET Centres and 2012 Snap Survey of AET Centres.Note 1: Private higher education figures are unaudited. Note 2: The number of private FET Colleges shown in Table 1 reflects the number of institutions registered with the Department.Note 3: The number of private AET Centres shown in Table 1 reflects the number of institutions registered with the Department.Note 4: Dash (-) means that data is not available.
As Table 1 shows, there were 23 public HEIs, 119 private HEIs, 50 public FET Colleges, 536 registered private FET Colleges, 3 150 public AET Centres and 150 registered private AET Centres in South Africa in 2012.
More than 2 million students had enrolled in public and private post-school education and training institutions in South Africa in 2012. As can be seen in Table 1, the majority of these students (more than 1 000 000) were enrolled in public and private higher education institutions, while more than 770 000 students had enrolled in private and public FET Colleges, close to 300 000 students had enrolled in public and private AET Centres.
The Provisioning of Post-School Education and Training: An Overview

3
Figure1:Percentagedistributionofstudentenrolmentinpost-schooleducationandtraininginstitutions,in2012
Note: Figure 1 reflects enrolment in both public and private institutions.
Figure 1 shows that student enrolment is proportionally higher in HEIs, compared with FET Colleges and AET Centres. In 2012, 49% of students had enrolled in HEIs, while 36% of students had enrolled in FET Colleges and 15% in AET Centres. Table2:NumberofworkersandunemployedpersonsregisteredforandcertificatedinSETA-supportedlearningprogrammes,by programmetype,in2012
Registered Certificated
Learnerships InternshipsSkills
developmentprogrammes
Total Learnerships InternshipsSkills
developmentprogrammes
Total
Workers 20 678 n.a. 64 105 84 783 14 399 n.a. 68 173 82 572
Unemployedpersons 30 207 6 127 10 482 46 816 22 759 2 195 18 318 43 272
Total 50 885 6 127 74 587 131 599 37 158 2 195 86 491 125 844
Source: SETA Quarterly Reports, 2012/13.Note 1: The category “Learnerships” means a learning programme that leads to an occupational qualification or part qualification, and includes an apprenticeship and cadetship.Note 2: The category “Internships” refers to the structured work experience component of an occupational qualification registered by the Quality Council for Trades and Occupations (QCTO).Note 3: The category “Skills Programmes” refers to programmes that have been undertaken as part qualifications as defined in the NQF Act, 2008.Note 4: “n.a.” means “not applicable.”
Table 2 shows that SETAs registered over 131 000 learners in SETA-supported learning programmes, and certificated close to 126 000 learners in 2012. More than 50 000 learners registered for learnership programmes in 2012, while close to 75 000 learners were registered for skills development programmes in 2012.
The Provisioning of Post-School Education and Training: An Overview

4
3. HIGHER EDUCATION AND TRAINING: AN OVERVIEW
3.1. INTRODUCTION
The Higher Education (HE) sector comprises 23 public HEIs and 119 private HEIs, with about 90% of all HE students enrolled in public HEIs. Two new public HEIs were established by 2014.
Figure2:NumberofstudentsenrolledinpublicandprivateHEIs,from2008to2012
Sources: 2012 HEMIS database (data extracted in October 2013) and annual reports submitted by private HEIs to the DHET.Note 1: Enrolment figures for private HEIs figures are unaudited.
Figure 2 shows that total student enrolment in HEIs (both public and private) grew from 868 178 in 2008 to 1 050 851 in 2012. Plans are afoot to ensure that government’s enrolment target of 1 620 000 for HEIs, as expressed in the National Development Plan (NDP)1, is achieved by 2030.
Student enrolment in public HEIs grew steadily over the past five years, from 799 490 in 2008 to 953 373 in 2012. While student enrolment in private HEIs also grew over this period, it declined between 2011 and 2012. In 2012, more than 950 000 students had enrolled in public HEIs, while about 97 000 students were enrolled in private HEIs.
1 The Presidency (2011). National Development Plan: Vision 2030, Pretoria.
Higher Education and Training: An Overview

5
3.2. PUBLIC HEIs
3.2.1 Introduction
South Africa has twenty three public HEIs. Eleven of these are generally regarded as Traditional Universities, six as Universities of Technology (formerly known as Technikons), and six as Comprehensive Universities (established as a result of mergers between traditional universities and former Technikons). Two new public universities, Sol Plaatje University in the Northern Cape Province, and the University of Mpumalanga in Mpumalanga Province, were established as legal entities in 2013 and will begin to function as fully fledged universities from 2014.
The statistics reflected in the tables and graphs below have been provided to the Department by pubic HEIs. The figures can be considered to be reliable since external auditors appointed by HEIs have audited the data prior to these being submitted to the Department.
3.2.2 EnrolmentsinpublicHEIs
Figure 3 indicates that, in general, a higher number of students enroll in contact mode of studies than in the distance mode. In 2012, 566 239 students were enrolled in contact mode programmes, while 387 134 students had enrolled in the distance mode. Figure 3 also shows a growth in student enrolment in both contact and distance modes of education between 2008 and 2012, with a significantly greater growth in student numbers occurring in the contact mode over this period.
Figure3:NumberofstudentsenrolledinpublicHEIsbyattendancemode,from2008to2012
Source: 2012 HEMIS database, extracted in October 2013. Note 1: The contact mode of study involves personal interaction with lecturers or supervisors, through, inter alia, lectures, seminars and/or practicals at the premises of the institution. Note 2: The distance mode of study involves interaction with lecturers or supervisors through distance education techniques, such as written correspondence, telematics and/or the internet.
Higher Education and Training: An Overview

6
Table3:NumberofstudentsenrolledinpublicHEIs,bymajorfieldofstudy,qualificationtypeandinstitution,in2012
Institution
MajorFieldofStudy QualificationType
Science,
Engine
eringan
dTechno
logy
Busine
ssand
Man
agem
ent
Educati
on
All O
ther
Hu
man
itiesand
So
cialScien
ces
Tota
l
Occasiona
lStud
ents
Und
ergrad
uate
Certificatesand
Dipl
omas
Und
ergrad
uate
Degree
s
Postgrad
uate,
Belo
w M
aste
r’s
Leve
l
Master's
Deg
rees
DoctoralDeg
rees
Tota
l
CapePeninsulaUniversityofTechnology 16 848 10 297 2 848 3 516 33 509 656 22 645 8 654 470 887 197 33 509UniversityofCapeTown 11 073 6 236 811 7 685 25 805 1 403 617 15 630 2 867 3 961 1 327 25 805CentralUniversityofTechnology,FreeState 5 586 3 326 1 956 1 857 12 724 1 8 446 3 466 524 202 85 12 724DurbanUniversityofTechnology 11 723 8 782 867 3 503 24 875 0 19 177 5 131 0 468 99 24 875
UniversityofFortHare 2 950 2 200 1 419 5 475 12 044 67 365 9 455 988 885 284 12 044UniversityoftheFreeState 8 946 7 221 9 019 7 190 32 375 1 883 5 679 17 941 4 149 2 192 531 32 375UniversityofJohannesburg 14 822 19 660 3 255 11 032 48 769 146 17 088 24 918 3 825 2 132 660 48 769UniversityofKwaZulu-Natal 15 733 7 737 7 638 10 757 41 864 1 190 3 370 27 856 3 404 4 418 1 626 41 864UniversityofLimpopo 10 755 4 491 1 058 5 945 22 249 8 525 18 566 1 218 1 743 189 22 249NelsonMandelaMetropolitanUniversity 9 170 9 481 3 281 4 665 26 597 589 11 079 11 164 1 285 2 028 452 26 597North West University 11 707 9 465 25 394 12 187 58 752 179 18 040 26 316 10 341 2 828 1 048 58 752
UniversityofPretoria 23 494 9 084 16 453 8 476 57 508 492 4 726 31 148 12 723 6 559 1 860 57 508Rhodes University 2 104 1 585 782 2 925 7 395 38 64 5 179 789 905 420 7 395UniversityofSouthAfrica 39 570 129 443 72 113 95 160 336 286 14 307 83 943 199 392 32 217 5 254 1 173 336 286UniversityofStellenbosch 13 189 5 933 1 566 6 822 27 510 989 36 16 480 3 625 5 072 1 308 27 510TshwaneUniversityofTechnology 21 127 17 146 3 526 9 913 51 711 59 38 942 10 549 343 1 510 308 51 711
UniversityofVenda 4 631 1 936 1 623 2 134 10 323 5 387 8 592 639 560 140 10 323VaalUniversityofTechnology 11 363 7 832 1 2 005 21 201 177 18 080 2 731 66 130 17 21 201Walter Sisulu University 7 659 6 582 4 434 5 938 24 613 0 14 205 9 378 645 351 34 24 613UniversityofWesternCape 7 117 2 669 1 806 8 000 19 591 0 496 15 099 1 882 1 511 603 19 591UniversityofWitwatersrand 14 391 5 327 3 213 7 506 30 436 347 530 19 940 2 568 5 627 1 424 30 436UniversityofZululand 3 000 2 218 5 546 5 670 16 434 101 2 312 12 571 933 338 179 16 434MangosuthuUniversityofTechnology 6 327 3 650 0 825 10 802 0 10 528 274 0 0 0 10 802
Total 273 282 282 299 168 608 229 184 953 373 22 637 281 280 500 430 85 501 49 561 13 964 953 373
Source: 2012 HEMIS database, extracted in October 2013. Note 1: Because some students were coded as “major field of study unknown”, or “unknown qualification type”, totals may not add up.Note 2: Education and Other Humanities and Social Sciences are separated out for the purpose of monitoring and planning. Note 3: SET majors refer to majors in the field of science, engineering and technology. These include majors in areas such as engineering, health sciences, life sciences, physical sciences, computer sciences and mathematical sciences. Note 4: Business majors include majors in accounting, management and all other business-related majors, such as marketing. Note 5: Humanities majors include majors in education, languages and literary studies, fine arts, music and the social sciences. Note 6: As a result of rounding off, numbers and percentages may not necessarily add up. Note 7: The category “Undergraduate Certificates and Diplomas” includes national certificates and diplomas. Note 8: The category “Undergraduate Degrees” includes also professional bachelor’s degrees, which are those that have an approved formal time of more than four years. Examples include degrees such as B Tech, BSc (Engineering), MB ChB, BFA.Note 9: The category “Postgraduate, Below Master’s Level” includes postgraduate and post-diploma diplomas, postgraduate bachelor’s degrees, and honours degrees.
Higher Education and Training: An Overview

7
Table 3 indicates that in 2012, Humanities remained the most popular field of study in public HEIs, with close to 400 0002
students enrolled in this area, followed by 282 299 students in the field of Business and Management, and 273 282 in the field of Science, Engineering and Technology (SET). Of all students studying in the field of Humanities, about 170 000 were enrolled in Education. Table 3 also shows that 500 430 students in public HEIs were enrolled in undergraduate degree programmes in 2012, while 281 280 were enrolled in undergraduate diploma and certificate programmes. Furthermore, 13 964 Doctoral students and 49 561 Master’s students enrolled in public HEIs in 2012.
Figure4:NumberofstudentsenrolledinpublicHEIsbymajorfieldofstudy,from2010to2012
Source: 2012 HEMIS database, extracted in October 2013.
Figure 4 shows that student enrolment in the SET and Humanities fields of study increased steadily since 2010, while that in Business and Management decreased between 2011 and 2012. The student enrolment ratio between SET, Business and Management, and the Humanities major fields of study stood at 29%: 30%: 41% in 2012.
2 This figure has been obtained by adding enrolment figures in the “Education” column with those reflected in the column “All Other Humanities and Social Sciences”.
Higher Education and Training: An Overview

8
Figure5:PercentagedistributionofstudentenrolmentinpublicHEIs,byqualificationtype,in2012
Source: 2012 HEMIS database, extracted in October 2013.Note 1: As a result of rounding off, total do not add up to 100.
Figure 5 shows that in 2012, more than 50% of HEI students were enrolled in undergraduate degree programmes, 29.5% in undergraduate certificate and diploma programmes, and 6.7% students in Master’s and Doctoral programmes.
Higher Education and Training: An Overview

9
Table4:NumberofstudentsenrolledinpublicHEIs,byattendancemode,populationgroup,genderandinstitution,in2012
Institution
Contact DistanceAfric
an
Colo
ured
Indian
/As
ian
Whi
te
Tota
l
Fem
ale
Mal
e
Afric
an
Colo
ured
Indian
/As
ian
Whi
te
Tota
l
Fem
ale
Mal
e
CapePeninsulaUniversityofTechnology 18 672 9 630 390 4 639 33 331 17 938 15 393 77 10 9 82 178 56 122UniversityofCapeTown 7 054 3 540 1 821 8 962 25 789 13 452 12 337 0 0 0 0 0 0 0CentralUniversityofTechnology,FreeState 10 724 407 40 1 285 12 456 5 884 6 572 178 73 4 13 268 195 73DurbanUniversityofTechnology 19 806 379 3 754 906 24 875 12 149 12 726 0 0 0 0 0 0 0UniversityofFortHare 11 440 220 54 330 12 044 6 943 5 101 0 0 0 0 0 0 0UniversityoftheFree State 16 163 1 270 303 8 257 25 993 15 403 10 590 5 158 253 155 816 6 382 4 566 1 816UniversityofJohannesburg 38 390 1 475 2 163 6 741 48 769 26 427 22 342 0 0 0 0 0 0 0UniversityofKwaZulu-Natal 22 574 897 10 610 3 038 37 242 21 017 16 225 4 298 44 219 57 4 622 3 354 1 268UniversityofLimpopo 21 787 36 149 277 22 249 12 043 10 206 0 0 0 0 0 0 0NelsonMandelaMetropolitanUniversity 14 443 3 606 357 6 429 24 837 12 957 11 880 1 653 69 4 34 1 760 1 393 367North West University 16 686 1 112 400 16 187 34 386 20 564 13 822 19 802 1 456 48 876 24 365 18 544 5 821UniversityofPretoria 18 488 972 2 124 23 883 45 468 24 885 20 583 11 823 66 55 96 11 894 8 526 3 368Rhodes University 3 877 284 289 2 945 7 395 4 306 3 089 0 0 0 0 0 0 0UniversityofSouth Africa 7 48 0 10 65 51 14 239 570 17 547 23 162 55 340 336 220 210 262 125 958UniversityofStellenbosch 4 027 4 253 572 18 658 27 510 13 958 13 552 0 0 0 0 0 0 0TshwaneUniversityofTechnology 46 505 334 208 3 426 50 473 26 015 24 458 982 185 34 37 1 238 571 667UniversityofVenda 10 308 3 7 5 10 323 5 593 4 730 0 0 0 0 0 0 0VaalUniversityofTechnology 20 202 308 74 556 21 141 9 622 11 519 60 0 0 0 60 33 27Walter Sisulu University 24 443 37 82 51 24 613 13 708 10 905 0 0 0 0 0 0 0UniversityofWesternCape 8 328 9 067 1 044 924 19 590 11 757 7 833 0 0 0 0 0 0 0UniversityofWitwatersrand 17 499 1 085 4 105 7 745 30 436 16 526 13 910 0 0 0 0 0 0 0UniversityofZululand 16 323 14 50 45 16 434 10 624 5 810 0 0 0 0 0 0 0MangosuthuUniversityofTechnology 10 776 12 10 4 10 802 5 518 5 284 0 0 0 0 0 0 0
Totals 378 522 38 989 28 606 115 303 566 221 307 340 258 881 283 601 19 703 23 690 57 351 386 987 247 500 139 487
Percentage 67% 7% 5% 20% 100% 54% 46% 73% 5% 6% 15% 100% 64% 36%
Source: 2012 HEMIS database, extracted in October 2013. Note 1: Contact students are those who are registered mainly for courses offered in contact mode. Note 2: Distance students are those who are registered mainly for courses offered in distance mode. Note 3: The totals in the table = total male + total female. Seeing that students coded as “race unknown” are not included in the table, African + Coloured + Indian/ Asian + White may, therefore, not = the total columns.Note 4: As a result of rounding off, numbers and percentages may not necessarily add up.
Table 4 shows the number of students enrolled in public HEIs by attendance mode, population group and gender. In 2012, of the 566 221 students enrolled in contact education programmes, more than 50% (386 987) were African students with the remainder constituting White, Coloured and Asian/Indian students.

10
Figure6:PercentagedistributionofstudentenrolmentinpublicHEIs,byattendancemodeandgender,in2012
Source:2012HEMISdatabase,extractedinOctober2013.
Figure 6 demonstrates that females comprise a significantly higher proportion of students at public HEIs compared to males, at about 58% and 42% respectively. This gender gap is even wider in distance education programmes, where females comprise 64% of total student enrolment, compared to 36% of males.
Higher Education and Training: An Overview

11
Table5:Full-timeequivalentstudentenrolmentinpublicHEIsbyattendancemode,majorfieldofstudyandinstitution,in2012
Source: 2012 HEMIS database, extracted in October 2013.Note 1: Full-Time Equivalent (FTE) student enrolments are calculated (a) by assigning to each course a fraction representing the weighting it has in the curriculum of a qualification, and (b) by multiplying the headcount enrolment of that course by this fraction.Note 2: FTE contact students are those who are registered mainly for courses offered in contact mode.Note 3: FTE distance students are those who are registered mainly for courses offered in distance mode.Note 4: Definitions for fields of study employed here are the same as those employed in Table 3.Note 5: The totals above include undergraduate and postgraduate courses.Note 6: As a result of rounding off, numbers and percentages may not necessarily add up.
Higher Education and Training: An Overview
Institution
Contact Distance
Science,
Engine
eringan
dTechno
logy
Busine
ssand
Man
agem
ent
Educati
on
All O
ther
Hu
man
itiesand
So
cialScien
ces
Tota
l
Science,
Engine
eringan
dTechno
logy
Busine
ssand
Man
agem
ent
Educati
on
AllO
therHum
an-
itiesand
Social
Sciences
Tota
l
CapePeninsulaUniversityofTechnology 10 718 7 213 2 251 4 524 24 706 11 131 0 0 142UniversityofCapeTown 8 400 4 596 725 6 721 20 442 0 0 0 0 0CentralUniversityofTechnology,Free State 3 992 2 082 1 794 1 691 9 561 11 67 0 106 184DurbanUniversityofTechnology 7 964 5 550 555 4 090 18 159 0 0 0 0 0
UniversityofFortHare 2 426 1 621 1 203 4 716 9 967 0 0 0 0 0UniversityoftheFreeState 7 424 3 460 2 234 7 120 20 237 14 838 2 028 203 3 082UniversityofJohannesburg 10 480 14 615 2 486 9 768 37 349 0 0 0 0 0UniversityofKwaZulu-Natal 11 471 5 617 3 800 8 787 29 675 455 113 1 465 0 2 033UniversityofLimpopo 8 459 2 454 2 156 5 609 18 678 0 0 0 0 0NelsonMandelaMetropolitanUniversity 6 732 5 882 1 109 4 937 18 660 218 2 565 0 785North West University 8 945 6 369 2 574 10 375 28 264 1 346 171 8 087 1 744 11 347UniversityofPretoria 16 916 7 044 3 269 8 042 35 272 2 0 4 869 0 4 871
RhodesUniversity 1 718 1 184 475 2 737 6 114 0 0 0 0 0UniversityofSouthAfrica 0 0 0 56 56 22 560 55 515 31 519 62 653 172 248UniversityofStellenbosch 10 367 4 641 1 317 5 869 22 193 0 0 0 0 0TshwaneUniversityofTechnology 13 342 10 916 2 693 8 981 35 932 0 0 0 919 919
UniversityofVenda 2 963 1 014 1 086 3 058 8 122 0 0 0 0 0VaalUniversityofTechnology 6 656 5 098 0 2 703 14 457 16 25 0 10 50Walter Sisulu University 6 776 2 959 4 929 5 683 20 347 0 0 0 0 0UniversityofWesternCape 5 549 2 047 1 041 6 728 15 366 0 0 0 0 0UniversityofWitwatersrand 10 389 3 576 2 255 6 424 22 644 0 0 0 0 0UniversityofZululand 2 587 2 195 5 423 5 379 15 583 0 0 0 0 0MangosuthuUniversityofTechnology 3 978 1 998 0 1 396 7 372 0 0 0 0 0
Total 168 252 102 130 43 376 125 397 439 155 24 633 56 862 48 533 65 633 195 662
Percentage 38% 23% 10% 29% 100% 13% 29% 25% 34% 100%

12
Full-Time Equivalent (FTE) student enrolments are calculated by: (a) assigning to each course a fraction representing the weighting it has in the curriculum of a qualification and (b) by multiplying the headcount enrolment of that course by this fraction.
In 2012, the total number of FTEs in public HEIs was more than 630 000. The majority of FTEs by far (439_155) were enrolled in contact education learning, while more than 195 000 FTEs were enrolled in distance education learning. Furthermore, of the FTEs enrolled in contact education learning, 38% were enrolled in SET programmes, while 10% were enrolled in the field of Education. However, of those enrolled for distance education learning, the majority (34%) were enrolled in Other Humanities and Social Sciences, while 13% were enrolled in SET programmes.
3.2.3 GraduatesinpublicHEIs
Figure7:NumberofgraduatesinpublicHEIsbymajorfieldofstudy,from2010to2012
Source: 2012 HEMIS database, extracted in October 2013.
Figure 7 shows that the number of graduates in public HEIs increased steadily in all fields of studies since 2010, except in the field of Education, where the number of graduates decreased over the 2010 to 2012 period. In 2012, the highest number of graduates was from the SET field of study, followed by the Business and Management field of study.
Higher Education and Training: An Overview

13
Table6:NumberofstudentswhograduatedfrompublicHEIsbymajorfieldofstudy,qualificationtypeandinstitution,in2012
Institution
MajorFieldofStudy FormalQualification
Science,
Engine
eringan
dTechno
logy
Busine
ssand
Man
agem
ent
Educati
on
All O
ther
Hu
man
itiesand
So
cialScien
ces
Tota
l
Und
ergrad
uate
Certificatesand
Di
plom
as
Und
ergrad
uate
Degree
s
Postgrad
uateBelow
M
aste
r's L
evel
Master's
Deg
rees
DoctoralDeg
rees
Tota
l
CapePeninsulaUniversityofTechnology 3 309 2 857 752 975 7 892 4 552 2 923 267 126 24 7 892UniversityofCapeTown 2 673 1 757 365 1 943 6 737 208 3 330 1 921 1 080 198 6 737CentralUniversityofTechnology,FreeState 1 203 906 639 411 3 159 1 691 1 122 320 21 5 3 159DurbanUniversityofTechnology 2 486 2 226 167 1 023 5 902 3 999 1 834 0 63 6 5 902UniversityofFortHare 582 512 379 1 106 2 578 106 1 640 606 183 43 2 578UniversityoftheFreeState 2 256 1 596 1 291 1 330 6 473 613 2 850 2 381 535 94 6 473UniversityofJohannesburg 3 147 4 936 1 032 2 296 11 410 3 647 5 238 1 986 430 109 11 410Universityof KwaZulu-Natal 2 908 1 726 2 591 2 263 9 488 1 341 5 236 1 937 797 177 9 488UniversityofLimpopo 1 701 850 389 1 358 4 298 177 3 021 816 273 17 4 304NelsonMandelaMetropolitanUniversity 2 112 1 972 971 922 5 976 2 314 2 400 758 418 86 5 976North WestUniversity 2 901 2 454 6 653 2 661 14 669 5 351 4 771 3 723 670 154 14 669
UniversityofPretoria 4 419 2 602 4 368 2 020 13 408 2 005 5 604 4 199 1 400 200 13 408Rhodes University 598 485 295 919 2 297 49 1 286 664 231 67 2 297UniversityofSouthAfrica 2 057 8 228 10 178 5 747 26 210 7 563 10 051 7 613 831 152 26 210UniversityofStellenbosch 3 072 2 108 597 1 904 7 681 10 3 477 2 514 1 440 240 7 681TshwaneUniversityofTechnology 4 073 3 824 800 2 060 10 757 7 404 2 989 133 187 44 10 757
UniversityofVenda 807 281 309 367 1 764 92 1 380 263 25 4 1 764VaalUniversityofTechnology 1 636 2 022 0 272 3 930 2 877 1 006 0 45 2 3 930Walter Sisulu University 1 233 1 581 782 1 230 4 826 2 751 1 777 251 45 3 4 827UniversityofWesternCape 1 445 578 369 1 315 3 705 202 2 122 955 351 75 3 705UniversityofWitwatersrand 2 615 1 506 955 1 733 6 809 329 3 545 1 651 1 134 150 6 809
UniversityofZululand 558 348 1 599 1 561 4 066 515 3 047 427 49 28 4 066MangosuthuUniversityofTechnology 1 058 691 0 202 1 951 1 858 93 0 0 0 1 951
Total 48 848 46 044 35 478 35 617 165 986 49 654 70 742 33 385 10 334 1 878 165 993
Source: 2012 HEMIS database, extracted in October 2013. Note 1: Definitions of fields of study are the same as those employed in Table 3. Note 2: Definitions of formal qualifications are the same as those employed in Table 3. Note 3: As a result of rounding off, numbers and percentages may not necessarily add up.Note 4: Because some students were coded as “Major Field of Study Unknown”, or “Unknown Qualification Type”, totals may not add up.
Higher Education and Training: An Overview

14
Table 6 shows that more than 165 000 students graduated from public HEIs in 2012. Of these, 48 848 were in the SET field of study, 46 044 were in Business and Management, 35 478 were in Education, and the remaining 35 617 were in all other Humanities and Social Sciences.
Table 6 also shows that in 2012, 70 742 students graduated with undergraduate degrees, while 49 654 students graduated with certificates and diplomas. In 2012, 10 334 Master’s degrees and 1 878 doctoral degrees were awarded.
Table7:SummariesofgraduationratesinpublicHEIs,in2012
Institution UndergraduateDegreesandDiplomas (%) Master'sDegrees(%) DoctoralDegrees(%)
CapePeninsulaUniversityofTechnology 24 14 12
UniversityofCapeTown 22 27 15
CentralUniversityofTechnology,FreeState 24 10 6
DurbanUniversityofTechnology 24 13 6
UniversityofFortHare 18 21 15
UniversityoftheFreeState 15 24 18
UniversityofJohannesburg 21 20 17
UniversityofKwaZulu-Natal 21 18 11
UniversityofLimpopo 17 16 9
NelsonMandelaMetropolitanUniversity 21 21 19
NorthWestUniversity 23 24 15
UniversityofPretoria 21 21 11
RhodesUniversity 25 26 16
UniversityofSouthAfrica 6 16 13
UniversityofStellenbosch 21 28 18
TshwaneUniversityofTechnology 21 12 14
UniversityofVenda 16 4 3
VaalUniversityofTechnology 19 35 12
WalterSisuluUniversity 19 13 9
UniversityofWesternCape 15 23 12
UniversityofWitwatersrand 19 20 11
UniversityofZululand 24 14 16
MangosuthuUniversityofTechnology 18 n.a. n.a.
Average 15 21 13
Source: 2012 HEMIS database, extracted in October 2013. Note 1: The graduation rate is the number of graduates in the 2012 academic year at the level of undergraduate degrees and diplomas, masters degrees and doctoral degrees, expressed as the percentage of total enrolment for 2012, at the level of degree/diploma, masters degrees and doctoral degrees.Note 2: These graduation rates serve as proxies for throughput rates of cohorts of students. A detailed account of benchmarks related to these graduation rates can be seen in The National Plan for Higher Education (Department of Education: 2001). Note 3: The benchmarks in the National Plan were set on the basis that at least 75% of any cohort of students entering a programme should complete their degrees or diplomas. When converted to graduation rates, the cohort throughput rates in the table above are equivalent to graduation rates of, broadly, the following kind:
Undergraduate DoctoralContactprogrammes 25% 20%Distanceprogrammes 15% 15%
Note 4: As a result of rounding off, numbers and percentages may not necessarily add up. Note 5: Graduation rates include graduates and diplomates.
Table 7 shows that graduation rates in HEIs are generally lower than that set by the National Plan for Higher Education (DoE, 2001). In 2012, the average graduation rate of doctoral students stood at 13%, while that for Masters students and undergraduate degree and diploma students was 21% and 15% respectively. Table 7 also shows that graduation rates differ widely across HEIs.
Higher Education and Training: An Overview

15
Table8:UndergraduatesuccessratesofstudentsinpublicHEIsbypopulationgroup,attendancemodeandinstitution,in2012
InstitutionContact(%) Distance(%)
African Coloured Indian/Asian White Average African Coloured Indian/
Asian White Average
CapePeninsulaUniversityofTechnology 73 83 85 88 78 52 55 63 68 60
UniversityofCapeTown 79 86 86 93 86 n.a. n.a. n.a. n.a. n.a.CentralUniversityofTechnology,FreeState 76 80 76 80 77 79 83 77 77 80DurbanUniversityofTechnology 79 86 82 87 80 n.a. n.a. n.a. n.a. n.a.
UniversityofFortHare 77 78 78 91 78 n.a. n.a. n.a. n.a. n.a.
UniversityoftheFreeState 69 72 73 85 75 61 76 94 89 62
UniversityofJohannesburg 81 80 84 87 82 n.a. n.a. n.a. n.a. n.a.
UniversityofKwaZulu-Natal 79 84 84 90 81 84 87 95 94 85
UniversityofLimpopo 84 71 92 96 84 n.a. n.a. n.a. n.a. n.a.NelsonMandelaMetropolitanUniversity 75 78 81 86 78 83 89 50 79 83
NorthWestUniversity 82 80 87 88 85 83 86 97 95 84
UniversityofPretoria 76 78 82 87 82 77 71 89 94 77
RhodesUniversity 84 82 86 90 86 n.a. n.a. n.a. n.a. n.a.
UniversityofSouthAfrica 97 100 n.a. 100 99 64 66 70 76 67
UniversityofStellenbosch 75 80 87 87 85 n.a. n.a. n.a. n.a. n.a.TshwaneUniversityofTechnology 74 70 74 82 75 73 73 86 82 73
UniversityofVenda 85 94 83 79 85 n.a. n.a. n.a. n.a. n.a.
VaalUniversityofTechnology 73 66 72 71 73 90 n.a. n.a. n.a. 90Walter Sisulu University 78 76 98 72 78 n.a. n.a. n.a. n.a. n.a.
UniversityofWesternCape 77 80 87 92 80 n.a. n.a. n.a. n.a. n.a.UniversityofWitwatersrand 79 83 85 91 83 n.a. n.a. n.a. n.a. n.a.
UniversityofZululand 82 58 75 87 82 n.a. n.a. n.a. n.a. n.a.MangosuthuUniversityofTechnology 79 83 71 93 79 n.a. n.a. n.a. n.a. n.a.
Average 78 81 84 88 80 66 68 70 76 68
Source: 2012 HEMIS database, extracted in October 2013.Note 1: Undergraduate courses are those coded as lower prediplomate/undergraduate, intermediate prediplomate/undergraduate, and higher undergraduate Note 2: Success rates are determined as follows: a calculation is made of Full-Time Equivalent (FTE) enrolled student totals for each category of courses. A further FTE calculation, using the same credit values, is made for each category of courses for those students who passed the courses. The success rates are then determined as FTE passes divided by FTE enrolments. The success rates shown are, therefore, weighted averages for contact and distance courses for each population group. Note 3: As a result of rounding off, numbers and percentages may not necessarily add up. Note 4: “n.a.” means “not applicable”.
Table 8 shows that on average, contact mode students yielded more passes (80%) compared to the distance mode students (68%).
Higher Education and Training: An Overview

16
Figure8:PercentagedistributionofaverageundergraduatesuccessratesinpublicHEIs,bycontacteducationprogrammesand populationgroup,in2012
Source: 2012 HEMIS database, extracted in October 2013.
Figure 8 shows that in 2012 the average undergraduate success rate for contact students was 80.3%. The national average for under- and postgraduate, as well as contact and distance students, was 76%, which is on par with the set medium-term target of 76% by the Department. (DHET, Annual Performance Plan, 2012-2013 page 39)
Higher Education and Training: An Overview

17
3.2.4 StaffinginpublicHEIs
Table9:NumberandpercentageofpermanentstaffinpublicHEIs,byinstitution,in2012
Institution
TotalPermanentStaff %ofBlackStaffinTotal %ofFemaleStaffinTotal
Instructi
onand
Re
searchStaff
Administrati
ve
Staff
ServiceStaff
Instructi
onand
Re
searchStaff
Administrati
ve
Staff
ServiceStaff
Instructi
onand
Re
searchStaff
Administrati
ve
Staff
ServiceStaff
CapePeninsulaUniversityofTechnology 765 916 163 59 83 99 42 60 26
UniversityofCapeTown 1 077 2 210 133 29 70 98 42 66 60CentralUniversityofTechnology,FreeState 274 325 103 42 61 98 39 57 55DurbanUniversityofTechnology 599 753 94 72 91 100 46 53 20
UniversityofFortHare 315 470 21 73 88 100 39 56 10UniversityoftheFreeState 949 1 113 329 21 34 97 48 67 49UniversityofJohannesburg 1 009 1 878 251 41 66 98 45 53 33UniversityofKwaZulu-Natal 1 399 2 185 261 54 85 99 47 62 25
UniversityofLimpopo 825 700 288 83 83 100 42 58 44NelsonMandelaMetropolitanUniversity 596 967 80 26 57 91 47 62 35
NorthWestUniversity 1 248 1 676 363 27 32 96 46 67 47
UniversityofPretoria 1 281 1 544 387 21 46 89 50 66 33
RhodesUniversity 336 546 452 23 53 99 40 60 50UniversityofSouthAfrica 1 588 3 128 98 48 71 99 49 58 31UniversityofStellenbosch 973 1 837 240 19 45 100 42 62 41TshwaneUniversityofTechnology 855 1 462 157 55 72 98 40 53 38UniversityofVenda 328 313 156 93 98 100 34 51 58VaalUniversityofTechnology 341 441 232 59 73 98 41 62 56
WalterSisuluUniversity 583 687 166 88 96 100 44 56 52UniversityofWesternCape 559 883 25 64 94 100 49 58 8UniversityofWitwatersrand 1 074 1 605 317 35 73 100 48 66 29
UniversityofZululand 298 387 184 81 92 100 40 48 40MangosuthuUniversityofTechnology 179 267 96 88 96 100 31 51 47
Total 17 451 26 293 4 596 46% 67% 98% 45% 60% 41%
Source: 2012 HEMIS database, extracted in October 2013.Note 1: A permanent staff member is defined as an employee who contributes to an institutional pension or retirement fund.Note 2: “Instruction and Research Staff” (also referred to as “academic staff”) are those who spend more than 50% of their official time on duty on instruction and research activities.Note 3: The category “Administrative Staff” includes all executive and professional staff who spend less than 50% of their official time on duty on instruction and research activities, as well as all technical and office staff.Note 4: The category “Service Staff” includes all staff, such as cleaners, gardeners, security guards and messengers, who are not engaged in supervisory or administrative functions linked to an office.Note 5: “Black Staff”, for the purpose of this summary table, includes all African, Coloured and Indian/ Asian staff on permanent contracts.Note 6: As a result of rounding off, numbers and percentages may not necessarily add up.
Table 9 shows that 17 451 persons were employed in the capacity of instruction and research staff, 26 293 as administrative staff, and 4 596 as service staff in public HEIs in 2012. Of the service staff and the instruction and research staff, 98% and 46% respectively were Black, while 45% of all instruction and research staff were female, and 60% of all administrative staff in public HEIs were female.
Higher Education and Training: An Overview

18
3.3. PRIVATE HEIs
3.3.1 Introduction
On 30 October 1998 the Minister of Education released a public notice in Government Gazette no. 19389 in which he stated that no private institution shall be allowed to offer HE education in South Africa as of 1 January 2000, unless registered or provisionally registered with the Department. In terms of the Higher Education Act, 1997 (Act No 101 of 1997) (hereafter referred to as “the Act”) and the Regulations for the Registration of Private Higher Education Institutions published in Government Gazette No. 24143 dated 13 December 2002, all private institutions providing HE, that is, programmes equivalent to those provided by traditional universities, comprehensive universities and universities of technology that fall on the Higher Education Qualifications Sub-Framework (HEQSF), must be registered with the DHET. This requirement applies to both local and foreign institutions. The Act was promulgated late in 1997 and the registration process was initiated in 1999.
The total student enrolment figures provided below are based on student enrolment per HE programme per institution as listed on the Register of Private HEIs. The Register is available on the Department’s website at www.dhet.gov.za.
3.3.2 EnrolmentsinprivateHEIs
Table10:NumberofstudentsenrolledinprivateHEIsbygender,from2010to2012
Year Male Female Total
2010 44 121 46 646 90 767
2011 48 876 54 160 103 036
2012 43 704 53 774 97 478
Source: DHET Annual Reporting by private HEIs, August 2013.Note 1: These figures are unaudited.
As shown in Table 10, student enrolment in private HEIs was more than 97 000 in 2012, a small decline since 2011. However, Table 10 also shows a significant increase in enrolment between 2010 and 2011. As was the case with public HEIs, female enrolment in private HEIs was consistently higher than that of males over the 2010-2012 reporting period.
Table11:NumberofstudentsenrolledinprivateHEIsbypopulationgroupandnationality,from2010to2012
Year African Coloured Indian/Asian WhiteNon-SouthAfricanstudents
TotalnumberofSouth Africanstudents
Totalnumberofstudents
2010 51 720 7 516 5 644 18 334 7 553 83 214 90 767
2011 56 988 7 526 5 913 23 311 9 298 93 738 103 036
2012 56 813 6 876 5 222 18 500 10 067 87 411 97 478
Source: DHET Annual Reporting by private HEIs, August 2013.Note 1: These figures are unaudited.
Table 11 indicates that of all the traditional race groups in South Africa, African students by far comprise the majority of students in private HEIs, with the numbers increasing substantially between 2010 and 2012. The number of non-South African students in private South African HEIs has also increased over the years, with over 10 000 non-South African students enrolled in private HEIs in 2012.
Higher Education and Training: An Overview

19
4. FURTHEREDUCATIONANDTRAINING(FET)COLLEGES:ANOVERVIEW
4.1. INTRODUCTION
Public and private FET Colleges are administered in terms of the Further Education and Training Colleges Act 16 of 2006, as amended. FET Colleges provide vocational and occupational education and training programmes to learners who left school before completing Grade 12, those who completed Grade 12, as well as employed persons.
In general, FET Colleges provide three broad categories of qualifications:
a. The National Certificate (Vocational) (NC(V)) at three levels (Levels 2, 3 and 4), which are equivalent to Grades 10, 11 and 12 of the schooling system; b. The “N” certificates offered at six different levels (N1 to N6), leading to the “N“ Diploma after 18 to 24 months of work experience in the case of the Business and General Studies, and 2 000 hours of work experience in the case of Engineering Studies; andc. Occupational Qualifications (including part qualifications), which are based on programmes linked closely to the workplace.
One of the Department’s central strategic objectives for the FET sector is the need to increase access to, and improve success in programmes that lead to intermediate and high level learning. In addition, FET Colleges are phasing in the offering of Higher Certificate programmes in collaboration with HEIs.
Public FET Colleges have become important providers of occupational learning funded by SETAs in terms of the SETA Grant Regulations, 2012.
This section of the report provides a statistical overview of access to both public and private FET Colleges. The subsequent sections provide further detail on student access to FET Colleges, disaggregated by public and private FET Colleges. Information about student performance in FET Colleges is provided in the section titled “Examination results”.
Further Education and Training (FET) Colleges: An Overview
IMPORTANT NOTE:
The source for student enrolment data of public FET Colleges has been obtained from the Department’s weekly enrolment monitoring tool. In previous versions of similar statistical publications, student enrolment data was obtained from the Department’s annual survey of FET Colleges.

20
Table12:OverviewofstudentenrolmentintheFETCollegesectorbyinstitutionaltype,qualificationsandprovince,in2012
Province
Public Private
NC
(V)
Repo
rt 1
91
N1-
N3
Repo
rt 1
91
N4-
N6
Occup
ation
al
qualificatio
ns
Repo
rt550
/NSC
Oth
er
Tota
l
NC
(V)
Repo
rt 1
91
NN
1-N
3
Repo
rt 1
91
N4-
N6
Occup
ation
al
qualificatio
ns
Repo
rt550
/NSC
Oth
er
Tota
l
EasternCape 18 843 7 985 19 476 2 192 0 10 409 58 905 42 25 108 1 943 123 1 060 3 301
Free State 5 481 11 888 29 275 2 763 349 2 059 51 815 251 0 279 350 337 866 2 083
Gauteng 28 976 33 805 60 704 6 578 0 17 844 147 907 183 282 607 20 798 515 29 005 60 490
KwaZulu- Natal 30 251 22 351 51 825 5 845 511 14 564 125 347 458 996 4 060 6 041 2 365 4 330 18 250
Limpopo 20 925 10 106 25 171 1 485 0 3724 61 411 45 143 804 1 724 12 1 139 3 867
Mpumalanga 86 46 15 478 11 024 2 994 0 764 38 906 78 0 31 1 836 0 1 003 2 948
NorthernCape 24 66 2 304 5 359 3 386 93 3 951 17 559 0 0 0 46 0 174 220
North West 98 37 10 770 9 330 6 516 0 14 162 50 615 21 19 92 1 111 105 730 2 078
WesternCape 15 150 10 409 22 364 30 600 762 25 940 105 225 1 08 0 22 7 762 495 3 052 12 339
Unspecified n.a. n.a. n.a. n.a. n.a. n.a. n.a. 595 525 534 5 545 270 2 541 10 010
National 140 575 125 096 234 528 62 359 1 715 93 417 657 690 4 181 3 790 12 337 47 156 4 222 43 900 115 586
Sources: Public FET Colleges: 2012 Audited Weekly Enrolment Monitoring of Public FET Colleges. Private FET Colleges: 2012 Annual Survey of Private FET Colleges. Note 1: NC(V) refers to the National Certificate (Vocational) Levels 2-4.Note 2: Report 191 refers to the NATED programmes, N1 to N6.Note 3: “Occupational Qualifications” refer to qualifications associated with a trade, occupation or profession resulting from work-based learning, and consisting of knowedge unit standards, practical unit standards and work experience unit standards. Note 4: NSC refers to the old National Senior Certificate (the Matric at N3 level).Note 5: “Other” in FET Colleges refers to all other skills development and short courses.Note 6: “n.a.” means “not applicable”.
Table 12 shows that 773 276 students enrolled in public and private FET Colleges in 2012. This figure represents a signif-icant increase in enrolment since 2010, when enrolment in public and private FET Colleges was 405 275, and a further improvement in enrolment since 2011, when enrolment was 534 719.
The private FET college sector in South Africa is relatively small-comprising only 15% of total FET College student enrolment in 2012.
As Table 12 indicates, the majority of FET College students had enrolled in Report 191(N4-N6) certificate programmes in 2012, as compared to other programme offerings.
FET Colleges: An Overview

21
4.2. PUBLIC FET COLLEGES
4.2.1 Introduction
The expansion and growth of the FET College sector remains a strategic priority of the Department. Therefore the performance of the sector is closely monitored. The phase-out of the N1 to N6 certificate programmes was halted in November 2010, to allow for the continued training of artisans and to broaden the learning options available to Matriculants.
The information reflected in this section relates to the scope, size and general demographics of public FET Colleges as is reflected per province. Staffing and student headcount and full-time equivalent enrolment statistics are also reflected per College and per programme (course) offering. This information can be used to reflect on the performance of the public FET College sector against pre-determined strategic objectives.
Table13:Numberofstudents,lecturersandinstitutionsinpublicFETColleges,byprovince,in2012
Province Categories Number
EasternCape
StudentsLecturersInstitutions
58 0221217
8
Free State
StudentsLecturersInstitutions
51 815602
4
Gauteng
StudentsLecturersInstitutions
147 9072 281
8
KwaZulu-Natal
StudentsLecturersInstitutions
125 3472 188
9
Limpopo
StudentsLecturersInstitutions
61 411971
7
Mpumalanga
StudentsLecturersInstitutions
38 906492
3
NorthernCape
StudentsLecturersInstitutions
17 559189
2
North West
StudentsLecturersInstitutions
50 615569
3
WesternCape
StudentsLecturersInstitutions
105 2251 368
6
National
StudentsLecturersInstitutions
657 6909 877
50
Source:2012AuditedWeeklyEnrolmentMonitoringofPublicFETColleges.
Table 13 shows that there were 50 public FET Colleges in South Africa, with a total headcount student enrolment of more than 657 000, and a staff complement of more than 9 800 FET College lecturers, in 2012. The number of public FET Colleges across provinces ranges from two to nine, with each having a number of campuses.
As can be seen from Table 13, student enrolment in public FET Colleges was highest in Gauteng and KwaZulu-Natal, at 147 907 and 125 347 respectively.
FET Colleges: An Overview

22
4.2.2 EnrolmentinpublicFurtherEducationandTrainingColleges
Table14:NumberofstudentsenrolledinpublicFETColleges,bycollegeandqualificationcategory,in2012
NameofCollege NC (V) Report 191 (N1-N3)
Report 191 (N4-N6)
Occupationalqualifications NSC Other Total
1.BolandFETCollege 1 870 661 6 606 6 442 - 5 438 21 0172.BuffaloCityFETCollege 2 653 750 3 670 - - 104 7 1773.CapricornFETCollege 4 881 1 206 5 006 75 0 1 256 12 4244.CentralJHBFETCollege 2 247 5 401 9 186 425 - 2 163 19 4225.CoastalFETCollege 6 864 2 362 6 918 229 - 402 16 7756.CollegeofCapeTownFETCollege 3 056 1 271 4 185 12 050 762 4 282 25 6067.EastCapeMidlandsFETCollege 2 362 2 123 3 203 521 - 3 497 11 7068.EhlanzeniFETCollege 2 601 2 476 2 486 1 072 0 8 6359.EkurhuleniEastFETCollege 2 944 1 031 5 434 60 - 1 812 11 28110.EkurhuleniWestCollege 5 835 3 459 6 625 2 084 - 621 18 62411.ElangeniFETCollege 3 893 678 3 216 252 511 594 9 14412.EsayidiFETCollege 2 881 1 670 6 913 - 0 937 12 40113.FalseBayFETCollege 2 264 1 151 1 320 7 187 - 2 893 14 81514.FlaviusMarekaFETCollege 843 1 744 4 141 682 0 296 7 70615.GertSibandeFETCollege 3 776 2 694 2 532 115 0 454 9 57116.GoldfieldsFETCollege 831 2 387 2 919 - - 1 035 7 17217.IkhalaFETCollege 1 669 255 1 352 - - 351 3 62718.IngweFETCollege 1 868 574 1 846 - 0 180 4 46819.KingHintsaFETCollege 2 320 1 015 2 426 515 - 413 6 68920.KingSabataDalindyeboFETCollege 2 090 1 403 3 803 395 0 792 8 48321.LephalaleFETCollege 506 3 745 2 690 1 086 - 517 8 54422.LetabaFETCollege 2 448 780 1 129 - - 4 35723.LovedaleFETCollege 1 477 - 1 471 - - 1 181 4 12924.MajubaFETCollege 5 508 7 925 9 475 1 250 - 5 177 29 33525.MalutiFETCollege 2 118 1 704 5 970 282 0 534 10 60826.M-mbithiFETCollege 2 405 - 3 969 - 0 1 264 7 63827.MopaniSouthEastFETCollege 3 251 1 592 2 017 56 0 1 095 8 01128.MotheoFETCollege 1 689 6 053 16 245 1 896 349 97 26 32929.MthashanaFETCollege 1 822 1 190 2 867 549 0 649 7 07730.NkangalaFETCollege 2 269 10 308 6 006 1 807 0 310 20 70031.NorthernCapeRuralFETCollege 1 366 1 049 2 640 3 386 0 2 624 11 06532.NorthernCapeUrbanFETCollege 1 100 1 255 2 719 - 93 1 327 6 49433.NorthlinkFETCollege 2 502 5 830 7 927 - 0 11 449 27 70834.OrbitFETCollege 4 243 5 109 2 647 3 990 - 6 533 22 52235.PortElizabethFETCollege 4 404 1 865 1 705 761 0 3 891 12 62636.SedibengFETCollege 3 842 2 494 4 309 544 0 622 11 81137.SekhukhuneFETCollege 2 043 2 084 2 830 183 - 88 7 22838.SouthCapeFETCollege 2 205 537 1 044 2 084 - 770 6 64039.SouthWestFETCollege 5 473 2 774 6 387 1 383 0 989 17 00640.TaletsoFETCollege 2 374 2 053 3 946 1 020 - 4 364 13 75741.ThekwiniFETCollege 1 753 3 751 5 986 307 0 1 369 13 16642.TshwaneNorthFETCollege 3 163 3 081 10 696 - - 301 17 24143.TshwaneSouthFETCollege 3 313 8 384 11 005 1 390 0 10 332 34 42444.UmfoloziFETCollege 3 927 2 388 5 291 3 258 0 2 988 17 85245.UmgungundlovuFETCollege 1 198 2 387 7 190 - - 1 184 11 95946.VhembeFETCollege 4 659 403 11 499 - 0 438 16 99947.VuselelaFETCollege 3 220 3 608 2 737 1 506 0 3 265 14 33648.WaterbergFETCollege 3 137 296 - 85 0 330 3 84849.WestCoastFETCollege 2 159 7 181 7 062 2 837 0 1 108 20 34750.WesternCollegeFETCollege 3 253 959 1 282 692 - 1 004 7 190Total 140 575 125 096 234 528 62 456 1 715 92 056 657 690
Source: 2012 Audited Weekly Enrolment Monitoring of Public FET Colleges.Note 1: Dash (-) means that data is not available.Note 2: NC(V) refers to the National Certificate (Vocational) Levels 2-4.Note 3: Report 191 refers to the NATED programmes, N1 to N6.Note 4: “Occupational Qualifications” refer to qualifications associated with a trade, occupation or profession resulting from work-based learning, and consisting of knowedge unit standards, practical unit standards and work experience unit standards. Note 5: NSC refers to the old National Senior Certificate (the Matric at N3 level).Note 6: “Other” in FET Colleges refers to all other skills development and short courses.
Table 14 indicates that the majority of public FET students (more than 234 000) had enrolled for the Report 191 (N4-N6) certificate programmes in 2012, while more than 140 000 students had enrolled for the NC(V) Levels 2 to 4 qualifications. Tshwane South and Majuba FET Colleges had the highest student enrolment in 2012, at 34 424 and 29 335 respectively.
FET Colleges: An Overview

23
Table15:Full-timeEquivalentstudentenrolmentinpublicFETColleges,byqualificationcategoryandcollege,in2012
NameofCollege NC (V) Report 191 (N1-N3)
Report 191 (N4-N6) Total
1.BolandFETCollege 1 866 200 2 717 4 7832.BuffaloCityFETCollege 2 580 226 969 3 7753.CapricornFETCollege 4 493 378 1 852 6 7234.CentralJHBFETCollege 2 145 1 529 3 070 6 7455.CoastalFETCollege 6 675 768 2 574 10 0176.CollegeofCapeTownFETCollege 3 394 302 1 304 5 0007.EastCapeMidlandsFETCollege 2 363 497 1 093 3 9528.EhlanzeniFETCollege 2 491 850 1 101 4 4429.EkurhuleniEastFETCollege 2 944 343 2 312 5 59910.EkurhuleniWestCollege 5 636 792 2 080 8 50711.ElangeniFETCollege 3 796 219 2 249 6 26412.EsayidiFETCollege 2 874 522 3 248 6 64313.FalseBayFETCollege 2 112 401 625 3 13814.FlaviusMarekaFETCollege 784 378 1 490 2 65215.GertSibandeFETCollege 3 776 554 629 4 95916.GoldfieldsFETCollege 744 582 1 086 2 41117.IkhalaFETCollege 1 676 101 645 2 42318.IngweFETCollege 1 834 157 874 2 86419.KingHintsaFETCollege 5 524 338 1 188 7 05020.KingSabataDalindyeboFETCollege 3 399 528 1 406 5 33321.LephalaleFETCollege 1 271 883 840 2 99422.LetabaFETCollege 2 382 250 709 3 34123.LovedaleFETCollege 1 433 0 697 2 13024.MajubaFETCollege 5 388 2 344 3 828 11 56025.MalutiFETCollege 1 907 504 2 502 4 91326.MnambithiFETCollege 2 253 0 1 782 4 03527.MopaniSouthEastFETCollege 3 231 1 936 1 062 6 22928.MotheoFETCollege 1 724 1 556 5 785 9 06629.MthashanaFETCollege 1 818 351 1 192 3 36130.NkangalaFETCollege 2 183 2 381 1 557 6 12131.NorthernCapeRuralFETCollege 1 367 226 1 098 2 69132.NorthernCapeUrbanFETCollege 1 057 324 1 145 2 52633.NorthlinkFETCollege 2 537 1 726 3 100 7 36234.OrbitFETCollege 4 085 1 318 879 6 28235.PortElizabethFETCollege 3 340 475 539 4 35336.SedibengFETCollege 3 524 722 1 691 5 93637.SekhukhuneFETCollege 1 927 638 1 565 4 13038.SouthCapeFETCollege 2 163 171 513 2 84739.SouthWestFETCollege 4 750 779 2 570 8 10040.TaletsoFETCollege 2 118 603 1 497 4 21741.ThekwiniFETCollege 1 688 1 095 2 495 5 27842.TshwaneNorthFETCollege 3 270 957 4 258 8 48543.TshwaneSouthFETCollege 2 526 2 272 2 924 7 72244.UmfoloziFETCollege 3 884 556 1 839 6 27945.UmgungundlovuFETCollege 1 142 662 3 018 4 82246.VhembeFETCollege 4 659 134 5 417 10 21047.VuselelaFETCollege 2 530 899 966 4 39548.WaterbergFETCollege 2 472 81 0 2 55449.WestCoastFETCollege 3 253 161 566 3 98050.WesternCollegeFETCollege 1 723 1 777 2 842 6 341Total 138 711 35 445 91 385 265 542
Source: 2012 Audited Weekly Enrolment Monitoring of Public FET Colleges. Note 1: As a result of rounding off, numbers may not necessarily add up.
FTE enrolments represent weighted student enrolments. The weights are based on the type of programme that students are enrolled in. One FTE represents a student who is enrolled for all the subjects of a programme on a particular level. Statistics on FTEs are important, as they are used to allocate resources to public FET Colleges.
Table 15 shows that in 2012, there were more than 265 000 FTEs in public FET Colleges. The majority of FTEs (138 711) were enrolled for the NC(V) Levels 2, 3 and 4 qualifications.
FET Colleges: An Overview

24
4.2.3 StaffinginpublicFETColleges
Table16:NumberofstaffandstudentsinpublicFETColleges,in2012
NameofCollege NumberofStaff NumberofStudents
BolandFETCollege 392 21 017BuffaloCityFETCollege 299 7 177CapricornFETCollege 427 12 424CentralJHBFETCollege 456 19 422CoastalFETCollege 679 16 775CollegeofCapeTownFETCollege 493 25 606EastCapeMidlandsFETCollege 367 11 706EhlanzeniFETCollege 265 8 635EkurhuleniEastFETCollege 426 11 281EkurhuleniWestCollege 495 18 624ElangeniFETCollege 389 9 144EsayidiFETCollege 409 12 401FalseBayFETCollege 322 14 815FlaviusMarekaFETCollege 209 7 706GertSibandeFETCollege 334 9 571GoldfieldsFETCollege 178 7 172IkhalaFETCollege 186 3 627IngweFETCollege 175 4 468KingHintsaFETCollege 199 6 689KingSabataDalindyeboFETCollege 234 8 483LephalaleFETCollege 102 8 544LetabaFETCollege 193 4 357LovedaleFETCollege 253 4 129MajubaFETCollege 567 29 335MalutiFETCollege 352 10 608MnambithiFETCollege 237 7 638MopaniSouthEastFETCollege 196 8 011MotheoFETCollege 388 26 329MthashanaFETCollege 209 7 077NkangalaFETCollege 379 20 700NorthernCapeRuralFETCollege 185 11 065NorthernCapeUrbanFETCollege 140 6 494NorthlinkFETCollege 778 27 708OrbitFETCollege 417 22 522PortElizabethFETCollege 357 12 626SedibengFETCollege 350 11 811SekhukhuneFETCollege 253 7 228SouthCapeFETCollege 329 6 640SouthWestFETCollege 389 17 006TaletsoFETCollege 267 13 757ThekwiniFETCollege 275 13 166TshwaneNorthFETCollege 670 17 241TshwaneSouthFETCollege 482 34 424UmfoloziFETCollege 440 17 852UmgungundlovuFETCollege 301 11 959VhembeFETCollege 343 16 999VuselelaFETCollege 330 14 336WaterbergFETCollege 217 3 848WestCoastFETCollege 296 20 347WesternCollegeFETCollege 299 7 190Total 16 928 657 690
Source: 2012 Audited Weekly Enrolment Monitoring of Public FET Colleges. Note 1: “Staff” refers to persons employed at a public further education and training institution (this includes management, lecturing and support staff).
Table 16 shows that public FET Colleges had a total staff establishment of 16 928 in 2012. Northlink, Coastal and Tshwane North FET Colleges had employed the highest number of staff at 778, 679 and 670 respectively.
FET Colleges: An Overview
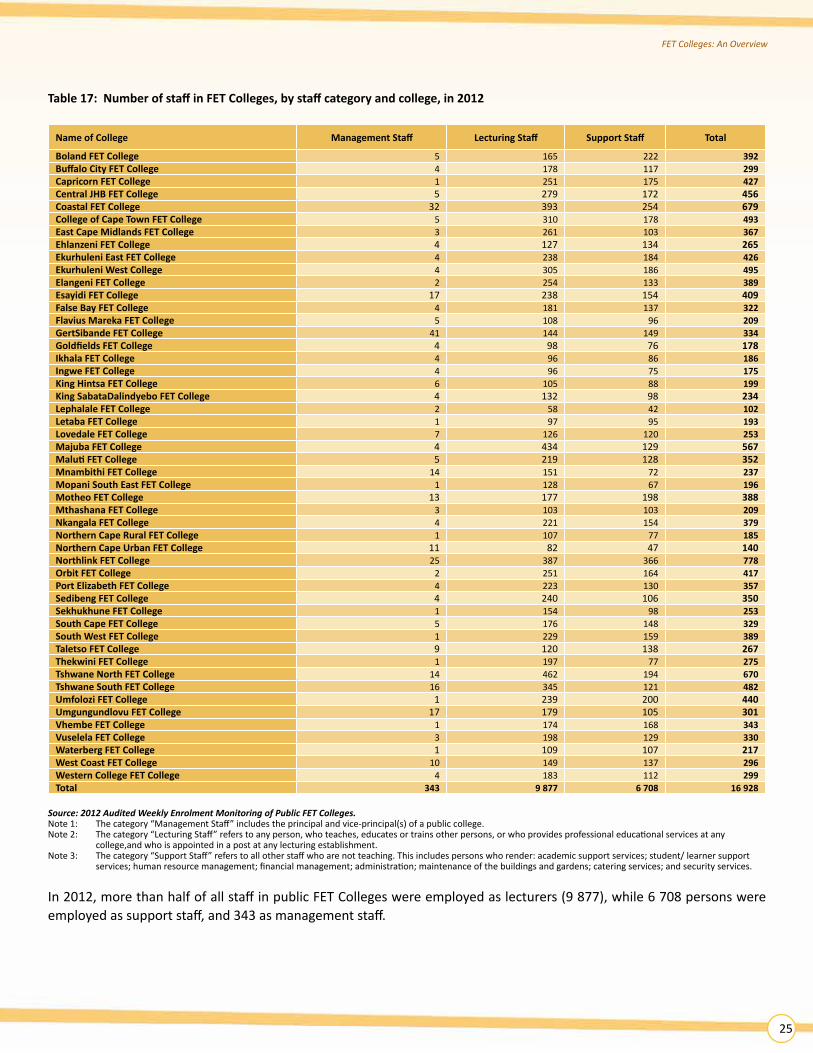
25
Table17:NumberofstaffinFETColleges,bystaffcategoryandcollege,in2012
NameofCollege ManagementStaff LecturingStaff SupportStaff Total
BolandFETCollege 5 165 222 392BuffaloCityFETCollege 4 178 117 299CapricornFETCollege 1 251 175 427CentralJHBFETCollege 5 279 172 456CoastalFETCollege 32 393 254 679CollegeofCapeTownFETCollege 5 310 178 493EastCapeMidlandsFETCollege 3 261 103 367EhlanzeniFETCollege 4 127 134 265EkurhuleniEastFETCollege 4 238 184 426EkurhuleniWestCollege 4 305 186 495ElangeniFETCollege 2 254 133 389EsayidiFETCollege 17 238 154 409FalseBayFETCollege 4 181 137 322FlaviusMarekaFETCollege 5 108 96 209GertSibandeFETCollege 41 144 149 334GoldfieldsFETCollege 4 98 76 178IkhalaFETCollege 4 96 86 186IngweFETCollege 4 96 75 175KingHintsaFETCollege 6 105 88 199KingSabataDalindyeboFETCollege 4 132 98 234LephalaleFETCollege 2 58 42 102LetabaFETCollege 1 97 95 193LovedaleFETCollege 7 126 120 253MajubaFETCollege 4 434 129 567MalutiFETCollege 5 219 128 352MnambithiFETCollege 14 151 72 237MopaniSouthEastFETCollege 1 128 67 196MotheoFETCollege 13 177 198 388MthashanaFETCollege 3 103 103 209NkangalaFETCollege 4 221 154 379NorthernCapeRuralFETCollege 1 107 77 185NorthernCapeUrbanFETCollege 11 82 47 140NorthlinkFETCollege 25 387 366 778OrbitFETCollege 2 251 164 417PortElizabethFETCollege 4 223 130 357SedibengFETCollege 4 240 106 350SekhukhuneFETCollege 1 154 98 253SouthCapeFETCollege 5 176 148 329SouthWestFETCollege 1 229 159 389TaletsoFETCollege 9 120 138 267ThekwiniFETCollege 1 197 77 275TshwaneNorthFETCollege 14 462 194 670TshwaneSouthFETCollege 16 345 121 482UmfoloziFETCollege 1 239 200 440UmgungundlovuFETCollege 17 179 105 301VhembeFETCollege 1 174 168 343VuselelaFETCollege 3 198 129 330WaterbergFETCollege 1 109 107 217WestCoastFETCollege 10 149 137 296WesternCollegeFETCollege 4 183 112 299Total 343 9 877 6 708 16 928
Source: 2012 Audited Weekly Enrolment Monitoring of Public FET Colleges.Note 1: The category “Management Staff” includes the principal and vice-principal(s) of a public college.Note 2: The category “Lecturing Staff” refers to any person, who teaches, educates or trains other persons, or who provides professional educational services at any college,and who is appointed in a post at any lecturing establishment.Note 3: The category “Support Staff” refers to all other staff who are not teaching. This includes persons who render: academic support services; student/ learner support services; human resource management; financial management; administration; maintenance of the buildings and gardens; catering services; and security services.
In 2012, more than half of all staff in public FET Colleges were employed as lecturers (9 877), while 6 708 persons were employed as support staff, and 343 as management staff.
FET Colleges: An Overview

26
4.3. PRIVATE FET COLLEGES
4.3.1 Introduction
The information reflected in this section is derived from private FET Colleges that have registered with the Department and have responded to the departmental survey. It includes statistics on headcount enrolment per qualification category and gender. Staffing is reflected by staff category and gender, while the examination results of private FET Colleges are provided in conjunction with those of public FET Colleges.
In 2012, there were 536 private FET Colleges registered with the Department. However, only 220 private FET Colleges responded to the survey sent to them by the department. Therefore, the data provided below needs to be read in this context.
This information provides an insight into the contribution of private FET College delivery to the system as a whole, while the examination data reveals interesting information related to the performance of the system.
4.3.2 EnrolmentinprivateFETColleges
Table18:NumberofstudentsenrolledinprivateFETColleges,byqualificationcategoryandgender,in2012
QualificationCategory Female Male Total
NC (V) Levels 2-4 2 095 2 086 4 181
Report 191( N1-N3) 1 298 2 492 3 790
Report 191( N4-N6) 5 906 6 431 12 337
OccupationalQualifications 29 266 17 890 47 156
Other 26 243 21 879 48 122
Total 64 808 50 778 115 586
Source: 2012 Annual Survey of Private FET Colleges.Note 1: “Occupational Qualifications” refer to qualifications associated with a trade, occupation or profession resulting from work-based learning, and consisting of knowledge unit standards, practical unit standards and work experience unit standards.Note 2: “Other” refers to all other skills development and short courses.
Table 18 shows that more than 115 500 students had enrolled in private FET Colleges in 2012. Of these, the majority were female. In contrast to public FET Colleges, most private FET College students enrolled for “Occupational” and “Other” qualifications rather than the NC (V) and Report 191 qualifications.
FET Colleges: An Overview
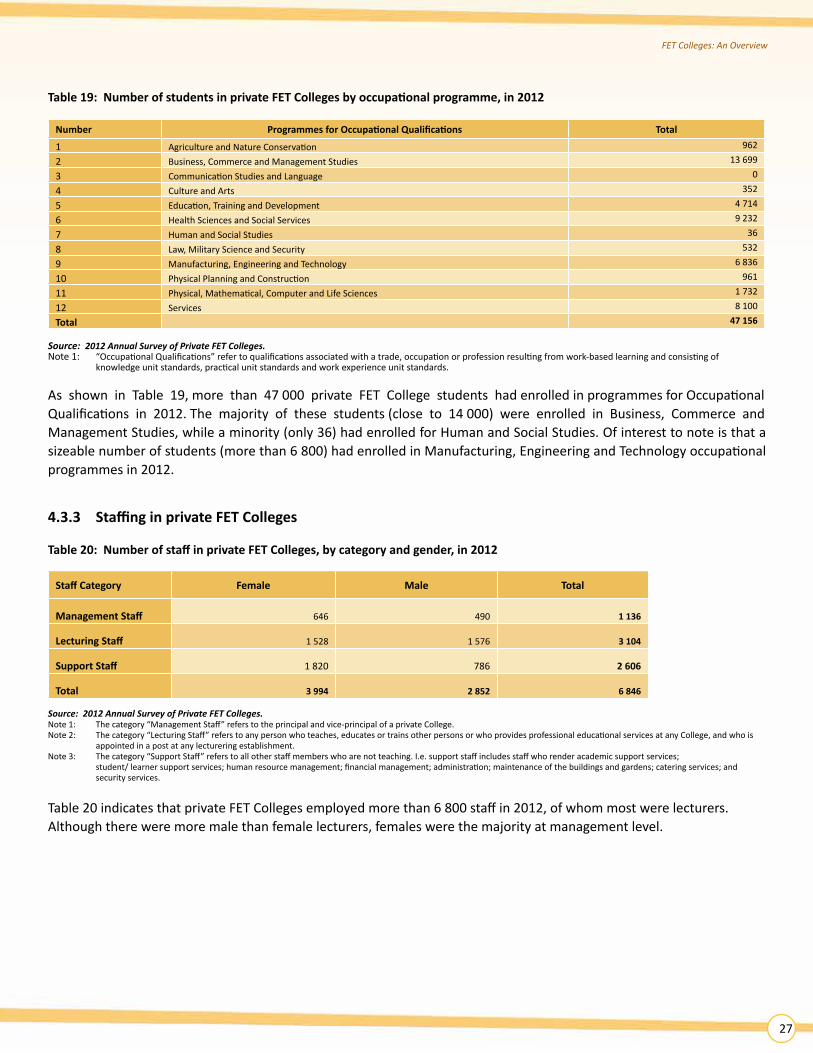
27
Table19:NumberofstudentsinprivateFETCollegesbyoccupationalprogramme,in2012
Number ProgrammesforOccupationalQualifications Total
1 Agriculture and Nature Conservation 962
2 Business, Commerce and Management Studies 13 699
3 Communication Studies and Language 0
4 Culture and Arts 352
5 Education, Training and Development 4 714
6 Health Sciences and Social Services 9 232
7 Human and Social Studies 36
8 Law, Military Science and Security 532
9 Manufacturing, Engineering and Technology 6 836
10 Physical Planning and Construction 961
11 Physical, Mathematical, Computer and Life Sciences 1 732
12 Services 8 100
Total 47 156
Source: 2012 Annual Survey of Private FET Colleges.Note 1: “Occupational Qualifications” refer to qualifications associated with a trade, occupation or profession resulting from work-based learning and consisting of knowledge unit standards, practical unit standards and work experience unit standards.
As shown in Table 19, more than 47 000 private FET College students had enrolled in programmes for Occupational Qualifications in 2012. The majority of these students (close to 14 000) were enrolled in Business, Commerce and Management Studies, while a minority (only 36) had enrolled for Human and Social Studies. Of interest to note is that a sizeable number of students (more than 6 800) had enrolled in Manufacturing, Engineering and Technology occupational programmes in 2012.
4.3.3 StaffinginprivateFETColleges
Table20:NumberofstaffinprivateFETColleges,bycategoryandgender,in2012
StaffCategory Female Male Total
ManagementStaff 646 490 1 136
LecturingStaff 1 528 1 576 3 104
SupportStaff 1 820 786 2 606
Total 3 994 2 852 6 846
Source: 2012 Annual Survey of Private FET Colleges.Note 1: The category “Management Staff” refers to the principal and vice-principal of a private College.Note 2: The category “Lecturing Staff” refers to any person who teaches, educates or trains other persons or who provides professional educational services at any College, and who is appointed in a post at any lecturering establishment.Note 3: The category “Support Staff” refers to all other staff members who are not teaching. I.e. support staff includes staff who render academic support services; student/ learner support services; human resource management; financial management; administration; maintenance of the buildings and gardens; catering services; and security services.
Table 20 indicates that private FET Colleges employed more than 6 800 staff in 2012, of whom most were lecturers. Although there were more male than female lecturers, females were the majority at management level.
FET Colleges: An Overview

28
4.4 EXAMINATION RESULTS IN PUBLIC AND PRIVATE FET COLLEGES
4.4.1Introduction This section of the report provides an overview of the performance of the candidates who wrote the November 2012 examinations at public and private FET Colleges. It focuses on candidates’ performance in the Report 190/1 part-qualifications and the NC(V) full qualifications. The examinations undertaken by FET College students in November 2012 were declared as valid and fair by UMALUSI, the quality assurance body for FET and general qualifications.
The statistics contained herein include all candidates who wrote the November 2012 examinations at all examination centres registered with the Department. 4.4.2ExaminationresultsinpublicandprivateFETColleges
Table21:NumberandpercentageofstudentsinpublicandprivateFETCollegeswhowroteandpassed,byqualification type,from2011to2012
YearNC(V) Level 4 Report 191 N3 Report 191 N6
Averagepassrate (%)Number
wroteNumber passed
Pass rate (%)
Number wrote
Number passed
Pass rate (%)
Number wrote
Number passed
Pass rate (%)
2011 17 836 7 638 42.8 2 909 1 366 47.0 2 428 1 488 61.3 50.4
2012 15 334 6 018 39.3 9 928 3 724 37.5 8 735 2 902 33.2 36.7
Source: Statistics on Post-School Education and Training in South Africa (2011), National Examinations Database, November 2012.Note 1: National Certificate (Vocational) qualification allows access to Higher Education study programmes to those who meet the minimum requirements.. Note 2: “Pass rate” represents the percentage of students who passed. Pass rate is computed by dividing the total number of students who passed (pass+ conditional pass) by total number of students who sat for an examination.
Table 21 shows that the average pass rate of students in FET Colleges (public and private combined) was about 37% in 2012, a significant decline from the previous year, when the pass rate was more than 50%. This decline can be attributed to the halving of the pass rate of N6 between 2011 and 2012. The average pass rate of students enrolled for the NC(V) programme was 39% in 2012, while that for N3 students was about 38%, and for N6 students 33%.
FET Colleges: An Overview

29
Table22:NumberofpublicandprivateFETCollegestudentswhoentered,wroteandpassedNC(V)examinations,byprovince, in2012
Province
NC(V) Level 2 NC (V) Level 3 NC (V) Level 4 Averagepass rate
(%)Number
entered
Number
wrote
Number
passed
Pass
rate
(%)
Number
entered
Number
wrote
Number
passed
Pass
rate
(%)
Number
entered
Number
wrote
Number
passed
Pass
rate
(%)
EasternCape 9 769 4 243 2 045 48.2 4 114 2 340 1 088 46.5 2 251 1 901 803 42.2 45.6
Free State 3 116 1 223 336 27.5 581 308 130 42.2 376 274 104 37.9 35.9
Gauteng 14 958 8 231 3 059 37.2 5 013 3 542 1 360 38.4 3 606 3 215 1 300 40.4 38.7
KwaZulu-Natal 17 769 9 788 3 793 38.8 6 596 4 116 1 347 32.7 3 842 2 960 788 26.6 32.7
Limpopo 10 034 5 847 2 107 36.0 3 773 2 814 1 046 37.2 3 531 2 938 1 014 34.5 35.9
Mpumalanga 3 966 2 457 1 402 57.1 2 000 1 360 704 51.8 1 464 1 307 675 51.6 53.5
NorthernCape 1 474 541 202 37.3 512 263 71 27.0 249 214 73 34.1 32.8
North West 3 728 2 263 972 42.9 1 527 1 118 577 51.6 1 044 941 501 53.2 49.2
WesternCape 8 230 4 199 2 601 61.9 3 901 2 444 1 340 54.8 2 244 1 584 760 47.9 54.9
National 73 044 38 792 16 517 42.6 28 017 18 305 7 663 41.9 18 607 15 334 6 018 39.3 41.3
Source: DHET (2012) FET Colleges and AET Centres: Preliminary report on examination and assessment results, November 2012 examinations. Pretoria.Note 1: “Pass rate” refers to the percentage of students who passed. Pass rate is computed by dividing the total number of students who passed (pass+ conditional pass) by total number of students who sat for an examination.Note 2: “Number entered” refers to the number of students who enrolled in an FET College for the qualification in NC (V) Levels 2-4.Note 3: “Number wrote” refers to the number of students who sat for the NC(V) Levels 2-4 examinations.Note 4: “Number passed” refers to the number of students who successfully completed the relevant NC (V) Levels 2-4.
Table 22 shows that large numbers of students did not write the NC(V) examinations, even though they had registered for the examinations. On average, the national pass rate of students in NC(V) examinations stood at 41% in 2012, with the Western Cape province having a 55% average pass rate, followed by Mpumalanga at 54%.
FET Colleges: An Overview

30
Table23:NumberofpublicandprivateFETCollegestudentswhoentered,wroteandpassedtheReport191N1-N3December 2012examinationsforengineeringstudies,byprovince,in2012
Province
Report 191 N1 Report 191 N2 Report 191 N3 Averagepass rate
(%)Number entered
Number wrote
Number passed
Pass rate (%)
Number entered
Number wrote
Number passed
Pass rate (%)
Number entered
Number wrote
Number passed
Pass rate (%)
EasternCape 459 241 88 36.5 832 592 166 28.0 679 533 156 29.3 31.3
Free State 798 590 224 37.9 834 682 173 25.4 494 377 138 36.6 33.3
Gauteng 2 497 1 542 567 36.8 3 514 2 863 879 30.7 5 340 3 726 1 406 37.7 35.1
KwaZulu-Natal 1 501 1 060 320 30.2 2 692 2 231 741 33.2 2 857 1 975 756 38.3 33.9
Limpopo 433 288 115 39.9 1 655 1 272 294 23.1 2 084 1 463 481 32.9 32.0
Mpumalanga 781 629 286 45.5 1 330 942 229 24.3 1 424 1 013 485 47.9 39.2
NorthernCape 78 66 19 28.8 249 207 85 41.1 97 80 33 41.3 37.1
North West 650 472 141 29.9 1 446 752 166 22.1 566 382 123 32.2 28.1
WesternCape 1 096 542 321 59.2 1 042 613 280 45.7 675 379 146 38.5 47.8
National 8 293 5 430 2 081 38.3 13 594 10 154 3 013 29.7 14 216 9 928 3 724 37.5 35.2
Source: DHET (2012) FET Colleges and AET Centres: Preliminary report on examination and assessment results, November 2012 examinations. Pretoria.Note 1: “Pass rate” refers to the percentage of students who passed. Pass rate is computed by dividing the total number of students who passed (pass+ conditional pass) by total number of students who sat for an examination.Note 2: “Number entered” refers to the number of students who enrolled in an FET College for the programmes in engineering studies N1-N3.Note 3: “Number wrote” refers to the number of students who sat for the engineering studies N1-N3 examinations.Note 4: “Number passed” refers to the number of students who successfully completed the relevant engineering studies N1-N3.
As can be seen in Table 23, a large number of students who registered to write examinations for N1 to N3 programmes, did not actually write the examinations. The national average pass rate for N1 to N3 programmes stood at 35% in 2012, with the Western Cape having the highest average pass rate at 48% and North West with the lowest average pass rate at 28%.
FET Colleges: An Overview

31
Table24:NumberofpublicandprivateFETCollegestudentswhoentered,wroteandpassedtheReport191N4-N6December 2012examinationsforengineeringstudies,byprovince,in2012
Province
Report 191 N4 Report 191 N5 Report 191 N6 Averagepass rate
(%)Number entered
Number wrote
Number passed
Pass rate (%)
Number entered
Number wrote
Number passed
Pass rate (%)
Number entered
Number wrote
Number passed
Pass rate (%)
EasternCape 356 274 125 45.6 191 157 60 38.2 145 124 39 31.5 38.4
Free State 340 257 91 35.4 247 177 38 21.5 130 78 21 26.9 27.9
Gauteng 3 207 2 182 864 39.6 2 801 2 044 860 42.1 1 497 1 140 420 36.8 39.5
KwaZulu-Natal 2 600 1 977 930 47.0 1 443 1 017 366 35.9 885 575 199 34.6 39.2
Limpopo 1 418 1 041 287 27.6 1 256 1 023 369 36.1 760 667 261 39.1 34.3
Mpumalanga 599 427 202 47.3 322 201 68 33.8 126 50 12 24.0 35.0
NorthernCape 4 0 0 - 4 2 0 0 0 0 0 - 0.0
North West 219 131 66 50.4 140 77 24 31.2 75 46 10 21.7 34.4
WesternCape 446 235 140 59.6 288 176 55 31.3 102 64 30 46.9 45.9
National 9 189 6 524 2 705 41.5 6 692 4 874 1 840 37.8 3 720 2 744 992 36.2 38.5
Source: DHET (2012) FET Colleges and AET Centres: Preliminary report on examination and assessment results, November 2012 examinations. Pretoria.Note 1: Dash (-) means that data is not available.Note 2: “Pass rate” refers to the percentage of students who passed. Pass rate is computed by dividing the total number of students who passed (pass + conditional pass) by total number of students who sat for an examination.Note 3: “Number entered” refers to the number of students who enrolled in an FET College for the qualification in engineering studies N4-N6Note 4: “Number wrote” refers to the number of students who sat for the engineering studies N4-N6 examinations.Note 5: “Number passed” refers to the number of students who successfully completed the relevant engineering studies N4-N6.
As is the case with other FET College programmes, the gap between the number of students who registered to write the N4 to N6 examinations and those who actually wrote the examinations, is fairly big. Table 24 shows that more than 14 000 students of the 19 601 who entered, wrote the Report 191 N4 to N6 Engineering Studies examinations in 2012, of whom just more than 5 000 passed the examinations. The province with the highest average pass rate was Western Cape at 46%.
FET Colleges: An Overview

32
Table25:NumberofpublicandprivateFETCollegestudentswhoentered,wroteandpassedtheReport191N4-N6 December2012examinationsforbusinessstudies,byprovince,in2012
Province
Report 191 N4 Report 191 N5 Report 191 N6 Averagepass rate
(%)Number entered
Number wrote
Number passed
Pass rate (%)
Number entered
Number wrote
Number passed
Pass rate (%)
Number entered
Number wrote
Number Passed
Pass rate (%)
EasternCape 1 992 1 411 428 30.3 1 374 1 141 169 14.8 567 481 123 25.6 23.6
Free State 2 802 771 38 4.9 1 392 1 068 180 16.9 555 431 138 32.0 17.9
Gauteng 7 334 5 524 1 908 34.5 4 287 3 503 364 10.4 1 426 1 196 361 30.2 25.0
KwaZulu- Natal 8 045 5 687 1 129 19.9 5 842 4 504 794 17.6 2 300 1 885 532 28.2 21.9
Limpopo 3 008 2 464 123 5.0 2 155 1 776 56 3.2 886 682 179 26.2 11.5
Mpumalanga 651 528 144 27.3 720 634 38 6.0 251 206 78 37.9 23.7
NorthernCape 453 328 79 24.1 873 742 63 8.5 227 195 51 26.2 19.6
North West 961 751 283 37.7 680 549 75 13.7 147 112 48 42.9 31.4
WesternCape 2 200 1 691 842 49.8 3 380 2 754 986 35.8 1 025 803 400 49.8 45.1
National 27 446 19 155 4 974 26.0 20 703 16 671 2 725 16.3 7 384 5 991 1 910 31.9 24.7
Source: DHET (2012) FET Colleges and AET Centres: Preliminary report on examination and assessment results, November 2012 examinations. Pretoria.Note 1: “Pass rate” refers to the percentage of students who passed. Pass rate is computed by dividing the total number of students who passed (pass + conditional pass) by total number of students who sat for an examination.Note 2: “Number entered” refers to the number of students who enrolled in an FET College for the qualification in business studies N4-N6.Note 3: “Number wrote” refers to the number of students who sat for the business studies N4-N6 examinations.Note 4: “Number passed” refers to the number of students who successfully completed the relevant business studies N4-N6.
Table 25 shows that more than 41 000 students of the 55 533 who entered, wrote the Report 191 N4 to N6 Business Studies examinations in 2012, with just more than 9 000 students having passed the examinations, resulting in an average pass rate of 25%. Western Cape had the highest average pass rate at 45%, while the lowest average pass rate was in Limpopo at 11.5%.
FET Colleges: An Overview

33
5. ADULTEDUCATIONANDTRAINING(AET)CENTRES:ANOVERVIEW
5.1 INTRODUCTION
The provisioning of AET in South Africa is underpinned by The Adult Basic Education and Training Act, 2000 (Act No. 52 of 2000). The Act provides for the establishment, governance and funding of AET institutions in South Africa.
AET is offered in public and private adult learning centres for adults and out-of-school youth who seek to complete their schooling and who wish to acquire new skills.
Table26:LearnerenrolmentinpublicandprivateAETCentresbyinstitutionaltypeandprogrammetype,in2012
Type AET Level 1
AET Level 2
AETLevel 3
AETLevel 4
(NQF Level 1)
Grade 10 (NQF Level 2)
Grade 11 (NQF Level 3)
Grade 12 (NQF Level 4)
Other/SkillsDevelopment Total
Private AET 1 148 1 263 1 356 2 370 53 8 2 049 443 8 690
Public AET 24 213 33 470 36 253 134 276 258 213 71 037 6 658 306 378
Total 25 361 34 733 37 609 136 646 311 221 73 086 7 101 315 068
Percentage 8.0% 11.0% 11.9% 43.4% 0.1% 0.1% 23.2% 2.3% 100%
Source: 2012 Annual Survey of AET Centres. 2012 Snap Survey of AET Centres.Note 1: Mpumalanga data was sourced from the 2012 Snap Survey of AET Centres.
Table 26 indicates that more than 315 000 learners had enrolled in public and private AET Centres in 2012, exceeding the 2012/13 target of 255 000 set in the Department’s Annual Performance Plan (APP). The public AET sector is significantly larger, at 97% of the total AET sector, compared to the private AET sector.
AET entres offer a range of learning opportunities – from adult basic education and training programmes, to second- chance opportunities for learners to complete Grade 12, as well as general skills development programmes. As can be seen from Table 26, in 2012, more than 40% of learners were enrolled in AET Level 4 programmes (NQF level 1 programme, equivalent to Grade 9), while more than a quarter of learners were enrolled in Grade 12 (NQF Level 4). The number and proportion of learners undertaking skills programmes is relatively much lower.
Adult Education and Training (AET) Centres: An Overview

34
5.2 PUBLIC AET CENTRES
5.2.1 Introduction
AET is offered in public and private AET Centres, which are located mainly in the townships and rural areas of South Africa. The majority of public AET Centres utilise schools for the provision of adult education and training programmes. Public AET Centres are established at provincial level by Provincial Departments of Education (PEDs). PEDs are responsible for the funding and support of AET Centres, including the recruitment of learners, the appointment of educators and managers, and the establishment of centres.
In 2012, there were 3 150 public AET Centres in South Africa. However, only 2 457 public AET Centres responded to the survey sent to them by the department. Therefore, the data provided below needs to be read in this context.
5.2.2 OverviewofpublicAETCentres
Table27:Numberoflearners,educatorsandinstitutionsinpublicAETCentresbyprovince,in2012
Province Categories Number
EasternCape
LearnersEducatorsInstitutions
40 7462 888
263
Free State
LearnersEducatorsInstitutions
12 774616
71
Gauteng
LearnersEducatorsInstitutions
85 6242 408
47
KwaZulu-Natal
LearnersEducatorsInstitutions
47 9614 871
702
Limpopo
LearnersEducatorsInstitutions
33 6101 532
650
*Mpumalanga
LearnersEducatorsInstitutions
27 1261 593
257
NorthernCape
LearnersEducatorsInstitutions
4 174236104
North West
LearnersEducatorsInstitutions
24 3491 373
260
WesternCape
LearnersEducatorsInstitutions
29 963926103
Unspecified
LearnersEducatorsInstitutions
512
n.a.
National
LearnersEducatorsInstitutions
306 37816 445
2 457
Source: 2012 Annual Survey of AET Centres. *2012 Snap Survey of AET Centres.Note 1: Dash (-) means that data is not available. Note 2: “n.a.” means “not applicable.”Note 3: 51 learners and two educators did not specify the name of their AET Centres and/ or province.Note 4: Mpumalanga data was sourced from the 2012 Snap Survey of AET Centres.
Table 27 shows that there were approximately 307 000 learners and 16 445 educators in 2 457 public AET Centres in South Africa in 2012. The number of AET Centres across provinces varies greatly, ranging from 47 in Gauteng to 702 in KwaZulu-Natal. However, Gauteng had the highest number of enrolled learners in 2012 at 85 624, followed by KwaZulu-Natal with close to 48 000 learners.
AET Centres: An Overview

35
Table28:NumberoflearnersinpublicAETCentresbyprovinceandprogramme,in2012
Province AET Level 1
AET Level 2
AET Level 3
AET Level 4 (NQF 1)
Grade 10 (NQF 2)
Grade 11 (NQF 3)
Grade 12 (NQF 4)
Other/SkillsDevelopment Total
EasternCape 4 144 6 682 6 920 22 777 0 0 0 223 40 746
Free State 199 854 1 423 6 380 0 22 3768 128 12 774
Gauteng 2 288 2 609 3 810 20 806 130 0 5 2740 3 241 85 624
KwaZulu-Natal 6 435 7 530 8 571 21 651 45 125 3 364 240 47 961
Limpopo 1 270 3 609 3 320 25 349 0 0 0 62 33 610
*Mpumalanga 2 725 5 294 5 152 13 825 17 0 108 5 27 126
NorthernCape 577 574 556 2 420 0 0 0 47 4 174
North West 3 268 4 060 4 252 11 156 0 0 828 785 24 349
WesternCape 3 307 2 249 2 235 9 884 66 66 10 229 1 927 29 963
Unspecified n.a. 9 14 28 n.a. n.a. n.a. n.a. 51
National 24 213 33 470 36 253 134 276 258 213 71 037 6 658 306 378
Percentage 7.9% 10.9% 11.8% 43.8% 0.1% 0.1% 23.2% 2.2% 100%
Source: 2012 Annual Survey of AET Centres. *2012 Snap Survey of AET Centres.Note 1: “n.a.” means “not applicable.”Note 2: 51 learners did not specify the name of their AET Centres and/ or province.Note 3: “Unspecified” refers to data that cannot be identified by province.Note 4: Mpumalanga data was sourced from the 2012 Snap Survey of AET Centres.
Table 28 shows that the majority of learners in public AET Centres were enrolled in AET Level 4 (NQF Level 1) and Grade12 (NQF Level 4) programmes.
AET Centres: An Overview

36
5.2.3 StaffinginpublicAETCentres
Table29:NumberofstaffinpublicAETCentresbyprovince,categoryandgender,in2012
ProvinceManagementstafftotal Educatorstafftotal Supportstafftotal Total
Female Male Total Female Male Total Female Male Total Female Male Total
EasternCape 248 64 312 2 414 474 2 888 8 6 14 2 670 544 3 214
Free State 69 45 114 407 209 616 1 0 1 477 254 731
Gauteng 25 43 68 1 526 882 2 408 113 98 211 1 664 1 023 2 687
KwaZulu-Natal 524 146 670 3 535 1 336 4 871 60 20 80 4 119 1 502 5 621
Limpopo 599 95 694 1 310 222 1 532 14 -0 14 1 923 317 2 240
*Mpumalanga 253 38 291 1 372 221 1 593 21 9 30 1 646 268 1 914
NorthernCape 29 8 37 180 56 236 4 1 5 213 65 278
North West 185 43 228 1 110 263 1 373 5 15 20 1 300 321 1 621
WesternCape 103 71 174 524 402 926 85 75 160 712 548 1 260
Unspecified 1 n.a. 1 2 n.a. 2 n.a. n.a. n.a. 3 n.a. 3
National 2 036 553 2 589 12 380 4 065 16 445 311 224 535 14 727 4 842 19 569
Percentage 78.6% 21.4% 100.0% 75.3% 24.7% 100.0% 58.1% 41.9% 100.0% 75.3% 24.7% 100%
Source: 2012 Annual Survey of AET Centres. *2012 Snap Survey of AET Centres.Note 1: “n.a means.” not applicable.Note 2: Three (3) staff members did not specify the name of their AET Centres and/or province.Note 3: “Educator staff” refers to any person who teaches, educates or trains a learner, or provides professional educational services, including professional therapy and educational psychology services at a centre.Note 4: “Management staff” includes the centre manager of an AET Centre.Note 5: “Support staff” includes all other staff members who are not teaching, i.e. support staff includes persons who render: academic support services; student/learner support services; human resource management; financial management; administration; maintenance of the buildings and gardens; catering services; and security services.Note 6: Mpumalanga data was sourced from the 2012 Snap Survey of AET Centres.
In 2012, there were 19 569 staff members in public AET Centres. Of these, 84% were educator staff and 74% comprised of females. Most educators were located in KwaZulu-Natal (4 871), followed by Eastern Cape (2 888) and Gauteng (2 408).
AET Centres: An Overview

37
5.3 PRIVATE AET CENTRES
5.3.1 Introduction
Private AET Centres are required by law to be registered with PEDs. As can be seen in Table 30, the private AET sector is relatively small in comparison with the public sector.
In 2012, there were 150 private AET Centres registered with the Department. However, only 60 private AET Centres responded to the survey sent to them by the department. Therefore, the data provided below needs to be read in this context.
5.3.2 OverviewofprivateAETCentres
Table30:Numberoflearners,educatorsandinstitutionsinprivateAETCentresbyprovince,in2012
Province Categories PrivateAETCentres
EasternCape
LearnersEducatorsInstitutions
1 172100
9
Free State
LearnersEducatorsInstitutions
20052
Gauteng
LearnersEducatorsInstitutions
3 053103
10
KwaZulu-Natal
LearnersEducatorsInstitutions
53750
8
Limpopo
LearnersEducatorsInstitutions
n.a.n.a.n.a.
*Mpumalanga
LearnersEducatorsInstitutions
26713
5
NorthernCape
LearnersEducatorsInstitutions
n.a.n.a.
n.a.
North West
LearnersEducatorsInstitutions
73623
6
WesternCape
LearnersEducatorsInstitutions
2 7258620
National
LearnersEducatorsInstitutions
8 690380
60
Source: 2012 Annual Survey of AET Centres. *2012 Snap Survey of AET Centres.Note 1: “n.a.” means “not applicable”.Note 2: Mpumalanga data was sourced from the 2012 Snap Survey of AET Centres.
Table 30 shows that there were 60 private AET Centres, with 8 690 learners and 380 educators in South Africa, in 2012. Limpopo and Northern Cape did not have any registered private AET Centres in 2012, while Western Cape had the highest number of private AET Centres.
AET Centres: An Overview

38
Table31:NumberoflearnersenrolledinprivateAETCentresbyprogrammeandbyprovince,in2012
Province AETLevel 1
AET Level 2
AET Level 3
AET Level 4 (NQF 1)
Grade 10 (NQF 2)
Grade 11 (NQF 3)
Grade 12 (NQF 4)
Other/SkillsDevelopment Total
EasternCape 133 199 153 687 0 0 0 0 1 172
Free State 8 5 16 171 0 0 0 0 200
Gauteng 309 313 329 443 53 8 1 378 220 3 053
KwaZulu-Natal 67 107 138 152 0 0 73 0 537
Limpopo n.a. n.a. n.a. n.a. n.a. n.a. n.a. n.a. n.a.
*Mpumalanga 16 23 42 86 0 0 67 33 267
NorthernCape n.a. n.a. n.a. n.a. n.a. n.a. n.a. n.a. n.a.
North West 80 81 92 184 0 0 206 93 736
WesternCape 535 535 586 647 0 0 325 97 2 725
National 1 148 1 263 1 356 2 370 53 8 2 049 443 8 690
Percentage 13.2% 14.5% 15.6% 27.3% 0.6% 0.1% 23.6% 5.1% 100.0%
Source: 2012 Annual Survey of AET Centres *2012 Snap Survey of AET Centres.Note 1: “n.a.” means “not applicable”.Note 2: Mpumalanga data was sourced from the 2012 Snap Survey of AET Centres.
Table 31 shows that, as in the case of public AET Centres, the majority of the 8 690 learners in private AET Centres were enrolled in AET Level 4 programmes (NQF Level 1) and in Grade 12 (NQF Level 4) programmes.
In 2012, the Eastern Cape and Free State provinces only offered ABET Levels 1 to 4 programmes and not Grades 10 to 12 programmes. Gauteng was the only province that offered the widest range of programmes at all levels.
AET Centres: An Overview

39
5.3.3 StaffinginprivateAETCentres
Table32:NumberofstaffinprivateAETCentresbyprovince,categoryandgender,in2012
ProvinceManagementstafftotal Educatorstafftotal Supportstafftotal Total
Female Male Total Female Male Total Female Male Total Female Male Total
EasternCape 9 0 9 86 14 100 0 1 1 95 15 110
Free State 1 1 2 3 2 5 0 0 0 4 3 7
Gauteng 7 10 17 35 68 103 12 9 21 54 87 141
KwaZulu-Natal 5 1 6 39 11 50 0 1 1 44 13 57
Limpopo n.a. n.a. n.a. n.a. n.a. n.a. n.a. n.a. n.a. n.a. n.a. n.a.
*Mpumalanga 2 2 4 7 6 13 0 0 0 9 8 17
NorthernCape n.a. n.a. n.a. n.a. n.a. n.a. n.a. n.a. n.a. n.a. n.a. n.a.
North West 1 1 2 16 7 23 0 0 0 17 8 25
WesternCape 11 15 26 53 33 86 4 3 7 68 51 119
National 36 30 66 239 141 380 16 14 30 291 185 476
Percentage 54.5% 45.5% 100.0% 62.9% 37.1% 100.0% 53.3% 46.7% 100.0% 61.1% 38.9% 100.0%
Source: 2012 Annual Survey of AET Centres. *2012 Snap Survey of AET Centres. Note 1: “n.a.” means “not applicable”.Note 2: The category “Management staff” includes the centre manager of a centre. Note 3: The category “Educator staff” includes any person who teaches, educates or trains a learner, or provides professional educational services, including professional therapy and educational psychology services, at a centre.Note 4: The category “Support staff” includes all other staff members who are not teaching. I.e. support staff includes persons who render: academic support services; student support services; human resource management; financial management; administration; maintenance of the buildings and gardens; catering services; and security services.Note 6: Mpumalanga data was sourced from the 2012 Snap Survey of AET Centres.
In 2012, there were 476 staff members in private AET Centres. Of these, 80% were educator staff and 61% comprised females. Most educators were located in Gauteng province (103), followed by Eastern Cape (100) and Western Cape (86).
AET Centres: An Overview
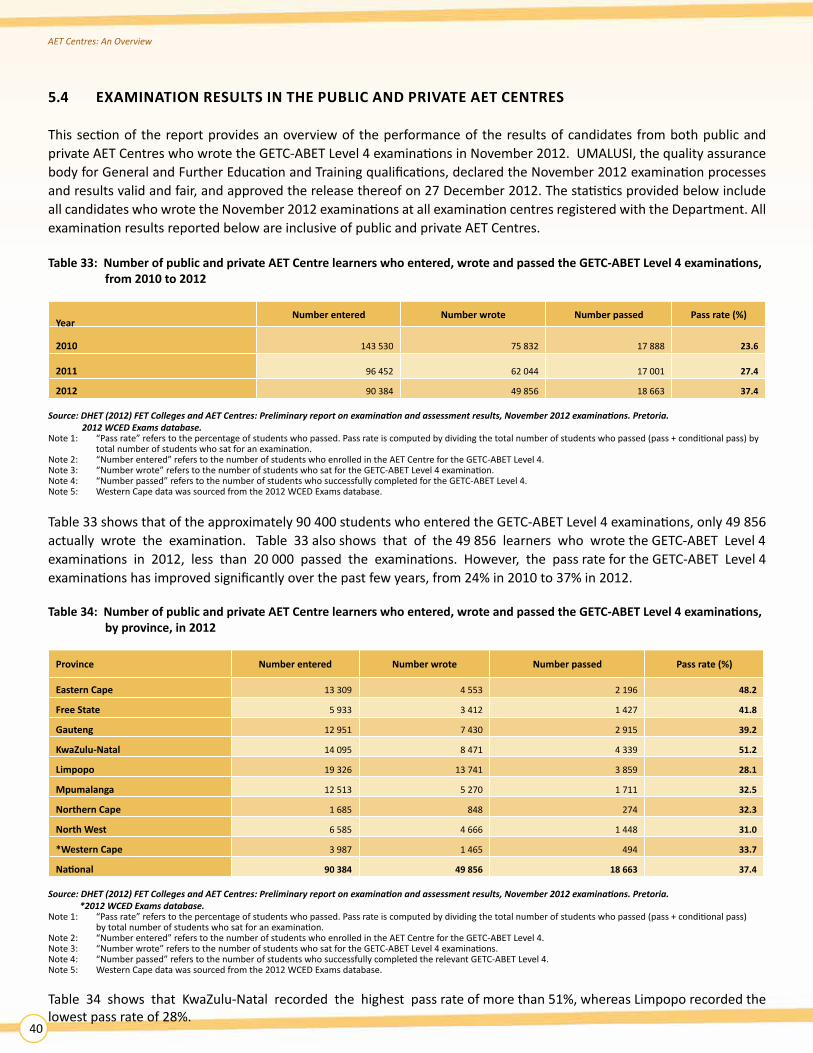
40
5.4 EXAMINATION RESULTS IN THE PUBLIC AND PRIVATE AET CENTRES
This section of the report provides an overview of the performance of the results of candidates from both public and private AET Centres who wrote the GETC-ABET Level 4 examinations in November 2012. UMALUSI, the quality assurance body for General and Further Education and Training qualifications, declared the November 2012 examination processes and results valid and fair, and approved the release thereof on 27 December 2012. The statistics provided below include all candidates who wrote the November 2012 examinations at all examination centres registered with the Department. All examination results reported below are inclusive of public and private AET Centres.
Table33:NumberofpublicandprivateAETCentrelearnerswhoentered,wroteandpassedtheGETC-ABETLevel4examinations, from 2010 to 2012
YearNumberentered Number wrote Number passed Pass rate (%)
2010 143 530 75 832 17 888 23.6
2011 96 452 62 044 17 001 27.4
2012 90 384 49 856 18 663 37.4
Source: DHET (2012) FET Colleges and AET Centres: Preliminary report on examination and assessment results, November 2012 examinations. Pretoria. 2012 WCED Exams database.Note 1: “Pass rate” refers to the percentage of students who passed. Pass rate is computed by dividing the total number of students who passed (pass + conditional pass) by total number of students who sat for an examination.Note 2: “Number entered” refers to the number of students who enrolled in the AET Centre for the GETC-ABET Level 4.Note 3: “Number wrote” refers to the number of students who sat for the GETC-ABET Level 4 examination.Note 4: “Number passed” refers to the number of students who successfully completed for the GETC-ABET Level 4.Note 5: Western Cape data was sourced from the 2012 WCED Exams database.
Table 33 shows that of the approximately 90 400 students who entered the GETC-ABET Level 4 examinations, only 49 856 actually wrote the examination. Table 33 also shows that of the 49 856 learners who wrote the GETC-ABET Level 4 examinations in 2012, less than 20 000 passed the examinations. However, the pass rate for the GETC-ABET Level 4 examinations has improved significantly over the past few years, from 24% in 2010 to 37% in 2012.
Table34:NumberofpublicandprivateAETCentrelearnerswhoentered,wroteandpassedtheGETC-ABETLevel4examinations, byprovince,in2012
Province Numberentered Number wrote Number passed Pass rate (%)
EasternCape 13 309 4 553 2 196 48.2
Free State 5 933 3 412 1 427 41.8
Gauteng 12 951 7 430 2 915 39.2
KwaZulu-Natal 14 095 8 471 4 339 51.2
Limpopo 19 326 13 741 3 859 28.1
Mpumalanga 12 513 5 270 1 711 32.5
NorthernCape 1 685 848 274 32.3
North West 6 585 4 666 1 448 31.0
*WesternCape 3 987 1 465 494 33.7
National 90 384 49 856 18 663 37.4
Source: DHET (2012) FET Colleges and AET Centres: Preliminary report on examination and assessment results, November 2012 examinations. Pretoria. *2012 WCED Exams database.Note 1: “Pass rate” refers to the percentage of students who passed. Pass rate is computed by dividing the total number of students who passed (pass + conditional pass) by total number of students who sat for an examination.Note 2: “Number entered” refers to the number of students who enrolled in the AET Centre for the GETC-ABET Level 4.Note 3: “Number wrote” refers to the number of students who sat for the GETC-ABET Level 4 examinations.Note 4: “Number passed” refers to the number of students who successfully completed the relevant GETC-ABET Level 4.Note 5: Western Cape data was sourced from the 2012 WCED Exams database.
Table 34 shows that KwaZulu-Natal recorded the highest pass rate of more than 51%, whereas Limpopo recorded the lowest pass rate of 28%.
AET Centres: An Overview

41
6. SECTOREDUCATIONANDTRAININGAUTHORITY(SETA)SUPPORTEDLEARNING PROGRAMMES
6.1 INTRODUCTION
SETAs were established in terms of the Skills Development Act (RSA, No. 97 of 1998), to develop and improve the skills of the South African workforce. Currently, there are twenty one SETAs in South Africa, each classified according to economic sectors.
The functions and responsibilities of SETAs are set out in Chapter 3, section 10 of the Skills Development Act, 1998, which states, inter alia, that SETAs are to:
• Disburse levies collected from employers in their sector;• Develop and administer Learnerships;• Undertake quality assurance of training programmes through, among others, the accreditation of education and
training providers and the registration of assessors; • Develop a sector skills plan. This is a plan to describe the trends in each sector, the skills that are in demand, and to
identify priorities for skills development; and• Implement sector skills plans.
The Department is responsible for management of the SETA performance to ensure that the above functions are undertaken effectively and efficiently. The Department is determined to realise the slogan of “every workplace a training space” by ensuring that significant numbers of young people are able to access workplace-based training through learnerships and internships.
This section of the report provides information on the number of workers and unemployed persons who are registered in SETA-supported learning programmes, namely learnerships, internships and skills programmes. It includes a special sub-section on artisans owing to the importance attached by government to develop greater numbers of artisans in the country.
Sector Education and Training Authority (SETA) Supported Learning Programmes

42
6.2 REGISTRATIONANDCERTIFICATIONINSETA-SUPPORTEDLEARNINGPROGRAMMES:TREND DATA
Table35:NumberofworkersandunemployedpersonsregisteredforandcertificatedinSETA-supportedlearningprogrammesbyprogrammetype,from2010/11to2012/13
YearRegistered Certificated
Learnerships InternshipsSkills
programmesTotalregistered Learnerships Internships Skillsprogrammes Totalcertificated
2010/11 47 649 2 675 66 133 116 457 30 864 1 064 75 531 107 459
2011/12 43 871 3 452 87 906 135 229 29 197 878 87 527 117 602
2012/13 50 885 6 127 74 587 131 599 37 158 2 195 86 491 125 844
Source: SETA Quarterly Reports, 2012/13.Note 1: The category “Learnerships” refers to a learning programme that leads to an occupational qualification or part qualification, and includes an apprenticeship and cadetship.Note 2: The category “Internships” refers to the structured work experience component of an occupational qualification registered by the Quality Council for Trades and Occupations (QCTO).Note 3: The category “Skills programmes” refers to a part qualification as defined in the NQF Act.
Table 35 shows that more than 131 000 persons registered in SETA learning programmes in 2012/13. More than half of all persons involved in SETA learning programmes had registered for skills programmes, while 50 885 learners had registered for learnerships in 2012/13. Although the number of persons registered for internships in 2012/13 was relatively smaller (6 127) in relation to other learning programmes, a significant increase in the number of internships is evident between 2010/11 and 2012/13. It is important for this positive trend to continue to ensure expanded opportunities for graduates and students to gain workplace exposure and experience, which would provide them with a better chance to enter the economy.
The number of persons who were certificated in SETA learning programmes increased from 107 459 in 2010/11 to almost 126 000 in 2012/13. The majority, by far, were certificated in skills programmes.
SETA Supported Learning Programmes
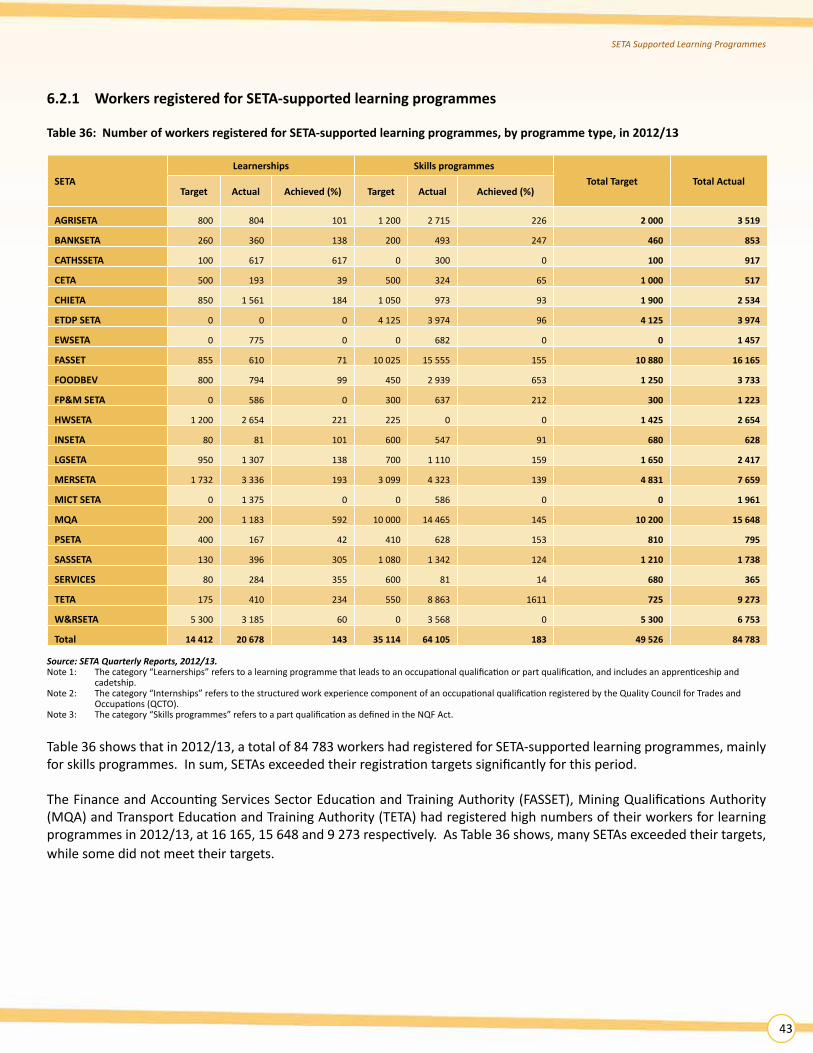
43
6.2.1 WorkersregisteredforSETA-supportedlearningprogrammes
Table36:NumberofworkersregisteredforSETA-supportedlearningprogrammes,byprogrammetype,in2012/13
SETALearnerships Skillsprogrammes
TotalTarget Total ActualTarget Actual Achieved (%) Target Actual Achieved (%)
AGRISETA 800 804 101 1 200 2 715 226 2 000 3 519
BANKSETA 260 360 138 200 493 247 460 853
CATHSSETA 100 617 617 0 300 0 100 917
CETA 500 193 39 500 324 65 1 000 517
CHIETA 850 1 561 184 1 050 973 93 1 900 2 534
ETDP SETA 0 0 0 4 125 3 974 96 4 125 3 974
EWSETA 0 775 0 0 682 0 0 1 457
FASSET 855 610 71 10 025 15 555 155 10 880 16 165
FOODBEV 800 794 99 450 2 939 653 1 250 3 733
FP&M SETA 0 586 0 300 637 212 300 1 223
HWSETA 1 200 2 654 221 225 0 0 1 425 2 654
INSETA 80 81 101 600 547 91 680 628
LGSETA 950 1 307 138 700 1 110 159 1 650 2 417
MERSETA 1 732 3 336 193 3 099 4 323 139 4 831 7 659
MICT SETA 0 1 375 0 0 586 0 0 1 961
MQA 200 1 183 592 10 000 14 465 145 10 200 15 648
PSETA 400 167 42 410 628 153 810 795
SASSETA 130 396 305 1 080 1 342 124 1 210 1 738
SERVICES 80 284 355 600 81 14 680 365
TETA 175 410 234 550 8 863 1611 725 9 273
W&RSETA 5 300 3 185 60 0 3 568 0 5 300 6 753
Total 14 412 20 678 143 35 114 64 105 183 49 526 84 783
Source: SETA Quarterly Reports, 2012/13.Note 1: The category “Learnerships” refers to a learning programme that leads to an occupational qualification or part qualification, and includes an apprenticeship and cadetship.Note 2: The category “Internships” refers to the structured work experience component of an occupational qualification registered by the Quality Council for Trades and Occupations (QCTO).Note 3: The category “Skills programmes” refers to a part qualification as defined in the NQF Act.
Table 36 shows that in 2012/13, a total of 84 783 workers had registered for SETA-supported learning programmes, mainly for skills programmes. In sum, SETAs exceeded their registration targets significantly for this period.
The Finance and Accounting Services Sector Education and Training Authority (FASSET), Mining Qualifications Authority (MQA) and Transport Education and Training Authority (TETA) had registered high numbers of their workers for learning programmes in 2012/13, at 16 165, 15 648 and 9 273 respectively. As Table 36 shows, many SETAs exceeded their targets, while some did not meet their targets.
SETA Supported Learning Programmes

44
6.2.2 WorkerscertificatedinSETA-supportedlearningprogrammes
Table37:NumberofworkerscertificatedinSETA-supportedlearningprogrammes,byprogrammetype,in2012/13
SETALearnerships Skillsprogrammes
TotalTarget Total ActualTarget Actual Achieved (%) Target Actual Achieved (%)
AGRISETA 400 866 217 600 3 676 613 1 000 4 542
BANKSETA 182 58 32 150 465 310 332 523
CATHSSETA 50 176 352 0 300 0 50 476
CETA 250 282 113 250 328 131 500 610
CHIETA 425 1 197 282 525 551 105 950 1 748
ETDP SETA 0 119 0 0 164 0 0 283
EWSETA 0 983 0 0 236 0 0 1 219
FASSET 450 111 25 10 025 15 555 155 10 475 15 666
FOODBEV 400 827 207 0 985 0 400 1 812
FP&M SETA 0 374 0 125 411 329 125 785
HWSETA 600 730 122 113 522 462 713 1 252
INSETA 0 325 0 420 1 676 399 420 2 001
LGSETA 200 2 007 1 004 400 6 165 1 541 600 8 172
MERSETA 940 2 109 224 1 448 2 177 150 2 388 4 286
MICT SETA 0 0 0 250 413 165 250 413
MQA 480 1 488 310 10 000 24 007 240 10 480 25 495
PSETA 120 311 259 300 689 230 420 1 000
SASSETA 65 500 769 540 3 335 618 605 3 835
SERVICES 0 123 0 420 0 0 420 123
TETA 131 37 28 412 4 884 1 185 543 4 921
W&RSETA 500 1 776 355 0 1 634 0 500 3 410
Total 5 193 14 399 277 25 978 68 173 262 31 171 82 572
Source: SETA Quarterly Reports, 2012/13.Note 1: The category “Learnerships” refers to a learning programme that leads to an occupational qualification or part qualification, and includes an apprenticeship and cadetship.Note 2: The category “Internships” refers to the structured work experience component of an occupational qualification registered by the Quality Council for Trades and Occupations (QCTO).Note 3: The category “Skills programmes” refers to a part qualification as defined in the NQF Act.
Table 37 above indicates that more than 82 000 workers were certificated in SETA-supported learning programmes in 2012/13, the majority (68 173) for skills programmes. The Manufacturing, Engineering and Related Services Sector Education and Training Authority (merSETA) and Local Government Sector Education and Training Authority (LGSETA) certificated the most number of workers for learnerships, while MQA and FASSET certificated the most number of workers for skills programmes. The Services SETA did not certify any workers for skills programmes.
In general, the set targets for certification were achieved for the 2012/13 period.
SETA Supported Learning Programmes

45
6.2.3 UnemployedpersonsregisteredforSETA-supportedlearningprogrammes
Table38:NumberofunemployedpersonsregisteredforSETA-supportedlearningprogrammes,byprogrammetype,in2012/13
SETALearnerships Internships Skillsprogrammes
Total Target
Total ActualTarget Actual Achieved (%) Target Actual Achieved (%) Target Actual Achieved (%)
AGRISETA 325 1 236 380 350 406 116 500 2 260 452 1 175 3 902
BANKSETA 700 1 225 175 50 74 148 200 355 178 950 1 654
CATHSSETA 165 1 023 620 40 172 430 200 220 110 405 1 415
CETA 500 926 185 1 500 99 7 500 143 29 2 500 1 168
CHIETA 950 1 882 198 75 121 161 280 279 100 1 305 2 282
ETDP SETA 950 1 077 113 300 572 191 0 405 0 1 250 2 054
EWSETA 550 575 105 0 30 0 0 0 0 550 605
FASSET 3 210 3 661 114 0 0 0 0 0 0 3 210 3 661
FOODBEV 600 598 100 700 401 57 0 0 0 1 300 999
FP&M SETA 1 200 1 235 103 40 43 108 400 326 82 1 640 1 604
HWSETA 1 200 1 223 102 0 0 0 225 41 18 1 425 1 264
INSETA 400 1 124 281 450 253 56 0 18 0 850 1 395
LGSETA 300 364 121 100 344 344 300 672 224 700 1 380
MERSETA 2 021 2 690 133 180 377 209 806 2 461 305 3 007 5 528
MICT SETA 2 100 2 830 135 500 970 194 0 0 0 2 600 3 800
MQA 600 566 94 500 606 121 2 000 2 089 104 3 100 3 261
PSETA 300 96 32 40 45 113 0 0 0 340 141
SASSETA 1 072 2 233 208 150 210 140 0 0 0 1 222 2 443
SERVICES 400 708 177 450 95 21 0 0 0 850 803
TETA 175 586 335 1 875 1 257 67 550 887 161 2 600 2 730
W&RSETA 3 365 4 349 129 3 667 52 1 0 326 0 7 032 4 727
Total 21 083 30 207 1.43 10 967 6 127 56 5 961 10 482 176 38 011 46 816
Source: SETA Quarterly Reports, 2012/13Note 1: The category “Learnerships” refers to a learning programme that leads to an occupational qualification or part qualification, and includes an apprenticeship and cadetship.Note 2: The category “Internships” refers to the structured work experience component of an occupational qualification registered by the Quality Council for Trades and Occupations (QCTO).Note 3: The category “Skills Programmes” refers to a part qualification as defined in the NQF Act.
As Table 38 shows, 46 816 unemployed persons were registered for SETA-supported learning programmes in 2012/13. Of these, the majority (30 207) were registered for learnership programmes , while 6 127 were registered for internship programmes, the latter performing significantly below the set target. The merSETA, Wholesale and Retail Sector Education and Training Authority (W&RSETA) and Agriculture Sector Education and Training Authority (AGRISETA) registered the highest number of unemployed persons for SETA-supported education and training programmes in 2012/13.
SETA Supported Learning Programmes

46
6.2.4 UNEMPLOYEDPERSONSCERTIFICATEDINSETA-SUPPORTEDLEARNINGPROGRAMMES
Table39:NumberofunemployedpersonscertificatedinSETA-supportedlearningprogrammes,byprogrammetype,in2012/13
SETALearnerships Internships Skillsprogrammes
TotalTarget Total ActualTarget Actual Achieved
(%) Target Actual Achieved (%) Target Actual Achieved (%)
AGRISETA 163 2 260 1 387 268 439 164 250 2 260 904 681 4 959
BANKSETA 602 859 142 0 0 0 150 465 310 752 1 324
CATHSSETA 83 228 275 20 96 480 100 3 499 3 499 203 3 823
CETA 500 260 52 0 0 0 500 292 58 1 000 552
CHIETA 475 1 219 257 38 47 124 140 229 164 653 1 495
ETDP SETA 0 478 0 0 306 0 0 61 0 0 845
EWSETA 225 781 347 0 0 0 0 0 0 225 781
FASSET 0 2 812 0 0 0 0 0 0 0 0 2 812
FOODBEV 300 598 199 250 136 54 0 0 0 550 734
FP&M SETA 600 711 119 0 0 0 225 134 60 825 845
HWSETA 600 939 157 0 0 0 225 120 53 825 1 059
INSETA 280 426 152 315 154 49 0 60 0 595 640
LGSETA 200 72 36 50 27 54 250 135 54 500 234
MERSETA 1 184 2 650 224 63 103 163 188 1 856 987 1 435 4 609
MICT SETA 1 300 2 313 178 0 0 0 220 0 0 1 520 2 313
MQA 480 701 146 0 0 0 6 000 8 280 138 6 480 8 981
PSETA 40 0 0 250 845 338 0 0 0 290 845
SASSETA 536 997 186 75 23 31 0 0 0 611 1 020
SERVICES 280 243 87 315 0 0 0 0 0 595 243
TETA 131 237 181 131 19 15 412 545 132 674 801
W&RSETA 500 3 975 795 1 834 0 0 0 382 0 2 334 4 357
Total 8 479 22 759 268 3 609 2 195 61 8 660 18 318 212 20 748 43 272
Source: SETA Quarterly Reports, 2012/13.Note 1: The category “Learnerships” refers to a learning programme that leads to an occupational qualification or part qualification, and includes an apprenticeship and cadetship.Note 2: The category “Internships” refers to the structured work experience component of an occupational qualification registered by the Quality Council for Trades and Occupations (QCTO).Note 3: The category “Skills programmes” refers to a part qualification as defined in the NQF Act.
Table 39 indicates that 43 272 unemployed persons were certificated in SETA-supported learning programmes 2012/13. Of these, the majority were certificated in learnerships (22 759) and skills programmes (18 318). The MQA, AGRISETA, merSETA, W&RSETA and CATHSETA certificated the most number of unemployed persons in 2012/13.
In general, SETAs exceeded their certification targets by more than 50% (43 272) in all the learning programmes over the 2012/13 financial period.
SETA Supported Learning Programmes

47
6.3. ARTISANS 6.3.1 Introduction
The Skills Development Act (RSA, 1998) defines an artisan as a person who has been certified as being competent to perform a listed trade. There are 125 trades listed in South Africa in terms of Government Notice 35625, issued on 31 August 2013. Each trade can be identified by a special code, referred to as the “Organising Framework for Occupations” (OFO) code. Below are some examples of listed trades.
OFO Code Occupation OFO Code Occupation
641201 Bricklayer 671202 Millwright
641301 Stonemason 671203 Mechatronics Technician
641303 Refractory Mason 671204 Lift Mechanic
641501 Carpenter and Joiner 651202 Welder
641502 Carpenter 651301 Sheet Metal Worker
671101 Electrician 651302 Boiler Maker
A person has to follow several steps to be certified as an artisan. These include the completion of a theory component, a practical training component, structured workplace training, and trade testing. There is a continuous need for suitably qualified artisans to sustain industries and support economic growth in South Africa. Artisan development has therefore been elevated as a priority area for skills development in the country. Government’s National Development Plan (NDP) indicates that by 2030 the country should be producing 30 000 qualified artisans per year. At present the country is producing on average 13 000 qualified artisans per year, and so the number has to more than double in the next two decades leading up to 2030.
Tables 40 and 41 below provide data on the numbers of learners entering artisanal programmes, as well as those completing artisanal programmes, for two consecutive financial years. They include information on data reported by SETAs and Institute for the National Development of Learnerships, Employment skills and Labour Assessments (INDLELA), as well as validated figures obtained through an auditing process.
SETA Supported Learning Programmes

48
6.3.2 Learnersenteringartisanallearningprogrammes
Table40:Numberoflearnersenteringartisanallearningprogrammes,from2011/12to2012/13
SETA2011 - 2012 2012 - 2013
NumberofLearners NumberofLearners
AGRISETA 96
70
CATHSSETA 563
662
CETA 1 849
579
CHIETA 2 541
1 989
EWSETA 1 046
1 316
FOODBEV 15 0
FP&MSETA 351
584
HWSETA - 0
INDLELA 5 227
5 795
LGSETA 413
528
MERSETA 6 254
4 951
MICT SETA - 0
MQA 2 525
2 365
PSETA 78
53
SASSETA -
516
SERVICES 2 104
984
TETA 1 019
711
W&R SETA 334
746
Total 24 415
21 849
Source: National Artisan Development Support Centre (NADSC) – NAP database management system.Note 1: Dash (-) means that data is not available.
Almost 22 000 learners entered artisanal learning programmes in 2012/13, compared with 24 415 in 2011/12. The decline in the number of learners entering artisanal programmes over the past two years, can be attributed to the significant drop in the number of artisanal learners supported by the Services SETA, the Transport Edu-cation and Training Authority SETA (TETA) and the Construction Education and Training Authority (CETA).
The merSETA and INDLELA supported almost half of all learners entering artisanal learning programmes during the 2012/13 financial year, while the MQA also supported a significant number of artisanal learners. Some SETAs do not support artisans, since they do not work with occupations that are listed as trades.
6.3.3 Learnerscompletingartisanallearningprogrammes
INDLELA is responsible for testing learners who have completed their structured work-based and theoretical training. INDLELA certifies successful learners as artisans in terms of applicable industry-based Bargaining Council Agreements.
Table 41 provides information on the number of persons who qualified as artisans since 2011. It shows that the number of newly-qualified artisans increased from about 14 000 in 2011/12 to more than 15 000 in 2012/13. Should the current trend continue, it is quite likely that the NDP goal to produce 30 000 artisans per year by 2030 will be achieved.
SETA Supported Learning Programmes

49
Table41:Numberoflearnerscompletingartisanallearningprogrammes,from2011/12to2012/13
SETA
2011 - 2012 2012 - 2013
NumberofLearners NumberofLearners
AGRISETA 77 149
CATHSSETA 282 1 007
CETA 699 520
CHIETA 989 1 279
ETDP SETA - -
EWSETA 571 37
FOODBEV 160 36
FP&M SETA - -
HWSETA - -
INDLELA 3 392 1 355
LGSETA 226 305
MERSETA 3 155 7 166
MICT SETA - -
MQA 2 566 2 035
PSETA 1 5
SASSETA - -
SERVICES 1 521 841
TETA 208 169
W&RSETA 176 373
Total 14 023 15 277
Source: National Artisan Development Support Center (NADSC) – NAP database management system.Note 1: Dash (-) means that data is not available.
SETA Supported Learning Programmes

50
7. FUNDINGINTHEPOST-SCHOOLEDUCATIONANDTRAININGSECTOR
7.1 INTRODUCTION
Included in the Department’s budget allocation as appropriated by Parliament, are amounts to be transferred to the 23 Public HE Sector for block grants, infrastructure and efficiency funds, development funds for teaching, research and foundation provision, interest and redemption of government loans, clinical training of health professionals, veterinary science, and the two new universities to be established in Mpumalanga and Northern Cape in 2014. The allocations to HEIs are informed by a funding formula.
In addition, for the 2010/11 to 2012/13 financial years, the amounts included in the Department’s budget allocation as appropriated by Parliament, are conditional grant amounts to be transferred to PEDs for the 50 FET Colleges for salaries and operational expenditure. The Division of Revenue Act and a framework regulated the expenditure on this conditional grant.
Funding for the public AET is provided through the provincial sphere of government to the various PEDs.
7.2 FUNDINGOFKEYPOST-SCHOOLEDUCATIONANDTRAININGPUBLICINSTITUTIONS
Table42:Transferstokeypost-schooleducationandtraininginstitutions,from2010/11to2012/13
FinancialyearPublic HEIs
R’000
PublicFETColleges
R’000
PublicAETCentres
R’000
Total
R’000
2010/11 17 516 740 3 803 958 1 222 855 22 543 553
2011/12 19 354 159 4 375 311 1 413 194 25 142 664
2012/13 20 902 779 4 844 607 1 464 756 27 212 142
Shareoftotalexpenditurein2012/13 77% 18% 5% 100%
Source: National Treasury website.Note 1: Amount for public HEIs reflects funds transferred by the DHET to HEIs. Note 2: Amount for FET Colleges reflects funds transferred by the DHET to provincial education departments for the FET College sector.Note 3: Amount for AET Centres reflects funds transferred from provincial education departments to AET Centres. The amount reflected for 2012/13 is the budgeted amount (and not the expenditure amount), since the final audited data for this sector have not yet been obtained at the date of publication.
Table 42 indicates the amount of funding allocated to public HEIs, public FET Colleges and to public AET Centres respectively. As demonstrated above, public HEIs receive a significantly higher proportion of the public funding compared to public FET Colleges and public AET Centres. In 2012/13, the proportional distribution of funds to public HEIs, public FET Colleges and public AET Centres stood at 77%, 18% and 5% respectively. Public HEIs received almost R21 billion in the 2012/13 financial year from the Department, while close to R5 billion was transferred by the Department to PEDs for FET Colleges in 2012/13. The PEDs budgeted over R1.4 billion for AET Centres in 2012/13.
Funding in the Post-School Education and Training Sector

51
7.3 NATIONALSTUDENTFINANCIALAIDSCHEME(NSFAS)
7.3.1 INTRODUCTION
The National Student Financial Aid Scheme (NSFAS) is a loan and bursary scheme funded by the Department for previously disadvantaged students who do not have the financial means to fund their studies. NSFAS is administered and accessible through the universities and FET Colleges.
In terms of the NSFAS Act, 1999 (Act No 56 of 1996), the functions of NSFAS are stated as follows:• To allocate funds for loans and bursaries to eligible students;• To develop criteria and conditions for the granting of loans and bursaries to eligible students in consultation with
the Minister;• To raise funds as contemplated in section 14(1) of the NSFAS Act;• To recover loans;• To maintain and analyse a database and undertake research for the better utilisation of financial resources;• To advise the Minister on matters relating to student financial aid; and• To perform other functions assigned to it by the NSFAS Act or by the Minister.
7.3.2 NSFASbeneficiariesandamountprovided
Table43:Numberofstudentswhohavereceivedloans/bursariesfromtheNationalStudentFinancialAidScheme(NSFAS)andtheamountprovided,bysub-sector,from2010to2012
YearPublic HEIs PublicFETColleges Total Percentage
changeonamountprovidedNumber of
students Amountprovided Number of students Amountprovided Number of
students Amountprovided
2010 151 441 3 343 530 674 61 971 317 998 191 213 412 3 661 528 865
2011 184 189 4 561 360 064 129 766 1 116 590 548 313 955 5 677 950 612 55.1%
2012 202 524 5 871 489 881 192 810 1 822 497 265 395 334 7 693 987 146 35.5%
Source: 2011/12 NSFAS Annual Report.Note 1: The term “loans” refers to a loan granted to a person by the NSFAS to enable the person to defray the costs connected with his or her education at a designated higher education institution, and those connected with the board and lodging of that person for purposes of attending the institution. Note 2: The term “bursaries” refers to that part of the loan granted to a person by the NSFAS, which the person is not required to pay back on compliance with the criteria and conditions set in the written agreement.
Close to 400 000 HE and FET College students received financial support from NSFAS in the form of loans or bursaries in 2012, a significantly higher number since the previous two years. The gap between the number of HE and FET College students who benefitted from NSFAS has been closing dramatically over the years, with the result that a significantly higher proportion of FET College students benefitted from NSFAS, compared to the proportion of HE students.
NSFAS granted over R7.6 billion rand in loans and bursaries in 2012, more than double the amount spent in 2010. A significant part of this increase occurred between 2010 and 2011.
Funding in the Post-School Education and Training Sector

52
7.3.3 FunzaLushakabursaryscheme
The Funza Lushaka Bursary Programme is a special multi-year programme established to incentivise HE students to study in the field of education. It provides financial support to students for the entire duration of the programme linked to a full teaching qualification. Students specialising in national priority areas, such as Mathematics, Science and the Foundation Phase, are most often beneficiaries of the Funza Lushaka bursary scheme.
Table44:NumberofHEIstudentswhoreceivedaFunzaLushakabursaryandtheamountprovided,from2010to2012
Year NumberofstudentsenrolledintheEducationfield
NumberofstudentswhoreceivedaFunzaLushaka
bursary
PercentageofstudentswhoreceivedFunzaLushakabursary
Amountprovided(inrands)
2010 145 413 10 074 6.9% 462 232 553
2011 164 939 8 716 5.3% 442 846 392
2012 168 608 11 704 6.9% 666 782 495
Source: 2011/12 NSFAS Annual Report.
Table 44 shows that almost 12 000 students benefitted from the Funza Lushaka bursary scheme in 2012, comprising about 7% of the total number of students registered in the field of education in 2012. The number of students benefitting from the Funza Lushaka bursary scheme over the 2010 to 2012 period has not been consistent, with a decrease in the number of beneficiaries between 2010 and 2011 and an increase between 2011 and 2012. These shifts are reflected in the amount of funds granted to Funza Lushaka beneficiaries between 2010 and 2012, with over R666 million being spent in 2012.
Funding in the Post-School Education and Training Sector

53
7.4 THE SKILLS LEVY
7.4.1 Introduction
The skills development levy is a form of tax collected from employers on an annual basis. It constitutes 1% of an employer’s monthly payroll costs. The skills development levy is regulated by Section 3 (4) of the Skills Development Levies Act (RSA, 1998).
7.4.2 Distributionoftheskillslevy
Table45:Distributionoftheskillslevyfund,from2010/11to2012/13
YearTotalamountdisbursedbytheskillslevyfund
(R ’000)
Distributionoflevyfunds
NSF (R`000)SETAs
AdministrationCosts (R`000)
MandatoryGrant(R`000)
DiscretionaryGrant(R`000)
AmountdisbursedtoSETAs (R`000)
2010/11 8 542 521 1 681 140 945 799 3 198 483 2 717 099 6 861 381
2011/12 8 690 375 2 012 837 964 323 3 564 932 2 148 283 6 677 538
2012/13 10 240 111 2 270 798 1 181 809 4 460 329 2 327 175 7 969 313
Source: DHET Annual Financial Statements for the years ending 2011, 2012 and 2013.Note 1: “NSF” refers to the funds disbursed by the National Skills Fund (see Table 47 for further information). Note 2: “Administration Costs” refer to administration costs incurred by SETAs, as approved by a SETA Accounting Authority.Note 2: “Mandatory Grant” refers to the grant paid to an employer by a SETA upon receipt of the employer’s Workplace Skills Plan, in terms of Section 4 of the Skills
Development Act, 1998 (Act No. 97 of 1998). Note 3: “Discretionary Grant” refers to the grant paid to an employer by a SETA in support of the SETA Sector Skills Plan, in terms of Section 6 of the Skills Development Act,
1998 (Act No. 97 of 1998).
Table 45 shows the distribution of the skills levy to SETAs and the National Skills Fund (NSF) between the 2010/11 and 2012/13 financial years.
Over R10 billion was available for skills development from the skills development levy fund in the 2012/13 financial year. Of this amount, close to R8 billion was allocated to SETAs, while more than R2 billion was allocated to the NSF. As can be seen from Table 45, the amount of funding available for skills development has grown substantially over the past three financial years – from about R8.5 billion in 2010/11 to more than R10.2 billion in 2012/13.
Funding in the Post-School Education and Training Sector

54
7.5 GRANTSPROVIDEDBYTHENATIONALSKILLSFUND(NSF)
7.5.1 Introduction
The National Skills Fund (NSF) was established by the Skills Development Act (RSA, No. 97 of 1998) in 1998. It is resourced from skills development levies that are submitted by employers to the government in terms of the Skills Development Levies Act (RSA, No. 9 of 1999). National skills funds are disbursed in line with the strategic framework and criteria for the allocation of funds as approved by the Minister of Higher Education and Training upon advice provided by the National Skills Authority (NSA) as per Section 5(1)(a)(iv) of the Skills Development Act (RSA, No. 97 of 1998).
The Skills Development Act (RSA, No. 97 of 1998) stipulates that NSF may fund the following:
• Skills development projects identified in the National Skills Development Strategy (NSDS) III as national priorities;• Skills development projects related to the achievement of the purposes of the Skills Development Act; and• Any activity undertaken by the Minister to achieve a national standard of good practice in skills development.
The tables below provide an overview of the number of projects supported by the NSF, as well as the distribution of funds across key projects.
7.5.2 NumberofprojectssupportedbytheNSFandnumberofbeneficiaries
Table 46 illustrates the distribution of the number of skills development projects supported by the NSF across individual provinces, in multi-provinces, as well as the number of national projects. It also indicates the number of estimated persons benefiting from skills development projects supported by the NSF.
The NSF supported 157 skills development projects across South Africa during the 2012/13 financial year. Many of these were located at provincial level, while some were national projects. Key national projects supported by the NSF include: the NAMB-NAD Support Centre for national artisan development; Recognition of Prior Learning (RPL) Project of INDLELA; Labour Market Intelligence Project; Green and White Paper processes on Post-School Education and Training and establishment of Ministerial Task Teams on skills-development-related interventions.
Funding in the Post-School Education and Training Sector
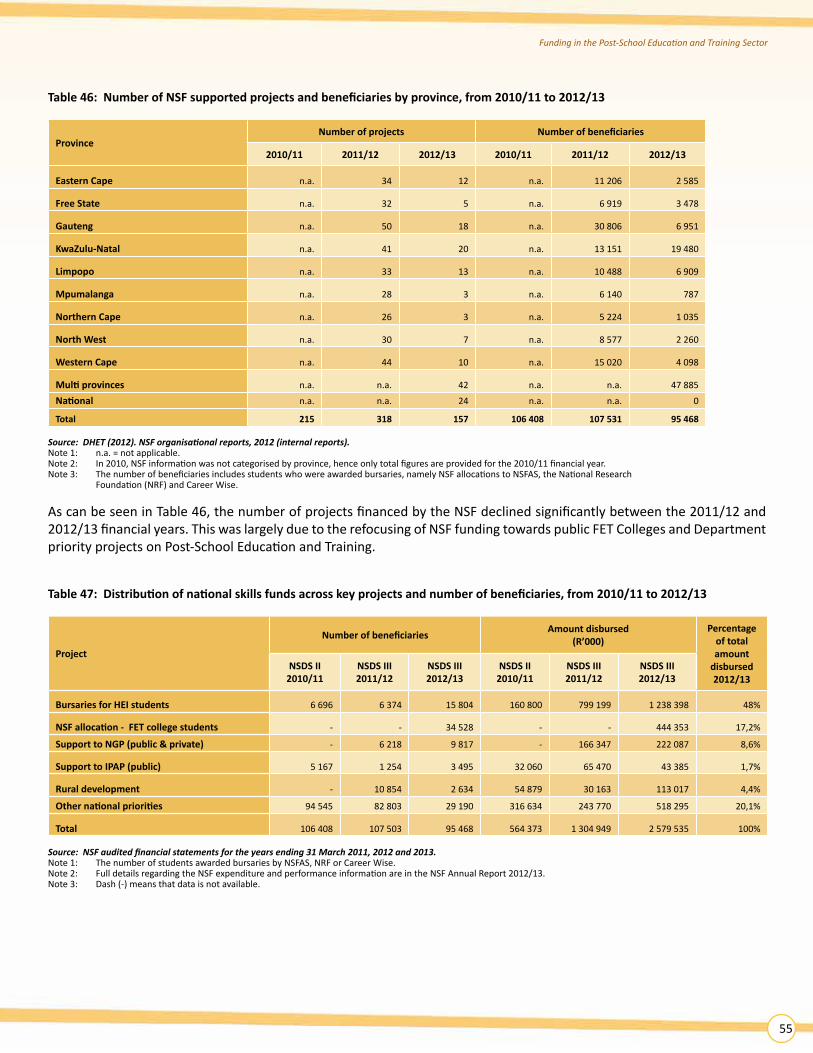
55
Table46:NumberofNSFsupportedprojectsandbeneficiariesbyprovince,from2010/11to2012/13
ProvinceNumberofprojects Numberofbeneficiaries
2010/11 2011/12 2012/13 2010/11 2011/12 2012/13
EasternCape n.a. 34 12 n.a. 11 206 2 585
Free State n.a. 32 5 n.a. 6 919 3 478
Gauteng n.a. 50 18 n.a. 30 806 6 951
KwaZulu-Natal n.a. 41 20 n.a. 13 151 19 480
Limpopo n.a. 33 13 n.a. 10 488 6 909
Mpumalanga n.a. 28 3 n.a. 6 140 787
NorthernCape n.a. 26 3 n.a. 5 224 1 035
North West n.a. 30 7 n.a. 8 577 2 260
WesternCape n.a. 44 10 n.a. 15 020 4 098
Multiprovinces n.a. n.a. 42 n.a. n.a. 47 885
National n.a. n.a. 24 n.a. n.a. 0
Total 215 318 157 106 408 107 531 95 468
Source: DHET (2012). NSF organisational reports, 2012 (internal reports).Note 1: n.a. = not applicable.Note 2: In 2010, NSF information was not categorised by province, hence only total figures are provided for the 2010/11 financial year.Note 3: The number of beneficiaries includes students who were awarded bursaries, namely NSF allocations to NSFAS, the National Research Foundation (NRF) and Career Wise.
As can be seen in Table 46, the number of projects financed by the NSF declined significantly between the 2011/12 and 2012/13 financial years. This was largely due to the refocusing of NSF funding towards public FET Colleges and Department priority projects on Post-School Education and Training.
Table47:Distributionofnationalskillsfundsacrosskeyprojectsandnumberofbeneficiaries,from2010/11to2012/13
Project
Numberofbeneficiaries Amountdisbursed(R’000)
Percentageof total amount
disbursed 2012/13
NSDS II 2010/11
NSDS III 2011/12
NSDS III 2012/13
NSDS II 2010/11
NSDS III 2011/12
NSDS III 2012/13
BursariesforHEIstudents 6 696 6 374 15 804 160 800 799 199 1 238 398 48%
NSFallocation-FETcollegestudents - - 34 528 - - 444 353 17,2%
Support to NGP (public & private) - 6 218 9 817 - 166 347 222 087 8,6%
Support to IPAP (public) 5 167 1 254 3 495 32 060 65 470 43 385 1,7%
Ruraldevelopment - 10 854 2 634 54 879 30 163 113 017 4,4%
Othernationalpriorities 94 545 82 803 29 190 316 634 243 770 518 295 20,1%
Total 106 408 107 503 95 468 564 373 1 304 949 2 579 535 100%
Source: NSF audited financial statements for the years ending 31 March 2011, 2012 and 2013.Note 1: The number of students awarded bursaries by NSFAS, NRF or Career Wise.Note 2: Full details regarding the NSF expenditure and performance information are in the NSF Annual Report 2012/13.Note 3: Dash (-) means that data is not available.
Funding in the Post-School Education and Training Sector

56
The amount of funds disbursed by the NSF for skills development has increased significantly since 2010, from just more than R0.5 billion in 2010/11 to more than R2.5 billion in 2012/13. This dramatic increase can be attributed to changes in legislation, which places greater emphasis on an integrated post-school education and training system as envisioned in the Green Paper on Post-School Education and Training. Closer links between employers, education and training institutions, the NSF and SETA’s has strengthened the provisioning of education and training and has made the system more responsive to sector, local, regional and national skills needs and priorities, as promoted by the NSDS III. Consequently, as Table 47 shows, in 2012/13, more than 65% of NSF project funds were directed at supporting HEI and FET College students with bursaries.
Table 47 shows that of the 95 468 persons who benefited directly from NSF support in 2012/13, 34 528 were public FET College students and 15 804 were HEI students who received under-graduate and post-graduate bursaries in scarce skills fields of study through the NSFAS, Career Wise and the National Research Foundation (NRF). Other beneficiaries were supported from the NSF through skills development programmes, established to support the National Growth Path (NGP), the Industrial Policy Action Plan (IPAP), rural development and other national priorities.
7.5.3 NSFinfrastructuregrants
In addition to supporting HEI and FET College students with bursaries, the NSF has prioritised allocations to expand and improve the infrastructure of HEIs, FET Colleges and Community Education Centres, as well as support the improvement of infrastructure at state-owned enterprises. To this end, the NSF disbursed R54 million towards skills infrastructure development as a national priority of government during the 2012/13 financial year.
Table48:DistributionofNSFinfrastructurebudget,in2012/13
HEIsR’000
OtherR’000 Total
Amountdisbursed 21 113 32 838 53 951
Source: NSF audited financial statements for the year ending 31 March 2013 (page 93 of the NSF Annual Report 2012/13).Note 1: “Other” includes institutions other than government.
In 2012/13, over R21 million was disbursed to the University of Pretoria to expand its medical and veterinary facilities, while almost R33 million was used to build hostels and lecture rooms for deaf students and accommodation for hostel managers at the National Institute for the Deaf (NID), which is the only community-based tertiary education institute for deaf people in South Africa.
Funding in the Post-School Education and Training Sector

57
8. EXPLANATORY NOTES
8.1 INTRODUCTION
These explanatory notes provide information about data sources and some methodological issues pertaining to the surveys conducted by the Department to obtain data for this publication.
8.2 SCOPE
Information for this publication has been provided by the following education and training institutions and entities:
• Public and private Higher Education Institutions (HEIs);• Public and private Further Education and Training (FET) Colleges; • Public and private Adult Education and Training (AET) Centres;• Sector Education and Training Authorities (SETAs); • The National Student Financial Aid (NSFAS);• The National Artisan Moderation Body (NAMB); and • The National Skills Fund (NSF).
8.3 METHODOLOGY
Data pertaining to AET Centres and FET Colleges are provided to the Department in an aggregated format (that is, unit record data are not available), while HEIs submit unit record data directly to the Department as per the format prescribed by the Department to HEIs. SETAs, NAMB and the NSF provide aggregated data to the Department. The Department develops and implements policy, standards, definitions and classifications for the aggregation, standardisation and uniformity in the collection of education information from provinces.
In the case of public FET colleges, two sources of data were used. Student enrolment figures have been derived from the Department’s Weekly Enrolment monitoring tools, while staffing figures have been obtained from the Department’s Annual Survey of public FET Colleges. The Annual Survey gets collected once a year and the Weekly Enrolment gets collected over 20 weeks in a year spread over the year from January to October.
In the case of public and private AET Centres, two sources of data were used. Student enrolment and staff figures for all but one province (Mpumalanga) were derived from the Annual Survey of AET Centres. Data for Mpumalanga province was derived from the Snap Survey of AET Centres.
8.4 RESPONSE RATE
The response rates to questionnaires sent by the Department and PEDs to education and training institutions with re-spect to 2012 data are as follows:
• Public HEIs: 100%.• Public FET Colleges: 100%.• Private FET Colleges: 41%.• Public AET Centres: approximately 78% .• Private AET Centres: approximately 41% (Limpopo and Northern Cape did not register private AET Centres).
Explanatory Notes
58
9. GLOSSARY
AdministrativestaffAll technical and office staff, as well as all executive and professional staff who spend less than 50% of their official time on administrative functions. Adapted from the Department of Education (1982, 1995) Manual: South African Post-Secondary Education (SAPSE). Pretoria.
AdultEducationandTraining(AET) All learning and training programmes for adults on Level 1, registered on the national qualifications framework contemplated in the National Qualifications Framework Act, 2008 (Act No. 67 of 2008). South Africa (2010) Higher Education and Training Laws Amendment Act, No 52 of 2010. Pretoria.
AdultEducationandTraining(AET)CentreAn institution that offers adult education and training programmes in terms of the Adult Basic Education and Training Act (as amended).
Artisan A person who has been certified as competent to perform a listed trade in accordance with the Skills Development Act. South Africa (1998) Skills Development Act, No. 97 of 1998. Pretoria.
BursaryThat part of the loan granted to a person by the NSFAS, that the person is not required to pay back on compliance with the criteria and conditions set in the written agreement. South Africa (1999) National Student Financial Aid Scheme Act, No. 56 of 1999. Pretoria.
CertificationFormal Recognition of a qualification or part qualification awarded to a successful learner. SAQA (2013) Standard Glossary of Terms: Terms related to the South African National Qualifications Framework. Pretoria. A public or private further education and training institution that is established, declared or registered under this Act, but does not include:(a) a school offering further education and training programmes under the South African Schools Act; or (b) a under the authority of a government department other than the Department of Education. South Africa (2006) Further Education and Training Act, No. 16 of 2006. Pretoria.
ComprehensiveUniversityA type of public higher education institution established through the merger of a former technikon with a traditional university.
ContactstudentA student in a higher education institution who is registered mainly for courses offered in contact mode. A contact mode course involves personal interaction with lecturers or supervisors, through lectures, tutorials, seminars, practicals, supervision or other forms of required work, which is presented on the institution’s premises or at a site of the institution.
Distancestudent A student in a higher education institution who is registered mainly for courses offered in distance mode. A distance mode course involves interaction with lecturers, or institution supervisors, through distance education techniques. For example, through the use of correspondence, telematics or the Internet.
Glossary

59
EducatorAny person who teaches, educates, trains, or provides professional education services, including professional therapy and education psychology services at a centre. South Africa (2000). Adult Basic Education and Training Act, No. 52 of 2000. Pretoria.
FurtherEducationandTrainingInstitutionAny institution that provides further education and training on a full-time, part-time or distance basis, which is:(a) established or regarded as having been established as a public further education and training institution under this Act;(b) declared as a public further education and training institution under this Act; or(c) registered or provisionally registered as a private further education and training institution under the this Act. South Africa (1998) Further Education and Training Act, No. 98 of 1998. Pretoria.
Full-TimeEquivalent(FTE)studentA student in the post-school sector who is enrolled for an academic programme for a full academic year and who is registered for all the courses included in the curriculum of that programme. If a student is following, for example, only half of the courses required for a full-year academic programme, then he/she would be counted as 0.5 FTE students. If a student is taking 20% more than the courses required in a standard full-year curriculum, then he/she would be counted as 1.2 FTE students.
GeneralEducationandTraining(GET)All learning and training programmes leading to a qualification on Level 1 of the National Qualifications Framework, which level is below further education and training. South Africa (2001) General and Further Education and Training Quality Assurance Act, No. 58 of 2001. Pretoria.
GETC-ABETLevel4qualificationA qualification at Level 1 on the National Qualifications Framework (NQF). The GETC is offered to adults as prescribed in the Adult Basic Education and Training Act, 2000 (Act No 52 of 2000), who have not had any formal schooling, or who may not have completed formal basic schooling to the equivalent of NQF Level 1.
GraduateA student who has satisfied all the requirements of the degree, diploma or certificate for which he/she was registered. South African Post-Secondary Education (SAPSE)-020: Student Statistics Manual. Pretoria.
GraduationrateA calculation based on the number of students who have graduated in a particular year, irrespective of the year of study, divided by the total number of students enrolled at the universities, in that particular year. The total number of graduates in 2012 (165 986 students) divided by the total number of enrolments in 2012 (953 373 students), translates to a 17.4% graduation rate.
Headcountstudent Total unduplicated number of students enrolled in a post-Secondary education institution at a given census date, regardless of their course load. Department of Education (1995) South African Post-Secondary Education (SAPSE)-005: Student Statistics Manual. Pretoria.
HigherEducationInstitution(HEI)Any institution that provides higher education on a full-time, part-time or distance basis and that is: (a) Established, or deemed to be established, as a public higher education institution under the Higher Education Act; (b) Declared a public higher education institution under the Higher Education Act; or (c) Registered or conditionally registered as a private higher education institution under the Higher Education Act. South Africa (1997) Higher Education Act, No.101 of 1997. Pretoria.
Glossary

60
InstructionandResearchstaffAcademic staff who spend more than 50% of their official time on instruction and research activities. Adapted from the Department of Education (1982, 1995) Manual: South African Post-Secondary Education (SAPSE). Pretoria.
InternshipThe structured work experience component of an occupational qualification registered on the National Qualifications Framework. South Africa (1998) Skills Development Act, No. 97 of 1998. Pretoria.
LearnerAny person receiving education and training in terms of this Act. South Africa (2000) Adult Basic Education and Training Act, No. 52 of 2000. Pretoria.
LearnershipA learning programme that leads to an occupational qualification or part qualification, and includes an apprenticeship and cadetship. South Africa (1998) Skills Development Act, No. 97 of 1998. Pretoria.
Lecturer (FET)Any person who teaches, educates or trains other persons or who provides professional educational services at any college, and who is appointed in a post on any lecturer establishment under this Act. South Africa (2006) Further Education and Training Act, No. 16 of 2006. Pretoria.
MajorfieldofstudyThe subject area(s) in which a student may specialise in the final year of study for a degree/diploma/certificate instructional programme. Department of Education (1995) South African Post-Secondary Education (SAPSE)-004: Formal Degree/Diploma/Certificate Programme Classification Structure Manual. Pretoria.
Managementstaff1) In the case of FET Colleges, management staff refers to the principal and vice-principal of a public college. Department of Higher Education and Training (2013). Annual Survey for Public Further Education and Training (FET) Colleges.2) In the case of AET Centres, the category “management staff” refers to the centre manager of an AET centre. Department of Higher Education and Training (2012). Annual Survey for Adult Education and Training (AET) Centres.
MasterlistofinstitutionsA list of institutions containing all the contact information of the institution, such as addresses, telephone numbers, GIS coordinates, etc. Adapted from the Department of Higher Education and Training (2012) Higher Education Information Standards DHET 003: Standard for the publication of the master list of education institutions in the post-school sector Pretoria.
NationalCertificate(Vocational)(NC(V))National qualifications a t NQF Levels 2, 3 and 4, comprising 130 credits and seven subjects per level, and consists of academic knowledge and theory, integrated with the practical skills and values specific to each vocational area/specialisa-tion. The qualification comprises both internal and external components of assessment and is quality assured by Umalusi.
OccasionalstudentA student who is taking courses that are part of formally approved programmes, but who is not registered for a formal degree or diploma. Adapted from the Department of Education (1982, 1995) Manual: South African Post-Secondary Education (SAPSE). Pretoria.
Glossary

61
OccupationalQualificationA qualification associated with a trade, occupation or profession resulting from work-based learning and consisting of knowledge unit standards, practical unit standards, and work experience unit standards. South Africa (2008) Skills Development Amendment Act, No. 37 of 2008. Pretoria.
Pass rateRepresents the percentage of students who passed. It is calculated by dividing the total number of students who passed (pass + conditional pass) by total number of students who sat for an examination. National Examinations Database, November 2013. Pretoria.
PermanentstaffA permanent staff member is defined as an employee who contributes to an institutional pension or retirement fund. Adapted from the Department of Education (1982, 1995) Manual: South African Post-Secondary Education (SAPSE). Pretoria.
PopulationgroupA group with common characteristics (in terms of descent and history), particularly in relation to how they were (or would have been) classified before the 1994 elections. The following categories are provided in the census: African, Coloured, Indian or Asian, White, other. Statistics South Africa (2010) Adapted from Census 2010: Concepts and Definitions. Pretoria.
Postgraduate,belowMaster’slevelIncludes postgraduate and post-diploma diplomas, postgraduate Bachelor’s degrees, and Honours degrees. Adapted from the Department of Education (1982, 1995) Manual: South African Post-Secondary Education (SAPSE). Pretoria.
Post-MatricRefers to programmes offered to learners who have completed Matric ( Grade 12). Adapted from the Department of Education (1982, 1995) Manual: South African Post-Secondary Education (SAPSE). Pretoria.
Post-schoolThe term post-school is used to refer to all education and training for persons who have left school, as well as for those adults who have never been to school but require education opportunities. Department of Higher Education and Training (2012) Green Paper for post-school education and training. Pretoria.
PrivateFurtherEducationandTraininginstitutionAny institution registered or conditionally registered as a private further education and training institution in terms of Chapter 5 of the Further Education and Training Act. South Africa (1998) Further Education and Training Act, No. 98 of 1998. Pretoria.
PublicFurtherEducationandTrainingInstitutionAny further education and training institution that is established, deemed to be established, or declared as a public further education and training institution under the Further Education and Training Act. South Africa (1998) Further Education and Training Act, No. 98 of 1998. Pretoria.
PrivateHigherEducationInstitutionAny institution registered or conditionally registered as a private higher education institution in terms of Chapter 7 of the Higher Education Act. South Africa (1997) Higher Education Act, No.101 of 1997. Pretoria.
Glossary

62
PublicHigherEducationInstitutionAny higher education institution that is established or deemed to be established or declared as a public higher education institution under the Higher Education Act. South Africa (1997) Higher Education Act, No.101 of 1997. Pretoria.
QualificationA registered national qualification. South Africa (2008) National Qualifications Framework Act, No. 65 of 2008. Pretoria.
Report 191 A catalogue of nationally assessed and certificated occupationally-directed programmes aimed at learners intending to pursue a technical/ vocational learning pathway outside of the schooling system, and are offered from N1 to N6, with the latter culminating in the National N Diploma upon completion of the compulsory work place experience component. South Africa (2001) National Education Policy: Formal technical instructional programmes in the RSA, Report 191 (2001/08). Pretoria.
Report 550Is a policy resume of instructional programmes offered in schools, containing the programme requirements, which includes the promotion requirements, the special conditions and the rules of combination for the issuing of the Senior Certificate.
SouthAfricanQualificationsAuthority(SAQA)The statutory authority established in terms of the SAQA Act 58 of 1995 and continuing in terms of the NQF Act 67 of 2008, which oversees the further development and implementation of the NQF, the achievement of the objectives of the NQF, and the coordination of the three sub-frameworks. SAQA (2013) Standard Glossary of Terms: Terms related to the South African National Qualifications Framework. Pretoria.
Servicestaff(HEIs)All staff, such as cleaners, gardeners, security guards and messengers, who are not engaged in supervisory oradministrative functions linked to an office. Adapted from the Department of Education (1982, 1995) Manual: South African Post-Secondary Education (SAPSE). Pretoria.
SectorEducationandTrainingAuthority(SETA)A Sector Education and Training Authority established in terms of section 9 (1), of the Skills Development Act. South Africa (1998) Skills Development Act, No. 97 of 1998. Pretoria.
Skillsprogramme A skills programme that:(a) Is occupationally based;(b) When completed, will constitute a credit towards a qualification registered in terms of the National Qualifications Framework as defined in section 1 of the South African Qualifications Authority Act, No. 58 of 1995; (c) Uses training providers referred to in section 17(1)(c); or(d) Complies with the prescribed requirements. South Africa (1998) Skills Development Act, No. 97 of 1998. Pretoria.
Student1) Any person registered as a student at a higher education institution. South Africa (1997) Higher Education Act, No.101 of 1997. Pretoria.2) Any person registered as a student at a further education and training institution. South Africa (1998) Further Education and Training Act, No. 98 of 1998. Pretoria.
Glossary

63
SupportstaffIncludes all other staff who are not teaching, including: staff who render academic support services; student/learner support services; human resource management; financial management; administration; maintenance of the buildings and gardens; catering services; and security services. South Africa (2000) Adult Basic Education and Training Act, No. 52 of 2000. Pretoria as well as South Africa (2006) Further Education and Training Colleges Act, No. 16 of 2006. Pretoria.
UnemployedpersonsPersons who:a) Were not employed in the reference week of the census survey; andb) Were actively looking for work or trying to start a business in the four weeks preceding the survey interview; andc) Were available for work, i.e. would have been able to start work or a business in the reference week; ord) Had not actively looked for work in the past four weeks but had a job or business to start at a definite date in the future and were available. Statistics South Africa (2013) Quarterly Labour Force Survey. Pretoria.
UndergraduatestudentA student enrolled in an undergraduate programme as specified in the Higher Education Qualifications Sub-Framework.
UndergraduateDiplomaorCertificateA diploma or certificate that does not have a bachelor’s degree as prerequisite for admission to the programme. Department of Education (1995) South African Post-Secondary Education (SAPSE)-004: Formal Degree/Diploma/Certificate Programme Classification Structure Manual. Pretoria.
UndergraduateDegreeA qualification that also includes professional bachelor’s degrees, which are those that have an approved formal time of three or more years. Examples include degrees such as B Tech, BSc (Engineering), MB ChB, BFA. Adapted from the Department of Education (1982, 1995) Manual: South African Post-Secondary Education (SAPSE). Pretoria.
Workplace-basedlearningThe component of learning in an occupational qualification, internship, or work placement for professional designation whereby a learner is mentored by a qualified, and where required, registered mentor in the application and integration of the knowledge and practical skills learnt under supervision, in the context of a workplace in accordance with the prescripts set by the relevant qualification authority and professional body. Department of Higher Education and Training (2012) The Sector Education and Training Authorities (SETAs) grant regulations regarding monies received by a SETA and related matters. Pretoria.
Glossary

64
10. CONTACT DETAILS
Requests for further information can be communicated to the following persons:
Director:HigherEducationManagementInformation DeputyDirector:HigherEducationManagementInformationSystem SystemMsJeanSkene MrJacquesAppelgrynDepartment of Higher Education and Training Department of Higher Education and Training123 Francis Baard Street, Pretoria 123 Francis Baard Street, PretoriaPostal Address: Private Bag X174, Pretoria, 0001 Postal Address: Private Bag X174, Pretoria, 0001Tel.: 012 312 5099 Tel.: 012 312 5480Fax: 012 321 1788 Fax: 086 298 9673 Email: [email protected] Email: [email protected]
ActingDirector:PrivateHigherEducationInstitutionsDr Shaheeda EssackDepartment of Higher Education and Training123 Francis Baard Street, PretoriaPostal Address: Private Bag X174, Pretoria 0001Tel.: 012 312 5444Fax: 012 324 6343Email: [email protected]
ChiefDirector:PublicFurtherEducationandTrainingColleges DataManager:FETCollegesandAETCentresMsThembisaFutshane Ms Hilda HerbstDepartment of Higher Education and Training Department of Higher Education and Training123 Francis Baard Street, Pretoria 123 Francis Baard Street, PretoriaPostal Address: Private Bag X174, Pretoria, 0001 Postal Address: Private Bag X174, Pretoria, 0001Tel.: 012 312 5580/81 Tel.: 012 312 5414Fax: 012 323 3788 Fax: 086 298 9738Email: [email protected] Email: [email protected]
Director:PrivateFurtherEducationandTrainingCollegesDrMandlaButheleziDepartment of Higher Education and Training123 Francis Baard Street, PretoriaPostal Address: Private Bag X174, Pretoria, 0001Tel.: 012 312 5672Fax: 012 323 9838Email: [email protected]
Director:AdultEducationandTrainingCentresMr David DialeDepartment of Higher Education and Training123 Francis Baard Street, PretoriaPostal Address: Private Bag X174, Pretoria, 0001Tel.: 012 312 5515Fax: 086 714 0276Email: [email protected]
Contact Details

65
Director:SectorEducationandTrainingAuthorities AssistantDirector:SETAsMs Melissa Erra MrLennoxMalakaDepartment of Higher Education and Training Department of Higher Education and Training123 Francis Baard Street, Pretoria 123 Francis Baard Street, PretoriaPostal Address: Private Bag X174, Pretoria, 0001 Postal Address: Private Bag X174, Pretoria, 0001Tel.: 012 312 5430 Tel.: 012 312 5107Fax: 086 698 9734 Fax: 086 298 9822Email: [email protected] Email: [email protected]
Director:ArtisanDevelopment DataManager:ArtisanDevelopmentDrFlorusPrinsloo MrJabulaniNtshingilaDepartment of Higher Education and Training Department of Higher Education and Training123 Francis Baard Street, Pretoria INDLELA, OlifanstsfonteinPostal Address: Private Bag X174, Pretoria, 0001 Postal Address: Private Bag X174, Pretoria, 0001Tel.: 011 206 1025 Tel.: 011 206 1137Fax: 011 316 3284 Fax: 011 316 3284Email: [email protected] Email: [email protected]
ChiefDirector:NationalExaminationsandAssessment(FETCollegesandAETCentres) DataManager:ExaminationsMsNadinePote MrPierreDeVilliersDepartment of Higher Education and Training Department of Higher Education and Training222 Struben Street, Pretoria 222 Struben Street, PretoriaPostal Address: Private Bag X174, Pretoria, 0001 Postal Address: Private Bag X174, Pretoria, 0001Tel.: 012 357 3893/5 Tel.: 012 357 3966Fax: 086 714 0115 Fax: 086 714 0182Email: [email protected] Email: [email protected]
Director:NationalSkillsFund(NSF) Director:FinancialManagementMrFransStrydom MsAmeliaPoolmanDepartment of Higher Education and Training Department of Higher Education and Training123 Francis Baard Street, Pretoria 123 Francis Baard Street, PretoriaPostal Address: Private Bag X174, Pretoria, 0001 Postal Address: Private Bag X174, Pretoria, 0001Tel.: 012 312 6211 Tel.: 012 312 5241Fax: 012 323 1601 Fax: 012 323 1413Email: [email protected] Email: [email protected]
ChiefExecutiveOfficer:NationalStudentFinancialAidScheme(NSFAS)Mr Msulwa DacaNational Student Financial Aid SchemePostal Address: Private Bag X6, Plumstead, 7801Tel.: 021 763 3200Fax: 086 606 3551Email: [email protected]
GeneralEnquiries
HigherEducationandTrainingInformationSystem(HETMIS)OfficerMsKirstinBarthDepartment of Higher Education and TrainingPostal Address: Private Bag X174, Pretoria, 0001Tel.: 012 312 5212/5039Fax: 012 326 2069Email: [email protected]
Contact Details

66
Notes

67

DID YOU KNOW?The following post-school education and training institutions excisted in South Africain 2012:
23 Public Higher Education Institutions (HEIs)119 Private Higher Education Institutions (HEIs) 50 Public Further Education and Training (FET) Colleges536 Private Further Education and Training (FET) Colleges3 150 Public Adult Education and Training (AET) Centres150 Private Adult Education and Training (AET) Centres
Student enrolment in the post-school education and training sector in 2012 was asfollows:
Public Higher Education and Training Institutions (HEIs): 953 373Private Higher Education and Training Institutions (HEIs): 97 487Public Further Education and Training (FET) Colleges: 657 690Private Further Education and Training (FET) Colleges: 115 586*Public Adult Education and Training (AET) Centres: 306 378**Private Adult Education and Training (AET) Centres: 8 690***Sector Education and Training Authority (SETA) programmes: 131 599
*This figure represents enrolment at only 220 of the 536 private FET Colleges that responded to the departmental survey
**This figure represents enrolment at only 2 457 of the 3 150 public AET Centres that responded to the departmental survey ***This figure represents enrolment at only 60 of the 150 private AET Centres that responded to the departmental survey