statistics for genomics
TRANSCRIPT

Statistics for genomicsMayo Clinic and Illinois Alliance Computational Genomics Course
Dave Zhao, [email protected] of StatisticsUniversity of Illinois Urbana-Champaign

What is statistics for

“Imagine a flashy spaceship lands in your backyard.
The door opens and you are invited to investigate
everything to see what you can learn. The
technology is clearly millions of years beyond what
we can make.
This is biology. That’s why it fascinates me so much.
Life is billions of years old technology, and we can
explore it to see how it works!”
We want to understand biology
https://berthub.eu/articles/posts/immune-system/
Our questions (usually) are:
1. Explanatory
2. Qualitative
3. General
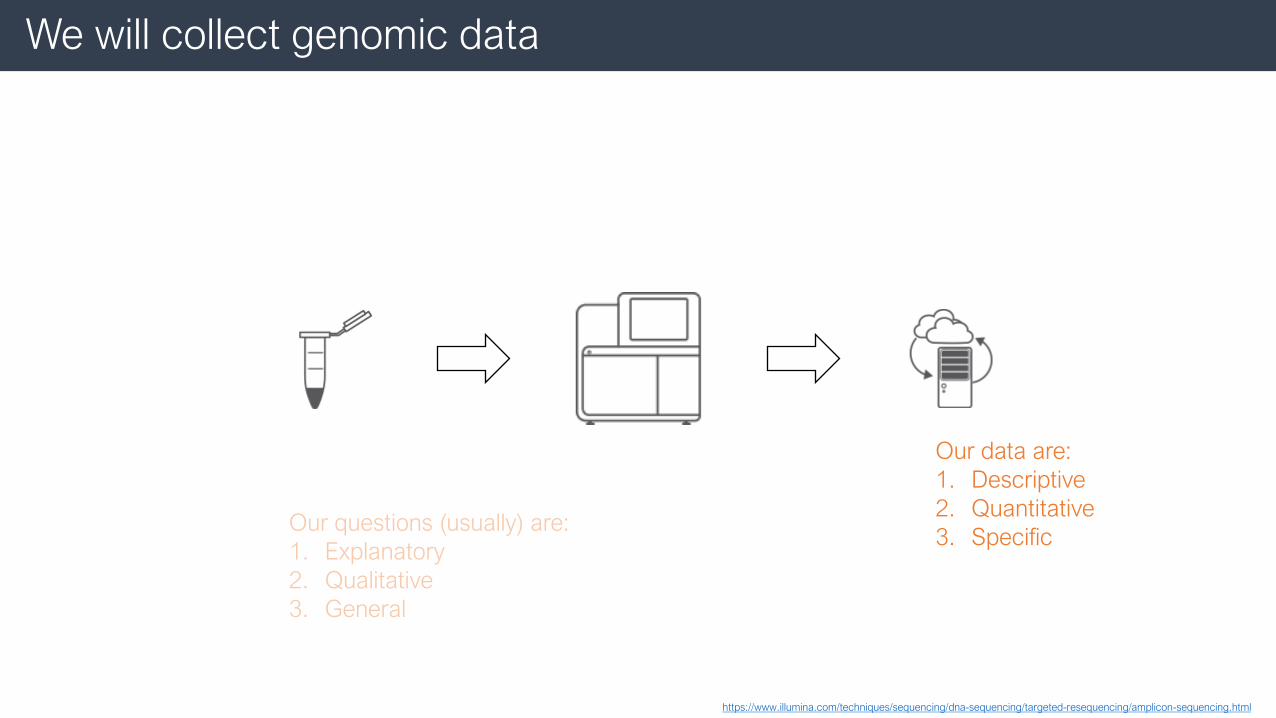
We will collect genomic data
https://www.illumina.com/techniques/sequencing/dna-sequencing/targeted-resequencing/amplicon-sequencing.html
Our data are:
1. Descriptive
2. Quantitative
3. SpecificOur questions (usually) are:
1. Explanatory
2. Qualitative
3. General

We need to bridge E ↔ D, ☺↔ #, and G ↔ S
☺ = qualitative, # = quantitative, D = descriptive, E = explanatory, G = general, S = specific
ExperimentQuestion
DataTheory
G☺E
G☺E
S#D
S#D
Deduction
Induction
?
?

We usually take several steps
ExperimentQuestion
Design
DataTheory
CollectPropose
Analyze
G☺E S#D
G☺E S#D
G☺D G#DFormulate
Model
Explain
Question1 Question2
ResultFinding
G☺D G#D
Interpret
Deduction
Induction
☺ = qualitative, # = quantitative, D = descriptive, E = explanatory, G = general, S = specific

These steps are difficult
General qualitative explanatory question (G☺E) General qualitative descriptive question (G☺D)
1. How do cells in the habenula of zebrafish larvae give
rise to brain function?
1. What reductionist descriptive information would be
useful for systems-level theory?
General qualitative descriptive question (G☺D) General quantitative descriptive question (G#D)
1. How highly expressed is gng8 in zebrafish larval
habenular cells?
2. Are the expression levels of epcam and calb2a
associated in zebrafish larval habenula cells?
3. What are the distinct molecularly defined cells types in
zebrafish larval habenula?
1. How to define “expression” for all habenular cells in all
zebrafish larvae?
2. How to numerically define “association”?
3. How to numerically define “distinct” and “cell type”?
Specific quantitative descriptive answer (S#D) General quantitative descriptive answer (G#D)
1. The expression levels of gng8 in cells from the scRNA-
seq data are 102, 20, 21, 15, 2, etc.
1. How to make general conclusion about all habenular
cells in all zebrafish larvae from these observed data?
Pandey et al. (2018)

Statistics is a mathematical framework for bridging ☺↔ #, G ↔ S
ExperimentQuestion
Design
DataTheory
CollectPropose
Analyze
G☺E S#D
G☺E S#D
G☺D G#DFormulate
Model
Explain
Question1 Question2
ResultFinding
G☺D G#D
Interpret
Deduction
Induction
☺ = qualitative, # = quantitative, D = descriptive, E = explanatory, G = general, S = specific
Concepts and language
Theory and
methods
Concepts and language
Theory and
methods

Principles of statistics

We will focus on principles instead of specific methods or code
“Why Structure and Interpretation of Computer Programs
matters” (https://people.eecs.berkeley.edu/~bh/sicp.html):
The language in which you'll spend most of your working life
hasn't been invented yet, so we can't teach it to you. Instead
we have to give you the skills you need to learn new languages
as they appear.
https://mitpress.mit.edu/sites/default/files/sicp/index.html

1. Identify population you want to generalize to
ExperimentQuestion
DataTheory
G☺E S#D
G☺E S#D
G☺D G#D
Question1 Question2
ResultFinding
G☺D G#D
Deduction
Induction
☺ = qualitative, # = quantitative, D = descriptive, E = explanatory, G = general, S = specific

Exercise: zebrafish scRNA-seq
How do cells in the
habenula of zebrafish
larvae give rise to
brain function?
What is the population of interest?
All cells in the habenulae of all
zebrafish larvae
Pandey et al. (2018)

2. Population distribution function encodes all G#D information
ExperimentQuestion
DataTheory
G☺E S#D
G☺E S#D
G☺D G#D
Question1 Question2
ResultFinding
G☺D G#D
Deduction
Induction
☺ = qualitative, # = quantitative, D = descriptive, E = explanatory, G = general, S = specific
𝑝(𝑥)

𝑝(𝑥) = proportion of the population whose variables take value 𝑥
The proportion of elements in the
population with
𝑋1 = 3.6599 and
𝑋2 = 93.4082 is
𝑝(3.6599, 93.4082) = 0.0081.
Variable 𝑋1of interest
Variable 𝑋2of interest

Many useful descriptive quantities are properties of 𝑝(𝑥)
𝑝 𝑥2
𝑝 𝑥1𝑝(𝑥1 ∣ 𝑥2 = 93.4082)
𝑝(𝑥2 ∣ 𝑥1 = 3.6599)
mean1, median1
mean2, median2
• Variances
• Conditional mean of
𝑋2 among subgroup
of population with
𝑋1 = 𝑥1• Correlations
• Etc.
Conditional distributions Marginal distributions Other

*3*. Model G☺D question as a G#D question about 𝑝 𝑥
ExperimentQuestion
DataTheory
G☺E S#D
G☺E S#D
G☺D G#D
Question1 Question2
ResultFinding
G☺D G#D
Deduction
Induction
☺ = qualitative, # = quantitative, D = descriptive, E = explanatory, G = general, S = specific
𝑝(𝑥)

Statistical methods can answer four types of G#D questions
Target
G#D question
“Is?”
Testing
“How much?”
Estimation
Underlying variables
Dimension reduction
Underlying groups
Clustering
Supervised learning
Unsupervised learning
Property of 𝑝(𝑥) of interest

Examples of testing questions
Li (2015)
Is Catalase differentially expressed
between ALL and AML patients?
Golub et al. (1999)
Which bacteria differ in abundance between normal and IBD patients?

Examples of estimation questions
Moffitt et al. (2015)
How much of a gene is expressed in different cell clusters?
Avalos et al. (2020)
How is minor allele frequency within a colony
related to colony defense response?

Examples of dimension reduction questions
Price et al. (2006)
What underlying patterns are captured in an
individual’s genetic code?
Lee and Seung (1999)
What canonical features can be combined to
form any face?

Examples of clustering questions
https://satijalab.org/seurat/articles/pbmc3k_tutorial.html
What types of molecularly defined cell types are present
in peripheral mononuclear blood cells?
Aure et al. (2017)
Are there clinically significant subtypes of the luminal A
subtype of breast cancer?

Generalized linear models make G☺D ⇒ G#D precise
𝑔−1 𝐸 𝑌 𝑋1 = 𝑥1, … , 𝑋𝑝 = 𝑥𝑝 = 𝛽0 +
𝑗=1
𝑝
𝑥𝑗𝛽𝑗
General qualitative descriptive question (G☺D) General quantitative descriptive ques. about 𝑝(𝑥) (G#D)
1. How highly expressed is gng8 in zebrafish larval
habenular cells?
2. Are the expression levels of epcam and calb2a
associated in zebrafish larval habenular cells?
3. What are the distinct molecularly defined cells types in
zebrafish larval habenula?
1. Let 𝑋1 = gng8 expression in a larval habenular cell. In
the model log 𝐸 𝑌 𝑋1 = 𝛽0, what is 𝛽0?
2. Let 𝑌 = epcam expression in a larval cell and 𝑋1 =
calb2a expression. In the model log 𝐸 𝑌 𝑋1 = 𝛽0 +𝛽1𝑋1, is 𝛽1 = 0?
3. Let 𝑋𝑗 be the expression of gene 𝑗 and let 𝐶𝑘 be
unknown group indicators that equal 1 if the cell is of
type 𝑘 and 0 otherwise, for 𝑘 = 1,… , 𝐾. In the models
log𝐸 𝑋𝑗 𝐶1, … , 𝐶𝐾 = 𝛽𝑗1𝐶1 +⋯+ 𝛽𝑗𝐾𝐶𝐾, what
definitions of 𝐶𝑘 make the 𝛽𝑗1, … , 𝛽𝑗𝐾 most distinct
from each other, for all genes 𝑗?
Generalized linear modeling
G☺D question ⇒ a G#D question about one or more of the 𝛽’s in:

4. Transform data into variables measured on samples
ExperimentQuestion
DataTheory
G☺E S#D
G☺E S#D
G☺D G#D
Question1 Question2
ResultFinding
G☺D G#D
Deduction
Induction
☺ = qualitative, # = quantitative, D = descriptive, E = explanatory, G = general, S = specific
𝑿𝟏 𝑿𝟐 …
variables
sampling
units
𝑝(𝑥)

Exercise: zebrafish scRNA-seq
GSM2818521_larva_counts_matrix.txt:
10 days post fertilization larval heads from 25 gng8-GFP fish were dissected, and cells were dissociated as described
previously…The resulting single cell suspension was promptly loaded on the 10X Chromium system.
Exercises:
1. What are the variables?
Genes
2. What are the sampling units?
Cells
3. What is the population you can generalize to?
All cells from the habenula of only the 25 gng8-
GFP larva used in this experiment
Pandey et al. (2018)

5. Infer properties of 𝑝(𝑥) from data using statistical methods
ExperimentQuestion
DataTheory
G☺E S#D
G☺E S#D
G☺D G#D
Question1 Question2
ResultFinding
G☺D G#D
Deduction
Induction
☺ = qualitative, # = quantitative, D = descriptive, E = explanatory, G = general, S = specific
𝑿𝟏 𝑿𝟐 …
variables
sampling
units
𝑝(𝑥)
Ƹ𝑝(𝑥)

Taxonomy of methods is more important than any specific method
Toolbox = taxonomy
Tools = methods

Methods can be categorized based on a few important factors
Target
G#D question
“Is?”
Testing
“How much?”
Estimation
Underlying variables
Dimension reduction
Underlying groups
Clustering
Other factors:
1. Data structure
• Variable types
• Missingness
• Censoring
• Etc.
2. Model assumptions
• Parametric
• Semiparametric
• Nonparametric
3. Problem details
4. Cultural norms
Property of 𝑝(𝑥) of interest

Hardware
Operating system
Programs
The R ecosystem is useful for implementing analyses
https://www.r-project.org/
https://rstudio.com/products/rstudio/download/
https://git-scm.com/
User-contributed R packages

6. Use inferred ො𝑝(𝑥) to make qualitative conclusions
ExperimentQuestion
DataTheory
G☺E S#D
G☺E S#D
G☺D G#D
Question1 Question2
ResultFinding
G☺D G#D
Deduction
Induction
☺ = qualitative, # = quantitative, D = descriptive, E = explanatory, G = general, S = specific
𝑿𝟏 𝑿𝟐 …
variables
sampling
units
𝑝(𝑥)
Ƹ𝑝(𝑥)
https://www.cusabio.com/pathway.html

Generalized linear models make G#D ⇒ G☺D precise
𝑔−1 𝐸 𝑌 𝑋1 = 𝑥1, … , 𝑋𝑝 = 𝑥𝑝 = 𝛽0 +
𝑗=1
𝑝
𝑥𝑗𝛽𝑗
General quantitative descriptive result about 𝑝(𝑥) (G#D) General qualitative descriptive finding (G☺D)
1. Let 𝑋1 = gng8 expression in a larval habenular cell. In
the model log 𝐸 𝑌 𝑋1 = 𝛽0, 𝛽0 is estimated to equal
4.19 with a standard deviation of 0.90.
2. Let 𝑌 = epcam expression in a larval cell and 𝑋1 =
calb2a expression. In the model log 𝐸 𝑌 𝑋1 = 𝛽0 +𝛽1𝑋1, the p-value for testing 𝛽1 = 0 is less than 10−16.
3. Let 𝑋𝑗 be the expression of gene 𝑗. We can estimate
underlying group indicators 𝐶1, … 𝐶𝐾 such that in the
model log𝐸 𝑋𝑗 𝐶1, … , 𝐶𝐾 = 𝛽𝑗1𝐶1 +⋯+ 𝛽𝑗𝐾𝐶𝐾, the
estimated 𝛽𝑗1, … , 𝛽𝑗𝐾 are most distinct from each
other, for all genes 𝑗.
1. We’re fairly confident that the population average
expression level of gng8 in zebrafish larval habenular
cells is around 𝑒4.19.
2. Since the p-value is very low, we have enough
evidence to say that epcam and calb2a are associated
in zebrafish larval habenular cells.
3. The cells that have 𝐶𝑘 = 1 are part of the same cell
cluster and have a common structural or functional
role in the habenula.
Generalized linear modeling
G☺D question ⇒ a G#D question about one or more of the 𝛽’s in:

Case study

We will study zebrafish scRNA-seq data
G☺E
Deduction
Induction
☺ = qualitative, # = quantitative, D = descriptive, E = explanatory, G = general, S = specific
How do cells in the
habenula of zebrafish
larvae give rise to
brain function?
Pandey et al. (2018)

*1*. Formulate a useful G☺D question
G☺E
G☺D
Deduction
Induction
☺ = qualitative, # = quantitative, D = descriptive, E = explanatory, G = general, S = specific
How do cells in the
habenula of zebrafish
larvae give rise to
brain function?
What are the molecularly
distinct cell types in the
habenula?
Pandey et al. (2018)

*2*. Model G☺D question as a G#D question about 𝑝 𝑥
G☺D G#D
What underlying
groups can 𝑝(𝑥) be
divided into?Deduction
Induction
☺ = qualitative, # = quantitative, D = descriptive, E = explanatory, G = general, S = specific
How do cells in the
habenula of zebrafish
larvae give rise to
brain function? 𝑝(𝑥)
G☺E
What are the molecularly
distinct cell types in the
habenula?
Pandey et al. (2018)

3. Conduct experiment
G☺E S#D
G☺D G#D
What underlying
groups can 𝑝(𝑥) be
divided into?Deduction
Induction
☺ = qualitative, # = quantitative, D = descriptive, E = explanatory, G = general, S = specific
How do cells in the
habenula of zebrafish
larvae give rise to
brain function? 𝑝(𝑥)
What are the molecularly
distinct cell types in the
habenula?
Pandey et al. (2018)

4. Transform raw data into data table
G☺E S#D
S#D
G☺D G#D
What underlying
groups can 𝑝(𝑥) be
divided into?Deduction
Induction
☺ = qualitative, # = quantitative, D = descriptive, E = explanatory, G = general, S = specific
How do cells in the
habenula of zebrafish
larvae give rise to
brain function? 𝑝(𝑥)
Bioinformatics
GSM2818521_larva_counts_matrix.txt
What are the molecularly
distinct cell types in the
habenula?
Pandey et al. (2018)

5. Answer G#D question about 𝑝(𝑥)
G☺E S#D
S#D
G☺D G#D
What underlying
groups can 𝑝(𝑥) be
divided into?
G#D
Deduction
Induction
☺ = qualitative, # = quantitative, D = descriptive, E = explanatory, G = general, S = specific
How do cells in the
habenula of zebrafish
larvae give rise to
brain function? 𝑝(𝑥)
Bioinformatics
GSM2818521_larva_counts_matrix.txt
1. Preprocessing
a. Quality control
b. Normalization
2. Analysis and visualization
Ƹ𝑝(𝑥)
What are the molecularly
distinct cell types in the
habenula?
Pandey et al. (2018)

We will be using the Seurat R package

Quality control and normalization are technology-specific
## ##############################################################
## load data
## ##############################################################
file = "/home/user/data/stat530_2021/GSM2818521_larva_counts_matrix.txt"
pandey <- read.table(file, header = TRUE)
dim(pandey)
library(Seurat)
## set random seed for reproducibility
set.seed(1)
s_obj <- CreateSeuratObject(counts = pandey, min.cells = 30, min.features = 500)
## ##############################################################
## quality control
## ##############################################################
s_obj[["percent.mt"]] = PercentageFeatureSet(s_obj, pattern = "^MT-")
VlnPlot(s_obj, features = c("nCount_RNA", "nFeature_RNA", "percent.mt"))
s_obj <- subset(s_obj, percent.mt <= 6)
## ##############################################################
## normalization
## ##############################################################
s_obj <- NormalizeData(s_obj)
s_obj <- FindVariableFeatures(s_obj)
s_obj <- ScaleData(s_obj, vars.to.regress = "percent.mt")Estimate variances
Estimate associations

Property of 𝑝(𝑥) of interest
We cluster using the Louvain algorithm on an SNN graph
Target
G#D question
“Is?”
Testing
“How much?”
Estimation
Underlying variables
Dimension reduction
Underlying groups
Clustering
Ertoz, Steinbach, Kumar (2003), Waltman and van Eck (2013)
𝑝(𝑥)
Algorithm:
## ##############################################################
## analysis
## ##############################################################
## dimension reduction
s_obj <- RunPCA(s_obj)
## clustering
s_obj <- FindNeighbors(s_obj)
s_obj <- FindClusters(s_obj, resolution = 0.5)

We first reduce variables for speed and accuracy using PCA
Property of 𝑝(𝑥) of interest
Target
G#D question
“Is?”
Testing
“How much?”
Estimation
Underlying variables
Dimension reduction
Underlying groups
Clustering
𝑝(𝑥)
𝑋 𝑌 new 𝑍 = position on orange line
https://online.stat.psu.edu/stat200/lesson/3/3.4/3.4.1
Algorithm:
## ##############################################################
## analysis
## ##############################################################
## dimension reduction
s_obj <- RunPCA(s_obj)
## clustering
s_obj <- FindNeighbors(s_obj)
s_obj <- FindClusters(s_obj, resolution = 0.5)

We visualize using UMAP to reduce variables
Property of 𝑝(𝑥) of interest
Target
G#D question
“Is?”
Testing
“How much?”
Estimation
Underlying variables
Dimension reduction
Underlying groups
Clustering
𝑝(𝑥)
Rhys (2020)
Algorithm:
## ##############################################################
## visualization
## ##############################################################
## dimension reduction
s_obj <- RunUMAP(s_obj, dims = 1:20)
## visualization
DimPlot(s_obj)

6. Answer G☺D question about population
G☺E S#D
S#D
G☺D G#D
What underlying
groups can 𝑝(𝑥) be
divided into?
G☺D G#D
Deduction
Induction
☺ = qualitative, # = quantitative, D = descriptive, E = explanatory, G = general, S = specific
How do cells in the
habenula of zebrafish
larvae give rise to
brain function? 𝑝(𝑥)
Bioinformatics
GSM2818521_larva_counts_matrix.txt
1. Preprocessing
a. Quality control
b. Normalization
2. Analysis and visualization
Ƹ𝑝(𝑥)
What are the molecularly
distinct cell types in the
habenula?
There are at least 12
distinct cell types in
the habenula.
Pandey et al. (2018)

Combine biological knowledge with results to arrive at finding
## ##############################################################
## interpretation
## ##############################################################
## visualize marker of olfactory cells
FeaturePlot(s_obj, features = "EPCAM")
Not a cluster of
habenular cells

7. Reconcile finding with existing theory
G☺E S#D
S#D
G☺D G#D
What are the molecularly
distinct cell types in the
habenula?
What underlying
groups can 𝑝(𝑥) be
divided into?
There are at least 12
distinct cell types in
the habenula.
G☺D G#D
Deduction
Induction
☺ = qualitative, # = quantitative, D = descriptive, E = explanatory, G = general, S = specific
How do cells in the
habenula of zebrafish
larvae give rise to
brain function? 𝑝(𝑥)
Bioinformatics
GSM2818521_larva_counts_matrix.txt
1. Preprocessing
a. Quality control
b. Normalization
2. Analysis and visualization
Ƹ𝑝(𝑥)
Theory G☺E
Pandey et al. (2018)

8. Continue
Theory G☺E
Deduction
Induction
☺ = qualitative, # = quantitative, D = descriptive, E = explanatory, G = general, S = specific
G☺E
G☺D
How do cells in the
habenula of zebrafish
larvae give rise to
brain function?
What are the biological
functions of the different
habenular cell types?
Pandey et al. (2018)
There are at least 12
distinct cell types in
the habenula.
G☺D

Find differentially expressed genes and active pathways
## ##############################################################
## additional analysis
## ##############################################################
markers = FindMarkers(s_obj, ident.1 = 5)
gene_names = rownames(markers)[markers$p_val_adj <= 0.05]
length(gene_names)
cat(gene_names, sep = "\n")
## https://david.ncifcrf.gov/

Questions
Dave Zhao, [email protected]
Department of Statistics
University of Illinois Urbana-Champaign
http://publish.illinois.edu/sdzhao/