statistics for engineers lecture 1 introduction to...
TRANSCRIPT
Statistics for Engineers Lecture 1Introduction to Probability Theory
Chong Ma
Department of StatisticsUniversity of South Carolina
January 9, 2017
Chong Ma (Statistics, USC) STAT 509 Spring 2017 January 9, 2017 1 / 32
Outline
1 IntroductionDeterministic ModelStatistical Model
2 ProbabilitySample Spaces and EventsUnions and IntersectionsAxioms of ProbabilityConditional ProbabilityProbability RulesRandom Variables
Chong Ma (Statistics, USC) STAT 509 Spring 2017 January 9, 2017 2 / 32
What is statistics?
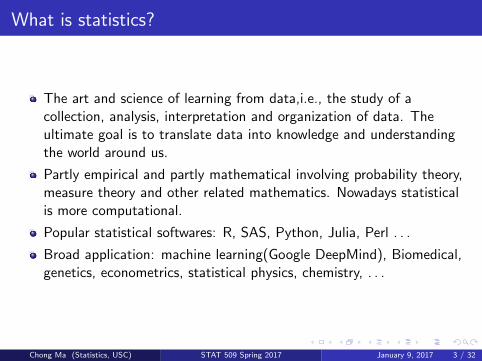
The art and science of learning from data,i.e., the study of acollection, analysis, interpretation and organization of data. Theultimate goal is to translate data into knowledge and understandingthe world around us.
Partly empirical and partly mathematical involving probability theory,measure theory and other related mathematics. Nowadays statisticalis more computational.
Popular statistical softwares: R, SAS, Python, Julia, Perl . . .
Broad application: machine learning(Google DeepMind), Biomedical,genetics, econometrics, statistical physics, chemistry, . . .
Chong Ma (Statistics, USC) STAT 509 Spring 2017 January 9, 2017 3 / 32
Examples
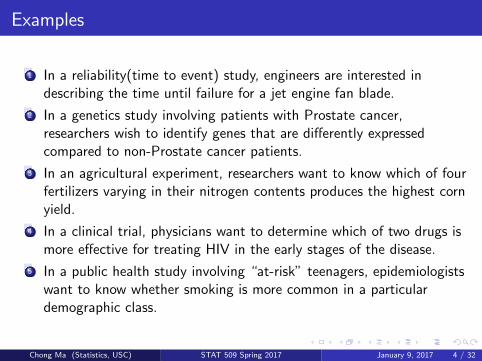
1 In a reliability(time to event) study, engineers are interested indescribing the time until failure for a jet engine fan blade.
2 In a genetics study involving patients with Prostate cancer,researchers wish to identify genes that are differently expressedcompared to non-Prostate cancer patients.
3 In an agricultural experiment, researchers want to know which of fourfertilizers varying in their nitrogen contents produces the highest cornyield.
4 In a clinical trial, physicians want to determine which of two drugs ismore effective for treating HIV in the early stages of the disease.
5 In a public health study involving “at-risk” teenagers, epidemiologistswant to know whether smoking is more common in a particulardemographic class.
Chong Ma (Statistics, USC) STAT 509 Spring 2017 January 9, 2017 4 / 32

continue. . .
6 A food scientist is interested in determining how different feedingschedules(for pigs) could affect the spread of salmonella during theslaughtering process.
7 A pharmacist is concerned that administering caffeine to prematurebabies will increase the incidence of necrotizing enterocolitis.
8 A research dietitian wants to determine if academic achievement isrelated to body mass index(BMI) among African American studentsin the fourth grade.
Chong Ma (Statistics, USC) STAT 509 Spring 2017 January 9, 2017 5 / 32
Deterministic Model
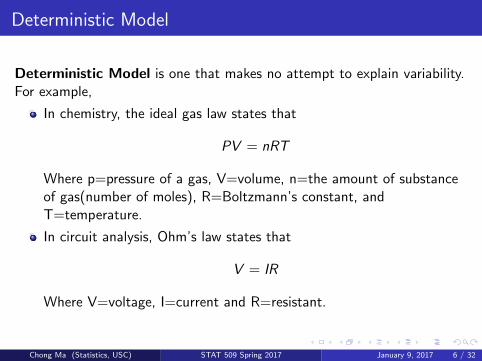
Deterministic Model is one that makes no attempt to explain variability.For example,
In chemistry, the ideal gas law states that
PV = nRT
Where p=pressure of a gas, V=volume, n=the amount of substanceof gas(number of moles), R=Boltzmann’s constant, andT=temperature.
In circuit analysis, Ohm’s law states that
V = IR
Where V=voltage, I=current and R=resistant.
Chong Ma (Statistics, USC) STAT 509 Spring 2017 January 9, 2017 6 / 32
Deterministic Model
Remarks:
In both of these models, the relationship among the variables iscompletely determined without ambiguity.
In real life, this is rarely true for the obvious reason: there is naturalvariation that arises in the measurement process.
For example, a common electrical engineering experiment involvessetting up a simple circuit with a known resistance R. For a givencurrent I, different students will then measure the voltage V.
- With a sample of 20 students, conducting the experiment insuccession, they might very well get 20 different measured voltages.
- A deterministic model is too simplistic; it does not acknowledge theinherent variability that arises in the measurement process.
Chong Ma (Statistics, USC) STAT 509 Spring 2017 January 9, 2017 7 / 32
Statistical Model
Statistical Model is not deterministic, which incorporates variability andis used to predict future outcomes. Suppose that I am interested inpredicting
Y = STAT 509 final course percentage
by using x1 = SAT MATH score and x2 = MATH 141 grade. Thestatistical model can be formated as
Y = β0 + β1x1 + β2x2 + ε
Where ε is a term that accounts for not only measurement errors(e.g.,incorrect information, data entry errors, grading errors, etc.) but also
all of the other variables not accounted for(e.g., majoy, study habits,natural ability, etc.) and
the error induced by assuming a linear relationship between Y andx1 and x2 when the relationship might actually not be.
Chong Ma (Statistics, USC) STAT 509 Spring 2017 January 9, 2017 8 / 32
Statistical Model
500 550 600 650 700 750
0 2
0 4
0 6
0 8
010
0
2.6
2.8
3.0
3.2
3.4
SAT MATH
MAT
H 14
1
STAT
509
●
●
●
●
●
●
●
●
●
●
●
●
●
●
●
●
●
●
●
●
●
●
●
●
●
●
●
●
●
●
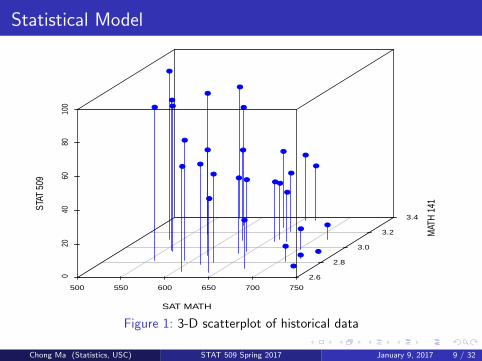
Figure 1: 3-D scatterplot of historical data
Chong Ma (Statistics, USC) STAT 509 Spring 2017 January 9, 2017 9 / 32

Statistical Model
Remarks:
Is this sample of students representative of some larger relevantpopulation? After all, we would like our model to be useful on alarger scale.
How should we estimate β0, β1 and β2 in the model?
- If we can do this, then we can produce predictions of Y on astudent-by-student basis.
- This maybe of interest to academic advisers who are trying to modelthe success of their incoming students.
- We can also characterize numerical uncertainty with our predictions.
Probability is the “mathematics of uncertainty” and forms the basisfor all of statistics.
Chong Ma (Statistics, USC) STAT 509 Spring 2017 January 9, 2017 10 / 32

Outline
1 IntroductionDeterministic ModelStatistical Model
2 ProbabilitySample Spaces and EventsUnions and IntersectionsAxioms of ProbabilityConditional ProbabilityProbability RulesRandom Variables
Chong Ma (Statistics, USC) STAT 509 Spring 2017 January 9, 2017 11 / 32
Sample Spaces and Events
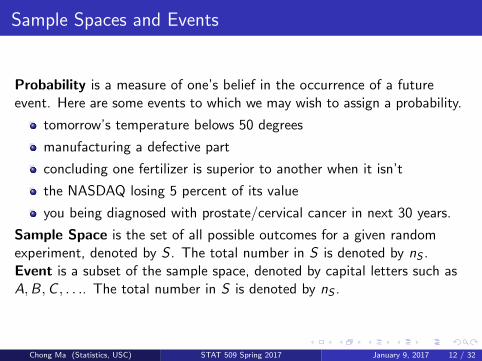
Probability is a measure of one’s belief in the occurrence of a futureevent. Here are some events to which we may wish to assign a probability.
tomorrow’s temperature belows 50 degrees
manufacturing a defective part
concluding one fertilizer is superior to another when it isn’t
the NASDAQ losing 5 percent of its value
you being diagnosed with prostate/cervical cancer in next 30 years.
Sample Space is the set of all possible outcomes for a given randomexperiment, denoted by S . The total number in S is denoted by nS .Event is a subset of the sample space, denoted by capital letters such asA,B,C , . . .. The total number in S is denoted by nS .
Chong Ma (Statistics, USC) STAT 509 Spring 2017 January 9, 2017 12 / 32
Sample Spaces and Events
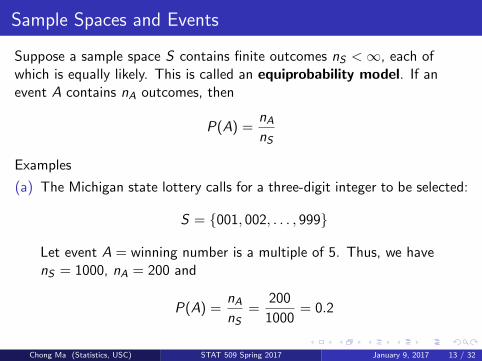
Suppose a sample space S contains finite outcomes nS <∞, each ofwhich is equally likely. This is called an equiprobability model. If anevent A contains nA outcomes, then
P(A) =nAnS
Examples
(a) The Michigan state lottery calls for a three-digit integer to be selected:
S = {001, 002, . . . , 999}
Let event A = winning number is a multiple of 5. Thus, we havenS = 1000, nA = 200 and
P(A) =nAnS
=200
1000= 0.2
Chong Ma (Statistics, USC) STAT 509 Spring 2017 January 9, 2017 13 / 32

Sample Spaces and Events
(b) A USC undergraduate student is tested for chlamydia(0=negative and1=positive). Thus,
S = {0, 1}Here nS = 2 possible outcomes. However, is it reasonable to assumethat each outcome in S is equally likely?
The prevalence of chlamydia among college age students is much lessthan 50%.It would be illogical to assign probabilities using equiprobability model.
(c) Four equally qualified applicants(a,b,c,d) are competing for twopositions. If the positions are identical(so that selection order doesn’tmatter). Let A be the event that applicant d is selected for one of thetwo positions. Thus,
S = {ab, ac, ad , bc, bd , cd},A = {ad , bd , cd}
AndP(A) = 3/6 = 0.5
Chong Ma (Statistics, USC) STAT 509 Spring 2017 January 9, 2017 14 / 32

Sample Spaces and Events
Interpretation: What does P(A) measure? There are two maininterpretations:
P(A) measures the likelihood that A will occure on any givenexperiment.
If the experiment is performed many times, then P(A) can beinterpreted as the percentage of times that A will occur “over thelong run”. This is called the relative frequency interpretation.
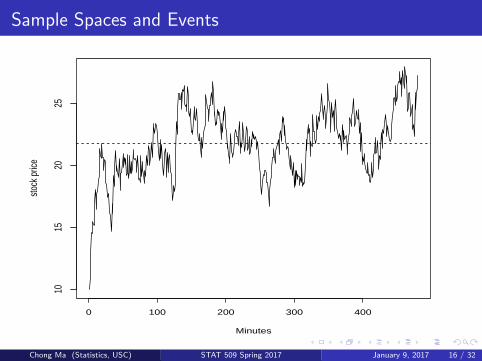
Example Suppose a new public company’s initial stock price is set at $10.Assume that its average stock price on the first day is more than $21.75with probability 0.463. The probability 0.463 can also be interpreted asthe ”long run” percentage of stock price more than $21.75. I used R tosimulate the stock price on the first transaction day.
Chong Ma (Statistics, USC) STAT 509 Spring 2017 January 9, 2017 15 / 32
Sample Spaces and Events
0 100 200 300 400
1015
2025
Minutes
stoc
k pr
ice
Figure 2: Simulation of stock price in one transaction day.Chong Ma (Statistics, USC) STAT 509 Spring 2017 January 9, 2017 16 / 32
Unions and Intersections
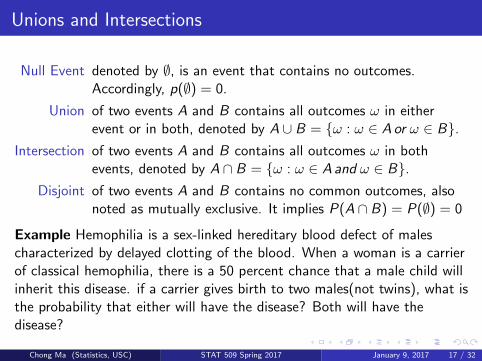
Null Event denoted by ∅, is an event that contains no outcomes.Accordingly, p(∅) = 0.
Union of two events A and B contains all outcomes ω in eitherevent or in both, denoted by A ∪ B = {ω : ω ∈ Aor ω ∈ B}.
Intersection of two events A and B contains all outcomes ω in bothevents, denoted by A ∩ B = {ω : ω ∈ Aand ω ∈ B}.
Disjoint of two events A and B contains no common outcomes, alsonoted as mutually exclusive. It implies P(A ∩ B) = P(∅) = 0
Example Hemophilia is a sex-linked hereditary blood defect of malescharacterized by delayed clotting of the blood. When a woman is a carrierof classical hemophilia, there is a 50 percent chance that a male child willinherit this disease. if a carrier gives birth to two males(not twins), what isthe probability that either will have the disease? Both will have thedisease?
Chong Ma (Statistics, USC) STAT 509 Spring 2017 January 9, 2017 17 / 32

Unions and Intersections
Consider that the process of having two male children as an experimentwith sample space
S = {++,+−,−+,−−}
Where “ + ” means the male offspring has the disease;“− ” means thatthe male does not have the disease. Assume that each outcome in S isequally likely. Note that
A = {first child has disease} = {++,+−}B = {second child has disease} = {−+,−−}
Thus,
A ∪ B = {either child has disease} = {++,+−,−+}A ∩ B = {both child have disease} = {++}
Chong Ma (Statistics, USC) STAT 509 Spring 2017 January 9, 2017 18 / 32
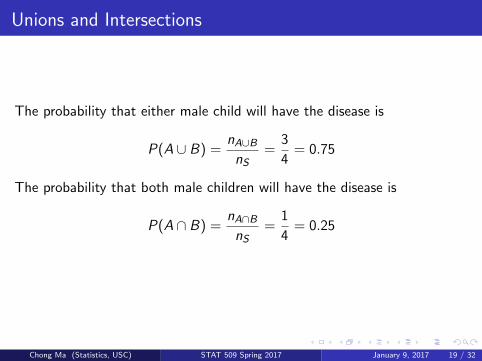
Unions and Intersections
The probability that either male child will have the disease is
P(A ∪ B) =nA∪BnS
=3
4= 0.75
The probability that both male children will have the disease is
P(A ∩ B) =nA∩BnS
=1
4= 0.25
Chong Ma (Statistics, USC) STAT 509 Spring 2017 January 9, 2017 19 / 32
Axioms of Probability
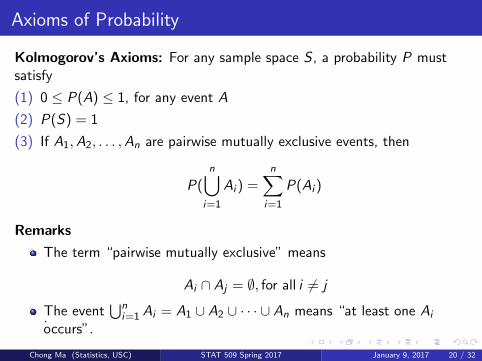
Kolmogorov’s Axioms: For any sample space S , a probability P mustsatisfy
(1) 0 ≤ P(A) ≤ 1, for any event A
(2) P(S) = 1
(3) If A1,A2, . . . ,An are pairwise mutually exclusive events, then
P(n⋃
i=1
Ai ) =n∑
i=1
P(Ai )
Remarks
The term “pairwise mutually exclusive” means
Ai ∩ Aj = ∅, for all i 6= j
.The event⋃n
i=1 Ai = A1 ∪ A2 ∪ · · · ∪ An means “at least one Ai
occurs”.
Chong Ma (Statistics, USC) STAT 509 Spring 2017 January 9, 2017 20 / 32

Conditional Probability
Let A and B be events in a sample space S with P(B) > 0. Theconditional probability of A, given that B has occurred, is
P(A|B) =P(A ∩ B)
P(B)
Example In a company, 36% of employees have a degree from a SECuniversity, 22% of those employees with a degree from the SEC areengineers, and 30% of employees are engineers. An employee is selected atrandom.
(a) Compute the probability that the employee is an engineer and is fromthe SEC.
(b) Compute the conditional probability that the employee is from theSEC, given that he/she is an engineer.
Chong Ma (Statistics, USC) STAT 509 Spring 2017 January 9, 2017 21 / 32

Conditional Probability
Note that
A = {employee has a degree from SEC}, P(A) = 0.36
B = {employee is an engineer}, P(B) = 0.3
And we also know from the problem
P(B|A) = 0.22
The probability that the employee is an engineer and is from SEC
P(A ∩ B) = P(B|A)P(A) = 0.22× 0.36 = 0.0792
The conditional probability that the employee is from the SEC, given thathe/she is an engineer
P(A|B) =P(A ∩ B)
P(B)=
0.0792
0.3= 0.264
Chong Ma (Statistics, USC) STAT 509 Spring 2017 January 9, 2017 22 / 32

Conditional Probability
Remark:In the example, the conditional probability P(A|B) and theunconditional probability P(A) are not equal.
In some situation, knowledge that “B has occurred” has changed thelikelihood that A occurs.In other situations, it might be that the occurrence(ornon-occurrence) of a companion event has no effect on the probabilityof the event of interest. This leads to the definition of independence.
When the occurrence or non-occurrence of B has no effect on whether ornot A occurs, and vice-versa, we say the events A and B are independent.Mathematically, we define A and B are independent if and only if
P(A ∩ B) = P(A)P(B)
Equivalently, if A and B are independent,
P(A|B) =P(A ∩ B)
P(B)=
P(A)P(B)
P(B)= P(A)
P(B|A) =P(B ∩ A)
P(A)=
P(B)P(A)
P(A)= P(B)
Chong Ma (Statistics, USC) STAT 509 Spring 2017 January 9, 2017 23 / 32
Conditional Probability
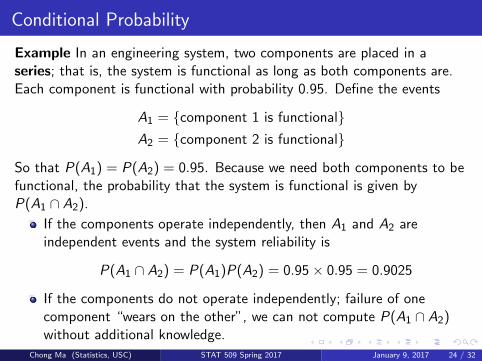
Example In an engineering system, two components are placed in aseries; that is, the system is functional as long as both components are.Each component is functional with probability 0.95. Define the events
A1 = {component 1 is functional}A2 = {component 2 is functional}
So that P(A1) = P(A2) = 0.95. Because we need both components to befunctional, the probability that the system is functional is given byP(A1 ∩ A2).
If the components operate independently, then A1 and A2 areindependent events and the system reliability is
P(A1 ∩ A2) = P(A1)P(A2) = 0.95× 0.95 = 0.9025
If the components do not operate independently; failure of onecomponent “wears on the other”, we can not compute P(A1 ∩ A2)without additional knowledge.
Chong Ma (Statistics, USC) STAT 509 Spring 2017 January 9, 2017 24 / 32

Conditional Probability
Extension: The notion of independence extends to any finite collection ofevents A1,A2, . . . ,An. Mutually independence means that theprobability of the intersection of any sub-collection of A1,A2, . . . ,An
equals the product of the probabilities of the events in the sub-collection.For example, if A1,A2,A3, and A4 are mutually independent, then
P(A1 ∩ A2) = P(A1)P(A2)
P(A1 ∩ A2 ∩ A3) = P(A1)P(A2)P(A3)
P(A1 ∩ A2 ∩ A3 ∩ A4) = P(A1)P(A2)P(A3)P(A4)
Chong Ma (Statistics, USC) STAT 509 Spring 2017 January 9, 2017 25 / 32
Probability Rules
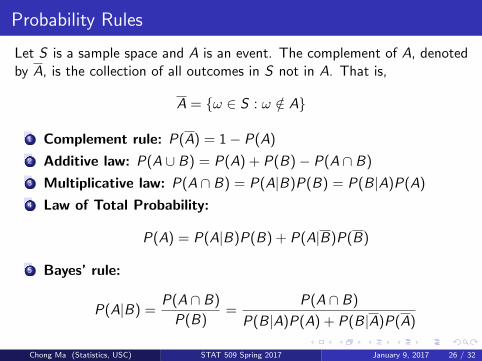
Let S is a sample space and A is an event. The complement of A, denotedby A, is the collection of all outcomes in S not in A. That is,
A = {ω ∈ S : ω /∈ A}
1 Complement rule: P(A) = 1− P(A)
2 Additive law: P(A ∪ B) = P(A) + P(B)− P(A ∩ B)
3 Multiplicative law: P(A ∩ B) = P(A|B)P(B) = P(B|A)P(A)
4 Law of Total Probability:
P(A) = P(A|B)P(B) + P(A|B)P(B)
5 Bayes’ rule:
P(A|B) =P(A ∩ B)
P(B)=
P(A ∩ B)
P(B|A)P(A) + P(B|A)P(A)
Chong Ma (Statistics, USC) STAT 509 Spring 2017 January 9, 2017 26 / 32
Probability Rules
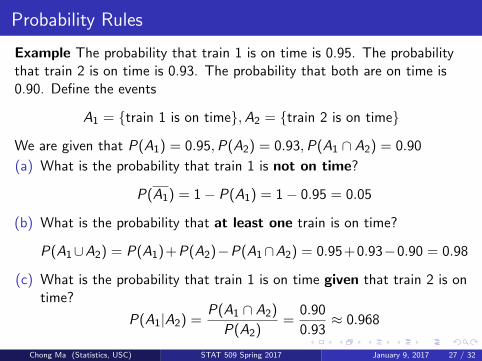
Example The probability that train 1 is on time is 0.95. The probabilitythat train 2 is on time is 0.93. The probability that both are on time is0.90. Define the events
A1 = {train 1 is on time},A2 = {train 2 is on time}
We are given that P(A1) = 0.95,P(A2) = 0.93,P(A1 ∩ A2) = 0.90
(a) What is the probability that train 1 is not on time?
P(A1) = 1− P(A1) = 1− 0.95 = 0.05
(b) What is the probability that at least one train is on time?
P(A1∪A2) = P(A1)+P(A2)−P(A1∩A2) = 0.95+0.93−0.90 = 0.98
(c) What is the probability that train 1 is on time given that train 2 is ontime?
P(A1|A2) =P(A1 ∩ A2)
P(A2)=
0.90
0.93≈ 0.968
Chong Ma (Statistics, USC) STAT 509 Spring 2017 January 9, 2017 27 / 32

Probability Rules
(d) What is the probability that train 2 is on time train 1 is not on time?
P(A2|A1) =P(A1 ∩ A2)
P(A1)=
P(A2)− P(A1 ∩ A2)
1− P(A1)=
0.93− 0.90
1− 0.95= 0.6
(d) Are A1 and A2 independent?They are not independent because P(A1|A2) 6= P(A1). In other words,knowledge that A2 has occurred changes the likelihood that A1 occurs.
Example An insurance company classifies people as “accident-prone” and“non-accident-prone”. For a fixed year, the probability that anaccident-prone person has an accident is 0.4, and the probability that anon-accident-prone person has an accident is 0.2. The population isestimated to be 30% accident-prone. Define the events
A = {policy holder has an accident},B = {policy holder is accident-prone}
Chong Ma (Statistics, USC) STAT 509 Spring 2017 January 9, 2017 28 / 32
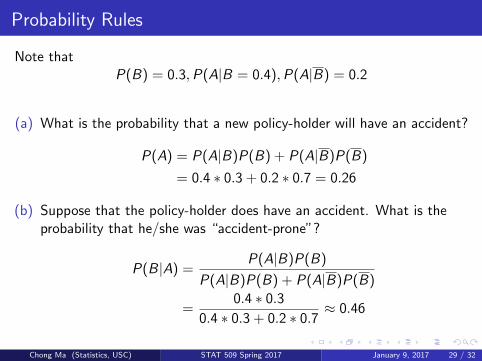
Probability Rules
Note thatP(B) = 0.3,P(A|B = 0.4),P(A|B) = 0.2
(a) What is the probability that a new policy-holder will have an accident?
P(A) = P(A|B)P(B) + P(A|B)P(B)
= 0.4 ∗ 0.3 + 0.2 ∗ 0.7 = 0.26
(b) Suppose that the policy-holder does have an accident. What is theprobability that he/she was “accident-prone”?
P(B|A) =P(A|B)P(B)
P(A|B)P(B) + P(A|B)P(B)
=0.4 ∗ 0.3
0.4 ∗ 0.3 + 0.2 ∗ 0.7≈ 0.46
Chong Ma (Statistics, USC) STAT 509 Spring 2017 January 9, 2017 29 / 32

Random Variables
A random variables(denoted as r.v.) Y is a variable whose value isdetermined by chance. The distribution of a r.v.consists of two parts:
an elicitation of the set of all possible values of Y (called support).
a function that describes how to assign probabilities to events inducedby Y .
A r.v. Y can be categorized by two types:
discrete If Y can assume only a finite (or countable) number ofvalues.
continuous If can envision Y as assuming in an interval off numbers.
Remarks: By convention, we denote random variables by upper caseletters towards the end of the alphabet, e.g., W ,X ,Y ,Z , etc. A possiblevalue of Y is denoted generally by its according lower case letter. In words,
P(Y = y)
is read,“the probability that the random variable Y equals the value y .”Chong Ma (Statistics, USC) STAT 509 Spring 2017 January 9, 2017 30 / 32

Random Variables
Example Classify the following random variables as discrete orcontinuous and specify the support of each random variable.
V = number of broken eggs in a randomly selected carton(dozen)
W = pH of an aqueous solution
X = length of time between accident at a factory
Y = whether or not you pass this class
Z = number of cans of beer that an adult has
The r.v. V is discrete. It can assume values in
{υ : υ ∈ 0, 1, 2, . . . , 12}
The r.v. W is continuous. It can appropriately assume values in
{ω : 0 ≤ ω ≤ 14}
Of course, its support can assumed as {ω : −∞ < ω <∞}Chong Ma (Statistics, USC) STAT 509 Spring 2017 January 9, 2017 31 / 32
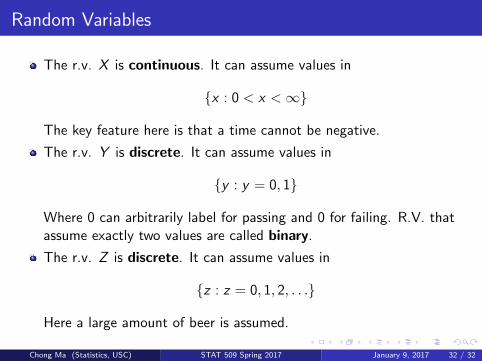
Random Variables
The r.v. X is continuous. It can assume values in
{x : 0 < x <∞}
The key feature here is that a time cannot be negative.
The r.v. Y is discrete. It can assume values in
{y : y = 0, 1}
Where 0 can arbitrarily label for passing and 0 for failing. R.V. thatassume exactly two values are called binary.
The r.v. Z is discrete. It can assume values in
{z : z = 0, 1, 2, . . .}
Here a large amount of beer is assumed.
Chong Ma (Statistics, USC) STAT 509 Spring 2017 January 9, 2017 32 / 32