statistical profile of new brunswick's publicly funded ... · statistical profile of new...
TRANSCRIPT

Statistical Profile of New Brunswick’s Publicly Funded Universities
Academic Year 2010 – 2011
Statistical Profile of New Brunswick’s Publicly Funded Universities Academic Year 2010 – 2011
Province of New Brunswick PO 6000, Fredericton NB E3B 5H1
www.gnb.ca
2012.09
ISBN 978-1-55471-866-5
Printed in New Brunswick 8932

1Statistical Profile of New Brunswick’s Publicly Funded Universities | Academic Year 2010 – 2011
Table of Contents
Introduction . . . . . . . . . . . . . . . . . . . . . . . . . . . . . . . . . . . . . . . . . . . . . . . . . . . . . . . . . . . . . . . . . . . . . . . . . . . . . . . . . . . . . . . 3
Figure 1: Consolidated enrolment characteristics . . . . . . . . . . . . . . . . . . . . . . . . . . . . . . . . . . . . . . . . . . . . . . . . . . 4
Figure 2: Persistence . . . . . . . . . . . . . . . . . . . . . . . . . . . . . . . . . . . . . . . . . . . . . . . . . . . . . . . . . . . . . . . . . . . . . . . . . . . . . . 4
Figure 3: Employment rate and mobility . . . . . . . . . . . . . . . . . . . . . . . . . . . . . . . . . . . . . . . . . . . . . . . . . . . . . . . . . . . 5
Figure 4: Employment earnings . . . . . . . . . . . . . . . . . . . . . . . . . . . . . . . . . . . . . . . . . . . . . . . . . . . . . . . . . . . . . . . . . . . 5
Figure 5: Total number of credentials awarded . . . . . . . . . . . . . . . . . . . . . . . . . . . . . . . . . . . . . . . . . . . . . . . . . . . . . 6
Figure 6: Direct Entry Rate . . . . . . . . . . . . . . . . . . . . . . . . . . . . . . . . . . . . . . . . . . . . . . . . . . . . . . . . . . . . . . . . . . . . . . . . 6
Figure 7: Home Province 18 – 24 Participation . . . . . . . . . . . . . . . . . . . . . . . . . . . . . . . . . . . . . . . . . . . . . . . . . . . . . 6
Figure 8: Home Province Participation . . . . . . . . . . . . . . . . . . . . . . . . . . . . . . . . . . . . . . . . . . . . . . . . . . . . . . . . . . . . . 7
Figure 9: Graduates who would choose the same institution . . . . . . . . . . . . . . . . . . . . . . . . . . . . . . . . . . . . . . . 7
Figure 10: Graduate satisfaction with instruction by cluster . . . . . . . . . . . . . . . . . . . . . . . . . . . . . . . . . . . . . . . . . . 7
Figure 11: Income by source . . . . . . . . . . . . . . . . . . . . . . . . . . . . . . . . . . . . . . . . . . . . . . . . . . . . . . . . . . . . . . . . . . . . . . . . 8
Figure 12: Average dollars per FTE, general operating funds . . . . . . . . . . . . . . . . . . . . . . . . . . . . . . . . . . . . . . . . . 8
Figure 13: Expenditures by source . . . . . . . . . . . . . . . . . . . . . . . . . . . . . . . . . . . . . . . . . . . . . . . . . . . . . . . . . . . . . . . . . . 8
Figure 14: Expenditure . . . . . . . . . . . . . . . . . . . . . . . . . . . . . . . . . . . . . . . . . . . . . . . . . . . . . . . . . . . . . . . . . . . . . . . . . . . . . 9
Figure 15: Number of full-time faculty . . . . . . . . . . . . . . . . . . . . . . . . . . . . . . . . . . . . . . . . . . . . . . . . . . . . . . . . . . . . . . 9
Figure 16: Average faculty salaries . . . . . . . . . . . . . . . . . . . . . . . . . . . . . . . . . . . . . . . . . . . . . . . . . . . . . . . . . . . . . . . . . . 9
Figure 17: Research income to New Brunswick Universities . . . . . . . . . . . . . . . . . . . . . . . . . . . . . . . . . . . . . . . . . 10
Definitions . . . . . . . . . . . . . . . . . . . . . . . . . . . . . . . . . . . . . . . . . . . . . . . . . . . . . . . . . . . . . . . . . . . . . . . . . . . . . . . . . . . . . . . . 11


3Statistical Profile of New Brunswick’s Publicly Funded Universities | Academic Year 2010 – 2011
Introduction
This statistical profile was developed in consultation with staff of New Brunswick’s four publicly funded universities, the Maritime Provinces Higher Education Commission (MPHEC), and the Department of Post-Secondary Education, Training and Labour (PETL) for the 2010 – 2011 academic year.
This profile is designed to provide insight into the publicly funded university system in New Brunswick and thus facilitate policy development by institutions and governments and alignment of future priorities in the sector. It provides a baseline by which to measure progress in years to come and a source for key performance indicators for the sector. It achieves this by consolidating and simplifying existing information regarding the sector and by making it accessible to a wide audience.
The data that forms the basis of this document has been obtained from the Canadian Association of University Business Officers (CAUBO) and the Maritime Provinces Higher Education Commission (MPHEC), and is publicly available. It has been compiled by PETL staff. Readers may wish to access more detailed data through any of the aforementioned agencies.

4
Figure 1: Consolidated enrolment characteristicsThis figure presents various attributes related to the student population within New Brunswick’s publicly funded universities for the academic year 2010 – 2011. Additional enrolment details can be found within this section.
23 505
20 909
2 596
18 924
4 581
15 898
4 3003 307
13 949
9 512
4 981
0
5 000
10 000
15 000
20 000
25 000
TotalEnrolment
UndergraduateEnrolment
GraduateEnrolment
Full-timeEnrolment
Part-timeEnrolment
New BrunswickStudents
OtherProvinces
InternationalStudents
FemaleStudents
MaleStudents
CredentialsAwarded
MPHEC, Enrolment Database 2006 – 2007 to 2010 – 2011http://www.mphec.ca/research/enrolment.aspx
Figure 2: Persistenceafter one year and graduation rate after six years. Persistence is defined as the percent of the cohort that enrolled in the same institution in subsequent years, regardless of registration status or field of study. Graduation rate is measured only within the institution of first entry.1
78%
57%
0%
20%
40%
60%
80%
100%
Percent returning after 1 year of university Percent that graduate after 6 years
MPHEC, PSIS Data
1 Graduation rate is underestimated as it only captures students at the undergraduate level who graduated from a program after six years in the same institution in which they were initially registered.

5Statistical Profile of New Brunswick’s Publicly Funded Universities | Academic Year 2010 – 2011
Figure 3: Employment rate and mobilityof graduates 2 years post graduation, class of 2007.
80%
17.5%
88% 88%
0%
20%
40%
60%
80%
100%
NB graduates Graduates from away
Stay in NB 2 years post graduation Employed
MPHEC, PSIS Data
Figure 4: Employment earningsMean annualized full-time earnings by discipline cluster, graduates surveyed two years after graduation, class of 2007.
$47 661
$52 975
$45 617$42 111
$38 120
0
$10 000
$20 000
$30 000
$40 000
$50 000
$60 000
All graduates (n = 559) Applied Arts and Sciencesor Professional Programs
(n = 286)
Commerce andAdministration
(n = 103)
Physical and Life Sciencesand Mathematics (n = 32)
Humanities, Arts andSocial Sciences (n = 138)
MPHEC Two Years on: A Survey of Class of 2007 Maritime University Graduateshttp://www.mphec.ca/resources/GFU2007in2009ProvEng.pdf
6
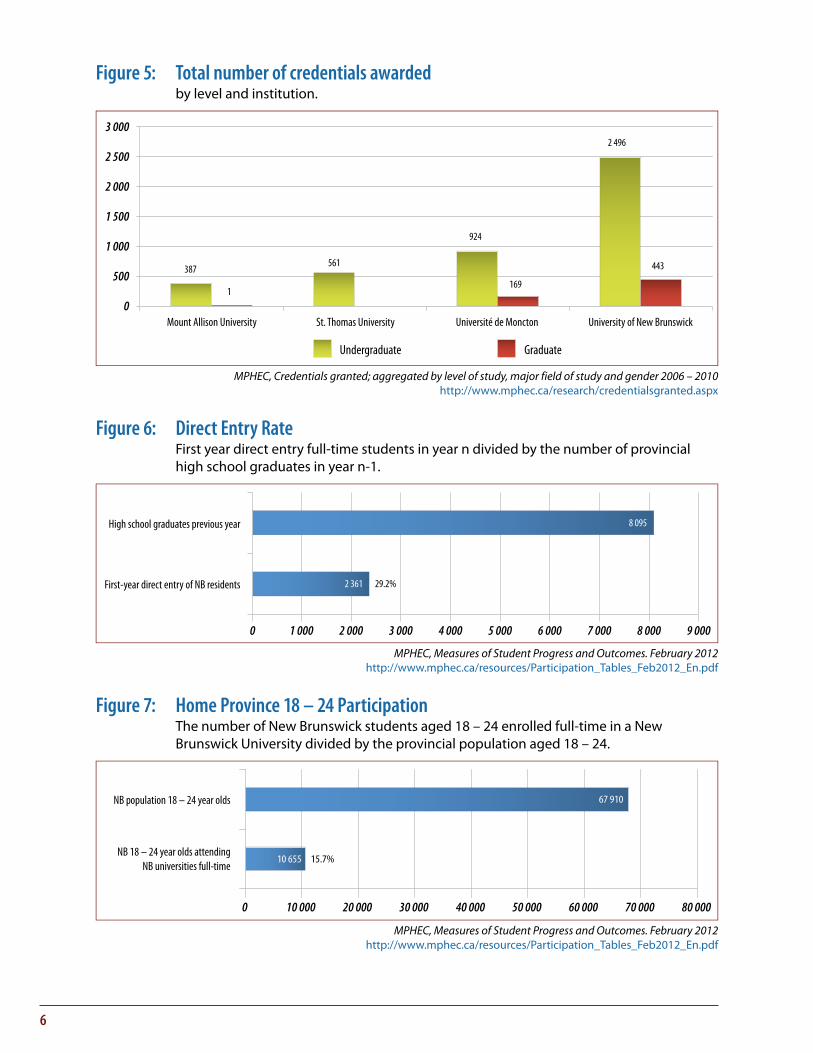
Figure 5: Total number of credentials awardedby level and institution.
387561
924
2 496
1169
443
0
500
1 000
1 500
2 000
2 500
3 000
Mount Allison University St. Thomas University Université de Moncton University of New Brunswick
Undergraduate Graduate
MPHEC, Credentials granted; aggregated by level of study, major field of study and gender 2006 – 2010http://www.mphec.ca/research/credentialsgranted.aspx
Figure 6: Direct Entry RateFirst year direct entry full-time students in year n divided by the number of provincial high school graduates in year n-1.
2 361 29.2%
8 095
0 1 000 2 000 3 000 4 000 5 000 6 000 7 000 8 000 9 000
First-year direct entry of NB residents
High school graduates previous year
MPHEC, Measures of Student Progress and Outcomes. February 2012http://www.mphec.ca/resources/Participation_Tables_Feb2012_En.pdf
Figure 7: Home Province 18 – 24 ParticipationThe number of New Brunswick students aged 18 – 24 enrolled full-time in a New Brunswick University divided by the provincial population aged 18 – 24.
10 655 15.7%
67 910
0 10 000 20 000 30 000 40 000 50 000 60 000 70 000 80 000
NB 18 – 24 year olds attendingNB universities full-time
NB population 18 – 24 year olds
MPHEC, Measures of Student Progress and Outcomes. February 2012http://www.mphec.ca/resources/Participation_Tables_Feb2012_En.pdf

7Statistical Profile of New Brunswick’s Publicly Funded Universities | Academic Year 2010 – 2011
Figure 8: Home Province ParticipationThe number of New Brunswick students enrolled full-time in a New Brunswick university divided by provincial population aged 18 – 24.
12 648
67 910
0 10 000 20 000 30 000 40 000 50 000 60 000 70 000 80 000
NB students enrolled full-time ina New Brunswick university
NB population 18-24 year olds
18.6%
MPHEC, Measures of Student Progress and Outcomes. February 2012http://www.mphec.ca/resources/Participation_Tables_Feb2012_En.pdf
Figure 9: Graduates who would choose the same institutionPercent of graduates reporting they would have chosen the same university again.
All graduates (n = 1047) 81%
Commerce and Administration (n = 183) 77%
Applied Arts and Sciences or Professional Programs (n = 473) 83%
Physical and Life Sciences and Mathematics (n = 86) 80%
Humanities, Arts and Social Sciences (n = 300) 80%
MPHEC
Figure 10: Graduate satisfaction with instruction by clusterPercent who were satisfied or very satisfied with the quality of teaching in most of their classes.
All graduates (n = 1047) 93%
Commerce and Administration (n = 183) 94%
Applied Arts and Sciences or Professional Programs (n = 473) 92%
Physical and Life Sciences and Mathematics (n = 86) 95%
Humanities, Arts and Social Sciences (n = 300) 95%
MPHEC

8
Figure 11: Income by source
Public Universities Revenue Source Percent Per Full Time Student**
Provincial Grant $213 582 000 56.4% $10 729
Course Credit Tuition $125 579 000 33.2% $6 308
Other Funding* $39 583 000 10.5% $1 988
Total General Operating Funding $378 744 000 $19 025
* Includes all other sources of operational revenue ** Total Full-Time FTE = 19 907 Students http://www.mphec.ca/resources/Enr_Table4_2010_2011E.pdf
CAUBO, 2011, Report 3.1, Income by Fund http://www.caubo.ca/resources/publications/financial_information_universities
Figure 12: Average dollars per FTE, general operating funds
$10 728
$6 308
$19 025
0
$2 000
$4 000
$6 000
$8 000
$10 000
$12 000
$14 000
$16 000
$18 000
$20 000
Provincial Grant Course Credit Tuition General Operating Funding
Source data Figure 11
Figure 13: Expenditures by source
Year 2011 Expenditures by source General Operating
Line Items General Operating %
Academic Ranks $137 776 000 38.1%
Other salaries and wages $93 527 000 25.9%
Benefits $33 925 000 9.4%
Other Instruction & Research $6 384 000 1.8%
Subtotal: Salary Expenditures $271 612 000 75.1%
Other Expenditures $90 137 000 24.9%
Total Expenditures $361 749 000 100.0%CAUBO, 2011 Report 3.2 Expenditures by Fund
http://www.caubo.ca/resources/publications/financial_information_universities
9Statistical Profile of New Brunswick’s Publicly Funded Universities | Academic Year 2010 – 2011
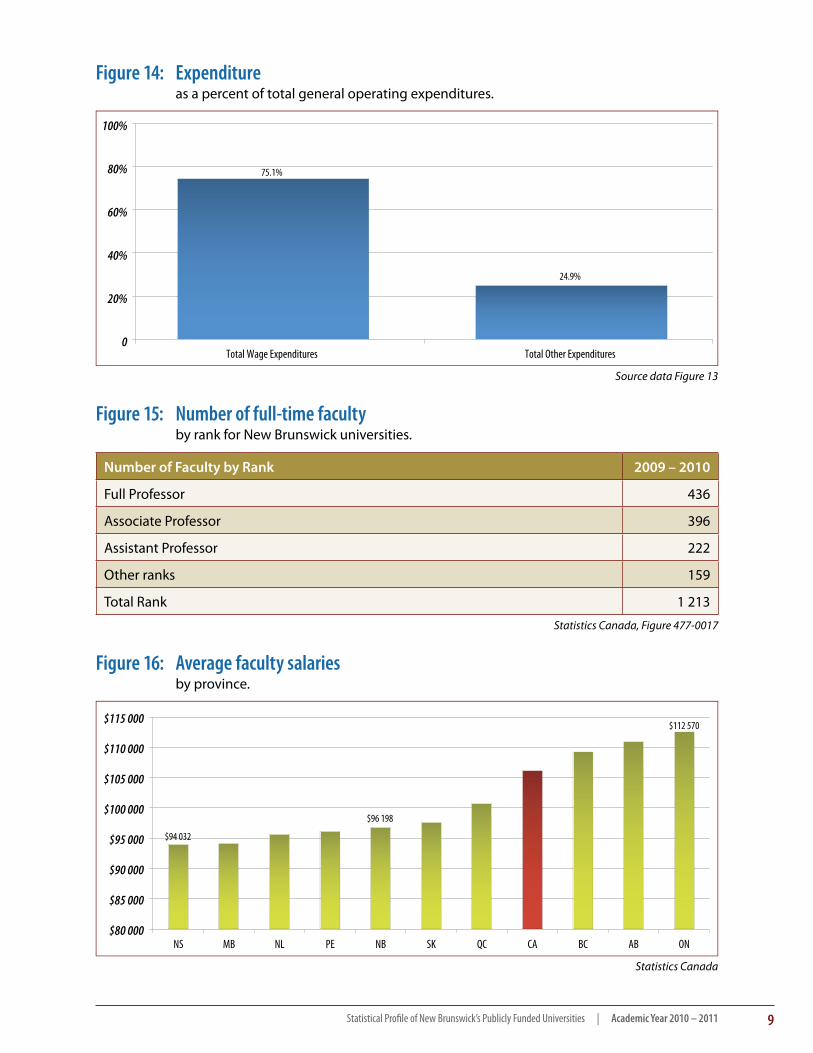
Figure 14: Expenditureas a percent of total general operating expenditures.
75.1%
24.9%
0
20%
40%
60%
80%
100%
Total Wage Expenditures Total Other Expenditures
Source data Figure 13
Figure 15: Number of full-time facultyby rank for New Brunswick universities.
Number of Faculty by Rank 2009 – 2010
Full Professor 436
Associate Professor 396
Assistant Professor 222
Other ranks 159
Total Rank 1 213
Statistics Canada, Figure 477-0017
Figure 16: Average faculty salariesby province.
$96 198
$94 032
$112 570
$80 000
$85 000
$90 000
$95 000
$100 000
$105 000
$110 000
$115 000
NS MB NL PE NB SK QC CA BC AB ON
Statistics Canada
10
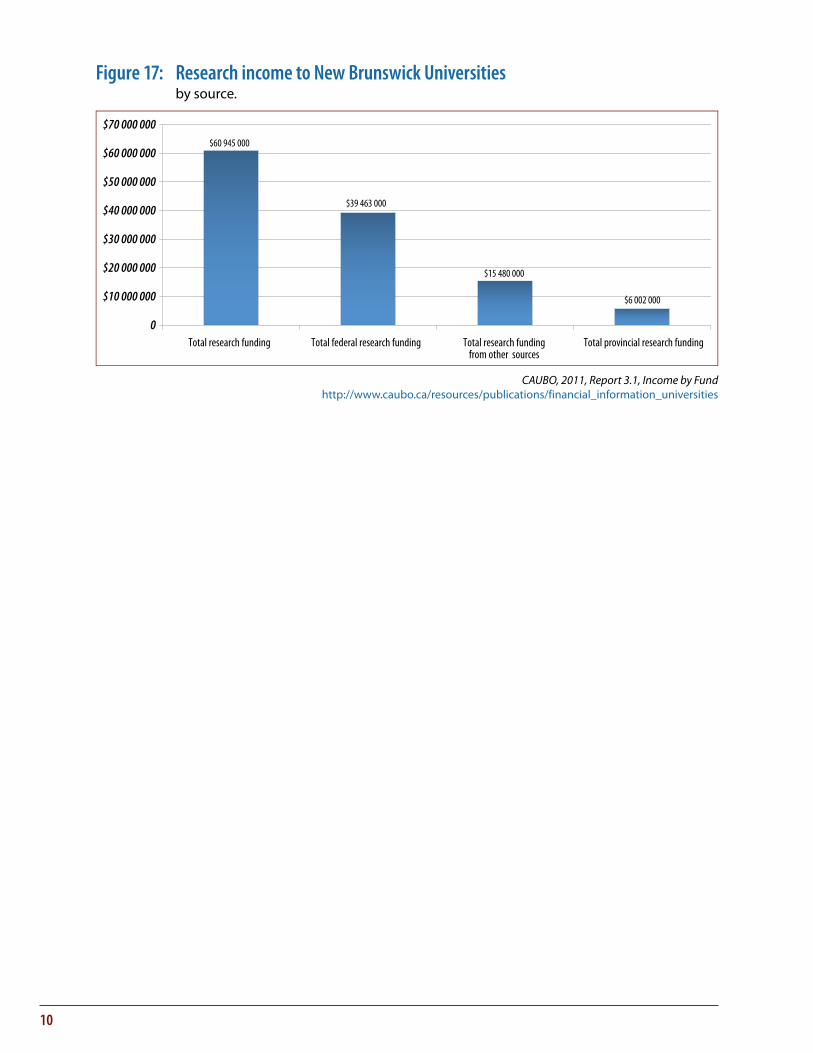
Figure 17: Research income to New Brunswick Universitiesby source.
$60 945 000
$39 463 000
$15 480 000
$6 002 000
0
$10 000 000
$20 000 000
$30 000 000
$40 000 000
$50 000 000
$60 000 000
$70 000 000
Total research funding Total federal research funding Total research fundingfrom other sources
Total provincial research funding
CAUBO, 2011, Report 3.1, Income by Fundhttp://www.caubo.ca/resources/publications/financial_information_universities
11Statistical Profile of New Brunswick’s Publicly Funded Universities | Academic Year 2010 – 2011
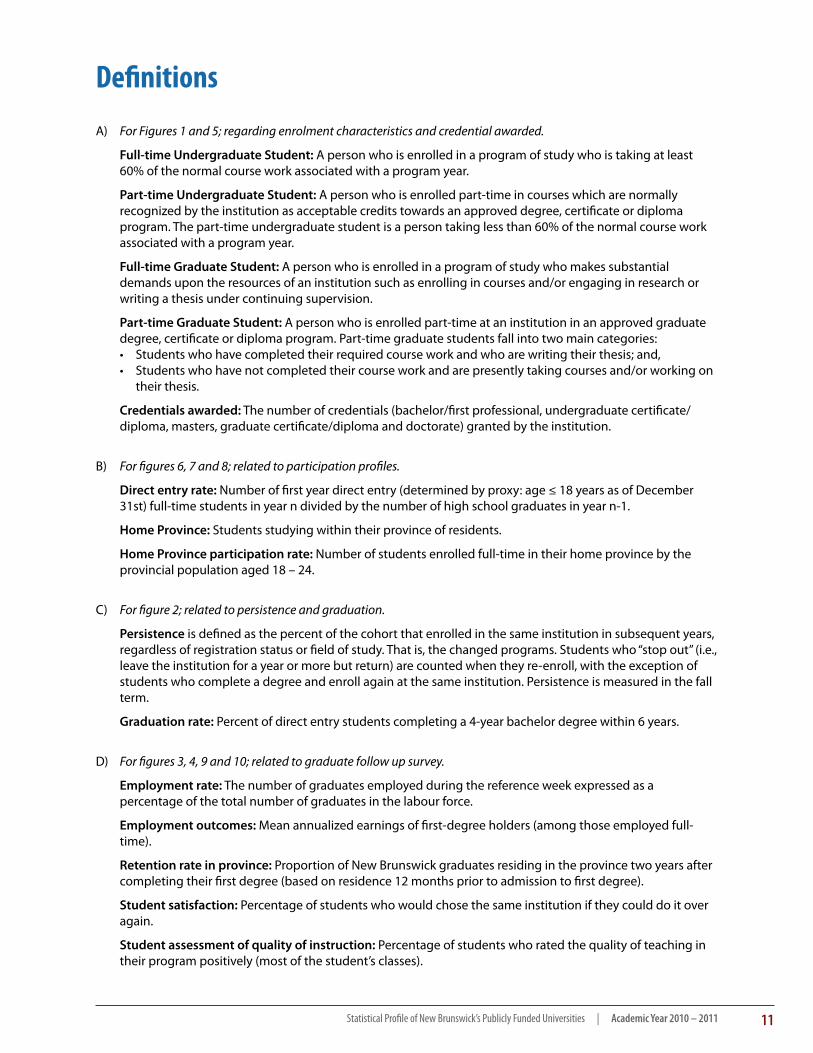
DefinitionsA) For Figures 1 and 5; regarding enrolment characteristics and credential awarded.
Full-time Undergraduate Student: A person who is enrolled in a program of study who is taking at least 60% of the normal course work associated with a program year.
Part-time Undergraduate Student: A person who is enrolled part-time in courses which are normally recognized by the institution as acceptable credits towards an approved degree, certificate or diploma program. The part-time undergraduate student is a person taking less than 60% of the normal course work associated with a program year.
Full-time Graduate Student: A person who is enrolled in a program of study who makes substantial demands upon the resources of an institution such as enrolling in courses and/or engaging in research or writing a thesis under continuing supervision.
Part-time Graduate Student: A person who is enrolled part-time at an institution in an approved graduate degree, certificate or diploma program. Part-time graduate students fall into two main categories: • Students who have completed their required course work and who are writing their thesis; and,• Students who have not completed their course work and are presently taking courses and/or working on
their thesis.
Credentials awarded: The number of credentials (bachelor/first professional, undergraduate certificate/diploma, masters, graduate certificate/diploma and doctorate) granted by the institution.
B) For figures 6, 7 and 8; related to participation profiles.
Direct entry rate: Number of first year direct entry (determined by proxy: age ≤ 18 years as of December 31st) full-time students in year n divided by the number of high school graduates in year n-1.
Home Province: Students studying within their province of residents.
Home Province participation rate: Number of students enrolled full-time in their home province by the provincial population aged 18 – 24.
C) For figure 2; related to persistence and graduation.
Persistence is defined as the percent of the cohort that enrolled in the same institution in subsequent years, regardless of registration status or field of study. That is, the changed programs. Students who “stop out” (i.e., leave the institution for a year or more but return) are counted when they re-enroll, with the exception of students who complete a degree and enroll again at the same institution. Persistence is measured in the fall term.
Graduation rate: Percent of direct entry students completing a 4-year bachelor degree within 6 years.
D) For figures 3, 4, 9 and 10; related to graduate follow up survey.
Employment rate: The number of graduates employed during the reference week expressed as a percentage of the total number of graduates in the labour force.
Employment outcomes: Mean annualized earnings of first-degree holders (among those employed full-time).
Retention rate in province: Proportion of New Brunswick graduates residing in the province two years after completing their first degree (based on residence 12 months prior to admission to first degree).
Student satisfaction: Percentage of students who would chose the same institution if they could do it over again.
Student assessment of quality of instruction: Percentage of students who rated the quality of teaching in their program positively (most of the student’s classes).