statistical models for predicting threat detection from
TRANSCRIPT
fpsyg-09-00466 April 12, 2018 Time: 16:12 # 1
ORIGINAL RESEARCHpublished: 16 April 2018
doi: 10.3389/fpsyg.2018.00466
Edited by:Stefan Sütterlin,
Østfold University College, Norway
Reviewed by:Ariel Telpaz,
General Motors, United StatesRicardo Gregorio Lugo,
Lillehammer University College,Norway
*Correspondence:Timothy Kelley
Specialty section:This article was submitted to
Cognitive Science,a section of the journalFrontiers in Psychology
Received: 21 November 2017Accepted: 19 March 2018
Published: 16 April 2018
Citation:Kelley T, Amon MJ and Bertenthal BI
(2018) Statistical Modelsfor Predicting Threat Detection From
Human Behavior.Front. Psychol. 9:466.
doi: 10.3389/fpsyg.2018.00466
Statistical Models for PredictingThreat Detection From HumanBehaviorTimothy Kelley1* , Mary J. Amon2 and Bennett I. Bertenthal2
1 Naval Surface Warfare Center, Crane Division, Crane, IN, United States, 2 Department of Psychological and Brain Sciences,Indiana University Bloomington, Bloomington, IN, United States
Users must regularly distinguish between secure and insecure cyber platforms inorder to preserve their privacy and safety. Mouse tracking is an accessible, high-resolution measure that can be leveraged to understand the dynamics of perception,categorization, and decision-making in threat detection. Researchers have begun toutilize measures like mouse tracking in cyber security research, including in the study ofrisky online behavior. However, it remains an empirical question to what extent real-timeinformation about user behavior is predictive of user outcomes and demonstrates addedvalue compared to traditional self-report questionnaires. Participants navigated throughsix simulated websites, which resembled either secure “non-spoof” or insecure “spoof”versions of popular websites. Websites also varied in terms of authentication level (i.e.,extended validation, standard validation, or partial encryption). Spoof websites hadmodified Uniform Resource Locator (URL) and authentication level. Participants choseto “login” to or “back” out of each website based on perceived website security. Mousetracking information was recorded throughout the task, along with task performance.After completing the website identification task, participants completed a questionnaireassessing their security knowledge and degree of familiarity with the websites simulatedduring the experiment. Despite being primed to the possibility of website phishingattacks, participants generally showed a bias for logging in to websites versus backingout of potentially dangerous sites. Along these lines, participant ability to identify spoofwebsites was around the level of chance. Hierarchical Bayesian logistic models wereused to compare the accuracy of two-factor (i.e., website security and encryptionlevel), survey-based (i.e., security knowledge and website familiarity), and real-timemeasures (i.e., mouse tracking) in predicting risky online behavior during phishingattacks. Participant accuracy in identifying spoof and non-spoof websites was bestcaptured using a model that included real-time indicators of decision-making behavior,as compared to two-factor and survey-based models. Findings validate three widelyapplicable measures of user behavior derived from mouse tracking recordings, whichcan be utilized in cyber security and user intervention research. Survey data alone arenot as strong at predicting risky Internet behavior as models that incorporate real-timemeasures of user behavior, such as mouse tracking.
Keywords: threat detection, statistical models, phishing, mouse tracking, human dynamics, cyber security,cyberpsychology
Frontiers in Psychology | www.frontiersin.org 1 April 2018 | Volume 9 | Article 466

fpsyg-09-00466 April 12, 2018 Time: 16:12 # 2
Kelley et al. Statistical Models for Predicting Threat Detection
INTRODUCTION
Phishing is an attempt to steal an individual’s sensitive andpersonal information via social engineering and technicaldeception, such as mimicking a legitimate and trustworthy entitylike a bank. These attacks often originate from emails—alsodesigned to appear to come from a legitimate source—thatcontain links to malicious websites. Search engine results canalso lead people to phishing websites (Myers, 2006; Ramzan,2010). Phishing remains a significant risk despite many technicalattempts to alert users to potential dangers. A recent report on thecost of phishing estimated the annual cost for a large companyto be $3.7 million dollars (Ponemon Institute, 2015). Furtherinvestigation shows that there is a large market for personal data,with fresh credit card data fetching between 20 and 45 dollars percard (Ablon et al., 2014). The total number of phishing attacksin 2016 was 1,220,523 representing a 65% increase over 2015(Anti-Phishing Working Group [APWG], 2016).
Email servers are designed to filter potential scam emails inorder to protect users from phishing attempts. The filters arenot perfect, however, and even though only a small portion ofphishing emails reach individuals’ in-boxes, there are still enoughindividuals that click on the malicious links to sustain phishingfraud as a profitable venture (Kanich et al., 2008; Herley andFlor, 2010). While general phishing attacks have low successrates, attacks that utilize contextual information so it appears tocome from a legitimate and known source greatly increases thelikelihood the email will get through a filter and an individual willvisit a malicious website and enter their information (Dhamijaet al., 2006; Jagatic et al., 2007).
Web browsers use domain name and security indicators thatidentify whether users are at the intended website, whethera page is encrypted (i.e., electronic data is converted into aform that is not easily intercepted), and third party vettingof domain ownership (e.g., a website has extended validation).These indicators fail for a variety of reasons. Even web designersfrom popular websites often construct legitimate websites thatbehave in a manner similar to malicious websites. For example,some websites will redirect users to login screens that have adifferent domain name than the originating webpage, makingit potentially difficult to for users identify the validity of thelogin screen (Stebila, 2010). If an individual has a history ofvisiting a given site, they will ignore warnings that the site isinsecure, demonstrating more trust in the site than the browser’salerts (Almuhimedi et al., 2014). Furthermore, the nature ofinformation that security indicators communicate is somewhattechnical and designed primarily for experts (Garg and Camp,2012). These factors lead to increased uncertainty and manypeople, including technically savvy individuals, fall for phishingemails and enter their credentials at malicious websites on a dailybasis (Jagatic et al., 2007; Stebila, 2010).
Despite the availability of security indicators, users are notguaranteed to understand, attend to, or respond appropriatelyto these cues. For example, Sheng et al. (2010) instructedparticipants to conduct banking tasks online, either role playingor using their real online credentials. Participants receivedincreasingly alarming cues throughout the task, suggesting
their connection was insecure. Cues ranged from a missing“https,” a missing site-authentication image, and a warningpage. Participants who role-played the task were more likelyto engage in risky online behavior, as compared to those whoused their own accounts and passwords. However, even thoseusing their real login information (92%) tended to ignore missing“https” and site-authentication images, suggesting that manysecurity indicators are not effectively utilized (Schechter et al.,2007). In another study, participants navigating a series ofsimulated websites that varied in terms of security warningssuccessfully detected only 53% of phishing websites, even thoughthey were explicitly instructed to identify the insecure websites(Alsharnouby et al., 2015). Moreover, Whalen and Inkpen (2005)found that participants displayed virtually no attention to securityindicators without first priming them to the risk of maliciouswebsites.
There have been numerous studies that examine technicaland practical security knowledge as well as other demographicinformation that modulate the effectiveness of “spoof” websites,or hoax websites that appear to look like those belongingto a different person or organization. Many of these studiesexamine the relationship between an individual’s self-reportedonline activity, demographic characteristics, and knowledge ofsecurity through survey measures (Downs et al., 2007; Shenget al., 2010; Wright and Marett, 2010). However, survey datareflecting, for example, self-reported security knowledge, is notnecessarily a good predictor of behavior during phishing attacks.Kelley and Bertenthal (2016b) found that participants with highsecurity knowledge were better than those with low securityknowledge at identifying spoof websites, but were not better atidentifying sites lacking encryption information. Furthermore,participants were more likely to login to non-spoof websites ifthey were familiar, but familiarity did not affect responses tospoof websites. These findings demonstrate that a high degreeof security knowledge cannot ensure that users will consistentlyattend to and appropriately respond to all relevant factors thatindicate security risk. Moreover, recent findings suggest thatadditional dynamically changing factors such as fatigue, cognitiveload, and attention modulate the effects of security knowledge(e.g., Vishwanath et al., 2011, 2016; Kelley and Bertenthal, 2016a).
Researchers are increasingly looking to behavioral measuresto gain a better understanding of users’ decision-making. Real-time measures such as eye movements, mouse movements, andphysiological recordings like heart rate or pupillary responsescan be used to quantify different aspects of decision-making. Forexample, Sobey et al. (2008) were among the first to employeye-tracking technology to better understand the utilization ofsecurity indicators, finding that extended validation securityindicators drew little attention from users without a modifiedweb browser. By contrast, the ability to detect phishing websitesis associated with an increase in gaze time directed toward thesesecurity indicators, such as a padlock or https (Alsharnouby et al.,2015); also, users with greater security expertise tend to gaze atsecurity indicators longer (Arianezhad et al., 2013).
Mouse tracking is another viable measure of user behaviorin that it does not typically require equipment outside ofthe computer interface and can be applied remotely (e.g., via
Frontiers in Psychology | www.frontiersin.org 2 April 2018 | Volume 9 | Article 466
fpsyg-09-00466 April 12, 2018 Time: 16:12 # 3
Kelley et al. Statistical Models for Predicting Threat Detection
Amazon’s Mechanical Turk data collection tool) (Dale andDuran, 2011). Rather than motor movements reflecting the finalstage in decision making, motor movements are continuouslyupdated based on cognitive processing, reflecting a thoughtprocess that evolves throughout a given task (Goodale et al.,1986; Cisek and Kalaska, 2005; Song and Nakayama, 2006;Freeman et al., 2011). The cognitive dynamics of the decisionprocess can be inferred from the mouse trajectories, repeatpatterns, velocity, and switches in direction. McKinstry et al.(2008) used a mouse-tracking experiment to demonstrate therelationship between cognitive dynamics and arm movements.They asked participants to indicate the truthfulness of astatement by moving their mouse to a “yes” or “no” locationon a computer monitor. Greater uncertainty was associatedwith broader distributions, greater absolute curvatures, andlower peak velocities of mouse movements. In other words,when a participant was relatively uncertain about a statement’struthfulness, their mouse movement tended to be slowerand wander more. In this context, arm movement reflectscontinuously updated motor commands during a dynamic, high-level decision-making process (McKinstry et al., 2008).
Several recent papers have used mouse tracking to inform ourunderstanding of risky online behavior. Iuga et al. (2016) usedmouse-tracking heat maps to hypothesize about the potential lackof mouse focus in areas of interest corresponding to securityindicators. In addition, Kelley and Bertenthal (2016a) analyzedparticipants’ mouse trajectories to assess how websites weresearched before a decision was made to login or back out ofa specific website. The results revealed that mouse trajectoriesdiffered as a function of the encryption level specified in thebrowser chrome and also as a function of whether the domainnames were correct or spoofed. In essence, mouse trajectorieswere used as a second set of dependent variables in this researchand covaried with the accuracy of the participants’ responses.
It remains an empirical question as to whether this real-timeinformation about user behavior could also serve as a predictorof threat detection by users. The present study compares theaccuracy of naïve, survey-based, and real-time measures modelsin predicting risky online behavior during phishing attacks.Mouse tracking is used as a relatively novel yet highly accessiblemeasure of dynamic user behavior during phishing scenarios.We apply this technique while users visit different websites anddecide whether or not to login by moving a mouse to one of twodifferent locations depending on whether they want to login orback out.
The experiment was designed to protect users from anyreal online risks while web-surfing, but this compromises theecological validity of the study because freedom from riskreduces cognitive load and stress while making decisions. Asa consequence, we introduced rewards and penalties such thatusers experienced the risks and advantages of logging in tovarious websites. Participants were motivated to move quicklythrough the experiment in order maximize their payout, andwere penalized for incorrectly responding to spoof and non-spoofwebsites. Thus, the experiment was designed to include timepressure often encountered in everyday life while also makingit “risky” for participants to incorrectly respond to spoof and
non-spoof websites. After completing the website identificationtask, participants completed a questionnaire assessing theirpractical and technical security knowledge, knowledge of securityindicators, and degree of familiarity with the websites simulatedduring the experiment. Given our previous research (Kelley andBertenthal, 2016a,b) indicating that participants often ignoresecurity indicators, it was hypothesized that participants wouldnot perform better than chance at identifying insecure, or “spoof,”websites and would demonstrate a bias toward logging in towebsites. It was also expected that a model utilizing knowledgeof security indicators and website familiarity would be morepredictive of risky online behavior than a two-factor modelincluding only information specified by the experimental design(i.e., spoof vs. non-spoof websites and variations in securityindicators). Lastly, it was hypothesized that a model utilizing real-time indicators of mouse tracking behavior would provide thebest predictive value of risky online behavior during potentialphishing attacks.
MATERIALS AND METHODS
ParticipantsParticipants were recruited from Amazon’s Mechanical Turkusing a protocol approved by Indiana University’s InternalReview Board. Participants were eligible to take part in the studyif they were 18 years or older, fluent in English, and utilizeda Mozilla Firefox browser. The initial sample consisted of 214participants. Before data analysis, 41 participants were excludedfrom the study for not completing the task. An additional50 participants were excluded from analysis for only makingone type of response to all websites (e.g., for all websites theparticipant chose to press ‘login’). The final sample included datafrom 123 participants. Forty-one percent of participants in thefinal sample were female, and participants had a median age of 30(95% UI = 18, 53).
For completeness we evaluated the models with both the finalsample and the larger sample of all participants that completedthe study (N = 173). The full sample of participants thatcompleted the task was similar to the reduced sample. Forty-twopercent of participants were female, and the median age was also30 (95% UI = 18, 54).
StimuliWebsite images were consistent with those presented on a MozillaFirefox browser, and participants were required to use Firefoxthroughout the task. Adobe Photoshop CS6 13.0.1 ×64 wasused to create spoof and non-spoof versions of six differentwebsites at 1920 × 1080 pixel resolution. There was one spoofand one non-spoof website for each of the following threeauthentication levels: (1) Extended validation (EV) displayeda green lock and “https.” This configuration indicates thatthe website has had extended vetting by a certificate authorityand full encryption, respectively, (2) Standard validation (SV)displayed a gray lock and “https” indicating domain validationonly and full encryption, and (3) Partial encryption (PE)displayed a triangle with exclamation mark, indicating that some
Frontiers in Psychology | www.frontiersin.org 3 April 2018 | Volume 9 | Article 466

fpsyg-09-00466 April 12, 2018 Time: 16:12 # 4
Kelley et al. Statistical Models for Predicting Threat Detection
(unknown) elements of the website were encrypted. All stimulusconfigurations were consistent with those that are technicallyfeasible on the Internet. For example, the URL bar could not lista URL beginning with “https” and display a partial encryptionindicator. Similarly, spoof conditions displaying an extendedvalidation certificate could not point to a non-spoofed entity (i.e.,ebuy.com’s extended validation certificate would list ebuy as itsvalidated entity, but it could not list eBay as the verified entity).Matched versions of the spoof and non-spoof websites werecreated by altering one letter of the domain name for the spoofwebsite’s URL (see Figure 1), and, if necessary, manipulatingthe owner of the extended validation certificate. HTML imagemaps were used to simulate functionality in the websites’ loginand back buttons on the simulated browser. The stimuli werepresented to participants in a pop-up window with the MozillaFirefox browser disabled to minimize confusion between thesimulated websites’ browser chrome and the participants’ actualbrowser. The disabled browser also prevented participants fromreloading pages or navigating backward or forward through theexperimental stimuli.
ProcedureParticipants were presented with a novel two-alternative forced-choice paradigm where they were asked to decide whether ornot to login to a series of websites based on their judgment ofthe website’s security. Participants received $2.00 for completingthe study and received bonus pay for completing the task asquickly and accurately as possible. Each participant had theopportunity to earn $8.00 in bonus pay, but this bonus paydecreased linearly with the time it took participants to completethe task. Incorrect responses resulted in time penalties. Logginginto an insecure website resulted in a 10 s penalty, while clickingon the back button for a legitimate website resulted in a 20 spenalty. Differences in penalty time were driven by pilot testswhich showed that, given the fixed location of the simulated backbutton, participants could respond with a back response muchquicker than a login response.
The average bonus pay received was $2.34 (95% UI = $0.00,$4.83). The average time it took to respond per site was 9.04 s(95% UI = 3.52, 27.2), and the mean total time to completethe task was 54.2 s (95% UI = 25.1, 99.1). Bayesian correlations
FIGURE 1 | Example website manipulations. The top image depicts alegitimate website, with both a valid URL in bold and extended validation (EV)certificate in green text. The bottom image depicts a sample spoof websitewith modified URL and EV certificate (Kelley and Bertenthal, 2016b).
showed no effect of total time on accuracy (β = −0.0002; 95%UI = −0.002, 0.001) nor an effect of mean time per site onaccuracy (β = 0.002; 95% UI = −0.003, 0.008). Unsurprisingly,a participants’ total time had a negative effect on their total bonuspay with each additional second spent reducing the bonus pay byabout $0.04 (β =−0.04; 95% UI =−0.05,−0.03).
On each trial, participants were first presented with a “starttrial” screen containing only a “start trial” button. On the“start trial” screen no timers were running. Once participantsclicked on the “start trial” button, they were presented withthe Homepage of a simulated website. They then had to clickon an active login link, which advanced the experiment to thesecond page where participants had to choose between logginginto the website by clicking either the “sign in” or “back” button.If participants decided that the site was secure, they clickedon the “sign in” button, but if they decided that the site wasinsecure, they clicked on the “back” button. Presenting theHomepage of the website followed by the login page ensured thatall participants would begin each trial with their mouse curser atthe same location. The locations of the “start trial” and “back”buttons were constant across all the trials, but the locations of thelogin link and “sign in” buttons varied across trials.
Once participants decided whether the website was secure ormalicious and clicked on the corresponding button (i.e., loginor back, respectively), the screen advanced to the next “starttrial” screen. After finishing six trials, participants completeda survey including demographic (e.g., age, gender), securityknowledge, and website familiarity questions. Self-reported useof security indicators was computed from the number ofcorrect and incorrect security indicators identified in the survey(#correct indicators+1/#incorrect indicators+1) resulting in anindicator score ranging from 0.2 to 4.0. Security knowledgewas assessed through 10 multiple-choice questions on formalknowledge of information security (e.g., what type of math isused in the RSA algorithm) resulting in a score from 0 (nonecorrect) to 1 (all correct) (Ben-Asher and Gonzalez, 2015). Thewebsite familiarity questions asked participants to indicate theirlevel of familiarity with the websites that were presented onthe six trials. Participants rated their familiarity with a givenwebsite using a five-point Likert scale ranging from 1 = notfamiliar to 5 = very familiar. The survey included additionalquestions focusing on self-reported technical experience, butthey were not used in this experiment because the securityknowledge questions provided a single continuous predictor oftechnical experience rather than numerous ordinal or categoricalpredictors.
DesignEach participant was presented with three spoof and three non-spoof trials, hereafter referred to as “site type.” Within eachof these two conditions, there was one website for each of thefollowing three authentication level conditions: (1) ExtendedValidation (EV), (2) Standard Validation (SV), and (3) PartialEncryption (PE). Stimuli were presented to participants in acounter-balanced design with half of the participants viewing thesame three spoof websites and the same three non-spoof websitesin random order, and the other half of the participants viewing
Frontiers in Psychology | www.frontiersin.org 4 April 2018 | Volume 9 | Article 466

fpsyg-09-00466 April 12, 2018 Time: 16:12 # 5
Kelley et al. Statistical Models for Predicting Threat Detection
the reverse (i.e., spoof version of the non-spoof websites and viceversa).
Models and AnalysesThe present research examines the added value of including real-time measures of the decision-making process in predicting theidentification of phishing websites. To this end, three differentmodels of participants’ ability to identify malicious websites werecompared. All three models were hierarchical Bayesian logisticregression models using participants as partially pooled group-level predictors with individuals’ ability to correctly identifymalicious websites (i.e., accuracy) as the dependent measure.Each model used robust, weakly informed Student-t priors withthree degrees of freedom. Coefficient priors had a scale of five,while priors for the intercepts had a scale of 10 (Gelman et al.,2008; Ghosh et al., 2017).
The first model, dubbed “two-factor model,” testedparticipants’ accuracy as a function of the experimentalmanipulations (i.e., site type and authentication level) as well asthe group-level predictors. The second, “survey-based” model,tested participants’ security knowledge and their familiarity withthe websites in addition to the predictors included in the firstmodel. The third, “real-time measures” model, included thepreviously mentioned predictors, in addition to three real-timemeasures of mouse movement: area under the curve (AUC),sample entropy (SE), and response time (RT) to login or backout of the website. Descriptive statistics for each individualpredictor are found in Table 1. Any differences between themodels analysis using the selected sample and the full sample ofparticipants that completed the study are noted in the relevantmodel analysis section.
Interpretations of the regression coefficients can be done in thestandard manner of adding the coefficients together starting fromthe intercept. For example, each model intercept correspondsto the average accuracy in the non-spoof, standard validationcondition, with all continuous measures centered at 0. To look atthe difference in accuracy in the non-spoof/spoof manipulation,one would compare βintercept and βintercept + βspoof. Since theparameter estimates are on the logistic scale, one can use theinverse logistic function to convert the estimates back to aprobability. Since we are using Bayesian analysis, another wayto investigate the parameter estimates is to sample directly fromthe posterior distribution given the parameter values of interest.Sampling the posterior is often easier than trying to calculate allthe values in the regression equation, and is used to generate themodel figures.
We used Bayesian statistics wherever possible. One of theadvantages of using a Bayesian approach is that it gives a broadnumber of solutions for examining models (Gelman and Rubin,1995). In particular, a Bayesian analysis provides evidence for amodel based on the data, which allows comparison with othermodels, rather than comparison against a null model (Myung andPitt, 1997; Rouder et al., 2009; Kass and Raftery, 2015; Moreyet al., 2016b). Bayesian analysis also allows us to use properconfidence intervals, while mitigating the problems with multiplecomparisons (Gelman et al., 2012; Hoekstra et al., 2014). Wecall the confidence intervals uncertainty intervals to highlight the
fact that the interval being reported represents the uncertaintyof the estimation; wider distributions mean greater uncertaintyabout the actual estimation. This makes reading the uncertaintyintervals of an estimation straightforward. We use α = 0.05throughout the paper. Since we have proper uncertainty intervals,an estimated parameter value has (1−α)% chance of falling withinthe given uncertainty interval (Morey et al., 2016a; Kruschke andLiddell, 2017).
To ascertain the evidence for a given model, we use theexpected log-pointwise predictive density (ELPD). As the ELPD,or log-likelihood, in a model increases, it indicates that the modelis more probable given the data. ELPD has the advantage overusing mean-squared error to evaluate models in that ELPD canbe applied to models that are not normally distributed. ELPDalso allows models to be compared equivalently and supportscontinuous model expansion and evaluation rather than specificmodel selection (Gelman et al., 2013b). ELPD in standard analysisis usually a pointwise estimate, say a maximum likelihoodestimate, but, since we have the posterior distributions, we canexamine the distribution of ELPD for each set of samples.
In addition to ELPD, we also use posterior predictive checkingon the generated contingency tables to assess model accuracy.Model accuracy is the number of true positives and true negativespredicted over the total number of predictions. Due to the smallamount of data in our sample we use 10-fold cross-validationto assess model performance with the in-and-out-of-sample datafor both ELPD and model accuracy. In-sample data are thedata the model is trained on, while out-of-sample data are heldout of the training and used to test the model’s fit. While thisapproach does not completely remove the biased estimate fromlooking at in-sample predictive accuracy, it somewhat balancesthe difficulties of evaluating out-of-sample predictions in sparsedata and over-estimating the predictive power of a model.
MeasuresIn each model, individual participants’ accuracy was used asa group-level predictor of accuracy. Thus, the models utilizeparticipants’ observed behavior, but treat that behavior assomewhat homogeneous between participants. This allows themodels to include any similarities between predictor levels,at the expense of higher variance. Given the few number oftrials in each condition, however, this is useful tradeoff toavoid overfitting (Gelman et al., 2013a). In addition, all threemodels utilized site type (non-spoof/spoof) and authenticationlevel (PE < SV < EV) as predictors of accuracy. In this casesite type was a two-level factor and authentication level wastreated as an ordinal factor with three levels. Partial encryptioncontains less authentication information than full encryption,which contains less information than extended validation. Thesecond and third models included survey-based predictors ofaccuracy (i.e., security knowledge and website familiarity).
Response time, AUC, and SE were added to the third model asreal-time predictors of login accuracy. All three of these measureshave been used to demonstrate the effects of conflicting optionson final decisions (Freeman et al., 2008). Rather than examiningthe end product of the decision, both AUC and SE measuredifferent characteristics of mouse behavior leading to the final
Frontiers in Psychology | www.frontiersin.org 5 April 2018 | Volume 9 | Article 466

fpsyg-09-00466 April 12, 2018 Time: 16:12 # 6
Kelley et al. Statistical Models for Predicting Threat Detection
TABLE 1 | Correlation and descriptive statistics (N = 736).
Variables Accuracy Knowledge Familiarity AUC SE RT
Accuracy –
Knowledge 0.20∗∗∗ –
Familiarity 0.11∗∗ −0.01 –
AUC −0.07 0.02 −0.11∗∗ –
SE −0.07 0.07 −0.00 0.28∗∗∗ –
RT (s) 0.04 0.04 −0.07 0.12∗∗ 0.00 –
M 0.64 0.52 3.17 1.31 −2.34 8.96
SD 0.48 0.25 1.60 1.29 0.65 0.51
Range 0 – 1 0.1 – 1.0 1 – 5 −2.34 – 4.67 −5.58 – −0.72 7.74 – 11.37
∗∗∗p < 0.001, ∗∗p < 0.01, ∗p < 0.05.
decision, while RT is a measure of the time it takes an individualto make their final response. In this case, RT was calculated as thetime between the login page first appearing and the time whenparticipants clicked a final response.
To account for different screen sizes and resolutions, eachmouse trajectory was normalized by scaling the straight-lineresponse from the click to load the final login page and the finalresponse click to a unit vector. The optimal responses were thenrotated to fall along a 45◦ angle from origin for login responsesand a 135◦ angle for back response. This scales all trajectories tothe same state space beginning at the origin with the distance ofthe optimal path being 1, and allows trajectories to be comparedon the same scale. Example normalized login responses are foundin Figure 2.
Area under the curve is the area formed by connecting theactual mouse trajectory and a straight-line path between the startof the trajectory and its end. Trajectories with high AUC deviatefurther from straight-line paths than do trajectories with lowAUC (Figure 2). Previous research indicates that higher AUCcorresponds to higher uncertainty in each response, while lowerAUC corresponds to more certain responses (Dale et al., 2007;
Freeman et al., 2010, 2011). In the current research, a participantmay start out at the top right of the screen and move in an arctoward the back button (top left of the screen) before curvingthe mouse toward the final login response. Given that that thepresence of security indicators has previously been shown toaffect participants’ AUC when responding to phishing websites,this research attempts to use AUC as an independent predictorto better understand the decision-making process in differentsituations (Kelley and Bertenthal, 2016b).
Sample entropy is another tool for examining the dynamics ofmouse trajectories during decision making and can be seen as a“complexity index” (Richman and Moorman, 2000). Trajectoriesthat are more complex or irregular have higher sample entropies,while less complex trajectories have low SE and appear assmooth curves in this application (Figure 2). Since standardSE is sensitive to input parameters, multi-scale sample entropy(MSSE) was used as a more robust measure that accounts fordifferent radii and dimensional encodings (Yentes et al., 2013).SE was calculated on the distance of each point from the finalresponse. This takes into account both x and y motion. The finalSE was taken as the MSSE calculated using radii from 0.01 of the
FIGURE 2 | Sample entropy (SE) and area under the curve (AUC) of sample mouse trajectories. The black lines represent Mouse trajectories and shaded areasrepresent the AUC. Trajectories with high SE (left column) are more variable; low SE trajectories are smooth curves (right column). High AUC trajectories (top row)deviate further from a hypothetical straight-line trajectory than those with low AUC (bottom row).
Frontiers in Psychology | www.frontiersin.org 6 April 2018 | Volume 9 | Article 466

fpsyg-09-00466 April 12, 2018 Time: 16:12 # 7
Kelley et al. Statistical Models for Predicting Threat Detection
sample standard deviation (a very local measure) to 0.25 of thesample standard deviation (a more global measure), dimensionalencodings between 2 and 8, and a Theiler Window based onautocorrelation as described in Theiler’s work on the dimensionsof strange attractors (Theiler, 1986).
As with AUC, SE has been used to observe the effects ofuncertainty between competing views in decision-making tasks(Dale et al., 2007; McKinstry et al., 2008). In this research,increases in SE could correspond to increases in uncertaintyin identifying a spoof website. Higher SE would correspondto more switches in direction. For example, a participantwith higher uncertainty between choices may show behaviortoward login, then move toward the back button, beforefinally switching back to click on the login button. IncludingSE as an independent measure allows for the exploration ofdifferent types of correct or incorrect responses. For example,there may be conditions that interact with SE to createlow SE errors—incorrect responses because the participantis too certain—and high SE errors—incorrect responses dueto too much uncertainty. Figure 2 summarizes the types ofmouse trajectories produced by different combinations of SEand AUC.
RESULTS
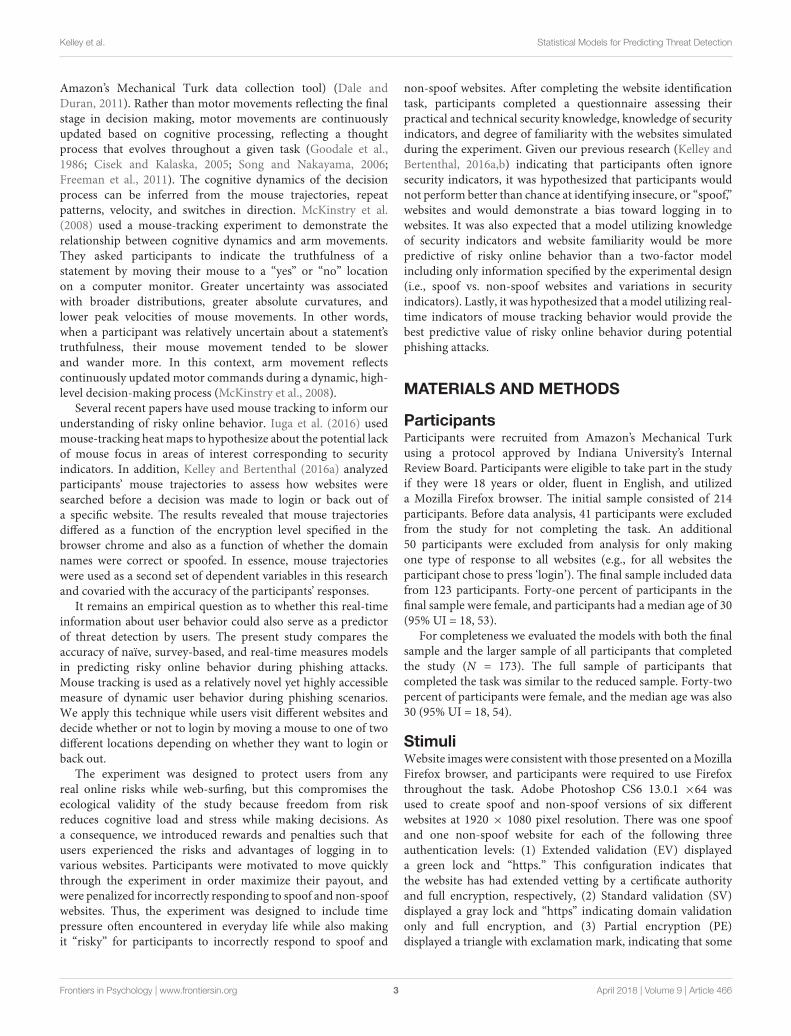
AccuracyMean accuracy in identifying spoof and non-spoof websites was0.64 (95% UI = 0.17, 1.00). The finding that mean accuracywas above 0.50 was due primarily to high accuracy in the non-spoof condition (µ = 0.79, 95% UI = 0.33, 1.00); accuracy in thespoof condition was at chance (µ = 0.49, 95% UI = 0.00, 1.00).The results also revealed a strong bias to login regardless of thesecurity indicator.
Accuracy in the spoof condition decreased as a function ofencryption level (PE < SV < EV), and it also varied non-monotonically with encryption in the non-spoof condition (seeFigure 3). In the spoof condition, there was nearly 60% accuracywith partial encryption (µ = 0.59, 95% UI = 0.00, 1.00), butaccuracy declined with standard validation (µ = 0.47, 95%UI = 0.00, 1.00), and declined even further with extendedvalidation (µ = 0.41, 95% UI = 0.00, 1.00). This findingsuggests that false confidence in the security of the websitemight increase with the level of encryption. Bayesian t-testsshowed that responses in extended validation were credibly lessaccurate than both standard validation (µEV−SV = −0.08, 95%UI = −0.15, −0.01) and partial encryption (µEV−PE = −0.21,95% UI = −0.28, −0.15). Extended validation responseswere also found to be credibly less accurate than partialencryption responses (µSV−PE = −0.14, 95% UI = −0.20,−0.06). Note that a credible difference (similar to a significantdifference in frequentist statistics) is concluded when the95% uncertainty interval (UI) does not include an effectsize of 0.
In the non-spoof condition, accuracy was highest withstandard validation (µ = 0.87, 95% UI = 0.00, 1.00), but lowerfor partial encryption (µ = 0.74, 95% UI = 0.00, 1.00) and
extended validation (µ = 0.77, SD = 95% UI = 0.00, 1.00).Bayesian t-tests revealed that response accuracy was reliablygreater with standard validation as opposed to either partialencryption (µSV−PE = 0.13, 95% UI = 0.09, 0.18) or extendedvalidation (µSV−EV = 0.11, 95% UI = 0.06, 0.15). There wasno credible difference between partial encryption and extendedvalidation response accuracy (µEV−PE = 0.005, 95% UI = −0.05,0.06).
Security Knowledge and WebsiteFamiliarityOn average, participants answered 49.8% of the questionsassessing security knowledge correctly (SD = 25%). Increasedsecurity knowledge was associated with increased accuracy inidentifying websites across all trials
[r(736) = 0.2, p < 0.001
].
This was true in both spoof[r(367) = 0.25, p < 0.0001
]and
non-spoof conditions[r(367) = 0.18, p < 0.001
].
Familiarity with a given website was also associated withgreater accuracy when identifying websites. This measureranged between 1 (not familiar) and 5 (very familiar) andaveraged (µ = 3.17, SD = 1.60) across all trials. Greaterfamiliarity with a given website covaried with accuracy[r(736) = 0.11, p < 0.01
]. This relation was significant in both
the spoof[r(367) = 0.11, p < 0.05
]and non-spoof conditions[
r(367) = 0.17, p < 0.001].
Security knowledge and website familiaritywere not significantly correlated with one another[r(736) =− 0.01, p = 0.83
]. Self-reported use of security
indicators was not found to be associated with accuracy asa function of either authentication level or non-spoof/spoofcondition. Since there was no correlation between indicatorscore and accuracy, this score was not used as a predictor inthe tested models. By contrast, both security knowledge andfamiliarity were found to be correlated with increases in accuracyfor at least one of the two independent variables, and thus theywere both included in the survey-based model and real-timemeasures model.
Real-Time MeasuresReal-time measures were associated with accuracy, but thisrelation was modulated by the non-spoof versus spoofcondition. AUC was not correlated with accuracy collapsedacross conditions [r(736) = −0.07, p = 0.06; MAUC = 8.09,SDAUC = 12.09] or in the non-spoof condition [r(367) = 0.08,p = 0.14]. In the spoof condition, however, increased AUC waslinearly associated with decreased accuracy, [r(367) = −0.26,p < 0.001]. Even though AUC was not correlated with accuracycollapsed across conditions, higher AUC was correlated witha higher likelihood to login, r(736) = 0.20, p < 0.001. Thissuggests that the covariation between AUC and accuracy mightbe related to the screen locations of the back and login buttons,because the latter button shifted somewhat from one trial to thenext.
Sample entropy was not correlated with overall accuracy[r(736) = −0.07, p = 0.08; MSE = 0.12, SDSE = 0.08] or accuracyin the spoof condition [r(367) = 0.01, p = 0.90]. By contrast,
Frontiers in Psychology | www.frontiersin.org 7 April 2018 | Volume 9 | Article 466
fpsyg-09-00466 April 12, 2018 Time: 16:12 # 8
Kelley et al. Statistical Models for Predicting Threat Detection
FIGURE 3 | Accuracy plotted as a function of authentication level and non-spoof/spoof condition.
higher SE in the non-spoof condition was associated with loweraccuracy, [r(367) =−0.13, p = 0.01].
Like both AUC and SE, there was no correlation betweenRT and overall accuracy, r(736) = 0.04, p = 0.22; MRT = 9.04,SDRT = 6.56. Unlike AUC and SE, the lack of relationshipbetween RT and accuracy across all trials was due to offsettingrelationships in the two conditions. Increases in RT (slowerresponses) were associated with reductions in accuracy inthe non-spoof condition
[r(367) =− 0.1, p < 0.05
], but higher
accuracy in the spoof condition[r(367) =0.18, p < 0.001
].
Correlations Between PredictorsAs mentioned above, security knowledge and websitefamiliarity were not significantly correlated. Websitefamiliarity was, however, negatively correlated withAUC, r(736) =− 0.11, p < 0.01. AUC was also positivelycorrelated with SE
[r(736) =0.28, p < 0.001
]and RTs[
r(736) =0.12, p = 0.001]. This may occur as larger AUCs
likely take more time and involve larger path deviations toexecute. As shown in Table 1, SE was not associated with RT,r(736) =0.002, p=0.94. It might have been expected that highersecurity knowledge or higher website familiarity might haveresulted in faster RT, but this was not observed, p > 0.05 (seeTable 1).
In order to capture the correlations between AUC, SE, andRT, the survey-based and real-time measures models includedthree-way interactions between predictors. Including all three-way interactions in the survey-based measures model alsopreserved the changes in correlation between the spoof and non-spoof conditions for both the security knowledge and websitefamiliarity predictors.
Two-Factor ModelThe two-factor model captured the effects of both the non-spoof/spoof manipulation and the authentication manipulationin addition to individual variation among participants.
Examining the posterior distributions shows that this modelwas relatively accurate in capturing the observed data. Samplingfrom the posterior distribution showed that the model predictedaccuracy in the non-spoof condition (µ = 0.83, 95% UI = 0.49,0.99), but was essentially random in the spoof condition(µ = 0.48, 95% UI = 0.11, 0.87). The model predicted that anon-spoof website would be correctly identified 33% more oftenthan a spoof website and that this difference is credible, despitethe high variance—most of which is found in responses to thespoof condition (µdiff = 0.33, 95% UI = 0.11, 0.46).
The two-factor model also captured the relationship betweenauthentication level and non-spoof/spoof condition. In the non-spoof condition, there was no difference between authenticationlevels in terms of accuracy: extended validation had the highestaccuracy (µ = 0.81, 95% UI = 0.44, 0.98), followed by standardvalidation (µ = 0.79, 95% UI = 0.42, 0.98) and partial encryption(µ = 0.78, 95% UI = 0.38, 0.98). In the spoof condition, increasesin authentication level corresponded to decreases in accuracy:partial encryption (µ = 0.58, 95% UI = 0.17, 0.92) was associatedwith greater accuracy than standard validation (µ = 0.49, 95%UI = 0.12, 0.88), which was, in turn, associated with greateraccuracy than extended validation (µ = 0.40, 95% UI = 0.08,0.83). Because of the linear ordering of encryption levels, eachincrease in authentication level (i.e., PE→SV and SV→EV) ledto a decrease in accuracy of approximately 9% (µdiff = 0.09, 95%UI = 0.02, 0.16).
As Table 2 shows, the two-factor model captured the effectsof the experimental variables, but it did not reveal any specificinformation about how these decisions were processed. Moreinformation about aspects of user decision making must beevaluated in order to better understand the conditions underwhich security cues fail.
Survey-Based ModelAdding both security knowledge and website familiarity tothe model improves our understanding of the decision-making
Frontiers in Psychology | www.frontiersin.org 8 April 2018 | Volume 9 | Article 466

fpsyg-09-00466 April 12, 2018 Time: 16:12 # 9
Kelley et al. Statistical Models for Predicting Threat Detection
TABLE 2 | Two-factor model coefficient estimates from those estimated to havecredible effects different than zero.
Coefficient Est. β (95% UI) Est. error Eff. samples R̂
Population-level effects
Intercept 1.63 (1.29, 2.00) 0.19 20,000 1
Spoof −1.69 (−2.08, −1.31) 0.20 20,000 1
Spoof ×authentication
−0.56 (−1.01, −0.12) 0.31 20,000 1
Group-level effects
SD (intercept) 1.03 (0.73, 1.37) 0.16 6,494 1
process. As shown in Table 3, the survey-based model indicatedthat both security knowledge and familiarity contributed tosusceptibility of phishing attacks. In particular, increased securityknowledge (β = 1.15, 95% UI = 0.40, 1.91) and website familiarity(β = 1.15, 95% UI = 0.47, 1.85) were associated with better abilityto discriminate between spoof and non-spoof websites.
While security knowledge was beneficial for all authenticationlevels, the two-way interaction between website familiarity andauthentication level revealed that website familiarity affectedaccuracy in standard and extended validation, but not partialencryption conditions. Website familiarity was not predictiveof accuracy in partial encryption (µ = 0.06, 95% UI = −0.91,1.01). In the case of standard validation, the normal effects offamiliarity were present (µ = 1.15, 95% UI = 0.47, 1.85), however,when an extended validation certificate was present, the websitefamiliarity greatly increased the ability to identify a spoofedwebsite (µ = 2.23, 95% UI = 1.15, 3.39).
The interaction between spoof and authentication showsthe same effects as the previous model. Authentication is notpredictive of accuracy in the non-spoof condition, but, in thespoof condition, increases in authentication level reduce accuracy(see Table 3).
Real-Time Measures ModelThe addition of real-time measures increases model complexity,but reveals that these measures are significant predictors ofaccuracy, while largely leaving the results from the previousmodels unchanged. Table 4 reveals that the effects and directionsof the previous models remain credible predictors of accuracy,
TABLE 3 | Survey-based model coefficients with credible effects different thanzero.
Coefficient Est. β (95% UI) Est. error Eff. samples R̂
Intercept 1.88 (1.48, 2.30) 0.21 10,291 1
Spoof −1.93 (−2.38, −1.49) 0.23 20,000 1
Knowledge 1.15 (0.40, 1.91) 0.38 10,919 1
Familiarity 1.15 (0.47, 1.85) 0.35 12,123 1
Spoof ×authentication
−0.83 (−1.35, −0.33) 0.26 13,537 1
Familiarity ×authentication
1.09 (0.30, 1.89) 0.40 14,734 1
Group-level effects
SD (intercept) 0.88 (0.55, 1.22) 0.17 7,374 1
TABLE 4 | Real-time measures model coefficients with credible effects differentthan zero.
Coefficient Est. β (95% UI) Est. error Eff. samples R̂
Intercept 2.18 (1.67, 2.75) 0.27 11,079 1
Spoof −2.43 (−3.07, −1.84) 0.31 12,451 1
Authentication 0.74 (0.20, 1.31) 0.28 13,090 1
Knowledge 2.12 (1.13, 3.20) 0.53 12,074 1
Familiarity 1.10 (0.26, 1.99) 0.44 14,203 1
AUC 1.57 (0.55, 2.63) 0.53 12,973 1
SE −1.47 (−2.34, −0.64) 0.43 15,560 1
Spoof ×authentication
−1.40 (−2.11, −0.73) 0.35 13,581 1
Spoof × AUC −3.90 (−5.19, −2.64) 0.65 14,241 1
Spoof × SE 2.01 (0.92, 3.15) 0.57 20,000 1
Spoof × RT 1.66 (0.46, 2.85) 0.61 14,821 1
Authentication× AUC 1.73 (0.52, 2.97) 0.62 13,628 1
Knowledge × SE 2.35 (0.66, 4.10) 0.88 20,000 1
AUC × SE 1.60 (0.00, 3.29) 0.84 20,000 1
SE × RT −2.69 (−4.50, −0.97) 0.90 20,000 1
Spoof ×authentication× AUC
−2.26 (−3.83, −0.73) 0.79 14,023 1
Spoof× AUC× SE −3.25 (−5.52, −1.09) 1.13 20,000 1
Authentication ×Knowledge× AUC
1.82 (0.29, 3.37) 0.78 20,000 1
Authentication ×Knowledge × SE
−1.54 (−3.02, −0.09) 0.75 20,000 1
AUC × SE × RT∗ 1.98 (0.14, 3.93) 0.96 20,000 1
Group-level effects
SD (intercept) 0.85 (0.33, 1.31) 0.24 4,313 1
∗The interaction between AUC, sample entropy, and response time, was onlycredible when the model used the full population that completed the study(N = 173) as opposed to the selected population (N = 123).
with slightly different estimated coefficients due to the addedpredictors. Non-spoof trials are more accurate than spoof trials,and increases in security knowledge and website familiarityimprove accuracy.
There are, however, two major changes from the survey-basedmodel due to the added predictors. First, the interaction betweenauthentication and familiarity is gone. Second, authenticationlevel becomes an important predictor of accuracy in both non-spoof and spoof conditions, rather than just the spoof condition,as it was in the survey-based model.
Response TimeThe interaction between RT and non-spoof/spoof conditionsshows that RT is not predictive of accuracy in the non-spoofcondition (B = −0.16, 95% UI = −1.19, 0.89), but in thespoof condition longer RTs are associated with higher accuracy(B = 1.66, 95% UI = 0.46, 2.88). As seen in Figure 4, RT alsointeracts with SE. On the right side of the figure, slower RTpaired with lower SE lead to greater accuracy, but as SE increases,accuracy decreases rapidly. Faster RT, seen on the left side of thefigure, and lower SE were associated with lower accuracy. As SEincreases, so does accuracy, though SE affects accuracy to a lesserextent in fast responses than in slower responses.
Frontiers in Psychology | www.frontiersin.org 9 April 2018 | Volume 9 | Article 466

fpsyg-09-00466 April 12, 2018 Time: 16:12 # 10
Kelley et al. Statistical Models for Predicting Threat Detection
FIGURE 4 | Mean accuracy based on mouse trajectory SE and RT. The dataon the x-axis are normalized and range from 2 SD below the mean (−1.00) to2 SD above the mean (+1.00).
Using the full sample introduced another interaction betweenRT, SE, and AUC. Given this interaction between threecontinuous variables, we describe the results qualitatively. WhenRT was average or slower and AUC was average or lower,an increase in SE was associated with reduced accuracy. AsAUC increased from low AUC (−1 SD) to average AUC,the association between SE and inaccuracy decreased. As RTincreased from average RT to slower RT (+1 SD), the effectbetween SE and lack of accuracy increased. When RT was fast(−1 SD) or when there was a large amount of AUC (+1 SD),there was no association between SE and accuracy. When RTwas average and SE was average or high (+1 SD), increasedAUC was associated with greater response accuracy. Increasesin AUC were also associated with better accuracy when RTwas slow (+1 SD) and SE was high (+1 SD). As SE increased,increases in AUC led to greater increases in accuracy. As AUCdecreased from average to low (−1 SD), RT was associatedwith accuracy, but SE modulated this association. Decreasesin AUC, increased the effects of SE on the association ofRT to accuracy. When SE was low (−1 SD), increases in RTwere associated with increases in accuracy. When SE was high(+1 SD), increases in RT were associated with decreases inaccuracy.
Sample EntropySample entropy is a credible predictor of accuracy in both spoofand non-spoof conditions. Higher SE leads to greater inaccuracyin identifying non-spoof sites (B = −1.47, 95% UI = −2.34,−0.64), but leads to greater accuracy in identifying spoof sites(B = 2.01, 95% UI = 0.92, 3.15). SE is also involved in atwo-way interaction with security knowledge, which is part ofthe three-way interaction between SE, authentication level, andknowledge. Figure 5 depicts the interactions between SE, securityknowledge, and authentication level. In the standard validationcondition (middle panel), low security knowledge and low SEare predictive of high accuracy, whereas higher levels of SE arepredictive of low accuracy. As knowledge increases, the predictivepower of SE decreases, because accuracy is high regardlessof SE.
FIGURE 5 | Mean accuracy as a function of SE, security knowledge, andauthentication level. The data on the x-axis are normalized and range from2 SD below the mean (−1.00) to 2 SD above the mean (+1.00).
The relation between SE and security knowledge is very similarin the extended validation condition (Figure 5 right panel). Justas in standard validation, low levels of knowledge and low SE areassociated with higher accuracy, while low levels of knowledgeand high SE lead to poorer accuracy. With high knowledge, thereis little difference in performance between responses that havehigh or low SE.
Unlike the preceding two conditions, SE in the partialencryption condition varies at both low and high levels of securityknowledge (Figure 5 left panel). Low knowledge and low SE arestill associated with higher accuracy. By contrast, high knowledgeand low SE leads to lower accuracy, whereas high knowledge andhigh SE leads to higher accuracy. As such, the effects of SE areflipped in the low- compared to high-knowledge conditions.
Sample entropy was also involved in a three-way interactioninvolving AUC and non-spoof/spoof conditions. As can be seenin Figure 6, accuracy increases as AUC increases, but thisis modulated by SE in opposite directions for non-spoof andspoof conditions. When AUC is low, high SE is associatedwith accurate responses in the spoof condition and inaccurateresponses in the non-spoof condition, while low SE is associated
FIGURE 6 | Mean accuracy as a function of AUC and SE in spoof andnon-spoof conditions. The data on the x-axis are normalized and range from2 SD below the mean (−1.00) to 2 SD above the mean (+1.00).
Frontiers in Psychology | www.frontiersin.org 10 April 2018 | Volume 9 | Article 466
fpsyg-09-00466 April 12, 2018 Time: 16:12 # 11
Kelley et al. Statistical Models for Predicting Threat Detection
with less accurate responses in the spoof condition and accurateresponses in the non-spoof condition. When AUC is high, theseinteractions are for the most part canceled and accuracy isprimarily determined by the AUC: High AUC results in lowaccuracy in the spoof condition and high accuracy in the non-spoof condition.
Area Under the CurveAs is suggested in the previous section, AUC is another crediblepredictor of accuracy (β = 1.57, 95% UI = 0.55, 2.63), but it alsointeracts other predictors in this model. In addition to the three-way interaction between SE and non-spoof/spoof (discussedabove), AUC is also involved in two additional three-wayinteractions. The first interaction involves AUC, authenticationlevel, and non-spoof/spoof. This three-way interaction includesthe two-way interactions between AUC and authenticationlevel, and AUC and non-spoof/spoof. The second three-wayinteraction involves AUC, authentication level, and securityknowledge.
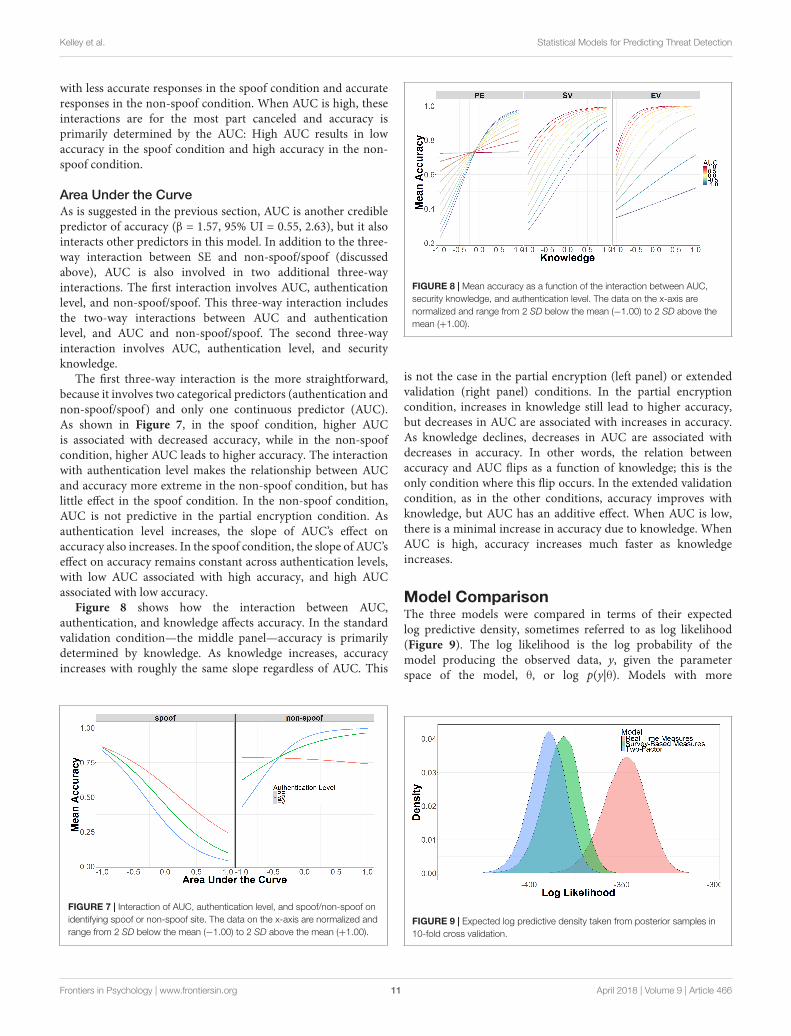
The first three-way interaction is the more straightforward,because it involves two categorical predictors (authentication andnon-spoof/spoof) and only one continuous predictor (AUC).As shown in Figure 7, in the spoof condition, higher AUCis associated with decreased accuracy, while in the non-spoofcondition, higher AUC leads to higher accuracy. The interactionwith authentication level makes the relationship between AUCand accuracy more extreme in the non-spoof condition, but haslittle effect in the spoof condition. In the non-spoof condition,AUC is not predictive in the partial encryption condition. Asauthentication level increases, the slope of AUC’s effect onaccuracy also increases. In the spoof condition, the slope of AUC’seffect on accuracy remains constant across authentication levels,with low AUC associated with high accuracy, and high AUCassociated with low accuracy.
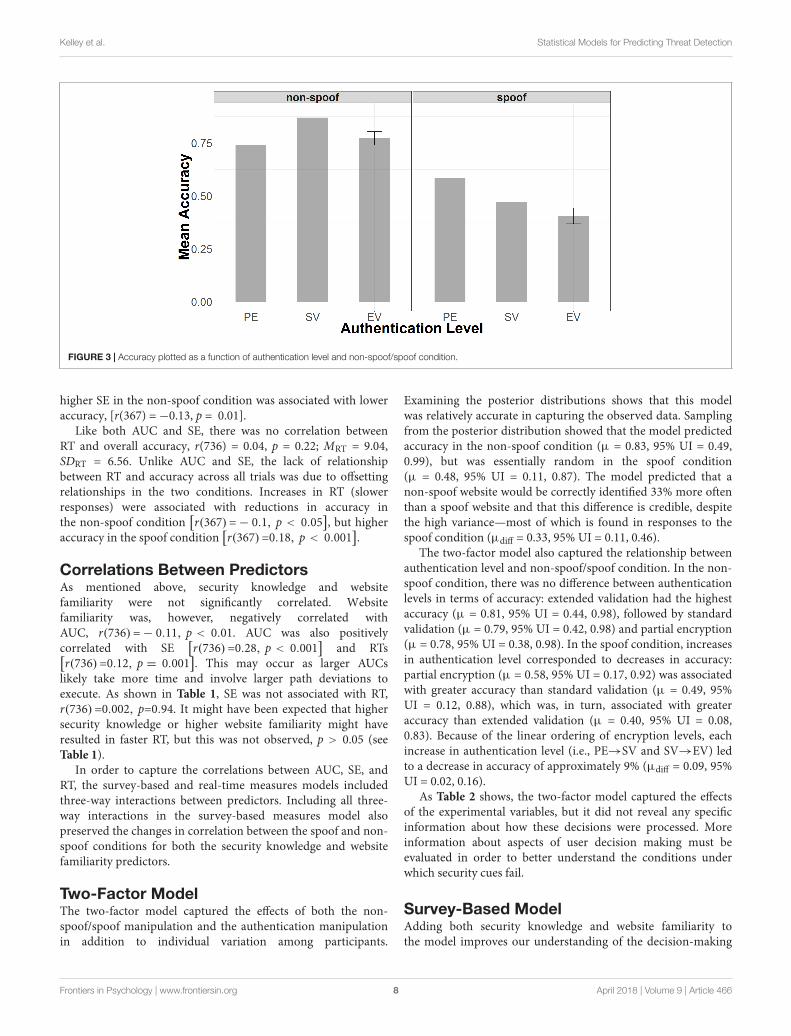
Figure 8 shows how the interaction between AUC,authentication, and knowledge affects accuracy. In the standardvalidation condition—the middle panel—accuracy is primarilydetermined by knowledge. As knowledge increases, accuracyincreases with roughly the same slope regardless of AUC. This
FIGURE 7 | Interaction of AUC, authentication level, and spoof/non-spoof onidentifying spoof or non-spoof site. The data on the x-axis are normalized andrange from 2 SD below the mean (−1.00) to 2 SD above the mean (+1.00).
FIGURE 8 | Mean accuracy as a function of the interaction between AUC,security knowledge, and authentication level. The data on the x-axis arenormalized and range from 2 SD below the mean (−1.00) to 2 SD above themean (+1.00).
is not the case in the partial encryption (left panel) or extendedvalidation (right panel) conditions. In the partial encryptioncondition, increases in knowledge still lead to higher accuracy,but decreases in AUC are associated with increases in accuracy.As knowledge declines, decreases in AUC are associated withdecreases in accuracy. In other words, the relation betweenaccuracy and AUC flips as a function of knowledge; this is theonly condition where this flip occurs. In the extended validationcondition, as in the other conditions, accuracy improves withknowledge, but AUC has an additive effect. When AUC is low,there is a minimal increase in accuracy due to knowledge. WhenAUC is high, accuracy increases much faster as knowledgeincreases.
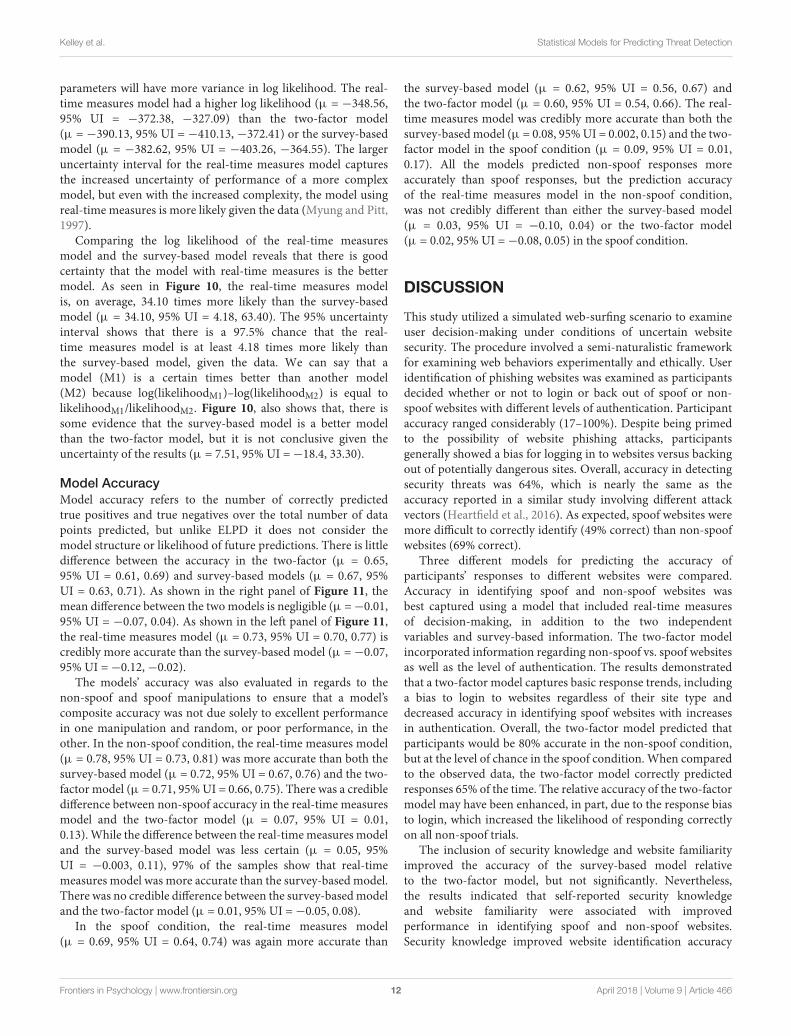
Model ComparisonThe three models were compared in terms of their expectedlog predictive density, sometimes referred to as log likelihood(Figure 9). The log likelihood is the log probability of themodel producing the observed data, y, given the parameterspace of the model, θ, or log p(y|θ). Models with more
FIGURE 9 | Expected log predictive density taken from posterior samples in10-fold cross validation.
Frontiers in Psychology | www.frontiersin.org 11 April 2018 | Volume 9 | Article 466
fpsyg-09-00466 April 12, 2018 Time: 16:12 # 12
Kelley et al. Statistical Models for Predicting Threat Detection
parameters will have more variance in log likelihood. The real-time measures model had a higher log likelihood (µ = −348.56,95% UI = −372.38, −327.09) than the two-factor model(µ = −390.13, 95% UI = −410.13, −372.41) or the survey-basedmodel (µ = −382.62, 95% UI = −403.26, −364.55). The largeruncertainty interval for the real-time measures model capturesthe increased uncertainty of performance of a more complexmodel, but even with the increased complexity, the model usingreal-time measures is more likely given the data (Myung and Pitt,1997).
Comparing the log likelihood of the real-time measuresmodel and the survey-based model reveals that there is goodcertainty that the model with real-time measures is the bettermodel. As seen in Figure 10, the real-time measures modelis, on average, 34.10 times more likely than the survey-basedmodel (µ = 34.10, 95% UI = 4.18, 63.40). The 95% uncertaintyinterval shows that there is a 97.5% chance that the real-time measures model is at least 4.18 times more likely thanthe survey-based model, given the data. We can say that amodel (M1) is a certain times better than another model(M2) because log(likelihoodM1)–log(likelihoodM2) is equal tolikelihoodM1/likelihoodM2. Figure 10, also shows that, there issome evidence that the survey-based model is a better modelthan the two-factor model, but it is not conclusive given theuncertainty of the results (µ = 7.51, 95% UI =−18.4, 33.30).
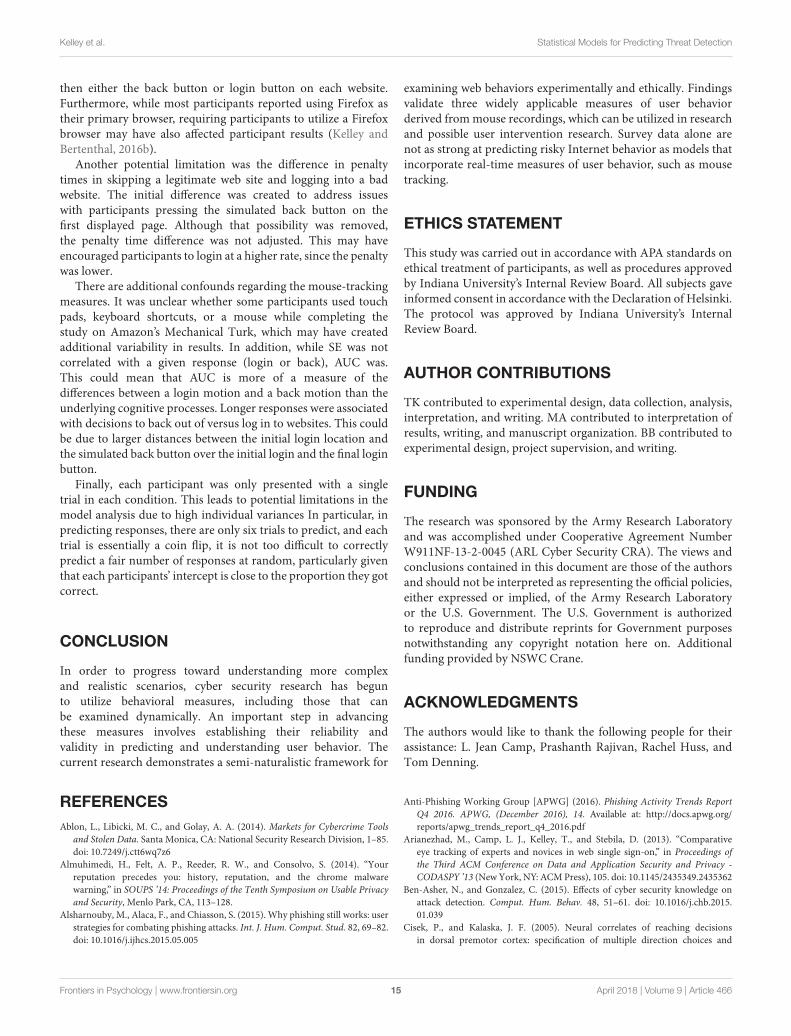
Model AccuracyModel accuracy refers to the number of correctly predictedtrue positives and true negatives over the total number of datapoints predicted, but unlike ELPD it does not consider themodel structure or likelihood of future predictions. There is littledifference between the accuracy in the two-factor (µ = 0.65,95% UI = 0.61, 0.69) and survey-based models (µ = 0.67, 95%UI = 0.63, 0.71). As shown in the right panel of Figure 11, themean difference between the two models is negligible (µ =−0.01,95% UI = −0.07, 0.04). As shown in the left panel of Figure 11,the real-time measures model (µ = 0.73, 95% UI = 0.70, 0.77) iscredibly more accurate than the survey-based model (µ =−0.07,95% UI =−0.12,−0.02).
The models’ accuracy was also evaluated in regards to thenon-spoof and spoof manipulations to ensure that a model’scomposite accuracy was not due solely to excellent performancein one manipulation and random, or poor performance, in theother. In the non-spoof condition, the real-time measures model(µ = 0.78, 95% UI = 0.73, 0.81) was more accurate than both thesurvey-based model (µ = 0.72, 95% UI = 0.67, 0.76) and the two-factor model (µ = 0.71, 95% UI = 0.66, 0.75). There was a credibledifference between non-spoof accuracy in the real-time measuresmodel and the two-factor model (µ = 0.07, 95% UI = 0.01,0.13). While the difference between the real-time measures modeland the survey-based model was less certain (µ = 0.05, 95%UI = −0.003, 0.11), 97% of the samples show that real-timemeasures model was more accurate than the survey-based model.There was no credible difference between the survey-based modeland the two-factor model (µ = 0.01, 95% UI =−0.05, 0.08).
In the spoof condition, the real-time measures model(µ = 0.69, 95% UI = 0.64, 0.74) was again more accurate than
the survey-based model (µ = 0.62, 95% UI = 0.56, 0.67) andthe two-factor model (µ = 0.60, 95% UI = 0.54, 0.66). The real-time measures model was credibly more accurate than both thesurvey-based model (µ = 0.08, 95% UI = 0.002, 0.15) and the two-factor model in the spoof condition (µ = 0.09, 95% UI = 0.01,0.17). All the models predicted non-spoof responses moreaccurately than spoof responses, but the prediction accuracyof the real-time measures model in the non-spoof condition,was not credibly different than either the survey-based model(µ = 0.03, 95% UI = −0.10, 0.04) or the two-factor model(µ = 0.02, 95% UI =−0.08, 0.05) in the spoof condition.
DISCUSSION
This study utilized a simulated web-surfing scenario to examineuser decision-making under conditions of uncertain websitesecurity. The procedure involved a semi-naturalistic frameworkfor examining web behaviors experimentally and ethically. Useridentification of phishing websites was examined as participantsdecided whether or not to login or back out of spoof or non-spoof websites with different levels of authentication. Participantaccuracy ranged considerably (17–100%). Despite being primedto the possibility of website phishing attacks, participantsgenerally showed a bias for logging in to websites versus backingout of potentially dangerous sites. Overall, accuracy in detectingsecurity threats was 64%, which is nearly the same as theaccuracy reported in a similar study involving different attackvectors (Heartfield et al., 2016). As expected, spoof websites weremore difficult to correctly identify (49% correct) than non-spoofwebsites (69% correct).
Three different models for predicting the accuracy ofparticipants’ responses to different websites were compared.Accuracy in identifying spoof and non-spoof websites wasbest captured using a model that included real-time measuresof decision-making, in addition to the two independentvariables and survey-based information. The two-factor modelincorporated information regarding non-spoof vs. spoof websitesas well as the level of authentication. The results demonstratedthat a two-factor model captures basic response trends, includinga bias to login to websites regardless of their site type anddecreased accuracy in identifying spoof websites with increasesin authentication. Overall, the two-factor model predicted thatparticipants would be 80% accurate in the non-spoof condition,but at the level of chance in the spoof condition. When comparedto the observed data, the two-factor model correctly predictedresponses 65% of the time. The relative accuracy of the two-factormodel may have been enhanced, in part, due to the response biasto login, which increased the likelihood of responding correctlyon all non-spoof trials.
The inclusion of security knowledge and website familiarityimproved the accuracy of the survey-based model relativeto the two-factor model, but not significantly. Nevertheless,the results indicated that self-reported security knowledgeand website familiarity were associated with improvedperformance in identifying spoof and non-spoof websites.Security knowledge improved website identification accuracy
Frontiers in Psychology | www.frontiersin.org 12 April 2018 | Volume 9 | Article 466

fpsyg-09-00466 April 12, 2018 Time: 16:12 # 13
Kelley et al. Statistical Models for Predicting Threat Detection
FIGURE 10 | Difference in the expected log predictive density of the real-time measures model and the survey-based model and the survey-based measures modeland the two-factor model.
FIGURE 11 | Comparison of accuracy for survey-based and real-time measures models (Left) and two-factor and survey-based models (Right).
across all authentication levels, while website familiarity resultedin greater accuracy when viewing standard and extendedvalidation websites but not those with partial encryption.Moreover, participants visiting extended validation sites thatwere spoofed were more likely to login than those visitingpartial encryption or standard validation websites. As such,the survey-based model captured more nuanced differences inphishing detection than did the two-factor model.
One interpretation for the interaction between spoof websitesand authentication levels is that extended validation increasedparticipants’ confidence in the security of the website, and thusthey were more likely to login to malicious websites. The problemwith accepting this interpretation is that the addition of real-timemeasures in the third model reveals that participants’ decisionmaking was more complicated and depended on multiplemodulating factors.
Frontiers in Psychology | www.frontiersin.org 13 April 2018 | Volume 9 | Article 466

fpsyg-09-00466 April 12, 2018 Time: 16:12 # 14
Kelley et al. Statistical Models for Predicting Threat Detection
It is also noteworthy that security knowledge wassystematically related to the correct identification of the websites,but it did not interact with any of the other variables. In manystudies of cybersecurity, security knowledge is considered a majorfactor in explaining individual differences (e.g., Vishwanath et al.,2011; Stembert et al., 2015), but this seemed less true in thecurrent study at least in the context of the survey-based model.Critically, security knowledge was the one variable that wasconstant across all trials, and thus there was no variability toincrease the likelihood of an interaction with other factors.By contrast, the other survey-based measure, website familiarity,varied with each trial. As will be discussed next, the additionof the real-time measures improved significantly the predictivepower of the third model, in part because each measure changedcontinuously between trials as well as within trials.
The addition of the real-time measures revealed that the effectsof non-spoof/spoof and authentication-level manipulations,security knowledge, and website familiarity were furthermodulated by the trajectories and timing of the mousemovements. For example, slower RTs were associated withgreater accuracy when responding to spoof websites. By contrast,there was no reliable relationship between RT and threatdetection when responding to non-spoof websites. In addition,mouse trajectories with high AUC, or those deviating furtherfrom straight-line paths, corresponded to lower accuracy inspoof conditions and higher accuracy in non-spoof conditions.This relationship was further moderated by SE, revealing acomplex interplay between experimental factors and real-timebehaviors. The relationship between SE and accuracy wasalso dependent on non-spoof/spoof condition and securityknowledge. For standard and extended validation websites,individuals with lower knowledge tended to be less accuratewith higher SE, while participants with lower SE tendedto be more accurate. By contrast, participants with higherknowledge tended to be more accurate regardless of their SEbecause the variation became highly constrained with increasingsecurity knowledge. For partial encryption websites, the effectsof SE on accuracy were reversed for low and high securityknowledge.
The multiple interactions between the real-time measures andthe other categorical and continuous variables are difficult tocompletely decipher as this time. Based on previous research(Kelley and Bertenthal, 2016b), we suggest that AUC is oftenassociated with visual search and will tend to expand whenindividuals decide to login, because the location of the loginbutton varies from one site to the next. SE is associated withuncertainty in decision making, and this type of variation inmouse movement is observed independent of RT or AUC.Differences in RT were consistent with the distinction betweentype I vs. type II decision making (Kahneman, 2011). Some ofthe decisions were very fast and automatic (type I), whereasothers were slower and more deliberate and thoughtful (typeII). Slower RTs were associated with greater accuracies forspoof but not for non-spoof conditions suggesting that fasteror automatic responses were less likely correct, which wouldhave penalized participants in the spoof, but not non-spoof,condition. Currently, these characterizations of the real-time
measures are merely heuristic guesses that will require furthersystematic research to test whether they have merit.
The major finding emerging from this study was that theinclusion of the mouse-tracking measures improved the accuracyof the overall model. The real-time measures model was alsomore accurate than the survey-based and two-factor models inpredicting responses in the spoof condition but not the non-spoof condition. Accuracy improved from 65% for the two-factormodel to 67% with the inclusion of the survey information to 73%with inclusion of the real-time measures. One of the potentialreasons that the mouse tracking measures increased the accuracyover the survey-based measures is that the mouse trajectoriescaptured the decision-making process as it unfolds over time.Using surveys to assess users’ online behavior assumes thatself-reported knowledge or behavior is reflective of real-worlddecision making, which is not always the case. Knowledge ofsecurity indicators, for instance, does not guarantee that users willconsistently devote time and attention to browser informationprior to login (e.g., Kelley and Bertenthal, 2016b). The findingsfrom the current study confirm this intuition by showing thatsurvey-based measures utilizing knowledge and familiarity, whilebetter than the two-factor model, only improved performanceby 2%. Mouse tracking is an especially valuable measure ofuser behavior because it is capable of capturing the dynamicsof perception, categorization, and decision-making (Goodaleet al., 1986; Cisek and Kalaska, 2005; Song and Nakayama,2006; McKinstry et al., 2008; Freeman et al., 2011). As such,the inclusion of this measure not only increases the predictivevalidity of the model, but offers additional insights into thedecision making process associated with threat detection atwebsites.
Unlike previous mouse-tracking studies, the currentstudy introduced a normalization procedure for extendingmouse trajectories to paradigms that do not have fixed andsymmetrically positioned alternative choices (Kelley andBertenthal, 2016a). More specifically, we normalized thedistances between start and end locations of the mousetrajectory by converting distance to a unit vector and thenrotating the trajectory to a standard location. In addition, wedemonstrated that it was possible to extend mouse trackingresearch to crowd-sourcing websites in order to collect data.Lastly, converging measures of mouse trajectories were used toexamine user decision-making, which examined different facetsof human behavior. These findings highlight the rich amountof information that can be derived from mouse movementrecordings during cognitive tasks.
LimitationsThe present study compared the accuracy of two-factor, survey-based, and real-time measures in predicting risky online behaviorduring phishing attacks. This study was limited in requiringusers to interact with simulated website scenarios. While thisformat provided experimental control within a semi-naturalisticframework, the format necessarily constrained participantresponses. In particular, participants interacted with image-mapped versions of websites that only had limited functionality.Thus, participants could only click on login account links,
Frontiers in Psychology | www.frontiersin.org 14 April 2018 | Volume 9 | Article 466
fpsyg-09-00466 April 12, 2018 Time: 16:12 # 15
Kelley et al. Statistical Models for Predicting Threat Detection
then either the back button or login button on each website.Furthermore, while most participants reported using Firefox astheir primary browser, requiring participants to utilize a Firefoxbrowser may have also affected participant results (Kelley andBertenthal, 2016b).
Another potential limitation was the difference in penaltytimes in skipping a legitimate web site and logging into a badwebsite. The initial difference was created to address issueswith participants pressing the simulated back button on thefirst displayed page. Although that possibility was removed,the penalty time difference was not adjusted. This may haveencouraged participants to login at a higher rate, since the penaltywas lower.
There are additional confounds regarding the mouse-trackingmeasures. It was unclear whether some participants used touchpads, keyboard shortcuts, or a mouse while completing thestudy on Amazon’s Mechanical Turk, which may have createdadditional variability in results. In addition, while SE was notcorrelated with a given response (login or back), AUC was.This could mean that AUC is more of a measure of thedifferences between a login motion and a back motion than theunderlying cognitive processes. Longer responses were associatedwith decisions to back out of versus log in to websites. This couldbe due to larger distances between the initial login location andthe simulated back button over the initial login and the final loginbutton.
Finally, each participant was only presented with a singletrial in each condition. This leads to potential limitations in themodel analysis due to high individual variances In particular, inpredicting responses, there are only six trials to predict, and eachtrial is essentially a coin flip, it is not too difficult to correctlypredict a fair number of responses at random, particularly giventhat each participants’ intercept is close to the proportion they gotcorrect.
CONCLUSION
In order to progress toward understanding more complexand realistic scenarios, cyber security research has begunto utilize behavioral measures, including those that canbe examined dynamically. An important step in advancingthese measures involves establishing their reliability andvalidity in predicting and understanding user behavior. Thecurrent research demonstrates a semi-naturalistic framework for
examining web behaviors experimentally and ethically. Findingsvalidate three widely applicable measures of user behaviorderived from mouse recordings, which can be utilized in researchand possible user intervention research. Survey data alone arenot as strong at predicting risky Internet behavior as models thatincorporate real-time measures of user behavior, such as mousetracking.
ETHICS STATEMENT
This study was carried out in accordance with APA standards onethical treatment of participants, as well as procedures approvedby Indiana University’s Internal Review Board. All subjects gaveinformed consent in accordance with the Declaration of Helsinki.The protocol was approved by Indiana University’s InternalReview Board.
AUTHOR CONTRIBUTIONS
TK contributed to experimental design, data collection, analysis,interpretation, and writing. MA contributed to interpretation ofresults, writing, and manuscript organization. BB contributed toexperimental design, project supervision, and writing.
FUNDING
The research was sponsored by the Army Research Laboratoryand was accomplished under Cooperative Agreement NumberW911NF-13-2-0045 (ARL Cyber Security CRA). The views andconclusions contained in this document are those of the authorsand should not be interpreted as representing the official policies,either expressed or implied, of the Army Research Laboratoryor the U.S. Government. The U.S. Government is authorizedto reproduce and distribute reprints for Government purposesnotwithstanding any copyright notation here on. Additionalfunding provided by NSWC Crane.
ACKNOWLEDGMENTS
The authors would like to thank the following people for theirassistance: L. Jean Camp, Prashanth Rajivan, Rachel Huss, andTom Denning.
REFERENCESAblon, L., Libicki, M. C., and Golay, A. A. (2014). Markets for Cybercrime Tools
and Stolen Data. Santa Monica, CA: National Security Research Division, 1–85.doi: 10.7249/j.ctt6wq7z6
Almuhimedi, H., Felt, A. P., Reeder, R. W., and Consolvo, S. (2014). “Yourreputation precedes you: history, reputation, and the chrome malwarewarning,” in SOUPS ’14: Proceedings of the Tenth Symposium on Usable Privacyand Security, Menlo Park, CA, 113–128.
Alsharnouby, M., Alaca, F., and Chiasson, S. (2015). Why phishing still works: userstrategies for combating phishing attacks. Int. J. Hum. Comput. Stud. 82, 69–82.doi: 10.1016/j.ijhcs.2015.05.005
Anti-Phishing Working Group [APWG] (2016). Phishing Activity Trends ReportQ4 2016. APWG, (December 2016), 14. Available at: http://docs.apwg.org/reports/apwg_trends_report_q4_2016.pdf
Arianezhad, M., Camp, L. J., Kelley, T., and Stebila, D. (2013). “Comparativeeye tracking of experts and novices in web single sign-on,” in Proceedings ofthe Third ACM Conference on Data and Application Security and Privacy -CODASPY ’13 (New York, NY: ACM Press), 105. doi: 10.1145/2435349.2435362
Ben-Asher, N., and Gonzalez, C. (2015). Effects of cyber security knowledge onattack detection. Comput. Hum. Behav. 48, 51–61. doi: 10.1016/j.chb.2015.01.039
Cisek, P., and Kalaska, J. F. (2005). Neural correlates of reaching decisionsin dorsal premotor cortex: specification of multiple direction choices and
Frontiers in Psychology | www.frontiersin.org 15 April 2018 | Volume 9 | Article 466

fpsyg-09-00466 April 12, 2018 Time: 16:12 # 16
Kelley et al. Statistical Models for Predicting Threat Detection
final selection of action. Neuron 45, 801–814. doi: 10.1016/j.neuron.2005.01.027
Dale, R., and Duran, N. D. (2011). The cognitive dynamics of negated sentenceverification. Cogn. Sci. 35, 983–996. doi: 10.1111/j.1551-6709.2010.01164.x
Dale, R., Kehoe, C., and Spivey, M. J. (2007). Graded motor responses inthe time course of categorizing atypical exemplars. Mem. Cogn. 35, 15–28.doi: 10.3758/BF03195938
Dhamija, R., Tygar, J. D., and Hearst, M. (2006). “Why phishing works,” inProceedings of the SIGCHI Conference on Human Factors in Computing Systems(New York, NY: ACM Press), 581–590. doi: 10.1145/1124772.1124861
Downs, J. S., Holbrook, M. B., and Cranor, L. F. (2007). “Behavioral response tophishing risk,” in Proceedings of the Anti-phishing Working Groups 2nd AnnualeCrime Researchers Summit on - eCrime ’07 (New York, NY: ACM Press), 37–44.doi: 10.1145/1299015.1299019
Freeman, J. B., Ambady, N., Rule, N. O., and Johnson, K. L. (2008). Will a categorycue attract you? Motor output reveals dynamic competition across personconstrual. J. Exp. Psychol. Gen. 137, 673–690. doi: 10.1037/a0013875
Freeman, J. B., Dale, R., and Farmer, T. A. (2011). Hand in motion reveals mind inmotion. Front. Psychol. 2:59. doi: 10.3389/fpsyg.2011.00059
Freeman, J. B., Pauker, K., Apfelbaum, E. P., and Ambady, N. (2010). Continuousdynamics in the real-time perception of race. J. Exp. Soc. Psychol. 46, 179–185.doi: 10.1016/j.jesp.2009.10.002
Garg, V., and Camp, J. (2012). “End user perception of online risk underuncertainty,” in Proceedings of the 2012 45th Hawaii International Conferenceon System Sciences, Maui, HI, 3278–3287. doi: 10.1109/HICSS.2012.245
Gelman, A., Carlin, J. B., Stern, H. S., Dunson, D. B., Vehtari, A., and Rubin, D. B.(2013a). Bayesian Data Analysis, 3rd Edn. London: Chapman & Hall.
Gelman, A., Hill, J., and Yajima, M. (2012). Why we (usually) don’t have to worryabout multiple comparisons. J. Res. Educ. Effect. 5, 189–211. doi: 10.1080/19345747.2011.618213
Gelman, A., Hwang, J., and Vehtari, A. (2013b). Understanding PredictiveInformation Criteria for Bayesian Models. Available at: http://www.stat.columbia.edu/~gelman/research/unpublished/waic_understand.pdf
Gelman, A., Jakulin, A., Pittau, M. G., and Su, Y.-S. (2008). A weakly informativedefault prior distribution for logistic and other regression models. Ann. Appl.Stat. 2, 1360–1383. doi: 10.1214/08-AOAS191
Gelman, A., and Rubin, D. B. (1995). Avoiding model selection in Bayesian socialresearch. Sociol. Methodol. 25, 165–173. doi: 10.2307/271064
Ghosh, J., Li, Y., and Mitra, R. (2017). On the use of Cauchy prior distributionsfor Bayesian logistic regression. Bayesian Anal. 13, 359–383. doi: 10.1214/17-BA1051
Goodale, M. A., Pelisson, D., and Prablanc, C. (1986). Large adjustments in visuallyguided reaching do not depend on vision of the hand or perception of targetdisplacement. Nature 320, 748–750. doi: 10.1038/320748a0
Heartfield, R., Loukas, G., and Gan, D. (2016). You are probably not theweakest link: towards practical prediction of susceptibility to semantic socialengineering attacks. IEEE Access 4, 6910–6928. doi: 10.1109/ACCESS.2016.2616285
Herley, C., and Flor, D. (2010). “Nobody sells gold for the price of silver: dishonesty,uncertainty and the underground economy,” in Economics of Information,Security and Privacy eds T. Moore, D. Pym and C. Ioannidis (Berlin: Springer),33–53. doi: 10.1007/978-1-4419-6967-5_3
Hoekstra, R., Morey, R. D., Rouder, J. N., and Wagenmakers, E.-J. (2014). Robustmisinterpretation of confidence intervals. Psychon. Bull. Rev. 21, 1157–1164.doi: 10.3758/s13423-013-0572-3
Iuga, C., Nurse, J. R. C., and Erola, A. (2016). Baiting the hook: factors impactingsusceptibility to phishing attacks. Hum. Centric Comput. Inform. Sci. 6:8.doi: 10.1186/s13673-016-0065-2
Jagatic, T. N., Johnson, N. A., Jakobsson, M., and Menczer, F. (2007). Socialphishing. Commun. ACM 50, 94–100. doi: 10.1145/1290958.1290968
Kahneman, D. (2011). Thinking, Fast and Slow. New York: Farrar, Straus andGiroux.
Kanich, C., Kreibich, C., Levchenko, K., Enright, B., Voelker, G. M., Paxson, V.,et al. (2008). “Spamalytics: an empirical analysis of spam marketing conversion,”in Proceedings of the ACM Conference on Computer and CommunicationsSecurity (Alexandria, VA: ACM), 3–14. doi: 10.1145/1562164.1562190
Kass, R. E., and Raftery, A. E. (2015). Bayes factors. J. Am. Stat. Assoc. 90, 773–795.doi: 10.1080/01621459.1995.10476572
Kelley, T., and Bertenthal, B. I. (2016a). Attention and past behavior, not securityknowledge, modulate users’ decisions to login to insecure websites. Inf. Comput.Secur. 24, 164–176. doi: 10.1108/ICS-01-2016-0002
Kelley, T., and Bertenthal, B. I. (2016b). “Real-world decision making: logging intosecure vs. insecure websites,” in Proceedings of the USEC ’16 (San Diego, CA:Internet Society). doi: 10.14722/usec.2016.23023
Kruschke, J. K., and Liddell, T. M. (2017). Bayesian data analysis for newcomers.Psychon. Bull. Rev. 25, 155–177. doi: 10.3758/s13423-017-1272-1
McKinstry, C., Dale, R., and Spivey, M. J. (2008). Action dynamics reveal parallelcompetition in decision making. Psychol. Sci. 19, 22–24. doi: 10.1111/j.1467-9280.2008.02041.x
Morey, R. D., Hoekstra, R., Rouder, J. N., Lee, M. D., and Wagenmakers, E.-J.(2016a). The fallacy of placing confidence in confidence intervals. Psychon. Bull.Rev. 23, 103–123. doi: 10.3758/s13423-015-0947-8
Morey, R. D., Romeijn, J. W., and Rouder, J. N. (2016b). The philosophy of Bayesfactors and the quantification of statistical evidence. J. Math. Psychol. 72, 6–18.doi: 10.1016/j.jmp.2015.11.001
Myers, S. (2006). “Introduction to phishing,” in Phishing and Countermeasures,eds M. Jakobsson and S. Myers (Hoboken, NJ: John Wiley & Sons, Inc.), 1–29.doi: 10.1002/9780470086100.ch1
Myung, I. J., and Pitt, M. A. (1997). Applying Occam’s razor in modeling cognition:a Bayesian approach. Psychon. Bull. Rev. 4, 79–95. doi: 10.3758/BF03210778
Ponemon Institute (2015). The Cost of Phishing & Value of Employee Training.Traverse City, MI: Ponemon Institute.
Ramzan, Z. (2010). “Phishing attacks and countermeasures,” in Handbook ofInformation and Communication Security, eds P. Stavroulakis and M. Stamp(Heidelberg: Springer), 433–448. doi: 10.1007/978-1-84882-684-7
Richman, J. S., and Moorman, J. R. (2000). Physiological time-series analysis usingapproximate entropy and sample entropy. Am. J. Physiol. Heart Circ. Physiol.278, H2039—-H2049. doi: 10.1152/ajpheart.2000.278.6.H2039
Rouder, J. N., Speckman, P. L., Sun, D., Morey, R. D., and Iverson, G. (2009).Bayesian t tests for accepting and rejecting the null hypothesis. Psychon. Bull.Rev. 16, 225–237. doi: 10.3758/PBR.16.2.225
Schechter, S. E., Dhamija, R., Ozment, A., and Fischer, I. (2007). “The emperor’snew security indicators,” in Proceedings of the 2007 IEEE Symposium onSecurity and Privacy (SP ’07) (Los Alamitos, CA: IEEE), 51–65. doi: 10.1109/SP.2007.35
Sheng, S., Holbrook, M., Kumaraguru, P., Cranor, L. F. F., and Downs, J.(2010). “Who falls for phish?: a demographic analysis of phishing susceptibilityand effectiveness of interventions,” in Proceedings of the 28th InternationalConference on Human Factors in Computing Systems (New York, NY: ACM),373–382. doi: 10.1145/1753326.1753383
Sobey, J., Biddle, R., van Oorschot, P. C., and Patrick, A. S. (2008). “Exploringuser reactions to new browser cues for extended validation certificates,” inProceedings of the 13th European Symposium on Research in Computer Security(ESORICS) 2008, Vol. 5283, eds S. Jajodia and J. Lopez (Berlin: Springer),411–427. doi: 10.1007/978-3-540-88313-5_27
Song, J.-H., and Nakayama, K. (2006). Role of focal attention on latencies andtrajectories of visually guided manual pointing. J. Vis. 6:11. doi: 10.1167/6.9.11
Stebila, D. (2010). “Reinforcing bad behaviour,” in Proceedings of the 22ndConference of the Computer-Human Interaction Special Interest Group ofAustralia on Computer-Human Interaction - OZCHI ’10 (New York, NY: ACMPress), 248. doi: 10.1145/1952222.1952275
Stembert, N., Padmos, A., Bargh, M. S., Choenni, S., and Jansen, F. (2015).“A study of preventing email (spear) phishing by enabling humanintelligence,” in Proceedings of the 2015 European Intelligence andSecurity Informatics Conference, Manchester, 113–120. doi: 10.1109/EISIC.2015.38
Theiler, J. (1986). Spurious dimension from correlation algorithms applied tolimited time-series data. Phys. Rev. A Gen. Phys. 34, 2427–2432. doi: 10.1103/PhysRevA.34.2427
Vishwanath, A., Harrison, B., and Ng, Y. J. (2016). Suspicion, cognition,and automaticity model of phishing susceptibility. Commun. Res. 1–21.doi: 10.1177/0093650215627483
Vishwanath, A., Herath, T., Chen, R., Wang, J., and Rao, H. R. (2011). Why dopeople get phished? Testing individual differences in phishing vulnerabilitywithin an integrated, information processing model. Decis. Support Syst. 51,576–586. doi: 10.1016/j.dss.2011.03.002
Frontiers in Psychology | www.frontiersin.org 16 April 2018 | Volume 9 | Article 466

fpsyg-09-00466 April 12, 2018 Time: 16:12 # 17
Kelley et al. Statistical Models for Predicting Threat Detection
Whalen, T., and Inkpen, K. M. (2005). “Gathering evidence: use of visual securitycues in web browsers,” in Proceedings of Graphics Interface, Victoria, BC,137–144. Available at: http://portal.acm.org/citation.cfm?id=1089508.1089532
Wright, R. T., and Marett, K. (2010). The influence of experiential anddispositional factors in phishing: an empirical investigation of thedeceived. J. Manag. Inform. Syst. 27, 273–303. doi: 10.2753/MIS0742-1222270111
Yentes, J. M., Hunt, N., Schmid, K. K., Kaipust, J. P., McGrath, D., and Stergiou, N.(2013). The appropriate use of approximate entropy and sample entropy withshort data sets. Ann. Biomed. Eng. 41, 349–365. doi: 10.1007/s10439-012-0668-3
Conflict of Interest Statement: The authors declare that the research wasconducted in the absence of any commercial or financial relationships that couldbe construed as a potential conflict of interest.
Copyright © 2018 Kelley, Amon and Bertenthal. This is an open-access articledistributed under the terms of the Creative Commons Attribution License (CC BY).The use, distribution or reproduction in other forums is permitted, provided theoriginal author(s) and the copyright owner are credited and that the originalpublication in this journal is cited, in accordance with accepted academic practice.No use, distribution or reproduction is permitted which does not comply with theseterms.
Frontiers in Psychology | www.frontiersin.org 17 April 2018 | Volume 9 | Article 466