statistical modeling of migration attractiveness of the eu
TRANSCRIPT

Journal of Modern Applied StatisticalMethods
Volume 14 | Issue 2 Article 19
11-1-2015
Statistical Modeling of Migration Attractiveness ofthe EU Member StatesTatiana TikhomirovaPlekhanov Russian University of Economics
Yulia LebedevaPlekhanov Russian University of Economics, [email protected]
Follow this and additional works at: http://digitalcommons.wayne.edu/jmasm
Part of the Applied Statistics Commons, Social and Behavioral Sciences Commons, and theStatistical Theory Commons
This Regular Article is brought to you for free and open access by the Open Access Journals at DigitalCommons@WayneState. It has been accepted forinclusion in Journal of Modern Applied Statistical Methods by an authorized editor of DigitalCommons@WayneState.
Recommended CitationTikhomirova, Tatiana and Lebedeva, Yulia (2015) "Statistical Modeling of Migration Attractiveness of the EU Member States," Journalof Modern Applied Statistical Methods: Vol. 14 : Iss. 2 , Article 19.DOI: 10.22237/jmasm/1446351480Available at: http://digitalcommons.wayne.edu/jmasm/vol14/iss2/19

Statistical Modeling of Migration Attractiveness of the EU Member States
Cover Page Footnote1. Eurostat, Population and social conditions, Author: Fabio SARTORI, 45/12 2. Migrants in Europe Astatistical portrait of the first and second generation, Luxembourg: Publications Office of the EuropeanUnion, 2011, Printed in Belgium 3. Official site – Eurostat/ electronic resource.http://epp.eurostat.ec.europa.eu/statistics_explained/index.php/Migration_and_migrant_population_statistics 4. The official website of the National Institute of Statistics(Romania) http://www.insse.ro 5. The official site of the National Statistics Office (Malta) / Electronicresource http://www.nso.gov.mt 6. Tikhomirov N.P., Tikhomirova T.M., Oushmaev O.S. Econometricmethods and multivariate statistical analysis: A Textbook. - Moscow: Economics, 2011. - 647 pages 7.Electronic bulletin which is published with the support of the French National Institute of DemographicStudies (INED) in collaboration with the Institute of Demography at the National Research University"Higher School of Economics' / Electronic resource. http://demoscope.ru/weekly/2013/0553/index.php
This regular article is available in Journal of Modern Applied Statistical Methods: http://digitalcommons.wayne.edu/jmasm/vol14/iss2/19

Journal of Modern Applied Statistical Methods
November 2015, Vol. 14, No. 2, 257-274.
Copyright © 2015 JMASM, Inc.
ISSN 1538 − 9472
Prof. Dr. Tikhomirova is Professor of Economics. Email Tatiana Tikhomirova at [email protected]. Email Yulia Lebedeva at [email protected].
257
Statistical Modeling of Migration Attractiveness of the EU Member States
Tatiana Tikhomirova Plekhanov Russian University of Economics
Москва, Russia
Yulia Lebedeva Plekhanov Russian University of Economics
Москва, Russia
Identifying the relationship between the migration attractiveness of the European Union countries and their level of socio-economic development is investigated. An approach is proposed identify influences on migration socio-economic characteristics, by aggregating and reducing their diversity, and substantiating the cause-and-effect relationships of the studied phenomenon. A stable classification of countries scheme is developed according to the attractiveness of migration on aggregate factors, and then an econometric model of
a binary choice using panel data for 2008-2010 was applying, quantifying the impact of aggregate designed factors on immigration and emigration. Keywords: Immigration attractiveness, immigration, emigration, applied statistics, multivariate statistical techniques, multi-dimensional space, the panel data.
Introduction
Migration is “one of the most important challenges of the 21st century”
(Albertinelli et al., 2011; “Migrants in Europe”, 2012). This phenomenon, caused
by rising unemployment, increasing crime, the destruction of the traditional
indigenous way of life, increasing the burden on the budget, and many other
negative consequences, particularly when unregulated or illegal urges
governments of developed countries to take certain measures to regulate
migration flows within the appropriate migration policies.
The problems of developing an effective migration policy are also becoming
more pressing in the European Union (EU), particularly because of the open
borders within the framework of this community. In such a situation, the
regulation of migration within the EU is usually associated with exposure to the
factors generating the process and the living conditions of the population, of
which, according to experts, the most important is the difference in the levels of
living of the population and socio-economic development of the community.

TIKHOMIROVA & LEBEDEVA
258
An important stage of the development and validation of measures of
migration policy in the EU is the clusterization of countries within homogeneous
groups in terms of socio-economic development and identification of the main
reasons - factors that determine the patterns of intra-group and between group
processes. In this regard, the construction of a sustainable clusterization of EU
countries in terms of the attractiveness of migration is considered, as well as the
identification of factors that have an impact on migration, and cause the
differences in the development of EU countries, is relevant.
In this study, the 29 countries of the European Union: Austria, England,
Belgium, Bulgaria, Hungary, Germany, Denmark, Greece, Ireland, Spain, Italy,
Cyprus, Latvia, Lithuania, Luxembourg, Malta, Netherlands, Norway, Poland,
Portugal, Romania, Slovakia, Slovenia, Finland, France, Croatia, Czech Republic,
Sweden, Estonia were examined for the period of 2008 to 2010, on 84 social,
economic and political indicators: compensation of employees, GDP per capita in
PPS, life expectancy at birth by sex, the number of pupils and students,
self-reported unmet need for medical examination or treatment by income quintile,
etc. (Sartori, 2012; "Migration and migrant population statistics", 2015; Institul
National de Statistica, n.d.; National Statistics Office, Malta, n.d.). All these
characteristics are given in comparable units of measurement.
In general, the source data set is a parallelepiped (see Figure 1), where the
axis iP belongs to EU member states 1.29i , the axis Xj belongs the previously
mentioned socio-economic and demographic characteristics of EU countries
1.84j , and the axis tk is time interval, 1.3t .
Figure 1. Parallelepiped of initial data on indicators of the attractiveness of the EU
member states migration

STATISTICAL MODELING OF MIGRATION ATTRACTIVENESS
259
When considering the information set numerous problems appear: 1)
selecting the informative features that have a significant statistical effect on the
migration, 2) reducing the dimensions of the array of information and the
transition to the matrix representation of the data, 3) selecting the correct
mathematical tools for analyzing small samples in which the number of signs
exceeds the number of objects (29 × 84), making it impossible to construct the set
econometric models, 4) recovering the gaps in the baseline data, 5) leveling the
effect of multicollinearity between variables without significant loss of
information content of the feature space (Tikhomirov, Tikhomirova, Oushmaev,
2011).
The first problem (the assessment of the relationship between factors and
migration attractiveness of countries) was solved in several stages. With the help
of multiple correlation analysis those features that have the greatest impact on
statistical indicators of officially registered immigrants and emigrants were
selected from the total number of socio-economic and demographic indicators. It
was found that 32 of the 84 characteristic have a significant impact on
immigration and 9 characteristic have a significant impact on emigration.
In the next step the combined influence of selected characteristics on
migration attractiveness of countries was investigated, using the approach
proposed by the authors: scaling of countries by aggregated, randomized
indicators. This approach lies in the fact that the selected indicators are assigned
levels according to the following principle: if the data has a direct correlation to
the corresponding endogenous variable, the number of officially registered
emigrants, or the number of registered immigrants, i.e., the correlation coefficient
between the factor variable and efficient variable is significant and positive, then
the ranks assigned to each variable are as follows: the observation with the
highest value is assigned the maximum rank and levels are in descending order.
If the variable has an inverse relationship with the endogenous variable, i.e.
the correlation coefficient is significant and negative, then the ranks are assigned
to each variable in the reverse order: the observation with the largest value has a
rank corresponding to one and then ranks are arranged in ascending order. Then
the sum of the ranks corresponding to all variables influencing the emigration and
immigration for each country is calculated:
i ijjR R (1)

TIKHOMIROVA & LEBEDEVA
260
where i is the serial number of the country 1.29i ; j is the serial number of
variable Xj, 1.9j (for emigration) and 1.32j (for immigration), Ri is the sum
of the ranks in the country with the number of i, Rij is the rank assigned to the ith
observation of the jth variable.
In the next step, the percentage deviation of the sum of the rank of each
country from the median level of emigration and immigration in the EU
respectively is calculated:
*100%i
i
R M
M
(2)
where M is the median for all Ri.
The scaling was produced with respect to values of percentage: from the
largest percentage to the lowest value of percentage. The results of the
calculations by the variables of the attractiveness of emigration are presented in
Figure 2. Figure 3 shows the ranking of EU countries, which was built for the
number of officially registered emigrants per thousand inhabitants.
Figure 2. Distribution of the EU countries with respect of emigration attractiveness

STATISTICAL MODELING OF MIGRATION ATTRACTIVENESS
261
Figure 3. The distribution of EU countries by number of registered emigrants per
thousand inhabitants
Comparing the histograms placed in Figure 2 and Figure 3 indicates that
these extreme values are the same. This indicates that the selected explanatory
variables are really informative and their joint effect on the attractiveness of
emigration is significant. Moreover, in Figure 2 and Figure 3, heterogeneity of the
EU countries by selected characteristics is observed (their scatter relative to the
EU median level is greater than 70%), which leads to the need for clustering of
countries by studied characteristics. Similar results were obtained during the
distribution of countries by number of immigrants and the characteristics that
affect the level of immigration.
The next problem which we solved in this paper was caused by
multicollinearity selected features. Statistics of Pearson has confirmed the
presence of multicollinearity in features of emigration attractiveness
2 2
.60.8 50.9est tab on 99% confidence level. It should be noted that the
multicollinearity of the features of immigration attractiveness was not statistically
established.
Cluster analysis (see Figure 4), which was built for the 9 variables of
emigration attractiveness, also shows a relationship between them.

TIKHOMIROVA & LEBEDEVA
262
Figure 4. Cluster analysis dendrogram constructed for the 9 variables of emigration
attractiveness using method farthest neighbor (the square of the Euclidean metric)
The dendrogram (Figure 4) shows that the variables numbered 3, 4, 9 are
collinear. Step by step, we removed one variable, which had the least variation,
from consideration. This meant that the space variables of emigration
attractiveness of EU countries were reduced with no loss of informativity and the
problem of multicollinearity was solved. Statistics of Pearson after the removal of
collinear variables (no. 4 and 9) was: 2 2
. .32.8 38.9est tab for α = 0.01.
A similar approach was applied to reduce the feature space on the
immigration attractiveness of EU countries.
Figure 5. The dendrogram of the cluster analysis for the 32 features of immigration
attractiveness of the EU (the square of the Euclidean metric)

STATISTICAL MODELING OF MIGRATION ATTRACTIVENESS
263
As follows from the dendrogram (Figure 5), many of the characteristics are
closely related, although the statistic of Pearson did not confirm the presence of
multicollinearity for them, apparently, due to the excessive multi-dimensionality
(the number of variables, in this case exceeds the number of observations). For
example, variables number 1 and 3, as well as 5 and 6, are collinear so for further
research it is advisable to leave only one of each pair, based on the principle that
the most preferred variable is the one with higher variability.
Reduction of the feature space of immigration attractiveness was conducted
in several iterations. Moreover, in each iteration of the classification we built on a
selected set of variables until the requirements of sustainability were met
(Tikhomirov et al. 2011). In order to obtain a stable classification 9 iterations took
place. The final dendrogram of cluster analysis of EU countries by immigration
attractiveness based on many of its defining characteristics is represented in
Figure 6.
Figure 6. The dendrogram of cluster analysis of immigration attractiveness of the EU
countries by using far neighbor method (the square of the Euclidean metric)
From the obtained clustering of countries it follows that they can be divided
into two groups of immigration attractiveness (see Table 1 and Figure 7). The first
group includes countries of the former capitalist camp, and the second group has
the countries of the former socialist camp. Luxembourg (the object no.15) is
located out of the general mass of EU countries and cannot be added to either of
the groups.

TIKHOMIROVA & LEBEDEVA
264
Table 1. The distribution of EU countries by immigration attractiveness by homogeneous
groups
1 group Belgium, Denmark, Germany, Ireland, Greece, Spain, France, Italy, Cyprus, Malta, the Netherlands, Austria, Portugal, Finland, Sweden, England, Norway.
2 group Bulgaria, The Czech Republic, Estonia, Latvia, Lithuania, Hungary, Poland, Romania, Slovenia, Slovakia, Croatia.
Unclassified country Luxembourg.
On the map (Figure 7) these three groups are displayed. The blue color
indicates the countries included in the first group, and the red indicates those in
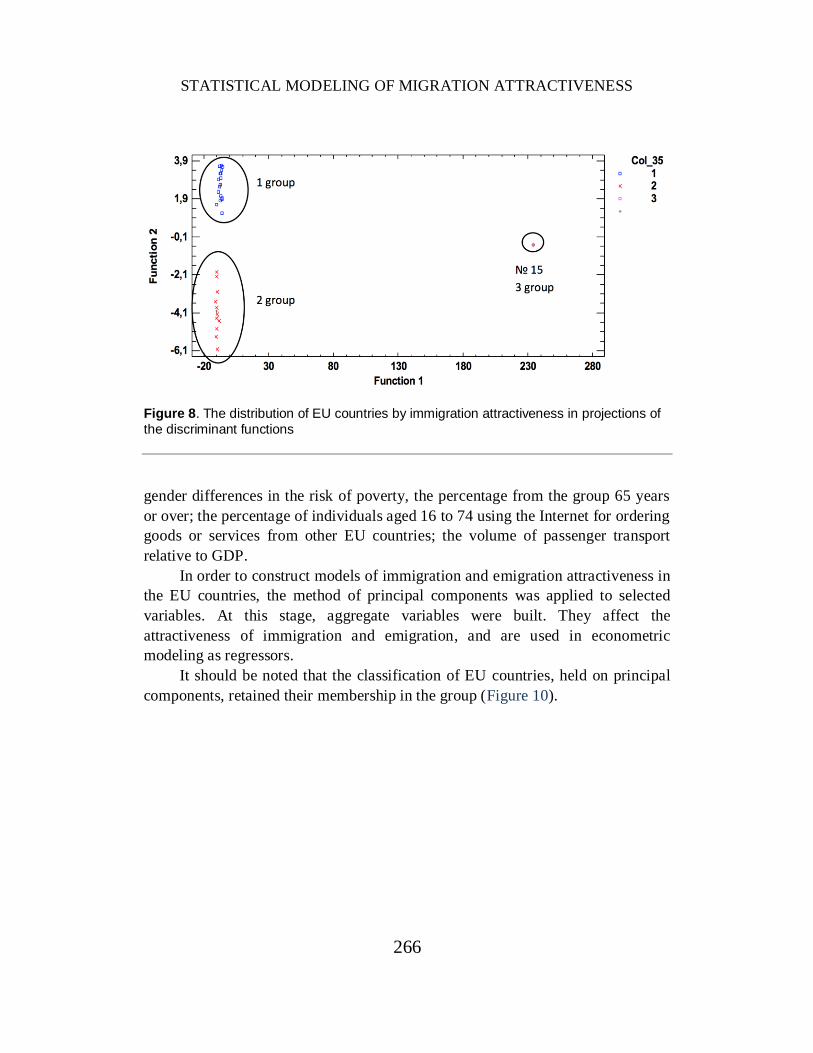
the second. Countries which are not included in the review are white. The quality of the classification was confirmed by discriminant analysis.
The percentage of correctly classified cases (in the application of discriminant
analysis) was 100%. From the results of the discriminant analysis, shown in
Figure 8, it follows that the groups of countries are located far enough away from
each other to indicate their significant differences in immigration attractiveness.
As a result of the statistical analysis 15 variables which have an impact on
immigration were selected from 84 variables, such as: final consumption
expenditure of households and non-profit organizations serving households as a
percentage of GDP, net national income as a percentage of GDP, direct
investment flows abroad as a percentage of GDP, natural decline in population
per thousand residents, the number of students in higher education per one
thousand inhabitants (the number of graduates between the ages of 20-29 years in
mathematics, science and technology per thousand population), employment rate
by highest level of education attained (the percentage of age group 20-64 years),
overcrowding rate by tenure status (the percentage of owner, with mortgage or
loan), the percentage of individuals aged 16 to 74 using the Internet for ordering
goods or services from other EU countries, the percentage of individuals in aged
16 to 74 using a mobile phone via UMTS (3G) to access the Internet, number of
deaths due to accidents, selected from standardized death rate by 100000
inhabitants, individuals seeking information on the Internet with the purpose of
learning, life expectancy at birth (healthy life years) and 7 variables which have
an impact on emigration: the gross fixed capital formation, defined as
investment’s percentage of GDP; the gross fixed capital formation, defined as
investment’s percentage of GDP; population of foreigners by citizenship; the

TIKHOMIROVA & LEBEDEVA
265
Figure 7. The dendrogram of cluster analysis of immigration attractiveness of the EU countries by using far neighbor method (the
square of the Euclidean metric)
STATISTICAL MODELING OF MIGRATION ATTRACTIVENESS
266
Figure 8. The distribution of EU countries by immigration attractiveness in projections of
the discriminant functions
gender differences in the risk of poverty, the percentage from the group 65 years
or over; the percentage of individuals aged 16 to 74 using the Internet for ordering
goods or services from other EU countries; the volume of passenger transport
relative to GDP.
In order to construct models of immigration and emigration attractiveness in
the EU countries, the method of principal components was applied to selected
variables. At this stage, aggregate variables were built. They affect the
attractiveness of immigration and emigration, and are used in econometric
modeling as regressors.
It should be noted that the classification of EU countries, held on principal
components, retained their membership in the group (Figure 10).

STATISTICAL MODELING OF MIGRATION ATTRACTIVENESS
267
Figure 9. The dendrogram of the cluster analysis of the EU immigration appeal, based on
principal components
This classification of countries is stable, which is confirmed by the results of
the discriminant analysis (Figure 10).
Figure 10. The distribution of the EU countries by main components of immigration
attractiveness in projections of the discriminant functions

TIKHOMIROVA & LEBEDEVA
268
Similar calculations were carried out by emigration in EU countries.
Classification of the EU countries of emigration attractiveness is robust and is
presented in Figure 11 and Table 2.
Figure 11. The distribution of the EU countries by main components of immigration
attractiveness in projections of the discriminant functions
Table 2. Distribution of the EU countries by emigration attractiveness by homogeneous
groups
1 group
Austria, England, Belgium, Hungary, Germany, Greece, France, Italy, Cyprus, Latvia, Lithuania, Netherlands, Norway, Poland, Portugal, Finland, Croatia, Sweden, Estonia.
2 group Denmark, Ireland, Malta.
3 group Bulgaria, Spain, Romania, Slovakia, Slovenia, Czech Republic
Unclassified country Luxembourg.
Consider the results of principal component analysis for the characteristics
of the immigration and emigration attractiveness of EU countries. The system of
equations of principal components of immigration is as follows:

STATISTICAL MODELING OF MIGRATION ATTRACTIVENESS
269
1 2 4 5 7 14 15 16 18
24 25 26 27 28 33 34
2 2 4 5 7 14 15 16 18
24 25 2
0.22 0.14 0.25 0.3 0.1 0.03 0.28 0.36
0.3 0.30 0.3 0.25 0.24 0.35 0.22
0.27 0.09 0.12 0.02 0.46 0.39 0.19 0.07
0.06 0.19 0.29
F x x x x x x x x
x x x x x x x
F x x x x x x x x
x x x
6 27 28 33 34
3 2 4 5 7 14 15 16 18
24 25 26 27 28 33 24
4 2 4 5 7 14 15
0.39 0.32 0.19 0.28
0.34 0.62 0.42 0.27 0.15 0.04 0.34 0.01
0.01 0.16 0.08 0.04 0.25 0.07 0.04
0.47 0.03 0.13 0.39 0.32 0.49 0.
x x x x
F x x x x x x x x
x x x x x x x
F x x x x x x
16 18
24 25 26 27 28 33 24
00 0.17
0.15 0.26 0.28 0.00 0.01 0.22 0.16
x x
x x x x x x x
(3)
In the component F1 the following variables have the greatest weight: 7 (the
natural population change per 1000 inhabitants), 18 (the overcrowding rate by
tenure status), 24 (the percentage of individuals aged 16 to 74 using the Internet
for ordering goods or services from other EU countries), 25 (the percentage of
individuals in aged 16 to 74 using a mobile phone via UMTS (3G) to access the
Internet), and 26 (the percentage of the inhabitance from age 16 to 74 who use a
laptop with wireless connection to access the Internet). Moreover, all variables
except 18 have positive weights. It was decided that the F1 describes the technical
equipment of the country.
In the component F2 the following variables have the greatest weight: 14
(the students in the tertiary education system per 1000 inhabitants), 15(science
and technology graduates, defined as tertiary graduates in science and technology
per 1000 of population aged 20-29 years and graduates in mathematics, science
and technology per 1000 of population aged 20-29), 27 ( number of deaths due to
accidents, selected from standardized death rate by 100000 inhabitants), and 28
(individuals seeking information on the Internet with the purpose of learning,
from individuals aged 16 to 74, who used the Internet within the last three months
before the survey). All variables included in the component have negative
weights. In this situation, it was assumed that F2 is responsible for the low level of
skills of the economically active population.
In the component F3 the following variables have the greatest weight: 2 (the
final consumption expenditure of households and non-profit institutions serving
households measured as percentage of GDP), 4 (the net national income), 16 (the
employment rate by highest level of education attained, from the age group 20-64
years. All variables included in this component have positive weights, so we
considered it appropriate to characterize the F3 as the level of production.

TIKHOMIROVA & LEBEDEVA
270
In the component F4 the following variables have the greatest weight: 2 (the
final consumption expenditure of households and non-profit institutions serving
households as a percentage of GDP), 7 (the natural population change per 1000
inhabitants), 14 (the students in the tertiary education system per 1000
inhabitants), and 15 (science and technology graduates, defined as tertiary
graduates in science and technology per 1000 of population aged 20-29 years and
graduates in mathematics, science and technology per 1000 of population aged
20-29). F4 can be interpreted as a country with a production oriented economy.
Principal component analysis applied to the variables of emigration
attractiveness identified the following factors:
1 1 2 3 5 6 7 8
2 1 2 3 5 6 7 8
3 1 2 3 5 6 7 8
0.55 0.16 0.39 0.26 0.43 0.42 0.31
0.15 0.76 0.19 0.04 0.39 0.15 0.43
0.16 0.10 0.24 0.70 0.30 0.22 0.53
F x x x x x x x
F x x x x x x x
F x x x x x x x
(4)
In the component F1 the following variables have the greatest weight: 1 (the
gross fixed capital formation, defined as investment’s percentage of GDP), 6 (the
gender differences in the risk of poverty, the percentage from the group 65 years
or over), 7 (percentage of individuals aged 16 to 74 using the Internet for ordering
goods or services from other EU countries). The first variable has a positive
weight, and the other two have negative. This suggests that F1 is responsible for
the underdevelopment of the domestic market of a country.
In the component F2 the following variables have the greatest weight: 2 (the
net national income) and 8 (the volume of passenger transport relative to GDP).
All variables included in this component have positive weights. In this regard, F2
can be interpreted as the skill level of the economically active population in a
country.
In the component F3 the following variables have the greatest weight: 5
(population of foreigners by citizenship) and 8 (the volume of passenger transport
relative to GDP). It was decided that the component F3 is responsible for the
shortage of labor in a country.
For the studied countries, binary choice econometric models were built by
panel data using principal components, which allowed us to quantify the degree of
influence of identified factors in the migration attractiveness of the EU countries.
The logit model for immigration in the EU countries, which is based on principal
components (see Equation 3) is presented in Table 3.

STATISTICAL MODELING OF MIGRATION ATTRACTIVENESS
271
As can be seen from the results of Table 3 coefficients of regressors F1 and
F2 are statistically different from zero. In our case, confidence intervals for the
parameter estimates 1̂ and
2̂ do not cover the zero on 95% confidence level.
Factors F3 and F4 are not statistically significant, so on the second iteration of the
modeling process they were removed from consideration (see Table 4). Table 3. Distribution of the EU countries by emigration attractiveness by homogeneous
groups
Table 4. Statistical characteristics of the quality of the logit model of immigration
Logit model of immigration in EU countries has the form:
1 2
1 2 1 2
0.9 0.3 0.6
0.9 0.3 0.6 0.9 0.3 0.6
11 1
1 1И
F F
i i i iF F F F
eP y x P y x
e e
(5)
Factors F1 and F2 have an impact on immigration in the EU countries. The
first factor F1 has a positive impact, but factor F2 has a negative one. It can be
reasonably argued that an increase in technical equipment (development of IT

TIKHOMIROVA & LEBEDEVA
272
technologies) and decrease of low-skilled economically active population
increases the probability of a favorable immigration situation in the country. The
level of well-being and the production orientation do not have a significant impact
on the immigration attractiveness of the country. The logit model of emigration
attractiveness, built on the principal components (see Equation 4) has the form:
1 2 3
1 2 3 1 2 3
0.8 0.4 0.7 0.6
0.8 0.4 0.7 0.6 0.8 0.4 0.7 0.6
11 1И
1 1
F F F
i i i iF F F F F F
eP y x P y x
e e
(6)
The results of the calculation of the migration logit model for our binary
data are shown in Table 5. Table 5. Statistical characteristics of the quality of the logit model of emigration
Components F1, F2, F3 and the constant have a significant impact on the
amount of emigration. Econometric modeling of the attractiveness of emigration
has revealed that with an increase in the production component of the economy
and the labor shortage in the country, as well as a reduction of the development of
the internal market, the probability of the country’s emigration attractiveness
grows.
Conclusions
From 15 variables that influence the number of immigrants in the EU, we
identified four latent factors of immigration attractiveness: F1 describes the
technical equipment of the country; F2 – the low level of skills of the
economically active population; F3 – level of production; F4 – as a production
oriented economy of the country. From 9 variables that influence the number of
immigrants in the EU, we identified three latent factors of immigration

STATISTICAL MODELING OF MIGRATION ATTRACTIVENESS
273
attractiveness: F1 – underdevelopment of the domestic market of the country; F2 –
a scientific backwardness of the country; F3 – the shortage of labor in the country.
Using an iterative approach of cluster analysis, discriminant analysis, and
factor analysis we have received the stable classification of countries by the level
of immigration and emigration. The countries were divided into two groups
according to the immigration attractiveness. The first group included former
capitalist countries (Belgium, Denmark, Germany, Ireland, Greece, Spain, France,
Italy, Cyprus, Malta, the Netherlands, Austria, Portugal, Finland, Sweden,
England, Norway) and the second included ex-socialist countries (Bulgaria,
Czech Republic, Estonia, Latvia, Lithuania, Hungary, Poland, Romania, Slovenia,
Slovakia, Croatia). This result has great importance, since during the study it was
revealed that the EU, which has long sought to achieve economic and social
equality, has not been able to overcome the historically formed significant
differences in the levels of development. Luxembourg was not identified in any
group, which confirms that Luxembourg has the economic status of a free
economic zone.
According to the emigration attractiveness, EU countries were divided into
three stable groups. The first group included Austria, Belgium, Great Britain,
Hungary, Germany, Greece, Italy, Cyprus, Latvia, Netherlands, Norway, Poland,
Portugal, Finland, France, Croatia, Sweden, Estonia, the second included
Denmark, Ireland, Malta, and the third included Bulgaria, Spain, Romania,
Slovakia, Slovenia, Czech Republic. Again Luxembourg was not identified in any
group.
Econometric modeling of the immigration attractiveness allowed us to
explain that increasing in technical equipment (development of IT technologies)
and increasing skills of the economically active population increases the
likelihood of a successful immigration situation in the country. Immigration
situation does not change with the growth of the welfare of a country and the
industrial economy orientation.
Econometric modeling of emigration attractiveness revealed that it is
determined by an increase in the production component of the country's economy
and labor shortages. With increasing underdevelopment of the domestic market
the likelihood of a favorable emigration environment is decreased. The results of
this study may be of practical interest for a variety of community and government
organizations in making effective decisions in the field of migration policy by
influencing the work of selected factors, as well as to predict the level of
migration attractiveness in different countries.

TIKHOMIROVA & LEBEDEVA
274
References
Albertinelli, A., Knauth, B., Kraszewski, K., & Thorogood, D. (Eds.).
(2011). Migrants in Europe: A statistical portrait of the first and second
generation (2011 Edition). Luxembourg: Publications Office of the European
Union. doi:10.2785/5318
Institutul National de Statistica. (n.d.). Institutul National de Statistica.
Retrieved from http://www.insse.ro/cms/
Migrants in Europe: A statistical portrait of the first and second generation,
2011 edition. (2012, March 19 – April 1). Demoscope Weekly, 503-504. Retrieved
from http://demoscope.ru/weekly/2012/0503/biblio03.php.
Migration and migrant population statistics. (2015, May). In
Eurostat: Statistics Explained. Retrieved from
http://ec.europa.eu/eurostat/statistics-
explained/index.php/Migration_and_migrant_population_statistics
National Statistics Office, Malta. (n.d.). NSO Online. Retrieved from
http://nso.gov.mt/en/Pages/NSO-Home.aspx
Sartori, F. (2012). EU Member states granted citizenship to more than 800
000 persons in 2010. Statistics in focus, 45.
http://ec.europa.eu/eurostat/documents/3433488/5585336/KS-SF-12-045-
EN.PDF/241b75f4-2dfb-4aca-b0ff-1b6c34a78dc8
Tikhomirov, N. P., Tikhomirova, T. M., Oushmaev O. S. (2011)
Econometric methods and multivariate statistical analysis: A Textbook. Moscow:
Economics.