statistical bulletin relevé statistique boletín estadístico€¦ · · 2014-09-23statistical...
TRANSCRIPT

November 2005Novembre 2005
Noviembre de 2005
Statistical BulletinRelevé statistiqueBoletín estadístico

Published May 2006
Publié en mai 2006
Publicado en mayo de 2006
International Baccalaureate Organization
Peterson House, Malthouse Avenue, Cardiff Gate
Cardiff, Wales GB CF23 8GL
United Kingdom
Phone: + 44 29 2054 7777
Fax: + 44 29 2054 7778
Web site: www.ibo.org
© International Baccalaureate Organization 2006
The International Baccalaureate Organization (IBO) was established in 1968 and is
a non-profit, international educational foundation registered in Switzerland.
The IBO is grateful for permission to reproduce and/or translate any copyright
material used in this publication. Acknowledgments are included, where
appropriate, and, if notified, the IBO will be pleased to rectify any errors or
omissions at the earliest opportunity.
IBO merchandise and publications in its official and working languages can be
purchased through the IB store at http://store.ibo.org. General ordering queries
should be directed to the sales and marketing department in Cardiff.
Phone: +44 29 2054 7746
Fax: +44 29 2054 7779
E-mail: [email protected]
Statistical Bulletin, November 2005
Relevé statistique, novembre 2005
Boletín estadístico, noviembre de 2005

Contents
Tables and graphs
Index: Key to abbreviations 1
1 Registration statistics by school November 2004 and November 2005 2
2 Candidates examined November 2004 and November 2005 3
3A Additional Diploma Programme requirements November 2005 4 Extended essays Theory of knowledge
3B Subject registration summary: Extended essay November 2005 (Graph) 5
3C Subject registration summary: Theory of knowledge November 2005 (Graph) 5
4A Analysis of examination results by subject and level November 2005 6
4B Grade distribution by group November 2005 (Graph) 11
5 Diploma candidates (D and R) distribution of points totals November 2005 12
6A Summary of IB Diploma Programme examination entries November 1990–November 2005 14
6B Summary of IB Diploma Programme examination entries November 1990–November 2005 (Graph) 15
6C Summary of IB Diploma Programme examination entries: Schools with registered 16 candidates November 1990–November 2005 (Graph)
6D Candidate entries by school November 1991–November 2005 (Graph) 17
7 Nationalities of candidates registered November 2005 18
8 Subject registration summary November 2005: Groups 1–6, school-based syllabuses and pilot programmes 20
9 Group subject entries November 1995–November 2005 (Graph) 21
Statistical Bulletin November 2005
Statistical Bulletin November 2005
Index: Key to abbreviations
Candidate statusDiploma Programme candidates must register in one of four categories: diploma, anticipated, retake or certificate. Candidates studying for the diploma may also register for additional subjects, and are referred to here as “extra certificate” candidates. These categories are identified by one of the following letters.
D Diploma A Anticipated R Retake C Certificate E Extra certificate
IBO regionsSchools that are authorized to offer the IB Diploma Programme are grouped by geographical region. The abbreviations used in these tables are the codes used by each of the IBO’s regional offices.
IBAEM Africa, Europe and the Middle East IBAP Asia-Pacific IBLA Latin America IBNA North America and Caribbean
1 © International Baccalaureate Organization 2006

Statistical Bulletin November 2005
November 2004 % of total November 2005 % of total
Number of schools following the IB Diploma Programme
1,228 - 1,373 -
Number of schools registering candidates 357 29.1% 393 28.6%
By working language
EnglishFrenchSpanish
281175
78.7%0.3%21.0%
313179
79.6%0.3%20.1%
By regional office
IBAEM IBAPIBLA IBNA
138619068
38.7%17.1%25.2%19.0%
172719555
43.8%18.1%24.2%14.0%
By Diploma Programme category
Diploma Programme entry schools
IBAEM IBAPIBLA IBNA
124
738763
34.7%
5.6%30.7%61.3%2.4%
126
739800
32.1%
5.6%31.0%63.5%
0%
TABLE 1 Registration statistics by school November 2004 and November 2005
© International Baccalaureate Organization 2006 2

Statistical Bulletin November 2005
Nov2004
Nov2005
% increase
% Male Nov
2005
Female Nov 2005
IBAEMNov2005
IBAPNov2005
IBLANov2005
IBNA Nov2005
Number of candidates examined
Diploma (D)Anticipated (A)Retake (R)Certificate (C)Extra certificate (E)
4,573
2,674264537
1,08612
5,183
2,997272738
1,14432
13.3%
12.1%3.0%
37.4%5.3%
166.7%
57.8%5.2%
14.2%22.1%0.6%
2,42446.8%
1,35112438355313
2,75953.2%
1,64614835559119
85216.4%
24255
525228
1,52629.4%
1,18720772537
2,70152.1%
1,5683
501,063
17
1042.0%
07
9160
Number of candidates awarded diploma
Percentage of candidates (D and R) awarded diploma
2,496
*81.0%
2,914
*81.5%
16.7%
0.5%
1,266
73.0%
1,648
82.3%
442
57.6%
1,106
87.8%
1,329
82.1%
37
40.7%
Number of bilingual diplomas awarded
1,170 1,353 15.6% 46.9% 566 787 214 136 1,001 2
Number ofnon-regular diplomas awarded
11 16 45.5% 0.4% 5 11 1 15 0 0
* Withdrawn candidates excluded from percentage calculation
TABLE 2 Candidates examined November 2004 and November 2005
3 © International Baccalaureate Organization 2006

Statistical Bulletin November 2005
Extended essaysNumber of candidates
E D C B A Total Percentage
Group 1 10 52 201 181 141 585 19.5%
Group 2 8 43 56 34 33 174 5.8%
Group 3 58 267 554 309 193 1,381 46.1%
Group 4 46 145 204 82 39 516 17.2%
Group 5 1 17 16 9 9 52 1.7%
Group 6 5 21 72 56 82 236 7.9%
PP - 2 2 - 2 6 0.2%
SBS - 12 20 5 9 46 1.5%
Totals 128 559 1,125 676 508 2,996
Percentage 4.3% 18.7% 37.6% 22.6% 17.0%
Group 1 Language A1Group 2 Second languageGroup 3 Individuals and societiesGroup 4 Experimental sciencesGroup 5 Mathematics and computer scienceGroup 6 The arts PP Pilot programmesSBS School-based syllabuses
Theory of knowledgeNumber of candidates
E D C B A Total
21 493 1,324 952 205 2,995
0.7% 16.5% 44.2% 31.8% 6.8%
TABLE 3A Additional Diploma Programme requirements November 2005
© International Baccalaureate Organization 2006 4

Statistical Bulletin November 2005
GRAPH 3C Subject registration summary: Theory of knowledge November 2005
GRAPH 3B Subject registration summary: Extended essay November 2005
Group 4 516
Group 5 52
Group 6 236
SBS46
PP6 Group 1
585
Group 2 174
Group 3 1,381
1,850
1,158
2
English
French
Spanish
5 © International Baccalaureate Organization 2006
Statistical Bulletin November 2005
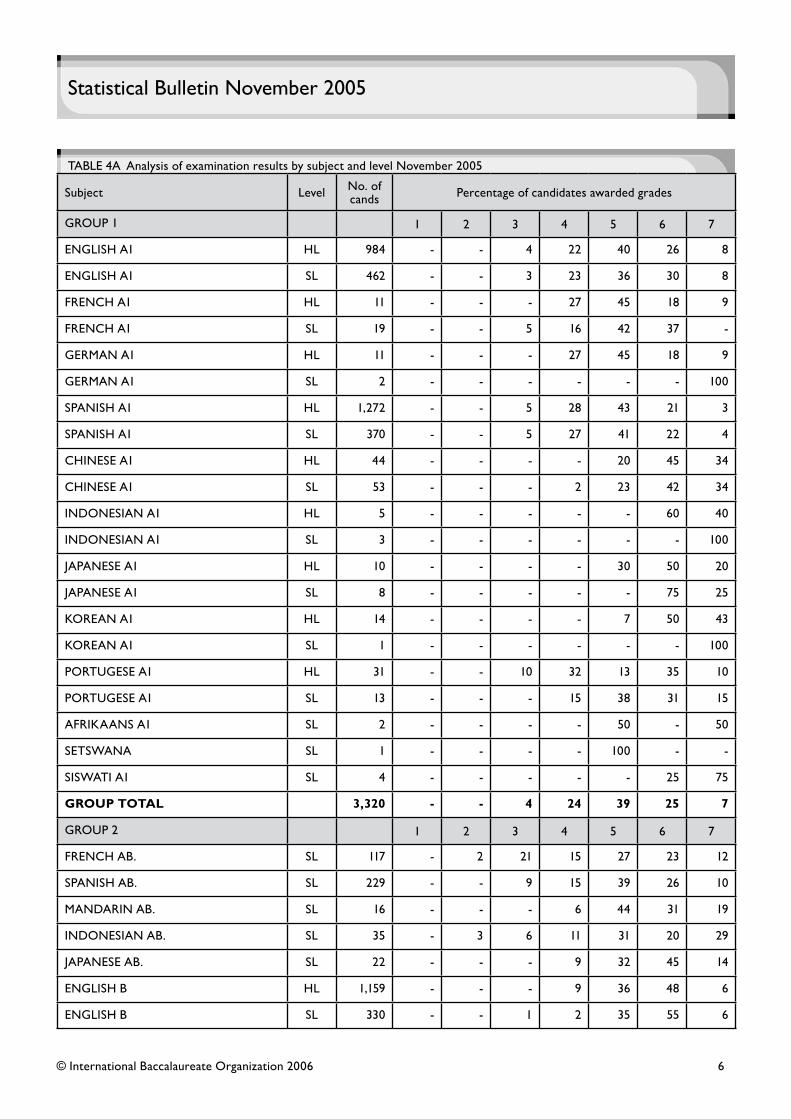
TABLE 4A Analysis of examination results by subject and level November 2005
Subject Level No. of cands Percentage of candidates awarded grades
GROUP 1 1 2 3 4 5 6 7
ENGLISH A1 HL 984 - - 4 22 40 26 8
ENGLISH A1 SL 462 - - 3 23 36 30 8
FRENCH A1 HL 11 - - - 27 45 18 9
FRENCH A1 SL 19 - - 5 16 42 37 -
GERMAN A1 HL 11 - - - 27 45 18 9
GERMAN A1 SL 2 - - - - - - 100
SPANISH A1 HL 1,272 - - 5 28 43 21 3
SPANISH A1 SL 370 - - 5 27 41 22 4
CHINESE A1 HL 44 - - - - 20 45 34
CHINESE A1 SL 53 - - - 2 23 42 34
INDONESIAN A1 HL 5 - - - - - 60 40
INDONESIAN A1 SL 3 - - - - - - 100
JAPANESE A1 HL 10 - - - - 30 50 20
JAPANESE A1 SL 8 - - - - - 75 25
KOREAN A1 HL 14 - - - - 7 50 43
KOREAN A1 SL 1 - - - - - - 100
PORTUGESE A1 HL 31 - - 10 32 13 35 10
PORTUGESE A1 SL 13 - - - 15 38 31 15
AFRIKAANS A1 SL 2 - - - - 50 - 50
SETSWANA SL 1 - - - - 100 - -
SISWATI A1 SL 4 - - - - - 25 75
GROUP TOTAL 3,320 - - 4 24 39 25 7
GROUP 2 1 2 3 4 5 6 7
FRENCH AB. SL 117 - 2 21 15 27 23 12
SPANISH AB. SL 229 - - 9 15 39 26 10
MANDARIN AB. SL 16 - - - 6 44 31 19
INDONESIAN AB. SL 35 - 3 6 11 31 20 29
JAPANESE AB. SL 22 - - - 9 32 45 14
ENGLISH B HL 1,159 - - - 9 36 48 6
ENGLISH B SL 330 - - 1 2 35 55 6
© International Baccalaureate Organization 2006 6

Statistical Bulletin November 2005
TABLE 4A Analysis of examination results by subject and level November 2005
Subject Level No. of cands Percentage of candidates awarded grades
FRENCH B HL 86 - - 3 17 31 27 21
FRENCH B SL 447 - - 4 16 34 34 11
GERMAN B HL 80 - - 6 30 39 16 9
GERMAN B SL 111 - - 1 13 28 39 20
SPANISH B HL 16 - - - - 6 31 63
SPANISH B SL 16 - - 6 6 38 44 6
ITALIAN B HL 21 - 5 5 29 38 14 10
ITALIAN B SL 10 - - 10 10 20 40 20
ARABIC B HL 4 - - - - - 50 50
ARABIC B SL 4 - - - 25 25 - 50
MANDARIN B. HL 19 - - - - - 26 74
MANDARIN B. SL 82 - - - 6 23 28 43
MOD. GREEK B SL 3 - - - - - 100 -
INDONESIAN B. HL 7 - - - 14 14 29 43
INDONESIAN B. SL 53 - - - 17 25 36 23
JAPANESE B. SL 64 - - 8 19 28 25 20
PORTUGESE B SL 6 - - - - 17 67 17
SWAHILI B HL 33 - - - 9 21 58 12
SWAHILI B SL 28 - - - 11 39 46 4
AFRIKAANS B HL 3 - - - - 33 67 -
AFRIKAANS B SL 2 - - - - 50 50 -
LATIN HL 10 - 10 - 10 20 50 10
LATIN SL 22 - 5 14 - 32 36 14
ENGLISH A2 HL 840 - - 2 22 49 23 4
ENGLISH A2 SL 140 - - 3 28 44 21 4
FRENCH A2 HL 17 - - 6 12 71 12 -
FRENCH A2 SL 12 - - - 25 50 25 -
GERMAN A2 HL 47 - - 6 23 40 28 2
GERMAN A2 SL 7 - - - 29 29 29 14
SPANISH A2 HL 62 - - - 2 40 52 6
SPANISH A2 SL 7 - - - - 43 43 14
7 © International Baccalaureate Organization 2006

Statistical Bulletin November 2005
TABLE 4A Analysis of examination results by subject and level November 2005
Subject Level No. of cands Percentage of candidates awarded grades
PORTUGESE A2 HL 37 - - - - 24 57 19
PORTUGESE A2 SL 6 - - - - 83 17 -
GROUP TOTAL 4,210 - - 3 14 38 36 9
GROUP 3 1 2 3 4 5 6 7
HISTORY SL 535 - 2 13 32 32 16 4
HIST.AFRICA HL 59 - 3 8 31 17 25 15
HIST.AMERICAS HL 308 - 3 17 37 29 13 2
HIST.ASIA/OCE HL 80 - 1 9 11 21 30 28
HIST.EUROPE HL 602 - 1 6 20 29 30 13
GEOGRAPHY HL 314 - 3 9 23 34 22 10
GEOGRAPHY SL 203 - 4 19 33 26 11 7
ECONOMICS HL 650 - 3 18 20 24 23 13
ECONOMICS SL 389 - 1 13 24 31 22 8
PHILOSOPHY HL 93 - - 4 22 29 32 13
PHILOSOPHY SL 41 - - 7 20 34 29 10
PSYCHOLOGY HL 203 - 2 8 23 30 27 9
PSYCHOLOGY SL 97 3 11 15 24 21 11 14
SOC.CUL.ANTH HL 75 - - 13 53 23 9 1
SOC.CUL.ANTH SL 29 - - 7 21 45 28 -
BUS & MAN HL 260 - 2 20 21 27 22 8
BUS & MAN SL 166 - 7 14 22 26 17 14
ISLAMIC HIST. HL 11 - - - - 45 36 18
ITGS SL 247 - 3 10 28 32 15 11
GROUP TOTAL 4,362 - 3 13 25 29 21 10
GROUP 4 1 2 3 4 5 6 7
BIOLOGY HL 770 - 4 18 26 22 22 7
BIOLOGY SL 1,215 - 5 23 34 25 11 2
CHEMISTRY HL 555 - 6 18 21 18 21 15
CHEMISTRY SL 669 - 10 17 21 21 18 12
PHYSICS HL 518 - 3 20 23 22 18 14
PHYSICS SL 523 - 10 25 29 19 11 5
© International Baccalaureate Organization 2006 8

Statistical Bulletin November 2005
TABLE 4A Analysis of examination results by subject and level November 2005
Subject Level No. of cands Percentage of candidates awarded grades
ENVIRON.SYST. SL 178 - 7 22 22 21 17 11
DESIGN TECH. HL 28 - - - 18 64 14 4
DESIGN TECH. SL 8 - - - 25 38 25 13
GROUP TOTAL 4,464 - 6 21 27 22 16 8
GROUP 5 1 2 3 4 5 6 7
MATHEMATICS HL 448 1 9 18 22 15 20 15
MATH.METHODS SL 1,773 - 7 19 21 25 17 11
MATH.STUDIES SL 1,270 - 3 11 18 30 28 10
FURTH.MATHS SL 2 - 100 - - - - -
COMPUTER SC. HL 30 - 23 37 13 10 10 7
COMPUTER SC. SL 48 6 31 21 21 12 4 4
GROUP TOTAL 3,571 - 6 16 20 25 21 11
GROUP 6 1 2 3 4 5 6 7
VISUAL ARTS HL 532 - 3 10 32 27 19 8
VISUAL ARTS A SL 254 1 8 15 35 33 7 2
VISUAL ARTS B SL 3 - - 33 33 33 - -
MUSIC HL 70 - 1 9 9 26 43 13
MUSIC SO.PERF SL 37 - - 8 35 38 14 5
MUSIC GR.PERF SL 2 - - 50 - - - 50
MUSIC COMP. SL 6 - - 17 17 33 33 -
THEATRE ARTS HL 158 - 4 15 28 37 14 3
THEATRE ARTS SL 22 5 18 36 9 32 - -
GROUP TOTAL 1,084 - 4 12 30 30 17 6
PILOT 1 2 3 4 5 6 7
TEXT AND PERF. SL 16 - - 6 25 31 38 -
ECO. AND SOC. SL 14 - - 7 21 57 7 7
FILM HL 11 - - 18 36 45 - -
FILM SL 1 - - 100 - - - -
DANCE HL 6 - - - - 17 67 17
GROUP TOTAL 48 - - 10 23 40 23 4
9 © International Baccalaureate Organization 2006

Statistical Bulletin November 2005
TABLE 4A Analysis of examination results by subject and level November 2005
Subject Level No. of cands Percentage of candidates awarded grades
SCHOOL BASED SYLLABUSES 1 2 3 4 5 6 7
CL.GK.ROM.ST. SL 18 - - - - 17 56 28
WORLD RELIG. SL 5 - 20 - 60 20 - -
ANCIENT HIST. SL 7 - - - - - 57 43
HIS&CON B/STU SL 32 - - 6 16 41 28 9
GROUP TOTAL 62 - 2 3 13 27 37 18
TOTAL ALL SUBJECTS 21,121 - 3 11 22 30 24 9
© International Baccalaureate Organization 2006 10

Statistical Bulletin November 2005
GRAPH 4B Grade distribution by group November 2005
0
5
10
15
20
25
30
35
40
45
Grade 1 Grade 2 Grade 3 Grade 4 Grade 5 Grade 6 Grade 7
Grade
Per
cen
tage
Group 1
Group 2
Group 3
Group 4
Group 5
Group 6
Pilots
SBS
11 © International Baccalaureate Organization 2006

Statistical Bulletin November 2005
Number of candidates
Points total
Diploma awarded Diploma not awarded
Diploma D Retake RTotal
D and RDiploma D Retake R
TotalD and R
Cumulative %
0 0.00%
1 0.00%
2 0.00%
3 0.00%
4 0.00%
5 0.00%
6 0.00%
7 1 1 0.03%
8 0.03%
9 0.03%
10 0.03%
11 0.03%
12 1 1 0.06%
13 1 1 0.08%
14 2 2 0.14%
15 3 3 0.23%
16 1 1 0.25%
17 10 1 11 0.57%
18 17 17 1.05%
19 27 5 32 1.95%
20 30 7 37 3.00%
21 51 18 69 4.95%
22 57 44 101 7.81%
23 89 76 165 12.48%
24 74 52 126 38 28 66 17.92%
25 101 46 147 20 27 47 23.41%
26 157 44 201 13 21 34 30.06%
27 151 34 185 12 15 27 36.06%
28 175 30 205 1 1 41.89%
29 198 18 216 48.00%
30 178 19 197 1 1 53.61%
31 185 13 198 1 1 59.24%
32 177 21 198 64.85%
TABLE 5 Diploma candidates (D and R) distribution of points totals November 2005
© International Baccalaureate Organization 2006 12

Statistical Bulletin November 2005
Number of candidates
Points total
Diploma awarded Diploma not awarded
Diploma D Retake RTotal
D and RDiploma D Retake R
TotalD and R
Cumulative %
33 169 22 191 70.25%
34 153 15 168 75.01%
35 144 8 152 79.31%
36 126 10 136 83.16%
37 107 7 114 86.39%
38 102 2 104 89.33%
39 73 1 74 91.42%
40 91 5 96 94.14%
41 68 2 70 96.12%
42 56 56 97.71%
43 39 39 98.81%
44 28 28 99.60%
45 14 14 100.00%
Totals 2,566 349 2,915 376 242 618
Points total: overall mean = 30.31
Candidates registered as D & R not meeting the requirements of the diploma are excluded from the table. Diploma not awarded for points total 24 or over: all conditions of the Diploma Programme not met. (Reference: Guide to the Diploma Programme: Article 9)
TABLE 5 Diploma candidates (D and R) distribution of points totals November 2005
13 © International Baccalaureate Organization 2006

Statistical Bulletin November 2005
Year No. of schools entered
% inc. No. of cands.
examined
% inc. Average no. of cands.
per school
Dcands.
Average D cands.
per school
R cands.
Average R cands.
per school
C & E cands.
Average C & E cands.
per school
Acands.
Average A cands.
per school
1990
1991
1992
1993
1994
1995
1996
1997
1998
1999
2000
2001
2002
2003
2004
2005
27
34
47
54
70
71
89
91
165
242
236
271
294
343
357
393
-
26%
38%
15%
30%
1%
25%
2%
55%
47%
-2%
14%
8.5%
16.6%
4.1%
10.1%
720
801
1,152
1,474
1,820
2,035
2,415
2,827
3,325
3,895
4,166
4,246
4,429
4,703
4,573
5,183
-
11%
44%
28%
23%
12%
19%
17%
18%
17%
7%
1.9%
4.3%
6.2%
-2.8%
13.3%
26.7
23.6
24.5
27.2
26.0
28.7
27.1
31.1
20.2
16.1
17.7
15.7
15.1
13.7
12.8
13.2
314
410
556
760
996
1,088
1,190
1,460
1,687
1,982
2,213
2,352
2,422
2,641
2,674
2,997
11.6
12.1
11.8
14.1
14.2
15.3
13.4
16.0
10.2
8.2
9.4
8.7
8.2
7.7
7.5
7.6
12
6
17
19
24
26
34
57
186
407
377
402
521
542
537
738
0.4
0.2
0.4
0.4
0.3
0.4
0.4
0.6
1.1
1.7
1.6
1.5
1.8
1.6
1.5
1.9
352
357
535
635
713
855
991
1,145
1,287
1,296
1,324
1,239
1,251
1,242
1,098
1,176
13.0
10.5
11.4
11.8
10.2
12.0
11.1
12.6
7.8
5.4
5.6
4.6
4.3
3.6
3.1
3.0
42
28
44
60
87
66
200
165
165
210
252
253
235
278
264
272
1.6
0.8
0.9
1.1
1.2
0.9
2.3
1.8
1.0
0.9
1.1
0.9
0.8
0.8
0.7
0.7
TABLE 6A Summary of IB Diploma Programme examination entries November 1990–November 2005
© International Baccalaureate Organization 2006 14

Statistical Bulletin November 2005
GRAPH 6B Summary of IB Diploma Programme examination entries November 1990–November 2005
Anticipated
Certificate and extra
Diploma and retake
Total candidates
Year
Nu
mb
er o
f ca
nd
idat
es
1990
1991
1992
1993
1994
1995
1996
1997
1998
1999
2000
2001
2002
2003
2004
2005
0
1,000
2,000
3,000
4,000
5,000
6,000
15 © International Baccalaureate Organization 2006

Statistical Bulletin November 2005
GRAPH 6C Summary of IB Diploma Programme examination entries: Schools with registered candidates November 1990–November 2005
0
50
100
150
200
250
300
350
400
1990 1991 1992 1993 1994 1995 1996 1997 1998 1999 2000 2001 2002 2003 2004 2005
Nu
mb
er o
f sc
ho
ols
Year
© International Baccalaureate Organization 2006 16

Statistical Bulletin November 2005
GRAPH 6D Candidate entries by school November 1991–November 2005
19941993
19921991
19951996
19971998
19992000
20012002
20032004
2005
Nu
mb
er o
f sc
ho
ols
Number of candidatesper school
Year
0–10
11–3
0
31–5
0
51–8
0
81–1
20
121–
200
200+
0
50
100
150
200
250
300
17 © International Baccalaureate Organization 2006
Statistical Bulletin November 2005
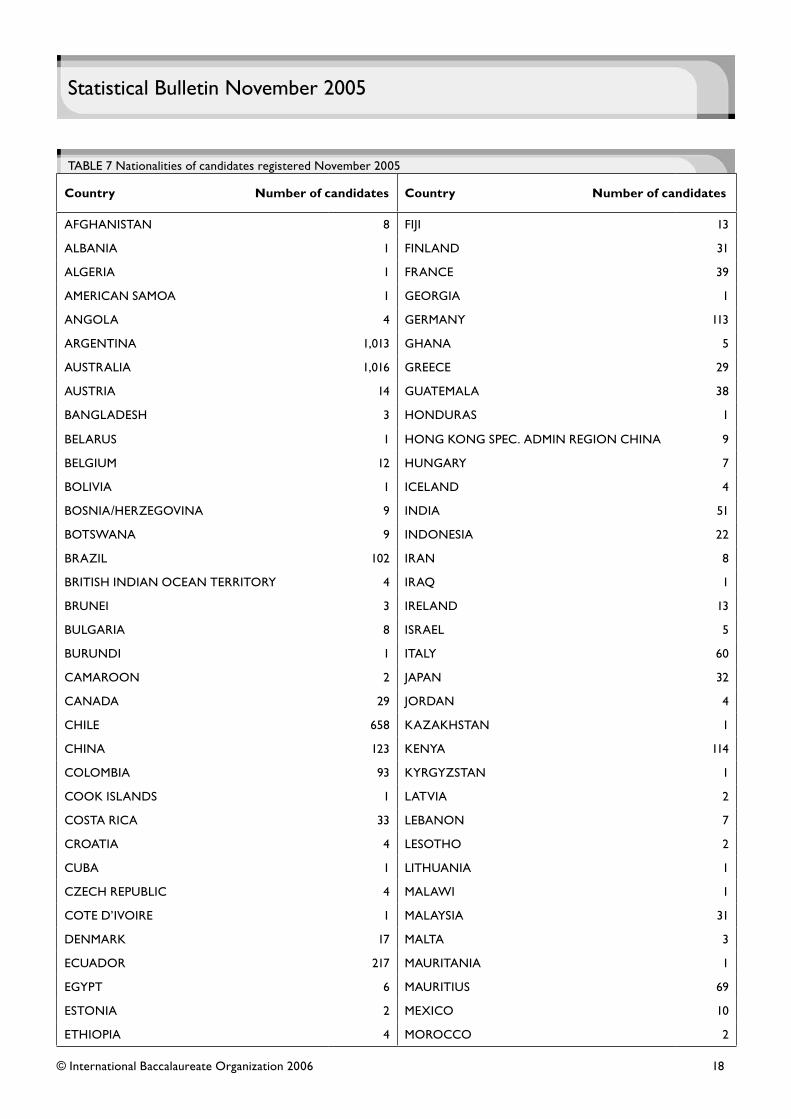
TABLE 7 Nationalities of candidates registered November 2005
Country Number of candidates Country Number of candidates
AFGHANISTAN 8 FIJI 13
ALBANIA 1 FINLAND 31
ALGERIA 1 FRANCE 39
AMERICAN SAMOA 1 GEORGIA 1
ANGOLA 4 GERMANY 113
ARGENTINA 1,013 GHANA 5
AUSTRALIA 1,016 GREECE 29
AUSTRIA 14 GUATEMALA 38
BANGLADESH 3 HONDURAS 1
BELARUS 1 HONG KONG SPEC. ADMIN REGION CHINA 9
BELGIUM 12 HUNGARY 7
BOLIVIA 1 ICELAND 4
BOSNIA/HERZEGOVINA 9 INDIA 51
BOTSWANA 9 INDONESIA 22
BRAZIL 102 IRAN 8
BRITISH INDIAN OCEAN TERRITORY 4 IRAQ 1
BRUNEI 3 IRELAND 13
BULGARIA 8 ISRAEL 5
BURUNDI 1 ITALY 60
CAMAROON 2 JAPAN 32
CANADA 29 JORDAN 4
CHILE 658 KAZAKHSTAN 1
CHINA 123 KENYA 114
COLOMBIA 93 KYRGYZSTAN 1
COOK ISLANDS 1 LATVIA 2
COSTA RICA 33 LEBANON 7
CROATIA 4 LESOTHO 2
CUBA 1 LITHUANIA 1
CZECH REPUBLIC 4 MALAWI 1
COTE D’IVOIRE 1 MALAYSIA 31
DENMARK 17 MALTA 3
ECUADOR 217 MAURITANIA 1
EGYPT 6 MAURITIUS 69
ESTONIA 2 MEXICO 10
ETHIOPIA 4 MOROCCO 2
© International Baccalaureate Organization 2006 18

Statistical Bulletin November 2005
Country Number of candidates Country Number of candidates
MOZAMBIQUE 1 SIERRA LEONE 1
NEPAL 2 SINGAPORE 19
NETHERLANDS 45 SLOVAKIA 2
NEW ZEALAND 146 SLOVENIA 1
NICARAGUA 2 SOUTH AFRICA 42
NIGERIA 3 SOUTH KOREA 28
NORTH KOREA 14 SPAIN 46
NORWAY 27 SRI LANKA 11
OCCUPIED PALESTINIAN TERRITORY 3 SWAZILAND 17
OMAN 1 SWEDEN 46
OTHER 1 SWITZERLAND 50
PAKISTAN 6 SYRIA 2
PANAMA 5 TAIWAN 7
PAPUA NEW GUINEA 1 TANZANIA 26
PARAGUAY 24 THAILAND 6
PERU 392 TURKEY 14
PHILIPPINES 11 UGANDA 2
POLAND 13 UKRAINE 3
PORTUGAL 17 UNITED KINGDOM 180
QATAR 1 UNITED STATES OF AMERICA 190
ROMANIA 5 URUGUAY 60
RUSSIAN FEDERATION 18 VENEZUELA 7
RWANDA 3 VIETNAM 7
SAUDI ARABIA 3 ZAMBIA 1
SERBIA AND MONTENEGRO 4 ZIMBABWE 22
TABLE 7 Nationalities of candidates registered November 2005
Total number of nationalities: 120Candidates with dual nationality (included in above): 495
19 © International Baccalaureate Organization 2006

Statistical Bulletin November 2005
Subject registrations Number of subjectsSubjects with internal
assessment
English French Spanish TotalHigher
levelStandard
levelTotal
Higher level
Standard level
Total
Group 1
Group 2
Group 3
Group 4
Group 5
Group 6
SBS*
Pilots**
-
-
3,247
3,380
2,355
558
62
49
-
-
-
-
-
-
-
-
-
-
1,187
1,188
1,293
550
-
-
3,368
4,341
4,434
4,568
3,648
1,108
62
49
10
16
11
4
2
3
-
2
12
24
8
5
4
6
4
3
22
40
19
9
6
9
4
5
10
16
11
4
2
3
-
2
12
23
8
5
4
6
4
3
22
39
19
9
6
9
4
5
Totals 9,651 - 4,218 21,578 48 66 114 48 65 113
* School-based syllabuses: 100% assessment by school, with moderation by assessor** Pilot programmes
TABLE 8 Subject registration summary November 2005: Groups 1–6, school-based syllabuses and pilot programmes
© International Baccalaureate Organization 2006 20

Statistical Bulletin November 2005
GRAPH 9 Group subject entries November 1995–November 2005G
roup
1
Gro
up 2
Gro
up 3
Gro
up 4
Gro
up 5
Gro
up 6 1995
1996
1997
1998
1999
2000
2001
2002
2003
2004
0
500
1,000
1,500
2,000
2,500
3,000
3,500
4,500
4,000
5,000
Nu
mb
er o
f ca
nd
idat
es
Group
Year
2005
21 © International Baccalaureate Organization 2006