statistical analysis - rempec: home tools... · regional marine pollution emergency response centre...
TRANSCRIPT
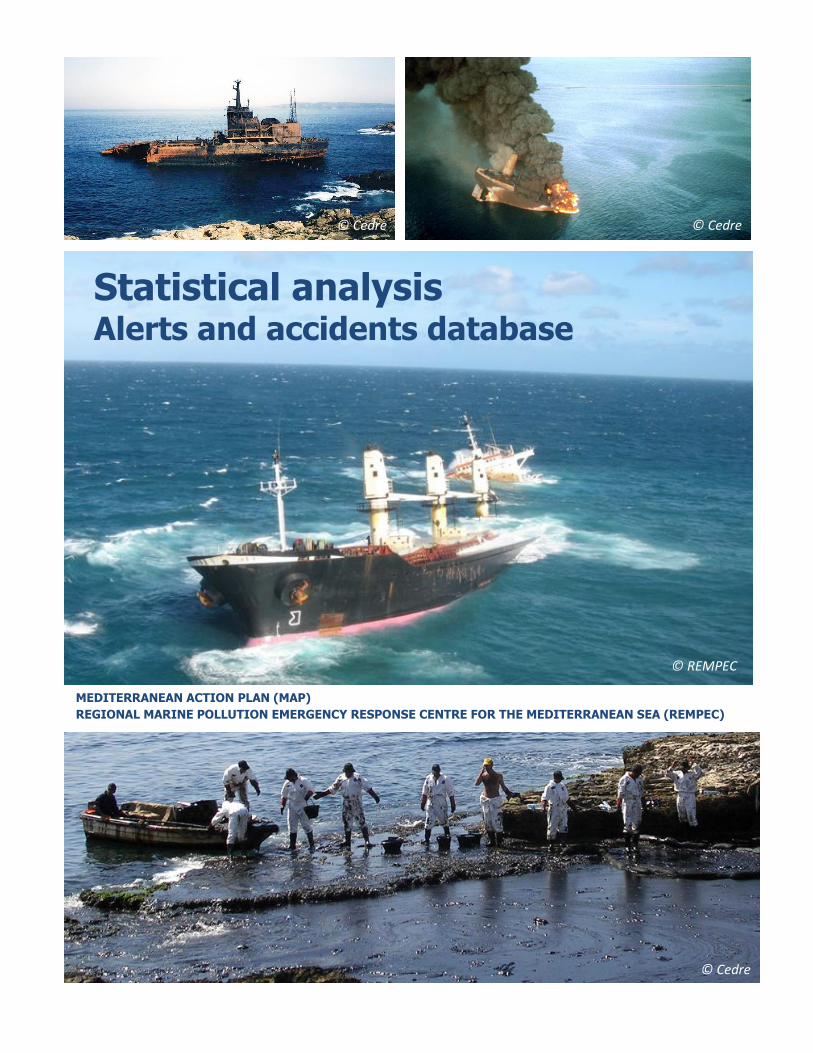
Statistical analysis Alerts and accidents database
MEDITERRANEAN ACTION PLAN (MAP)
REGIONAL MARINE POLLUTION EMERGENCY RESPONSE CENTRE FOR THE MEDITERRANEAN SEA (REMPEC)
© Cedre © Cedre
© Cedre
© REMPEC

REGIONAL MARINE POLLUTION EMERGENCY
RESPONSE CENTRE FOR THE MEDITERRANEAN SEA (REMPEC)
MEDITERRANEAN ACTION PLAN
Statistical analysis
Alerts and accidents database
Regional Information System – RIS C2
www.rempec.org
2011
I
Note
This document is aimed only at facilitating access to information in the field of cooperation in preventing
pollution from ships and, in cases of emergency, combating pollution of the Mediterranean Sea. Data is
made available for information purposes only. REMPEC assumes no liability whatsoever for any
potentially damaging consequences which could result from the interpretation and use of information
presented in this document.
The designations employed and the presentation of the material in this document do not imply the
expression of any opinion whatsoever on the part of IMO, UNEP, MAP and REMPEC concerning the legal
status of any State, Territory, city or area, or of its authorities, or concerning the delimitation of their
frontiers or boundaries.
Cover photos:
1. Oil pumping from the grounded and burnt ship Aegean
Sea © Cedre
2. Haven in fire in the Golf of Genoa © Cedre
3. © REMPEC
4. Clean-up of the Lebanese Coast © Cedre
The Statistical Analysis is downloadable from REMPEC’s website (www.rempec.org) in the section
“Tools/Alerts and Accidents Database”.
For bibliographic purposes this document should be cited as follows:
IMO/UNEP: Regional Information System; Part C2, Statistical Analysis - Alerts and Accidents Database,
REMPEC, February 2011
II
Table of contents
Executive summary ........................................................................................................................................1
Introduction ....................................................................................................................................................3
Overview .........................................................................................................................................................5
Incidents causing or likely to cause pollution by oil (1977-2010) ..................................................................6
Quantities of oil spilled and number of accidents ......................................................................................6
Places of accidents with a release above 100 tonnes ............................................................................. 10
Type of accidents ..................................................................................................................................... 11
Type of accidents for released quantities above 700 tonnes.............................................................. 13
Type of accidents for released quantities between 101 and 700 tonnes ........................................... 15
Type of accidents for released quantities below 100 tonnes ............................................................. 16
Type of accidents when no release occurred ...................................................................................... 17
Type of accident leading to a proven release but with an unknown amount .................................... 17
Type of accident leading to spillage .................................................................................................... 18
Type of vessel involved ........................................................................................................................ 18
Age of vessel ............................................................................................................................................ 19
Incidents causing or likely to cause pollution by HNS other than oil (1988-2010) ..................................... 21
Number of accidents ............................................................................................................................... 21
Quantity of HNS other than oil spilled between 1988 and 2010 ............................................................ 22
Type of accidents ..................................................................................................................................... 24
Type of vessel .......................................................................................................................................... 25
Age of the ships at the time of the accident ........................................................................................... 26

III
List of figures
Figure 1 : Quantity of oil spilled in accidents, in tonnes (including major accidents) ....................................7
Figure 2 : Quantity of oil spilled in accidents (without major accidents) .......................................................8
Figure 3 : Number of accidents involving oil reported between 1977 and 2010 ...........................................9
Figure 4 : Average number of accidents (with trend line) and average spilled quantity (x100t) for each
month (1977-2010). .................................................................................................................................... 10
Figure 5 : Countries of occurrence of accidents involving an oil spill above 100 tonnes (1977-20010) ..... 11
Figure 7 : Number of accidents by type (percentage) ................................................................................. 12
Figure 9 : Released quantities by accident type (releases above 700 tonnes) ........................................... 14
Figure 10 : Proportion of accidents with released quantities between 101 and 700 tonnes (1977-2010) 15
Figure 11 : Released quantities by accident type (releases between 101 and 700 tonnes) ....................... 15
Figure 12 : Proportion of accidents with released quantities below 100 tonnes (1977-2010)................... 16
Figure 13 : Released quantities by accident type (releases below 100 tonnes) ......................................... 16
Figure 14 : Type of accidents with no released quantities (1977-2010) ..................................................... 17
Figure 15 : Proportion of accidents with releases proven but quantity unknown (1977-2010) ................. 17
Figure 16 : Proportion of accidents with proven release by type (1977-2010) .......................................... 18
Figure 17 : Types of vessels involved in accidents....................................................................................... 19
Figure 18 : Age of the ships involved in accidents (1977-2010) .................................................................. 19
Figure 19 : Average age of ships at the time of the accident (accidents involving oil), and average age of
the world and of the Mediterranean fleet. ................................................................................................. 20
Figure 20 : Number of accidents involving HNS other than oil reported between 1988 and 2010 ............ 21
Figure 21 : Quantity of HNS spilled in accidents (including major releases of more than 5,000t) ............. 22
Figure 22 : Quantity of HNS spilled in accidents (without major accidents) ............................................... 23
Figure 23 : Distribution of the type of accidents involving HNS (1988-2010) ............................................. 24
Figure 24 : Number of accidents involving HNS by type (percentage) ........................................................ 25
Figure 25 : Types of vessels involved in HNS accidents ............................................................................... 25
Figure 26 : Age of the ships involved in accidents (1988-2010) (HNS) ........................................................ 26
List of tables
Table 1 : Releases of oil above 5,000 tonnes .................................................................................................8
Table 2 : Accidents with released quantities of oil above 700 tonnes ........................................................ 13
Table 3 : Accidents involving releases of HNS other than oil above 2,000 tonnes ..................................... 23

1
Executive summary
This document is a statistical analysis of the data reported in the Alerts and accidents database
maintained by REMPEC since 1977, on oil spills and accidents likely to cause spillages of oil in the
Mediterranean. Accidents involving other hazardous and noxious substances (HNS) are also reported
since 1988. The main sources of information are the Lloyd’s Casualty Reporting Services (LCRS) and the
emergency reports sent to REMPEC by its national focal points of the Mediterranean countries. As a
consequence this database cannot be considered as a comprehensive list of all the spills occurring in the
Mediterranean.
The accidents reported in the database have led to the spillage of more than 310.000 tonnes of oil since
1977, and at least 120.000 tonnes of HNS other than oil since 1988. These amounts are estimates of the
minimum amounts spilled in the Mediterranean Sea, related to shipping.
In 1991, the explosion and fire on board of the MT HAVEN off Genoa, followed by the sinking of the ship
with its cargo of 144.000 tonnes of crude oil, led to the biggest quantity of oil released in the
Mediterranean. The major accident involving other HNS is the sinking of the CONTINENTAL LOTUS, also
in 1991, with more than 50,000t of iron ore on board in the East of the basin.
The increase in the number of accidents involving oil reported in the database can partly be explained by
the compliance of the countries to report casualties to the Centre, as required by the Guidelines for
cooperation in Combating Oil Pollution. Accidents involving HNS are fewer than the ones involving oil (an
average of 5.0 accidents reported per year, versus 19.9 accidents involving oil, on the same period 1988-
2010), and their overall trend is a significant decrease in the number of accidents. The overall trend for
the amount of substances released per year, both for oil and other HNS, seems to be a decrease; a total
amount of about 10t of HNS spilled has been reported in the database since 2005.
Considering the seasonality of the accidents reported, more accidents involving oil occur during autumn
and winter, seasons known to be less favourable to navigation in terms of sea conditions.
The major type of accident reported involving oil is grounding; however spills above 700t are mainly due
to collisions. For other HNS, sinking is the most frequent type of accident reported.

2
3
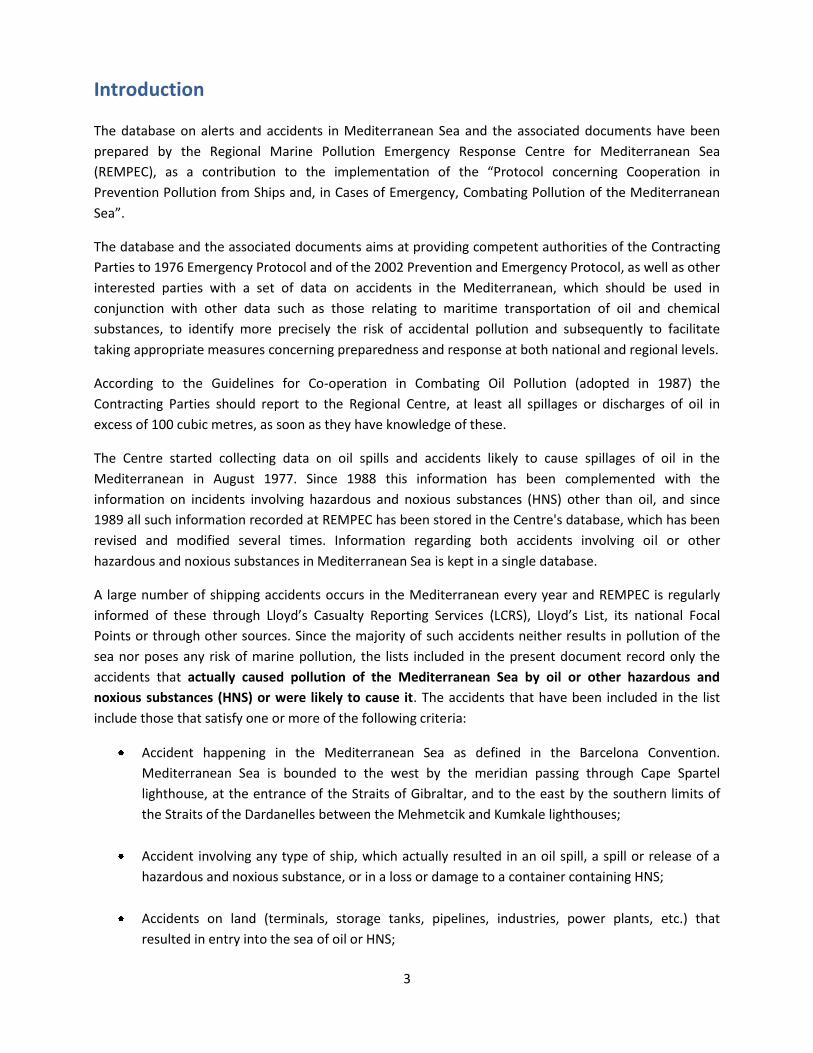
Introduction
The database on alerts and accidents in Mediterranean Sea and the associated documents have been
prepared by the Regional Marine Pollution Emergency Response Centre for Mediterranean Sea
(REMPEC), as a contribution to the implementation of the “Protocol concerning Cooperation in
Prevention Pollution from Ships and, in Cases of Emergency, Combating Pollution of the Mediterranean
Sea”.
The database and the associated documents aims at providing competent authorities of the Contracting
Parties to 1976 Emergency Protocol and of the 2002 Prevention and Emergency Protocol, as well as other
interested parties with a set of data on accidents in the Mediterranean, which should be used in
conjunction with other data such as those relating to maritime transportation of oil and chemical
substances, to identify more precisely the risk of accidental pollution and subsequently to facilitate
taking appropriate measures concerning preparedness and response at both national and regional levels.
According to the Guidelines for Co-operation in Combating Oil Pollution (adopted in 1987) the
Contracting Parties should report to the Regional Centre, at least all spillages or discharges of oil in
excess of 100 cubic metres, as soon as they have knowledge of these.
The Centre started collecting data on oil spills and accidents likely to cause spillages of oil in the
Mediterranean in August 1977. Since 1988 this information has been complemented with the
information on incidents involving hazardous and noxious substances (HNS) other than oil, and since
1989 all such information recorded at REMPEC has been stored in the Centre's database, which has been
revised and modified several times. Information regarding both accidents involving oil or other
hazardous and noxious substances in Mediterranean Sea is kept in a single database.
A large number of shipping accidents occurs in the Mediterranean every year and REMPEC is regularly
informed of these through Lloyd’s Casualty Reporting Services (LCRS), Lloyd’s List, its national Focal
Points or through other sources. Since the majority of such accidents neither results in pollution of the
sea nor poses any risk of marine pollution, the lists included in the present document record only the
accidents that actually caused pollution of the Mediterranean Sea by oil or other hazardous and
noxious substances (HNS) or were likely to cause it. The accidents that have been included in the list
include those that satisfy one or more of the following criteria:
Accident happening in the Mediterranean Sea as defined in the Barcelona Convention.
Mediterranean Sea is bounded to the west by the meridian passing through Cape Spartel
lighthouse, at the entrance of the Straits of Gibraltar, and to the east by the southern limits of
the Straits of the Dardanelles between the Mehmetcik and Kumkale lighthouses;
Accident involving any type of ship, which actually resulted in an oil spill, a spill or release of a
hazardous and noxious substance, or in a loss or damage to a container containing HNS;
Accidents on land (terminals, storage tanks, pipelines, industries, power plants, etc.) that
resulted in entry into the sea of oil or HNS;
4
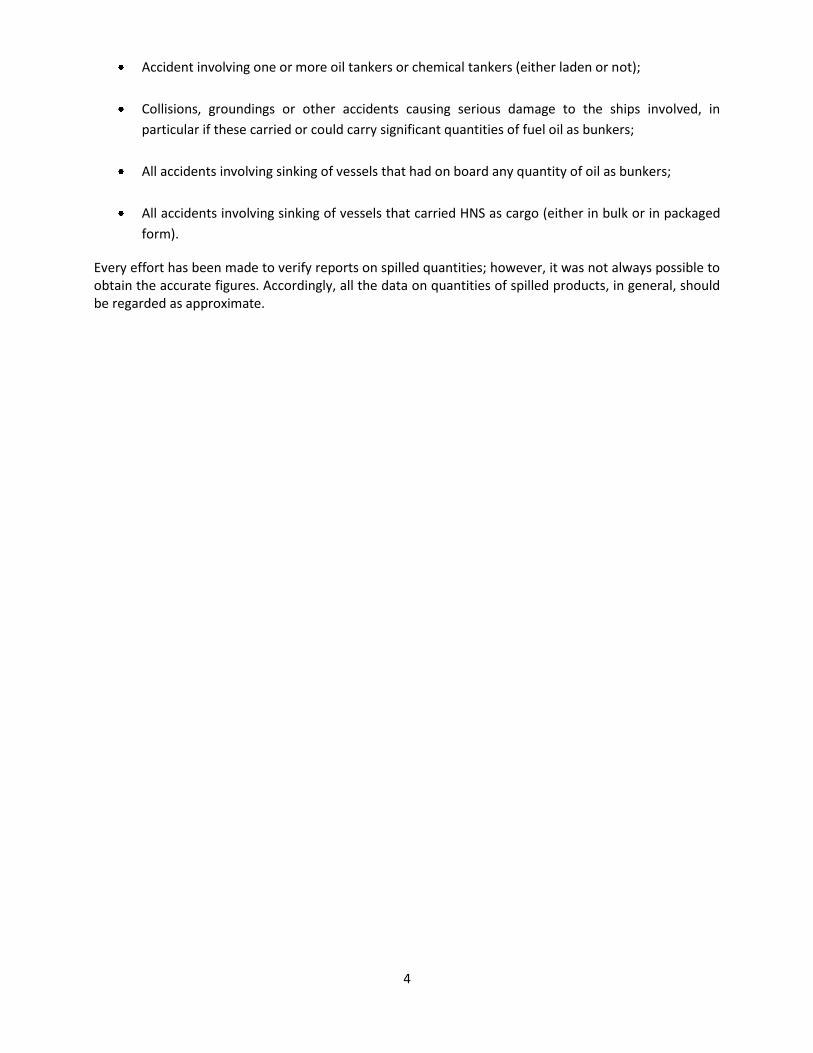
Accident involving one or more oil tankers or chemical tankers (either laden or not);
Collisions, groundings or other accidents causing serious damage to the ships involved, in
particular if these carried or could carry significant quantities of fuel oil as bunkers;
All accidents involving sinking of vessels that had on board any quantity of oil as bunkers;
All accidents involving sinking of vessels that carried HNS as cargo (either in bulk or in packaged
form).
Every effort has been made to verify reports on spilled quantities; however, it was not always possible to obtain the accurate figures. Accordingly, all the data on quantities of spilled products, in general, should be regarded as approximate.

5
Overview
This document presents a brief statistical analysis from data gathered by the Centre since 1977. The
analysis is aimed at extracting from the accident database general tendencies depending on:
released quantities;
number of accidents;
period of the year;
accident type;
vessel type;
vessel age.
These themes are discussed separately for accidents involving oil or HNS.
The total number of accidents that caused or were likely to cause pollution of the Mediterranean Sea by
oil and HNS, which occurred in the Mediterranean as defined in the Barcelona Convention and which
were reported to REMPEC between August 1977 and December 2010, reads 659; they led to the spillage
of approximately 310,000t of oil and 120,000t of HNS.
Number of accidents
Involving oil 545 Involving HNS other than oil 114 Total 659
Quantities released
Oil 312 531 t HNS other than oil 120 858 t Total 433 389 t

6
Incidents causing or likely to cause pollution by oil (1977-2010)
Quantities of oil spilled and number of accidents
Between 1 August 1977 and 31 December 2010, approximately 310,000 tonnes of oil entered into the
Mediterranean Sea as a result of accidents; the total quantity quoted above includes:
12,200 tonnes of heavy fuel oil and slops spilled from Oil/Bulk/Ore carrier “SEA SPIRIT” as a
result of her collision with LPG Carrier “HESPERUS”, west of Gibraltar. This quantity was added to
the total amount of oil spilled into the Mediterranean Sea due to the fact that although the
accident occurred outside the boundaries of the Mediterranean, as defined in the Barcelona
Convention, the spilled oil entered the Mediterranean carried by winds and currents and posed a
serious threat to the waters and coasts of Morocco, Spain and Algeria.
144,000 tonnes of crude oil spilled due to the explosion and fire on board MT “HAVEN” off
Genoa in April 1991. These events resulted in the loss of her entire cargo of 144 000 tonnes of
crude oil. Some of this oil burnt and it was not possible to establish the exact quantity of oil
which was actually spilled into the sea. Therefore, the figures presented in this report take into
consideration the amount of 144,000 tonnes spilled, as the quantity of oil released to the
environment.
15,000 tonnes released due to the bombing of the power plant of Jieh, in Lebanon, between the
13th and 15th
of July 2006. Located 30 km south of Beirut on the Lebanese coast, the bombing
caused fire of several storage tanks. The fuel which did not burn was released in the marine
environment. As mentioned in the previous case, the burnt quantity remains unknown;
consequently it was not possible to define the accurate released quantity. For this study, the
superior range of the estimate, communicated by the Lebanese authorities, was retained
(between 13,000 and 15,000 tonnes).
On the other hand, these figures do not include the oil spilled in 53 accidents for which the quantity of
released oil remains “UNKNOWN”. However, it is not likely that these quantities were significant and
that the overall picture would be much changed if there were to be added to the above-mentioned
figures.
7
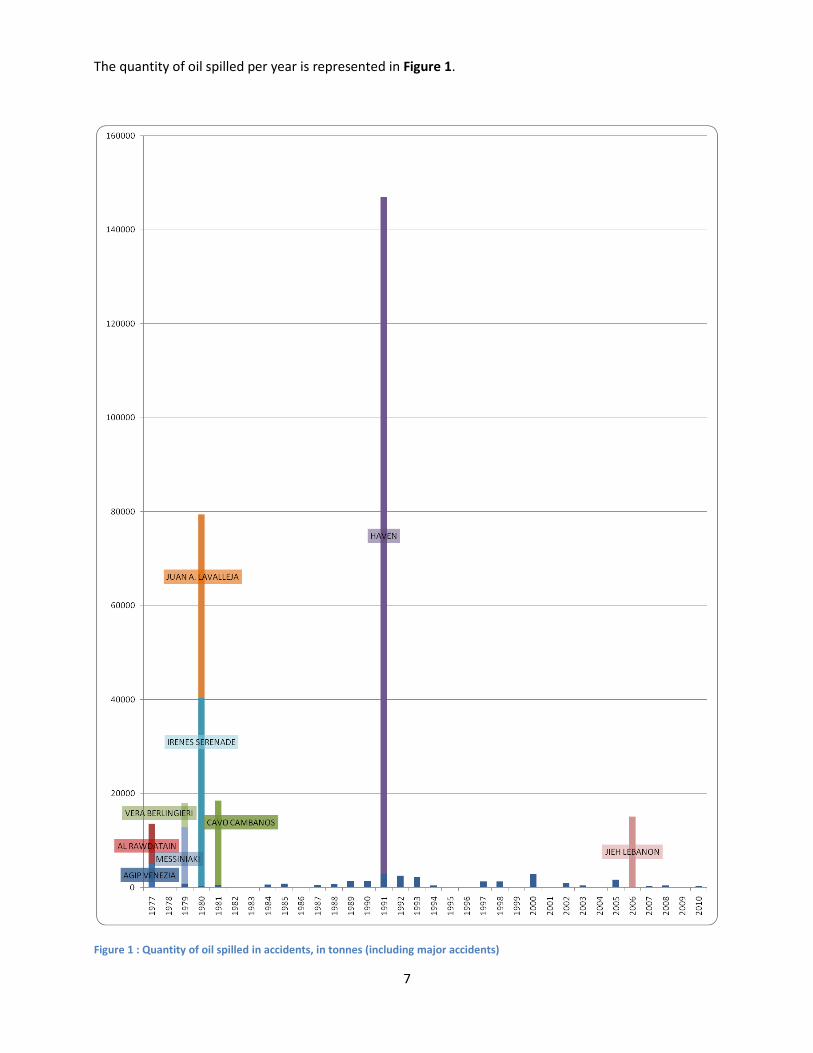
The quantity of oil spilled per year is represented in Figure 1.
Figure 1 : Quantity of oil spilled in accidents, in tonnes (including major accidents)

8
This graph reflects mainly the major accidents, leading to spills above 5000 tonnes of oil. These accidents
are rare but have a deep impact on the environment. It can be observed that major oil spills occurred
frequently between 1977 and 1981 and have become rare events since then. More details about these 9
accidents can be found in Table 1.
Table 1 : Releases of oil above 5,000 tonnes between 1977 and 2010
Vessel name Release quantity (tonnes)
Year Location Accident type
HAVEN 144,000 1991 Italy, off Genoa Fire/Explosion IRENES SERENADE 40,000 1980 Greece, Navarino Bay Fire/Explosion JUAN A. LAVALLEJA 39,000 1980 Algeria, Arzew Harbour Grounding CAVO CAMBANOS 18,000 1981 Spain, Tarragona Fire/Explosion
N/A 15,000 2006 Lebanon, Jieh War operations MESSINIAKI FRONTIS 12,000 1979 Greece, Off Kaloi Limenes Grounding
AL RAWDATAIN 8,500 1977 Italy, Multedo (Genoa) Cargo transfer failure VERA BERLINGIERI 5,200 1979 Italy, West of Fiumicino Collision
AGIP VENEZIA 5,000 1977 Italy, S.E. Sicily Collision
Figure 2 represents the quantities of oil spilled annually in the Mediterranean Sea excluding the major
incidents referred in table 1, with a peak in the early 90’s.
Figure 2 : Quantity of oil spilled in accidents (without major accidents)

9
Figure 3 shows the number of accidents for each year, distinguishing between those which resulted in an
actual spill and those which did not lead to a proven release of oil. It appears that the overall trend is an
increase in the number of accidents since 1977. However, the number of accidents resulting in an oil spill
dropped from 56% of the total number of accidents for the period 1977 – 1993, to 47% for the period
1994 – 2010. The increase in the number of accident reported is most likely due to a better compliance
by the Contracting Parties to the Barcelona Convention to report more casualties (and thus to record
more data), as required by the Article 9 of the Prevention and Emergency Protocol. According to the
Guidelines for Co-operation in Combating Oil Pollution (adopted in 1987) the Contracting Parties should
report to REMPEC at least all spillages or discharges of oil in excess of 100 cubic metres. However some
of the countries now also reports minor accidents, even if there is a very small amount of oil spilled as a
consequence. For instance all the accidents leading to a release reported in 2009 were minor accidents
of 1 tonnes or less. Therefore the overall trend of the number of accidents in the Mediterranean should
not be considered as increasing but as a better compliance to the regional communication procedure.
0
5
10
15
20
25
30
35
40
19
77
19
78
19
79
19
80
19
81
19
82
19
83
19
84
19
85
19
86
19
87
19
88
19
89
19
90
19
91
19
92
19
93
19
94
19
95
19
96
19
97
19
98
19
99
20
00
20
01
20
02
20
03
20
04
20
05
20
06
20
07
20
08
20
09
20
10
With release Without release Unknown
Figure 3 : Number of accidents involving oil reported between 1977 and 2010
The average number of ships involved in accidents and average quantity of oil spilled for each month of
the year over the 1977 – 2010 period is shown in Figure 4. Although these figures would need to be
confirmed by meteorological data, they seem to show that the occurrence of accidents is influenced by
weather conditions. It appears that the period from October to February, which is known to be the most
unfavourable time to navigation in terms of sea conditions, is the time of the year with the highest
number of accidents. The largest quantities of oil spilled were recorded for the months of January,
February and October.

10
Figure 4 : Average number of accidents (with trend line) and average spilled quantity (x100t) for each month (1977-2010). The Haven accident of April 91 is separated (orange) since the quantity spilled distorts the graph and is not linked with the general trend.
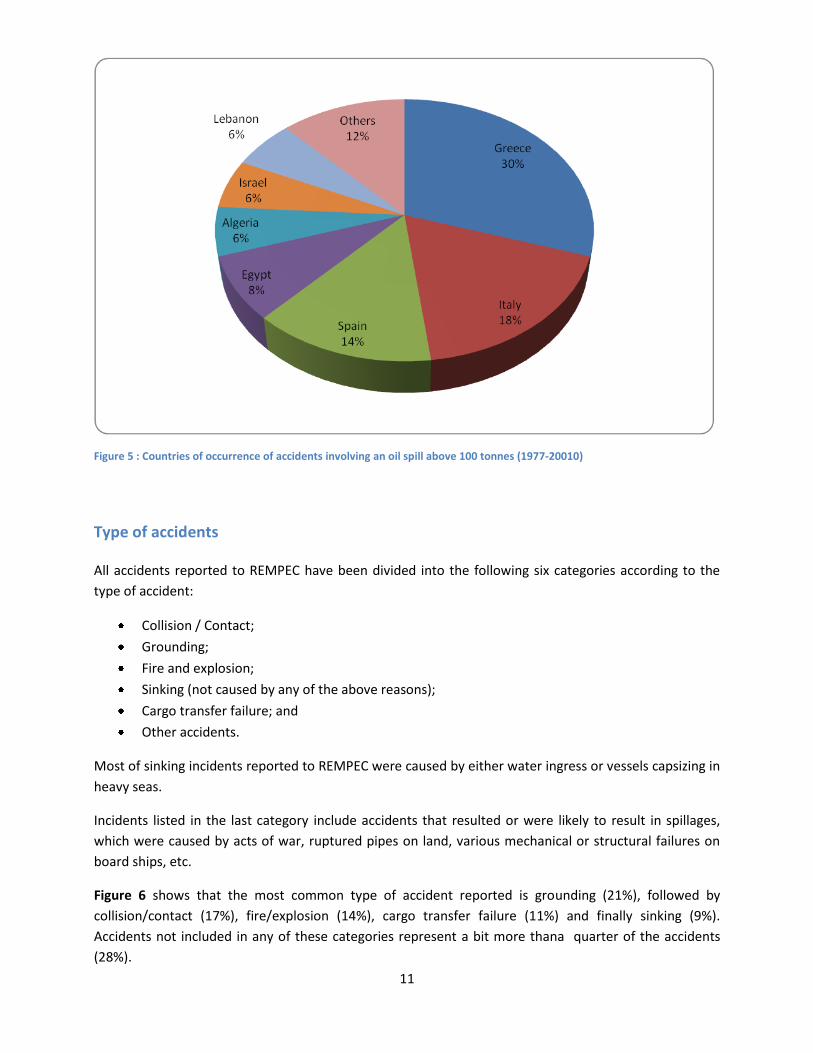
Places of accidents with a release above 100 tonnes
Accidents where a release above 100 tonnes occurred are the most reliable to study the spatial
distribution of the spillages, since countries have to report at least spillages or discharges in excess of 100
cubic meters. Figure 5 shows that most of these releases occurred in Greece (30%), Italy (18%), and Spain
(14%). This can be explained by the distribution of the maritime traffic in the Mediterranean: these three
countries host the ports with the highest traffic1. Out of the 10 ports with the highest number of calls
reported in 2006, 7 were ports located in these 3 countries (Piraeus in Greece; Leghorn, Genoa and
Venice in Italy; Barcelona, Valencia and Algeciras in Spain)2.
1 Khodjet El Khil L., « La pollution de la mer Méditerranée du fait du transport maritime de marchandises », thèse
pour le doctorat en droit, faculté de droit et de science politique d’Aix-Marseille, 2003 (356p), p.109. 2 Safemed project/Mediterranean Traffic Flow 2004-2005, Lloyd’s Marine Intelligence Unit (LMIU)
11
Figure 5 : Countries of occurrence of accidents involving an oil spill above 100 tonnes (1977-20010)
Type of accidents
All accidents reported to REMPEC have been divided into the following six categories according to the
type of accident:
Collision / Contact;
Grounding;
Fire and explosion;
Sinking (not caused by any of the above reasons);
Cargo transfer failure; and
Other accidents.
Most of sinking incidents reported to REMPEC were caused by either water ingress or vessels capsizing in
heavy seas.
Incidents listed in the last category include accidents that resulted or were likely to result in spillages,
which were caused by acts of war, ruptured pipes on land, various mechanical or structural failures on
board ships, etc.
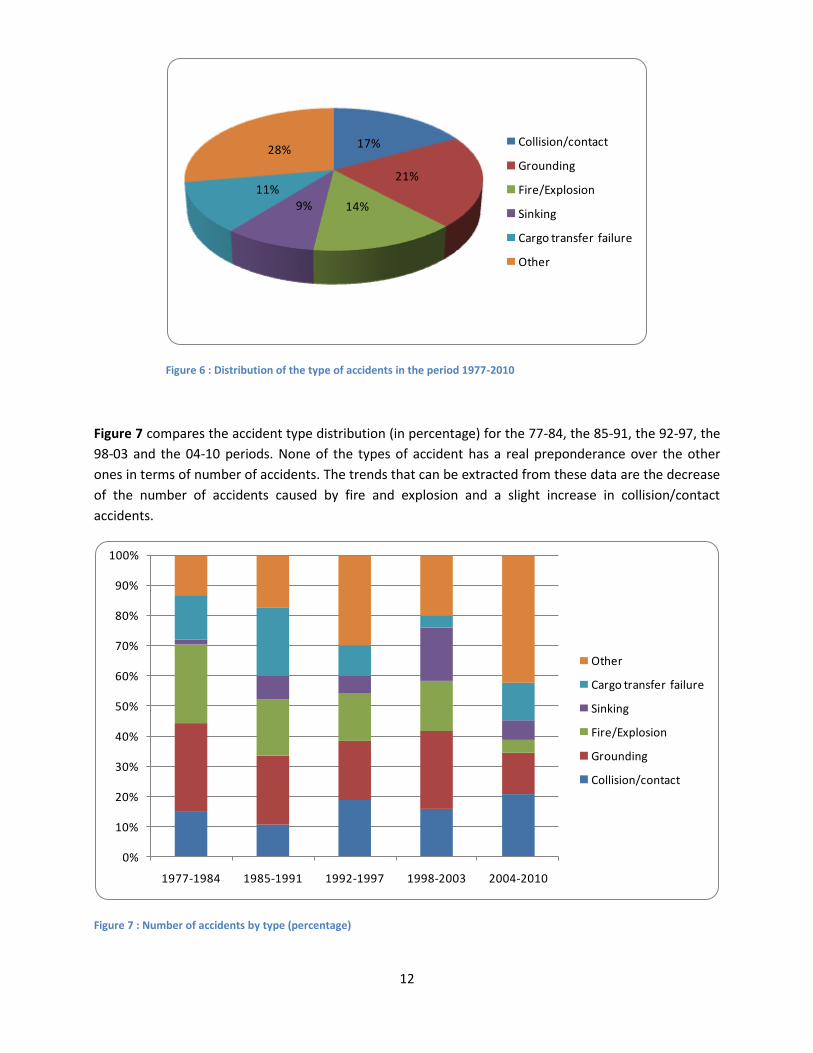
Figure 6 shows that the most common type of accident reported is grounding (21%), followed by
collision/contact (17%), fire/explosion (14%), cargo transfer failure (11%) and finally sinking (9%).
Accidents not included in any of these categories represent a bit more thana quarter of the accidents
(28%).
12
17%
21%
14%9%11%
28%Collision/contact
Grounding
Fire/Explosion
Sinking
Cargo transfer failure
Other
Figure 6 : Distribution of the type of accidents in the period 1977-2010
Figure 7 compares the accident type distribution (in percentage) for the 77-84, the 85-91, the 92-97, the
98-03 and the 04-10 periods. None of the types of accident has a real preponderance over the other
ones in terms of number of accidents. The trends that can be extracted from these data are the decrease
of the number of accidents caused by fire and explosion and a slight increase in collision/contact
accidents.
0%
10%
20%
30%
40%
50%
60%
70%
80%
90%
100%
1977-1984 1985-1991 1992-1997 1998-2003 2004-2010
Other
Cargo transfer failure
Sinking
Fire/Explosion
Grounding
Collision/contact
Figure 7 : Number of accidents by type (percentage)
13
The data below has been separated in five categories, in order to represent the evolution of accident
types. The categories are the following:
Above 700 tonnes
Between 101 and 700 tonnes
Below 100 tonnes
No release
Unknown quantity
Type of accidents for released quantities above 700 tonnes
Twenty accidents with spilled quantities above 700 tonnes have been reported between 1977 and 2010.
They are briefly recalled in Table 2, with vessel name, quantity spilled and accident type for each period.
Table 2 : Accidents with released quantities of oil above 700 tonnes C: Collision/Contact, G: Grounding, F: Fire/Explosion, S: Sinking, Ca: Cargo transfer failure, O: Other type
77-84 85-91 92-97 98-03 04-10
AL RAWDATAIN (8,500 t) Ca
VASILIOS V (1,000 t) Ca
GERIO CHERNO MORYA (1,500 t)
C GIOVANNA (1,000 t) F
GENMAR KESTREL/ TRIJATA (1,500 t)
C
AGIP VENEZIA (5,000 t)
C HAVEN (144,000 t)
F LYRIA (2,000 t)
C LINA STAR (1,150 t)
S JIEH (15,000 t)
O
MESSINIAKI FRONTIS (12,000 t)
G AGIP ABRUZZO (2,400 t) C
SERIFOS (800 t) G
ALBERT MAERSK (1,000 t) O
VERA BERLINGIERI (5,200 t)
C
SLOPS (2,000t)
F
GREY HUNTER (770 t)
G
IRENES SERENADE (40,000 t)
F
JUAN A. LAVALLEJA (39,000 t)
G
CAVO CAMBANOS (18,000 t)
F
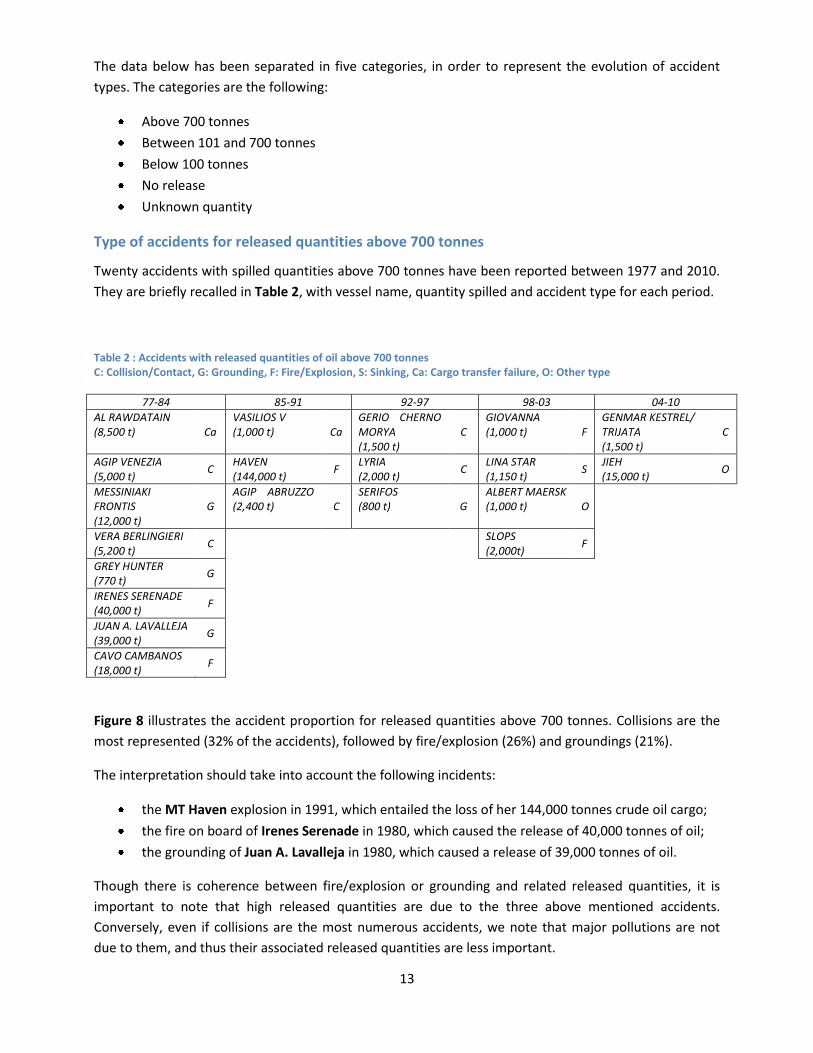
Figure 8 illustrates the accident proportion for released quantities above 700 tonnes. Collisions are the
most represented (32% of the accidents), followed by fire/explosion (26%) and groundings (21%).
The interpretation should take into account the following incidents:
the MT Haven explosion in 1991, which entailed the loss of her 144,000 tonnes crude oil cargo;
the fire on board of Irenes Serenade in 1980, which caused the release of 40,000 tonnes of oil;
the grounding of Juan A. Lavalleja in 1980, which caused a release of 39,000 tonnes of oil.
Though there is coherence between fire/explosion or grounding and related released quantities, it is
important to note that high released quantities are due to the three above mentioned accidents.
Conversely, even if collisions are the most numerous accidents, we note that major pollutions are not
due to them, and thus their associated released quantities are less important.
14
Figure 8 : Proportion of accidents with released quantities above 700 tonnes (1977-2010)
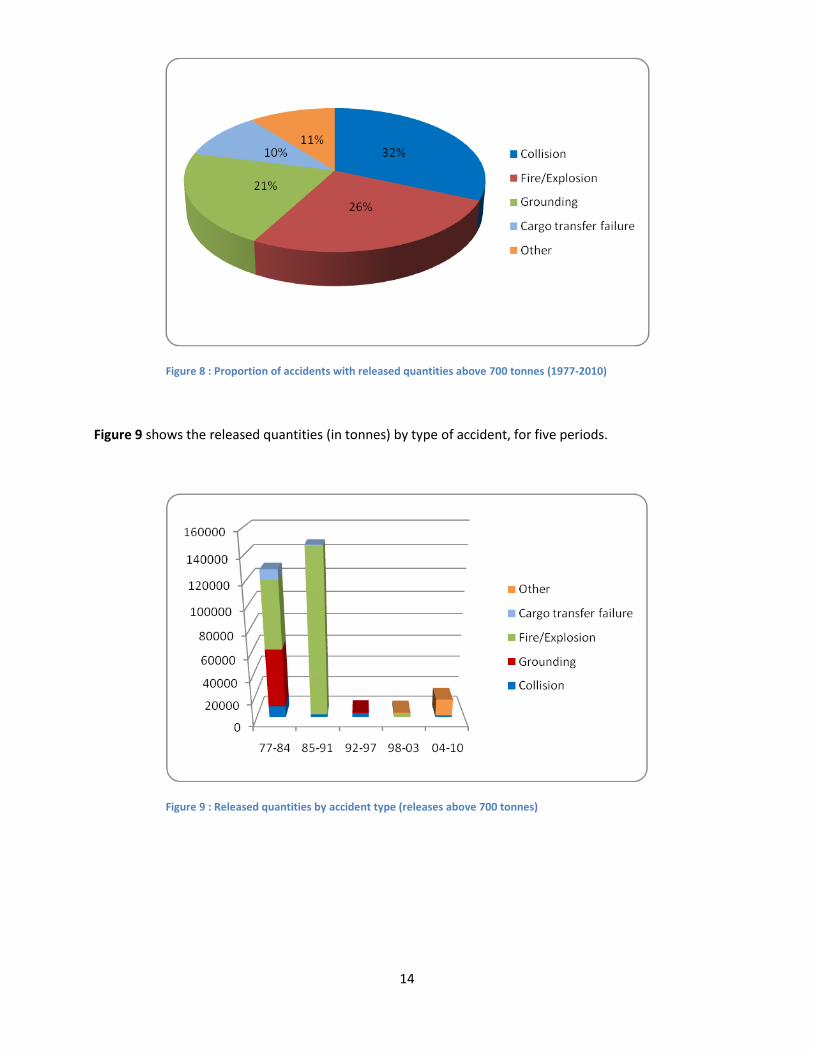
Figure 9 shows the released quantities (in tonnes) by type of accident, for five periods.
Figure 9 : Released quantities by accident type (releases above 700 tonnes)
15
Type of accidents for released quantities between 101 and 700 tonnes
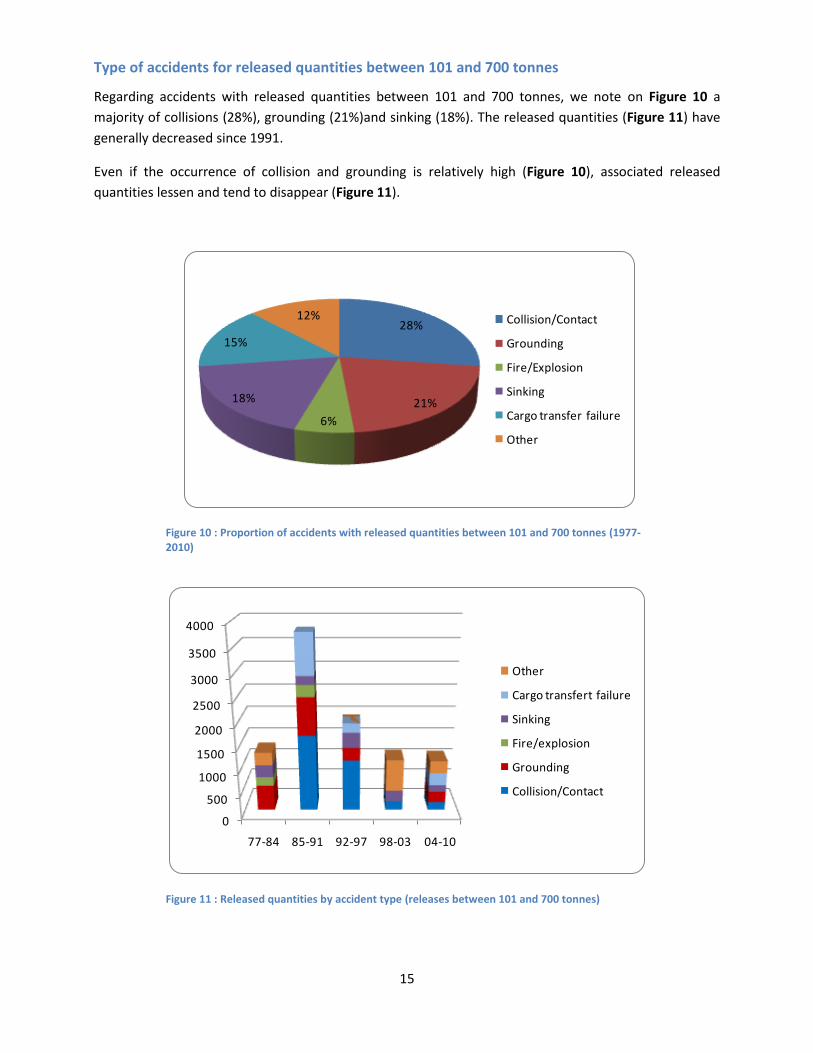
Regarding accidents with released quantities between 101 and 700 tonnes, we note on Figure 10 a
majority of collisions (28%), grounding (21%)and sinking (18%). The released quantities (Figure 11) have
generally decreased since 1991.
Even if the occurrence of collision and grounding is relatively high (Figure 10), associated released
quantities lessen and tend to disappear (Figure 11).
28%
21%
6%
18%
15%
12% Collision/Contact
Grounding
Fire/Explosion
Sinking
Cargo transfer failure
Other
Figure 10 : Proportion of accidents with released quantities between 101 and 700 tonnes (1977-2010)
0
500
1000
1500
2000
2500
3000
3500
4000
77-84 85-91 92-97 98-03 04-10
Other
Cargo transfert failure
Sinking
Fire/explosion
Grounding
Collision/Contact
Figure 11 : Released quantities by accident type (releases between 101 and 700 tonnes)
16
Type of accidents for released quantities below 100 tonnes
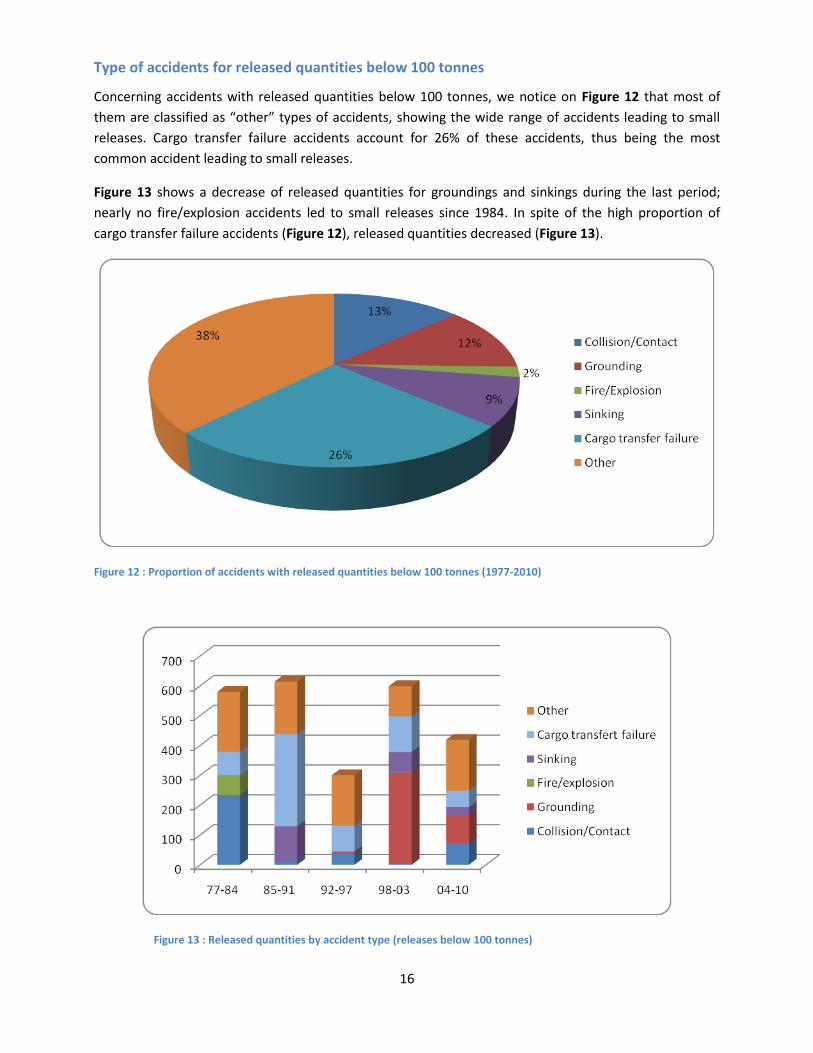
Concerning accidents with released quantities below 100 tonnes, we notice on Figure 12 that most of
them are classified as “other” types of accidents, showing the wide range of accidents leading to small
releases. Cargo transfer failure accidents account for 26% of these accidents, thus being the most
common accident leading to small releases.
Figure 13 shows a decrease of released quantities for groundings and sinkings during the last period;
nearly no fire/explosion accidents led to small releases since 1984. In spite of the high proportion of
cargo transfer failure accidents (Figure 12), released quantities decreased (Figure 13).
Figure 12 : Proportion of accidents with released quantities below 100 tonnes (1977-2010)
Figure 13 : Released quantities by accident type (releases below 100 tonnes)
17
Type of accidents when no release occurred
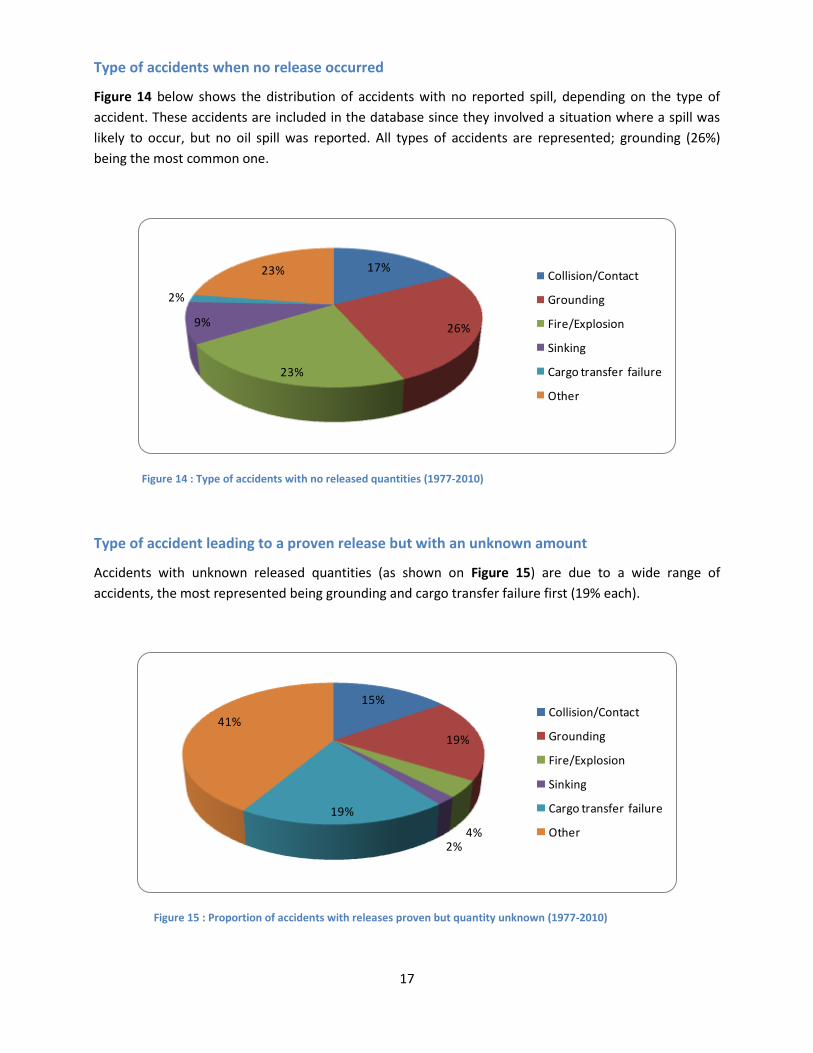
Figure 14 below shows the distribution of accidents with no reported spill, depending on the type of
accident. These accidents are included in the database since they involved a situation where a spill was
likely to occur, but no oil spill was reported. All types of accidents are represented; grounding (26%)
being the most common one.
17%
26%
23%
9%
2%
23% Collision/Contact
Grounding
Fire/Explosion
Sinking
Cargo transfer failure
Other
Figure 14 : Type of accidents with no released quantities (1977-2010)
Type of accident leading to a proven release but with an unknown amount
Accidents with unknown released quantities (as shown on Figure 15) are due to a wide range of
accidents, the most represented being grounding and cargo transfer failure first (19% each).
15%
19%
4%2%
19%
41%Collision/Contact
Grounding
Fire/Explosion
Sinking
Cargo transfer failure
Other
Figure 15 : Proportion of accidents with releases proven but quantity unknown (1977-2010)

18
Type of accident leading to spillage
Figure 16 shows, for the 1977-2010 period, the proportion of incidents leading or not to a proven oil
release for each accident type. Regarding the sinking type, even in cases where no proof of release is
reported, the bunker usually sinks with the vessel, and consequently remains in the marine environment,
unless it is recovered after the sinking.
For collisions, grounding, sinking and “other” accidents, about 50 to 65 % of the cases cause an oil
release. Fire/explosions are more rarely the source of oil pollution, whereas approximately 80% of the
accident caused by a cargo transport failure led to pollution.
0%
10%
20%
30%
40%
50%
60%
70%
80%
90%
100%
Collision/Contact Grounding Fire/Explosion Sinking Cargo transfer failure Other
With proven release Without proven release Unknown
Figure 16 : Proportion of accidents with proven release by type (1977-2010)
Type of vessel involved
Figure 17 shows percentages or each vessel type involved in accidents causing or likely to cause pollution
for the same five above-mentioned periods. The graph clearly shows a decrease of the proportion of oil
tanker accidents, gradually, from nearly 70% of the total amount of accident in 77-84 to 23% in 04-10.3
However, cargo proportion increased, varying from 17% in 77-84 to 30% in 04-10. We note a global slight
increase for the vessel type “Other”, container carriers and chemical tankers.
3 This diminution may be partly due to a tendency to register mainly oil tanker incidents at the early days of the
database. This would also explain the increase of the “other” type of vessel.

19
0%
10%
20%
30%
40%
50%
60%
70%
80%
90%
100%
77-84 85-91 92-97 98-03 04-10
Others
Chemical carriers
Container carriers
Bulk carriers
Cargos
Oil tanker
Figure 17 : Types of vessels involved in accidents
Age of vessel
Figure 18 represents the distribution of the ships involved in accidents between 1977 and 2010
according to their age at the time of the casualty. The majority of ships (31%) were between 16 and 25
years old, followed by the age brackets 26-35 and 6-15, accounting for roughly 22% and 18%. Ships of 0-5
years and ships above 35 years are relatively rare and this could explain the low occurrence of accidents
involving brand new and very old ships.
8%
18%
31%
22%
6%
15%
0-5
6-15
16-25
26-35
36-47
unknown
Figure 18 : Age of the ships involved in accidents (1977-2010)
20
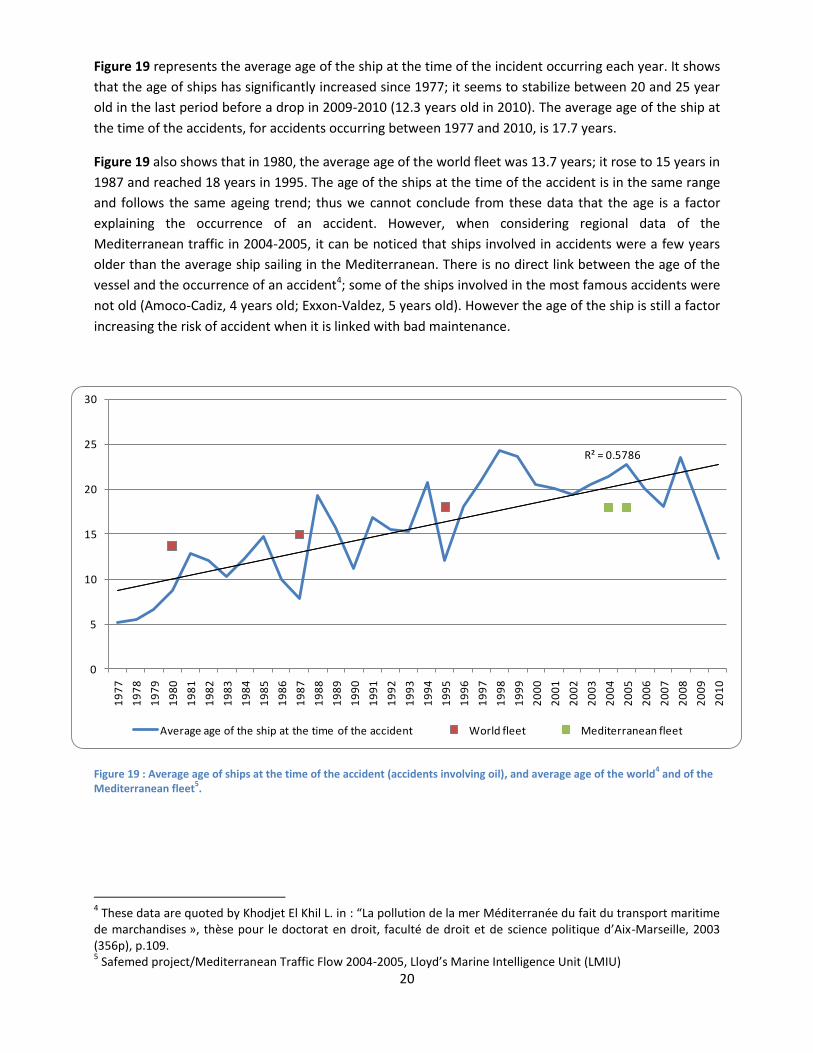
Figure 19 represents the average age of the ship at the time of the incident occurring each year. It shows
that the age of ships has significantly increased since 1977; it seems to stabilize between 20 and 25 year
old in the last period before a drop in 2009-2010 (12.3 years old in 2010). The average age of the ship at
the time of the accidents, for accidents occurring between 1977 and 2010, is 17.7 years.
Figure 19 also shows that in 1980, the average age of the world fleet was 13.7 years; it rose to 15 years in
1987 and reached 18 years in 1995. The age of the ships at the time of the accident is in the same range
and follows the same ageing trend; thus we cannot conclude from these data that the age is a factor
explaining the occurrence of an accident. However, when considering regional data of the
Mediterranean traffic in 2004-2005, it can be noticed that ships involved in accidents were a few years
older than the average ship sailing in the Mediterranean. There is no direct link between the age of the
vessel and the occurrence of an accident4; some of the ships involved in the most famous accidents were
not old (Amoco-Cadiz, 4 years old; Exxon-Valdez, 5 years old). However the age of the ship is still a factor
increasing the risk of accident when it is linked with bad maintenance.
R² = 0.5786
0
5
10
15
20
25
30
19
77
19
78
19
79
19
80
19
81
19
82
19
83
19
84
19
85
19
86
19
87
19
88
19
89
19
90
19
91
19
92
19
93
19
94
19
95
19
96
19
97
19
98
19
99
20
00
20
01
20
02
20
03
20
04
20
05
20
06
20
07
20
08
20
09
20
10
Average age of the ship at the time of the accident World fleet Mediterranean fleet
Figure 19 : Average age of ships at the time of the accident (accidents involving oil), and average age of the world4 and of the
Mediterranean fleet5.
4 These data are quoted by Khodjet El Khil L. in : “La pollution de la mer Méditerranée du fait du transport maritime
de marchandises », thèse pour le doctorat en droit, faculté de droit et de science politique d’Aix-Marseille, 2003 (356p), p.109. 5 Safemed project/Mediterranean Traffic Flow 2004-2005, Lloyd’s Marine Intelligence Unit (LMIU)

21
Incidents causing or likely to cause pollution by HNS other than oil
(1988-2010)
Observations from the data collected on accidents in the Mediterranean involving hazardous and
noxious substances other than oil (HNS), for the period 1988-2010, are as follows:
Accidents involving HNS
Number of accidents 114 Quantities released 120,858 t
It should be noted that REMPEC started collecting data on incidents involving HNS only after extension in
1987 by the Contracting Parties to the Barcelona Convention of the Centre mandate, which since then
includes also these substances.
Number of accidents
Figure 20 shows the number of accidents involving HNS for each year over the 1988-2010 period. We see
an overall decrease since 1994, with an average of 5 reported accidents per year.
0
2
4
6
8
10
12
14
16
18
20
19
88
19
89
19
90
19
91
19
92
19
93
19
94
19
95
19
96
19
97
19
98
19
99
20
00
20
01
20
02
20
03
20
04
20
05
20
06
20
07
20
08
20
09
20
10
Unknown
Accidents without release
Accidents with release
Figure 20 : Number of accidents involving HNS other than oil reported between 1988 and 2010
22
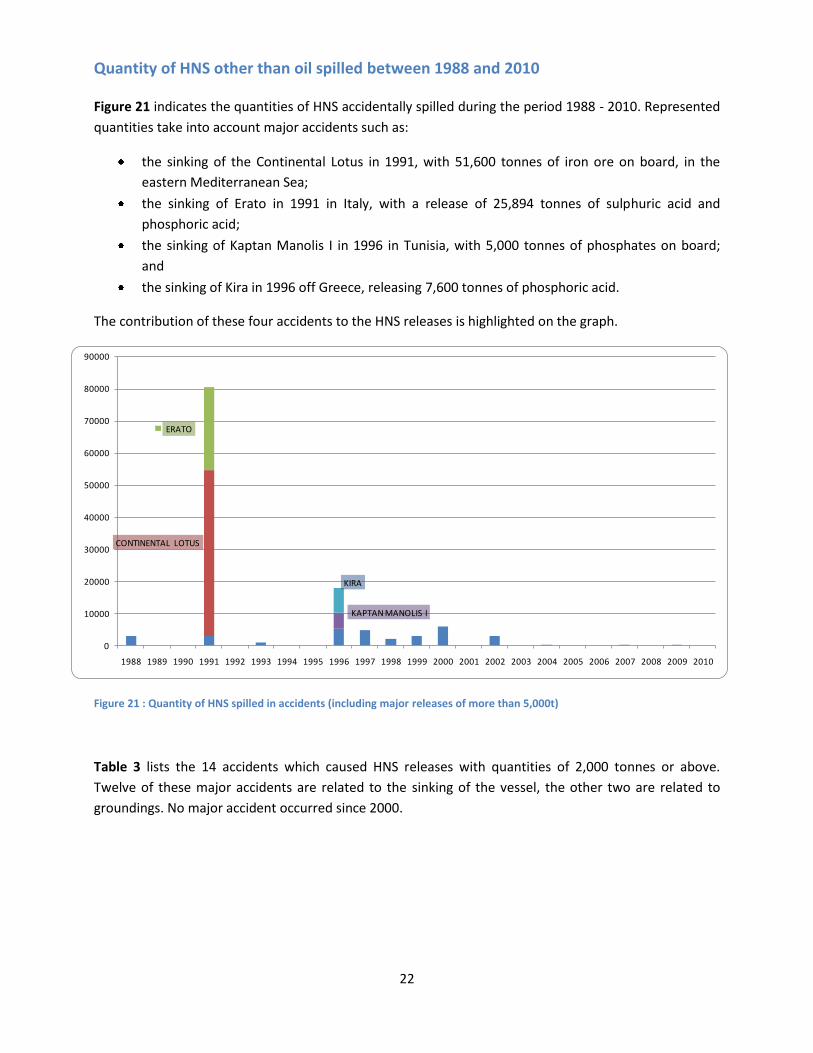
Quantity of HNS other than oil spilled between 1988 and 2010
Figure 21 indicates the quantities of HNS accidentally spilled during the period 1988 - 2010. Represented
quantities take into account major accidents such as:
the sinking of the Continental Lotus in 1991, with 51,600 tonnes of iron ore on board, in the
eastern Mediterranean Sea;
the sinking of Erato in 1991 in Italy, with a release of 25,894 tonnes of sulphuric acid and
phosphoric acid;
the sinking of Kaptan Manolis I in 1996 in Tunisia, with 5,000 tonnes of phosphates on board;
and
the sinking of Kira in 1996 off Greece, releasing 7,600 tonnes of phosphoric acid.
The contribution of these four accidents to the HNS releases is highlighted on the graph.
CONTINENTAL LOTUS
ERATO
KAPTAN MANOLIS I
KIRA
0
10000
20000
30000
40000
50000
60000
70000
80000
90000
1988 1989 1990 1991 1992 1993 1994 1995 1996 1997 1998 1999 2000 2001 2002 2003 2004 2005 2006 2007 2008 2009 2010
Figure 21 : Quantity of HNS spilled in accidents (including major releases of more than 5,000t)
Table 3 lists the 14 accidents which caused HNS releases with quantities of 2,000 tonnes or above.
Twelve of these major accidents are related to the sinking of the vessel, the other two are related to
groundings. No major accident occurred since 2000.

23
Table 3 : Accidents involving releases of HNS other than oil above 2,000 tonnes
Vessel name Release quantity (tonnes)
Year Location Accident type
CONTINENTAL LOTUS 51600 1991 Eastern Mediterranean Sinking ERATO 25894 1991 Italy Sinking KIRA 7600 1996 Greece Sinking KAPTAN MANOLIS I 5000 1996 Tunisia Sinking SCAIENI 3057 1991 Italy Sinking ROFAYDA 3000 1999 Cyprus Sinking CAMADAN 2900 2002 Malta Sinking OCEAN SPIRIT 2850 1988 Malta Sinking ANIS ROSE 2703 1996 Italy Sinking FENES 2500 1996 France Grounding MATTHEOS 2500 2000 Greece Sinking ABDUL RAHMAN 2250 1997 Libya Grounding DOGRUYOLLAR IV 2020 1998 Italy Sinking THOR EMILIE 2000 2000 Algeria Sinking
Figure 22 shows the quantities of HNS spilled annually in the Mediterranean Sea, excluding the major
incidents referred in table 3. The overall trend is a drastic decrease in the amounts spilled since 2003,
and a total quantity of less than 10 tonnes since 2003.
0
1000
2000
3000
4000
5000
6000
7000
1988 1989 1990 1991 1992 1993 1994 1995 1996 1997 1998 1999 2000 2001 2002 2003 2004 2005 2006 2007 2008 2009 2010
Figure 22 : Quantity of HNS spilled in accidents (without major accidents)
24
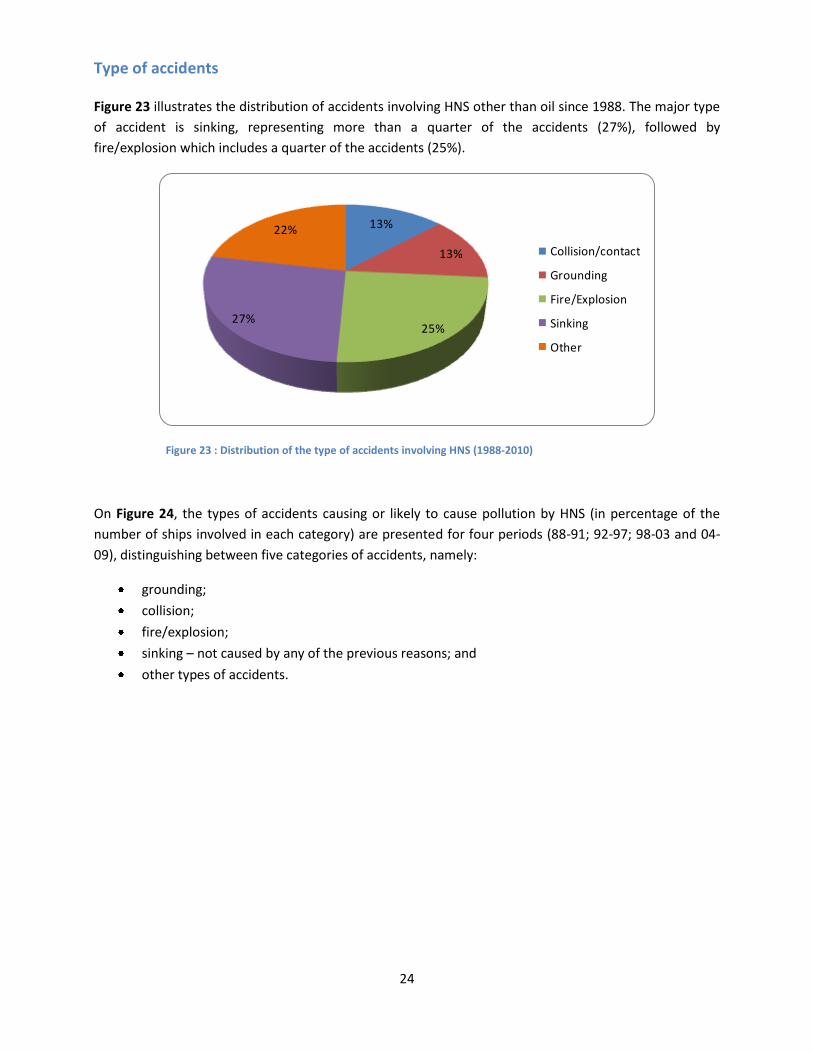
Type of accidents
Figure 23 illustrates the distribution of accidents involving HNS other than oil since 1988. The major type
of accident is sinking, representing more than a quarter of the accidents (27%), followed by
fire/explosion which includes a quarter of the accidents (25%).
13%
13%
25%27%
22%
Collision/contact
Grounding
Fire/Explosion
Sinking
Other
Figure 23 : Distribution of the type of accidents involving HNS (1988-2010)
On Figure 24, the types of accidents causing or likely to cause pollution by HNS (in percentage of the
number of ships involved in each category) are presented for four periods (88-91; 92-97; 98-03 and 04-
09), distinguishing between five categories of accidents, namely:
grounding;
collision;
fire/explosion;
sinking – not caused by any of the previous reasons; and
other types of accidents.

25
0%
10%
20%
30%
40%
50%
60%
70%
80%
90%
100%
1988-1991 1992-1997 1998-2003 2004-2010
Other
Sinking
Fire/Explosion
Grounding
Collision/contact
Figure 24 : Number of accidents involving HNS by type (percentage)
Sinking were by far the main type of accident for the period 1998-2003. The profile of the accident types
of the last period 2004-2010 is more diverse and similar to the period 1992-1997, the main type of
accident being fire/explosion, followed by other types, collision/contact, sinking and grounding.
Type of vessel
Figure 25 illustrates the distribution of accidents involving HNS other than oil for each type of vessel.
Accidents involving chemical carriers have recently increased, while general cargo ships incidents have
decreased.
0%
10%
20%
30%
40%
50%
60%
70%
80%
90%
100%
1988-1991 1992-1997 1998-2003 2004-2010
Others
LNG/LPG carrier
Chemical carrier
Bulk carrier
Container carrier
Cargo
Figure 25 : Types of vessels involved in HNS accidents
26
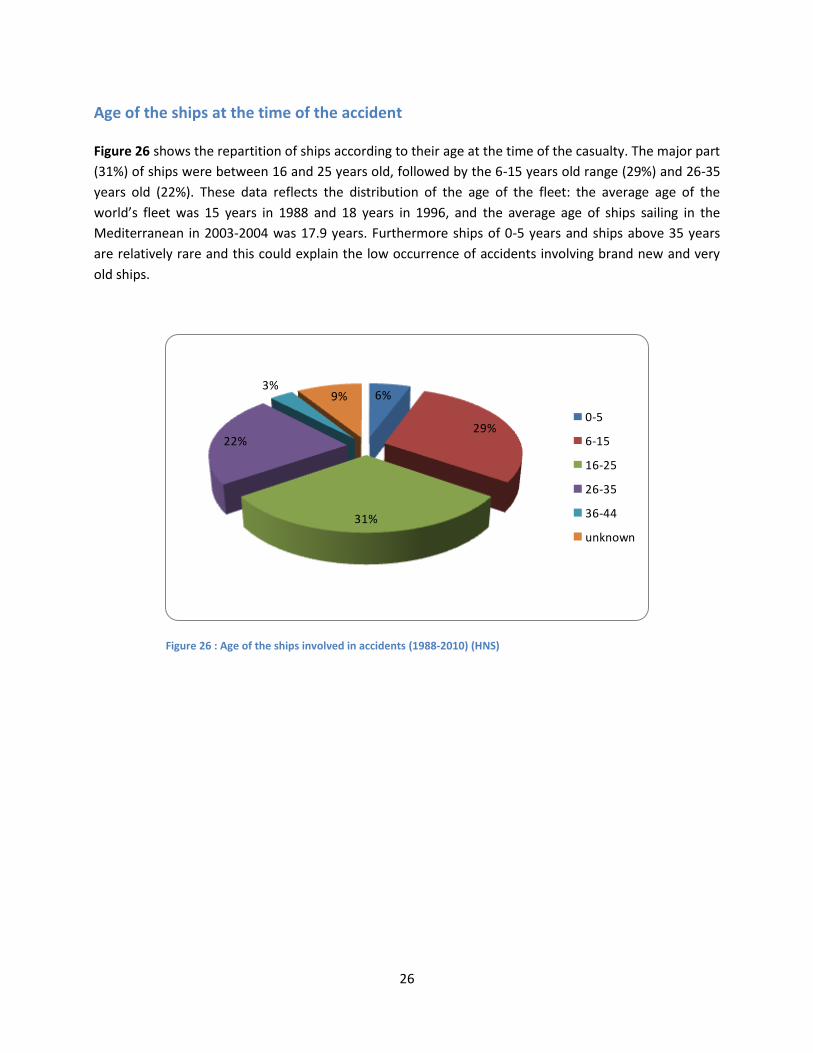
Age of the ships at the time of the accident
Figure 26 shows the repartition of ships according to their age at the time of the casualty. The major part
(31%) of ships were between 16 and 25 years old, followed by the 6-15 years old range (29%) and 26-35
years old (22%). These data reflects the distribution of the age of the fleet: the average age of the
world’s fleet was 15 years in 1988 and 18 years in 1996, and the average age of ships sailing in the
Mediterranean in 2003-2004 was 17.9 years. Furthermore ships of 0-5 years and ships above 35 years
are relatively rare and this could explain the low occurrence of accidents involving brand new and very
old ships.
6%
29%
31%
22%
3%9%
0-5
6-15
16-25
26-35
36-44
unknown
Figure 26 : Age of the ships involved in accidents (1988-2010) (HNS)