statistical analysis of precipitation time series in ...metnet.imd.gov.in/mausamdocs/16343_f.pdf ·...
TRANSCRIPT

MAUSAM, 63, 4 (October 2012), 553-564
551.577.12 : 519.246.8
Statistical analysis of precipitation time series in Dobrudja region
CARMEN MAFTEI and ALINA BARBULESCU
Ovidius University of Constanta, 124, Mamaia Bd., 900527, Constanta, Romania
(Received 09 April 2010, Modified 28 May 2012)
e mails : [email protected]; [email protected]
lkj & bl 'kks/k&i= esa tuojh 1965 ls fnlacj 2005 rd dh vof/k ds nkSjku ,df=r fd, x, 10 eghuksa dh Ja[kykvksa ds vk¡dM+k vk/kkj dk mi;ksx djrs gq, jksekfu;k ds nf{k.kiwohZ Hkkx esa fLFkr Mksc:tk esa o"kZ.k ds fooj.k esa dkfyd y{k.kksa dk fo’ys"k.k fd;k x;k gSA bl 'kks/k&i= esa ekfld o"kZ.k Ja[kykvksa ds fooj.k es ifjorZuksa ds fo"k; esa [kkst djus ds fy, czsd IokbaV dk irk yxkus gsrq fofHkUu i)fRr;ksa dh foospuk dh xbZ gSA bl v/;;u ls bl {ks= ds iwokZuqeku ds vuq:i o"kZ 2000 ls iwoZ o"kZ.k dh fLFkj izofRr dk vkSj o"kZ 2000 ds ckn o`f) dh izo`fRr dk irk pyk gSA
ABSTRACT. Temporal characteristics of precipitation evolution in Dobrudja, a region situated in the Southeastern
part of Romania, are analyzed in this article, using a data base of ten monthly series, collected in the period January 1965-December 2005. This paper describes different methods to detect the break points existence in order to detect changes in evolution of the monthly precipitation series. The study indicates a constant trend of precipitation before 2000 and an increasing one after 2000, in concordance with the predictions for this region.
Key words ‒ Precipitation, Time series, Break tests, Statistical analysis, CUSUM.
1. Introduction
After the assessment of the IPCC-Intergovernmental Panel on Climate Change 2001 (IPCC, 2001), which asserted that the climate has been affected by the greenhouse gas emission, that provoked a climate warming, the conclusions of the IPPC 2007 Report (IPCC, 2007) came to confirm the climate change. Analyzing the period between 1816 and 2000 the IPPC 2001 Report emphasized that over the 20th century the global average surface temperature increased of about 0.6 C and the precipitation augmented between 0.5 and 1% per decade over most mid and high latitudes of the Northern Hemisphere continents. The biggest part of Europe is affected by the augmentation of average precipitation per wet day (Frich et al., 2002), (Klein Tank et al., 2002), excepting the Mediterranean area, where a negative trend in precipitation was observed from 1950 (Piervitali et al., 1998). Significant increment of precipitation quantity has been registered in Eastern North America and South America, Northern Europe and Northern and central Asia. Based on these conclusions, and taking account of the enormous impact of the climate change on water availability and accessibility, its importance for economic and social activities, a wide interest for the research in this
area is remarked. It has been proved that the climate warming could have serious impact on the precipitation occurrence, frequency and intensity (Huntingford et al., 2003), (May et al., 2002), (Zwiers and Kharin, 1998) (Planton et al., 2005). For example, decreasing precipitation rates have been registered in Western part of Africa in the period 1970 - 1990 (Bricquet et al., 1997), (Mahe & Olivry, 1995), (Gong and Wang, 2000); the frequency of extreme rainfall occurrence in many parts of Asia, causing severe floods, increased, while the number of rainy days and total annual amount of precipitation decreased (Zhai et al., 1999), (Khan et al., 2000) (Shrestha et al., 2000), (Mirza et al., 2002) (Lal, 2003), (Min et al., 2003), (Zhai and Pan, 2003), (Gruza and Rankova, 2004), (Zhai, 2004).
Studies concerning the climate evolution in Romania
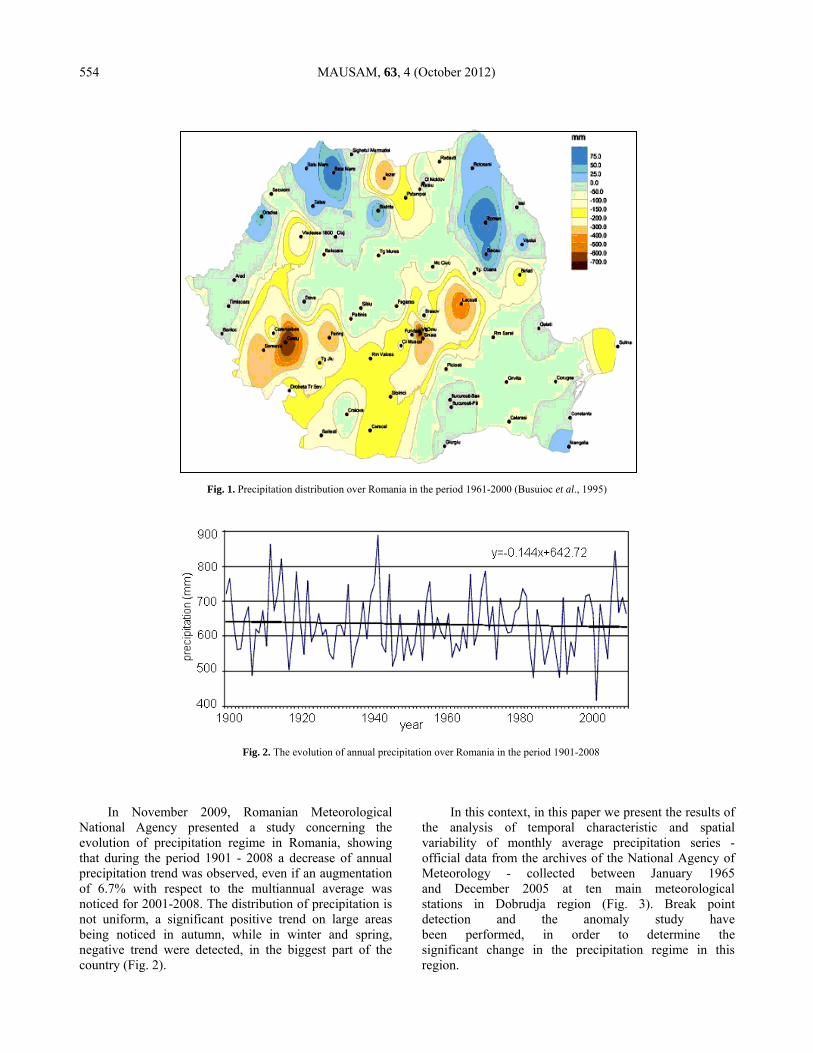
(Busuioc et al., 1995) indicate a diminution of annual precipitation, excepting some regions situated in the Northeastern part and Southeastern parts of the territory (Fig. 1). The study of Busuioc (Busuioc et al., 1995) reveals a precipitation augmentation between 0 and 25 mm in the Southern part of Dobrudja and a narrowing between 150 and 200 mm in its north- eastern part.
(553)
554 MAUSAM, 63, 4 (October 2012)
Fig. 1. Precipitation distribution over Romania in the period 1961-2000 (Busuioc et al., 1995)
Fig. 2. The evolution of annual precipitation over Romania in the period 1901-2008
In November 2009, Romanian Meteorological National Agency presented a study concerning the evolution of precipitation regime in Romania, showing that during the period 1901 - 2008 a decrease of annual precipitation trend was observed, even if an augmentation of 6.7% with respect to the multiannual average was noticed for 2001-2008. The distribution of precipitation is not uniform, a significant positive trend on large areas being noticed in autumn, while in winter and spring, negative trend were detected, in the biggest part of the country (Fig. 2).
In this context, in this paper we present the results of the analysis of temporal characteristic and spatial variability of monthly average precipitation series - official data from the archives of the National Agency of Meteorology - collected between January 1965 and December 2005 at ten main meteorological stations in Dobrudja region (Fig. 3). Break point detection and the anomaly study have been performed, in order to determine the significant change in the precipitation regime in this region.

MAFTEI and BARBULESCU : STATISTICAL ANALYSIS OF PPT TIME SERIES 555
Fig. 3. Dobrudja region and the meteorological stations
2. Study area Dobrudja region is located between the lower Danube River and the Black Sea including the Danube Delta and Romanian Littoral (Fig. 3), in a temperate continental climatic area, influenced by the Black Sea. Its average altitude is about 200 - 300 m. The average annual temperatures range from 11 °C inland and along the Danube to 11.8 °C on the coast and less than 10 °C in the higher parts of the plateau. Dobrudja is a windy region once known for its windmills. About 85 - 90% of all days experience some kind of wind, which usually comes from the north or northeast. Due to the limited precipitation and the proximity to the sea, rivers in Dobruja are usually short and with low discharge (Wikipedia).
3. Data and methodology The steps followed in our study, for each station, were the estimation of the mean monthly precipitation, the estimation of the multi-monthly mean precipitation, the determination of the anomaly chart, and the discontinuities detection. Extensive literature exists on change point problems. The break tests allow the detection of changes in a time series mean or of the probability distribution function of a process variable at a certain moment (Lubes et al., 1994). Tests for a single break point in mean were proposed by
different authors (Sen and Srivastava, 1975), (Pettitt, 1979), (Buishand, 1984), (James et al., 1987). Methods for multiple change points detection (Hubert, 2000) (Olshen et al., 2004) use the Scheffé test or the Schwarz’ Bayesian information criteria for segmentation. In this article the Pettitt, Buishand, Lee and Heghinian (Lee & Heghinian, 1977) tests, as well as the segmentation procedure of Hubert and the CUSUM method have been used for the break points detection in the study series. The Pettitt test (Pettitt, 1979) is a non - parametric one, performed for testing the null hypothesis that there is no break in a series, against the alternative that a stepwise shift in the mean is present. It can be applied in the hypothesis that the data is independent, identically distributed. The test statistic is related to the Mann - Whitney statistic. The Pettit test is more sensitive to breaks in the middle of a time series. The Buishand and Lee & Heghinian tests are Bayesian procedures applied under the assumption that the studied series is Gaussian, independent and identically distributed. They treat the timing of change as uncertain and the location of a change point is a parameter to be estimated. The Lee & Heghinian method determines the a posteriori probability distribution function of the parameters, considering their a priori distributions and

556 MAUSAM, 63, 4 (October 2012)
Fig. 4. Thiessen polygons
supposing that the break time follows a uniform distribution. This approach allows evidence for a change before a hypothesized date to count against the hypothesis (Western and Kleykamp, 2004). The segmentation procedure of Hubert yields an optimal partition (from a least square point of view) of the original series into as many subseries as possible, all differences between two contiguous means remaining simultaneously significant. This last requirement is ensured using the Scheffé test of contrast (Hubert, 2000).
The Cumulated Sum Analysis (Taylor, 2002) aims at detecting any change in the mean of a process, assuming that the series is identically distributed and independent (or there is no strong autocorrelation). It characterizes better than other methods the changes detected by providing associated confidence levels and confidence
intervals for the times of changes. If ;,1, nixi represent
the registered data, the CUSUM charts are constructed following the steps:
(i) Determining the series average,
n
iixx
1
(ii) Computing the cumulative sums, , by iS
;,1),(,0 10 nixxSSS iii
(iii) Plotting CUSUM series: the point farthest from 0 denotes a change point. (iv) Break into two sections at change points and analyze each subseries for additional significant change points. Bootstrapping provides a measure of change point significance (Kass - Hout). The distribution-free CUSUM test is a non - parametric rank-based method, which tests whether the means in two parts of a record are different for an unknown time of change. In particular, successive observations are compared with the median of the series in order to detect a change in the mean of a time series after a number of observations. The test statistic is the cumulative sum (CUSUM) of the k signs of the difference from the median starting from the beginning of the series. In order to facilitate the trend computation in the precipitation patterns in Israel, Steinberger and Gazit-Yaari (Steinberger and Gazit - Yaari, 1996) introduced the

MAFTEI and BARBULESCU : STATISTICAL ANALYSIS OF PPT TIME SERIES 557
Fig. 5. Hârsova series concept of “normalized variable”, calculated by dividing the actual precipitation by the average rainfall at one station and multiplying by 100%. The same index (named “Percent of Normal”) is used by Willeke (Willeke et al., 1994) in the drought analysis. A disadvantages of the use of this index is that the mean precipitation is often not the same as the median, which is the value exceeded by 50% of the precipitation occurrences in a long-term climate record (Steinemann et al., 2005). We use this concept, with one modification: the mean monthly precipitation is normalized by the regional multi-annual mean monthly precipitation (considered to be calculated by Thiessen method - Fig. 4.) (Maftei and Barbulescu, 2008). This index will be called “Normal Precipitation”. We remember that in Thiessen method the precipitation registered at a meteorological station is proportional with the surface of the polygonal area associated to the station. 4. Result and discussions 4.1. The analysis of precipitation variation
The chart of the studied monthly precipitation series is presented in Fig. 5 & Fig. 6 represents the spatial evolution of the multi-monthly mean precipitation (calculated as the average of the monthly precipitation registered in the period January 1965 - December 2005) in the region of Dobrudja. The isohyets are automatically generated in GIS ArcView®, by splines interpolation on the base of multi-monthly mean precipitation calculated at each station. The multi-monthly mean precipitation varied between 22 and 42 mm approximately, the highest values being registered in the Northern part and the Southwestern part of the territory and augmented with the altitude. The lowest precipitation was registered at Sulina, and the largest at Tulcea, Adamclisi and Cernavoda. Table 1 presents the descriptive statistics of the study series. Accordingly, the lowest mean precipitation
Fig.6. The isohyets
occurred at five meteorological stations (0 mm: August 1986 at Adamclisi; April 1968 at Cernavoda; May 1968 at Jurilovca; October 1969, August 1989 and March 1990 at Mangalia; June 1968, August 1975, August 1986, 1989, 2001, July 1995 at Sulina) and the highest amount of precipitation has been registered in September 2005, at Mangalia. Overall, the smallest mean monthly precipitation has been registered at Sulina, in the Danube Delta, and the highest on the Littoral (Constanta and Mangalia). All the coefficients of variation are greater than 0.77, proving a high dispersion of multi-monthly average precipitation. After performing the variance analysis, we found enough evidence to reject the hypothesis that there is no difference between the multi-monthly means of the precipitation series. To emphasize the station whose multi-monthly mean is statistically different from the others, the Tukey HSD and the Scheffé tests have been used at the level of significance α = 1%. It was found that the multi-monthly mean of Sulina series is not equal to the other series means, point of view of statistics (Barbulescu and Deguenon, 2012). The precipitation anomaly charts have also been determined (Fig. 7). Fig. 7 shows the difference between the mean annual precipitation and the average precipitation during a regional base period. The positive anomaly shows the years when the precipitation exceeded the 1965-2005 baseline average and the negative anomaly shows the years when the mean precipitation was less than the baseline average. We remark three different cases: (i) the

558 MAUSAM, 63, 4 (October 2012)
TABLE 1
Descriptive statistics of the multi - monthly mean precipitation
Station Adamclisi Cernavodă Constanta Corugea Hârsova Jurilovca Mangalia Medgidia Sulina Tulcea
Obs. no. 41 41 41 41 41 41 41 41 41 41
Min 0 0 0.1 0.2 0.3 0 0 0.4 0 0.7
Max 208.1 192.3 259.2 214.6 232.2 186.1 330 165.4 129 191.1
Mean 40.37 40.6 35.3 36.2 34.1 31.5 35.6 37.5 21.8 38.48
Std. dev. 32.1 31.37 29.8 29.71 29.7 27.3 30.6 30.87 19.6 31.05
Median 33.8 32.5 27.8 29 26.4 25.3 28.2 29.6 17.2 32.05
Coef. of var. 0.80 0.77 0.84 0.82 0.87 0.86 0.86 0.82 0.89 0.81
Skewness 1.63 1.49 2.11 1.69 2.23 1.69 2.90 1.53 1.76 1.52
TABLE 2
The results of break tests
Station Buishand Pettitt Lee & Heghinian Hubert
Adamclisi No No No – Apr 2004 No - Nov 1969, Apr 1971
Cernavoda Yes Yes No – Apr 2004 No - Dec 1965, Apr 1971, Jul 1999, Apr 2004
Medgidia Yes Yes No – Apr 2004 No - Apr 1971, Jul 1991
Harsova Yes Yes No – Apr 2004 No - Dec 1965, Jul 1972, Jun 1997, Apr 2004
Corugea Yes Yes No – Apr 2004 No - Aug 1972, Apr 2004, Aug 2005
Tulcea Yes Yes No – Apr 2004 No - May 1997
Sulina No No No - Aug 1982 No - Jul 1972
Jurilovca Yes Yes No - Jan 1965 No - Nov 1969
Constanta - Yes - No - July 2004
Mangalia Yes Yes No - Aug 2005 No - Aug 2005
‘Yes’ - means that the null hypothesis is accepted, ‘-‘ means that the test can not be applied
anomaly is mostly positive in the territory near the Danube river (Adamclisi, Cernavoda, Medgidia, Harsova, Tulcea); (ii) the anomaly is mostly negative in the Northeastern part (Sulina and Jurilovca); (iii) the positive anomaly and the negative ones are approximately equal (Corugea, Mangalia and Constanta). We also remark a trend of positive anomaly for all the series but Sulina, starting from 2000.
4.2. Break points analysis First, the normality, the autocorrelation and homoscedasticity hypotheses were tested, respectively by the Lilliefors test, the autocorrelation function and the Levene test (Bărbulescu, 2010). Since some series were not normally distributed, they were normalized by Box -
Cox transformations, in order to allow the application of certain break tests. The results of the break tests are given in Table 2, where no signifies that the null hypothesis is accepted. The Pettitt and Buishand tests (at the level of significance of 5%) gave the same result, excepting for Constanta series, for which the normality couldn’t be reached by transformations, so the last test couldn’t be performed. The Lee & Heghinian test found April 2004 as a break point for six series, August 2005 for one, January 1965, for another one. The results of segmentation procedure of Hubert are in concordance with those of Lee & Heghinian test for Cernavoda, Harsova and Mangalia (Table 2). The CUSUM charts were also studied and the results were compared to those obtained by the break tests. From

MAFTEI and BARBULESCU : STATISTICAL ANALYSIS OF PPT TIME SERIES 559
(a)
(b)
(c)
Figs. 7(a-c). Anomaly chart: (a) Sulina, (b) Cernavoda and (c) Constanta
the definition of the sums in the CUSUM procedure, it is obvious that each time the measurements are below the overall average, the CUSUM decreases and each time the values are above the overall average, the CUSUM increases. A slope change in the CUSUM graph indicates a sudden change in the average (Taylor, 2002).
Since the result of a CUSUM procedure is influenced by the outliers’ presence, the non - parametric CUSUM analysis (Hackl and Maderbacher, 1999) has been performed in the cases of the aberrant values existence, as for Adamclisi series. In Figs. 8 & 9, we present the boxplot for Adamclisi and Tulcea series, respectively the associated CUSUM charts, for comparison. The outliers of

560 MAUSAM, 63, 4 (October 2012)
Fig. 8. Boxplots for Adamclisi and Tulcea monthly series
(a)
(b)
Figs. 9 (a&b). CUSUM: a. Adamclisi, b. Tulcea
TABLE 3
The results of CUSUM charts
Confidence interval conf level from to level Method
Adamclisi Jun-94 (218, 381) 95% 37.62 47.385 3 Rank
Cernavoda Apr-81 (132, 223) 98% 43.803 32.511 2
Jun-94 (298, 396) 93% 32.511 41.609 1
May-04 (414, 477) 92% 41.609 68.085 3
Medgidia Jun-02 (191, 457) 95% 35.999 53.1 1
Harsova Sep-82 (141, 245) 93% 37.046 27.06 9 Rank
Jun-95 (298, 376) 98% 27.06 40.056 3
Jan-00 (402, 431) 93% 40.056 22.441 4
Sep-03 (458, 468) 100% 32.74 54.407 2
Corugea Nov-72 (66, 202) 92% 41.955 31.332 2 Rank
Sep-96 (304, 406) 98% 31.332 43.898 4
Tulcea No break
Sulina Sep-82 (141, 276) 92% 26.126 19.572 1 Rank
Feb-00 (315, 428) 95% 19.572 12.296 5
May-04 (455, 477) 90% 12.296 23.53 3
Jurilovca Mar-95 (137, 369) 98% 30.447 47.736 2 Rank
Dec-98 (397, 440) 100% 47.736 27.578 3
Constanta No break Rank
Mangalia No break Rank
MAFTEI and BARBULESCU : STATISTICAL ANALYSIS OF PPT TIME SERIES 561
slope:-0.005
slope:-0.0003slope:+ 0.008
0
1
2
3
4
5
6
7
0 50 100 150 200 250 300 350 400 450 500
month
PN
1965-1972 1972-1997 1997-2005
Linear (1965-1972) Linear (1972-1997) Linear (1997-2005)
(a)
slope: 0.0022
slope:0
0
1
2
3
4
5
6
0 50 100 150 200 250 300 350 400 450 500
month
PN
1965-1972 1972-2005 Linear (1965-1972) Linear (1972-2005)
(b)
(c)
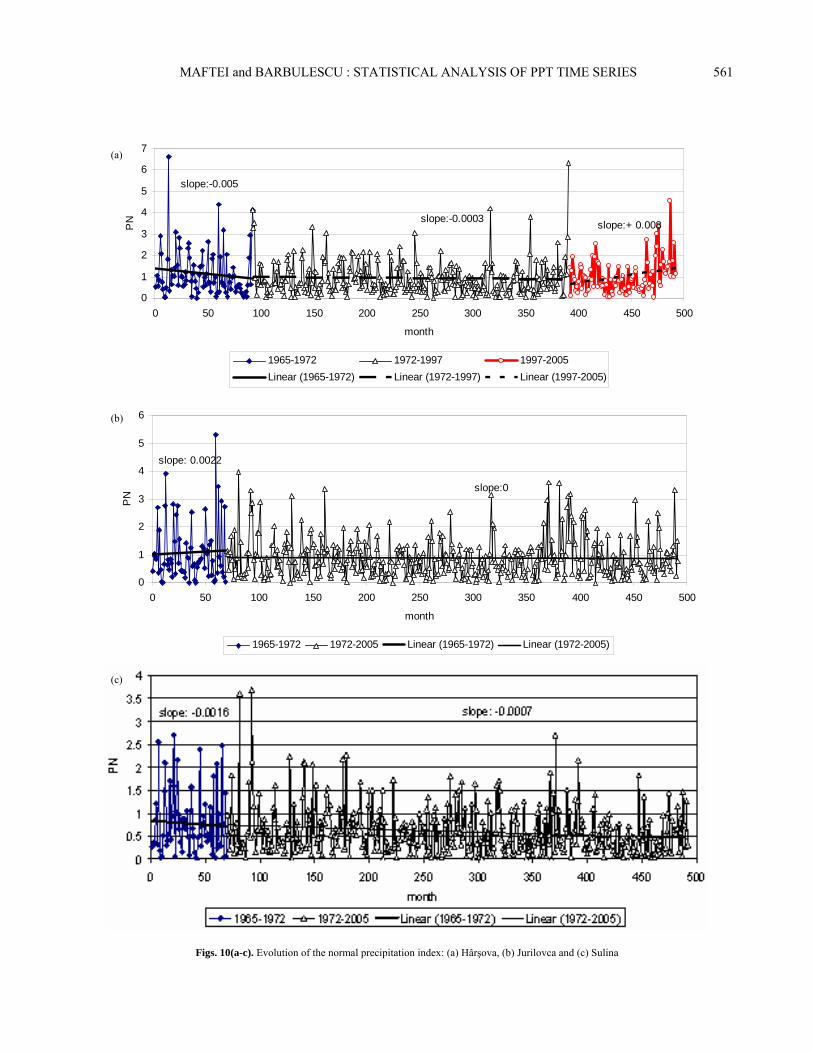
Figs. 10(a-c). Evolution of the normal precipitation index: (a) Hârşova, (b) Jurilovca and (c) Sulina

562 MAUSAM, 63, 4 (October 2012)
Fig. 11. Sen’ slope - Sulina series
TABLE 4
The result of Wilcoxon test
Hypothesis: H0 - The average for the two samples are equal, H1 - The average for the two samples are unequal
Adamclisi Cernavoda Medgidia Harsova Corugea
Result: Jun 1994
p = 0.0339
H0 rejected at 5%,
accepted at 1%.
Result: Apr 2004
p = 0.0331
H0 rejected at 1%
Result: Jun 2002
p = 0.010
H0 rejected at 1%
Result: Jan 2000,
Sept 2003
P = 0.046; 0.027
H0 rejected at 5 %, accepted at 1%
Result: Nov 1972,
Sept 1996
p = 0.022; 0.024
H0 rejected at 1%
Tulcea Sulina Jurilovca Constanta Mangalia
Result: Jan 1985
p = 0. 492
H0 accepted at 5%
Result: Sep 1982,
May 2004
p = 0.002; 0.04
H0 rejected at 1%,
Result: Mart 1995,
Dec 1998;
p = 0.0237; 0.012
H0 rejected at 5%, accepted at 1 %
Result: May 1973,
Oct 1994
p = 0.04; 0.012
H0 rejected at 5%
Result: Jan 1985
p = 0.415
H0 accepted 5%
Adamclisi series are depicted by small balls, the numbers near them denoting the month number, zero being associated to January 1965 and 492 to December 2005. In Figs. 8 & 9 we remark the existence of a change point for Adamclisi, respectively the change point’s absence for Tulcea.
We remark that the Wilcoxon test and CUSUM procedure gives the same results concerning the break point year, excepting for Constanta series. 4.3. Analysis of the Normal Precipitation index
The change points detected for all the series are presented in Table 3, together with the confidence levels, the average of the neighbour segments, the level of change point and the method used.
Analyzing the results of “Normal Precipitation” index we observe that its pattern is different (i) in the central and western zone, the index was slightly decreasing in the period 1965-1992, constant between 1992 and 1997 and increasing after 1997 [Fig. 10(a)]; (ii) on the Danube Delta and the Lagunar Complex, its trend was slightly increasing in the period 1965 - 1972, then constant [Fig. 10(b) - Jurilovca station]; (iii) on the
Since the results of the tests and of CUSUM procedure were not in concordance, a homogeneity test (Wilcoxon) was also performed (Table 4).

MAFTEI and BARBULESCU : STATISTICAL ANALYSIS OF PPT TIME SERIES 563
Littoral (without the Danube Delta and the Lagunar complex), the was slightly decreasing in the study period; (iv) for Sulina the trend was decreasing. Since the Normal index values are very small in all cases, but Sulina, the Mann - Kendall test and Sen’s slope estimate (www.emep.int/) for the annual average precipitation have been performed. The single series for which the slope was significant is Sulina (Fig. 11). 5. Conclusions Statistical tools were used to study the precipitation variation in a region of Romania. The isohyets analysis emphasized the precipitation increase from the boundary of the region to its interior and from the territory with low altitude, to that with higher one. Since the break point and CUSUM results were not concordant, the Normal index, introduced by us, has been calculated and the Mann Kendall tests have been performed in order to detect the trend existence in the annual mean precipitation. The results are concordant, the single precipitation series that registered a decreasing trend being Sulina, which has a particular position in the Danube Delta, 13 km offshore. The methods used here have also limitations, since the seasonality existence has not been considered. Therefore, a more complete image of the precipitation evolution could be given performing such an analysis on different seasons (winter, spring, autumn and summer), or after extracting the seasonality from the series. This approach will be done in a future article.
Acknowledgement
The data were provided by A.N.M. (National Meteorological Agency). This article was supported by CNCSIS - UEFISCSU by Grant PN II IDEI 262/2007.
References
Bărbulescu, A. and Deguenon, J., 2012, “Fitting Precipitation Variability in Dobrudja Region”, Recent Researches in Applied Computers and Computational Science, 30-34.
Bărbulescu, A., Serban (Gherghina), C. and Maftei, C., 2010, “Statistical analysis of Hurst coefficient for annual and monthly precipitation time series”, Wseas Transaction on Mathematics, 10, 9, 791-800.
Bricquet, J. P., Bamba, F., Mahe, G., Toure, M. and Olivry, J. C., 1997, “Variabilité des ressources en eau de l’Afrique Atlantique”, PHI-V, 6, 83-95.
Buishand, T. A., 1984, “Tests for detecting a shift in the mean of hydrological time series”, Journal of Hydrology, 58, 51- 69.
Busuioc, A. et al., 1995, “Observed temperature and precipitation variability in Romania”, http://meteo.hr/SEECOF08/day2/2-19.pdf
Frich, P., Alexander, L. V., Della-Marta, P., Gleason, B., Haylock, M., Tank, A. M. G. K. and Peterson, T., 2002, “Observed coherent changes in climatic extremes during the second half of the twentieth century”, Clim. Res., 19, 193-212.
Gong, D. Y. and Wang, S. W., 2000, “Severe summer rainfall in China associated with aggravated global warming, Climate Research, 16, 51-59.
Gruza, G., and Rankova, E., 2004, “Detection of changes in climate state, climate variability and climate extremity”, Proc. World Climate Change Conference, 29 Sept.-3 Oct. 2003, Moscow, 90-93.
Hubert, P., 2000, “The segmentation procedure as a tool for discrete modeling of hydrometeorologycal regimes”, Stochastic Environmental Research and Risk Assessment, 14, 297-304.
Hackl, P. and Maderbacher, M., 1999, “On the Robustness of the Rank-Based CUSUM Chart against Autocorrelation”, http://epub.wu.ac.at/1764/1/document.pdf.
Huntingford, C., Jones, R. G., Prudhomme, C., Lamb, R., Gash, J. H. C. and Jones, D. A., 2003, Regional climate-model predictions of extreme rainfall for a changing climate”, Quarterly Journal of the Royal Meteorologycal Society, 129, 1607-1621.
IPCC 2001, Climate Change 2001: The Scientific Basis, Cambridge University Press.
IPCC 2007, Climate Change 2007: The Scientific Basis, Cambridge University Press.
James, B., James, K. L. and Siegmund, D., 1987, “Tests for a change point”, Biometrika, 74, 71-83.
Kass-Hout, T. https://sites.google.com/site/changepointanalysis/
Khan, T. M. A., Singh, O. P. and Rahman, M. S., 2000, “Recent sea level and sea surface temperature trends along the Bangladesh coast in relation to the frequency of intense cyclones” Marine Geodesy, 23(2), 103-116.
Klein Tank, A. M. G. et al., 2002, “Daily dataset of 20th-century surface air temperature and precipitation series for the European Climate Assessment”, Int. J. Climatol., 22, 1441-1453.
Lal, R., 2003, “Offsetting global CO2 emissions by restoration of degraded soils and intensification of world agriculture and forestry”, Land Degradation and Dev., 14, 309-322.
Lee, A. F. S. and Heghinian M. S., 1977, “A Shift of the Mean Level in a Sequence of Independent Normal Random Variables - A Bayesian Approach”, Technometrics, 19, 4, 503-506.
Lubes, H., Masson, J. M., Servat, E., Paturel, J. E., Kouame, B. and Boyer, J. F., 1994, “Caractérisation de fluctuations dans une série chronologique par applications de tests statistique”. Rapport No. 3, Programme ICCARE, p21.
Mahe, G. and Olivry, J. C., 1995, “Variations des précipitations et des écoulements en Afrique de l’ouest et centrale de 1951 à 1989”, Sécheresse, 6, 1, 109-117.
Maftei, C. and Bărbulescu, A., 2008, “Statistical analysis of climate evolution in Dobrudja region”, Lecture Notes in Engineering and Computer Sciences, WCE 2008, Vol. II, 1082 -1087.

564 MAUSAM, 63, 4 (October 2012)
Shrestha, A. B., Wake, C. P., Dibb, J. E. and Mayewski, P. A., 2000, “Precipitation fluctuations in the Nepal Himalaya and its vicinity and relationship with some large-scale climatological parameters”, Int. J. Climatol., 20, 317-327.
May, W., Voss, R. and Roeckner, E., 2002, “Changes in the mean and extremes of the hydrological cycle in Europe under enhanced greenhouse gas conditions in a global time-slice experiment”, Advances in Global Change Research, 10, 1-29.
Steinemann, A., Hayes, M. and Cavalcanti, L., 2006, “Drought Indicators and Triggers”, ASCE Journal of Water Resources Planning and Management, 132, 3, 164-174.
Min, S. K., Kwon, W. T., Park, E. H. and Choi, Y., 2002, “Spatial and temporal comparisons of droughts over Korea with East Asia”, Int. J. Climatol., 23, 223-233.
Steinberger, E. H. and Gazit-Yaari, N., 1996, “Recent changes in the spatial distribution of annual precipitation in Israel”, J. Climate, 9, 3328-3336.
Mirza, M. M. Q., Warrick, R. A. and Ericksen, N. J., 2003, “The implications of climate change on floods of the Ganges, Brahmaputra and Meghna Rivers in Bangladesh”, Climatic Change, 57, 287-318.
Taylor, W., 2002, Change-PointAnalyzer, ASA : http://www.variation. com/ library.html
Olshen, A. B., Venkatraman, E. S., Lucito, R. and Wigler, M., 2004,“Circular binary segmentation for the analysis of array-based DNA copy number data”, Biostatistics, 5, 557-572.
Western, B. and Kleykamp, M., 2004, http://scholar.harvard.edu/ brucewestern/files/hists5.pdf
Wikipedia: http://en.wikipedia.org/wiki/Dobruja
Willeke, G., Hosking, J. R. M., Wallis, J. R. and Guttman, N. B, 1994, The National Drought Atlas, Institute for Water Resources Report 94-NDS-4, U.S. Army Corps of Engineers.
Pettitt, A. N., 1979, “A non - parametric approach to the change-point problem”, Applied Statistics, 28, 2, 126-135.
Piervitali, E., Colacino, M. and Conte, M., 1998, “Rainfall over Central-Western Mediterannean Basin in the period 1951- 1995 : Part I. Precipitations trends”, Nuovo Cim. 21C, 3, 331-334.
Zhai, P. M., 2004, “Climate change and meteorological disasters”, Sci. Techn. Rev., 193(7), 11-14.
Zhai, P. and Pan, X., 2003, “Trends in temperature extremes during 1951-1999 in China”, Geophysical Research Letters, 30 (17), 1913, doi: 10.1029/2003GL018004.
Planton, S., Déqué, M., Douville, H. and Spagnoli, B., 2005, “Impact du réchauffement climatique sur le cycle hydrologique“, Geoscience, 337, 193-202.
Zhai, P. M., Sun, A., Ren, F., Liu, X., Gao, B. and Zhang, O., 1999, “Changes of climate extremes in China”, Climatic Change, 42, 203-218.
Sen, A. and Srivastava, M. S., 1975, “On tests for detecting change in
mean when variance is unknown”, Annals of Statistics, 3, 1, 98-108.
Zwiers, F. and Kharin, V., 1998, “Changes in the extremes of climate simulated by CCC GCM2 under CO2 doubling”, J. Climate, 11, 2200-2222.