statistical analysis and visualization for cyber...
TRANSCRIPT
Statistical Analysis and Visualization
for Cyber Security Joanne Wendelberger, Scott Vander Wiel
Statistical Sciences Group, CCS-6 Los Alamos National Laboratory
Quality and Productivity Research Conference
IBM Watson Research Center
Yorktown Heights, New York
June 5, 2009 LA-UR-09-03485
2
Abstract
Diverse interdisciplinary capabilities are needed to address the challenges of Cyber Security including mathematics, statistics, information science, computer science, and high performance computing, as well as subject matter expertise in cyber security, homeland security, and intelligence. Expertise is needed several areas including, but not limited to the following: modeling and simulation; statistical methodology for exploration, analysis, prediction, and uncertainty quantification; network analysis and graph theory, machine learning and anomaly detection, streaming data, data intensive computing, and visualization. Cyber Security provides exciting opportunities to pursue innovative research motivated by our need to ensure the security and privacy of networks, systems, and data. A description of capabilities and research needs along with cyber-specific examples will be presented.
3
Many individuals have contributed to the ideas in this presentation.
Jim Ahrens, CCS-1
Michael Cai, ISR-3
Carolyn Connor, HPC-5
Stefan Eidenbenz, CCS-3
Mike Fisk, ACS-PO
Gary Grider, HPC-DO
Aric Hagberg, T-5
Dave Higdon, CCS-6
Don Hush, CCS-3
Pat Kelly, CCS-3
Alex Kent, ACS-PO
Earl Lawrence, CCS-6
Sarah Michalak, CCS-6
Scott Miller, ACS-PO
Leslie Moore, CCS-6
John Patchett, CCS-1
Clint Scovel, CCS-3
Jim Smith, D-DO
Richard Strelitz, CCS-3
Pieter Swart, T-5
Joanne Wendelberger, CCS-6
Scott Vander Wiel, CCS-6
Brian Williams, CCS-6
Jonathon Woodring, CCS-1
And others

4 Extensive data is collected on cyber security.

5

6
Cyber Security poses a number of interdisciplinary research challenges.
Intrusion tolerance and resilience; containing, removing, and surviving intrusions
Mining peta-scale network data to detect changes and anomalies and predict consequences
Creating trust (confidentiality, integrity, availability, and privacy) in systems that contain untrusted components
Evening the playing field between offense and defense
7
Statistical capabilities can contribute to Cyber Security challenges in many areas.
Modeling and Simulation
Networks and Graphs
Classification and Anomaly Detection
Analysis of Petascale Data
Streaming Data
Data Intensive Computing
Statistical Graphics and Real-time Visualization
8
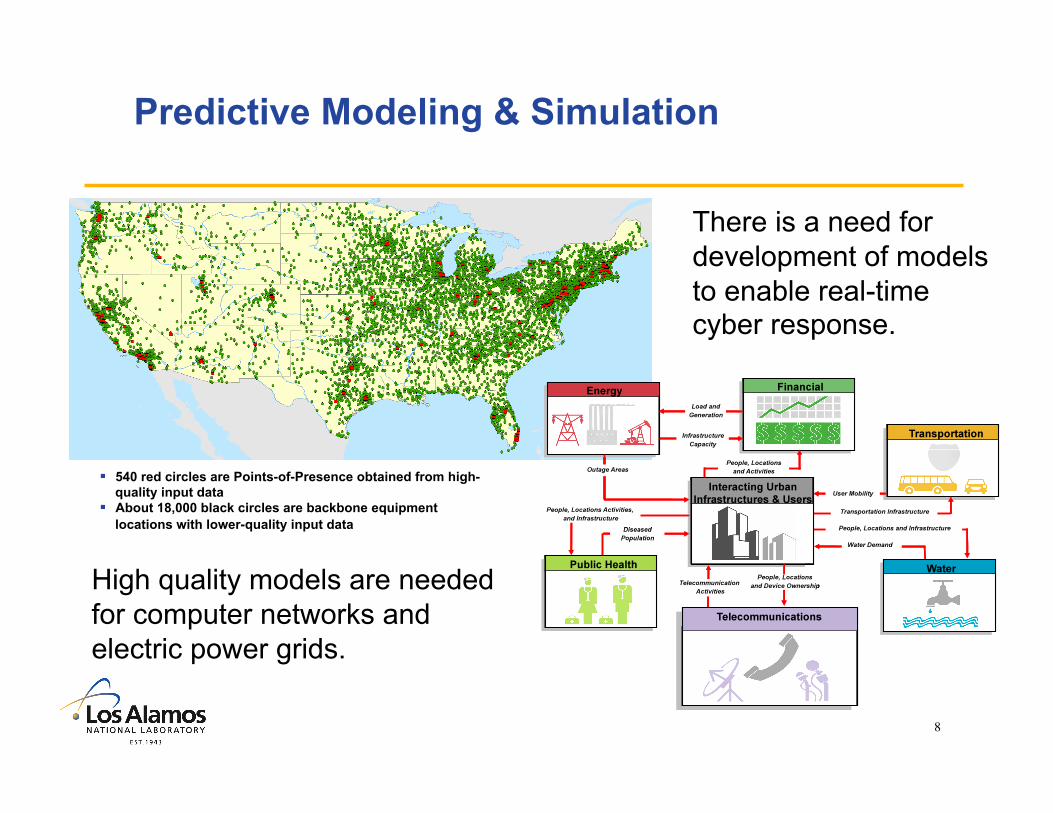
Predictive Modeling & Simulation
540 red circles are Points-of-Presence obtained from high-quality input data
About 18,000 black circles are backbone equipment locations with lower-quality input data
High quality models are needed for computer networks and electric power grids.
There is a need for development of models to enable real-time cyber response.
9
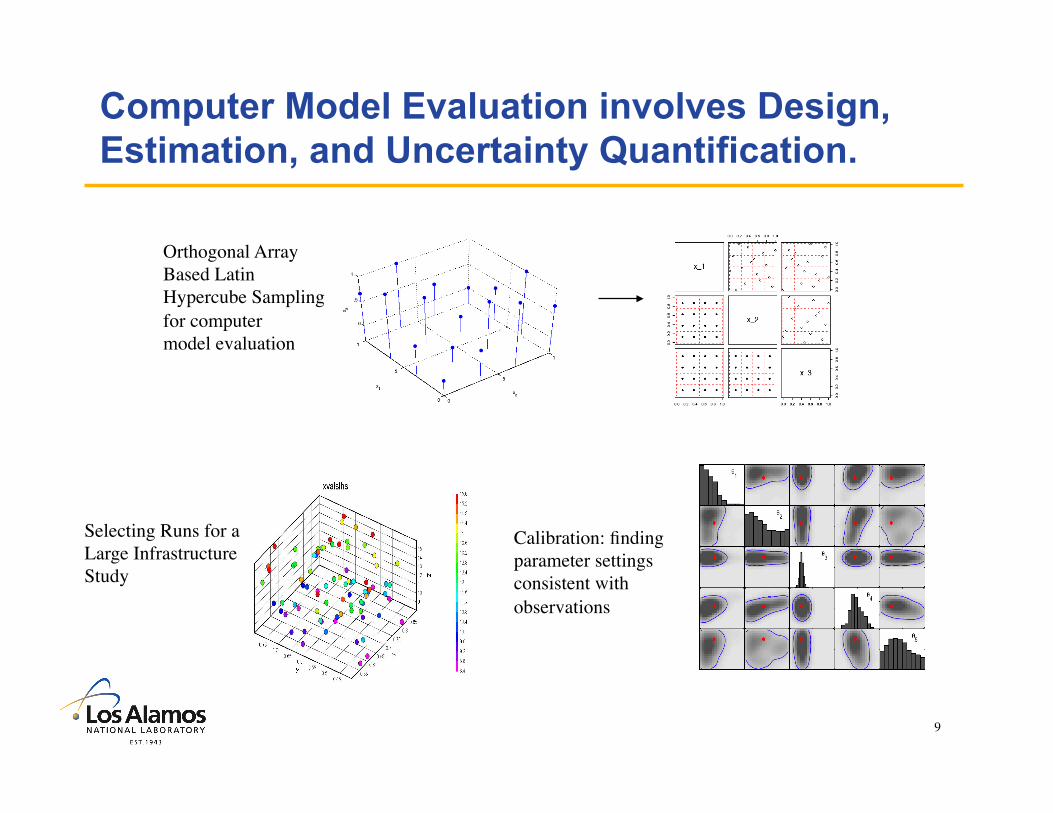
Computer Model Evaluation involves Design, Estimation, and Uncertainty Quantification.
Orthogonal Array Based Latin Hypercube Sampling for computer model evaluation
Calibration: finding parameter settings consistent with observations
Selecting Runs for a Large Infrastructure Study

10
Mathematical methods for networks and graphs aid in understanding cyber behavior.
Networks and Graphs provide mathematical constructs for modeling network behavior.
The Internet involves massive time-varying graphs.
NetworkX provides a Python package for exploration and analysis of networks and network algorithms including network properties and structure measures.
Methodology needs to be developed for Uncertainty Quantification in networks.

11
Network Tomography provides information about traffic behavior on networks.
• Passive: Estimate origin-destination traffic intensities based on link-level packet counts using existing network traffic at individual links.
• Active: Estimate link performance parameters based upon end-to-end path-level measurements using injected traffic.
NETWORK TOMOGRAPHY
12
Anomaly Detection Methods are needed to identify unusual patterns of cyber behavior.
Probability distributions can be used to characterize baseline behavior and identify anomalous behavior.
Time series analysis concepts can be incorporated into methods for analyzing cyber data.
Classification/machine learning algorithms, including direct methods such as Support Vector Machines, can be developed for detecting anomalies in cyber data.
Network-centric anomaly detection proposed to identify evolving threats with sensor networks.
13
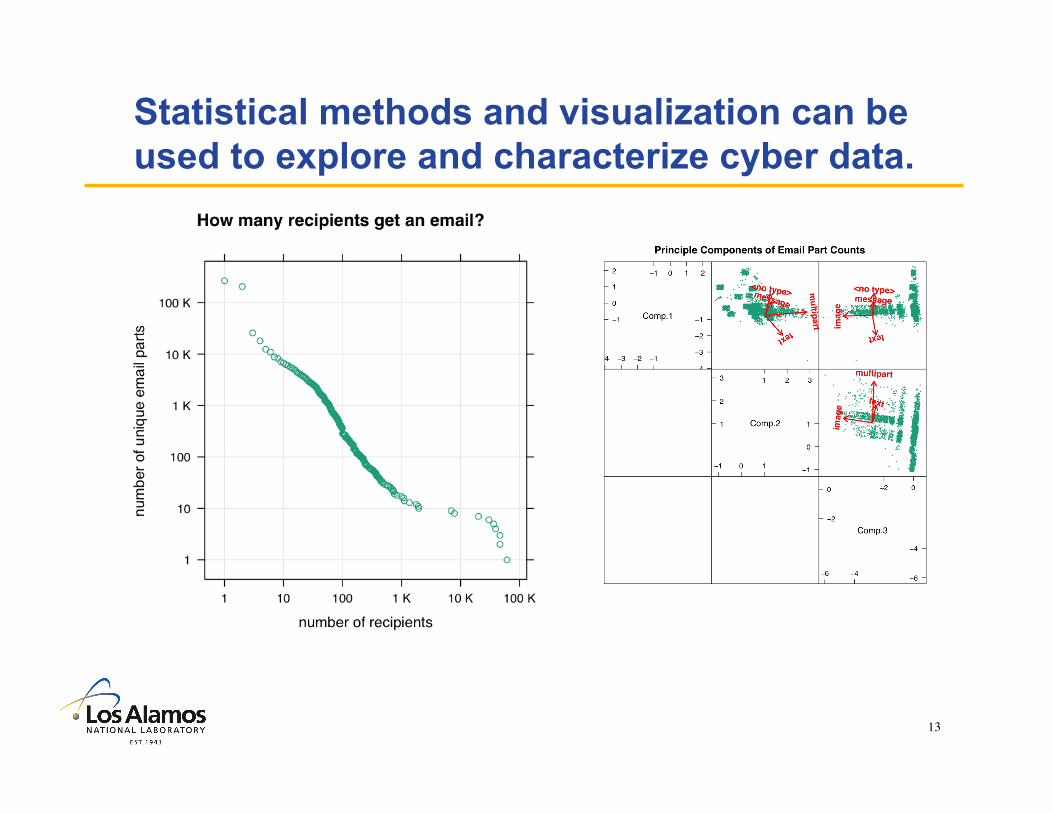
Statistical methods and visualization can be used to explore and characterize cyber data.
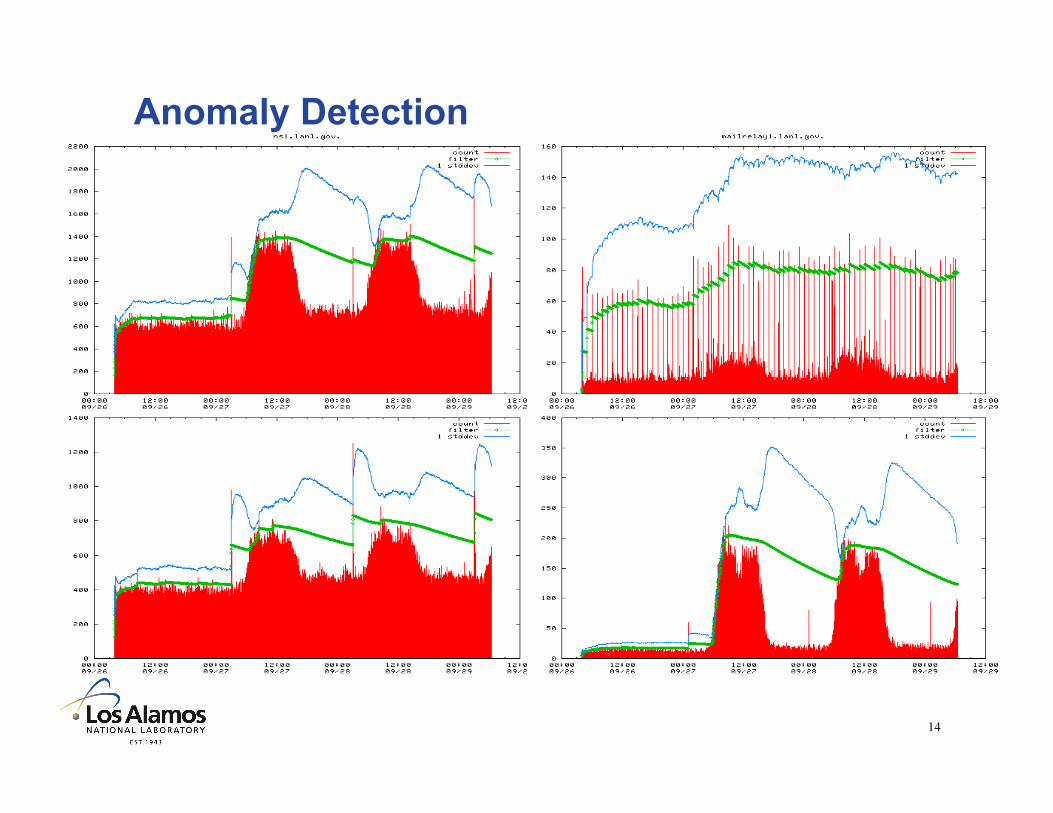
14
Anomaly Detection
15
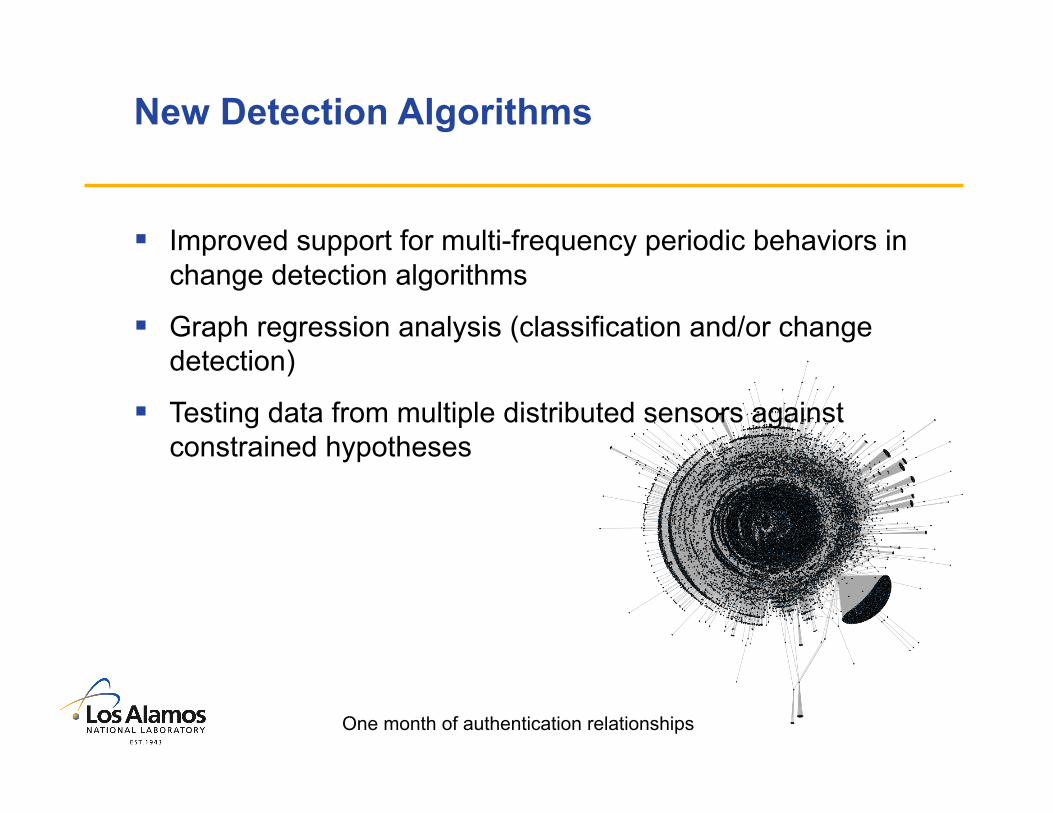
New Detection Algorithms
Improved support for multi-frequency periodic behaviors in change detection algorithms
Graph regression analysis (classification and/or change detection)
Testing data from multiple distributed sensors against constrained hypotheses
One month of authentication relationships

16
Petascale network data requires novel methods for data selection, acquisition, storage, and analysis.
Need mathematical methods that can be implemented for high volume data.
1 10 100 Gb/s
Real-time summarization and down-selection of data may have to be implemented.
May need to use probabilistic sampling, counting, indexing to reduce volume while retaining important characteristics.
Parallel and distributed storage, analysis & query will be required for analysis.
17
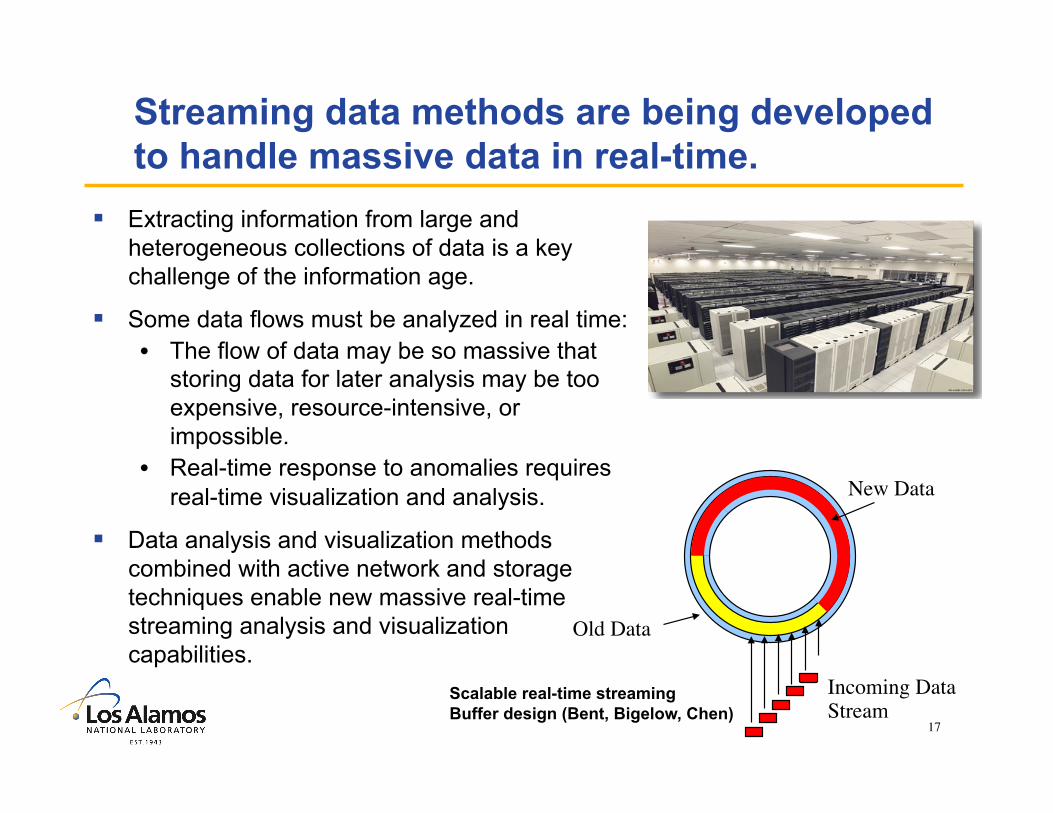
Streaming data methods are being developed to handle massive data in real-time.
Extracting information from large and heterogeneous collections of data is a key challenge of the information age.
Some data flows must be analyzed in real time: • The flow of data may be so massive that
storing data for later analysis may be too expensive, resource-intensive, or impossible.
• Real-time response to anomalies requires real-time visualization and analysis.
Data analysis and visualization methods combined with active network and storage techniques enable new massive real-time streaming analysis and visualization capabilities.
Incoming Data Stream
Old Data
New Data
Scalable real-time streaming Buffer design (Bent, Bigelow, Chen)
18
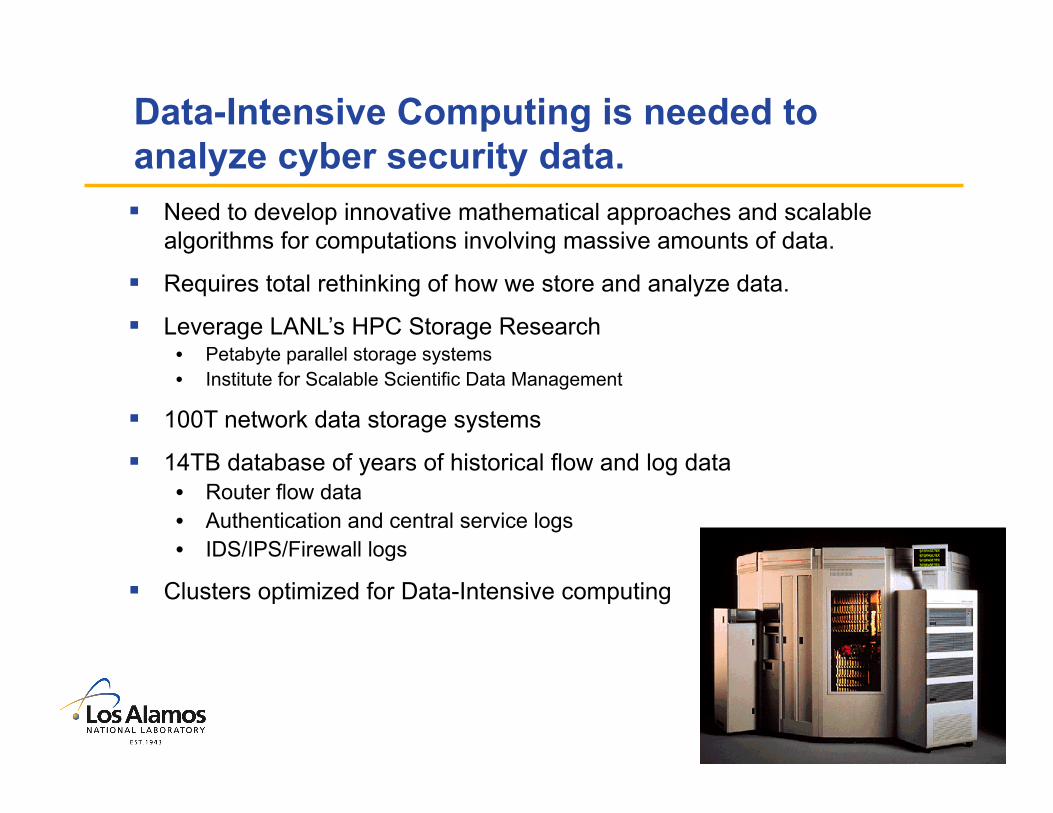
Data-Intensive Computing is needed to analyze cyber security data. Need to develop innovative mathematical approaches and scalable
algorithms for computations involving massive amounts of data.
Requires total rethinking of how we store and analyze data.
Leverage LANL’s HPC Storage Research • Petabyte parallel storage systems • Institute for Scalable Scientific Data Management
100T network data storage systems
14TB database of years of historical flow and log data • Router flow data • Authentication and central service logs • IDS/IPS/Firewall logs
Clusters optimized for Data-Intensive computing

19
Real-time Visual Analytics provide insight for network data.
Geo-spatial representation of network traffic
Representation of domain name hierarchies
Coordinate-space visualization of network scans
20
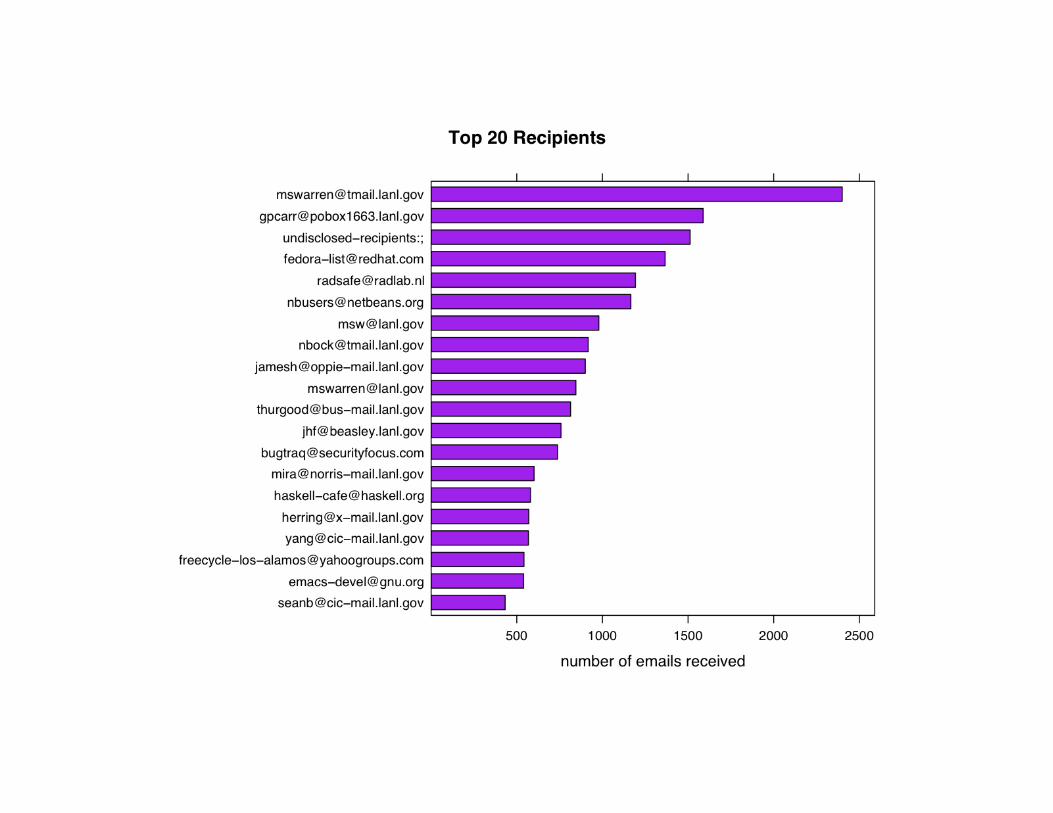
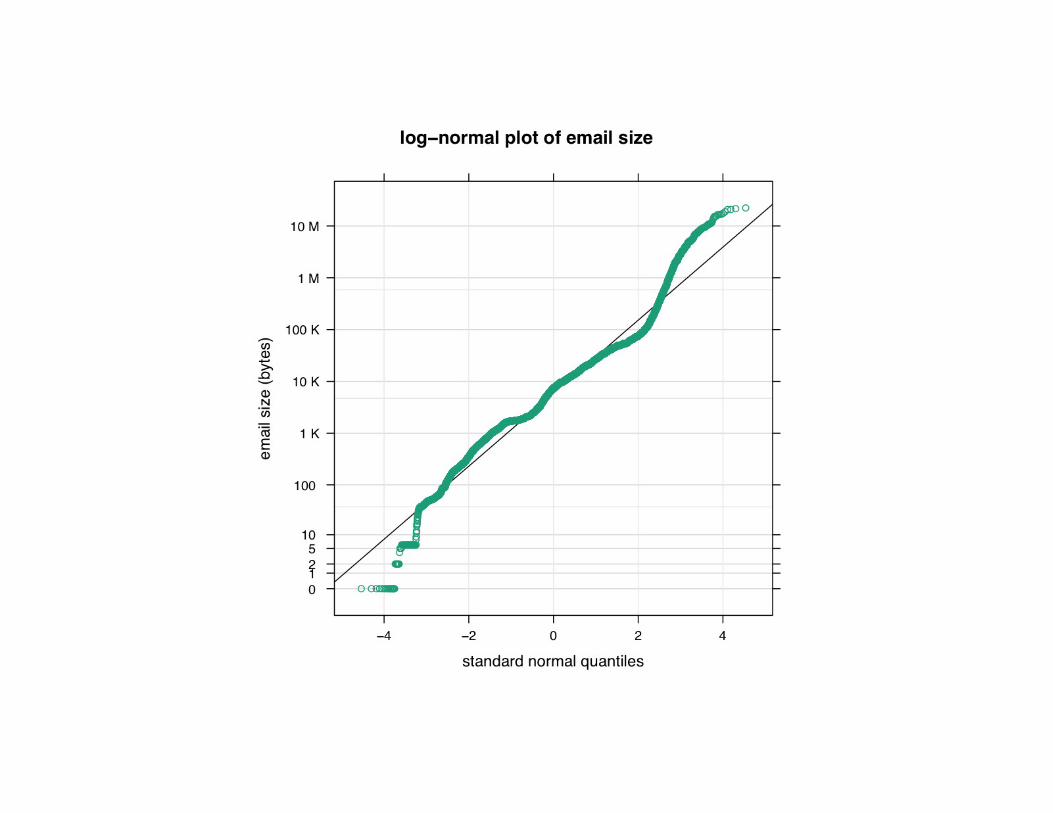
Email Investigation
Development of R code for displaying and extracting information from dataset
Large dataset analysis and display techniques • Sub-setting of data for fast exploration • Jitter to display overlapping points • Subset display points in high density regions for computational
efficiency
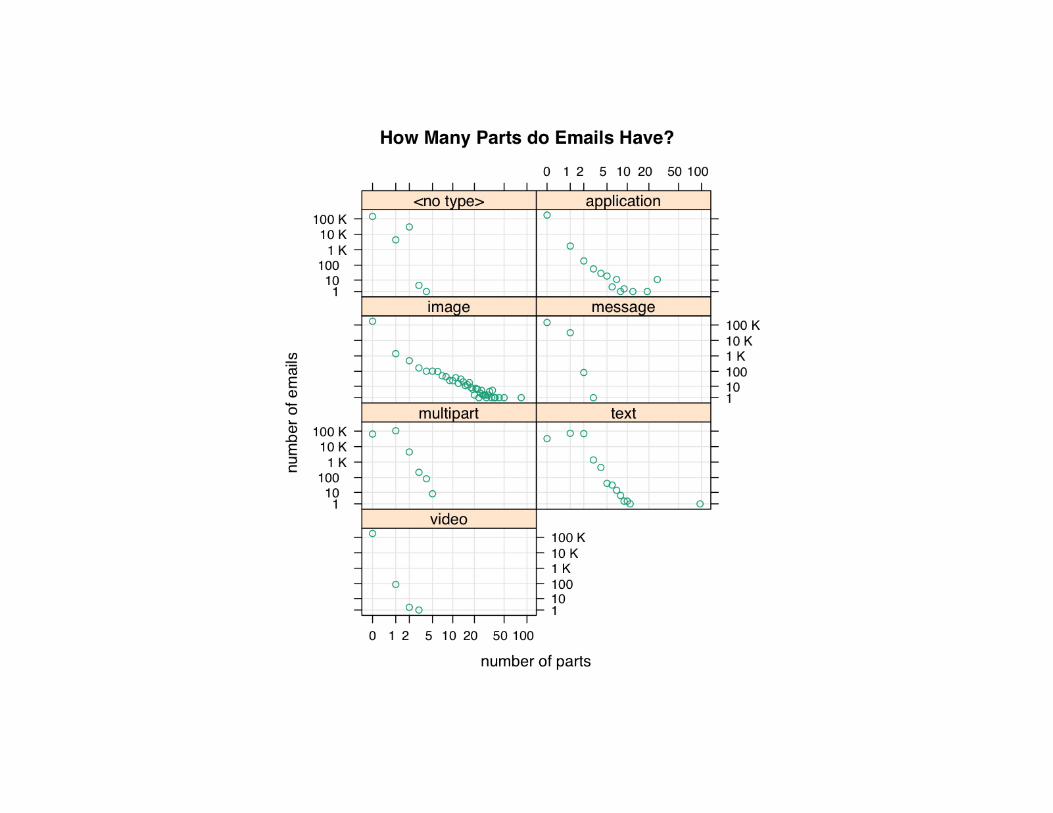
Identification of emails with unusual origin specification Distributions of email part counts by type
Representation of part counts using principal components analysis • Identify extreme points • Uncover multivariate structure


28
Technical Challenges
Streaming Data – collection, sampling, selection, updating
Signatures – broad tracking and monitoring of diverse individual usage patterns
Sketches – approximate tracking of limited characteristics on huge numbers of individuals when complete signatures would exceed memory and throughput capacity
Integration of capabilities for Database/Visualization/Statistics

29
Department of Energy Office of Science Grassroots Initiatives

30
Summary: Statistical methods are needed to address challenges in Cyber Security.
Extensive resources are needed to conduct statistical research in applied motivated by cyber security problems.
Statistical solutions can contribute to the next-generation of computer network operations to achieve the Threat Resilient Network.
End-to-end understanding of complex systems is needed to provide secure systems, networks, and data.