static liquefaction of sandy soil: an experimental investigation into
TRANSCRIPT
Acta Mech 218, 175–186 (2011)DOI 10.1007/s00707-010-0410-x
Noureddine Della · Ahmed Arab · Mostefa Belkhatir
Static liquefaction of sandy soil: An experimentalinvestigation into the effects of saturation and initial state
Received: 12 April 2010 / Revised: 11 October 2010 / Published online: 25 November 2010© Springer-Verlag 2010
Abstract The effects of initial state of the samples and the saturation evaluated in terms of Skempton’s porepressure B on the behavior of Chlef sand are studied in this article. For this purpose, the results of two seriesof drained and undrained monotonic triaxial compression tests on medium dense sand are presented. In thefirst test series, the influence of the specimen’s fabric and confining pressure has been studied. The testswere conducted at initial confining pressure of 50, 100, and 200 kPa. The specimens were prepared by twodepositional methods that include dry funnel pluviation and wet deposition. All the samples were subjectedto a monotonic loading after a consolidation phase. The results of the tests demonstrate that initial confiningpressure and the specimen’s fabric have detectable effects on the behavior of the sand. In the second seriesof tests, the saturation influence on the resistance to the sand liquefaction has been realized on samples at aneffective stress of 100 kPa for Skempton’s pore pressure coefficient varying between 13 and 90%. It was foundthat the increase in Skempton’s pore pressure coefficient B reduces the soil dilatancy and amplifies the phaseof contractancy.
1 Introduction
In the early afternoon (13:25 local time, 12:25 GMT) of October 10, 1980, the largest earthquake of thecentury in Algeria (Mw = 7.3) struck the Chlef region (formerly known as El-Asnam) [1–3]. The epicenterwas localized in the North East of El-Asnam near the village of Beni Rached. This earthquake killed morethan 3000 persons and caused great destruction to buildings, bridges, dams, highways and railways. After thisearthquake, sand boiling, serious settlement, and surface ruptures were widely observed in some areas.
According to Durville and Méneroud [4], the phenomenon of liquefaction appeared on a vast alluvial valleycrossed by the Chlef River and to the zone of confluence of this River with the Fodda River as it is shown inFig. 1.
2 Literature review
During earthquakes, the shaking of the ground may cause saturated cohesionless soils to lose their strengthand behave like a liquid. This phenomenon is called soil liquefaction and will cause settlement or tipping ofbuildings, failures of earth dams, earth structures and slopes. The modern study of soil liquefaction has beentriggered by numerous liquefaction-induced failures during the 1964 Niigata, Japan earthquake.
Numerous studies have reported that the behavior of sands can be greatly influenced by the initial stateand the saturation of the soil. Polito and Martin [5] asserted that the relative density and skeleton void ratio
N. Della (B) · A. Arab · M. BelkhatirLaboratory of Material Sciences and Environment, Civil Engineering Department,University of Chlef, Sendjas Street, P.O. Box 151, Chlef 02000, AlgeriaE-mail: [email protected]

176 N. Della et al.
Fig. 1 Valley of the Chlef river and localization of the sand boils due to the liquefaction phenomenon
were factors that seemed to explain the variation in different experimental results. Yamamuro and Lade [6,7]and Yamamuro and Covert [8] concluded that complete static liquefaction (zero effective confining pressureand zero effective stress difference) in laboratory testing is most easily achieved in silty sands at very lowpressures. Kramer and Seed [9] also observed that liquefaction resistance increased with increasing confiningpressure.
Several specimen reconstitution techniques, tamping and pluviation being the most common, are in usein current practice. The objective in all of these is to replicate a uniform sand specimen at the desired voidratio and effective stresses to simulate the sand mass in situ. However, the effect of the preparation method ofthe samples has been subject to controversial researches. Many studies have reported that the resistance to theliquefaction is more elevated for samples prepared by the method of sedimentation than for samples preparedby the dry funnel pluviation and the wet deposition [10]; other studies have found that the specimens preparedby dry funnel pluviation method tend to be less resistant than those reconstituted by wet deposition method[11,12]. Other researchers indicated that the tests prepared by dry funnel pluviation are more stable and dilatantthan those prepared by wet deposition [13,14]. Vaid et al. [15] confirm this result while showing that the wetdeposition encourages the initiation of the liquefaction in relation to a setting up by pluviation under water.Yamamuro et al. [16] concluded after their laboratory investigation that the method of dry pluviation supportsthe instability of the samples contrary to the method of sedimentation. Wood et al. [17] found that the effectof the method of deposition on the undrained behavior decreases, when the density increases. They also foundthat this influence decreases with the increase in the fines content, particularly with the lower densities. Dellaet al. [18], by performing undrained monotonic tests on loose and dense samples of Chlef sand, showed thatthe dry pluviation method induces higher liquefaction resistance than the wet deposition method. The focusof this study was to identify the differences in drained and undrained triaxial compression behavior that canresult from using different reconstitution techniques to create silty sand specimens.
The majority of the investigations into the liquefaction of the granular soils were based on completelysaturated material. The incidence of a partial saturation on cyclic resistance was approached in a theoreticalway by Martin et al. [19]. Mulilis et al. [20] examined the effect of the saturation degree on the liquefaction ofMonterrey sand. They noted that the variation of the of Skempton’s coefficient B between 0.91 and 0.97 doesnot significantly affect the liquefaction of this sand. This influence depends on the type of soil, the density andthe initial confining pressure. However, the recent results of the in situ tests include the measurements of thevelocity of the compression waves (Vp), and indicate that the condition of partial saturation can exist abovethe level of the phreatic ground for a few meters due to the presence of bubbles of air [21,22] or the presenceof gas bubbles in the marine sediments and sands containing oils as noted by Mathiroban and Grozic [23].

Static liquefaction of sandy soil 177
0.010.101.0010.00
Grain size (mm)
0
10
20
30
40
50
60
70
80
90
100
Per
cen
t fi
ner
(%
)
Sand of Chlef
Fig. 2 Grain size of the used sand
The effects of a condition of partial saturation on liquefaction were approached by some researchers [23–26].The condition of saturation of soil samples in the laboratory can be evaluated by measuring the value ofSkempton’s pore pressure (B) coefficient as suggested by Ishihara et al. [21]. The results of the laboratorytests showed that the resistance to the liquefaction of sands increases when the saturation degree decreases[19,21–31].
Mullilis et al. [20] and Tatsuoka et al. [32] showed that in the case of loose sands, a good saturation requireshigh values of the coefficient B. On the other hand, for stiffer materials, the problem seems less critical. Sheriffet al. [33] show that a fine or clayey sand can be considered saturated if the value of B exceeds 0.8. Chaney[34] summarized that the coefficient B must exceed 0.96 so that the soil is well saturated. Giroud and Cordary[35] noted that for values of B superiors to 0.85, the degree of saturation is very close to 1.Tests of liquefactionwere carried out by Yoshimi et al. [27] on medium dense Toyoura sand with various degrees of saturation. Theresults show that the degree of saturation significantly affects the resistance to liquefaction: With a coefficientB higher than 0.8, it is enough to apply three cycles to have a liquefaction of the sample, whereas we needeight cycles to obtain liquefaction of the specimens having a coefficient B close to 0.5.
This paper includes a contribution to the experimental data. It presents results of drained and undrainedmonotonic triaxial tests performed on Chlef sand for various values of the Skempton’s pore pressure coefficient.
3 Material tested
All tests in the present study were performed on the sand of Chlef (Algeria) containing 0.5% of silt of the riverof Chlef that crosses the city of Chlef (formerly El-Asnam). The granulometric curve of this sand is given inFig. 2. The sand of Chlef is a medium sand, rounded with a medium diameter D50 = 0.45 mm. The containedsilt is non-plastic with a plasticity index of 5.81%. Table 1 shows the physical properties of the used sand. The
Table 1 Properties of soil tested
Material emin emax γd min γd max γs g/cm3 Cu D60/D10 D50 mm D10 mm Grains shapeg/cm3 g/cm3
O/Chlef 0.54 0.99 1.34 1.73 2.67 3.2 0.45 0.15 Rounded

178 N. Della et al.
tests have been carried out on medium dense specimens collected from the region where the phenomenon ofliquefaction was observed during the last earthquake.
4 Experimental procedures
An advanced automated triaxial testing apparatus of Bishop and Wesley type [36] was used to conduct themonotonic drained and undrained tests.
4.1 Sample preparation
The samples were prepared with the help of a mold constituted of two semi-cylindrical shells. The two shellscan easily be joined or embossed one from the other with the help of a hose clamp. In order to maintain thecuff made of latex along the partitions of the mold, four ducts of aspiration are pierced in the conducted shells.Cylindrical soil specimens of 70 mm diameter and 140 mm height (H/D = 2.0) are created. The mass of sandto put in place is evaluated according to the wished density (the initial volume of the sample is known), thestate of density of the sample being defined by the relative density:
ID = (emax − e) / (emax − emin) . (1)
4.2 Depositional techniques
Two methods were used to reconstitute the specimens of sand: the wet deposition and dry funnel pluviation.The first method consists in mixing, in the most possible homogeneous manner, a small quantity of water fixedat 3%, with the sand previously dried and the deposition of the humid soil into the mold. The soil is placedfinely by successive layers (seven layers). A constant number of strokes was applied to get a homogeneousand isotropic structure. In dry funnel pluviation method, the dry soil is deposited in the mold with the help ofa funnel with control of the height. This method consists in filling the mold by tipping in rain of the dry sand.
4.3 Saturation of the sample
To obtain a good degree of saturation, the technique of carbon dioxide worked out by Lade and Duncan [37]was used. The sample is firstly swept by carbon dioxide for 20 minutes, then we let circulate the deaerated anddemineralized water until collecting a volume of water superior to one and a half the volume of the sample.To be able to obtain samples with various degrees of saturation, we have varied the time of passage of carbondioxide and the duration of duct drainage deaerated water through the sample.
4.4 Consolidation of the sample
The phase of consolidation consists in applying simultaneously a rise of pressure in the cell by meansof the volume/pressure controller (GDS1) and inside the sample (GDS2). The application of back pressure tothe sample using the GDS2 improves the quality of the saturation by compressing the microbubbles of theinterstitial gas that remains imprisoned between the grains of the soil. We maintain the pressures in the cell andthe sample until stabilization of volumes (cell and sample). The quality of saturation is evaluated by measuringthe Skempton’s coefficient (B). This coefficient (B) is equal to �u/�σ . We give an increment �σ of 100 kPato the GDS1 connected to the cell, and we measure the variation of the pore water pressure �u by the GDS2connected to the sample. The back pressure used is of 400 kPa.
The degree of saturation is controlled during a triaxial compression test by the Skempton’s coefficient thatcan be related to the degree of saturation by the following relation [38]:
B = 1
1 + nks
(Srkw
+ (1−Sr )Ua
) , (2)
where ks and kw indicate the bulk modulus of the soil skeleton and the water, respectively; n = the soil porosity,Ua = water pore pressure.

Static liquefaction of sandy soil 179
0 5 10 15 20 25 30
Axial strain Eps1 (%)
0
50
100
150
200
250D
evia
tori
c st
ress
q (
kPa)
Dry funnel pluviation, RD= 50%
P'c= 50kPa
P'c= 100 kPa
P'c= 200 kPa
0 5 10 15 20 25 30
Axial strain Eps1 (%)
0
50
100
150
200
250
Dev
iato
r st
ress
q (
kPa)
Wet deposition, RD = 50 %
P'c = 50 kPa
P'c = 100 kPa
P'c = 200 kPa
(a) (b)
Fig. 3 Evolution of the deviatoric stress versus axial strain. a Dry funnel pluviation method; b Wet deposition method
3020100
Axial strain Eps1 (%)
-15
-10
-5
0
5
10
Vo
lum
etri
c st
rain
(%
)
Dry funnel pluviation, RD= 50%
P'c= 50 kPa
P'c = 100kPa
P'c = 200 kPa
3020100
Axial strain Eps1 (%)
-25
-20
-15
-10
-5
0
5
10
Vo
lum
etri
c st
rain
(%
)
Wet deposition, RD= 50 %
P'c = 50 kPa
P'c = 100 kPa
P'c = 200 kPa
(a) (b)
Fig. 4 Evolution of the volumetric strain versus axial strain. a Dry funnel pluviation method; b Wet deposition method
5 Experimental results
5.1 Influence of confining pressure and specimens fabric
5.1.1 Results of drained compression tests
Figure 3 shows the variation of the deviatoric stress. It can be noticed that the resistance to the liquefactionof the soil increases with the increase in the confining pressure; this resistance is more pronounced for thedry funnel pluviation method (Fig. 3a) than for the wet deposition method (Fig. 3b). Concerning the volu-metric strain, Fig. 4 shows a rapid apparition of the dilatancy (resistance to liquefaction) for the specimensreconstituted by the dry funnel pluviation method in contrast to the samples prepared by the wet depositionmethod.

180 N. Della et al.
(b)(a)
0 5 10 15 20 25 30
Axial strain Eps1 (%)
0
50
100
150
200
250
300
Dev
iato
ric
stre
ss q
(kP
a)
Dry funnel pluviation (RD=50%)
P'c= 50 kPaP'c= 100 kpaP'c = 200 kPa
0 50 100 150 200 250
Effective mean stress p' (kPa)
0
50
100
150
200
250
Dev
iato
ric
stre
ss q
(kP
a)
Dry funnel pluviation (RD=50%)
P'c= 50 kPaP'c= 100 kpaP'c = 200 kPa
Fig. 5 Undrained tests for samples prepared by dry funnel pluviation method: a deviatoric stress–strain curve, b stress path
(a) (b)
Axial strain Eps1 (%)
0
20
40
60
80
100
Dev
iato
ric
stre
ss q
(kP
a) Wet deposition (RD=50%)
P'c=50 kPaP'c=100 kPa
P'c=200 kPa
0 5 10 15 20 25 30 0 50 100 150 200 250
Effective mean stress p' (kPa)
0
50
100
150
200
250
Dev
iato
ric
stre
ss q
(kP
a) Wet deposition (RD=50%) P'c= 50 kPaP'c=100 kPaP'c=200 kPa
Fig. 6 Undrained tests for samples prepared by wet deposition method: a deviatoric stress–strain curve, b stress path
5.1.2 Results of undrained compression tests
Effect of confining pressure
The effect of variation of effective confining pressure on the liquefaction resistance of sand is shown in Figs. 5and 6. As the confining pressure increases, the liquefaction resistance of sands increases for both the dry funnelpluviation and wet deposition methods. The results in Fig. 5a, b with an initial density of 50% (medium densestate) for specimens reconstituted by the first method at a confining pressure of 50 kPa show a weaker resis-tance than those shown at a confining pressure of 100 and 200 kPa. The resistance increases at the beginningof the loading up to a value of 25 kPa corresponding to an axial strain of 0.5%, then it decreases up to an axialdistortion strain of 5% to stabilize passing nearly a quasi a steady state (QSS); then, the sample mobilizes aresidual strength increasing the resistance of the sample in the steady state. The stress path diagram (Fig. 5b)presents a reduction in the effective mean stress until a value of 10 kPa, then a migration toward higher valuescharacterizing a dilating state. The same trends are signaled for the samples at confining pressure of 100 and200 kPa, with a peak deviatoric stress of 48 and 90 kPa, respectively.

Static liquefaction of sandy soil 181
0 50 100 150 200 250
Effective mean stress p' (kPa)
0
50
100
150
200
250
Max
imal
dev
iato
ric
stre
ss q
max
(kP
a) RD=50%
Dry funnel pluviation
Wet deposition
0 50 100 150 200 250 300
Effective mean stress p' (kPa)
0
50
100
150
200
Dev
iato
ric
stre
ss a
t p
eack
qp
ic (
kPa) RD=50%
Dry funnel pluviation
Wet deposition
(a) (b)
Fig. 7 Effect of the depositional method on the maximal deviatoric stress (a) and the peak deviatoric stress (b)
Effective stress paths for undrained triaxial compression tests on Chlef sand for samples prepared by wetdeposition method with initial relative densities of 50% are plotted on the p’-q diagrams shown in Fig. 6b.As can be seen, complete static liquefaction occurred in the test with the lowest confining pressure (50 kPa).Static liquefaction was coincidental with the formation of large wrinkles in the membranes surrounding thespecimens.
Figure 6b also shows that when the initial confining pressure is increased beyond 50 kPa, the effective stresspaths exhibit behavior that is characterized by increasing stability or increasing resistance against liquefaction.This is demonstrated by examining the stress–strain curves in Fig. 6a. The initial confining pressures anddensities are shown for each test. The stress–strain curves of the 100 and 200 kPa initial confining pressuretests show that the stress difference does not reach zero as in the test indicating complete liquefaction, butdecreases to a minimum before increasing to levels well above the initial peak or with progressive stabilizationaround an ultimate stationary value very weak. This is the condition of temporary liquefaction. The effect ofincreasing confining pressure is to increase the dilatant tendencies in the soil.
Influence of sample reconstitution method
The effect of the specimens reconstitution method on maximal deviatoric stress is shown in Fig. 7a. It canbe noticed from the results of these figures that the dry funnel pluviation method (DFP) gives more signifi-cant values of the maximal deviator, therefore a much higher resistance to liquefaction, contrary to the wetdeposition method (WD) where some weaker values of the maximal deviator were noted, with progressivestabilization around a very weak or nil ultimate stationary value meaning the liquefaction of the sample.
The same tendencies are noted for the variations of the values in the peak deviatoric stress given in Fig. 7b.As can be seen, the samples conceived by dry funnel pluviation method exhibit a resistance to the monotonicshearing, superior to those made by wet deposition method.
The influence of the sample preparation methods on excess pore pressure is illustrated in Fig. 8. As shownby Fig. 8a for the dry funnel pluviation method, the variation of the pore pressure curves presents two phases:the first shows a very high initial rate of generation, giving account of the strongly contracting characterof the Chlef sand. In the second phase, this rate is going to decrease progressively with the axial strain, mean-ing the dilating character of the material. The developed excess pore pressure in the samples prepared bythe wet deposition method is presented in Fig. 8b. It can be seen that the samples exhibit a very high con-tracting character, with an expansion rate highly elevated from the beginning of the shearing and progressivestabilization toward an ultimate value, to associate to the stabilization of the deviatoric stress.
We notice that our results are in perfect agreement with those given by Benahmed et al. [16] and Ishihara[39] who found that the samples prepared by dry funnel pluviation have a resistance to liquefaction higherthan those prepared by the method of wet deposition. Zlatovic and Ishihara [13] found by changing the method

182 N. Della et al.
(a) (b)
0 5 10 15 20 25 30
Axial strain Eps1 (%)
0
20
40
60
80
100
120
140
160
180E
xces
s p
ore
pre
ssu
re (
kpa)
0 5 10 15 20 25 30
Axial strain Eps1 (%)
0
20
40
60
80
100
120
140
160
180
Exc
ess
po
re p
ress
ure
(kP
a)
Wet deposition (RD=50%)
P'c = 50 kPa
P'c = 100 kPa
P'c = 200 kPa
P'c = 50 kPa
P'c = 100 kPa
P'c = 200 kPa
Dry funnel pluviation (RD=50%)
Fig. 8 Effect of sample reconstitution methods on the excess pore pressure: a dry funnel pluviation method, b wet depositionmethod
of preparation that the resistance of the samples prepared by the method of dry funnel pluviation decreaseswith the increase in the fraction of fines, while the samples prepared by sedimentation present a reductionin resistance until a fines content of Fc = 30%, and then a re-increase. Mulilis et al. [14] found from theirside that the samples prepared by wet damping present a resistance higher than those prepared by dry funnelpluviation.
These differences of behavior noted between the two methods of deposition can be explained by the factthat the molecules of water contained in the structures prepared by wet deposition method constitute somemacropores easily compressible at the time of the shearing of the sample, and at the same time prevent thegrain–grain adhesion. This trend accelerates the instability of the samples that show a very weak resistanceand even provokes the phenomenon of liquefaction of the sand for the weak densities and weak confinementsleading to the collapse of the sample—contrary to the structures of the samples prepared by the method ofdry funnel pluviation, which show a more dilating behavior.
5.2 Effect of the saturation degree
5.2.1 Drained compression tests
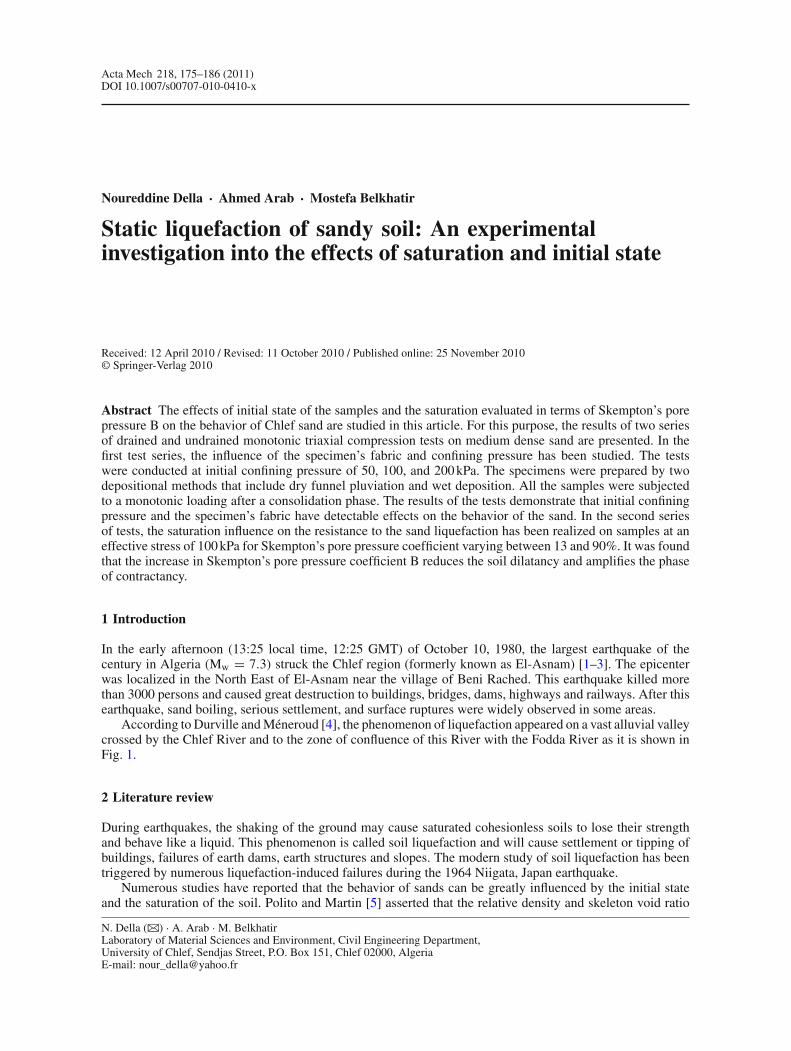
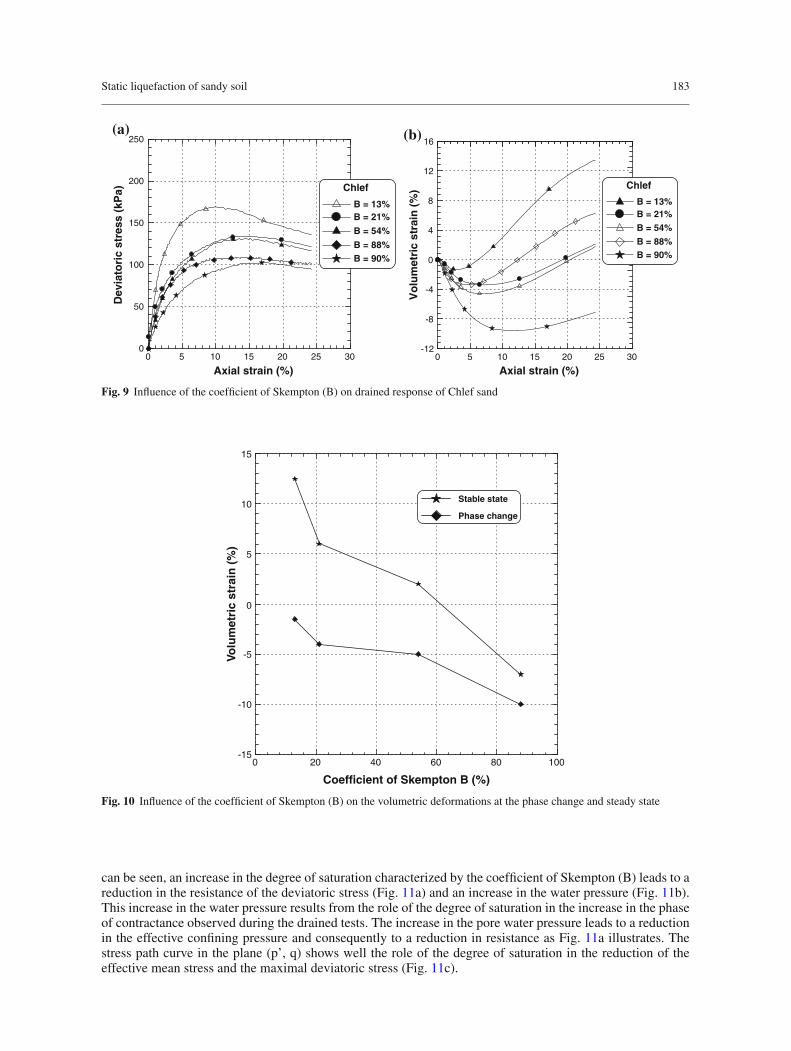
Figure 9 shows the results of the drained compression tests carried out for coefficients of Skempton B rangingbetween 13 and 90%. It is clear from this figure that the coefficient of Skempton (B) significantly affectsthe variation of the deviatoric stress (Fig. 9a) and the volumetric deformation (Fig. 9b). The increase in thecoefficient of Skempton (B) from 13 to 90% induces a reduction in the initial stiffness and resistance of thesoil (maximal deviator). With regard to the volumetric deformation, we note that the increase in B delays theappearance of dilatancy; the sample with a degree of saturation B = 13% dilatancy appears after 3% of axialdeformation, while for the sample with B = 90% we observe an amplification of the phase of contractanceand dilatancy is delayed and appears after 12% of axial deformation. Also shown in Fig. 10 are the curves ofvariation of the volumetric deformations at the phase change (contractance–dilatancy) and at the steady stateversus the coefficient of Skempton (B). We notice that the difference between these curves decreases with theincrease in B, showing the progressive disappearance of the phase of dilatancy and the appearance of only thephase of contractance for the sample with a coefficient of Skempton (B) equal to 90%.
5.2.2 Undrained compression tests
Figure 11 shows the results of the undrained triaxial compression tests performed in this study for variousvalues of the coefficient of Skempton (B) between 32 and 90% with an initial confining pressure of 100 kPa. As
Static liquefaction of sandy soil 183
Axial strain (%)
0
50
100
150
200
250
Dev
iato
ric
stre
ss (
kPa)
0 5 10 15 20 25 30 0 5 10 15 20 25 30
Axial strain (%)
-12
-8
-4
0
4
8
12
16
Vo
lum
etri
c st
rain
(%
) Chlef
B = 13%B = 21%
B = 54%
B = 88% B = 90%
Chlef
B = 13%B = 21%
B = 54%
B = 88% B = 90%
(a) (b)
Fig. 9 Influence of the coefficient of Skempton (B) on drained response of Chlef sand
0 20 40 60 80 100
Coefficient of Skempton B (%)
-15
-10
-5
0
5
10
15
Volu
met
ric
stra
in (
%)
Stable state
Phase change
Fig. 10 Influence of the coefficient of Skempton (B) on the volumetric deformations at the phase change and steady state
can be seen, an increase in the degree of saturation characterized by the coefficient of Skempton (B) leads to areduction in the resistance of the deviatoric stress (Fig. 11a) and an increase in the water pressure (Fig. 11b).This increase in the water pressure results from the role of the degree of saturation in the increase in the phaseof contractance observed during the drained tests. The increase in the pore water pressure leads to a reductionin the effective confining pressure and consequently to a reduction in resistance as Fig. 11a illustrates. Thestress path curve in the plane (p’, q) shows well the role of the degree of saturation in the reduction of theeffective mean stress and the maximal deviatoric stress (Fig. 11c).

184 N. Della et al.
Axial strain (%)
0
100
200
300
400
500D
evia
tori
c st
ress
(kP
a)
0 5 10 15 20 25 30
Axial strain (%)
500
520
540
560
580
600
Po
re p
ress
ure
(kP
a)
(a) (b)
0 100 200 300 400 500
Effective mean stress (kPa)
0
100
200
300
400
500
Dev
iato
ric
stre
ss (
kPa)
Chlef (RD=50%)
B= 32%
B= 54%
B= 90%
(c)
Chlef (RD=50%)
B= 32%
B= 54%
B= 90%
Chlef (RD=50%)
B= 32%
B= 54%
B= 90%
0 5 10 15 20 25 30
Fig. 11 Influence of the coefficient of Skempton (B) on undrained behavior of Chlef sand
5.3 Variation of the residual strength
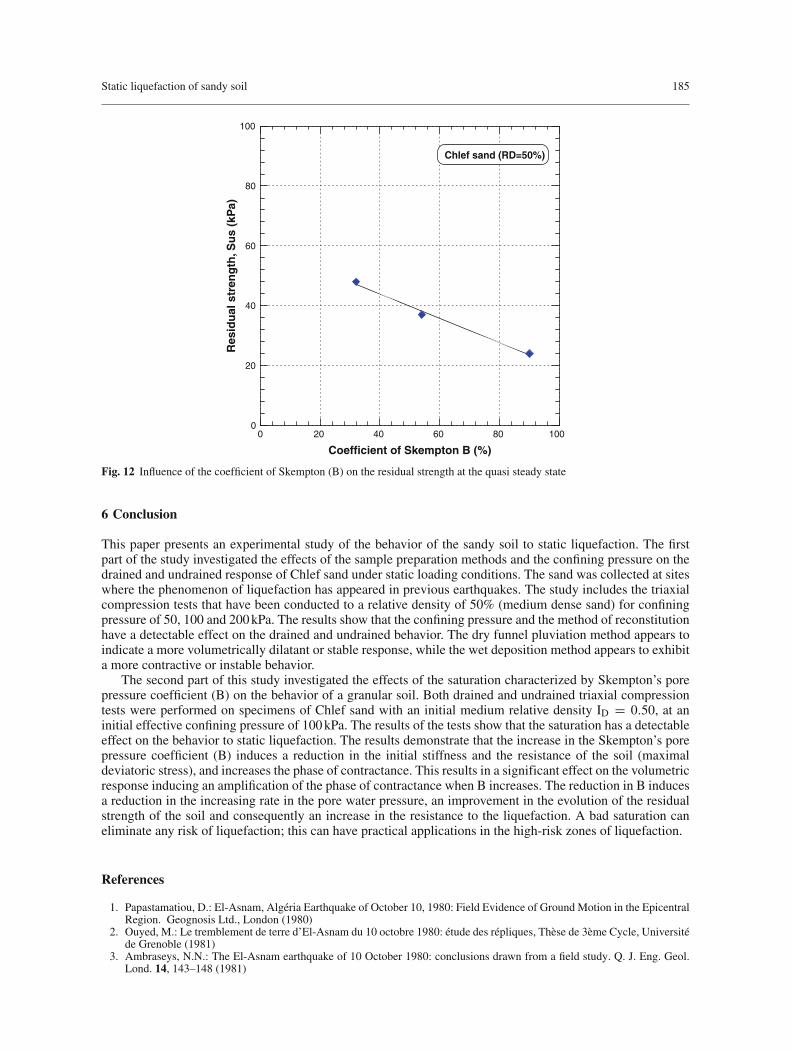
When sands are subjected to an undrained shearing, after the peak of deviatoric stress, the resistance to theshearing falls with an almost constant value on a broad deformation. Conventionally, this resistance to shearingis called residual strength or the shearing force at the quasi steady state (QSS). The residual strength is definedby Ishihara [39] as
Sus = (qs/2) cos φs . (3)
Where qs and φs indicate the deviatoric stress and the mobilized angle of interparticle friction at the quasisteady state.
Figure 12 shows the evolution of the residual strength with the coefficient of Skempton (B). We note thatthe residual strength decreases in a significant and linear way with the increase in B resulting from the role ofsaturation as for the amplification of the contractance of the studied soil.
Static liquefaction of sandy soil 185
0 20 40 60 80 100
Coefficient of Skempton B (%)
0
20
40
60
80
100
Res
idu
al s
tren
gth
, Su
s (k
Pa)
Chlef sand (RD=50%)
Fig. 12 Influence of the coefficient of Skempton (B) on the residual strength at the quasi steady state
6 Conclusion
This paper presents an experimental study of the behavior of the sandy soil to static liquefaction. The firstpart of the study investigated the effects of the sample preparation methods and the confining pressure on thedrained and undrained response of Chlef sand under static loading conditions. The sand was collected at siteswhere the phenomenon of liquefaction has appeared in previous earthquakes. The study includes the triaxialcompression tests that have been conducted to a relative density of 50% (medium dense sand) for confiningpressure of 50, 100 and 200 kPa. The results show that the confining pressure and the method of reconstitutionhave a detectable effect on the drained and undrained behavior. The dry funnel pluviation method appears toindicate a more volumetrically dilatant or stable response, while the wet deposition method appears to exhibita more contractive or instable behavior.
The second part of this study investigated the effects of the saturation characterized by Skempton’s porepressure coefficient (B) on the behavior of a granular soil. Both drained and undrained triaxial compressiontests were performed on specimens of Chlef sand with an initial medium relative density ID = 0.50, at aninitial effective confining pressure of 100 kPa. The results of the tests show that the saturation has a detectableeffect on the behavior to static liquefaction. The results demonstrate that the increase in the Skempton’s porepressure coefficient (B) induces a reduction in the initial stiffness and the resistance of the soil (maximaldeviatoric stress), and increases the phase of contractance. This results in a significant effect on the volumetricresponse inducing an amplification of the phase of contractance when B increases. The reduction in B inducesa reduction in the increasing rate in the pore water pressure, an improvement in the evolution of the residualstrength of the soil and consequently an increase in the resistance to the liquefaction. A bad saturation caneliminate any risk of liquefaction; this can have practical applications in the high-risk zones of liquefaction.
References
1. Papastamatiou, D.: El-Asnam, Algéria Earthquake of October 10, 1980: Field Evidence of Ground Motion in the EpicentralRegion. Geognosis Ltd., London (1980)
2. Ouyed, M.: Le tremblement de terre d’El-Asnam du 10 octobre 1980: étude des répliques, Thèse de 3ème Cycle, Universitéde Grenoble (1981)
3. Ambraseys, N.N.: The El-Asnam earthquake of 10 October 1980: conclusions drawn from a field study. Q. J. Eng. Geol.Lond. 14, 143–148 (1981)

186 N. Della et al.
4. Durville, J.L., Méneroud, J.P.: Phénomènes géomorphologiques induits par le séisme d’El-Asnam, Algérie: Bull. LiaisonLabo. P. et Ch., No. 120, juillet-août, pp. 13–23 (1982)
5. Polito, C.P., Martin, J.R. II.: A reconciliation of the effects of non-plastic fines on the liquefaction resistance of sands reportedin the literature. Earthq. Spectr. 19(3), 635–651 (2003)
6. Yamamuro, J.A., Lade, P.V.: Static liquefaction of very loose sands. Can. Geotech. J. 34(6), 905–917 (1997)7. Yamamuro, J.A., Lade, P.V.: Steady state concepts and static liquefaction of silty sands. J. Geotech. Geoenv. Eng.
ASCE 124(9), 868–877 (1998)8. Yamamuro, J.A., Covert, K.M.: Monotonic and cyclic liquefaction of very loose sands with high silt content. J. Geotech.
Geoenviron. Eng. ASCE 127(4), 314–324 (2001)9. Kramer, S.L., Seed, H.B.: Initiation of soil liquefaction under static loading conditions. J. Geotech. Eng. 114(4), 412–
430 (1988)10. Zlatovic, S., Ishihara, K.: Normalized behavior of very loose non-plastic soils: effects of fabric. Soils Found. 37(4), 47–
56 (1997)11. Mulilis, J.P., Seed, H.B., Chan, C.K., Mitchell, J.K., Arulanandan, K.: Effects of sample preparation on sand liquefaction.
J. Geotech. Eng. Div. ASCE 103(GT2), 91–108 (1977)12. Yamamuro, J.A., Wood, F.M.: Effect of depositional method on the undained behavior and microstructure of sand with
silt. Soil Dyn. Earthq. Eng. 24, 751–760 (2004)13. Benahmed, N., Canou, J., Dupla, J.C.: Structure initiale et propriétés de liquéfaction statique d’un sable. Comptes Rendus
Mécanique 332, 887–894 (2004)14. Canou, J.: Contribution l’étude et à l’évaluation des propriétés de liquéfaction d’un sable, Thèse de Doctorat de l’Ecole
Nationale Des Ponts et Chaussées, Paris (1989)15. Vaid, Y.P., Sivathayalan, S., Stedman, D.: Influence of specimen reconstituting method on the undrained response of
sand. Geotech. Test. J. 22(3), 187–195 (1999)16. Yamamuro, J.A., Wood, F.M., Lade, P.V.: Effect of depositional method on the microstructure of silty sand. Can. Geotech.
J. 45(11), 1538–1555 (2008)17. Wood, F.M., Yamamuro, J.A., Lade, P.V.: Effect of depositional method on the undrained response of silty sand. Can.
Geotech. J. 45(11), 1525–1537 (2008)18. Della, N., Arab, A., Belkhatir, M., Missoum, H.: Identification of the behavior of the Chlef sand to static liquefaction. Comptes
Rendus Mécanique 337, 282–290 (2009)19. Martin, G.R., Finn, W.D.L., Seed, H.D.: Effects of system compliance on liquefaction tests. J. Geotech. Eng. Div.
ASCE 104(GT4), 463–479 (1978)20. Mulilis, J.P., Townsend, F.C., Horz, R.C.: Triaxial Testing Techniques and Sand Liquefaction, ASTM STP 654, Dynamic
Geotechnical Testing, pp. 265–279 (1978)21. Ishihara, K., Tsuchiya, H., Huang, Y., Kamada, K.: Recent studies on liquefaction resistance of sand effect of saturation. In:
Proceedings of the 4th Conference on Recent Advances in Geotechnical Earthquake Engineering, Keynote Lecture (2001)22. Nakazawa, H., Ishihara, K., Tsukamoto, Y., Kamata, T.: Case studies on evaluation of liquefaction resistance of imperfectly
saturated soil deposits. In: Proc., Conf., Cyclic Behavior of Soils and Liquefaction Phenomena, Germany (2004)23. Mathiroban, S., Grozic, J.: A model to predict the undrained behaviour of loose gassy sand. In: Proceeding 57th Geotech.
Conf., Session 6G, pp. 16–22 (2004)24. Atigh, E., Byrne, P.M.: Liquefaction flow of submarine slopes under partially undrained conditions: an effective stress
approach. Can. Geotech. J. 41, 154–165 (2004)25. Pietruszczak, S., Pande, G., Oulapour, M.A.: Hypothesis for mitigation of risk of liquefaction. Geotechnique 9, 833–
838 (2003)26. Yang, J., Sato, T.: Analytical study of saturation effects on seismic vertical amplification of a soil layer. Geotechnique 2, 161–
165 (2001)27. Yoshimi, Y., Tanaka, K., Tokimatsu, K.: Liquefaction resistance of partially saturated sand. Soils Found. 3, 157–162 (1989)28. Ishihara, K., Tsukamoto, Y., Kamada, K.: Undrained behavior of near-saturated sand in cyclic and monotonic loading. In:
Proc. Conf., Cyclic Behavior of Soils and Liquefaction Phenomena, pp. 27–39 (2004)29. Yang, J.: Liquefaction resistance of sand in relation to P-wave velocity. Geotechnique 4, 295–298 (2002)30. Yang, J., Savidis, S., Roemer, M.: Evaluating liquefaction strength of partially saturated sand. J. Geotech. Geoenviron. Eng.
ASCE 9, 975–979 (2004)31. Bouferra, R., Benseddiq, N., Shahrour, I.: Saturation and preloading effects on the cyclic behaviour of sand. Int. J. Geomech.
ASCE 7, 396–401 (2007)32. Tatsuoka, F., Molenkamp, F., Torii, T., Hino, T.: Behavior of lubrication layers of platens in element tests. Soils Found. 1, 113–
128 (1984)33. Sherif, A.M., Tsuchiya, C., Isibashi, I.: Saturation effects on initial soil liquefaction. J. Geotech. Eng. Div. 103(8), 914–
917 (1977)34. Chaney, R.C.: Saturation effects on the cyclic strength of sand. In: Proc., Earthquake Engineering and Soil Dynamics, vol.
1, ASCE, New York, pp. 342–359 (1978)35. Giroud, J.P., Cordary, D.: Prevision du tassement initial et du tassement différé des fondations superficielles, Annales de
l’Institut Technique du Bâtiment et des Travaux Publics, 135, SP 127, Janvier, pp. 105–135 (1976)36. Bishop, A.W., Wesley, L.D.: A hydraulic triaxial apparatus for controlled stress path testing. Geotechnique 4, 657–670 (1975)37. Lade, P.V., Duncan, J.M.: Cubical triaxial tests on cohesionless soil. J. Soil Mech. Found. Div. ASCE 99(SM10), 793–
812 (1973)38. Lade, P.V., Hermandez, S.B.: Membrane penetration effects in undrained tests. J. Geotech. Eng. Div. ASCE 103(GT2), 109–
125 (1977)39. Ishihara, K.: Liquefaction and flow failure during earthquakes. Geotechnique 43(3), 351–415 (1993)