static-curis.ku.dk · the relative importance of the bacterial pathway and soil ... represented at...
TRANSCRIPT
u n i ve r s i t y o f co pe n h ag e n
Københavns Universitet
The relative importance of the bacterial pathway and soil inorganic nitrogen increaseacross an extreme wood-ash application gradientVestergård, Mette; Bang-Andreasen, Toke; Buss, Sebastian Micki; Cruz Paredes, Carla;Bentzon-Tilia, Sara; Ekelund, Flemming; Kjøller, Rasmus; Mortensen, Louise Hindborg;Rønn, ReginPublished in:GCB Bioenergy
DOI:10.1111/gcbb.12494
Publication date:2018
Document VersionPublisher's PDF, also known as Version of record
Citation for published version (APA):Vestergård, M., Bang-Andreasen, T., Buss, S. M., Cruz Paredes, C., Bentzon-Tilia, S., Ekelund, F., ... Rønn, R.(2018). The relative importance of the bacterial pathway and soil inorganic nitrogen increase across an extremewood-ash application gradient. GCB Bioenergy, 10(5), 320-334. https://doi.org/10.1111/gcbb.12494
Download date: 26. jul.. 2019
The relative importance of the bacterial pathway and soilinorganic nitrogen increase across an extreme wood-ashapplication gradientMETTE VESTERG�ARD 1 , TOKE BANG -ANDREASEN 1 , 2 , S EBAST IAN MICK I BUSS 1 ,
CARLA CRUZ -PAREDES 1 , SARA BENTZON-T I L IA 1 , F LEMMING EKELUND1 ,
RASMUS K JØLLER 1 , LOU I SE H INDBORG MORTENSEN1 and REGIN RØNN1, 3 , 4
1Terrestrial Ecology Section, Department of Biology, University of Copenhagen, Universitetsparken 15, DK-2100 Copenhagen Ø,
Denmark, 2Environmental Microbiology and Biotechnology, Department of Environmental Science, Aarhus University,
Frederiksborgvej 399, DK-4000 Roskilde, Denmark, 3Institute of Urban Environment, Chinese Academy of Sciences, 1799 Jimei
Road Xiamen 361021, China, 4Arctic Station, University of Copenhagen, P.O. Box 504, 3953, Qeqertarsuaq, Greenland
Abstract
Ash from combustion of biofuels, for example wood chips, is often deposited as waste, but due to its high con-
tent of essential plant nutrients and alkalinity, it has been proposed to recycle ash as a fertilizer and liming agent
in biofuel production forest. However, current legislation sets rather strict limitations for wood-ash application
in biofuel production systems. The soil microfood web, that is microorganisms and their microfaunal grazers,protozoa and nematodes, is pivotal for essential ecosystem processes such as decomposition and plant nutrient
release. Therefore, a thorough assessment of the impacts on microfood web structure and functioning must pre-
cede actions towards raising the currently allowed application rates. In a Danish Norway spruce plantation, we
evaluate the impact of wood ash applied at dosages from 0 to the extreme case of 90 t ash ha�1 on the micro-
food web, the bacterial community structure, soil content of inorganic nitrogen, organic matter, dissolved
organic carbon and nitrogen. Using structural equation modelling (SEM), we disentangled the direct effect of
the disturbance imposed by ash per se, the associated pH increase and changes in prey abundance on individual
organism groups in the microfood web. The SEM showed that the pH rise was the main driver of increasingabundances of culturable heterotrophic bacteria with increasing ash doses, and via trophical transfer, this also
manifested as higher abundances of bacterial grazers. Fungal-feeding nematodes were unaffected by ash,
whereas carnivorous/omnivorous nematodes decreased due to the direct effect of ash. Increasing ash doses
enhanced the difference between bacterial communities of control plots and ash-amended plots. The ash-
induced stimulation of culturable heterotrophic bacteria and bacterial grazers increased inorganic nitrogen avail-
ability at ash doses of 9 t ha�1 and above. Hence, raised limits for ash application may potentially benefit tree
growth via enhanced N mineralization activity of the soil food web.
Keywords: bacterial community structure, high-resolution melt curve (HRM) analysis, inorganic nitrogen, nematodes, Norway
spruce, protozoa, structural equation model (SEM)
Received 15 June 2017; revised version received 28 November 2017 and accepted 28 November 2017
Introduction
Wood ash – waste product or a valuable fertilizer?
Renewable energy sources such as wood chips play an
increasing role in the global energy production. For
instance, the European Council has set a mandatory tar-
get of 20% renewable energy of the total energy con-
sumption by 2020 (COM, 2006). Long-term sustainable
use of wood biomass for energy production calls for
optimized forest management, where the nutrient
export at harvest is balanced by similar nutrient inputs.
As wood ash contains high amounts of plant nutri-
ents, an obvious strategy is to apply the wood ash as a
biofertilizer in biofuel production plantations (Jacobson
et al., 2014). The major components of wood ash are cal-
cium, potassium, magnesium and phosphorus, while it
contains virtually no nitrogen (N) (Demeyer et al., 2001).
Therefore, the efficiency of ash as a fertilizer depends
on the existing N in the system and/or the rate of N
deposition. In spite of the negligible N content in wood
ash, the increased pH can indirectly increase microbial
activity and thus N mineralization and availabilityCorrespondence: Mette Vesterg�ard; tel. +45 51827047,
fax +45 35322128, e-mail [email protected]
© 2017 The Authors. Global Change Biology Bioenergy Published by John Wiley & Sons Ltd.
This is an open access article under the terms of the Creative Commons Attribution License,
which permits use, distribution and reproduction in any medium, provided the original work is properly cited.320
GCB Bioenergy (2018) 10, 320–334, doi: 10.1111/gcbb.12494
(Genenger et al., 2003; J€aggi et al., 2004). Positive effects
of wood-ash application on tree production have been
demonstrated at sites, which receive N deposition or
are rich in organic matter, like peat soils, whereas ash
does not enhance tree production on, for example, min-
eral soils where N is the limiting nutrient (Huotari et al.;
2015; Karltun et al., 2008). In N-limited systems, the
combined application of ash and N may be a solution to
the unbalanced nutrient content in wood ash (Saarsalmi
et al., 2006, 2012).
However, the extremely high pH of wood ash as well
as the potentially high heavy metal content may chal-
lenge the sustainability of wood-ash application as fer-
tilizers. The application of ash typically raises forest
floor pH 0.5–3 units depending on the amount of ash
applied (Huotari et al., 2015). Wood ash consists of a
range of trace elements that originate from the inciner-
ated wood such as arsenic, silver, molybdenum, mer-
cury, nickel, vanadium, zinc and cadmium (Cd) (Eti�egni
& Campbell, 1991; Demeyer et al., 2001; Karltun et al.,
2008). Some of these are micronutrients; some are non-
essential heavy metals (Huotari et al., 2015). The biggest
concern is the heavy metal content, particularly Cd
(Saarsalmi et al., 2001). The Cd concentration in wood
ash typically varies between 1 and 20 mg kg�1 (Korpi-
lahti et al., 1998). Presently, the Cd content defines the
maximum limit for wood-ash application to 3 t ha�1
three times during a 75 years period according to Dan-
ish legislation (DEA, 2008), and similar rules are fol-
lowed in, for example, Sweden and Finland. A
substantial proportion of ash produced during biofuel
combustion, including valuable plant nutrients, is there-
fore currently deposited as waste at a considerable cost
(Ingerslev et al., 2011). Enhanced recirculation of wood
ash as fertilizers in biofuel production would therefore
benefit the economy of biofuel-based energy production
through reduced expenses to fertilizers from alternative
sources and through reduced expenses to ash deposi-
tion. Increasing doses of 6–9 t ash ha�1 would be feasi-
ble and realistic. However, thorough evaluation of
potential negative side effects of enhanced wood-ash
recirculation on the environment must be conducted
before actions are taken towards changing the currently
allowed application rates.
The high alkalinity of ash often reduces moss and
lichen coverage resulting in the replacement of the origi-
nal moss species with other colonizing species. Likewise,
herbs and grasses often increase at the expense of shrubs
(Huotari et al., 2015). Generally, ash application does not
change plant Cd concentrations (Huotari et al., 2015) or
Cd concentrations in soil or aboveground invertebrates
(Lodenius et al., 2009), although earthworms may accu-
mulate Cd to nontoxic concentrations (M. Vesterg�ard,
R. Rønn and M.F. Hovmand, unpublished; Lodenius,
2003). Studies on the Cd effect on soil invertebrates after
ash application are scarce, but no toxic effects have been
observed (Lundkvist, 1998; Lodenius et al., 2009).
Thorough assessments of wood-ash application
impacts on the forest ecosystem must also include
detailed evaluation of effects on microorganisms and
higher trophic levels of the soil food web as well as key
microbial functioning.
The importance of the soil microfood web fordecomposition and nutrient mineralization
The soil microfood web, including microorganisms and
their microfaunal grazers, protozoa and nematodes
(Dam et al., 2017), plays an extremely important role for
key ecosystem processes, for example, decomposition
and mineralization of nitrogen and other plant nutrients
and hence plant growth (Rønn et al., 2012). Protozoa
and nematodes are the primary microbial grazers in ter-
restrial ecosystems. They regulate the size and function-
ing of fungal and bacterial populations (Ingham et al.,
1985; Rønn et al., 2012) in the soil, and nematode and
protozoan grazing enhance microbial activity and nutri-
ent mineralization (Rønn et al., 2012). Nematodes are
represented at several trophic levels of the soil decom-
poser food web; that is bacteriovorous, fungivorous,
omnivorous and carnivorous taxa (Yeates et al., 1993),
and the abundance of these individual feeding groups
often mirrors growth responses of their respective food
sources (Ferris, 2010; Christensen et al., 2012). Transfer
of energy and elements in the soil food web is thought
to be compartmentalized into two separate pathways
that are either based on bacterial or fungal production
(Moore & Hunt, 1988; Moore et al., 1996). Especially
lower order consumers in the soil food web such as pro-
tozoa and nematodes reflect the carbon flow through
the bacterial or fungal channel (Rooney et al., 2006).
Ash-induced effects on the soil microfood web
The pH increase caused by ash can have profound
effects on microbial composition and productivity. In
general, bacterial growth peaks at higher pH than fun-
gal growth (Rousk et al., 2010a; Rousk & B�a�ath, 2011;
Cruz-Paredes et al., 2017), and often increasing pH ben-
efits bacterial abundance and productivity, whereas fun-
gal productivity usually declines or remains unaffected
(Majdi et al., 2008; Rousk et al., 2009, 2011). Shifts
towards bacterial relative to fungal decomposition activ-
ity are likely to enhance mineralization rates and dimin-
ish soil C storage capacity (Waring et al., 2013; Malik
et al., 2016). In general, soil pH is a principal driver of
soil bacterial community composition (Fierer & Jackson,
2006; Rousk et al., 2010b); hence, also the composition of
© 2017 The Authors. Global Change Biology Bioenergy Published by John Wiley & Sons Ltd., 10, 320–334
MICROFOOD WEB RESPONSES TO WOOD ASH 321
bacterial communities may respond to wood-ash appli-
cation (Perki€om€aki & Fritze, 2002; Noyce et al., 2016;
Bang-Andreasen et al., 2017; Cruz-Paredes et al., 2017).
We know much less about the effects of increased pH
on organisms at higher trophic levels of the soil food
web. Further, there is a striking paucity of data on the
effects of ash application and pH increase on protozoa,
and results on the effects of wood-ash and lime applica-
tion on nematodes in acidic forest soils are somewhat
contradictory. Ash and lime application enhanced pop-
ulations of bacterial-feeding nematodes in Finnish pine
forest soils (Hyv€onen & Huhta, 1989; Nieminen, 2009),
whereas ash had a transient negative effect on fungal-
feeding nematodes, but no effect on bacterial-feeding
nematodes in a laboratory experiment with similar soil
(Liiri et al., 2007). Further, defaunated soil that was bur-
ied in acidic pine forest plots attained higher abun-
dances of microbial-feeding nematodes, but lower
abundances of omnivorous nematodes after colonization
from the surrounding forest soil that had been treated
with wood ash than from unamended soil (Liiri et al.,
2002). The variable responses may reflect that nematode
responses were assessed under variable experimental
conditions and may also reflect variable responses of
prey organisms or co-occurring microbivores under the
different experimental conditions.
Soil organisms will not only experience pH changes,
but also the general system disturbances imposed by
ash application, for example reduced moss coverage
and nutrient and heavy metal addition (Huotari et al.,
2015). Especially long-lived nematode taxa with long
life cycles and slow reproduction, most of which are
higher-order consumers such as omnivores and preda-
tors, are sensitive to environmental disturbance (Bon-
gers, 1990; de Goede & Dekker, 1993).
Testing ash dose effects in a spruce forest
Our aim is to assess the effects of ash application across
a wide range of doses on the bacterial community struc-
ture and the microfood web that is based on microbial
production in a spruce plantation, which represents a
system where enhanced application of wood ash as fer-
tilizer is most relevant. Further, we will evaluate if ash-
driven changes of the bacterial community structure
and the microfood web have implications for the inor-
ganic nitrogen availability. We also relate responses of
the organisms and inorganic nitrogen availability to ash
effects on soil organic matter content and labile organic
substrates, that is dissolved organic carbon and nitro-
gen. To our knowledge, no studies report the concerted
response of the major groups of the soil microfood web;
that is microorganisms, protozoa and nematode trophic
groups.
Effects of the application of potentially environmen-
tally harmful products are best evaluated in dose–re-sponse trials that also include very high or extreme
treatment doses. Extreme treatments increase the likeli-
hood of detecting potential negative effects of the appli-
cation of a given substance or product; vice versa, lack
of effects even at extreme doses allows us to conclude
with confidence that a product does not elicit harmful
effects on investigated variables. Such trials are rarely
conducted at field scale, but here we designed a field
experiment with a gradient of ash application doses
including currently allowed and extremely high doses;
that is, doses that far exceed the doses that would realis-
tically be applied in forestry.
Within recent years, the use of structural equation mod-
elling (SEM) has remarkably advanced our causal under-
standing of the shifts in belowground food webs and
ecological processes associated with environmental
changes (Eisenhauer et al., 2013; Vesterg�ard et al., 2015).
With SEM, we will analyse whether treatment effects on
abundances of culturable heterotrophic bacteria, protozoa
and nematode feeding groups can primarily be ascribed
to the ash application per se, to the direct effect of the
associated pH raise or to ash- or pH-induced changes in
the abundance of prey organisms.
For SEM, the analyst constructs a hypothesized net-
work of variables including hypothesized causal rela-
tionships between variables. SEM is a tool that
statistically evaluates the probability of the hypothesized
network including the implied causal relationships
between variables (McCoach et al., 2007). Therefore, sig-
nificant correlation between variables does not as such
prove causality (Kazantis et al., 2001). One limitation for
the inference of causality between variables is that it is
rarely, if ever, possible to identify and incorporate all
relevant causes for a given variable (McCoach et al.,
2007), and causality inference should always be inter-
preted with some caution.
We hypothesized that the liming effect of wood ash
was the principal driver of soil organism responses to
ash application, and that the pH raise would enhance
the abundance of culturable heterotrophic bacteria with
cascading positive effects on bacterial consumers and
possibly carnivorous/omnivorous nematodes. In con-
trast, we expected no or a modest negative response of
the fungal-based compartments of the soil food web to
the pH increase. Alternatively, we hypothesized that
differential sensitivity to environmental disturbances at
higher trophic levels could decouple the responses of
microbial grazers or higher-order consumers of the
microfood web from the anticipated bacterial productiv-
ity increase at wood-ash application. Further, we
hypothesized that the bacterial community composition
would respond to the pH increase in a dose-dependent
© 2017 The Authors. Global Change Biology Bioenergy Published by John Wiley & Sons Ltd., 10, 320–334
322 M. VESTERG�ARD et al.
manner, and we expected enhanced soil inorganic nitro-
gen content with enhanced microbial activity at increas-
ing ash application doses.
Materials and methods
Field experiment and sampling
Our field site is a Norway spruce (Picea abies (L.) Karst.) planta-
tion located in Mid Jutland, Denmark (N 56°16.6330, E
9°05.2000), 51 m above sea level. The climate is temperate with
a mean annual temperature of 8.4 °C and a mean annual pre-
cipitation of 850 mm. The plantation is a second-generation
plantation established in 1957 on former heathland with a well-
developed podzolization formed on a well-drained, sandy gla-
cial till. The ground vegetation is heavily dominated by mosses
with very limited contribution of vascular plants, mainly
Deschampsia flexuosa and Vaccinium vitis-idaea.
The experiment was laid out as a randomized block design
with six levels of wood-ash application in five replicate rows,
that is in total 30 2 9 2 m plots, within a 20 9 15 m area. In
April 2014, we applied the equivalent of 0, 3, 9, 15, 30 or
90 t wood ash ha�1 to the individual plots, where 3 t ha�1 rep-
resents the currently maximum allowed dose. The wood ash
was a mixture of bottom- and fly ash originating from the burn-
ing of spruce bark chips at the nearby Brande heating plant. The
ash had not been exposed to any stabilization treatment. Details
of wood-ash contents and alkalinity are shown in Table 1.
In April 2015, we sampled all plots. In each 2 9 2 m plot,
three samples randomly positioned at least 30 cm from the
edge of the plot were taken with a 5 cm auger to a depth of
5 cm including the moss (when present), O horizon and the
top of the A horizon (3 9 98 cm�3 per plot). The samples were
transported to the laboratory under cooled conditions and kept
at 4 °C until processed the following day.
Sample processing and determination ofphysicochemical parameters
The three subsamples from each plot were pooled into one
composite sample per plot.
We sieved (5 mm) and homogenized the individual compos-
ite samples. All variables were measured on fractions of the
homogenized composite samples.
pH was measured on 10 g (fw) soil suspended in 25 mL dis-
tilled H2O on a Phm 240 pH/ION meter. For soil water deter-
mination, we measured the weight loss of 5 g (fw) soil after
24 h drying at 110°C, and subsequently we determined soil
organic matter (SOM) content as mass loss on ignition at 550°C
for 6 h.
For dissolved organic carbon (DOC), dissolved organic nitro-
gen (DON), ammonium (NH4+) and nitrate (NO3
�) determina-
tion, we extracted 5 g (fw) soil in 50 mL distilled H2O for
60 min on a shaker at 200 rpm. The extracts were filtered and
immediately frozen at �18°C. We measured the DOC content
in the filtrates on a Shimadzu TOC5000A analyser (Shimadzu,
Kyoto, Japan). DON contents in digested filtrates and NH4+
and NO3� contents in the filtrates were measured with a flow
injection analyser (5000 FIASTAR, H€ogan€as, Sweden).
Enumeration of soil organisms
For the enumeration of culturable heterotrophic bacteria and
protozoa, we suspended 3 g of each composite sample (fw) in
100 mL sterile distilled H2O and blended for 1 min in a Waring
laboratory blender at full speed at 20 °C. We determined the
density of culturable heterotrophic bacteria as colony forming
units (CFUs) after plate spreading. Duplicates of 0.1 mL of
10�3, 10�4 and 10�5 dilutions of the soil suspension were
spread on tryptic soy broth (TSB) (0.3 g L�1) (Becton, Dickin-
son and Company, Sparks MD) agar plates, and the number of
CFUs was counted after 14 days incubation at 12 °C. Like any
other method for bacterial quantification (Blagodatskaya &
Kuzyakov, 2013), this culture-dependent method is biased; gen-
erally, it underestimates the total cell number by approximately
a factor of 10–100 (Vesterg�ard et al., 2011). Nevertheless, it
gives a cost-efficient and reproducible estimate of between-
sample variation in bacterial abundances that correlates with
total cell counts (Rønn et al., 2002) and most likely represents
the most metabolically active fraction of the bacterial commu-
nity (Olsen & Bakken, 1987).
Numbers of protozoa (amoebae/flagellates and ciliates) were
estimated with the most probable number (MPN) method. For
amoebae/flagellates, eight replicated threefold dilution series
of each soil suspension were prepared in 96 wells microtitre
plates with 0.3 g L�1 TSB in amoeba saline (Page, 1988) as
medium. After 7 and 21 days of incubation at 12 °C, we
inspected the wells for the presence of protozoa (amoebae/flag-
ellates) using an inverted microscope at 200-4009 magnifica-
tion (Rønn et al., 1995). For ciliates, eight replicates of 1 mL of
10�0, 10�1 and 10�2 dilutions were incubated with a sterile bar-
ley grain in wells of 12 wells titre plates. After 7 days of incu-
bation at 12 °C, we inspected the wells for the presence of
ciliates to determine the MPN of ciliates (Ekelund et al., 2002).
We extracted nematodes from 30 g of soil from each com-
posite sample by a combination of the Baermann pan and the
Whitehead tray (Whitehead & Hemming, 1965) extraction
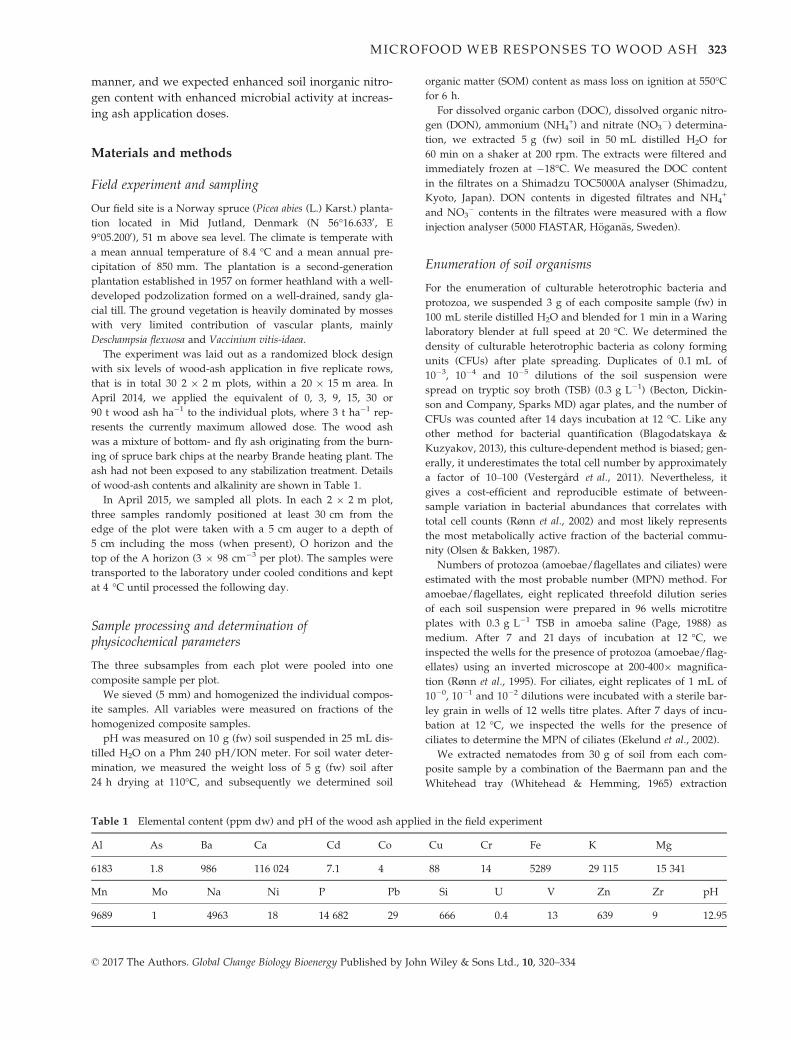
Table 1 Elemental content (ppm dw) and pH of the wood ash applied in the field experiment
Al As Ba Ca Cd Co Cu Cr Fe K Mg
6183 1.8 986 116 024 7.1 4 88 14 5289 29 115 15 341
Mn Mo Na Ni P Pb Si U V Zn Zr pH
9689 1 4963 18 14 682 29 666 0.4 13 639 9 12.95
© 2017 The Authors. Global Change Biology Bioenergy Published by John Wiley & Sons Ltd., 10, 320–334
MICROFOOD WEB RESPONSES TO WOOD ASH 323

methods. Samples were extracted for 72 h, and individuals of
nematode trophic groups were counted while live based on
morphological characteristics of mainly the buccal cavity and
oesophagus (Yeates et al., 1993; Dam et al., 2017) using an
inverted microscope at 2009 to 4009 magnification. We focus
on abundances of nematodes that feed on bacteria and fungi or
are carnivores or omnivores, as the quantitative responses of
these trophic groups often reflect growth responses of their
respective food sources (Rooney et al., 2006; Ferris, 2010; Chris-
tensen et al., 2012).
Fingerprinting of the bacterial community structure
DNA was extracted from 3 g of frozen soil with the PowerMax
Soil� kit (MoBIO, Carlsbad, USA). Differences in bacterial com-
munity structure between samples were examined using real-
time PCR combined with high-resolution melt curve analysis of
the amplified DNA, as described by (Hjelmsø et al., 2014).
PCRs were run on a real-time Bio-Rad T100 Thermal Cycler in
technical triplicates using a master mix consisting of 4 lL HOT
FIREPol� EvaGreen� qPCR Supermix (Solis Biodyne, Riia,
Estonia), 2 lL of bovine serum albumin (BSA) (20 mg mL�1;
BIORON, Ludwigshafen, Germany), 0.4 lL of 10 lM forward
and reverse primers (354f: 50-CCTAYGGGRBGCASCAG-30 and806r: 50-GGACTACNNGGGTATCTAAT-30) (Hansen et al.,
2012), 1 lL DNA template and 12.2 lL sterile water to a final
volume of 20 lL. Sterile water and genomic DNA from Escher-
ichia coli K-12 (Blattner et al., 1997) were used as negative and
positive controls, respectively. Thermal conditions were an ini-
tial denaturation at 95 °C for 12 m followed by 35 amplification
cycles of 95 °C for 15 s, 56 °C for 30 s, 72 °C for 30 s and end-
ing with 72 °C for 3 m. High-resolution melt curves were gen-
erated by melting the resulting 16S rRNA gene amplicons
using 0.1 °C increments from a starting temperature of 72 °C
and ending at 95 °C with fluorescence measurements at every
temperature increment.
Melting curves were normalized to relative fluorescence
units (RFU) in the melt region of the 16S rRNA gene amplicons
(83.8–90.9 °C) using the Precision Melt AnalysisTM Software
(Bio-Rad Laboratories, Richmond, CA, USA). Based on the nor-
malized curves, we calculated the difference in RFU for each
temperature step. These values represent the amount of DNA
melting at a given temperature, and the data provide a finger-
print of the bacterial community (Hjelmsø et al., 2014).
Data analysis
Our aim was to quantify the treatment impacts in the top five
cm of the forest floor, where the organic matter content and
hence soil density vary considerably. We therefore present all
variables on a volume basis, that is cm�3, to accommodate
comparison on a comparable basis. We analysed the relation-
ship between the independent variables, that is ash application
dose, and the response variables, that is soil pH, abundance of
culturable heterotrophic bacteria, protozoa, nematode trophic
groups, SOM, DOC, DON, NH4+–N and NO3
�–N with linear
and nonlinear regression models in SIGMAPLOT version 13.0.
Where necessary, data were log-transformed to obtain normality
and homoscedasticity. For variables that responded significantly
to ash application, we subsequently tested the significance of
pairwise differences between ash doses with Tukey’s test.
We used SEM to analyse the relationships between ash
application level, pH and abundances of organisms at different
trophic positions in the soil microfood web to examine whether
treatment effects on abundances could primarily be ascribed to
the ash application per se, to the associated pH raise or to ash-
or pH-induced changes in the abundance of prey organisms.
We arranged the measured variables in a causal network
according to our prior knowledge on soil-ecological cause–ef-
fect relationships (Fig. 6). Some of the variables were log-trans-
formed to achieve approximate normal distribution and linear
relationships between variables, and some of the variables were
rescaled to achieve approximately equal variances for all vari-
ables. We fitted the variables to the SEM with the software
package LAVAAN (Rosseel, 2012) in R (R Core Team, 2014).
We analysed overall differences in bacterial community struc-
ture with a principal component analysis (PCA), where we trea-
ted the difference in RFU for each temperature step of the HRM
analysis as proxy operational taxonomic units (OTUs). We ran
the PCA in PC-ORD ver. 5 (McCune & Mefford, 1999).
Results
Physicochemical parameters
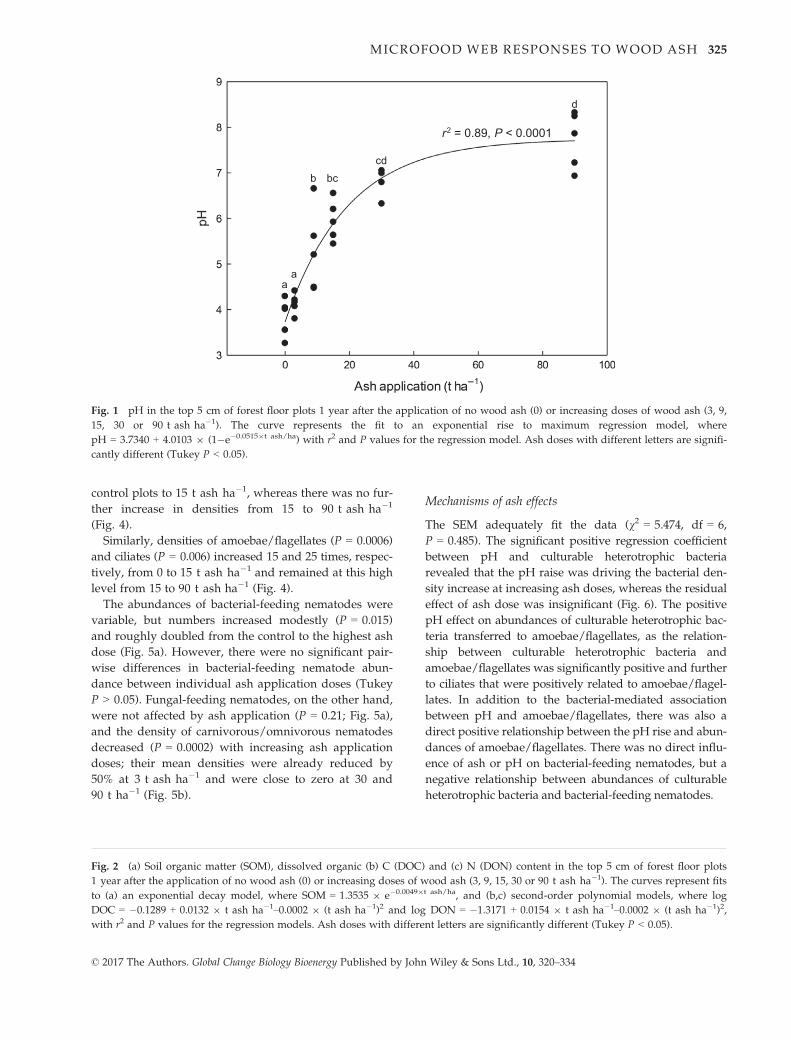
pH increased dramatically (P < 0.0001) from 3.8 in the
control treatment to 7.7 at the highest ash application
dose at 90 t ha�1 (Fig. 1).
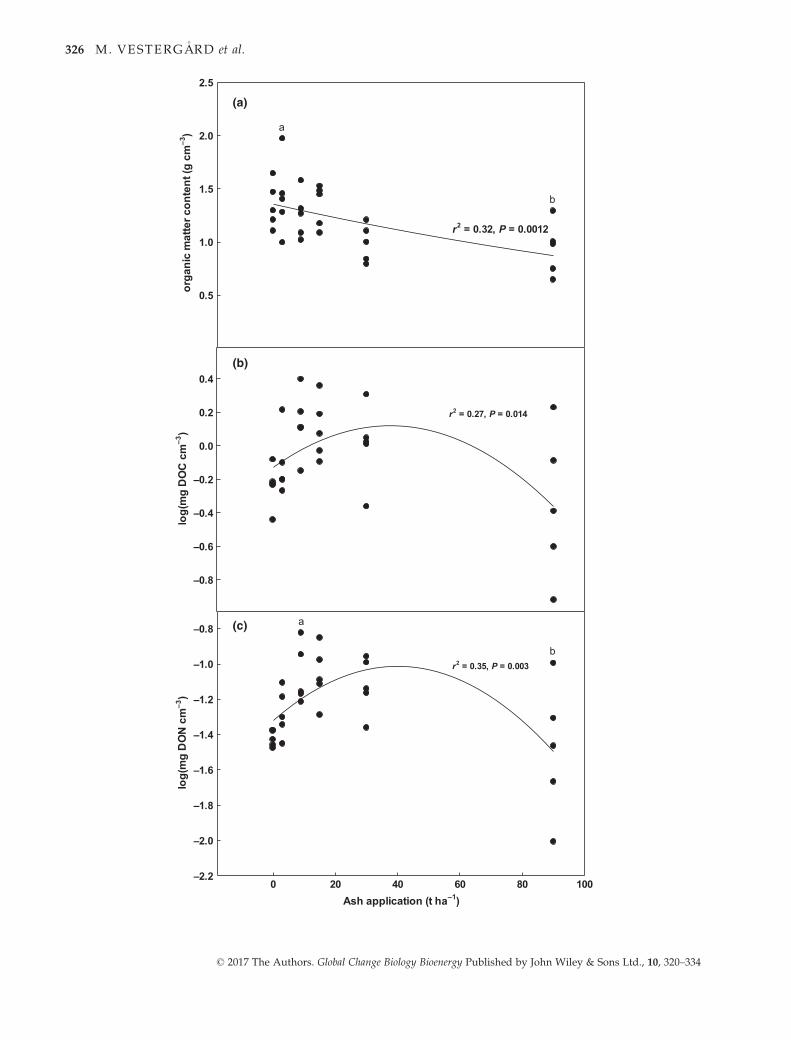
The organic matter content in the upper 5 cm was quite
variable within individual ash doses, but overall it
decreased with increasing ash doses (P = 0.0012), although
only two treatments, that is 3 t ash ha�1 with a mean
organic matter content of 1.4 g cm�3 and 90 t ash ha�1
with a mean of 0.93 g cm�3, were significantly different
(Tukey, P < 0.05) (Fig. 2a). Likewise, DOC and DON var-
ied considerably within individual ash application levels,
but both variables increased with ash doses up to 15–30 t ash ha�1. At 90 t ash ha�1, the variation within both
labile organic pools increased even further, but there was
an overall decline in DOC and DON compared to the max-
imum values found at lower ash doses (Fig. 2a,b).
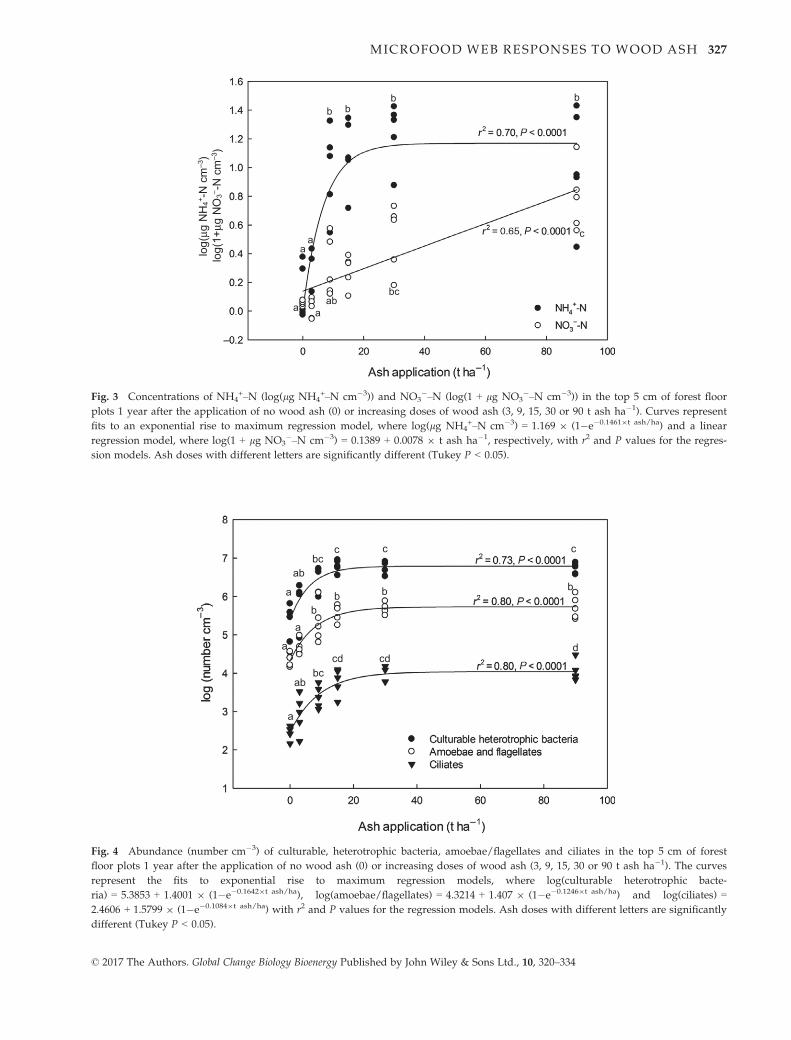
Soil ammonium concentration increased dramatically
from 1.5 to 1.7 lg NH4+–N at 0 to 3 t ash ha�1 to 11 lg
NH4+–N at 9 t ash ha�1, and remained at a high level
between 14 and 19 lg NH4+-N at 15–90 t ash ha�1
(Fig. 3). At 0 and 3 t ash ha�1, nitrate concentrations
were very low (0.1 lg NO3�–N cm�3), but it increased
linearly (P < 0.0001) with ash doses to 6 lg NO3�–N
cm�3 at 90 t ash ha�1 (Fig. 3).
Soil organism abundances
The density of culturable heterotrophic bacteria
increased (P < 0.0001) more than twentyfold from the
© 2017 The Authors. Global Change Biology Bioenergy Published by John Wiley & Sons Ltd., 10, 320–334
324 M. VESTERG�ARD et al.
control plots to 15 t ash ha�1, whereas there was no fur-
ther increase in densities from 15 to 90 t ash ha�1
(Fig. 4).
Similarly, densities of amoebae/flagellates (P = 0.0006)
and ciliates (P = 0.006) increased 15 and 25 times, respec-
tively, from 0 to 15 t ash ha�1 and remained at this high
level from 15 to 90 t ash ha�1 (Fig. 4).
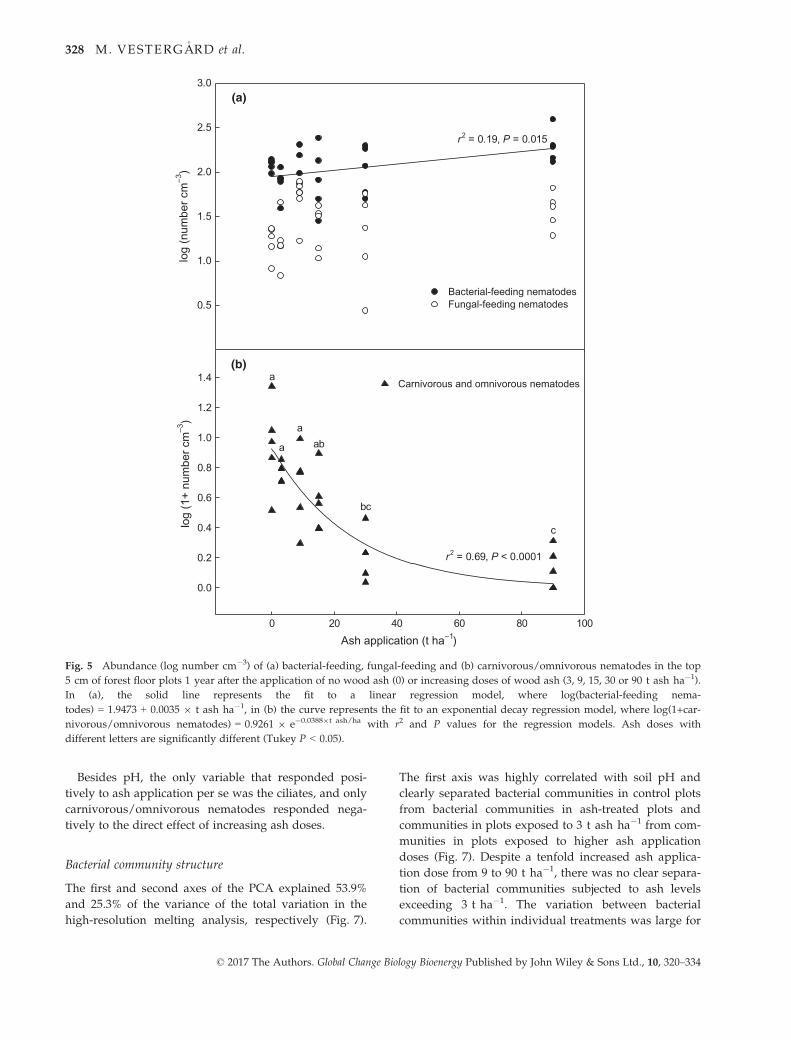
The abundances of bacterial-feeding nematodes were
variable, but numbers increased modestly (P = 0.015)
and roughly doubled from the control to the highest ash
dose (Fig. 5a). However, there were no significant pair-
wise differences in bacterial-feeding nematode abun-
dance between individual ash application doses (Tukey
P > 0.05). Fungal-feeding nematodes, on the other hand,
were not affected by ash application (P = 0.21; Fig. 5a),
and the density of carnivorous/omnivorous nematodes
decreased (P = 0.0002) with increasing ash application
doses; their mean densities were already reduced by
50% at 3 t ash ha�1 and were close to zero at 30 and
90 t ha�1 (Fig. 5b).
Mechanisms of ash effects
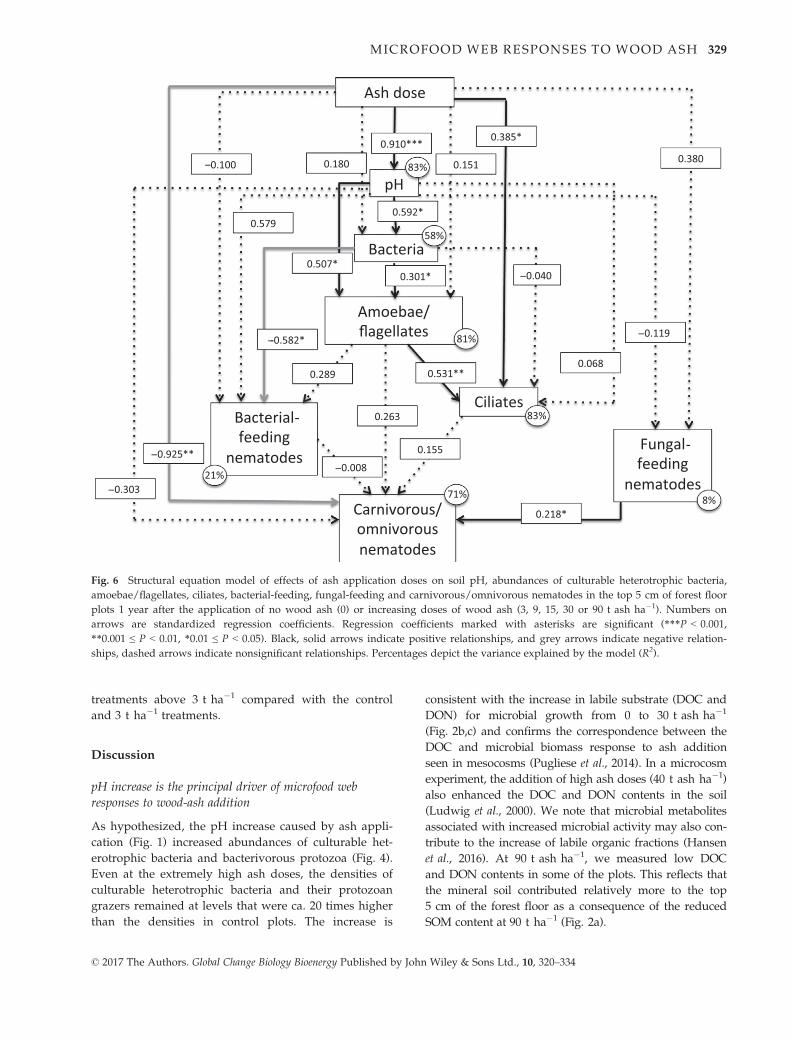
The SEM adequately fit the data (v2 = 5.474, df = 6,
P = 0.485). The significant positive regression coefficient
between pH and culturable heterotrophic bacteria
revealed that the pH raise was driving the bacterial den-
sity increase at increasing ash doses, whereas the residual
effect of ash dose was insignificant (Fig. 6). The positive
pH effect on abundances of culturable heterotrophic bac-
teria transferred to amoebae/flagellates, as the relation-
ship between culturable heterotrophic bacteria and
amoebae/flagellates was significantly positive and further
to ciliates that were positively related to amoebae/flagel-
lates. In addition to the bacterial-mediated association
between pH and amoebae/flagellates, there was also a
direct positive relationship between the pH rise and abun-
dances of amoebae/flagellates. There was no direct influ-
ence of ash or pH on bacterial-feeding nematodes, but a
negative relationship between abundances of culturable
heterotrophic bacteria and bacterial-feeding nematodes.
r2 = 0.89, P < 0.0001
aa
b bccd
d
Fig. 1 pH in the top 5 cm of forest floor plots 1 year after the application of no wood ash (0) or increasing doses of wood ash (3, 9,
15, 30 or 90 t ash ha�1). The curve represents the fit to an exponential rise to maximum regression model, where
pH = 3.7340 + 4.0103 9 (1�e�0.05159t ash/ha) with r2 and P values for the regression model. Ash doses with different letters are signifi-
cantly different (Tukey P < 0.05).
Fig. 2 (a) Soil organic matter (SOM), dissolved organic (b) C (DOC) and (c) N (DON) content in the top 5 cm of forest floor plots
1 year after the application of no wood ash (0) or increasing doses of wood ash (3, 9, 15, 30 or 90 t ash ha�1). The curves represent fits
to (a) an exponential decay model, where SOM = 1.3535 9 e�0.00499t ash/ha, and (b,c) second-order polynomial models, where log
DOC = �0.1289 + 0.0132 9 t ash ha�1–0.0002 9 (t ash ha�1)2 and log DON = �1.3171 + 0.0154 9 t ash ha�1–0.0002 9 (t ash ha�1)2,
with r2 and P values for the regression models. Ash doses with different letters are significantly different (Tukey P < 0.05).
© 2017 The Authors. Global Change Biology Bioenergy Published by John Wiley & Sons Ltd., 10, 320–334
MICROFOOD WEB RESPONSES TO WOOD ASH 325
m cg (tne tnocr ett a
mcin agro
3–)
0.5
1.0
1.5
2.0
2.5
r2 = 0.32, P = 0.0012
mcC
OD
gm(gol
3 –)
–0.8
–0.6
–0.4
–0.2
0.0
0.2
0.4
Ash application (t ha–1)0 20 40 60 80 100
mcN
OD
gm(gol
3–)
–2.2
–2.0
–1.8
–1.6
–1.4
–1.2
–1.0
–0.8
a
a
b
b
(a)
(b)
(c)
r2 = 0.27, P = 0.014
r2 = 0.35, P = 0.003
© 2017 The Authors. Global Change Biology Bioenergy Published by John Wiley & Sons Ltd., 10, 320–334
326 M. VESTERG�ARD et al.
µlo
g(g
NH
4+ -N
cm–3
)lo
g(1+
µ g N
O3— -
N c
m–3
)
aa
b bb b
a aab
bc
c
Fig. 3 Concentrations of NH4+–N (log(lg NH4
+–N cm�3)) and NO3�–N (log(1 + lg NO3
�–N cm�3)) in the top 5 cm of forest floor
plots 1 year after the application of no wood ash (0) or increasing doses of wood ash (3, 9, 15, 30 or 90 t ash ha�1). Curves represent
fits to an exponential rise to maximum regression model, where log(lg NH4+–N cm�3) = 1.169 9 (1�e�0.14619t ash/ha) and a linear
regression model, where log(1 + lg NO3�–N cm�3) = 0.1389 + 0.0078 9 t ash ha�1, respectively, with r2 and P values for the regres-
sion models. Ash doses with different letters are significantly different (Tukey P < 0.05).
a
abbc
c c
a
ab
b b b
c
a
abbc
cd cdd
Fig. 4 Abundance (number cm�3) of culturable, heterotrophic bacteria, amoebae/flagellates and ciliates in the top 5 cm of forest
floor plots 1 year after the application of no wood ash (0) or increasing doses of wood ash (3, 9, 15, 30 or 90 t ash ha�1). The curves
represent the fits to exponential rise to maximum regression models, where log(culturable heterotrophic bacte-
ria) = 5.3853 + 1.4001 9 (1�e�0.16429t ash/ha), log(amoebae/flagellates) = 4.3214 + 1.407 9 (1�e�0.12469t ash/ha) and log(ciliates) =
2.4606 + 1.5799 9 (1�e�0.10849t ash/ha) with r2 and P values for the regression models. Ash doses with different letters are significantly
different (Tukey P < 0.05).
© 2017 The Authors. Global Change Biology Bioenergy Published by John Wiley & Sons Ltd., 10, 320–334
MICROFOOD WEB RESPONSES TO WOOD ASH 327
Besides pH, the only variable that responded posi-
tively to ash application per se was the ciliates, and only
carnivorous/omnivorous nematodes responded nega-
tively to the direct effect of increasing ash doses.
Bacterial community structure
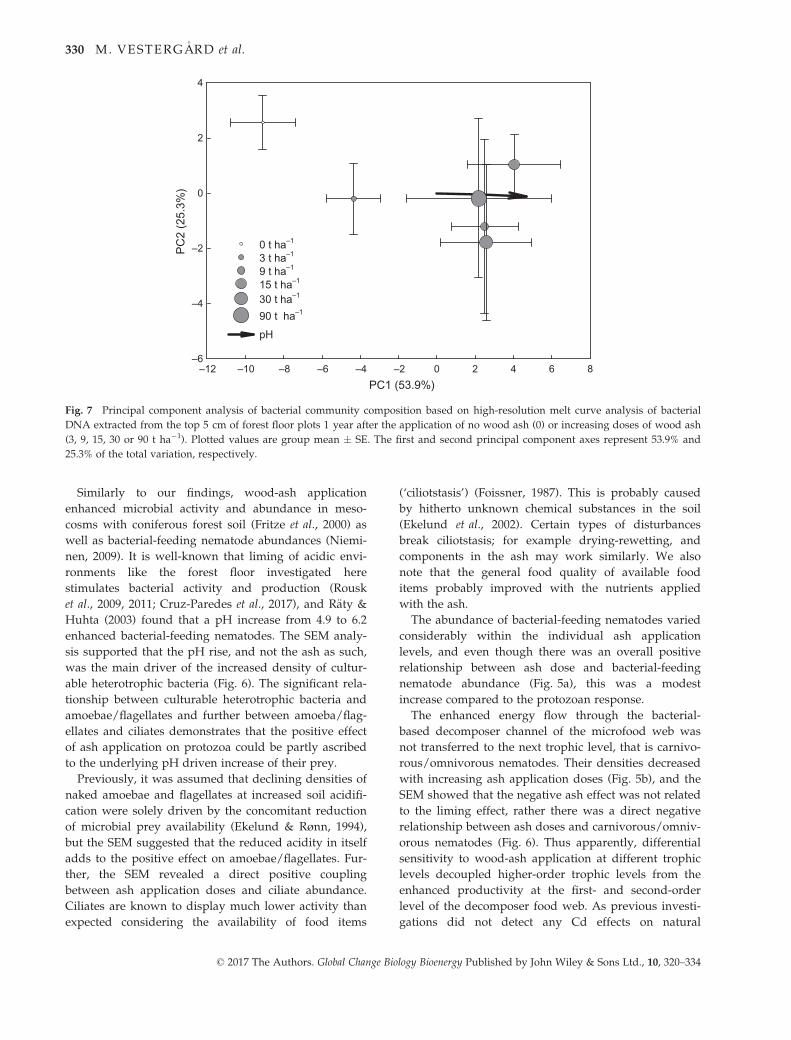
The first and second axes of the PCA explained 53.9%
and 25.3% of the variance of the total variation in the
high-resolution melting analysis, respectively (Fig. 7).
The first axis was highly correlated with soil pH and
clearly separated bacterial communities in control plots
from bacterial communities in ash-treated plots and
communities in plots exposed to 3 t ash ha�1 from com-
munities in plots exposed to higher ash application
doses (Fig. 7). Despite a tenfold increased ash applica-
tion dose from 9 to 90 t ha�1, there was no clear separa-
tion of bacterial communities subjected to ash levels
exceeding 3 t ha�1. The variation between bacterial
communities within individual treatments was large for
log
(num
ber c
m3–)
0.5
1.0
1.5
2.0
2.5
3.0
Bacterial-feeding nematodesFungal-feeding nematodes
r2 = 0.19, P = 0.015
Ash application (t ha–1)0 20 40 60 80 100
log
(1+
num
ber c
m3 –)
0.0
0.2
0.4
0.6
0.8
1.0
1.2
1.4 Carnivorous and omnivorous nematodes
(a)
(b)a
a
aab
bc
c
r2 = 0.69, P < 0.0001
Fig. 5 Abundance (log number cm�3) of (a) bacterial-feeding, fungal-feeding and (b) carnivorous/omnivorous nematodes in the top
5 cm of forest floor plots 1 year after the application of no wood ash (0) or increasing doses of wood ash (3, 9, 15, 30 or 90 t ash ha�1).
In (a), the solid line represents the fit to a linear regression model, where log(bacterial-feeding nema-
todes) = 1.9473 + 0.0035 9 t ash ha�1, in (b) the curve represents the fit to an exponential decay regression model, where log(1+car-
nivorous/omnivorous nematodes) = 0.9261 9 e�0.03889t ash/ha with r2 and P values for the regression models. Ash doses with
different letters are significantly different (Tukey P < 0.05).
© 2017 The Authors. Global Change Biology Bioenergy Published by John Wiley & Sons Ltd., 10, 320–334
328 M. VESTERG�ARD et al.
treatments above 3 t ha�1 compared with the control
and 3 t ha�1 treatments.
Discussion
pH increase is the principal driver of microfood webresponses to wood-ash addition
As hypothesized, the pH increase caused by ash appli-
cation (Fig. 1) increased abundances of culturable het-
erotrophic bacteria and bacterivorous protozoa (Fig. 4).
Even at the extremely high ash doses, the densities of
culturable heterotrophic bacteria and their protozoan
grazers remained at levels that were ca. 20 times higher
than the densities in control plots. The increase is
consistent with the increase in labile substrate (DOC and
DON) for microbial growth from 0 to 30 t ash ha�1
(Fig. 2b,c) and confirms the correspondence between the
DOC and microbial biomass response to ash addition
seen in mesocosms (Pugliese et al., 2014). In a microcosm
experiment, the addition of high ash doses (40 t ash ha�1)
also enhanced the DOC and DON contents in the soil
(Ludwig et al., 2000). We note that microbial metabolites
associated with increased microbial activity may also con-
tribute to the increase of labile organic fractions (Hansen
et al., 2016). At 90 t ash ha�1, we measured low DOC
and DON contents in some of the plots. This reflects that
the mineral soil contributed relatively more to the top
5 cm of the forest floor as a consequence of the reduced
SOM content at 90 t ha�1 (Fig. 2a).
Fig. 6 Structural equation model of effects of ash application doses on soil pH, abundances of culturable heterotrophic bacteria,
amoebae/flagellates, ciliates, bacterial-feeding, fungal-feeding and carnivorous/omnivorous nematodes in the top 5 cm of forest floor
plots 1 year after the application of no wood ash (0) or increasing doses of wood ash (3, 9, 15, 30 or 90 t ash ha�1). Numbers on
arrows are standardized regression coefficients. Regression coefficients marked with asterisks are significant (***P < 0.001,
**0.001 ≤ P < 0.01, *0.01 ≤ P < 0.05). Black, solid arrows indicate positive relationships, and grey arrows indicate negative relation-
ships, dashed arrows indicate nonsignificant relationships. Percentages depict the variance explained by the model (R2).
© 2017 The Authors. Global Change Biology Bioenergy Published by John Wiley & Sons Ltd., 10, 320–334
MICROFOOD WEB RESPONSES TO WOOD ASH 329
Similarly to our findings, wood-ash application
enhanced microbial activity and abundance in meso-
cosms with coniferous forest soil (Fritze et al., 2000) as
well as bacterial-feeding nematode abundances (Niemi-
nen, 2009). It is well-known that liming of acidic envi-
ronments like the forest floor investigated here
stimulates bacterial activity and production (Rousk
et al., 2009, 2011; Cruz-Paredes et al., 2017), and R€aty &
Huhta (2003) found that a pH increase from 4.9 to 6.2
enhanced bacterial-feeding nematodes. The SEM analy-
sis supported that the pH rise, and not the ash as such,
was the main driver of the increased density of cultur-
able heterotrophic bacteria (Fig. 6). The significant rela-
tionship between culturable heterotrophic bacteria and
amoebae/flagellates and further between amoeba/flag-
ellates and ciliates demonstrates that the positive effect
of ash application on protozoa could be partly ascribed
to the underlying pH driven increase of their prey.
Previously, it was assumed that declining densities of
naked amoebae and flagellates at increased soil acidifi-
cation were solely driven by the concomitant reduction
of microbial prey availability (Ekelund & Rønn, 1994),
but the SEM suggested that the reduced acidity in itself
adds to the positive effect on amoebae/flagellates. Fur-
ther, the SEM revealed a direct positive coupling
between ash application doses and ciliate abundance.
Ciliates are known to display much lower activity than
expected considering the availability of food items
(‘ciliotstasis’) (Foissner, 1987). This is probably caused
by hitherto unknown chemical substances in the soil
(Ekelund et al., 2002). Certain types of disturbances
break ciliotstasis; for example drying-rewetting, and
components in the ash may work similarly. We also
note that the general food quality of available food
items probably improved with the nutrients applied
with the ash.
The abundance of bacterial-feeding nematodes varied
considerably within the individual ash application
levels, and even though there was an overall positive
relationship between ash dose and bacterial-feeding
nematode abundance (Fig. 5a), this was a modest
increase compared to the protozoan response.
The enhanced energy flow through the bacterial-
based decomposer channel of the microfood web was
not transferred to the next trophic level, that is carnivo-
rous/omnivorous nematodes. Their densities decreased
with increasing ash application doses (Fig. 5b), and the
SEM showed that the negative ash effect was not related
to the liming effect, rather there was a direct negative
relationship between ash doses and carnivorous/omniv-
orous nematodes (Fig. 6). Thus apparently, differential
sensitivity to wood-ash application at different trophic
levels decoupled higher-order trophic levels from the
enhanced productivity at the first- and second-order
level of the decomposer food web. As previous investi-
gations did not detect any Cd effects on natural
PC1 (53.9%)–12 –10 –8 –6 –4 –2 0 2 4 6 8
PC2
(25.
3%)
–6
–4
–2
0
2
4
0 t ha–1
pH
3 t ha–1
9 t ha–1
15 t ha–1
30 t ha–1
90 t ha–1
Fig. 7 Principal component analysis of bacterial community composition based on high-resolution melt curve analysis of bacterial
DNA extracted from the top 5 cm of forest floor plots 1 year after the application of no wood ash (0) or increasing doses of wood ash
(3, 9, 15, 30 or 90 t ha�1). Plotted values are group mean � SE. The first and second principal component axes represent 53.9% and
25.3% of the total variation, respectively.
© 2017 The Authors. Global Change Biology Bioenergy Published by John Wiley & Sons Ltd., 10, 320–334
330 M. VESTERG�ARD et al.
nematode communities or typically disturbance-sensi-
tive nematode taxa (Korthals et al., 1996; Bakonyi et al.,
2003; Nagy et al., 2004), Cd added with the ash probably
did not cause the decline of carnivorous/omnivorous
nematodes. In our field experiment, ash application
reduced and changed the species composition of the
moss cover (Ethelberg-Findsen et al., in prep), and this
overall habitat disturbance may explain the negative
response of the most sensitive nematodes. Further, at
reduced organic matter content (Fig. 2a), the average
soil pore diameter declines, which can restrict the large-
sized carnivorous/omnivorous nematodes from access-
ing prey residing in small pores spaces (Mikola &
Set€al€a, 1998a). We speculate that the modest increase in
bacterial-feeding nematode abundances with increasing
ash doses may reflect reduced predatory control from
the declining populations of carnivorous/omnivorous
nematodes (Mikola & Set€al€a, 1998b). In general, popula-
tions of carnivorous/omnivorous nematodes increase
slower than populations of typically more r-selected
bacterial feeders (Bongers & Bongers, 1998). Here, we
study responses to ash 1 year after application; the posi-
tive ash effect on abundances of lower trophic organ-
isms may thus later manifest as enhanced carnivorous/
omnivorous nematode densities or to some degree
counteract the immediate negative effect on carnivo-
rous/omnivorous nematodes.
Contrary to the bacterial-based compartment of the
soil food web, ash application did not affect fungal-
feeding nematode abundances (Fig. 5a). The abundance
of bacterial- and fungal-feeding nematodes has been
shown to correlate with the activity of their food
sources, that is bacteria and fungi, respectively (Chris-
tensen et al., 2012). Our data thus support previous find-
ings that fungal production responds very little, if at all,
to rising pH (Rousk et al., 2009, 2011). Rousk et al.
(2010b) stated that fungal diversity is largely unrespon-
sive to soil pH changes, but there is also evidence that
fungal diversity is highest in acidic soils, and soil pH is
an important driver of fungal and particularly ectomyc-
orrhizal fungal community composition (Tedersoo et al.,
2014; Kjøller et al., 2017).
pH-related impacts on bacterial community structure
There is strong evidence that pH is the main driver of
bacterial community composition at both continental
scales (Fierer & Jackson, 2006) and local scales (Lanz�en
et al., 2015; Zhalnina et al., 2015), and our analysis con-
firms that the wood ash-induced community change
strongly correlates with pH (Fig. 7). In our system, the
largest bacterial community changes were associated
with pH increases from 3.8 to 5.3, that is from 0 to
9 t ash ha�1.
Within this range of ash doses and pH increase, our
analyses thus confirm previous findings that modest
ash application doses and the associated pH increase
significantly alter the composition of microbial, espe-
cially bacterial, communities (Frosteg�ard et al., 1993;
Perki€om€aki & Fritze, 2002; Noyce et al., 2016) resulting
in community-wide tolerance to higher pH values
(Cruz-Paredes et al., 2017). However, contrary to our
expectation ash doses above 9 t ash ha�1 did not sepa-
rate bacterial communities in a dose-dependent manner.
The larger variation of bacterial community composition
within treatments exposed to 9–90 t ash ha�1 suggests
that stochastic processes to a larger extent governed the
development of spatially separated bacterial communi-
ties exposed to extreme ash application doses.
The importance of pH as the driver of microbial com-
munity composition probably also explains why low
wood-ash application rates of maximum 3.3 t ha�1 did
not affect the microbial community composition in
drained peatlands, where wood ash did not raise the
pH (Bj€ork et al., 2010).
Given that wood-ash application did not induce
enhanced Cd tolerance in bacterial communities sam-
pled at our field site (Cruz-Paredes et al., 2017), we con-
sider it highly unlikely that the Cd content in the ash
applied in our experiment (7.1 mg kg�1 ash) con-
tributed to the changes in microbial community struc-
ture. Further, in another study, spiking wood ash with
very high Cd levels (up to 1,000 mg kg�1 ash) did not
in any way affect the microbial community composition
(Fritze et al., 2000).
Implications of wood-ash application on inorganicnitrogen availability and soil C storage
As wood ash contains practically no nitrogen, its appli-
cability as a fertilizer critically depends on its impact on
inorganic nitrogen availability, especially in N-limited
systems.
We found that application of 9 t ash ha�1 and above
increased ammonium concentrations more than 10
times, and at 30 and 90 t ash ha�1, mean nitrate concen-
trations were 18 and 41 times higher than in the control,
respectively. This is in accordance with the concurrent
increase of labile organic N (DON), readily available for
microbial turnover (Kielland et al., 2007) and the pro-
nounced stimulation of culturable heterotrophic bacteria
and bacterial grazers that are responsible for soil nitro-
gen mineralization (Rønn et al., 2012). At our study site,
vascular plants contribute very little to the forest floor
vegetation, which is totally dominated by mosses. Ash
application reduced the moss cover, and the increased
inorganic N content with ash application could thus
partly reflect reduced N uptake by mosses. However,
© 2017 The Authors. Global Change Biology Bioenergy Published by John Wiley & Sons Ltd., 10, 320–334
MICROFOOD WEB RESPONSES TO WOOD ASH 331

the 10-fold increase in ammonium was already apparent
at 9 t ash ha�1, whereas the moss cover did not decline
before 15–90 t ash ha�1 (Ethelberg-Findsen et al., in
prep.), and we therefore consider increased mineraliza-
tion the most likely cause of the increased ammonium
concentration.
In Finnish and Swedish studies, 3–4 t ash ha�1 either
had no or low, transient positive impact on soil ammo-
nium concentrations (Jacobson et al., 2004; Nieminen
et al., 2012). At one site, ammonium concentrations in
the humus layer increased ca. 2 and 4 times at 6 and
9 t ash ha�1, respectively, whereas at another site, ash
did not affect ammonium concentrations (Jacobson
et al., 2004). We found no increase in the inorganic N
availability at 3 t ash ha�1. Taken together, these results
suggest that consistent and lasting positive effects on
ammonium availability require ash application doses
above the currently allowed limits.
Whereas the NH4+-N pool increased dramatically
already at 9 t ash ha�1, the NO3�-N pool increased
more moderately and gradually. Although the tradi-
tional notion that nitrification is limited in acidic soils
has been challenged (Booth et al., 2005; Nicol et al.,
2008), our study shows that significant nitrate produc-
tion is not evident before near-neutral pH is reached.
Our plots of 2 9 2 m are too small to relate the
increased inorganic N availability to tree N uptake and
growth, which is key to assessing the economic and
environmental sustainability of ash application, but pos-
itive effects of ash application on tree production have
been reported for sites on organic soils (Karltun et al.,
2008; Huotari et al., 2015).
The main rationale for the use of wood as an
energy source is the replacement of fossil fuel and the
conversion of energy production towards systems
where CO2 uptake during biofuel production compen-
sate for CO2 emissions. However, if ash-induced min-
eralization of soil C exceeds the CO2–C fixed during
tree growth the climate change mitigating rationale
may prove untenable. Therefore, on the one hand, the
ash-induced increased activity of the bacterial-based
decomposer food web jeopardizes the sustainability of
biofuel production by increasing soil organic matter
decomposition, but on the other hand, the concomi-
tant N mineralization may enhance tree growth and
thus CO2 fixation. Further research is pertinent to
clarify, if the ash-induced enhanced inorganic N con-
tent will positively impact tree growth and adequately
compensate for ash-induced mineralization of soil
organic C.
In conclusion, wood-ash application increased labile
organic pools and the production of culturable hetero-
trophic bacteria in the top 5 cm of the forest floor with
cascading effects on the bacterial-feeding trophic level.
This response was governed by the liming effect of
wood ash rather than by ash per se. In contrast, ash
application per se, rather than the associated pH
change, reduced abundances of carnivorous/omnivo-
rous nematodes, confirming that nematode taxa at this
trophic level are sensitive to environmental distur-
bances.
Further, wood-ash application and the associated pH
increase changed the bacterial community structure, but
the changes induced by the most extreme ash dose of
90 t ha�1 did not exceed the changes induced at
9 t ash ha�1.
As expected, the stimulation of bacterial-based micro-
food web enhanced inorganic nitrogen availability. At
extreme ash doses, soil organic matter decreased, but at
0–15 t ash ha�1 the soil organic matter pool was unaf-
fected. Overall, the negative effects of ash application
on abundances of soil biota were very limited, and the
microfood web functioning proved robust to dosages
exceeding currently allowed doses up to 30 times.
Hence, we do not foresee negative implications for the
ecosystem parameters investigated here, if legislative
limits for ash application doses are raised to, for exam-
ple, 6–9 t ash ha�1.
Acknowledgements
This work was supported by the ‘Center for Bioenergy Recy-cling – ASHBACK’ funded by the Danish Council for StrategicResearch (grant no. 0606-00587B). We thank the forest owner,Steen Blicher A/S, for allowing us to establish the field studyand ASHBACK collaborators for establishing and maintainingthe field experiment. We appreciate the comments of threeanonymous reviewers that significantly improved the manu-script.
References
Bakonyi G, Nagy P, K�ad�ar I (2003) Long-term effects of heavy metals and microele-
ments on nematode assemblage. Toxicology Letters, 140–141, 391–401.
Bang-Andreasen T, Nielsen JT, Voriskova J, Heise J, Rønn R, Hansen HCB, Jacobsen
CS (2017) Wood ash induced pH changes strongly affect soil bacterial numbers
and community composition. Frontiers in Microbiology, 8, 1400.
Bj€ork RG, Ernfors M, Sikstr€om U, Nilsson MB, Andersson MX, R€utting T, Klemedts-
son L (2010) Contrasting effects of wood ash application on microbial community
structure, biomass and processes in drained forested peatlands. FEMS Microbiol-
ogy Ecology, 73, 550–562.
Blagodatskaya E, Kuzyakov Y (2013) Active microorganisms in soil: critical review
of estimation criteria and approaches. Soil Biology & Biochemistry, 67, 192–211.
Blattner FR, Plunkett III G, Bloch CA et al. (1997) The complete genome sequence of
Escherichia coli K-12. Science, 277, 1453–1462.
Bongers T (1990) The maturity index: an ecological measure of environmental distur-
bance based on nematode species composition. Oecologia, 83, 14–19.
Bongers T, Bongers M (1998) Functional diversity of nematodes. Applied Soil Ecology,
10, 239–251.
Booth MS, Stark JM, Rastetter E (2005) Controls on nitrogen cycling in terrestrial
ecosystems: a synthetic analysis of literature data. Ecological Monographs, 75, 139–
157.
Christensen S, Dam M, Vesterg�ard M, Petersen SO, Olesen JE, Schjønning P (2012)
Specific antibiotics and nematode trophic groups agree in assessing fungal:bacte-
rial activity in agricultural soil. Soil Biology & Biochemistry, 55, 17–19.
© 2017 The Authors. Global Change Biology Bioenergy Published by John Wiley & Sons Ltd., 10, 320–334
332 M. VESTERG�ARD et al.
COM (2006) COM 2006/848: Renewable Energy Road Map. Commission of the Euro-
pean Community, Brussels, Belgium.
Cruz-Paredes C, Wallander H, Kjøller R, Rousk J (2017) Using community trait-dis-
tributions to assign microbial responses to pH changes and Cd in forest soils trea-
ted with wood ash. Soil Biology & Biochemistry, 112, 153–164.
Dam M, Bergmark L, Vesterg�ard M (2017) Elevated CO2 increases fungal-based
micro-foodwebs in soils of contrasting plant species. Plant and Soil, 415, 549–561.
https://doi.org/10.1007/s11104-017-3191-3.
DEA (2008) Bioaskebekendtgørelsen. Danish Environmental Protection Agency, Copen-
hagen, Denmark.
Demeyer A, Voundi Nkana JC, Verloo MG (2001) Characteristics of wood ash and
influence on soil properties and nutrient uptake: an overview. Bioresource Technol-
ogy, 77, 287–295.
Eisenhauer N, Dobies T, Cesarz S, Hobbie SE, Meyer RJ, Worm K, Reich PB (2013)
Plant diversity effects on soil food webs are stronger than those of elevated CO2
and N deposition in a long-term grassland experiment. Proceedings of the National
Academy of Sciences of the United States of America, 110, 6889–6894.
Ekelund F, Rønn R (1994) Notes on protozoa in agricultural soil with emphasis on
heterotrophic flagellates and naked amoebas and their ecology. FEMS Microbiol-
ogy Reviews, 15, 321–353.
Ekelund F, Frederiksen HB, Rønn R (2002) Population dynamics of active and total
ciliate populations in arable soil amended with wheat. Applied and Environmental
Microbiology, 68, 1096–1101.
Ethelberg-Findsen D, Rønn R, Ekelund F (in prep) Wood Ash Application Changes
Bryophyte Cover and species Composition in a Picea abies (Norway Spruce) plantation.
Manuscript in preparation.
Eti�egni L, Campbell AG (1991) Physical and chemical characteristics of wood ash.
Bioresource Technology, 37, 173–178.
Ferris H (2010) Contribution of nematodes to the structure and function of the soil
food web. Journal of Nematology, 42, 63–67.
Fierer N, Jackson RB (2006) The diversity and biogeography of soil bacterial commu-
nities. Proceedings of the National Academy of Sciences of the United States of America,
103, 626–631.
Foissner W (1987) Soil protozoa: fundamental problems, ecological significance,
adaptations in ciliates and testaceans, bioindicators and guide to the future. Pro-
gress in Protistology, 2, 69–212.
Fritze H, Perki€om€aki J, Saarela U et al. (2000) Effect of Cd-containing wood ash on
the microflora of coniferous forest humus. FEMS Microbiology Ecology, 32, 43–51.
Frosteg�ard A, B�a�ath E, Tunlid A (1993) Shifts in the structure of soil microbial com-
munities in limed forests as revealed by phospholipid fatty-acid analysis. Soil
Biology & Biochemistry, 25, 723–730.
Genenger M, Zimmermann S, Frossard E, Brunner I (2003) The effects of fertiliser or
wood ash on nitrate reductase activity in Norway spruce fine roots. Forest Ecology
and Management, 175, 413–423.
de Goede RGM, Dekker HH (1993) Effects of liming and fertilization on nematode
communities in coniferous forest soils. Pedobiologia, 37, 193–209.
Hansen CHF, Krych L, Nielsen DS et al. (2012) Early life treatment with vancomycin
propagates Akkermansia muciniphila and reduces diabetes incidence in the NOD
mouse. Diabetologia, 55, 2285–2294.
Hansen M, Saarsalmi A, Peltre C (2016) Changes in SOM composition and stability
to microbial degradation over time in response to wood chip ash fertilisation. Soil
Biology & Biochemistry, 99, 179–186.
Hjelmsø MH, Hansen LH, Bælum J, Feld L, Holben WE, Jacobsen CS (2014) High-
resolution melt analysis for rapid comparison of bacterial community composi-
tions. Applied and Environmental Microbiology, 80, 3568–3575.
Huotari N, Tillman-Sutela E, Moilanen M, Laiho R (2015) Recycling of ash – For the
good of the environment? Forest Ecology and Management, 348, 226–240.
Hyv€onen R, Huhta V (1989) Effects of lime, ash and nitrogen fertilizers on nematode
populations in Scots pine forest soils. Pedobiologia, 33, 129–143.
Ingerslev M, Skov S, Sevel L, Pedersen LB (2011) Element budgets of forest biomass
combustion and ash fertilisation – A Danish case-study. Biomass and Bioenergy, 35,
2697–2704.
Ingham RE, Trofymow JA, Ingham ER, Coleman DC (1985) Interactions of bacteria,
fungi, and their nematode grazers: effects on nutrient cycling and plant-growth.
Ecological Monographs, 55, 119–140.
Jacobson S, H€ogbom L, Ring E, Nohrstedt H€O (2004) Effects of wood ash dose and
formulation on soil chemistry at two coniferous forest sites. Water Air and Soil Pol-
lution, 158, 113–125.
Jacobson S, Lundstr€om H, Nordlund S, Sikstr€om U, Pettersson F (2014) Is tree
growth in boreal coniferous stands on mineral soils affected by the addition of
wood ash? Scandinavian Journal of Forest Research, 29, 675–685.
J€aggi M, Siegwolf R, Genenger M, Hallenbarter D, Brunner I, Fuhrer J (2004) Wood
ash treatment affects seasonal N fluctuations in needles of adult Picea abies trees:
a 15N-tracer study. Trees, 18, 54–60.
Karltun E, Saarsalmi A, Ingerslev M et al. (2008) Wood ash recycling – possibilities
and risks. In: Sustainable Use of Forest Biomass for Energy: A Synthesis with Focus on
the Baltic and Nordic Region (eds R€oser D, Asikainen A, Raulund-Rasmussen K,
Stupak I), pp. 79–108. Springer, Dordrecht, the Netherlands.
Kazantis N, Deane FP, Ronan KR (2001) Concluding causation from correlation:
Comment on Burns and Spangler (2000). Journal of Consulting and Clinical Psychol-
ogy, 69, 1079–1083.
Kielland K, McFarland JW, Ruess RW, Olson K (2007) Rapid cycling of organic nitro-
gen in taiga forest ecosystems. Ecosystems, 10, 360–368.
Kjøller R, Cruz-Paredes C, Clemmensen K (2017) Ectomycorrhizal fungal responses
to forest liming and wood ash addition: review and meta-analysis. In: Soil Biologi-
cal Communities and Ecosystem Resilience (eds Lukac M, Grenni P, Gamboni M),
Springer International Publishing.
Korpilahti A, Moilanen M, Finer L (1998) Biomass ash utilization in Finland. In:
Ashes and Particulate Emissions from Biomass Combustion: Formation, Characterisation,
Evaluation, Treatment (ed Obernberger I), University of Graz, Institute of Chemical
Engineering and Technology.
Korthals GW, Ende AVD, Megen HV, Lexmond TM, Kammenga JE, Bongers T
(1996) Short-term effects of cadmium, copper, nickel and zinc on soil nematodes
from different feeding and life-history strategy groups. Applied Soil Ecology, 4,
107–117.
Lanz�en A, Epelde L, Garbisu C, Anza M, Mart�ın-S�anchez I, Blanco F, Mijangos I
(2015) The community structures of prokaryotes and fungi in mountain pasture
soils are highly correlated and primarily influenced by pH. Frontiers in Microbiol-
ogy, 6, 1321.
Liiri M, Set€al€a H, Haimi J, Pennanen T, Fritze H (2002) Soil processes are not influ-
enced by the functional complexity of soil decomposer food webs under distur-
bance. Soil Biology & Biochemistry, 34, 1009–1020.
Liiri M, Ilmarinen K, Set€al€a H (2007) Variable impacts of enchytraeid worms and
ectomycorrhizal fungi on plant growth in raw humus soil treated with wood ash.
Applied Soil Ecology, 35, 174–183.
Lodenius M (2003) Cadmium concentrations in a boreal forest ecosystem after appli-
cation of wood ash. Bulletin of Environmental Contamination and Toxicology, 71,
776–781.
Lodenius M, Josefsson J, Heli€ovaara K, Tulisalo E, Nummelin M (2009) Cadmium in
insects after ash application. Insect Science, 16, 93–98.
Ludwig B, Hell B, Beese F (2000) Use of 13C and 15N mass spectrometry to study
the decomposition of Calamagrostis epigeios in soil column experiments with
and without ash additions. Isotopes in Environmental and Health Studies, 36, 49–
61.
Lundkvist H (1998) Wood ash effects on enchytraeid and earthworm abundance
and enchytraeid cadmium content. Scandinavian Journal of Forest Research, 13,
86–95.
Majdi H, Truus L, Johansson U, Nylund J-E, Wallander H (2008) Effects of slash
retention and wood ash addition on fine root biomass and production and fungal
mycelium in a Norway spruce stand in SW Sweden. Forest Ecology and Manage-
ment, 255, 2109–2117.
Malik AA, Chowdhury S, Schlager V et al. (2016) Soil fungal:bacterial ratios are
linked to altered carbon cycling. Frontiers in Microbiology, 7, 1247.
McCoach DB, Black AC, O’Connell AA (2007) Errors of inference in structural equa-
tion modeling. Psychology in the Schools, 44, 461–470.
McCune B, Mefford M (1999) Multivariate Analysis of Ecological Data. Gleneden
Beach, MjM Software, Lincoln, OR, USA.
Mikola J, Set€al€a H (1998a) Productivity and trophic-level biomasses in a microbial-
based soil food web. Oikos, 82, 158–168.
Mikola J, Set€al€a H (1998b) No evidence of trophic cascades in an experimental
microbial-based soil food web. Ecology, 79, 153–164.
Moore JC, Hunt HW (1988) Resource compartmentation and the stability of real
ecosystems. Nature, 333, 261–263.
Moore JC, Deruiter PC, Hunt HW, Coleman DC, Freckman DW (1996) Microcosms
and soil ecology: critical linkages between field studies and modelling food webs.
Ecology, 77, 694–705.
Nagy P, Bakonyi G, Bongers T, K�ad�ar I, F�abi�an M, Kiss I (2004) Effects of microele-
ments on soil nematode assemblages seven years after contaminating an agricul-
tural field. Science of The Total Environment, 320, 131–143.
Nicol GW, Leininger S, Schleper C, Prosser JI (2008) The influence of soil pH on the
diversity, abundance and transcriptional activity of ammonia oxidizing archaea
and bacteria. Environmental Microbiology, 10, 2966–2978.
© 2017 The Authors. Global Change Biology Bioenergy Published by John Wiley & Sons Ltd., 10, 320–334
MICROFOOD WEB RESPONSES TO WOOD ASH 333
Nieminen JK (2009) Combined effects of loose wood ash and carbon on inorganic N
and P, key organisms, and the growth of Norway spruce seedlings and grasses in
a pot experiment. Plant and Soil, 317, 155–165.
Nieminen JK, Raisanen M, Haimi J (2012) Spot mounding and granulated wood
ash increase inorganic N availability and alter key components of the soil food
web in clear-cut Norway spruce forests. Forest Ecology and Management, 263,
24–30.
Noyce GL, Fulthorpe R, Gorgolewski A, Hazlett P, Tran H, Basiliko N (2016) Soil
microbial responses to wood ash addition and forest fire in managed Ontario for-
ests. Applied Soil Ecology, 107, 368–380.
Olsen A, Bakken L (1987) Viability of soil bacteria: optimisation of plate-counting
technique and comparison between total counts and plate counts within different
size groups. Microbial Ecology, 13, 59–74.
Page FC (1988) A New Key to Freshwater and Soil Gymnamoebae. Ambleside, Freshwa-
ter Biological Association.
Perki€om€aki J, Fritze H (2002) Short and long-term effects of wood ash on the
boreal forest humus microbial community. Soil Biology & Biochemistry, 34,
1343–1353.
Pugliese S, Jones T, Preston MD, Hazlett P, Tran H, Basiliko N (2014) Wood ash as a
forest soil amendment: the role of boiler and soil type on soil property response.
Canadian Journal of Soil Science, 94, 621–634.
R Core Team (2014) R: A Language and Environment for Statistical Computing. R Foun-
dation for Statistical Computing, Vienna, Austria.
R€aty M, Huhta V (2003) Earthworms and pH affect communities of nematodes and
enchytraeids in forest soil. Biology and Fertility of Soils, 38, 52–58.
Rønn R, Ekelund F, Christensen S (1995) Optimizing soil extract and broth media for
MPN-enumeration of naked amoebas and heterotrophic flagellates in soil. Pedobi-
ologia, 39, 10–19.
Rønn R, McCaig A, Griffiths BS, Prosser JI (2002) Impact of protozoan grazing on
bacterial community structure in soil microcosms. Appled and Environmental
Microbiology, 68, 6094–6105.
Rønn R, Vesterg�ard M, Ekelund F (2012) Interactions between bacteria, protozoa and
nematodes in soil. Acta Protozoologica, 51, 223–235.
Rooney N, McCann K, Gellner G, Moore JC (2006) Structural asymmetry and the sta-
bility of diverse food webs. Nature, 442, 265–269.
Rosseel Y (2012) lavaan: an R package for structural equation modeling. Journal of
Statistical Software, 48, 1–36.
Rousk J, B�a�ath E (2011) Growth of saprotrophic fungi and bacteria in soil. FEMS
Microbiology Ecology, 78, 17–30.
Rousk J, Brookes PC, B�a�ath E (2009) Contrasting soil pH effects on fungal and bacte-
rial growth suggest functional redundancy in carbon mineralization. Applied and
Environmental Microbiology, 75, 1589–1596.
Rousk J, Brookes PC, B�a�ath E (2010a) Investigating the mechanisms for the opposing
pH relationships of fungal and bacterial growth in soil. Soil Biology & Biochem-
istry, 42, 926–934.
Rousk J, B�a�ath E, Brookes PC et al. (2010b) Soil bacterial and fungal communities
across a pH gradient in an arable soil. ISME Journal, 4, 1340–1351.
Rousk J, Brookes PC, B�a�ath E (2011) Fungal and bacterial growth responses to N fer-
tilization and pH in the 150-year ‘Park Grass’ UK grassland experiment. FEMS
Microbiology Ecology, 76, 89–99.
Saarsalmi A, Malkonen E, Piirainen S (2001) Effects of wood ash fertilization on for-
est soil chemical properties. Silva Fennica, 35, 355–368.
Saarsalmi A, Kukkola M, Moilanen M, Arola M (2006) Long-term effects of ash and
N fertilization on stand growth, tree nutrient status and soil chemistry in a Scots
pine stand. Forest Ecology and Management, 235, 116–128.
Saarsalmi A, Smolander A, Kukkola M, Moilanen M, Saram€aki J (2012) 30-year
effects of wood ash and nitrogen fertilization on soil chemical properties, soil
microbial processes and stand growth in a Scots pine stand. Forest Ecology and
Management, 278, 63–70.
Tedersoo L, Bahram M, P~olme S et al. (2014) Global diversity and geography of soil
fungi. Science, 346, 1256688.
Vesterg�ard M, Ekelund F, Winding A, Jacobsen CS, Christensen S (2011) Starved
bacteria retain their size but lose culturability – Lessons from a 5000 years old
undisturbed A-horizon. Soil Biology & Biochemistry, 43, 1379–1382.
Vesterg�ard M, Dyrnum K, Michelsen A, Damgaard C, Holmstrup M (2015) Long-
term multifactorial climate change impacts on mesofaunal biomass and nitrogen
content. Applied Soil Ecology, 92, 54–63.
Waring BG, Averill C, Hawkes CV (2013) Differences in fungal and bacterial physi-
ology alter soil carbon and nitrogen cycling: insights from meta-analysis and the-
oretical models. Ecology Letters, 16, 887–894.
Whitehead AG, Hemming JR (1965) A comparison of some quantitative methods of
extracting small vermiformnematodes from soil.Annals of Applied Biology, 55, 25–38.
Yeates GW, Bongers T, de Goede RGM, Freckman DW, Georgieva SS (1993) Feed-
ing-habits in soil nematode families and genera – an outline for soil ecologists.
Journal of Nematology, 25, 315–331.
Zhalnina K, Dias R, De Quadros PD et al. (2015) Soil pH determines microbial
diversity and composition in the Park Grass experiment. Microbial Ecology, 69,
395–406.
© 2017 The Authors. Global Change Biology Bioenergy Published by John Wiley & Sons Ltd., 10, 320–334
334 M. VESTERG�ARD et al.