static benchmarking the nestle advanced nodal code/67531/metadc693673/m2/1/high... · static...
TRANSCRIPT

STATIC BENCHMARKING OF THE
NESTLE ADVANCED NODAL CODE
Russell D. Mosteller
Los Alamos National Laboratory MS € 3 5 1
Los Alamos, NM 87545
(505) 665-4879 (Voice)
[email protected] (505) 665-3 167 (FAX)
Submitted for Presentation at the Joint International Conference on
Mathematical Methods and Supercomputing for Nuclear Applications October 6- 10, 1997 Saratoga Springs, NY
Preferred Session: Alternative Session:
Validation of Reactor Analysis Methods Benchmarks (poster session; paper will be re-written to conform to the pidlines for poster sessions) - .
. . . .- - . . - .


STATIC BENCI-IMARKINC OF 1'I-IE NESTLE ADVANCED NODAL CODE
Russell D. Mosteller Los Alanios National Laborator)!
MS KSS 1 Los Alamos, NM
mostellei-@l anl. gov (505) 665-4879
ABSTRACT
Results from h e NESTLE advanced nodal code are presented for niultidimensional numerical benclunarks representing four different types of reactors, and predictions from NESTLE are compared with measured data from pressurized water reactors (PWRs). The numerical benclmiarks include cases representative of PWRs, boiling water reactors (SWRs), CANDU heavy water reactors (HWRs), and high-tempei-atui-e gas-cooled reactors (I-ITGRs). The measured PWR data include critical soluble boron concentrations and isothermal temperature coefficients of reactivity. The results demonstrate that NESTLE correctly solves the multigroup diffusion equations for both Cailesian and hexagonal geometries, that i t reliably calculates k,, and reactivity coefficients for PWRs, and that - subsequent to the incorporation of additional thermal- hydraulic models - it will be able to peifoim accurate calculations for the corresponding parameters in BWRs, IWRs, and HTGRs as well.
I. INTRODUCTION
The NESTLE advanced nodal code'.2 was developed at North Carolina State University with support from Los Alamos National Laboratory and Idaho National Engineering Laboratoy. I t employs the nodal expansion method (NEW3 in conjunction wilh a nonlinear iterative method4.' to solve the multigroup neutron diffusion equations in up to four energy groups. Furthermore, it can perform either two-dimensional (2D) or three-dimensional (3D) calculations in either Cartesian or hexagonal geometries. Finally, NESTLE can perform either steady-state or transient calculations. The results presented herein are limited to steady-state cases, however.
Because of i t s flexible geometric capabilities, NESTLE can be used to analy-e several diKerent Qpes of reactors. The first parl of this study compares results from NESTLE with those from other codes for four static numerical benchmarks. Those benchmarks include a pressurized water reactor (PWR), a boiling water reactor (BWR), a CANDU heavy-water reaclor (HWR), and a high-temperature gas-cooled reactor (I-ITGR). The second part compares predictions from NESTLE with measured data from actual PWRs, including critical soluhle boron concentrations and isothermal temperature coeficients of reactivity.
Cumnt ly, Ihennal-hydraulic feedback in NESTLE is based on a homogeneous equilibnum niixtiire (IFEM) model that can account for two-phase flow but implicitly assumes that the pressure is constant. The HEM model IS adequate for PWR steady-state conditions and for some PWR transients. However, additional tlicriiial-hydraulic models need to be incorporated before i t can perforni at-power calculations for other types of reactors.
I I . NUh4ERICAL BENCHMARKS
At the user's option, the nonlinear iterations can be omitted from NESTLE's solution strategy I n such cases, the solution degenerates to the standard finite-dilTerence method (FDM). Although~this feature is of' no pi-actical importance (it IS well known that. in contrast to NEM, FDM requires a veiy line mesh to produce an accuralc solution). it allows the

validation of NESTLE to proceed along two coniplementaiy paths: ( I ) comlxwison of its FDM solution with other FDM soldtions, and (2) comparison of i t s NEM solution wilh rcferencc solutions.
Mesh Spacing (cni)
Code Method Planar Axial k,,
5 10 1.02864 VENTURE FDM
Estrap. Estrap. 1.02903
ARROTTA ANM 20 20 1.02899
FDM 5 10 1.02864
20 20 1.02899
5 10 1.02907 NEM
Four benclunarks from the A ~ ~ O J J ~ C Beiicliiiinrk Book were studied: ( I ) the IAEA PWR case,6 (2) the LIlA BWR casc,’ (3) the CANDU I-IWR case,8 and (4) the HTGR case.9 None of these benclunarks account for variations i n tlicnnal-hydraulic conditions. Consequently, they are ideal tests of NESTLE’S ability to solve the steady-state multigroup diKusion equations correctly.
Peak Relative Power
2.504
2 354
NR’
2 504
2 304
2 340
Alhougli tlie benchmark specifications include both 2D and 3D versions of each of these cases, only results for the 3D cases will he presented herein. The only exception is the 2D HTGR case, because the specifications for the 3D version of that benchmark are incomplete. Results for tlie 2D PWR, BWR, and HWR cases have been presented previously.1° Unless otl~ewise noted, the results presented herein for all oftlie codes escept NESTLE are taken directly from the solutions presented in the Argonne Bciicl~ii~nik Book.
A. IAEA 3D PWR Benchmark
The IAEA PWR benclmark contains I77 assemblies and has octant synmetry. The assembly pitch is 20 cm, which is typical ofcei-tain PWR designs. The height ofthe active core is 340 cni, which is slightly shorter than a typical PWR, and the core contains only two different types of assemblies. Control rods are fully inserted in nine assemblies and patially inserted in four. The benchmark specifications include two-group cross sections for hoth assernbly types and the reflector.
Eigenvalues from NESTLE are compared with those from the VENTURE” and ARROTTA’? codes in Table I, and the corresponding power distributions are presented in Figs. 1 arid 2. VENTURE is based on FDM, while ARROTTA employs the analytic nodal method (ANM).I3 The ARROTTA results are taken from a presentation“ at a meeting of the Amencan Nuclear Society.
Table 1 Results for 3D IAEA PWR Benclmiark
NESTLE
NESTLE’S FDM calculation replicates k , , the assemhly power disti-ihution. and tlie nodal peak power fi-om tlie VENTURE calculation with the saine mesh. In addition, tlie NEM calculation produces die same value of k,, as ARROTTA when the sanie mesh structure is employed. Fuulhermore, the power distributions from tlie NESTLE’?: NEM calculation are in excellent agreement with those fi-orn ARROTTA and from the extrapolated solution from E N T U F E (tlie estrapolated solution was obtained by extrapolating tlie results fiom a series of liner and liner meshes to an infinitely fine mesh). There is only one esception to the generally esccllcnt agreement, and that appears to be a typographical error for one of tlie assembly powers i n the VENTURE solution for the 5-cni s 5-cm s IO-cm mesh

0.729 0.750 d 0.750
VENTURE, cstrapolated mesh VENTURE,, 5-cm s 5-cm s IO-cm mesh
NESTLE (FDM), 5-cm s 5-an s IO-cm mcsh
0.597 0.521 0.52 I
I .397 1.490 I .490
1.178 1.218 1.218
1.31 I I .366 I .366
1.29 1 1.356 1.356
1.193 1.266 I .266
1.28 I 1.378 1.378
0 972 0.923 0.866 I025 0.906 0.790 0 993 0.906 0.790
I181 I .089 1 .ooo 0.71 1 I .207 1.08 I 0.960 0.6 14 I .207 I .08 I 0.960 0.6 I4
I .072 1 .os5 0.976 0.757 I112 1.058 0.944 0.685 1.1 1 1 1 .OS8 0.944 0.685
0.6 I O 0.953 0.959 0.777 0.606 0.963 0.932 0.706 0.606 0.963 0.932 0.705
1.368 I .437 I .437
I I I i I
I .432 1.516 1.516
VENTURE, extrapolated mesh 0.597 0.60 I 0.590 0.600
0.476 0.700 0.476 0.706 0.473 0.699 0.476 0.70 1
1.178 0 972 0.923 1.178 0.972 0.924 1.182 0.975 0.920 1.175 0971 0.923
I .368 1.31 I 1.181 I .089 1.367 1.31 I 1 179 I .087 I .37 I 1.316 I 184 1 .OS8 1.363 1.307 I 179 1.089
1.397 I .432 1.29 1 1.072 1 .os5 1.394 I .429 1.288 I070 I .05 I 1.401 1.436 I .294 1075 I .OS4 1.391 I .426 I .286 1069 I .os5
0.729 1.281 1.422 1.193 0.6 I O 0.953 0.732 1.277 1.419 1.190 0610 0.950 0.733 I .285 I .426 1.198 0 610 0.955 0.727 I .278 1.417 1.190 0 610 0.953
ARROTTA, 20-cm x 20-cm x 20-cm mesh NESTLE 0, 20-cm x 20-cm x 20-cm mcsh
NESTLE (NEM), 5-cm x 5-cm x IO-cm mesh
I .422 1 SO8 1.508
0.61 1 0.6 I7 0.609 0.6 13
0.866 0.872 0.860 0.868
I .ooo 0.71 1 0.998 0.710 0.993 0.703 1 .oo I 0.7 I4
0.976 0.757 0.97 I 0.752 0 970 0.749 0.977 0.760
0.959 0.777 0.954 0.770 0 955 0.770 0.96 I 0.780
0.454 0.678 0.528 0.454 0.678 0.528
Fig. 1. Relative Power by Assembly for 3D IAEA PWR Bcnclunark from FDM Calculations.
-
Fig. 2 Relative Power by Asscmbly for 313 lAEA PWR 13encluiiark
,. I wo additional points are woi’tli noting. First, as a coiiipai-isori of Figs. I and 2 demonstrates, NEM produces much more accuhte power distributions than FDM for tlie same (coarse) mesh Second, the results from the NEM calculation change only sliglitly when a substantially finer mesh is employed.
Mesh Spacing (cm)
Code Mctliod P 1 anar Asia1 kern
7.5 25” 0.99639
15 25‘ 0.99644
7.5 7.5 0.99638
15 I5 0.99627
QUANDRY A N M
NESTLE NEM
B. L M 3D BWR Benchmark
Peak Relative Power
NRb
NRb
3 462
3.210
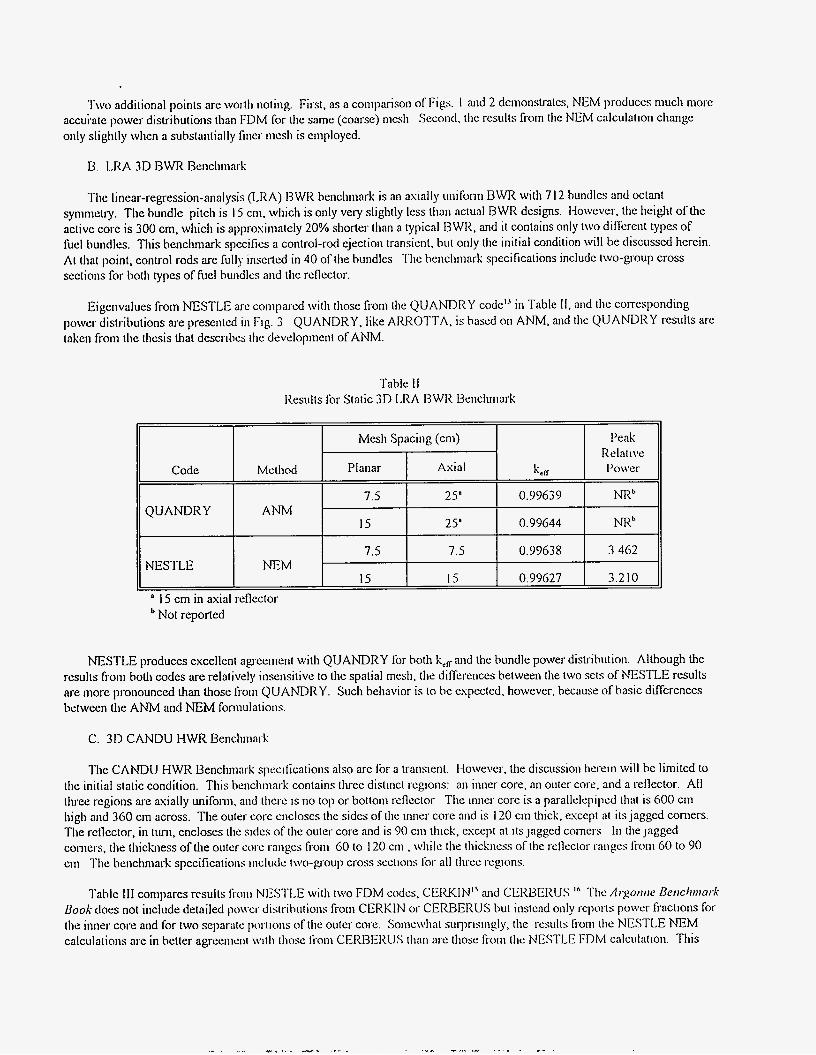
The linear-regi-ession-analysis (1,M) BWR benchmark is an asially unifonn BWR with 7 I2 bundles and octant symmetry. Tlie bundle pitch is I5 cni. which is only very slightly less tlian actual BWR designs. However, the height of Uie active core is 300 cm, which is approsimately 20% shorter than a typical BWR, and it contains only two different types of fuel bundles. This benchmark specifics a control-rod ejection transient, hut only (lie initial condition will be discussed herein. At that point, control rods are fully insei-ted in 40 of the bundles The henclimark specifications include two-group cross seclions for hotti types of fuel bundles and the reflector.
Eigenvalues from NESTLE are compared with those from the QUANDRY code” in Table 11, and the corresponding power distributions are presented in Fig. 3 QUANDRY, like AIWOTTA. is based on ANM, and the QUANDRY results are taken from tlie thesis that describes the development of ANM.
Table I1 Results for Static 3D L M BWR Bencliniark
NESTLE produces excellent agreement with QUANDRY for both k,, and the bundle power distribution. Although the results from both codes are relatively insensitive to the spatial mesh, the differences between the two sets of NESTLE results are more pronounced than those from QUANDRY. Such behavior is to be espected, however. because of basic differences between Uie ANM and NEM fomiulations.
C. 3D CANDU HWR Benchmark
The CANDU HWR Benchmark spccilications also are for a transient. However, the discussion herein will be limited to tlic initial static condition. This benchmark contains tluee distinct regions: an inner core, an outer core. and a rellector. All tluee regions are axially unifomi, and tlicrc is no top or bottom rellector The inner core is a parallelepiped tha1 is 600 a n high and 360 cni across. The outer core encloses the sides of the inner core and is 120 cin thick. escept at its jagged corners. Tlie reflector, in tuni, encloses tlie sides of’the outer core and is 90 ciii thick, except at Its jagged comers I n the jagged coniers, tlie tliichiess of the outer core imges fi-om 60 to I20 cni , wliile tlie tliichiess of tlie rellector ranges fi-om 60 to 90 ciii The henclimark specifications includc two-group cross sections for all three i-egions.
Table 111 compares rcsults l ioni NIZSI’LE with two FDM codcs, CEIKIN” and CERBERUS ’’ Tlic Arpr i r i e Berichark Book does not include detailed p\\-ei~ distributions from CERKIN or CERBERUS bur instead only repoi-ls power fractions for tlie inner core and for two separate poilions of tlic outer core. Somc\vliat suqmsinglp, tlie results fi-om tlic NESTLE NEM calculations are in better agreemciir \vitIi t h e from CERBERUS than are those fiom tlie NESTLE FDM calculation. This

QUANDRY. 7.5-cni s 7.5-cni x 25-cm mesh QUANDRY. I5-cm s 15-cm x 25-cni mesh
NESTLE @EM), 7.5-cm s 7.5-cm x 7.5-cm mesh NESTLE (NEM). 1 5-cm x 15-cm x I 5-cm mesh
0.678 0.678 0.678 0.68 I
I .332 1.329 1.327 1.303
0.843 0.843 0.843 0.843
2.161 2.164 2.156 2.152
0.6 I8 0.6 I8 0.6 19 0.623
I .622 1.623 1.617 I .60 1
0.783 0.782 0.783 0.786
0.848 0.846 0.845 0.828
2.05 1 2.053 2.047 2.048
I .680 I .680 1.676 I .665
0.972 0.973 0.969 0.957
1.852 I .853 I .849
0.864 1.152 0.865 1.151 0.864 1.151 0.866 1.148
1.339 1.338 1.337 1.332
1.422 I .423 1.419 1.415
0.932 0.933 0.930 0.922
0.552 0.553 0.553 0.556
1.022 1.022 1.022 I .020
I .22 I 1.220 1.220 1.217
0.853 0.853 0.852 0.845
0.967 0.966 0.967 0.968
1.173 1.171 1.173 1.172
0.827 0.826 0.826 0.822
0.424 0.424 0.425 0.429
0.492 0.492 0.493 0.497
0.400 0.400 0.40 I 0.407
0.407 0.406 0.408 0.4 I3
0.490 0.490 0.492 0.496
0.940 0.939 0.94 1 0.946
I .28 1 1.28 1 1.282 1.286
0.870 0.867 0.867 0.864
0.924 0.923 0.924 0.922
0.670 0.67 I 0.672 0.678
0.790 0.789 0.792 0.797
1.151 1.149 1.152 1.155
1.660 1.662 1.663 1.68 I
0.440 0.440 0.442 0.448
0.4 I3 0.4 I3 0.4 I5 0.4 19
0.5 12 0.5 I 1 0.5 13 0.5 18
I .384 1.385 1.388 1.404
1.481 I .48 I I .483 1.487
0.6 I2 0.6 I2 0.6 I5 0.628
Fig. 3. Relative Power by Bundle for 3D LRA BWR Benchmark
behavior suggests that the finer mesh that CERBERUS uses near tlie fuel/reflector interface significantly improves the accuracy of tlie results. Overall, however, there is excellent agreement between the NEM calculations and the reference solutions froin CERKIN and CERBERUS.
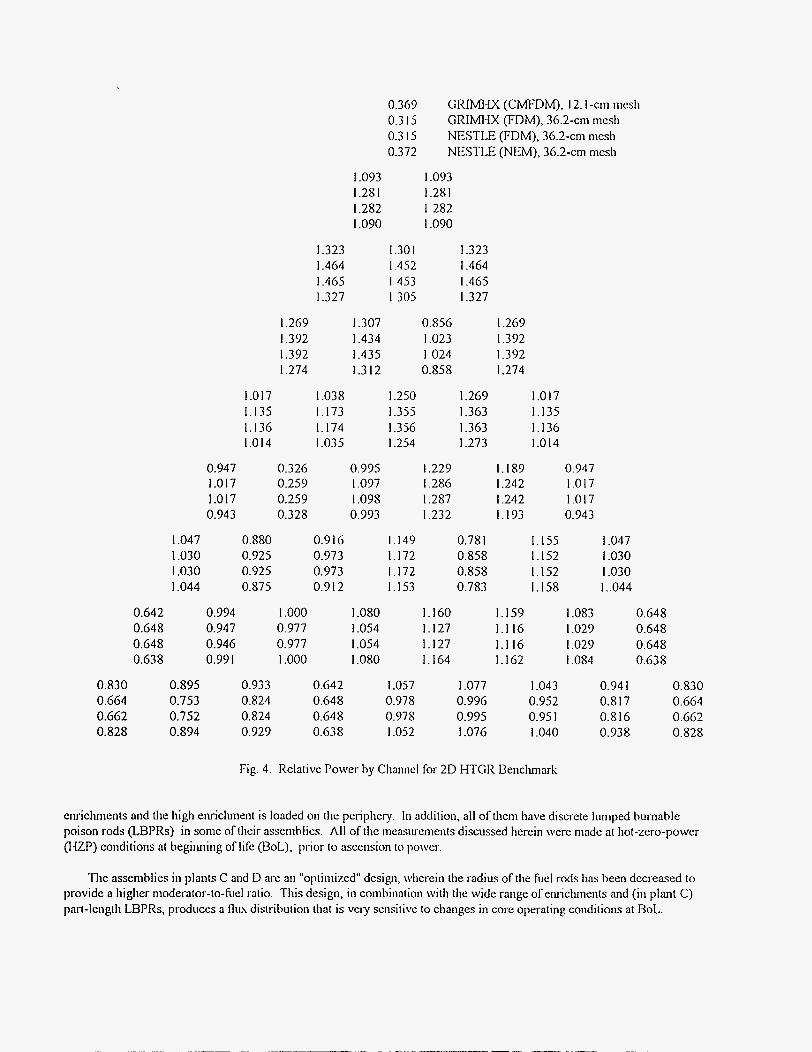
D. 2D I-ITGR Benclunark
The 2D HTGR problem is a sextant-symmetric NTGR wi th 247 fuel channels and 180 reflector channels The specifications for this benchmark differ from [lie others discussed above in two important respects: [lie geometry is hexagonal rather than Cartesian, and the cross sections are specified for four energy groups rather than 1\40
Table IV compares the eigenvalues obtained from NESTLE w i t h those fiom the VENTURE and GRIMHX" codes, and Fig. 4 compares the channel power distributions from NESTLE and GRIMHX. The Aigoiirie Beric/rninr.k Book does not include detailed power distributions froin VENTURE.
GRIMI-IX can solve the multigroup dilfiision equations wit11 either standard FDM or a higher-order coarse-mesh FDM (CMFDM)." The FDM option in NESTLE produces a value for ken- that i n is excellent agreement wi th those from the othcr-

Iablc I l l licsults for 311 CANDU I-IWIi Iknchmark
Method
FDM
FDM
FDM
NEM
Code
Power Fraction
Mesh Spacing (cm)
Planar Asia1 L I T Front and Back Sides Inner Core
NR" NR I .00355 0.27.52 0.3 I06 0.4 142
30/60" 60 1.00356 0.2752 0.3 106 0.4 142
30 60 100315 0.2739 0 3099 0.4 I62
30 60 I 00357 0.2743 03114 0.4 143
15 60 I00351 0.2742 0.3 I I I 0.4 147
Outer Core, Outer Coi-c,
-
CERKIN
Code
VENTURE
CERBERUS
Mesh s~'"cll~g
MeUiod (cm) k,,
36 2 I . 12725
Estral] 1.1 1835 FDM
NESTLE
NEM 36 2 1 . 1 1852
a Not rcpoi-ted 30 cni near fueI/reflector interface, 60 ciii eIsewIiere
I . 12725
CMFDM 1.1 1863
FDM 36 2 I . 12722
GRIM IX
FDM calculations, and the NEM option in NESTLE produces a valuc foi- kcr that in is excellent agreement with those extrapolated fiom VENTURE and calculated using CMFDM. Fiu-theniioi.e. the FDM and NEM power dish-ihutions from NESTLE are in excellent agreeiiienr with those from the FDM and CMFLIM options, respectively. in GRIMHX. Althougli the values of k,, extrapolated fi-oni VENTURE calculation arid obtained from the C W D M GRIMI-IX calculation differ slightly. the dilTerence is sufficicntly sinal1 that the power distribution tli;it wwld be extrapolated fioiii VENTURE should bc quite siniilar to the one calculatcd with CMI-LIM.
111. MEASURED PWR DATA
Althougli i t does no[ identify tlicni by iiariie, Ref I9 provides reasonably detailed dcsciiptions oftlie core dcsign aid loadiiig pattein for the first cycle o f f h PWRs. A succiiict x u i i i i i i a i ~ oftlie h s t cycle of each of those plants is provided i n
Tahle V All four have "out-iri" loading patterns wherein the cciitral Iwi-tioii of the core is a chcckerboard of thc two lowei-
0.369 GRIMI-LX (CMI-DM), 12. I -cm mesh 0.3 I5 GRIMI-LX (FDM), 36.2-cn1 mesh 0.3 I5 NESTLE (FDM), 36.2-cm mesh 0.372 NESTLE @EM), 36.2-cm mesh
1.093 I .28 I I .282 1.090
I .093 I .28 I 1282 I .090
I .30 I 1.323 1.452 I .464 1453 I .465 I305 1.327
0.856 I .023 1 024 0.858
1.323 1.464 1.465 I .327
I .307 I .434 1.435 1.312
I .269 1.392 1.392 I .274
1.269 I .392 1.392 1.274
1.017 I .038 . I73 . I74 .035
I .250 1.355 1.356 I .254
1.269 I .363 I .363 I .273
1.017 1.135 1.136 1.014
.I35
. I36
.O I4
0.326 0.259 0.259 0.328
0.947 1.017 1.017 0.943
0.995 I .097 I .098 0.993
1.189 1.242 1.242 1.193
,229 .286 .287
1.232
0.947 1.017 1.017 0.943
I .047 1.030 1.030 I .044
0.880 0.925 0.925 0.875
0.9 16 0.973 0.973 0.9 I2
1.149 1.172 1.172 1.153
0.78 1 0.858 0.8.58 0.783
1.155 1.152 1.152 1.158
1.047 1.030 1.030 1 ..044
0.642 0.648 0.648 0.638
0.994 0.947 0.946 0.99 1
I .ooo 0.977 0.977 I .ooo
1.080 1 .OS4 I .OS4 1.080
1.160 1.127 1.127 1.164
1.1.59 1 . 1 I6 1 .1 16 1.162
.083
.029
.029
.084
0.648 0.648 0.648 0.638
0.895 0.753 0.752 0.894
I .043 0.952 0.95 1 1.040
0.830 0.664 0.662 0.828
0.933 0.824 0.824 0.929
0.642 0.648 0.648 0.638
1.057 0.978 0.978 I .052
1.077 0.996 0.995 I .076
0.94 1 0.817 0.816 0.938
0.830 0.664 0.662 0.828
rig 4. Relative Power by Channel for 2D HTGR Benclunark
e~uiclmments and the high enrichment is loaded on the periphery. In addition, all of them have discrete lumped burnable poison rods (LBPRs) in some of their assemhlies. All of the measurements discussed herein were made at hot-zero-power (I-IZP) conditions at beginning of life (BoL), prior to ascension to po\\w.
The assemblies i n plants C and D are a11 "optiniized" design, wliereiii the radius of the fuel rods has been decreased to provide a higher moderator-to-fuel ratio. This design, in comhination with the wide range of eiuichments and (in plant C) pait-length LBPRs, produces a flu1 distribution that is veiy sensitive to clianges in core operating conditions at BoL.

Table V Plant Characteristics
Rated Power Number of Type of Type of Plant OVlWt) Assemblies Assemblies LBPR
B 3250 I93 15x 15 Full Length
C 2775 157 17x 17 Part Length D 341 1 I93 17x 17 Full Length
F 2560 217 1 4 x 14 Part Length
Fuel Enriclmicnt ( d o )
2.248,2.789,3.292
I .6 ,2 4,3.1 I .6,2.4.3.1
1.9.2 3 , 2 8
The cross sections for NESTLE were not generated as part of this study. Instead, cross sections that had been generated previously2' for ARROTTA simply were translated into NESTLE input format. Because of die similarity in the cross- section rcprcsentation employed by [lie two codes, no approsimations were required for h e translation.
Control-Rod Ternpei.ature Balks
("I.') Inserted
None
Db
547 c', D
Bb, C, D
A', B, C, D
557 None
None
557 D
C, D None
532 5.6.7
2, 3 .4 , 5.6.7
The NESTLE predictions for critical soluble boron concentrations are compared with the measured values in Table VI. The agreement is excellent: the largest diflerciice between die measured concentration a id that predicted by NESTLE is 38 PPM. and tlic average difference is only 9 PPM, which is comparahle to the uncertainty in most measurements of PPM at I-EP. The consistent agreement in [lie critical soluble boron concentration with difl'crent control-rod banks inserted also demonstrates that NESTLE accurately predicts control-rod woith. Furthemiore, the values predicted by NESTLE are very similar to those predicted by ARROTTA, which suggests that much of the difference in critical PPM may be due to the cross sections rather than the code itself.
Critical Soluhle Boron Concentration
Measured ARROTTA' NESTLE
1350 1314 1312
1348 - 1310
1203 - 1170
10x5 - 1063
940 - 914
1189 1190 I187
975 997 996
902 933 932
816 84 1 837
952 95 I 953
844 813 823
606 580 605
Table VI Measured and Predicted Critical Soluble Boron Concentrations
Plant
B
C
D
F
' Values taken from Ref. I9 200 Steps Withdrawn (Fully Withdra\vn at 220 Steps)
e 180 Steps Wilhdrawn (Fully Withdrawn at 220 Steps)

The NESTLE predictions for isotliennal temperature cocliicicnts of reactivity (ITCs) are compared with the nieasured values in Table VII. Once again. the values predicted by NESTLE are in escellent agreement with the measured ITCs and with Uiose predicted by ARROTTA. The largest difference between the ineasureinents and the corresponding NESTLE predictions is only 2.3 pciid°F, and the average difference is only 0.4 pcnl/"F. The agreement with the nicasurernents from Plants C and D is par-ticularly good, given the sensitivity of the flux distribution at these conditions. (Because of the large diffcrenccs in enrichment and Uie out-in loading pattern, relatively srnall changes in the l lus distribution can cause significant changes in Uie ITC.)
Plant
B
C
D
F
'Values
Table VI1 Measured and Predicted I lCs at BoL
Control-Rod Critical Boron ITC (pctd°F)
Measured ARIIOTTA' Teniperature Banks Concentrat ion
(OF) Inselled (PPW D" I348 -1.3 f 0 . 3 -1.6
C', n 1203 -5.2 f 0.3 -5.6
Bh. C, D I085 -9.0 f 0.9 -9. I 547
A', B, C, D 940 -10.3 f 1.7 -10.7
557 None 1 I89 3.5 1.3
None 975 -1.7 -3.2
557 D 902 -2.8 -4.3
C, D 816 -8.0 -8.9
None 952 0.8 -0.8
532 5.6.7 844 -4.1 -5.4
2 ,3 ,4 , 5 ,6 ,7 606 - 10.4 -10.3 taken from Ref 19
NESTLE
1 V. CONCLUSIONS
The results from the numerical benchmarks demonstrate that NESTLE FDM calculations replicate the FDM calculations froni other FDM codes almost identically and that the NESTLE NEM calculations produce escellent agreement with reference solutions. As expected, the NESTLE NEM calculations produce accurate results with spatial meshes that are much larger than those required for accurate FDM calculations. Furlliemiore:. NESTLE produces accurate results not only for the I W R , BWR, and CANDU benclunarks in Cailesian geonietiy but also for the HTGR henclunark in liesagonal geomeby.
NESTLE also has been showm to predict critical soluble boron concentrations, ITCs, and control-rod wadi that are In
excellent agreement with measured data fi-om a variety of PWRs. TIie agreement with the corresponding values fi-om ARROTTA demonstrates that, given the saiiie input, the t \ 4 ~ codes prodlice very similar results for actual PWRs This behavior is, of course, consistent with their results for the IAEA P WR benchmark.
In summary, NESTLE has been shown to predict the behavior of a varicty of PWRs vc~y accurately at static conditions In addition, its ability to produce accurate results for numerical hcnchmarks representing BWRs, CANDlls, and I-ITGRs

provides assurance that, after steady-state thcrnial-hydraulics inodules for those types of reactors arc installed in NESTLE, i t can be used for calculations for tlicni as well.
ACKNOWLEDGMENT
The cross sections for these comparisons with measured PWR data were obtained fi-om [lie Elccti-IC Power Rcscarch Institute (EPRI). Special thanks are due to J. Chao and L. Agec of EPRI, who approved their use, and to I, D Eisenhart ofS Levy, Inc., who supplicd the actual data.
REFERENCES
I
2.
3.
4.
5.
6.
7.
8
9.
IO.
I I .
12.
P. J. Turinshy, R. M. K. AI-Chalahi, P. Engrand, 14. N. Sarsour, F. X. Faure, and W Guo, “NESTLE: A Few-Group Neutron Diffusion Equation Solver Utilizing the Nodal Espansion Method for Eigenva!ue. Adjoint, Fised-Source Steady-State and Transient I’roblems,“ Idaho National Enginecring Laboratory repoit EGG-NRE- 1 1406 (June I 994)
P. J. Tuiinshy, R. M. K. A-Chalabi, P. Engrand, 14. N. Sarsour, F. X. Faure, and W. Guo, “Computer Code Abstract: NESTLE,” Niicl. Sci. h g . , 120, pp. 72-73 (May 199s)
14. Fiimeniann, F. BCM~WIQ. and M. R. Wagncr’, “lnteiface Current Teclmiques for MiiltidimensionaI Reactor Calculations,” Atottikerricrgrc, 30, 123 (1 977).
P. R. Engrand, G. I. Maldonado, R. AI-Chalahi, and P. 1. Turinshy, “Non-Linear Iterative Strategy for NEM. Refinement and Extension,” T r a m Ani. N i d S‘oc., 65, 22 1 (June 1992).
K. S. SmiUi, “Nodal Method Storage Reduction by Nonlinear Iteration,” Trans. Atti. hfircl. Soc., 44, 265 (June 1983).
R. R. Lee, D. Mencley, B. Micheelson, D. R. Vondy, M. R. Wagner, and W. Werner, “Benclmiark Source Situation 1 1 -A I : Tluee-Diniensional LWR Problem, (also 3D IAEA Problem),“ in Atgoiitic Code Cerilet-: Benclininrk Ptddeni Book, Argonne National Laboratoiy report ANL-74 16, Supplenient 2 (June 1977).
W. Maurer and W. Werner, “Benclmiark Source Situation 14-A2: Super Prompt-Critical Transient: Three-Dimensional, Two-Group DiKision Problem, wiUi Adiabatic Heatup and Doppler Feedback in Thermal Reactor,” in Argontie Code Ceiiler: Beticlittinrk Probleiii Book, Argonne National Lahoratoiy report ANL-74 16, Supplement 3 (December 198s).
R. A. Judd and B. Reuben, “Benclunark Source Situation I7-A2: Tlree-Dimensional Kinetics Benchmark Problem in a Heavy Water Reactor,” in Aigorine Code Cenfer: Betic/ininrk Problem Book, Argoruie National Laboratoiy repoit ANL-74 16. Supplement 3 (December 1985).
R. G. Steinkc. “Benclunark Source Situation 9-A I : Fcw-Group, Two-Dimensional, I-lesagonal Geometry HTGR Problem,” in At-gomie Code Cetitei-: Bettc1ittini.k Frobletti Book, Argonne National Laboratory report A N - 7 4 16, Supplement 2 (June 1977).
R. D. Mosteller. “Validation of NESTLE Against Static Reactor Benclmiark Problems.” Trotis. Ani. Nrrcl. Soc., 73, 3 I O (November 1995)
D. R. Vondy. 1‘. B. Fowlcr, and G. W. Cunninghani. “VENTURE: A Code Block for Solving Multigroup Neutronics Problems Applying the Finite-DiKerence Diflusion-Theoiy Approsiniation to Neutron Transport,” Oak Ridge National Laboratoiy rcpoi-t ORNL-5062 (October 1975).
L. D. Eiseidiart, "ARROTf A-0 I : An Advanced Rapid Reactor Opei-ational Transient Analysis Computer Code,“ Electric Power Research Institute report NP-7375 (Octobcr I99 I ) .

13. K. S. Smith. “hi Analytic Nodal Method for Solving the Two-Group, Multidimensional. Static and Transicnt Neutron DiRiision Equations,” N. E. and M. SC. diesis, Massachusetts Instituk of Teclinology (March 1 979).
14. L. D. Eiseilhail, W. J. Eich, and R. D. Mostella-, “Static 7’lirec-Diinensionnl ARROTI‘A Benclunxking,” Ttntis. Am/. Niicl. Soc.. 50, 540 (Novemher 1985).
15. A. P. Baudouin, “CERKIN - A Multi-Dimensional Reactor Kinetics Code,“ Chalk River Laboratories report CRNL- 1696 (Scptember 1977).
16. B. Rouhen, “Improvements in Numerical and Computational Techniques for CANDU Neutronics,” ftifertinfiotinlJoirt~in~ 0/nk~thht ig arid Sinrirlafioti, 1, No. 3 , 11. 207 ( 1 98 1 )
I 7 I-I. C. I-loneck and J. W. Stewail, “Simultaneous Line Over-rclasalion in I-Iesagonal Lattice,” Pt.oceehigs o/ilie Nnfrotrol Toj)icalA4ee1itig oti A‘ew D e ~ e l ~ p t i i ~ t i f ~ in Rencfor- Plysics ntid .SIiiel~/itig. U. S. Atomic Energy Conunission report COW-72090 I , pp. 253-265, (September 1972).
18. 14. L. Dodds, Jr., 14. C. I-Ioneck, and D. E. I-Iostetler, “Coarse-Mesh Method for Two-Dimensional Mised-Lattice Din’usion TIieoiy Calculations,” Tintis. Atti. Niicl. Soc.. 21, 223 (June I 9 7 9
19. R. D. Mosteller, M. J. Anderson, and L. D. Eiseilhar?, “Validating ARROTTA for a PWR at Beginning of Core Life,“ Electric Power Research Institute report NSAC- 135 (January 1989).