statewide mobility performance measures team meeting webinar june 17, 2013
TRANSCRIPT

Statewide Mobility Performance Measures
Team Meeting
WebinarJune 17, 2013
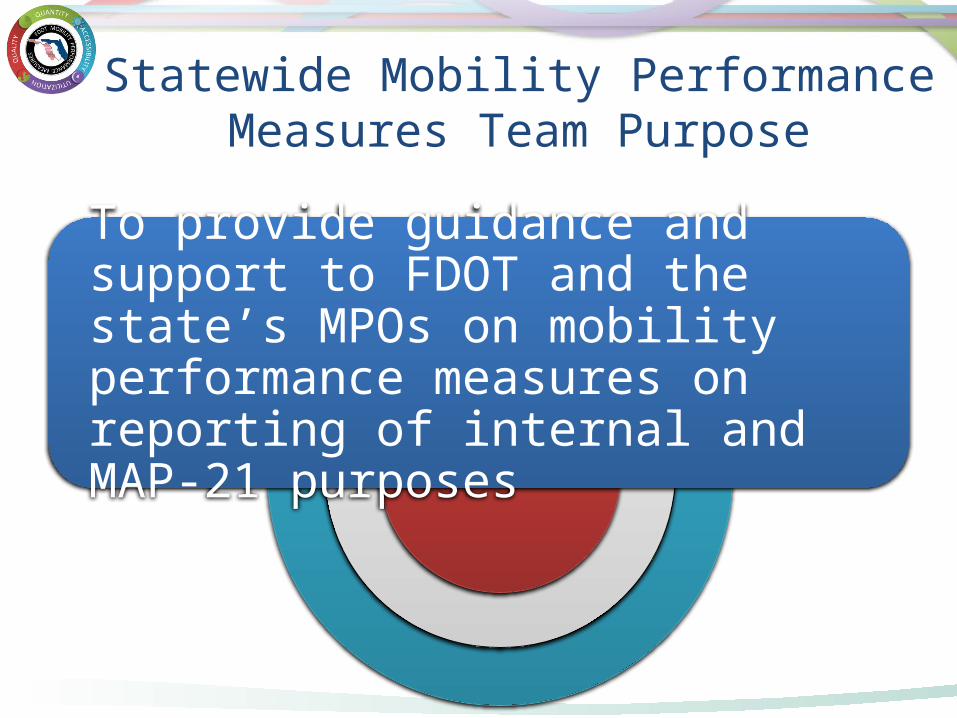
Statewide Mobility Performance Measures Team Purpose
To provide guidance and support to FDOT and the state’s MPOs on mobility performance measures on reporting of internal and MAP-21 purposes

Agenda1:00p Welcome and Introductions McLeod
1:15p Status of MPM Program (update since last meeting)
McLeod
1:30p Travel Time Reliability Presentation McLeod
2:00p Break
2:15p MPM Contract Vandervalk
2:30p Follow Up From Last Meeting
2:45p Next Meeting
3:00p Adjourn

Welcome and Introductions

Status of MPM
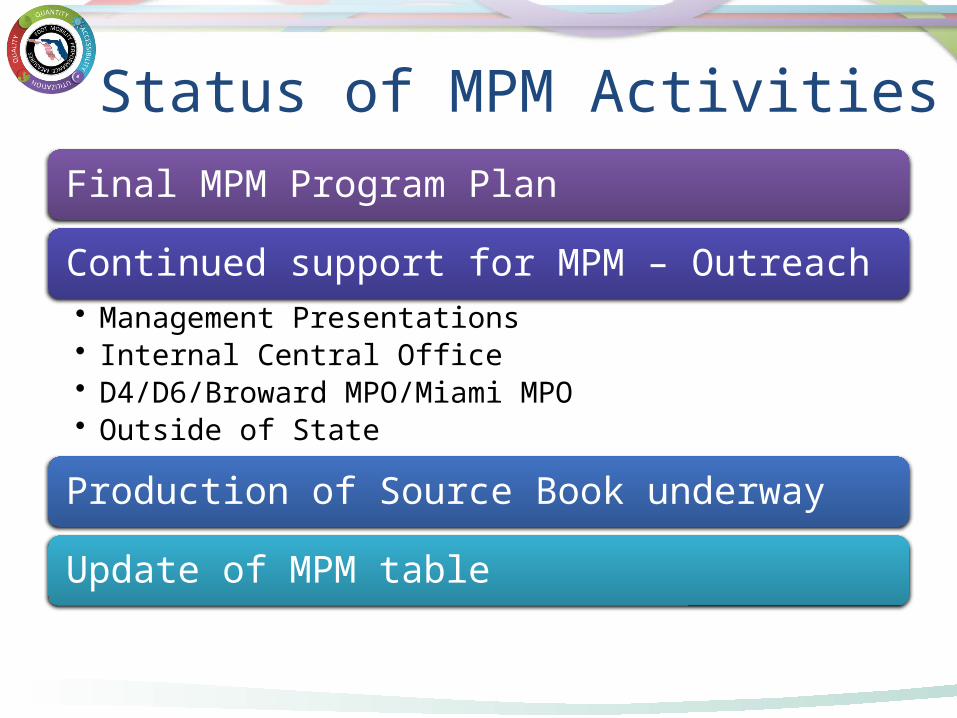
Status of MPM Activities
Final MPM Program Plan
Continued support for MPM – Outreach• Management Presentations• Internal Central Office• D4/D6/Broward MPO/Miami MPO• Outside of State
Production of Source Book underway
Update of MPM table
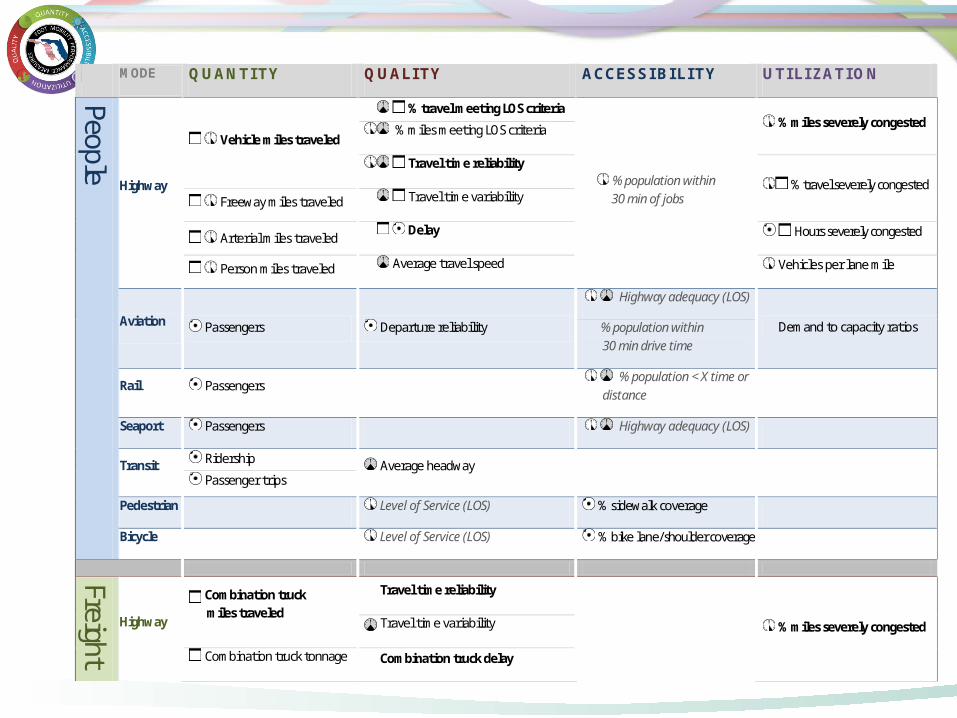
MODE QUANTITY QUALI TY ACCESSI BI LI TY UTI LI ZATI ON
People Highway
Vehicle miles traveled
% travel meeting LOS criteria
% population within 30 min of jobs
% miles severely congested % miles meeting LOS criteria
Travel time reliability
% travel severely congested Freeway miles traveled Travel time variability
Arterial miles traveled Delay Hours severely congested
Person miles traveled Average travel speed Vehicles per lane mile
Aviation Passengers Departure reliability
Highway adequacy (LOS)
Demand to capacity ratios % population within 30 min drive time
Rail Passengers % population < X time or
distance
Seaport Passengers Highway adequacy (LOS)
Transit Ridership Average headway Passenger trips
Pedestrian Level of Service (LOS) % sidewalk coverage
Bicycle Level of Service (LOS) % bike lane/shoulder coverage
Freight
Highway
Combination truck miles traveled
Travel time reliability
% miles severely congested Travel time variability
Combination truck tonnage Combination truck delay

QUANTITY QUALITY UTILIZATION
People Vehicle miles traveled
% travel meeting LOS criteria
% miles severely congested Travel time reliability
Delay
Freight Combination truck miles traveled
Travel time reliability % miles severely congested
Combination truck delay
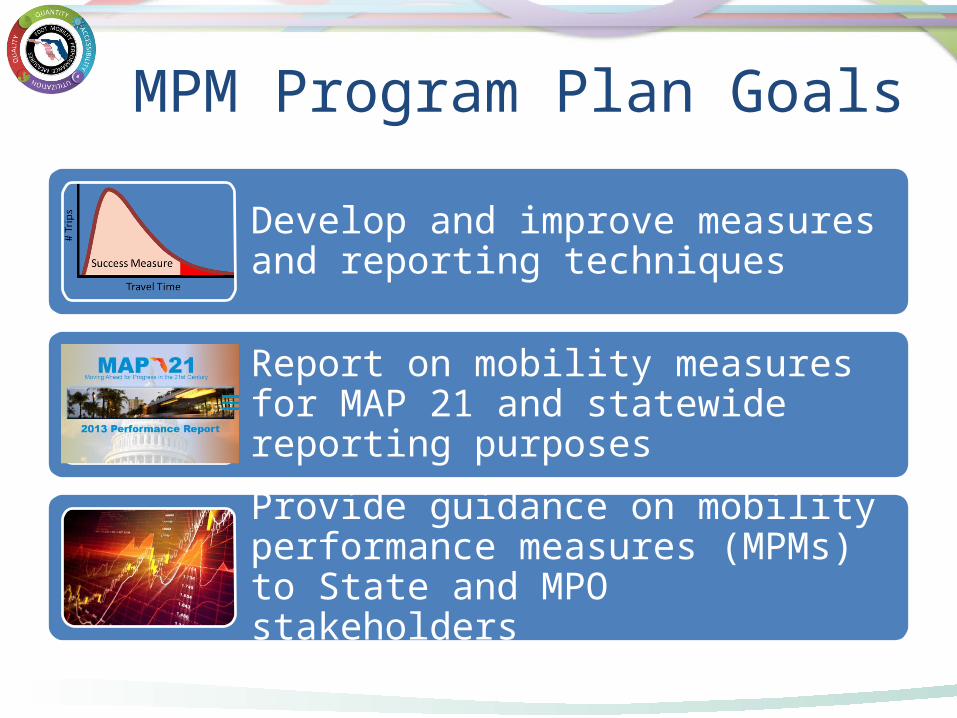
MPM Program Plan Goals
Develop and improve measures and reporting techniques
Report on mobility measures for MAP 21 and statewide reporting purposes
Provide guidance on mobility performance measures (MPMs) to State and MPO stakeholders

Stakeholders understand the measures and how they can be used in decision making
Monitoring the MPM Program
Stakeholders are asking for the dataReaction
Learning
Multimodal Performance Measures Source Book is widely used and cited AND Modal offices and districts include defined Mobility Performance Measures in their publications
Behavior

Monitoring the MPM Program
Output • Measures are used in evaluating
alternatives, programming/prioritizing projects within Florida
Outcome • The MPM program makes a
difference in improving mobility
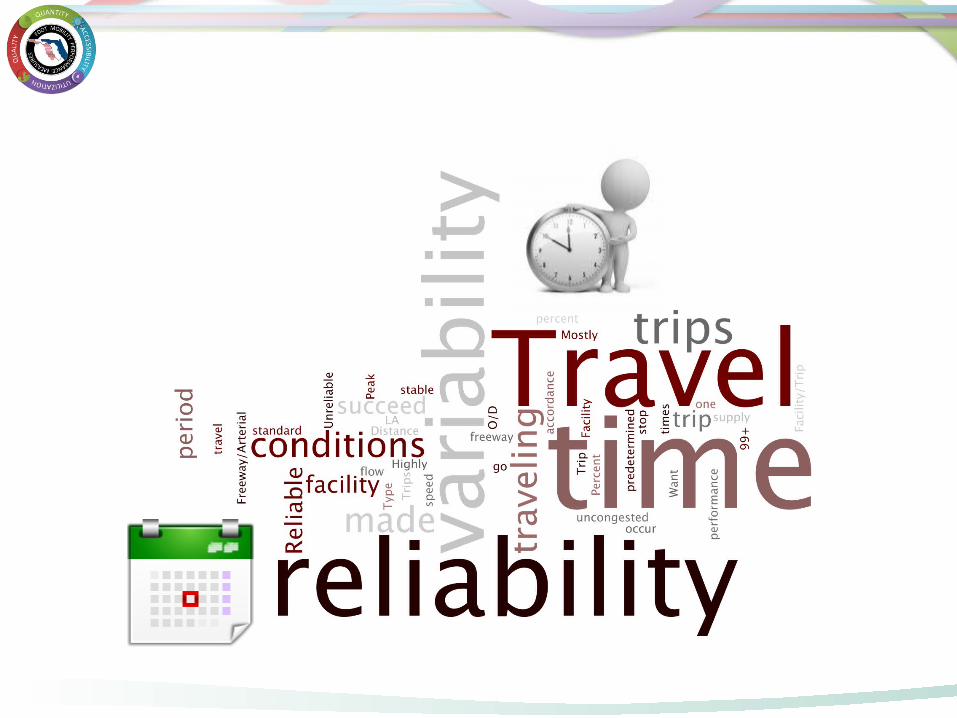
Travel Time Reliability
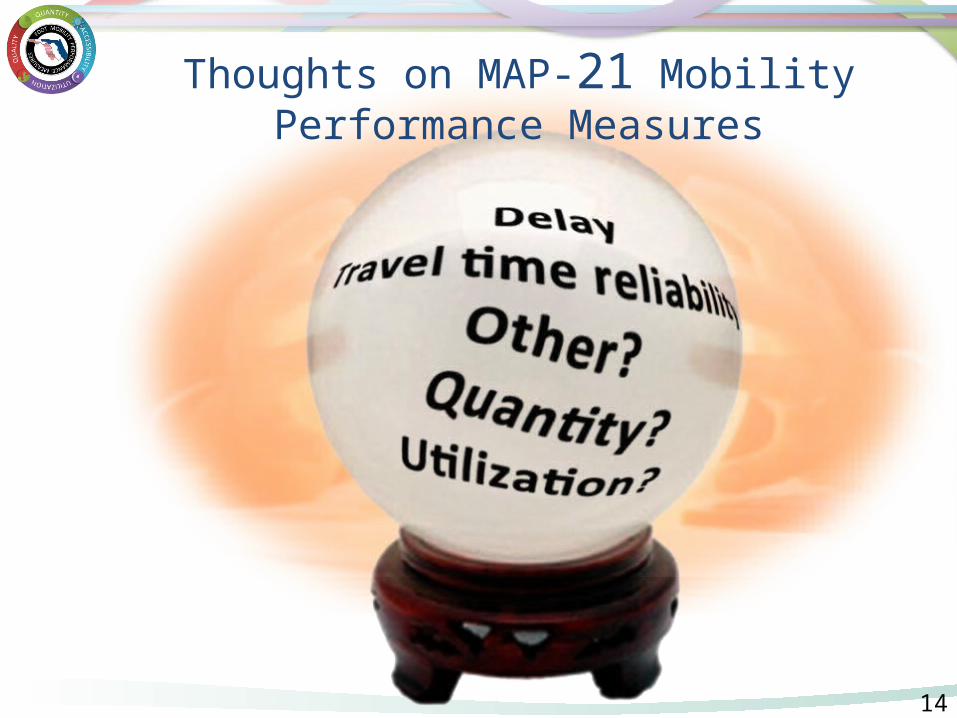
•Delay•Travel time reliability•Other?
Quantity?Utilization?
Thoughts on MAP-21 Mobility Performance Measures
14

There are two general types of travel time reliability performance measures:
Percent of trips that “succeed”
Comparison of variability in travel
times
Travel Time Reliability#
Trip
s
Travel Time
Success Measure
# Tr
ips
Travel Time
Free flow time80th
percentile95th
percentile
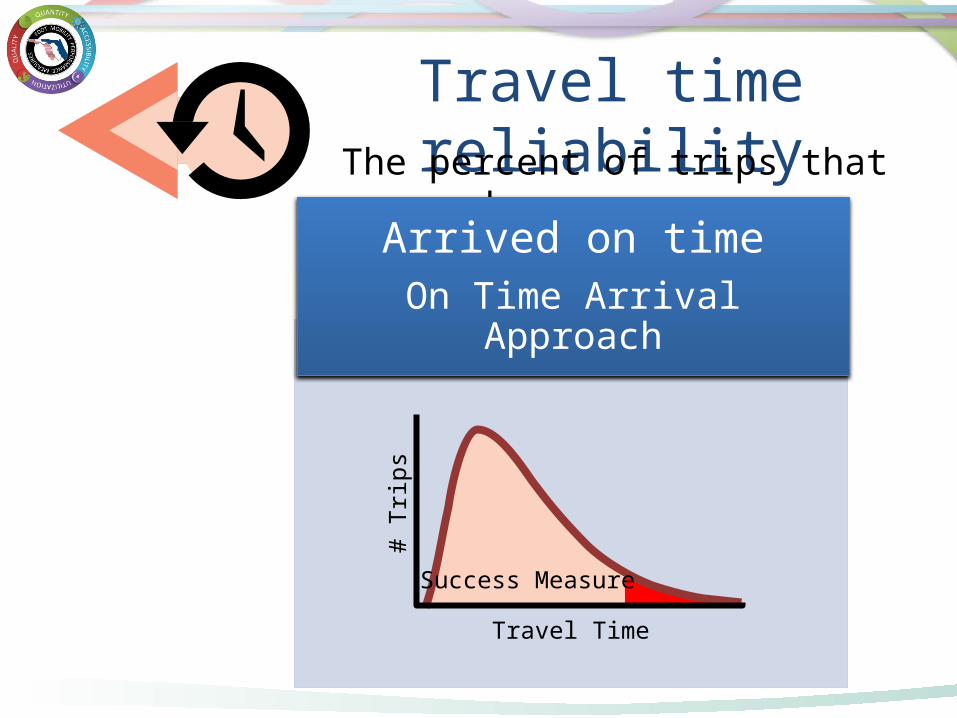
Travel time reliabilityThe percent of trips that succeed …
# Tr
ips
Travel Time
Success Measure
Arrived on timeOn Time Arrival Approach
On-Time Reliability
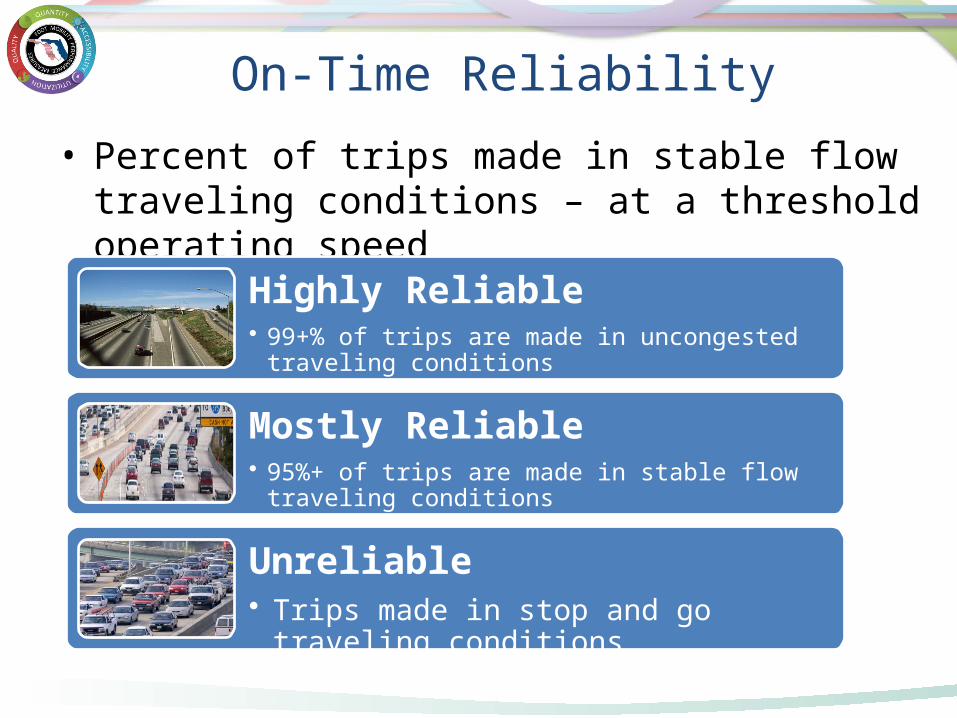
• Percent of trips made in stable flow traveling conditions – at a threshold operating speed
Highly Reliable• 99+% of trips are made in uncongested traveling
conditions
Mostly Reliable• 95%+ of trips are made in stable flow traveling conditions
Unreliable• Trips made in stop and go traveling conditions
19
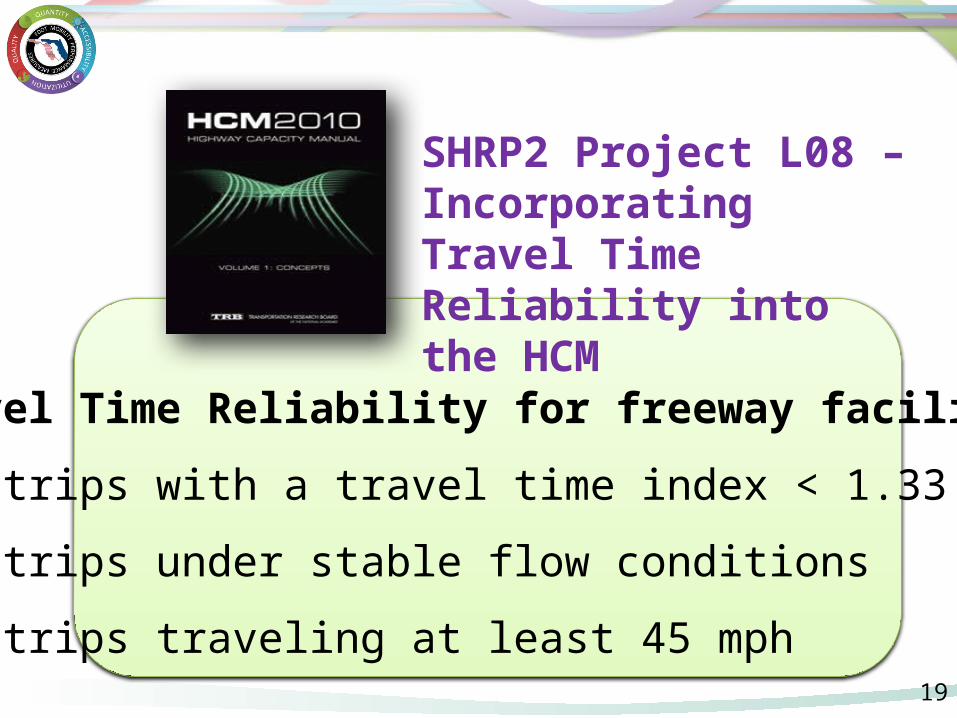
Travel Time Reliability for freeway facilities
• % trips with a travel time index < 1.33
• ~ trips under stable flow conditions
• ~ trips traveling at least 45 mph
SHRP2 Project L08 – Incorporating Travel Time Reliability into the HCM
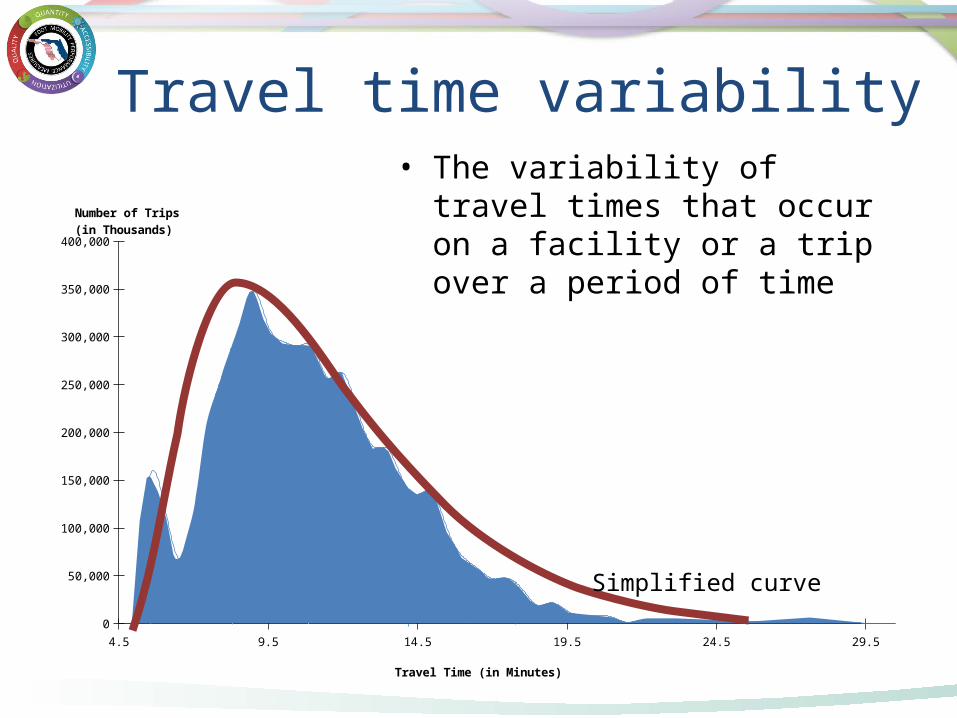
Travel time variability• The variability of travel times that
occur on a facility or a trip over a period of time
4.5 9.5 14.5 19.5 24.5 29.50
50,000
100,000
150,000
200,000
250,000
300,000
350,000
400,000
Travel Time (in Minutes)
Number of Trips (in Thousands)
Simplified curve
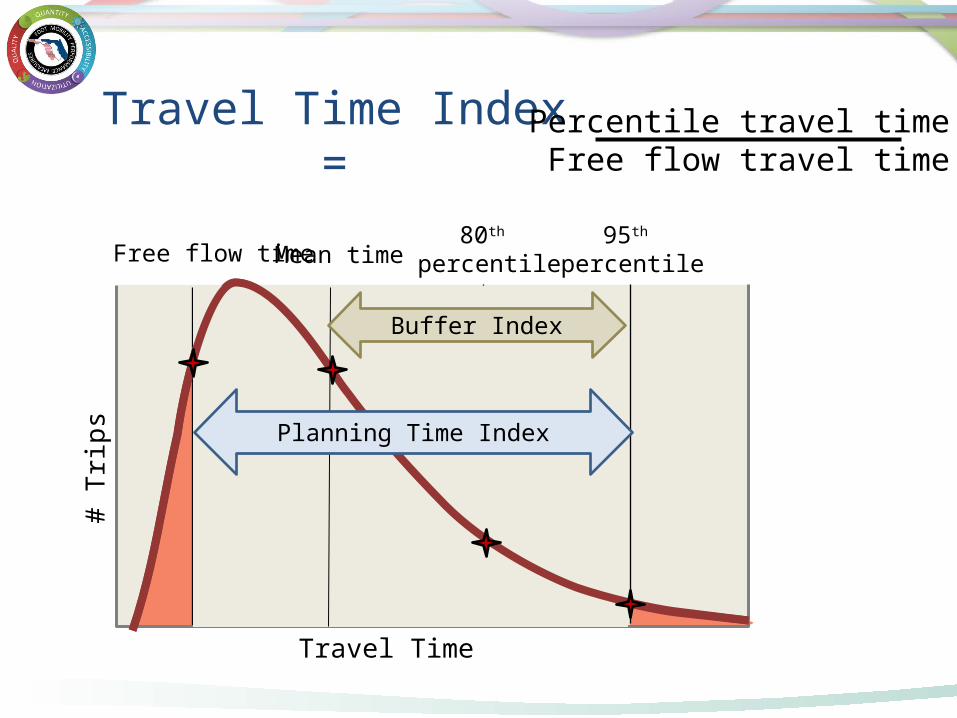
Travel Time Index = Percentile travel time Free flow travel time
# Tr
ips
Travel Time
Free flow time80th
percentile95th
percentile
Planning Time Index
Buffer Index
Mean time
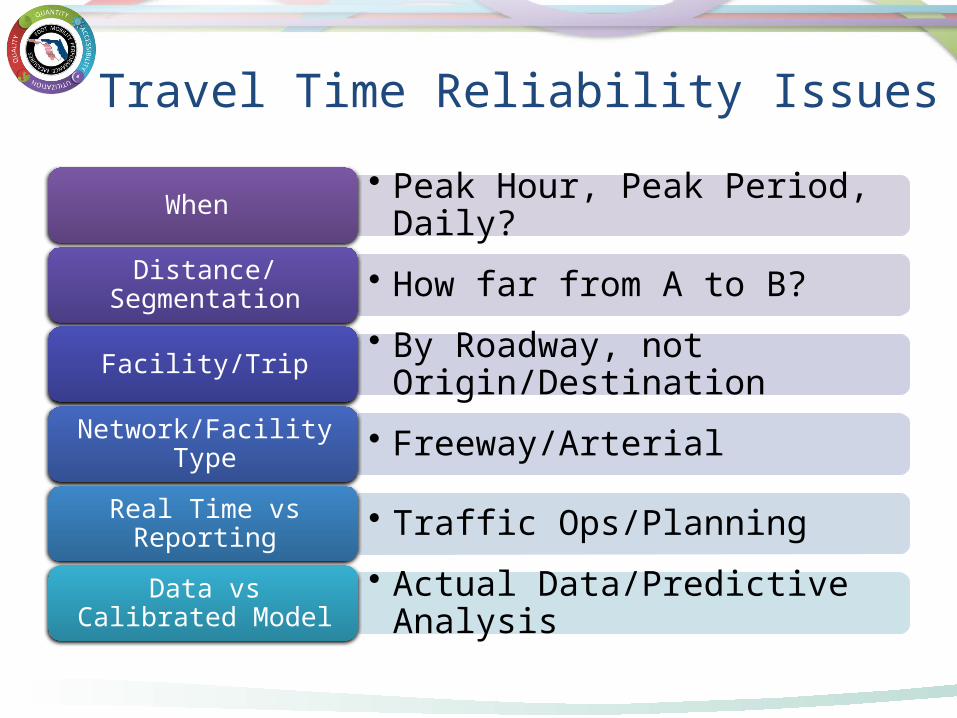
Travel Time Reliability Issues
• Peak Hour, Peak Period, Daily?When
• How far from A to B?Distance/Segmentation
• By Roadway, not Origin/DestinationFacility/Trip
• Freeway/ArterialNetwork/Facility Type
• Traffic Ops/PlanningReal Time vs Reporting
• Actual Data/Predictive AnalysisData vs Calibrated Model
23
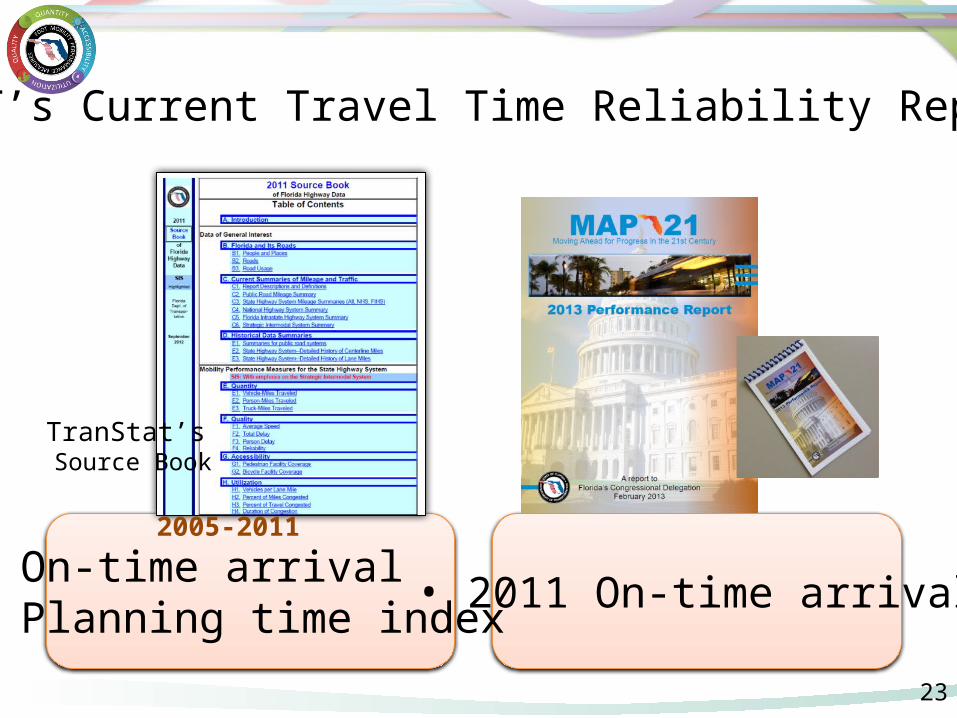
TranStat’s Source Book
FDOT’s Current Travel Time Reliability Reporting
• On-time arrival• Planning time index
2005-2011
• 2011 On-time arrival

Travel Time Reliability Meanings
Thoughts?24
Break
MPM Contract
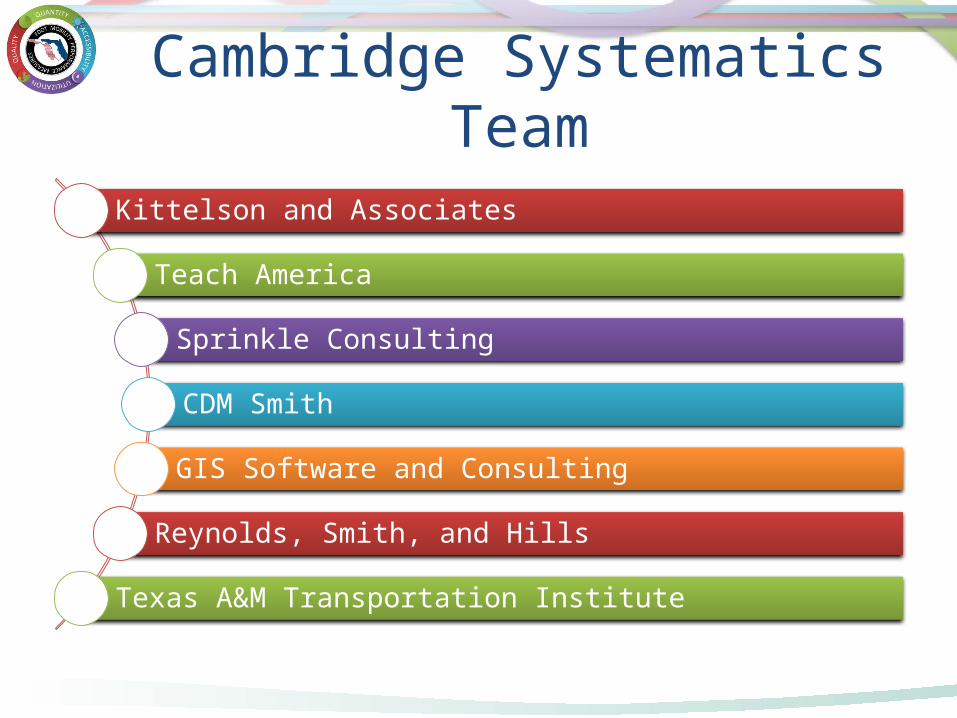
Cambridge Systematics Team
Kittelson and Associates
Teach America
Sprinkle Consulting
CDM Smith
GIS Software and Consulting
Reynolds, Smith, and Hills
Texas A&M Transportation Institute

1. Support/Develop Mobility Performance Measures Program
2. Report and Analyze Measures
3. Bicycle and Pedestrian Mobility
4. Research and Reliability
5. Other/Future
Major Task Topics
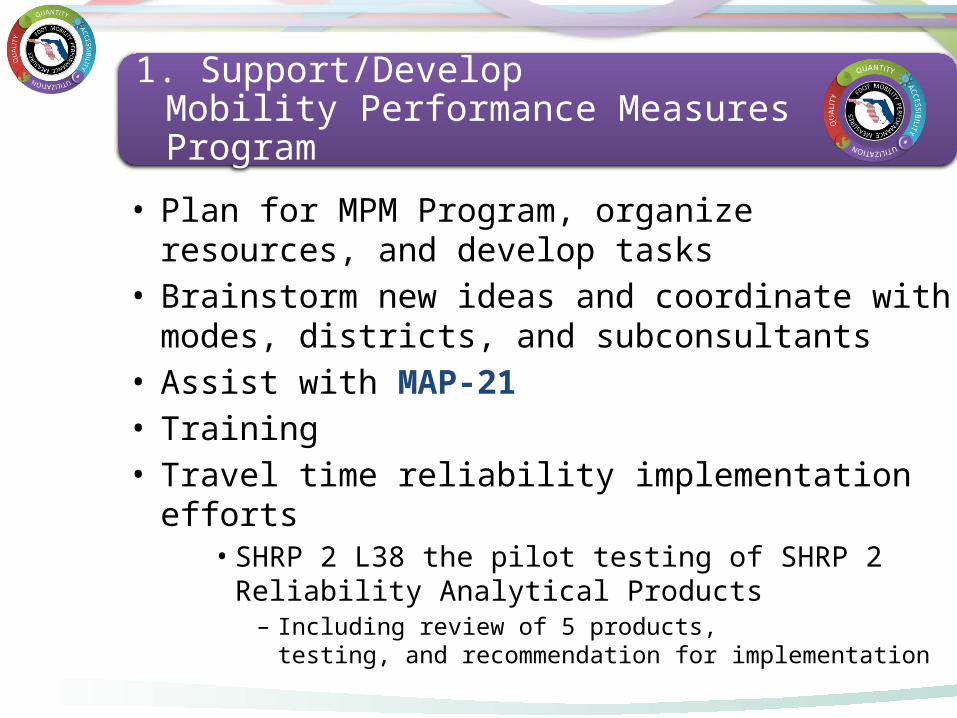
Support Mobility Performance Measures Program
• Plan for MPM Program, organize resources, and develop tasks
• Brainstorm new ideas and coordinate with modes, districts, and subconsultants
• Assist with MAP-21• Training• Travel time reliability implementation efforts
• SHRP 2 L38 the pilot testing of SHRP 2 Reliability Analytical Products– Including review of 5 products,
testing, and recommendation for implementation
1. Support/Develop Mobility Performance Measures Program
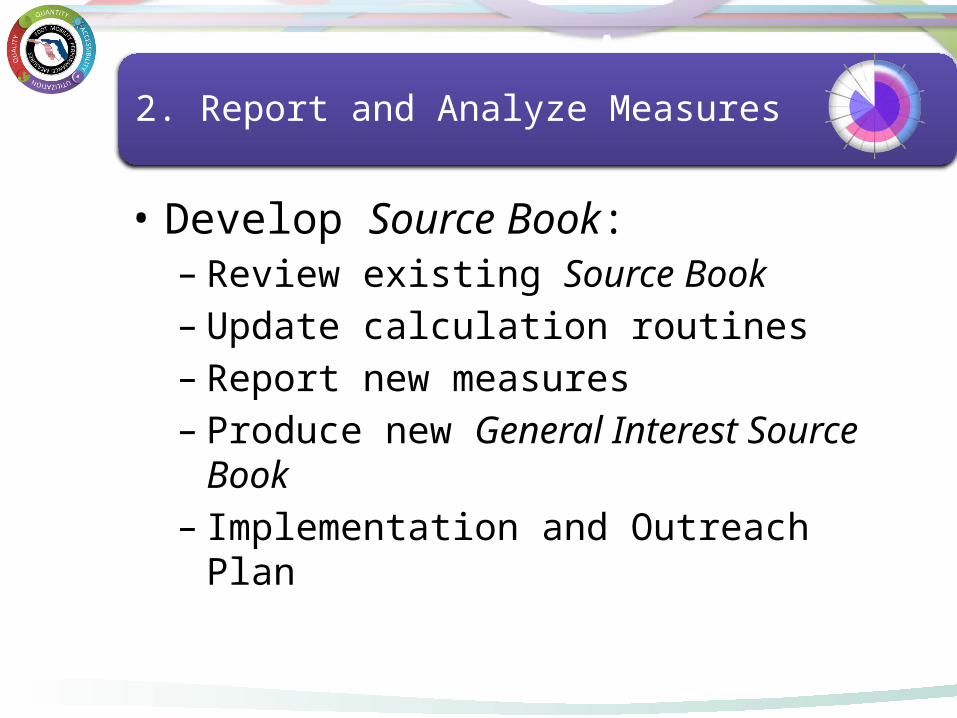
Report and Analyze Measures
• Develop Source Book:– Review existing Source Book– Update calculation routines– Report new measures– Produce new General Interest Source Book– Implementation and Outreach Plan
2. Report and Analyze Measures

Report and Analyze Measures
• Acquire mobility performance measures’ data:– Assist in the coordination of multimodal
databases– Summarize mobility performance measure
data and provide documentation of the MPM Program
– Provide data analysis through converting data into useful information
2. Report and Analyze Measures

Bicycle and Pedestrian Mobility
• HCM bike LOS model– Update methodology to calculate bike LOS in
the 2010 HCM• Bicycle and pedestrian LOS evaluation– Evaluate bike & Ped LOS on the SHS in
urbanized areas• Sidewalk and bike lane inventory– Account for all bike lanes and sidewalks for
the entire SHS
3. Bicycle and Pedestrian Mobility
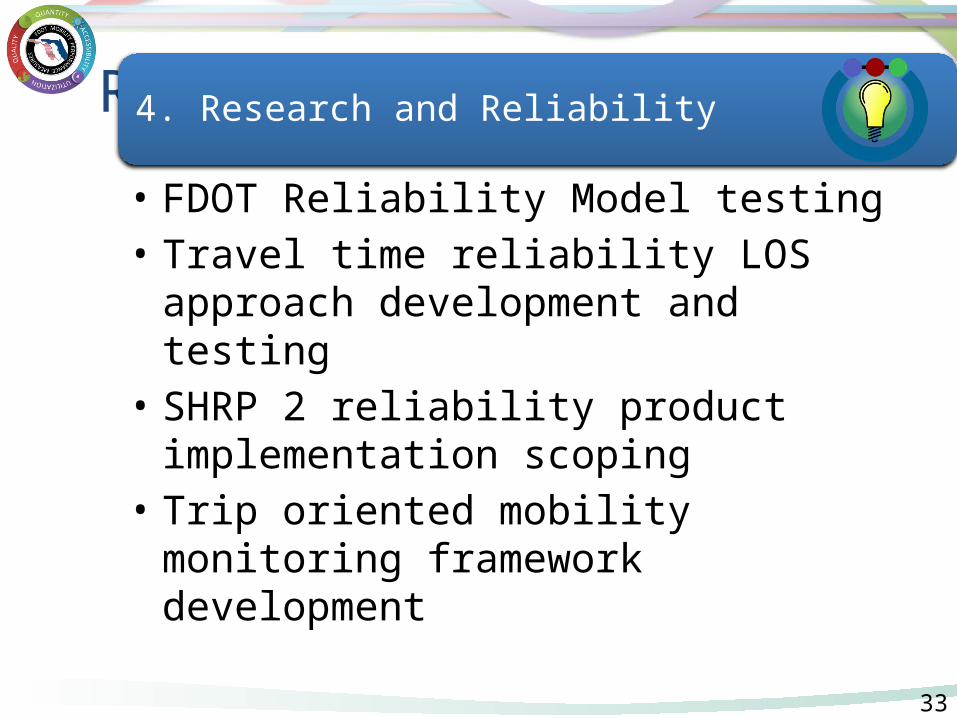
Research and Reliability
• FDOT Reliability Model testing• Travel time reliability LOS approach
development and testing• SHRP 2 reliability product implementation
scoping• Trip oriented mobility monitoring
framework development
33
4. Research and Reliability
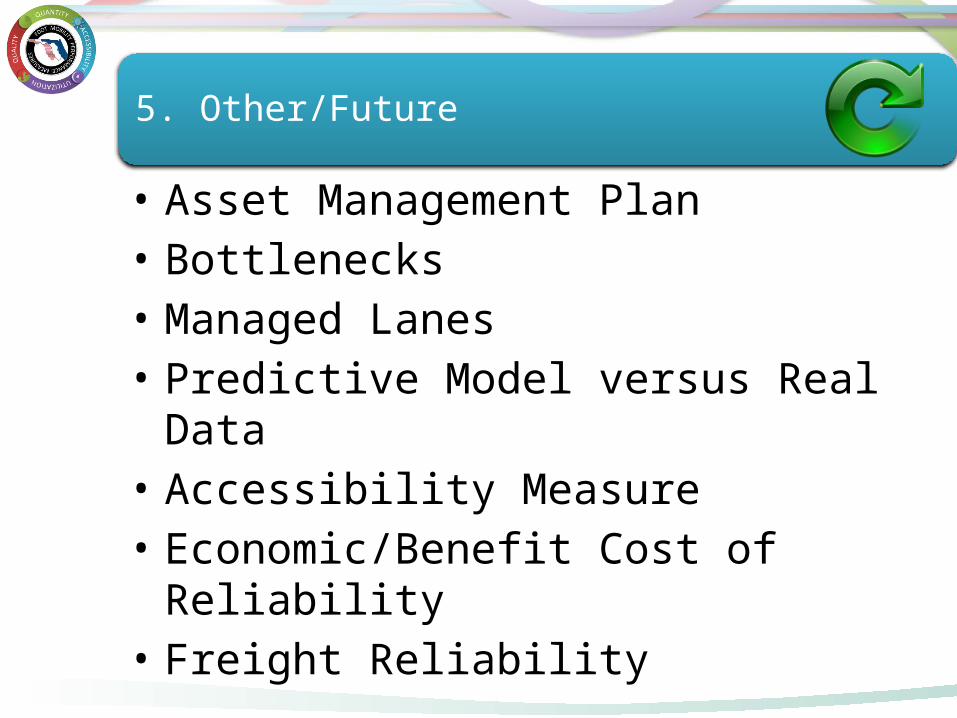
Other/Future Topics
• Asset Management Plan• Bottlenecks• Managed Lanes• Predictive Model versus Real Data• Accessibility Measure• Economic/Benefit Cost of Reliability• Freight Reliability
5. Other/Future

Follow up from Last Meeting
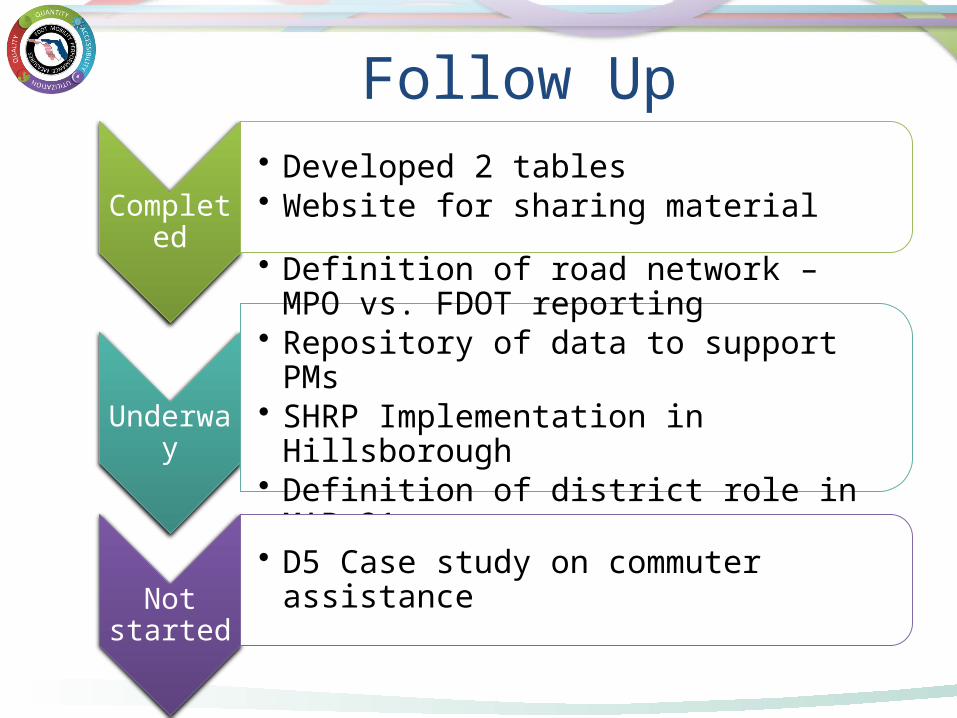
Completed
• Developed 2 tables• Website for sharing material
Underway
• Definition of road network – MPO vs. FDOT reporting
• Repository of data to support PMs• SHRP Implementation in Hillsborough• Definition of district role in MAP 21
Not started
• D5 Case study on commuter assistance
Follow Up

Discussion/Roundtable

Next Meeting
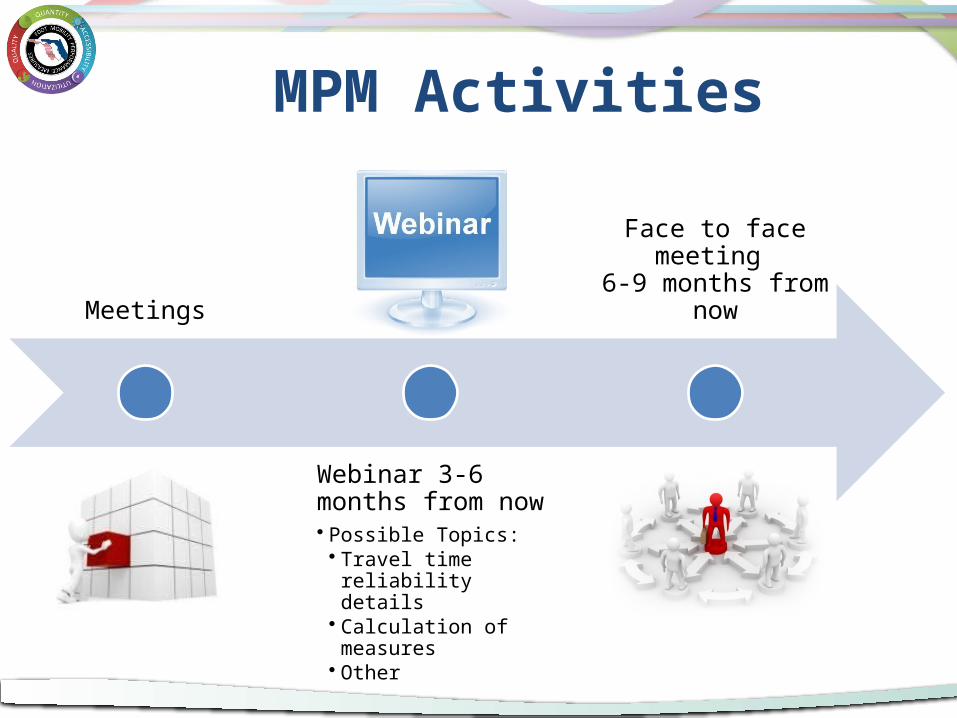
MPM Activities
Meetings
Webinar 3-6 months from now• Possible Topics:• Travel time reliability
details• Calculation of measures• Other
Face to face meeting 6-9 months from now