statewide aquatic remote sensing program in wisconsin
TRANSCRIPT

Statewide Aquatic Remote Sensing Program in Wisconsin
Steven Greb and Daniela Gurlin Wisconsin Department of Natural Resources
Terra and Aqua MODIS data. Space Science and Engineering Center (SSEC) atthe University of Wisconsin‐Madison
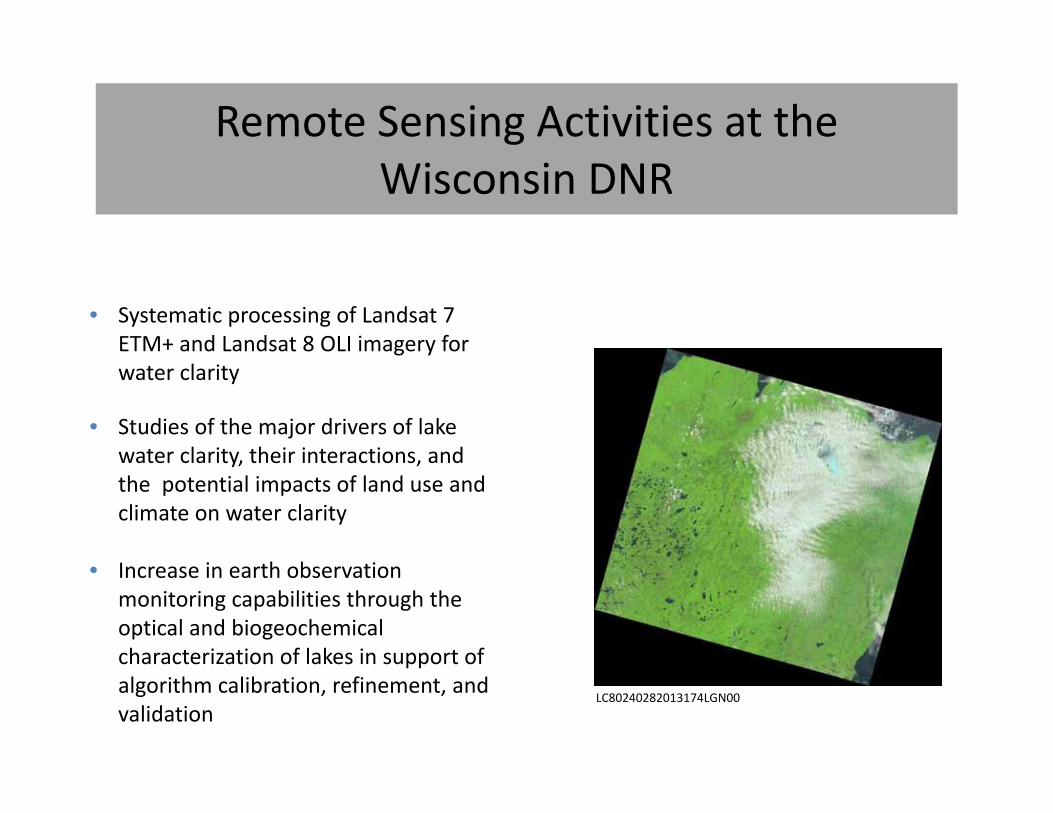
• Systematic processing of Landsat 7 ETM+ and Landsat 8 OLI imagery for water clarity
LC80240282013174LGN00
• Increase in earth observation monitoring capabilities through the optical and biogeochemical characterization of lakes in support of algorithm calibration, refinement, and validation
• Studies of the major drivers of lake water clarity, their interactions, and the potential impacts of land use and climate on water clarity
Remote Sensing Activities at the Wisconsin DNR

Landsat 8 OLI and TIRS (02/11/2013)
• Scene size 170 x 180 km• Repeat cycle 16 days
OLI• Eight multispectral
bands and one panchromatic band
• Pixel size 30 m for multispectral bands and 15 m for panchromatic band
TIRS• Two thermal bands• Pixel size 100 m
Table from Dekker, A.G. & Hestir, E. L. (2012) Evaluating the Feasibility of Systematic Inland Water Quality Monitoring withSatellite Remote Sensing. CSIRO: Water for a Healthy Country National Research Flagship
Remote sensing activities at the Wisconsin DNRRemote Sensing Activities at the Wisconsin DNR
NASA photo
Space.com image

Model 3:y = 1.1096x - 3.6371
R2 = 0.7612
Model 8:y = 1.1229x - 3.5878
R2 = 0.752
-2
-1.5
-1
-0.5
0
0.5
1
1.5
2
2.5
0 1 2 3 4 5 6
Blue:Red Spectral Radiance Ratio (TM1/TM3)
Natu
ral l
ogar
ithm
of S
ecch
i Dis
k Tr
ansp
aren
cy (m
eter
s)
Water Clarity Estimates from Landsat imagery

Systematic processing of satellite imagery for water clarity
2014 water clarity estimation• 86 satellite images• 32 data processing steps• 12 image mosaics for algorithm
development• 760 ground truth measurements for
algorithm development• 10703 water clarity estimates• 4294 Water Bodies

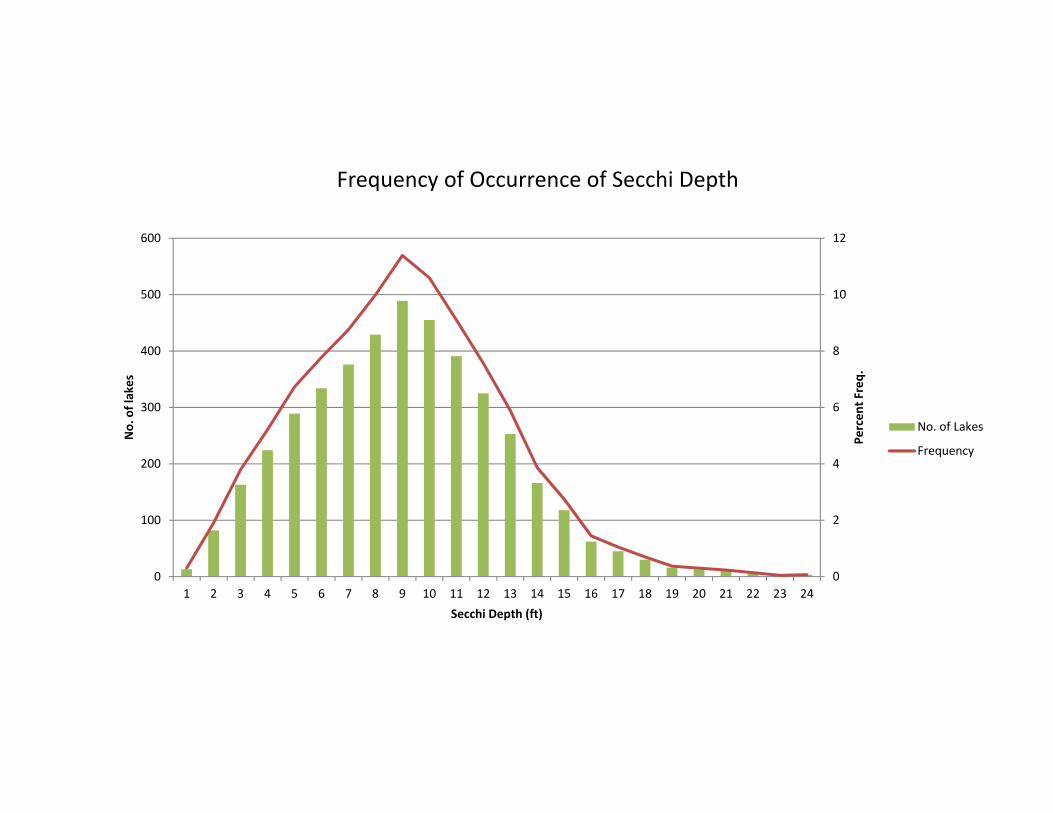
0
100
200
300
400
500
600
1 2 3 4 5 6 7 8 9 10 11 12 13 14 15 16 17 18 19 20 21 22 23 24
No. of lakes
Secchi Depth (ft)
No. of Lakes
Number of Lakes by Secchi Depth (1 ft. Intervals)Year 2014
0
2
4
6
8
10
12
0
100
200
300
400
500
600
1 2 3 4 5 6 7 8 9 10 11 12 13 14 15 16 17 18 19 20 21 22 23 24
Percen
t Freq.
No. of lakes
Secchi Depth (ft)
No. of Lakes
Frequency
Frequency of Occurrence of Secchi Depth

0
2
4
6
8
10
12
0
100
200
300
400
500
600
1 2 3 4 5 6 7 8 9 10 11 12 13 14 15 16 17 18 19 20 21 22 23 24
Percen
t Freq.
No. of lakes
Secchi Depth (ft)
No. of Lakes
Frequency
Normal Dist.
Frequency of Occurrence of Secchi Depthw/ fitted Normal Distribution
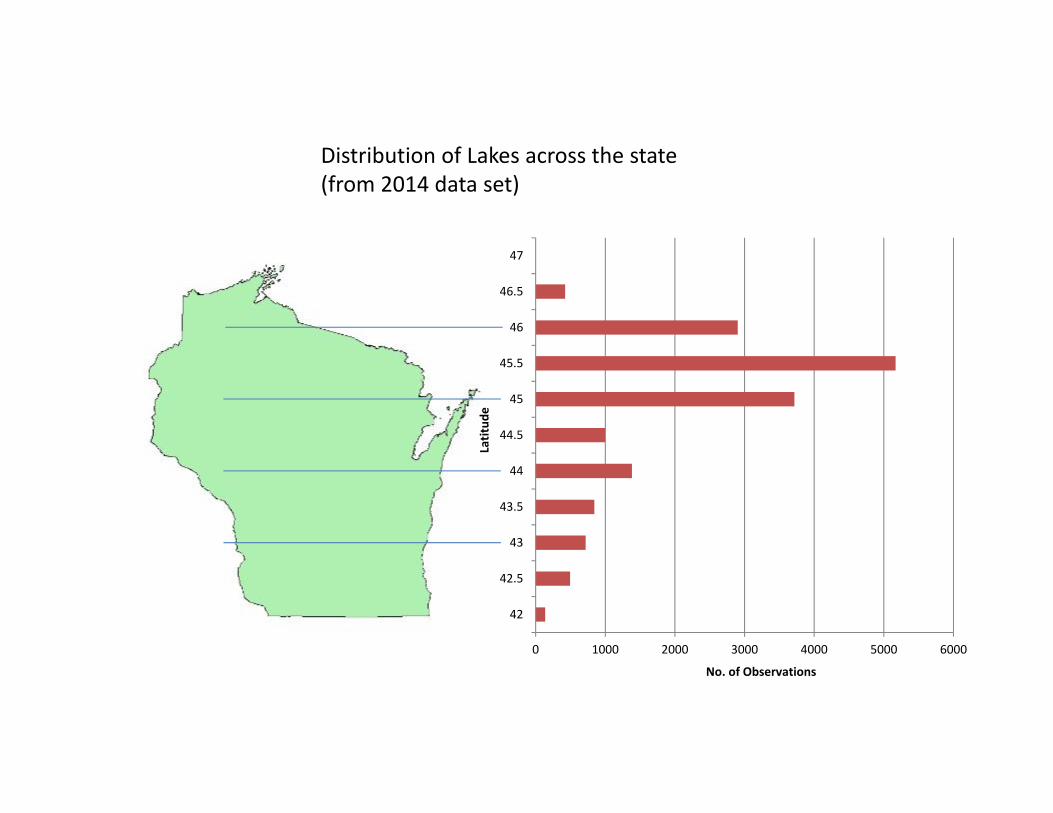
0 1000 2000 3000 4000 5000 6000
42
42.5
43
43.5
44
44.5
45
45.5
46
46.5
47
No. of Observations
Latitud
e
Distribution of Lakes across the state(from 2014 data set)

0
2
4
6
8
10
12
43 44 45 46 47
Secchi Dep
th(ft)
Latitude
Secchi (ft)
Secchi Depth South to North

The Best and the Worst

0
5
10
15
20
25
30
35
0 5000 10000 15000 20000 25000 30000
Secchi Dep
th (ft)
Lake Size (acres)
Relationship of Secchi to Lake Depth

0
5
10
15
20
25
30
35
0 5000 10000 15000 20000 25000 30000
Secchi Dep
th (ft)
Lake Size (acres)
Relationship of Secchi to Lake Depth
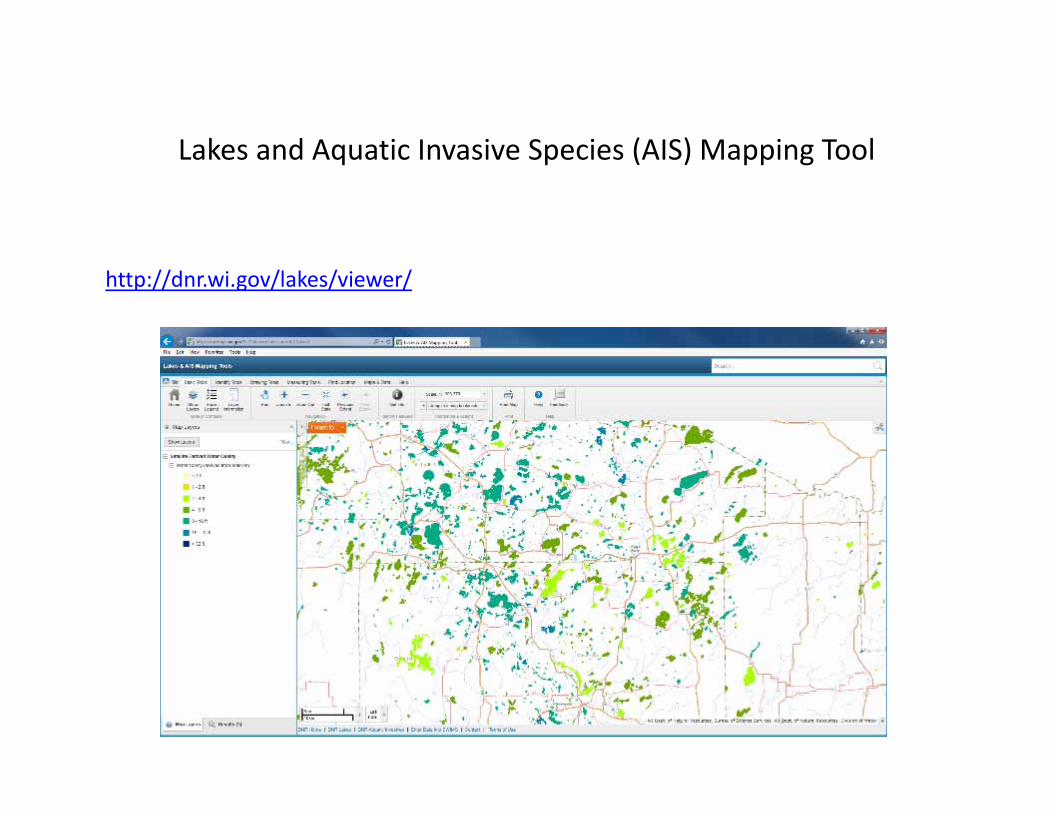
Lakes and Aquatic Invasive Species (AIS) Mapping Tool
http://dnr.wi.gov/lakes/viewer/

Optical and Biogeochemical Characterization of Lakes
Field and laboratory measurements• Water temperature, dissolved oxygen,
conductivity, and Secchi depth• Reflectance• Water color and turbidity• TSS, ISS, and OSS• Absorption and backscattering coefficients
Field data collection• Field data collection in summer and fall 2014‐
15 for algorithm development • 24 lakes in Wisconsin• Color samples collected by CBM volunteers
Collection of reflectance spectra with CDAP‐2

Guerschman, et al., 2015
Remote sensing of water quality

Guerschman, et al., 2015
0.000
0.001
0.002
0.003
0.004
0.005
400 450 500 550 600 650 700 750
R rs, sr
‐1
Wavelength, nm
ChlorophyllsCarotenoidsNAPCDOM
Chlorophyll‐aPhycocyanin
0.000
0.001
0.002
0.003
0.004
0.005
400 450 500 550 600 650 700 750
R rs, sr
‐1
Wavelength, nm
ChlorophyllsCarotenoidsNAPCDOM
Chlorophyll‐a
Trout Lake 06/17/2014
Rainbow Flowage 06/17/2014
Remote sensing of water quality


0
50
100
150
1 3 5 7 9 11 13 15 17 19 21 23 25
Color (PC
U)
Water Color
05101520253035
1 3 5 7 9 11 13 15 17 19 21 23 25
Turb (N
TU)
Turbidity
0.0050.00100.00150.00200.00250.00300.00
1 3 5 7 9 11 13 15 17 19 21 23 25
Chl‐a
(ug/l)
Chl‐a
0
20
40
60
020
4060
80100
120140
051015202530
Chl
-a
Color
Turb
2015 Field Data

Satellite Landsat‐7 Landsat‐8 Sentinel‐2 Sentinel‐3Satellite sensor systems ETM+ OLI/TIRS MSI OLCISpatial resolution (m) 30 30 10, 20, 60 300No of Spectral Bands 8 11 12 21
Revisit cycle (days) 16 16 5 2 Swath width (km) 185 185 290 1270Launch date April 1999 February 2013 June 2015 Feb 2016Years in orbit/Minimum design life (yr)
15/5 2/5 0/7 0/7
Current and future sensorsNew tools in the toolbox

Sentinel 3 ‐ESA Image 2015
Thank you