stateform 2015 final - city of north las vegas official ... form 2015 final adopted... · final...
TRANSCRIPT
FINAL BUDGETFISCAL YEAR 2014 - 2015
CITY OF NORTH LAS VEGAS, NEVADA
NORTH LAS VEGAS REDEVELOPMENT AGENCY
NORTH LAS VEGAS LIBRARY DISTRICT

CITY OF NORTH LAS VEGAS, NEVADA
NORTH LAS VEGAS REDEVELOPMENT AGENCYNORTH LAS VEGAS LIBRARY DISTRICT
LOCATED IN THE BACK SECTION OF THIS PUBLICATION
FINAL BUDGETFISCAL YEAR 2014 - 2015

I.Letter of Transmittal 1Table of Contents 2 - 3Budget Message 4 - 5
II. SUMMARY FORMSSchedule S-1 Budget Summary - All Funds 6 - 7Schedule S-2 Statistical Data 8Schedule S-3 Property Tax Rate and Revenue Reconciliation 9Schedule A and A-1
Governmental Fund Types, Expendable Trust Funds and Tax Supported Proprietary Fund Types 10 - 11
Schedule A-2 Proprietary Funds and Nonexpendable Trust Funds 12
III. GOVERNMENTAL FUND TYPES AND EXPENDABLE TRUST FUNDSSchedule B General Fund
Resources 13 - 15Expenditures by Function and Activity: General Government 16 - 19 Judicial 20 Public Safety 21 - 26 Public Works 27 Culture and Recreation 28 - 29 Community Support 30 Debt Service 31 Summary - Expenditures, Other Uses and Fund Balance 32
Schedule B Special Revenue FundsCommunity Development 33Public Safety Support 34 - 35Special Purpose 36 - 37Park Construction Tax 38Parks and Recreation Support 39Municipal Court Support 40Public Safety Tax 41 - 42PD Sales Tax 43
Schedule B Capital Project Funds - Public Safety 44Capital Project Funds - Street Improvements 45Capital Project Funds - Parks & Rec 46Capital Project Funds - General Government 47Capital Project Funds - Municipal Building Bonds 48Capital Project Funds - Civic Center Bonds 49
Schedule C Debt Service FundsRepaid by Operating Resources 50 - 53Repaid by Property Taxes (Debt Rate) 54 - 55
IV. PROPRIETARY FUNDSSchedule F-1 Water Utility - Revenues, Expenses & Net Income 56Schedule F-2 Water Utility - Statement of Cash Flows 57Schedule F-1 Wastewater Utility - Revenues, Expenses & Net Income 58
INTRODUCTION
Page 2

IV. PROPRIETARY FUNDS (continued)Schedule F-2 Wastewater Utility - Statement of Cash Flows 59Schedule F-1 Municipal Golf Course - Revenues, Expenses & Net Income 60Schedule F-2 Municipal Golf Course - Statement of Cash Flows 61Schedule F-1 Self Insurance Reserve - Revenues, Expenses & Net Income 62Schedule F-2 Self Insurance Reserve - Statement of Cash Flows 63Schedule F-1 Motor Equipment - Revenues, Expenses & Net Income 64Schedule F-2 Motor Equipment - Statement of Cash Flows 65
V. SUPPLEMENTARY INFORMATIONSchedule C-1 Indebtedness 66 - 68Schedule T Transfer Reconciliation 69 - 71Lobbying Expense Estimate 72Schedule of Existing Contracts 73 - 75Schedule of Privatization Contracts 76Proof of Publication 77
I. INTRODUCTIONLetter of Transmittal 78
II. SUMMARY FORMSSchedule S-1 Budget Summary - All Funds 79 - 80Schedule S-2 Statistical Data 81Schedule S-3 Property Tax Rate and Revenue Reconciliation 82Schedule A and A-1
Governmental Fund Types, Expendable Trust Funds and Tax Supported Proprietary Fund Types 83 - 84
III. GOVERNMENTAL FUND TYPESchedule B Redevelopment Fund 85 - 86
I. INTRODUCTIONLetter of Transmittal 87
II. SUMMARY FORMSSchedule S-1 Budget Summary - All Funds 88 - 89Schedule S-2 Statistical Data 90Schedule S-3 Property Tax Rate and Revenue Reconciliation 91Schedule A and A-1
Governmental Fund Types, Expendable Trust Funds and Tax Supported Proprietary Fund Types 92 - 93
III. GOVERNMENTAL FUND TYPESSchedule B Library Fund 94Schedule C-1 Indebtedness 95
Page 3
CITY OF NORTH LAS VEGAS - LIBRARY DISTRICT
CITY OF NORTH LAS VEGAS - REDEVELOPMENT AGENCY


Budget Summary for THE CITY OF NORTH LAS VEGASSchedule S-1
GOVERNMENTAL FUND TYPES AND EXPENDABLE TRUST FUNDS
ESTIMATED PROPRIETARY TOTALACTUAL PRIOR CURRENT BUDGET FUNDS (MEMO ONLY)
YEAR YEAR YEAR BUDGET YEAR COLUMNS 3+4REVENUES 06/30/2013 06/30/2014 06/30/2015 06/30/2015
(1) (2) (3) (4) (5) Property Taxes 45,194,088$ 44,133,891$ 45,400,730$ 45,400,730$ Other Taxes 955,347 600,000 630,000 630,000 Licenses and Permits 26,491,882 31,121,907 31,650,507 31,650,507 Intergovernmental Resources 146,060,556 124,377,407 193,401,015 - 193,401,015 Charges for Services 5,369,223 7,502,970 7,044,308 93,301,431 100,345,739 Fines and Forfeits 7,462,883 6,953,646 6,804,500 2,061,000 8,865,500 Miscellaneous 4,669,513 5,876,453 4,747,181 27,614,529 32,361,710
TOTAL REVENUES 236,203,492 220,566,274 289,678,241 122,976,960 412,655,201
EXPENDITURES-EXPENSES General Government 22,895,115 22,392,113 22,733,880 25,993,070 48,726,950 Judicial 8,501,665 9,365,950 7,918,418 7,918,418 Public Safety 122,186,237 127,510,669 127,124,632 - 127,124,632 Public Works 51,089,821 52,157,198 119,003,154 119,003,154 Sanitation - Health - Welfare - Culture and Recreation 49,589,728 22,880,374 27,698,724 3,242,539 30,941,263 Community Support 4,130,837 10,487,544 11,603,904 - 11,603,904 Intergovernmental Expenditures - - Contingencies - 500,000 500,000 Utility Enterprises 75,474,541 75,474,541 Hospitals -
Other Enterprises - Debt Service - Principal 5,593,600 4,640,000 5,392,700 5,392,700 Interest Cost 3,093,890 2,903,657 7,523,692 15,720,276 23,243,968
TOTAL EXPENDITURES-EXPENSES 267,080,893 252,337,505 329,499,104 120,430,426 449,929,530 Excess of Revenues over (under) Expenditures-Expenses (30,877,401) (31,771,231) (39,820,863) 2,546,534 (37,274,329)
Page 6Form 2
11/1/2013

Budget Summary for THE CITY OF NORTH LAS VEGASSchedule S-1
GOVERNMENTAL FUND TYPES AND EXPENDABLE TRUST FUNDS
ESTIMATED PROPRIETARY TOTALACTUAL PRIOR CURRENT BUDGET FUNDS (MEMO ONLY)
YEAR YEAR YEAR BUDGET YEAR COLUMNS 3+406/30/2013 06/30/2014 06/30/2015 06/30/2015
(1) (2) (3) (4) (5)OTHER FINANCING SOURCES (USES):
eeds Federal Grants 3,257,754 3,257,754 Sales Tax for Infrastructure 2,400,000 2,400,000 Sale of Equipment 181,316 25,000 25,000 - 25,000 Replacement Vehicle Reserves 1,215,120 1,215,120 Anticipated Savings / Attrition 4,100,000 250,000 250,000
- Operating Transfers in 46,373,396 48,064,305 39,052,125 778,434 39,830,559 Operating Transfers (out) (17,186,815) (30,609,935) (16,087,074) (23,743,485) (39,830,559)
TOTAL OTHER FINANCING SOURCES (USES) 29,367,897 21,579,370 23,240,051 (16,092,177) 7,147,874 Excess of Revenues and Other Sources over(under) Expenditures and Other Uses (Net Income) (1,509,504) (10,191,861) (16,580,812) (13,545,643) XXXXXXXXXXXXXX
FUND BALANCE JULY 1, BEGINNING OF YEAR: 75,719,609 74,510,228 64,318,367 XXXXXXXXXXXXXXXXXXXXXXXXXXXXPrior Period Adjustments 300,123 - - XXXXXXXXXXXXXXXXXXXXXXXXXXXX
XXXXXXXXXXXXXXXXXXXXXXXXXXXX TOTAL BEGINNING FUND BALANCE 76,019,732 74,510,228 64,318,367 XXXXXXXXXXXXXXXXXXXXXXXXXXXX
XXXXXXXXXXXXXXXXXXXXXXXXXXXXXXXXXXXXXXXXXXXXXXXXXXXXXXXXXXXXXXXXXXXXXXXXXXXXXXXXXXXX
FUND BALANCE JUNE 30, END OF YEAR 74,510,228 64,318,367 47,737,555 XXXXXXXXXXXXXXXXXXXXXXXXXXXXXXXXXXXXXXXXXXXXXXXXXXXXXXXX
TOTAL ENDING FUND BALANCE 74,510,228 64,318,367 47,737,555 XXXXXXXXXXXXXXXXXXXXXXXXXXXX
Page 7Form 3
11/1/2013

FULL TIME EQUIVALENT EMPLOYEES BY FUNCTION
ACTUAL ESTIMATEDPRIOR YEAR CURRENT YEAR BUDGET YEAR
06/30/13 06/30/14 06/30/15General Government 127.1 128.2 116.3 Judicial 71.5 68.5 63.0 Public Safety 719.5 721.5 688.5 Public Works 48.0 51.3 47.3 Sanitation - - - Health - - - Welfare - - - Culture and Recreation 109.8 121.0 117.0 Community Support 19.3 19.3 16.3
TOTAL GENERAL GOVERNMENT 1,095.2 1,109.8 1,048.4 Utilities 148.0 135.7 129.7 Hospitals - - - Transit Systems - - - Airports - - - Other - - -
TOTAL 1,243.2 1,245.5 1,178.1 Note: FTE's for each of the three years has been adjusted to reflect Funded FTE's.
07/01/11 07/01/12 07/01/13
POPULATION (AS OF JULY 1) 223,873 222,009 226,199 Gov Certified Gov Certified Gov Certified
SOURCE OF POPULATION ESTIMATE* Population Population Population
Assessed Valuation (Secured and Unsecured Only) 3,987,869,401 4,068,384,524 4,730,877,154 Net Proceeds of MinesTOTAL ASSESSED VALUE 3,987,869,401 4,068,384,524 4,730,877,154
TAX RATE General Fund 0.1937 0.1937 0.1937 Special Revenue Funds 0.9450 0.9475 0.9700 Capital Project Funds Debt Service Funds 0.0250 0.0225 0.0000 Enterprise Fund Other
TOTAL TAX RATE 1.1637 1.1637 1.1637*Use the population certified by the state in March each year. Small districts may use a numberdeveloped per the instructions (page 6) or the best information available.
CITY OF NORTH LAS VEGAS(Local Government)
SCHEDULE S-2 - STATISTICAL DATAPage 8Form 4
11/1/2013

PROPERTY TAX RATE AND REVENUE RECONCILIATION Fiscal Year 2014-2015
(1) (2) (3) (4) (5) (6) (7) (8)
ALLOWED TOTAL PREABATED AD VALOREMAD VALOREM AD VALOREM TAX AD VALOREM BUDGETED
ALLOWED ASSESSED REVENUE TAX RATE REVENUE ABATEMENT REVENUE AD VALOREM SEETAX RATE VALUATION [(1) X (2)/100] LEVIED [(2, line A)X(4)/100] [(5) - (7)] WITH CAP REVENUE WITH CAP NOTES
OPERATING RATE: A. PROPERTY TAX Subject to Revenue Limitations 0.3618 4,730,877,154 17,114,170 0.1937 9,163,709 (1,606,669) 7,557,040 7,557,040 A B. PROPERTY TAX Outside Revenue Limitations: xxxxxxxxxxxxx Net Proceeds of MinesVOTER APPROVED: 0.1800 4,730,877,154 8,515,580 0.1800 8,515,579 (1,493,039) 7,022,540 7,022,540 B C. Voter Approved Overrides 0.3500 4,730,877,154 16,558,070 0.3500 16,558,070 (2,903,132) 13,654,938 13,654,938 C
0.2000 4,730,877,154 9,461,750 0.2000 9,461,754 (1,658,932) 7,802,822 7,802,822 C0.2350 4,730,877,154 11,117,560 0.2350 11,117,561 (1,949,241) 9,168,320 9,168,320 D0.0050 4,730,877,154 236,540 0.0050 236,540 (41,470) 195,070 195,070 E
LEGISLATIVE OVERRIDES D. Accident Indigent (NRS 428.185)
E. Medical Indigent (NRS 428.285)
F. Capital Acquisition(NRS 354.59815)
G. Youth Services Levy(NRS 62B.150, 62B.160)
H. Legislative Overrides
I. SCCRT Loss (NRS 354.59813)0.1564 4,730,877,154 7,399,090 0.0000 - -
J. Other:
K. Other:
L. SUBTOTAL LEGISLATIVE OVERRIDES 0.1564 4,730,877,154 7,399,090 0.0000 - - - - M. SUBTOTAL A, C, L 1.4882 4,730,877,154 70,402,760 1.1637 55,053,220 (9,652,482) 45,400,730 45,400,730
N. Debt 0.0000 4,730,877,154 - 0.0000 - - - - F
O. TOTAL M AND N 1.4882 4,730,877,154 70,402,760 1.1637 55,053,220 (9,652,482) 45,400,730 45,400,730
NOTES:A. Rate subject to revenue limitations E. Approved by voters 11-6-84 (E911) included in Special Revenue FundB. Approved by voters 11-4-86; included in Public Safety Tax F. Approved by voters 11-6-90 and 6-8-93; included in Debt Service FundC. Approved by voters 5-2-89 and 11-5-96; included in Public Safety Tax
(Local Government) Page 9D. Approved by voters 6-6-95; and 6-5-01; included in SCHEDULE S-3 - PROPERTY TAX RATE Form 27 Tax Override Fund AND REVENUE RECONCILIATION 11/1/2013
CITY OF NORTH LAS VEGAS

SCHEDULE A - ESTIMATED REVENUES & OTHER RESOURCES - GOVERNMENTAL FUND TYPES, EXPENDABLE TRUST FUNDS & TAX SUPPORTED PROPRIETARY FUND TY
Budget For Fiscal Year Ending June 30, 2015 Budget Summary for CITY OF NORTH LAS VEGAS(Local Government)
OTHERFINANCING
GOVERNMENTAL FUNDS AND SOURCESEXPENDABLE TRUST FUNDS BEGINNING PROPERTY OTHER THAN
FUND CONSOLIDATED TAX TAX OTHER TRANSFERS OPERATINGBALANCES TAX REVENUE REQUIRED RATE REVENUE IN TRANSFERS IN TOTAL
(1) (2) (3) (4) (5) (6) (7) (8)General 11,883,258 44,309,860 7,557,040 0.1937 48,709,893 25,000 23,743,485 136,228,536 Community Development 4,247,353 9,076,287 101,880 13,425,520 Public safety support 2,218,125 195,070 0.0050 1,624,986 279,363 4,317,544 Special purpose 11,889,545 9,168,320 0.2350 5,022,209 116,993 26,197,067 Park construction tax 1,841,692 235,600 - 2,077,292 Parks and recreation support 1,860,669 1,996,274 375,000 4,231,943 Municipal court support 949,780 1,038,191 - 1,987,971
Public safety tax 994,495 28,480,300 0.7300 98,000 - 29,572,795 More cops sales tax 3,083,198 9,910,964 - 12,994,162
Capital Proj.-Public Safety 8,065,890 43,388,208 - 967,000 52,421,098 Capital Proj.-Streets 2,820,342 65,077,864 - 1,307,487 69,205,693 Capital Proj.-Parks & Rec 2,297,082 11,222,800 - 1,470,109 14,989,991 Capital Proj.-GenGov 144,447 - - 144,447 Capital Proj.-Municipal Bldgs 5,209,112 11,350 550,000 5,770,462 Capital Proj.-Civic Center 3,500,267 11,500 - 3,511,767
Debt Service No Ad Valorem 2,939,190 2,543,525 10,140,808 15,623,523 Debt Service w/Ad Valorem 373,922 - - - - 373,922
Subtotal Governmental Fund Types,Expendable Trust Funds 64,318,367 44,309,860 45,400,730 1.1637 199,967,651 25,000 39,052,125 393,073,733
PROPRIETARY FUNDSXXXXXXXXXXX XXXXXXXXX XXXXXXXXXXX XXXXXXXXXXX XXXXXXXXXXXXXXXXXXXXXX XXXXXXXXX XXXXXXXXXXX XXXXXXXXXXX XXXXXXXXXXXXXXXXXXXXXX XXXXXXXXX XXXXXXXXXXX XXXXXXXXXXX XXXXXXXXXXXXXXXXXXXXXX XXXXXXXXX XXXXXXXXXXX XXXXXXXXXXX XXXXXXXXXXXXXXXXXXXXXX XXXXXXXXX XXXXXXXXXXX XXXXXXXXXXX XXXXXXXXXXX
Subtotal Proprietary Funds XXXXXXXXXXX XXXXXXXXX XXXXXXXXXXX XXXXXXXXXXX XXXXXXXXXXX
TOTAL ALL FUNDS XXXXXXXXXXX 44,309,860 45,400,730 1.1637 XXXXXXXXX XXXXXXXXXXX XXXXXXXXXXX XXXXXXXXXXX
Page 10Form 5
11/1/2013

SCHEDULE A-1 ESTIMATED EXPENDITURES AND OTHER FINANCING USES
Budget For Fiscal Year Ending June 30, 2015 Budget Summary for CITY OF NORTH LAS VEGAS(Local Government)
SERVICES, CONTINGENCIESSUPPLIES AND USES
GOVERNMENTAL FUNDS AND AND OTHER THANEXPENDABLE TRUST FUNDS SALARIES OTHER CAPITAL OPERATING OPERATING
AND EMPLOYEE CHARGES OUTLAY TRANSFERS TRANSFERS ENDING FUND FUND NAME WAGES BENEFITS ** *** OUT OUT BALANCES TOTAL
* (1) (2) (3) (4) (5) (6) (7) (8)General - 56,075,661 32,605,956 28,505,861 - 250,000 8,679,961 10,111,097 136,228,536 Community Development R 491,072 225,891 8,398,779 717,900 - 350,000 3,241,878 13,425,520 Public safety support R 941,851 274,456 645,059 - - - 2,456,178 4,317,544 Special purpose R 2,778,785 1,293,126 6,469,838 - - 5,075,811 10,579,507 26,197,067 Park construction tax R - - 113,200 - 639,309 1,324,783 2,077,292 Parks and recreation support R 1,254,271 209,764 725,522 303,691 - 375,000 1,363,695 4,231,943 Municipal court support R 298,826 151,613 280,458 - - 300,000 957,074 1,987,971
Public safety tax R 14,081,117 9,289,937 4,606,174 - - - 1,595,567 29,572,795 More cops sales tax R 5,523,483 4,109,503 817,241 - - - 2,543,935 12,994,162
Capital Proj.-Public Safety C 2,101,542 928,849 2,486,419 40,351,398 - 6,552,890 52,421,098 Capital Proj.-Streets C 4,668,982 2,029,811 4,775,568 56,752,495 - 978,837 69,205,693 Capital Proj.-Parks & Rec C 607,633 265,192 772,975 13,039,309 - 304,882 14,989,991 Capital Proj.-GenGov C - - - - - 144,447 144,447 Capital Proj.-Municipal Bldgs C 53,019 22,769 1,363,346 1,879,500 550,000 1,901,828 5,770,462 Capital Proj.-Civic Center C - - 2,779,600 - - 732,167 3,511,767
Debt Service No Ad Valorem D 12,674,733 2,948,790 15,623,523 Debt Service w/Ad Valorem D 256,929 116,993 - 373,922
TOTAL GOVERNMENTAL FUND TYPESAND EXPENDABLE TRUST FUNDS 88,876,242 51,406,867 75,671,702 113,044,293 250,000 16,087,074 47,737,555 393,073,733
* FUND TYPES: R - Special RevenueC - Capital ProjectsD - Debt ServiceT - Expendable Trust
** Include Debt Service Requirements in this column Page 11Form 6
*** Capital Outlay must agree with CIP. 11/1/2013

SCHEDULE A-2 PROPRIETARY AND NONEXPENDABLE TRUST FUNDS
Budget For Fiscal Year Ending June 30, 2015 Budget Summary for CITY OF NORTH LAS VEGAS(Local Government)
OPERATING OPERATING NONOPERATING NONOPERATINGREVENUES EXPENSES REVENUES EXPENSES OPERATING TRANSFERS NET INCOME
FUND NAME * (1) (2) ** (3) (4) IN (5) OUT(6) (7)
Water utility fund E 54,079,000 40,522,016 - 545,917 - 18,256,669 (5,245,602)
Wastewater utility fund E 40,208,000 34,952,525 5,657,754 15,174,359 - 5,486,816 (9,747,946)
Golf course E 2,278,151 3,242,539 - - 778,434 - (185,954)
Self insurance I 21,917,746 21,686,758 - - - 230,988
Motor equipment I 4,494,063 4,306,312 1,215,120 - - - 1,402,871
TOTAL 122,976,960 104,710,150 6,872,874 15,720,276 778,434 23,743,485 (13,545,643)
* FUND TYPES: E - Enterprise I - Internal Service Page 12 N - Nonexpendable Trust Form 7
11/1/2013** Include Depreciation

(1) (2) (3) (4)ESTIMATED BUDGET YEAR ENDING 06/30/2015
ACTUAL PRIOR CURRENTYEAR ENDING YEAR ENDING TENTATIVE FINAL
06/30/13 06/30/14 APPROVED APPROVED
Property TaxesCurrent year 7,521,586 7,346,166 7,605,879 7,557,040 Prior year 16,013
Room Tax SUBTOTAL 7,537,599 7,346,166 7,605,879 7,557,040
Business licenses and permitsBusiness licenses 3,811,769 3,941,010 4,141,010 4,141,010 Liquor licenses 638,444 586,430 586,430 586,430 County gaming licenses 1,387,405 1,365,000 1,365,000 1,365,000 City gaming licenses 1,650,282 1,621,167 1,621,167 1,621,167 Franchise fees
Gas 1,755,237 2,003,900 2,003,900 2,003,900 Electric 8,863,631 8,687,500 8,687,500 8,687,500 Telecommunication 2,072,487 2,375,000 2,375,000 2,375,000 Sanitation 1,289,037 1,223,500 1,223,500 1,223,500 Cable 1,713,869 1,829,500 1,829,500 1,829,500 Ambulance 75,095 73,400 73,400 73,400 Utilities 4,282,500 4,327,100
Non-business licenses and permits Animal licenses 74,747 43,000 60,000 82,000 Engineering Permits 463,354 440,000 500,000 500,000 Building Permits 2,696,525 2,650,000 2,835,000 2,835,000
SUBTOTAL 26,491,882 31,121,907 27,301,407 31,650,507
Federal Grants 115,007 400,000 115,000 115,000 State Grants Other Grants 2,532 State shared revenues
Motor vehicle fuel tax 1.75 cents Motor vehicle fuel tax 2.35 cents Consolidated tax distribution 39,434,352 43,156,500 44,309,860 44,309,860 Motor vehicle fuel tax/county 1.00 cents County option 1/4 percent sales and use tax
Flood control Other local government shared revenues
Other-room and gaming tax LVCVA 2,224,996 2,300,000 2,300,000 2,100,000 County gaming licenses Intergovernmental - Payment in Lieu of Taxes 2,170,386 2,194,433 Intergovernmental - Library Intergovernmental - Redevelopment SUBTOTAL 41,776,887 48,026,886 46,724,860 48,719,293
Continued to next page
CITY OF NORTH LAS VEGAS(Local Government)
Page 13SCHEDULE B - GENERAL FUND Form 8
11/01/13
REVENUES
Licenses and Permits
Intergovernmental Revenues
Taxes

(1) (2) (3) (4)ESTIMATED BUDGET YEAR ENDING 06/30/2015
ACTUAL PRIOR CURRENTYEAR ENDING YEAR ENDING TENTATIVE FINAL
06/30/13 06/30/14 APPROVED APPROVED
General governmentBuilding and zoning fees 232,166 220,900 285,000 285,000 Special inspector services City Clerk fees 47,437 50,000 50,000 50,000 City Attorney Collection Costs Discovery 246 723 561 561 Other fees 1,121 SUBTOTAL 280,970 271,623 335,561 335,561
Judicial Court fees 1,241,970 1,360,000 1,360,000 1,360,000 Other fees 473,297 370,000 370,000 370,000 SUBTOTAL 1,715,267 1,730,000 1,730,000 1,730,000
Public Safety Police - other fees 137,963 121,500 113,900 113,900 Public Safety - other fees 31,992 192,000 69,000 69,000 Fire
Fire Prevention Fees 508,580 475,000 475,000 475,000 Fire Other Fees 249,691 82,500 82,500 82,500
Correction Prisoner board 222,167 147,000 140,000 140,000 Correction - other fees
SUBTOTAL 1,150,393 1,018,000 880,400 880,400 Culture and recreation
Swimming pool Recreation 18,200 18,200 18,200 SUBTOTAL 18,200 18,200 18,200
Utilities Indirect Allocation 1,548,182 1,734,982 SUBTOTAL 1,548,182 1,734,982
SUBTOTAL CHARGES FOR SERVICE 3,146,630 4,586,005 2,964,161 4,699,143
Fines Court 6,684,609 6,700,000 6,700,000 6,700,000 Other forfeits 115,301 104,500 104,500 104,500 SUBTOTAL 6,799,910 6,804,500 6,804,500 6,804,500
Interest earnings 139,959 454,000 354,000 354,000 Rents and royalties 480,523 450,000 450,000 450,000 Contributions and donations from private sources 821 300 300 300 Other
Refunds and reimbursements 447,525 539,926 306,710 306,710 Other miscellaneous revenue 124,335 58,300 35,300 35,300 Inmate payphone commission 5,285
SUBTOTAL 1,198,448 1,502,526 1,146,310 1,146,310
Continued to next page
CITY OF NORTH LAS VEGAS(Local Government) Page 14
Form 8SCHEDULE B - GENERAL FUND 11/01/13
Fines and Forfeits
REVENUES
Charges for Services
Miscellaneous

(1) (2) (3) (4)ESTIMATED BUDGET YEAR ENDING 06/30/2015
ACTUAL PRIOR CURRENTYEAR ENDING YEAR ENDING TENTATIVE FINAL
06/30/13 06/30/14 APPROVED APPROVED
Taxes 7,537,599 7,346,166 7,605,879 7,557,040
Licenses and permits 26,491,882 31,121,907 27,301,407 31,650,507
Intergovernmental revenues 41,776,887 48,026,886 46,724,860 48,719,293
Charges for services 3,146,630 4,586,005 2,964,161 4,699,143
Fines and forfeits 6,799,910 6,804,500 6,804,500 6,804,500
Miscellaneous 1,198,448 1,502,526 1,146,310 1,146,310
SUBTOTAL REVENUE ALL SOURCES 86,951,356 99,387,990 92,547,117 100,576,793 OTHER FINANCING SOURCES
Sale of Equipment 115,151 25,000 25,000 25,000 Operating Transfers In (Schedule T)
Special Revenue Sp. Rev. - Land fund Sp. Rev. - Graffiti Fund Sp. Rev. - Forensic Services 22,119 Sp. Rev. - Municipal Crt Assessment 465,000 Sp. Rev. - Redevelopment 300,000 300,000 Capital-Tech. Improvements Self Insurance fund Motor Equipment fund Water fund 17,703,000 18,419,769 22,400,000 18,256,669 Wastewater fund 13,797,000 5,579,163 9,600,000 5,486,816
SUBTOTAL OTHER FINANCING SOURCES 31,937,270 24,788,932 32,025,000 23,768,485 TOTAL ALL RESOURCES 118,888,626 124,176,922 124,572,117 124,345,278
BEGINNING FUND BALANCE 9,180,610 9,338,944 11,539,510 11,883,258 Prior Period Adjustment 59,732
TOTAL BEGINNING FUND BALANCE 9,240,342 9,338,944 11,539,510 11,883,258
TOTAL AVAILABLE RESOURCES 128,128,968 133,515,866 136,111,627 136,228,536
CITY OF NORTH LAS VEGAS(Local Government) Page 15
Form 9SCHEDULE B - GENERAL FUND 11/01/13
REVENUES
Resources Summary

(1) (2) (3) (4)ESTIMATED BUDGET YEAR ENDING 06/30/2015
ACTUAL PRIOR CURRENTYEAR ENDING YEAR ENDING TENTATIVE FINAL
06/30/13 06/30/14 APPROVED APPROVED
LegislativeMAC - Administration
Salaries and wages 362,562 496,919 456,100 454,990 Employee benefits 285,314 338,850 315,584 316,584 Services and supplies 74,393 95,576 92,209 92,209 Capital outlay
722,269 931,345 863,893 863,783 CM - Legislative Session
Salaries and wages Employee benefits Services and supplies 22,914 41,200 41,200 Capital outlay
22,914 41,200 41,200 ACTIVITY SUBTOTAL 745,183 931,345 905,093 904,983
ExecutiveCM - Administration
Salaries and wages 583,664 259,978 153,359 153,359 Employee benefits 299,594 179,861 89,607 89,607 Services and supplies 271,953 306,885 411,467 411,467 Capital outlay
1,155,211 746,724 654,433 654,433 CM - GG-Vacant
Salaries and wages 84,915 Employee benefits 37,096 Services and supplies 2,547 Capital outlay
124,558 ACTIVITY SUBTOTAL 1,155,211 871,282 654,433 654,433
CC - AdministrationSalaries and wages 365,160 353,007 318,031 318,030 Employee benefits 162,893 164,536 149,038 152,038 Services and supplies 106,133 148,396 184,171 184,171 Capital outlay
634,186 665,939 651,240 654,239 CC - Elections
Salaries and wages 3,100 3,100 3,100 Employee benefits 220 220 Services and supplies 196,281 1,000 291,000 291,000 Capital outlay
196,281 4,100 294,320 294,320 ACTIVITY SUBTOTAL 830,467 670,039 945,560 948,559
FinanceFN - Administration
Salaries and wages 198,054 201,928 195,492 195,109 Employee benefits 92,364 95,684 93,028 94,028 Services and supplies 37,179 47,120 44,088 44,088 Capital outlay
327,597 344,732 332,608 333,225 Continued to next page
CITY OF NORTH LAS VEGAS(Local Government)
SCHEDULE B - GENERAL FUND Page 16Form 10
FUNCTION - GENERAL GOVERNMENT 11/01/13
EXPENDITURES BY FUNCTIONAND ACTIVITY
General Government

(1) (2) (3) (4)ESTIMATED BUDGET YEAR ENDING 06/30/2015
ACTUAL PRIOR CURRENTYEAR ENDING YEAR ENDING TENTATIVE FINAL
06/30/13 06/30/14 APPROVED APPROVEDFN - Budget
Salaries and wages 401,359 210,811 290,253 289,855 Employee benefits 215,373 120,408 154,152 154,152 Services and supplies 11,870 15,124 13,345 13,345 Capital outlay
628,602 346,343 457,750 457,352 FN - Accounting
Salaries and wages 595,815 567,138 582,504 581,978 Employee benefits 292,252 295,233 297,525 302,525 Services and supplies 297,384 334,009 337,348 337,348 Capital outlay
1,185,451 1,196,380 1,217,377 1,221,851 FN - Business License
Salaries and wages 385,319 280,277 374,894 374,797 Employee benefits 162,878 128,055 179,296 184,381 Services and supplies 28,935 43,053 48,234 48,234 Capital outlay
577,132 451,385 602,424 607,412 FN - CIP Grant Accounting
Salaries and wages 196,745 199,198 198,793 Employee benefits 100,540 114,203 115,203 Services and supplies 7,104 8,158 8,158 Capital outlay
304,389 321,559 322,154 FN-GG-VACANT
Salaries and wages Employee benefits 250,450 Services and supplies 5,180 Capital outlay
255,630 ACTIVITY SUBTOTAL 2,718,782 2,898,859 2,931,718 2,941,994
OtherCA - Administration
Salaries and wages 353,767 241,174 371,531 371,490 Employee benefits 169,858 131,478 176,943 176,943 Services and supplies 107,363 134,861 140,825 140,825 Capital outlay
630,988 507,513 689,299 689,258 CA - Criminial Law
Salaries and wages 737,029 687,524 726,126 724,227 Employee benefits 374,075 357,472 374,650 378,650 Services and supplies 19,143 20,576 55,319 55,319 Capital outlay
1,130,247 1,065,572 1,156,095 1,158,196 CA - Civil Law
Salaries and wages 246,304 239,042 208,576 208,448 Employee benefits 131,178 137,341 111,641 111,641 Services and supplies 6,422 7,148 7,269 7,269 Capital outlay
383,904 383,531 327,486 327,358 Continued to next page
CITY OF NORTH LAS VEGAS(Local Government)
SCHEDULE B - GENERAL FUND Page 17Form 10
FUNCTION - GENERAL GOVERNMENT 11/01/13
EXPENDITURES BY FUNCTIONAND ACTIVITY

(1) (2) (3) (4)ESTIMATED BUDGET YEAR ENDING 06/30/2015
ACTUAL PRIOR CURRENTYEAR ENDING YEAR ENDING TENTATIVE FINAL
06/30/13 06/30/14 APPROVED APPROVEDCA - GG-Vacant
Salaries and wages 156,283 Employee benefits 62,125 Services and supplies 4,715 Capital outlay
223,123 ACTIVITY SUBTOTAL 2,145,139 2,179,739 2,172,880 2,174,812 CSD-PZ - Administration
Salaries and wages 113,820 178,138 Employee benefits 51,720 82,345 Services and supplies 46,775 53,138 Capital outlay
212,315 313,621 CSD-PZ - General
Salaries and wages 459,786 386,578 726,848 726,849 Employee benefits 184,333 165,875 318,603 325,603 Services and supplies 38,533 41,779 123,384 123,384 Capital outlay
682,652 594,232 1,168,835 1,175,836 CSD-PZ - Advanced
Salaries and wages 265,425 192,039 Employee benefits 110,654 83,121 Services and supplies 17,099 18,401 Capital outlay
393,178 293,561 ACTIVITY SUBTOTAL 1,288,145 1,201,414 1,168,835 1,175,836 HR - Administration
Salaries and wages 821,885 831,447 698,947 697,077 Employee benefits 445,129 449,460 383,831 386,035 Services and supplies 110,712 108,790 121,016 121,016 Capital outlay
1,377,726 1,389,697 1,203,794 1,204,128 AS-IT - Administration
Salaries and wages 1,887,616 1,849,530 1,884,992 1,883,866 Employee benefits 731,614 792,807 800,680 820,665 Services and supplies 1,667,372 1,862,489 1,957,383 1,957,383 Capital outlay 3,849
4,290,451 4,504,826 4,643,055 4,661,914 AS-GS - Administration
Salaries and wages 303,978 323,171 Employee benefits 159,343 165,037 Services and supplies 31,267 39,004 Capital outlay
494,588 527,212 AS-GS - Building Maintenance
Salaries and wages 784,449 574,953 755,809 755,810 Employee benefits 312,780 240,112 331,097 339,097 Services and supplies 297,103 315,026 322,615 322,615 Capital outlay
1,394,332 1,130,091 1,409,521 1,417,522 Continued to next page
CITY OF NORTH LAS VEGAS(Local Government)
SCHEDULE B - GENERAL FUND Page 18Form 10
FUNCTION - GENERAL GOVERNMENT 11/01/13
AND ACTIVITYEXPENDITURES BY FUNCTION

(1) (2) (3) (4)ESTIMATED BUDGET YEAR ENDING 06/30/2015
ACTUAL PRIOR CURRENTYEAR ENDING YEAR ENDING TENTATIVE FINAL
06/30/13 06/30/14 APPROVED APPROVEDAS-City Hall Maintenance
Salaries and wages Employee benefits Services and supplies 586,469 605,633 617,639 617,639 Capital outlay
586,469 605,633 617,639 617,639 AS-GS - Communication
Salaries and wages 148,469 147,646 149,899 149,899 Employee benefits 63,243 68,464 67,515 68,515 Services and supplies 164,821 193,886 194,657 194,657 Capital outlay
376,533 409,996 412,071 413,071 AS-GS - Custodial Services
Salaries and wages 181,277 175,540 175,542 175,543 Employee benefits 75,721 82,180 80,417 83,417 Services and supplies 157,481 220,863 223,978 223,978 Capital outlay
414,479 478,583 479,937 482,938 AS-PURCHASING & RISK MGMT
Salaries and wages 199,213 246,828 297,504 297,317 Employee benefits 83,842 118,129 146,251 149,415 Services and supplies 121,363 25,775 28,353 28,353 Capital outlay
404,418 390,732 472,108 475,085 FN - General Expense
Salaries and wages Employee benefits Services and supplies 468,266 512,975 685,296 700,296 Intergovernmental expense
468,266 512,975 685,296 700,296 AS-GS - Fleet Services
Services and supplies (106) (106)
AS-GG-VacantSalaries and wages 266,909 Employee benefits 114,914 Services and supplies 7,940 Capital outlay
389,763 CSD-GG-Vacant
Salaries and wages 79,400 Employee benefits 36,790 Services and supplies 2,382
118,572 ACTIVITY SUBTOTAL 9,807,156 10,458,080 9,923,421 9,972,593
Salaries and wages 9,394,951 9,231,020 8,568,705 8,560,537 Employee benefits 4,404,158 4,798,363 4,184,281 4,248,719 Services and supplies 4,887,125 5,181,375 5,948,954 5,963,954 Intergovernmental expense Capital outlay 3,849
FUNCTION SUBTOTAL 18,690,083 19,210,758 18,701,940 18,773,210 CITY OF NORTH LAS VEGAS
(Local Government)SCHEDULE B - GENERAL FUND Page 19
Form 10FUNCTION - GENERAL GOVERNMENT 11/01/13
EXPENDITURES BY FUNCTIONAND ACTIVITY
Function Summary

(1) (2) (3) (4)ESTIMATED BUDGET YEAR ENDING 06/30/2015
ACTUAL PRIOR CURRENTYEAR ENDING YEAR ENDING TENTATIVE FINAL
06/30/13 06/30/14 APPROVED APPROVED
MC - AdministrationSalaries and wages 3,507,605 3,081,718 3,041,547 3,037,312 Employee benefits 1,560,952 1,513,659 1,468,756 1,496,673 Services and supplies 459,215 503,256 519,838 519,708 Capital outlay
5,527,772 5,098,633 5,030,141 5,053,693 MC - Marshals
Salaries and wages 1,205,768 1,179,589 1,142,003 1,139,331 Employee benefits 909,612 868,507 826,981 826,981 Services and supplies 156,080 181,528 167,516 167,516 Capital outlay
2,271,460 2,229,624 2,136,500 2,133,828 MC - JUD-Vacant
Salaries and wages 424,564 Employee benefits 194,515 Services and supplies 13,217 Capital outlay
632,296
Salaries and wages 4,713,373 4,685,871 4,183,550 4,176,643 Employee benefits 2,470,564 2,576,681 2,295,737 2,323,654 Services and supplies 615,295 698,001 687,354 687,224 Capital outlay
FUNCTION SUBTOTAL 7,799,232 7,960,553 7,166,641 7,187,521
CITY OF NORTH LAS VEGAS(Local Government)
SCHEDULE B - GENERAL FUND Page 20Form 10
FUNCTION - JUDICIAL 11/01/13
Function Summary
Judicial
EXPENDITURES BY FUNCTIONAND ACTIVITY
(1) (2) (3) (4)ESTIMATED BUDGET YEAR ENDING 06/30/2015
ACTUAL PRIOR CURRENTYEAR ENDING YEAR ENDING TENTATIVE FINAL
06/30/13 06/30/14 APPROVED APPROVED
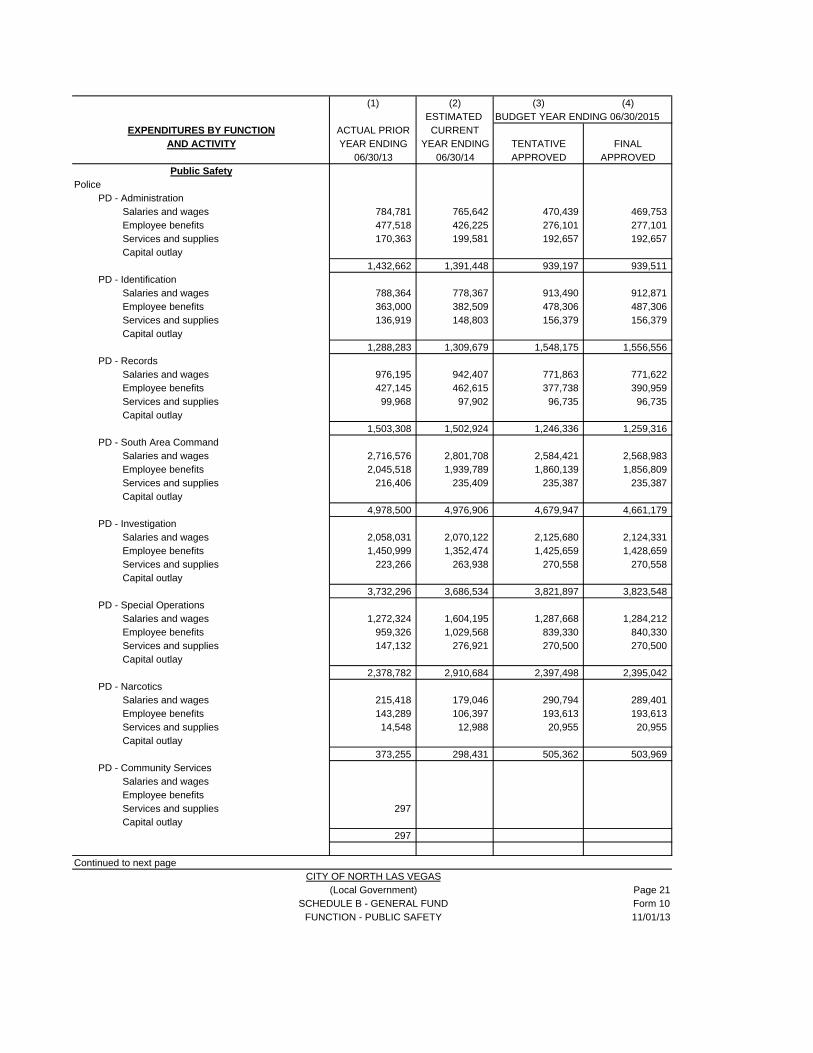
PolicePD - Administration
Salaries and wages 784,781 765,642 470,439 469,753 Employee benefits 477,518 426,225 276,101 277,101 Services and supplies 170,363 199,581 192,657 192,657 Capital outlay
1,432,662 1,391,448 939,197 939,511 PD - Identification
Salaries and wages 788,364 778,367 913,490 912,871 Employee benefits 363,000 382,509 478,306 487,306 Services and supplies 136,919 148,803 156,379 156,379 Capital outlay
1,288,283 1,309,679 1,548,175 1,556,556 PD - Records
Salaries and wages 976,195 942,407 771,863 771,622 Employee benefits 427,145 462,615 377,738 390,959 Services and supplies 99,968 97,902 96,735 96,735 Capital outlay
1,503,308 1,502,924 1,246,336 1,259,316 PD - South Area Command
Salaries and wages 2,716,576 2,801,708 2,584,421 2,568,983 Employee benefits 2,045,518 1,939,789 1,860,139 1,856,809 Services and supplies 216,406 235,409 235,387 235,387 Capital outlay
4,978,500 4,976,906 4,679,947 4,661,179 PD - Investigation
Salaries and wages 2,058,031 2,070,122 2,125,680 2,124,331 Employee benefits 1,450,999 1,352,474 1,425,659 1,428,659 Services and supplies 223,266 263,938 270,558 270,558 Capital outlay
3,732,296 3,686,534 3,821,897 3,823,548 PD - Special Operations
Salaries and wages 1,272,324 1,604,195 1,287,668 1,284,212 Employee benefits 959,326 1,029,568 839,330 840,330 Services and supplies 147,132 276,921 270,500 270,500 Capital outlay
2,378,782 2,910,684 2,397,498 2,395,042 PD - Narcotics
Salaries and wages 215,418 179,046 290,794 289,401 Employee benefits 143,289 106,397 193,613 193,613 Services and supplies 14,548 12,988 20,955 20,955 Capital outlay
373,255 298,431 505,362 503,969 PD - Community Services
Salaries and wages Employee benefits Services and supplies 297 Capital outlay
297
Continued to next pageCITY OF NORTH LAS VEGAS
(Local Government) Page 21SCHEDULE B - GENERAL FUND Form 10
FUNCTION - PUBLIC SAFETY 11/01/13
AND ACTIVITY
Public Safety
EXPENDITURES BY FUNCTION

(1) (2) (3) (4)ESTIMATED BUDGET YEAR ENDING 06/30/2015
ACTUAL PRIOR CURRENTYEAR ENDING YEAR ENDING TENTATIVE FINAL
06/30/13 06/30/14 APPROVED APPROVEDPD - Communications
Salaries and wages 809,085 837,156 699,794 699,399 Employee benefits 318,435 371,161 306,803 316,167 Services and supplies 39,033 53,706 53,713 53,713 Capital outlay
1,166,553 1,262,023 1,060,310 1,069,279 PD - Resource Management
Salaries and wages 365,720 361,569 367,810 367,810 Employee benefits 174,269 178,321 180,138 184,138 Services and supplies 646,281 868,700 1,223,423 1,223,423 Capital outlay
1,186,270 1,408,590 1,771,371 1,775,371 PD - Communications Radio Shop
Salaries and wages 265,173 248,982 152,619 152,619 Employee benefits 103,729 111,186 68,593 70,593 Services and supplies 175,877 297,728 291,562 291,562 Capital outlay
544,779 657,896 512,774 514,774 PD - Northwest Area Command
Salaries and wages 2,942,600 3,087,751 3,763,847 3,769,880 Employee benefits 2,226,888 2,138,110 2,732,509 2,734,509 Services and supplies 265,445 304,464 351,753 351,753 Capital outlay
5,434,933 5,530,325 6,848,109 6,856,142 PD - Technology NCIC
Salaries and wages 345,773 345,694 339,519 339,390 Employee benefits 134,106 151,229 148,651 152,764 Services and supplies 140,946 175,814 252,072 252,072 Capital outlay
620,825 672,737 740,242 744,226 PD - Mobile Command Center
Salaries and wages Employee benefits Services and supplies 23,516 39,707 37,001 37,001 Capital outlay
23,516 39,707 37,001 37,001 PD - Internal Affairs
Salaries and wages 377,802 434,629 394,257 392,908 Employee benefits 291,065 289,469 277,163 277,163 Services and supplies 37,931 54,499 54,100 54,100 Capital outlay
706,798 778,597 725,520 724,171 PD - Traffic
Salaries and wages 1,079,361 1,085,325 1,128,887 1,137,914 Employee benefits 797,956 722,118 779,993 784,323 Services and supplies 111,351 155,337 145,415 145,415 Capital outlay
1,988,668 1,962,780 2,054,295 2,067,652
Continued to next pageCITY OF NORTH LAS VEGAS
(Local Government) Page 22SCHEDULE B - GENERAL FUND Form 10
FUNCTION - PUBLIC SAFETY 11/01/13
AND ACTIVITYEXPENDITURES BY FUNCTION

(1) (2) (3) (4)ESTIMATED BUDGET YEAR ENDING 06/30/2015
ACTUAL PRIOR CURRENTYEAR ENDING YEAR ENDING TENTATIVE FINAL
06/30/13 06/30/14 APPROVED APPROVEDPD - Crime Analysis
Salaries and wages 175,538 176,539 176,761 176,761 Employee benefits 71,915 77,853 77,924 79,924 Services and supplies 9,411 9,396 10,324 10,324 Capital outlay
256,864 263,788 265,009 267,009 PD - Special Assignment Unit
Salaries and wages 306,211 212,491 147,686 147,068 Employee benefits 212,201 146,894 97,453 97,453 Services and supplies 32,875 40,917 37,336 37,336 Capital outlay
551,287 400,302 282,475 281,857 PD - School Crossing Guards
Salaries and wages 495,491 676,289 765,812 713,688 Employee benefits 61,699 90,963 102,251 161,835 Services and supplies 4,776 7,397 14,718 7,258 Capital outlay
561,966 774,649 882,781 882,781 PD - N E Area Command
Salaries and wages Employee benefits Services and supplies 11,548 Capital outlay
11,548 PD - Training
Salaries and wages 322,155 317,948 319,625 319,626 Employee benefits 167,211 171,948 175,970 178,970 Services and supplies 160,202 315,483 315,716 315,716 Capital outlay
649,568 805,379 811,311 814,312 PD-PS-Vacant / Attrition
Salaries and wages 240,374 Employee benefits 138,411 Services and supplies 10,188 Capital outlay
388,973 ACTIVITY SUBTOTAL 29,390,958 31,022,352 31,129,610 31,173,696
FireFD - Administration
Salaries and wages 539,403 634,309 685,002 682,023 Employee benefits 683,761 379,738 415,172 415,172 Services and supplies 281,893 291,140 272,786 272,786 Capital outlay
1,505,057 1,305,187 1,372,960 1,369,981 FD - Fire Spt Operations
Salaries and wages 14,381,445 15,306,656 14,944,800 14,906,043 Employee benefits 8,871,443 8,942,246 9,164,327 9,165,227 Services and supplies 2,313,374 2,672,265 2,691,547 2,691,547 Capital outlay
25,566,262 26,921,167 26,800,674 26,762,817 Continued to next page
CITY OF NORTH LAS VEGAS(Local Government) Page 23
SCHEDULE B - GENERAL FUND Form 10FUNCTION - PUBLIC SAFETY 11/01/13
AND ACTIVITYEXPENDITURES BY FUNCTION

(1) (2) (3) (4)ESTIMATED BUDGET YEAR ENDING 06/30/2015
ACTUAL PRIOR CURRENTYEAR ENDING YEAR ENDING TENTATIVE FINAL
06/30/13 06/30/14 APPROVED APPROVEDFD - Fire Spt Services
Salaries and wages 780,554 812,443 926,122 922,831 Employee benefits 701,660 507,908 525,146 526,146 Services and supplies 183,762 232,043 270,016 270,016 Capital outlay
1,665,976 1,552,394 1,721,284 1,718,993 FD - Community Life Safety
Salaries and wages 696,595 695,063 727,176 736,515 Employee benefits 344,792 363,284 379,399 380,849 Services and supplies 40,969 39,745 40,086 40,086 Capital outlay
1,082,356 1,098,092 1,146,661 1,157,450 FD-PS-Vacant
Salaries and wages Employee benefits Services and supplies Capital outlay
ACTIVITY SUBTOTAL 29,819,651 30,876,840 31,041,579 31,009,241
CorrectionsPD - Security Control
Salaries and wages 39,173 Employee benefits 25,093 Services and supplies 1,022 Capital outlay
65,288 PD -Detention Command
Salaries and wages 3,012,494 2,973,850 2,877,469 2,873,926 Employee benefits 2,315,802 1,985,203 1,964,927 1,964,927 Services and supplies 3,668,419 5,048,192 6,775,658 6,775,658 Capital outlay
8,996,715 10,007,245 11,618,054 11,614,511 PD - Contracts Inmate Programs
Salaries and wages 273,149 257,735 260,815 260,814 Employee benefits 124,372 121,821 124,626 126,626 Services and supplies 163,684 67,481 8,958 8,958 Capital outlay
561,205 447,037 394,399 396,398 PD - Warrant Court Services
Salaries and wages 646,223 639,862 522,358 521,740 Employee benefits 502,633 446,214 385,889 385,889 Services and supplies 33,194 31,147 28,519 28,519 Sustainability Plan
1,182,050 1,117,223 936,766 936,148 Continued to next page
CITY OF NORTH LAS VEGAS(Local Government)
SCHEDULE B - GENERAL FUND Page 24Form 10
FUNCTION - PUBLIC SAFETY 11/01/13
AND ACTIVITYEXPENDITURES BY FUNCTION
(1) (2) (3) (4)ESTIMATED BUDGET YEAR ENDING 06/30/2015
ACTUAL PRIOR CURRENTYEAR ENDING YEAR ENDING TENTATIVE FINAL
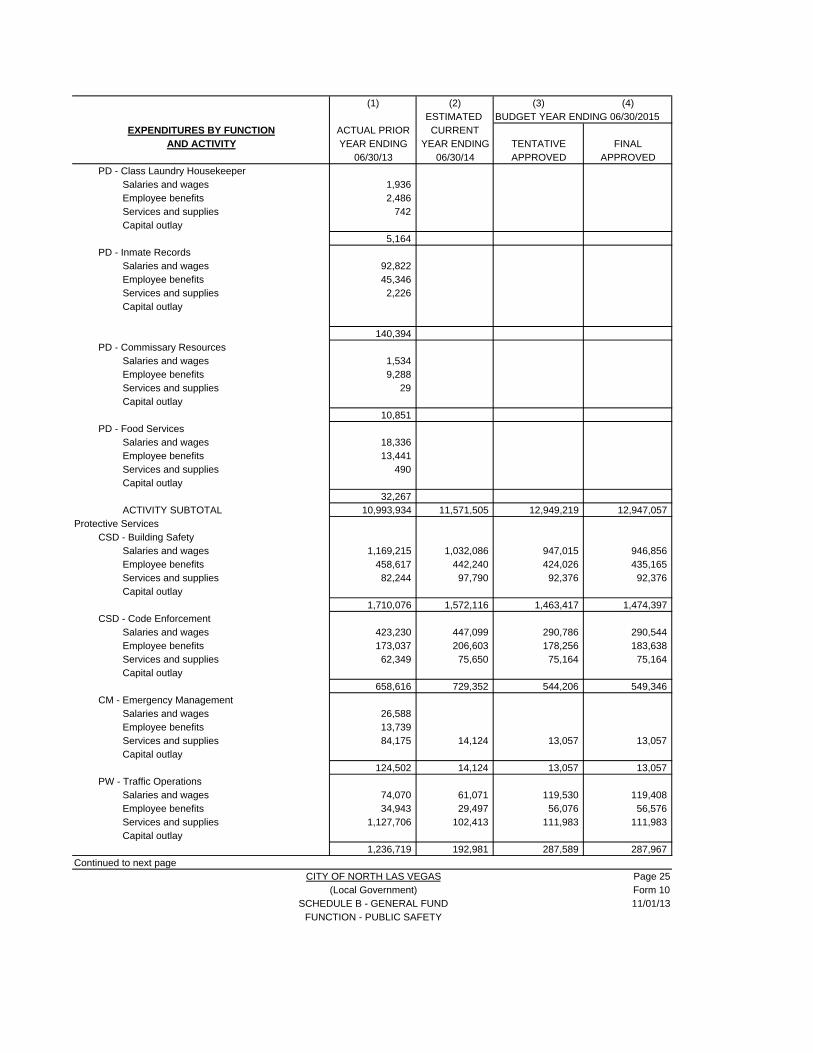
06/30/13 06/30/14 APPROVED APPROVEDPD - Class Laundry Housekeeper
Salaries and wages 1,936 Employee benefits 2,486 Services and supplies 742 Capital outlay
5,164 PD - Inmate Records
Salaries and wages 92,822 Employee benefits 45,346 Services and supplies 2,226 Capital outlay
140,394 PD - Commissary Resources
Salaries and wages 1,534 Employee benefits 9,288 Services and supplies 29 Capital outlay
10,851 PD - Food Services
Salaries and wages 18,336 Employee benefits 13,441 Services and supplies 490 Capital outlay
32,267 ACTIVITY SUBTOTAL 10,993,934 11,571,505 12,949,219 12,947,057
Protective ServicesCSD - Building Safety
Salaries and wages 1,169,215 1,032,086 947,015 946,856 Employee benefits 458,617 442,240 424,026 435,165 Services and supplies 82,244 97,790 92,376 92,376 Capital outlay
1,710,076 1,572,116 1,463,417 1,474,397 CSD - Code Enforcement
Salaries and wages 423,230 447,099 290,786 290,544 Employee benefits 173,037 206,603 178,256 183,638 Services and supplies 62,349 75,650 75,164 75,164 Capital outlay
658,616 729,352 544,206 549,346 CM - Emergency Management
Salaries and wages 26,588 Employee benefits 13,739 Services and supplies 84,175 14,124 13,057 13,057 Capital outlay
124,502 14,124 13,057 13,057 PW - Traffic Operations
Salaries and wages 74,070 61,071 119,530 119,408 Employee benefits 34,943 29,497 56,076 56,576 Services and supplies 1,127,706 102,413 111,983 111,983 Capital outlay
1,236,719 192,981 287,589 287,967 Continued to next page
CITY OF NORTH LAS VEGAS Page 25(Local Government) Form 10
SCHEDULE B - GENERAL FUND 11/01/13FUNCTION - PUBLIC SAFETY
AND ACTIVITYEXPENDITURES BY FUNCTION

(1) (2) (3) (4)ESTIMATED BUDGET YEAR ENDING 06/30/2015
ACTUAL PRIOR CURRENTYEAR ENDING YEAR ENDING TENTATIVE FINAL
06/30/13 06/30/14 APPROVED APPROVEDPD - Animal Control
Salaries and wages 349,455 303,177 305,295 305,263 Employee benefits 145,873 136,411 137,893 141,922 Services and supplies 704,882 763,818 768,656 768,656 Capital outlay
1,200,210 1,203,406 1,211,844 1,215,841 PD - PSOTH-Vacant
Salaries and wages Employee benefits Services and supplies Capital outlay
PW - PSOTH-Vacant
Salaries and wages Employee benefits Services and supplies Capital outlay
CSD-PSOTH-Vacant
Salaries and wages 77,796 Employee benefits 35,197 Services and supplies 2,382 Capital outlay
115,375 ACTIVITY SUBTOTAL 4,930,123 3,827,354 3,520,113 3,540,608
Salaries and wages 38,822,820 40,407,381 39,307,340 39,204,199 Employee benefits 24,892,595 23,883,602 24,154,071 24,294,753 Services and supplies 11,419,251 13,007,068 15,179,110 15,171,650 Capital outlay
FUNCTION SUBTOTAL 75,134,666 77,298,051 78,640,521 78,670,602
CITY OF NORTH LAS VEGAS(Local Government)
SCHEDULE B - GENERAL FUND Page 26Form 10
FUNCTION - PUBLIC SAFETY 11/01/13
Function Summary
AND ACTIVITYEXPENDITURES BY FUNCTION

(1) (2) (3) (4)ESTIMATED BUDGET YEAR ENDING 06/30/2015
ACTUAL PRIOR CURRENTYEAR ENDING YEAR ENDING TENTATIVE FINAL
06/30/13 06/30/14 APPROVED APPROVED
PW - Development Flood ControlSalaries and wages 364,077 380,251 307,395 307,396 Employee benefits 142,772 165,916 132,867 136,167 Services and supplies 15,786 33,080 32,415 32,415 Capital outlay
522,635 579,247 472,677 475,978 PW - Administration
Salaries and wages 294,979 281,650 244,980 244,267 Employee benefits 140,184 137,132 119,057 120,057 Services and supplies 20,496 25,323 25,612 25,612 Capital outlay
455,659 444,105 389,649 389,936 PW - Engineering and Design
Salaries and wages 173,030 142,063 141,782 141,784 Employee benefits 57,527 52,271 48,748 54,748 Services and supplies 73,413 95,026 97,507 97,507 Capital outlay
303,970 289,360 288,037 294,039 PW - Real Property Services
Salaries and wages 274,434 279,659 290,061 290,063 Employee benefits 114,198 126,240 128,708 133,708 Services and supplies 13,189 37,011 38,928 38,928 Capital outlay
401,821 442,910 457,697 462,699 PW - Construction Services
Salaries and wages 271,661 313,230 311,994 311,994 Employee benefits 97,993 116,672 112,844 119,844 Services and supplies 63,933 109,682 113,617 113,617 Capital outlay
433,587 539,584 538,455 545,455 PW - Survey
Salaries and wages 202,770 137,073 192,544 192,342 Employee benefits 74,332 46,873 72,742 76,938 Services and supplies 85,739 89,367 90,260 90,260 Capital outlay
362,841 273,313 355,546 359,540
Salaries and wages 1,580,951 1,533,926 1,488,756 1,487,846 Employee benefits 627,006 645,104 614,966 641,462 Services and supplies 272,556 389,489 398,339 398,339 Capital outlay
2,480,513 2,568,519 2,502,061 2,527,647 Continued to next page
CITY OF NORTH LAS VEGAS(Local Government)
SCHEDULE B - GENERAL FUND Page 27Form 10
FUNCTION - PUBLIC WORKS 11/01/13
Function Summary
Public Works
AND ACTIVITYEXPENDITURES BY FUNCTION

(1) (2) (3) (4)ESTIMATED BUDGET YEAR ENDING 06/30/2015
ACTUAL PRIOR CURRENTYEAR ENDING YEAR ENDING TENTATIVE FINAL
06/30/13 06/30/14 APPROVED APPROVED
CSD-PR - AdministrationSalaries and wages 185,137 203,096 156,537 156,538 Employee benefits 84,478 96,458 76,116 77,116 Services and supplies 16,833 14,618 14,051 14,051 Capital outlay
286,448 314,172 246,704 247,705 Participant Recreation
CSD-PR - AquaticsSalaries and wages 79,804 76,243 76,093 76,093 Employee benefits 9,491 10,110 10,116 10,116 Services and supplies 243,313 286,504 291,140 291,140 Capital outlay
332,608 372,857 377,349 377,349 CSD-PR - Recreational Division
Salaries and wages 174,366 145,341 182,076 179,949 Employee benefits 66,791 52,247 71,525 72,525 Services and supplies 36,722 55,063 51,865 51,865 Capital outlay
277,879 252,651 305,466 304,339 CSD-PR - Neighborhood Rec Center
Salaries and wages 156,176 123,120 123,024 123,024 Employee benefits 49,547 40,866 40,324 41,324 Services and supplies 89,707 103,463 105,114 105,114 Capital outlay
295,430 267,449 268,462 269,462 CSD-PR - Silver Mesa
Salaries and wages 400,477 356,429 225,708 230,736 Employee benefits 111,549 116,899 54,709 55,709 Services and supplies 91,260 100,554 105,118 105,118 Capital outlay
603,286 573,882 385,535 391,563 CSD-PR - Sports
Salaries and wages 80,485 89,972 123,055 123,055 Employee benefits 32,317 36,409 51,175 52,175 Services and supplies 1,923 2,176 3,651 3,651 Capital outlay
114,725 128,557 177,881 178,881 CSD-PR - Senior Programs
Salaries and wages 68,141 44,161 44,114 44,114 Employee benefits 8,487 5,940 5,935 5,935 Services and supplies 27,685 30,400 30,400 30,400 Capital outlay
104,313 80,501 80,449 80,449 Continued to next page
CITY OF NORTH LAS VEGAS
(Local Government)SCHEDULE B - GENERAL FUND Page 28
Form 10FUNCTION - CULTURE AND RECREATION 11/01/13
AND ACTIVITYEXPENDITURES BY FUNCTION
Culture and Recreation

(1) (2) (3) (4)ESTIMATED BUDGET YEAR ENDING 06/30/2015
ACTUAL PRIOR CURRENTYEAR ENDING YEAR ENDING TENTATIVE FINAL
06/30/13 06/30/14 APPROVED APPROVEDCSD-PR - Safekey
Salaries and wages 1,870 Employee benefits 238 Services and supplies 2,118 Capital outlay
4,226 CSD-PR - Special Events
Salaries and wages 3,362 Employee benefits 423 Services and supplies 2,717 3,000 3,000 3,000 Capital outlay
6,502 3,000 3,000 3,000 CSD-PR - Skyview
Salaries and wages Employee benefits Services and supplies 146,108 153,950 225,569 225,569 Capital outlay
146,108 153,950 225,569 225,569 ACTIVITY SUBTOTAL 1,885,077 1,832,847 1,823,711 1,830,612
ParksCSD-PR - Planning & Park Development
Salaries and wages Employee benefits Services and supplies Capital outlay
AS-PR - Parks Services
Salaries and wages 884,857 811,070 713,410 716,747 Employee benefits 375,300 381,070 307,985 318,985 Services and supplies 2,708,178 3,153,804 3,155,212 3,155,212 Capital outlay
3,968,335 4,345,944 4,176,607 4,190,944 CSD-PR-Vacant
Salaries and wages 118,458 Employee benefits 56,906 Services and supplies 3,578 Capital outlay
178,942 CSD-PR - Craig Ranch Regional Park
Salaries and wages 550,000 319,468 312,997 Employee benefits 131,638 136,842 Services and supplies 113,151 1,150,000 1,639,136 1,639,136 Capital outlay 22,632
135,783 1,700,000 2,090,242 2,088,975 ACTIVITY SUBTOTAL 4,104,118 6,224,886 6,266,849 6,279,919
Salaries and wages 2,034,675 2,517,890 1,963,485 1,963,253 Employee benefits 738,621 796,905 749,523 770,727 Services and supplies 3,479,715 5,057,110 5,624,256 5,624,256 Capital outlay 22,632
FUNCTION SUBTOTAL 6,275,643 8,371,905 8,337,264 8,358,236 CITY OF NORTH LAS VEGAS
(Local Government)SCHEDULE B - GENERAL FUND Page 29
Form 10FUNCTION - CULTURE AND RECREATION 11/01/13
AND ACTIVITYEXPENDITURES BY FUNCTION
Function Summary

(1) (2) (3) (4)ESTIMATED BUDGET YEAR ENDING 06/30/2015
ACTUAL PRIOR CURRENTYEAR ENDING YEAR ENDING TENTATIVE FINAL
06/30/13 06/30/14 APPROVED APPROVED
CSD-HN - AdministrationSalaries and wages 223,681 324,718 212,349 212,349 Employee benefits 87,384 142,094 94,458 97,118 Services and supplies 183,835 223,340 221,044 221,044 Capital outlay
494,900 690,152 527,851 530,511 AS-HN - Beautification
Salaries and wages 344,026 327,837 270,713 270,713 Employee benefits 142,355 151,699 121,754 125,754 Services and supplies 107,701 151,491 141,100 141,100 Capital outlay
594,082 631,027 533,567 537,567 CSD-HN - Outreach
Salaries and wages 128,347 101,293 94,585 94,235 Employee benefits 46,485 52,097 50,597 50,597 Services and supplies 10,916 10,871 11,223 11,223 Capital outlay
185,748 164,261 156,405 156,055 CSD-HN - Housing
Salaries and wages Employee benefits Services and supplies 40 Capital outlay
40 CM-ED - Administration
Salaries and wages 104,598 103,624 106,016 105,886 Employee benefits 50,807 52,012 52,372 53,172 Services and supplies 23,150 26,136 226,071 226,071 Capital outlay
178,555 181,772 384,459 385,129 CM - Developer Agreements
Salaries and wages Employee benefits Services and supplies 60,000 61,000 61,000 61,000 Capital outlay
60,000 61,000 61,000 61,000 CSD-CS-Vacant
Salaries and wages 48,058 Employee benefits 25,929 Services and supplies 1,416 Capital outlay
75,403
Salaries and wages 800,652 905,530 683,663 683,183 Employee benefits 327,031 423,831 319,181 326,641 Services and supplies 385,642 474,254 660,438 660,438 Capital outlay
FUNCTION SUBTOTAL 1,513,325 1,803,615 1,663,282 1,670,262
CITY OF NORTH LAS VEGAS(Local Government)
SCHEDULE B - GENERAL FUND Page 30Form 10
FUNCTION - COMMUNITY SUPPORT 11/01/13
Function Summary
AND ACTIVITYEXPENDITURES BY FUNCTION
Community Support

(1) (2) (3) (4)ESTIMATED BUDGET YEAR ENDING 06/30/2015
ACTUAL PRIOR CURRENTYEAR ENDING YEAR ENDING TENTATIVE FINAL
06/30/13 06/30/14 APPROVED APPROVED
Capital Lease - EquipmentPrincipal Interest
FUNCTION SUBTOTAL
CITY OF NORTH LAS VEGAS(Local Government)
SCHEDULE B - GENERAL FUND Page 31Form 10
FUNCTION - DEBT SERVICE 11/01/13
AND ACTIVITY
Debt Service
EXPENDITURES BY FUNCTION

(1) (2) (3) (4)ESTIMATED BUDGET YEAR ENDING 06/30/2015
ACTUAL PRIOR CURRENTYEAR ENDING YEAR ENDING TENTATIVE FINAL
06/30/13 06/30/14 APPROVED APPROVEDPAGE FUNCTION SUMMARY19 General Government 18,690,083 19,210,758 18,701,940 18,773,210 20 Judicial 7,799,232 7,960,553 7,166,641 7,187,521 26 Public Safety 75,134,666 77,298,051 78,640,521 78,670,602 27 Public Works 2,480,513 2,568,519 2,502,061 2,527,647 29 Culture and Recreation 6,275,643 8,371,905 8,337,264 8,358,236 30 Community Support 1,513,325 1,803,615 1,663,282 1,670,262 31 Debt Service
TOTAL EXPENDITURES - ALL FUNCTIONS 111,893,462 117,213,401 117,011,709 117,187,478
Salaries and wages 57,347,422 59,281,618 56,195,499 56,075,661 Employee benefits 33,459,975 33,124,486 32,317,759 32,605,956 Services and supplies 21,059,584 24,807,297 28,498,451 28,505,861 Intergovernmental expense Capital outlay 26,481 Debt Service
TOTAL EXPENDITURES - ALL FUNCTIONS 111,893,462 117,213,401 117,011,709 117,187,478 OTHER USES :CONTINGENCY (Not to exceed 3% of total
expenditures)Contingency 500,000 500,000
Attrition - Salaries & Benefits (3,100,000) (250,000) Anticipated Savings S&S (1,000,000) Budget Reduction Plan
Operating Transfers Out (Schedule T)Public Safety Support-Grant fund Police 579,490 315,207 130,800 130,800 Housing / Community Improvement fund 101,880 101,880 Public Safety Support-Grant fund Fire 148,563 148,563 Public Safety Tax 285,490 Library 760,543 Debt service fund 4,054,605 2,558,825 7,520,284 7,520,284 Municipal Golf Course 66,010 90,000 90,000 90,000 Aliante Golf Course 363,220 688,434 688,434 ISF Employee Benefits 1,796,457 ISF Workers Comp 400,000 ISF Liability Insurance 4,145,922
TOTAL EXPENDITURES AND OTHER USES 118,790,024 121,632,608 126,191,670 126,117,439
ENDING FUND BALANCE 9,338,944 11,883,258 9,919,957 10,111,097 TOTAL ENDING FUND BALANCE 9,338,944 11,883,258 9,919,957 10,111,097
TOTAL COMMITMENTS AND FUND BALANCE 128,128,968 133,515,866 136,111,627 136,228,536
7.86% 9.77% 7.86% 8.02%
CITY OF NORTH LAS VEGAS (Local Government)
SCHEDULE B - GENERAL FUND Page 32SCHEDULE B SUMMARY - EXPENDITURES, OTHER USES AND FUND BALANCE Form 11
GENERAL FUND - ALL FUNCTIONS 11/01/13
Function Summary
AND ACTIVITYEXPENDITURES BY FUNCTION

(1) (2) (3) (4)ESTIMATED BUDGET YEAR ENDING 06/30/2015
ACTUAL PRIOR CURRENTYEAR ENDING YEAR ENDING TENTATIVE FINAL
06/30/13 06/30/14 APPROVED APPROVED
Federal grants 3,074,252 13,048,978 8,826,287 8,826,287 Other
SUBTOTAL 3,074,252 13,048,978 8,826,287 8,826,287
Refunds and reimbursements 7,769 10,000 10,000 10,000 Other 240,158 260,000 240,000 240,000
SUBTOTAL 247,927 270,000 250,000 250,000 OTHER FINANCING SOURCES
Sale of Equipment 13,576 Operating Transfers In (Schedule T)
General fund 101,880 101,880 SUBTOTAL OTHER FINANCING SOURCES 13,576 101,880 101,880 TOTAL ALL RESOURCES 3,335,755 13,318,978 9,178,167 9,178,167
BEGINNING FUND BALANCE 4,951,518 5,180,701 4,247,353 4,247,353 TOTAL BEGINNING FUND BALANCE 4,951,518 5,180,701 4,247,353 4,247,353
Prior period adjustmentsResidual equity transfers
TOTAL AVAILABLE RESOURCES 8,287,273 18,499,679 13,425,520 13,425,520
General GovernmentSalaries and wages Employee benefits 60 Services and supplies Capital outlay
Total General Government 60 Community Support
Salaries and wages 640,835 662,063 482,078 491,072 Employee benefits 266,358 319,743 219,366 225,891 Services and supplies 1,682,130 6,884,223 8,398,779 8,398,779 Capital outlay 717,900 717,900 717,900
Total Community Support 2,589,323 8,583,929 9,818,123 9,833,642 Public Works
Salaries and wages Employee benefits 3,308 Services and supplies Capital outlay 5,483
Total Public Works 8,791 TOTAL EXPENDITURES 2,598,174 8,583,929 9,818,123 9,833,642 OTHER USES
CONTINGENCY (Not to exceed 3% of totalexpenditures)
Operating Transfers Out (Schedule T) Library fund 49,640 Capital projects HUD-Streets 458,758 5,214,000 350,000 350,000 Water fund 454,397 ISF Liability Insurance Budget Reduction Plan
TOTAL EXPENDITURES AND OTHER USES 3,106,572 14,252,326 10,168,123 10,183,642
ENDING FUND BALANCE 5,180,701 4,247,353 3,257,397 3,241,878 TOTAL ENDING FUND BALANCE 5,180,701 4,247,353 3,257,397 3,241,878
TOTAL COMMITMENTS AND FUND BALANCE 8,287,273 18,499,679 13,425,520 13,425,520
CITY OF NORTH LAS VEGAS (Local Government)
SCHEDULE B - SPECIAL REVENUE FUNDS Page 33Form 14
FUND - COMMUNITY DEVELOPMENT 11/1/2013
Intergovernmental Revenues
REVENUES
Miscellaneous
EXPENDITURES

(1) (2) (3) (4)ESTIMATED BUDGET YEAR ENDING 06/30/2015
ACTUAL PRIOR CURRENTYEAR ENDING YEAR ENDING TENTATIVE FINAL
06/30/13 06/30/14 APPROVED APPROVED
Property Taxes - Current year 194,093 189,628 196,328 195,070 Property Taxes - Prior year 103
Federal grants 3,260,651 2,538,291 1,309,780 1,309,780 Other grants Regional Transportation Commission
Police - Other fees 31,464 17,000 17,000 17,000 Other
Other 659,708 149,146
Interest earnings (36) 1,599 Interest earnings - Change in Value Contributions and donations from private sources 21,837 16,835 15,000 15,000 Payphone Commission Refunds & Reimbursements 214,974 284,106 283,206 283,206 Other 1,164 6,877
SUBTOTAL 4,383,958 3,203,482 1,821,314 1,820,056
OTHER FINANCING SOURCESSale of Equipment 9,500
Operating Transfers In (Schedule T) General fund 579,490 315,207 279,363 279,363 Grant fund 58,041
TOTAL ALL RESOURCES 4,972,948 3,576,730 2,100,677 2,099,419
BEGINNING FUND BALANCE 2,522,123 3,107,061 2,218,125 2,218,125 Prior period adjustments 2,206
TOTAL BEGINNING FUND BALANCE 2,524,329 3,107,061 2,218,125 2,218,125
Residual equity transfersTOTAL AVAILABLE RESOURCES 7,497,277 6,683,791 4,318,802 4,317,544
CITY OF NORTH LAS VEGAS(Local Government)
SCHEDULE B - SPECIAL REVENUE FUNDSPage 34
FUND - PUBLIC SAFETY SUPPORT Form 1211/1/2013
REVENUES
Intergovernmental Revenues
Charges for Services
Fines and Forfeitures
Miscellaneous
Taxes

(1) (2) (3) (4)ESTIMATED BUDGET YEAR ENDING 06/30/2015
ACTUAL PRIOR CURRENTYEAR ENDING YEAR ENDING TENTATIVE FINAL
06/30/13 06/30/14 APPROVED APPROVED
Civil LawSalaries and wages Employee benefits Services and supplies Capital outlay
Subtotal General Government
PoliceSalaries and wages 1,595,178 1,881,930 639,577 639,577 Employee benefits 822,500 932,170 120,728 125,728 Services and supplies 1,395,756 991,111 275,427 275,427 Capital outlay 419,868 10,682
FireSalaries and wages Employee benefits Services and supplies Capital outlay
DetentionSalaries and wages Employee benefits Services and supplies 6,130 161,004 118,413 118,413 Capital outlay
Protective ServicesSalaries and wages 41,416 160,029 302,437 302,274 Employee benefits 17,712 66,860 143,256 148,728 Services and supplies 69,537 203,839 251,219 251,219 Capital outlay
Subtotal Public Safety 4,368,097 4,407,625 1,851,057 1,861,366
Salaries and wages 1,636,594 2,041,959 942,014 941,851 Employee benefits 840,212 999,030 263,984 274,456 Services and supplies 1,471,423 1,355,954 645,059 645,059 Capital outlay 419,868 10,682
TOTAL EXPENDITURES 4,368,097 4,407,625 1,851,057 1,861,366
OTHER USES CONTINGENCY (Not to exceed 3% of total
expenditures) Operating Transfers Out (Schedule T)
Fire Dept Grant fund 58,041 General fund 22,119 ISF Liability Insurance Budget Reduction Plan
TOTAL EXPENDITURES AND OTHER USES 4,390,216 4,465,666 1,851,057 1,861,366
ENDING FUND BALANCE 3,107,061 2,218,125 2,467,745 2,456,178 TOTAL ENDING FUND BALANCE 3,107,061 2,218,125 2,467,745 2,456,178
TOTAL COMMITMENTS AND FUND BALANCE 7,497,277 6,683,791 4,318,802 4,317,544 CITY OF NORTH LAS VEGAS
(Local Government) Page 35SCHEDULE B - SPECIAL REVENUE FUNDS Form 13
FUND - PUBLIC SAFETY SUPPORT 11/1/2013
Function Summary
Public Safety
General Government
EXPENDITURES

(1) (2) (3) (4)ESTIMATED BUDGET YEAR ENDING 06/30/2015
ACTUAL PRIOR CURRENTYEAR ENDING YEAR ENDING TENTATIVE FINAL
06/30/13 06/30/14 APPROVED APPROVED
Property taxes - Current year 8,154,399 8,248,796 9,227,575 9,168,320 Property taxes - Prior year 6,118 Room Tax 383,888 400,000 400,000 400,000 Special Ad Valorem Tax 238,864
Federal Grants 357,028 Other Grants 26,962 Motor Veh Fuel Tx 1.75 926,852 933,460 970,825 970,825 Motor Veh Fuel Tx 2.35 772,976 780,750 873,201 873,201 Motor Veh Fuel Tx 1Cent 830,656 819,500 832,479 832,479 CCRFC-Roadway Maint. 1,170,525 1,780,000 1,842,914 1,842,914 Regional Transportation Commission 45,323
Fee-Police Other
Rents & Royalties Other 28,155 100,000 100,000 100,000 Interest 125 1,400 1,950 1,950 Donations and Contributions Refunds and Reimbursements 200 840 840 840 SUBTOTAL 12,942,071 13,064,746 14,249,784 14,190,529 OTHER FINANCING SOURCES
Sale of Equipment 17,186 Operating Transfers In (Schedule T)
Capital Projects - City Hall Other Funding 3,864,900 Debt Service (Ad Valorem) 116,993 116,993
SUBTOTAL OTHER FINANCING SOURCES 17,186 3,864,900 116,993 116,993
BEGINNING FUND BALANCE 9,662,026 10,892,355 11,889,545 11,889,545 Prior Period Adjustment 51,523
TOTAL BEGINNING FUND BALANCE 9,713,549 10,892,355 11,889,545 11,889,545
TOTAL AVAILABLE RESOURCES 22,672,806 27,822,001 26,256,322 26,197,067
CITY OF NORTH LAS VEGAS (Local Government) Page 36
SCHEDULE B - SPECIAL REVENUE FUNDS Form 12FUND - SPECIAL PURPOSE FUNDS 11/1/2013
Intergovernmental Revenues
REVENUES
Miscellaneous
Property Taxes
Charges for Services

(1) (2) (3) (4)ESTIMATED BUDGET YEAR ENDING 06/30/2015
ACTUAL PRIOR CURRENTYEAR ENDING YEAR ENDING TENTATIVE FINAL
06/30/13 06/30/14 APPROVED APPROVED
Salaries and wages 16,296 Employee benefits 6,589 Services and supplies 334,280 Capital outlay
357,165
Salaries and wages 1,297,301 1,381,429 1,394,641 1,393,815 Employee benefits 545,137 629,701 624,332 642,305 Services and supplies 1,141,727 2,666,040 2,680,339 2,680,339 Capital outlay
2,984,165 4,677,170 4,699,312 4,716,459
Salaries and wages 1,524,448 1,422,143 1,325,175 1,384,970 Employee benefits 635,158 664,122 602,489 650,821 Services and supplies 1,337,165 3,082,415 2,822,559 2,824,652 Capital outlay 26,962
3,523,733 5,168,680 4,750,223 4,860,443
Salaries and wages Employee benefits Services and supplies 635,404 853,216 864,847 864,847 Capital outlay
635,404 853,216 864,847 864,847
Salaries and wages 26 Employee benefits 8 Services and supplies 28,155 100,000 100,000 100,000 Capital outlay
28,189 100,000 100,000 100,000 SUBTOTAL 7,528,656 10,799,066 10,414,382 10,541,749
Function SummarySalaries and wages 2,838,071 2,803,572 2,719,816 2,778,785 Employee benefits 1,186,892 1,293,823 1,226,821 1,293,126 Services and supplies 3,476,731 6,701,671 6,467,745 6,469,838 Capital outlay 26,962
OTHER USES Operating Transfers Out (Schedule T)
General fund Debt service fund 714,370 1,482,401 2,320,524 2,320,524 Public Safety Tax Capital projects - Streets fund 1,442,500 1,449,489 957,487 957,487 Capital projects - Public Safety fund 1,660,000 1,547,500 967,000 967,000 Capital projects - Parks 654,000 830,800 830,800 Motor Equipment Fund 434,925 ISF Liability Insurance Budget Reduction Plan
TOTAL EXPENDITURES AND OTHER USES 11,780,451 15,932,456 15,490,193 15,617,560
ENDING FUND BALANCE 10,892,355 11,889,545 10,766,129 10,579,507 TOTAL ENDING FUND BALANCE 10,892,355 11,889,545 10,766,129 10,579,507
TOTAL COMMITMENTS AND FUND BALANCE 22,672,806 27,822,001 26,256,322 26,197,067 CITY OF NORTH LAS VEGAS Page 37
(Local Government) Form 13SCHEDULE B - SPECIAL REVENUE FUNDS 11/1/2013
FUND - SPECIAL PURPOSE FUNDS
Culture & Recreation
Community Support
Public Safety
EXPENDITURES
General Government
Public Works

(1) (2) (3) (4)ESTIMATED BUDGET YEAR ENDING 06/30/2015
ACTUAL PRIOR CURRENTYEAR ENDING YEAR ENDING TENTATIVE FINAL
06/30/13 06/30/14 APPROVED APPROVED
Residential park construction tax 332,595 200,000 230,000 230,000 Other
Interest earnings 2,888 6,750 5,600 5,600
Other SUBTOTAL 335,483 206,750 235,600 235,600 OTHER FINANCING SOURCES
Operating Transfers In (Schedule T)
BEGINNING FUND BALANCE 2,097,659 2,009,142 1,841,692 1,841,692 TOTAL BEGINNING FUND BALANCE 2,097,659 2,009,142 1,841,692 1,841,692
Prior period adjustmentsResidual equity transfers
TOTAL AVAILABLE RESOURCES 2,433,142 2,215,892 2,077,292 2,077,292
Culture and RecreationSalaries and wages Employee benefits Services and supplies 113,200 113,200 113,200 Capital outlay
Subtotal 113,200 113,200 113,200 OTHER USES
CONTINGENCY (Not to exceed 3% of totalexpenditures) Operating Transfers Out (Schedule T)
Capital Projects-Parks & Rec fund 424,000 261,000 639,309 639,309
TOTAL EXPENDITURES AND OTHER USES 424,000 374,200 752,509 752,509
ENDING FUND BALANCE 2,009,142 1,841,692 1,324,783 1,324,783 TOTAL ENDING FUND BALANCE 2,009,142 1,841,692 1,324,783 1,324,783
TOTAL COMMITMENTS AND FUND BALANCE 2,433,142 2,215,892 2,077,292 2,077,292
CITY OF NORTH LAS VEGAS
(Local Government) SCHEDULE B - SPECIAL REVENUE FUNDS
FUND - PARK CONSTRUCTION TAX Page 38Form 14
11/1/2013
Taxes
REVENUES
Miscellaneous
EXPENDITURES

(1) (2) (3) (4)ESTIMATED BUDGET YEAR ENDING 06/30/2015
ACTUAL PRIOR CURRENTYEAR ENDING YEAR ENDING TENTATIVE FINAL
06/30/13 06/30/14 APPROVED APPROVED
Federal grants 86,174 91,971 78,600 78,600 Other grants 86,041
Recreation fees 258,792 280,000 260,000 260,000 Safekey 1,121,807 1,200,000 1,200,000 1,200,000 Swimming Pool 103,967 89,000 80,000 80,000 Other 324,255 869,774 326,974 326,974
Returned Check Penalties 225
Interest earnings 429 800 700 700 Miscellaneous - Other 10,000 10,000 Contributions and donations from private sources 41,028 237,200 30,000 30,000 P & R Reimbursements 9,930 10,000 10,000 Other 107,375 SUBTOTAL 2,032,648 2,876,120 1,996,274 1,996,274 OTHER FINANCING SOURCES
Operating Transfers In (Schedule T)
Sp. Rev - Parks & Rec Activities & Programs 375,000 375,000
SUBTOTAL OTHER FINANCING SOURCES 375,000 375,000
BEGINNING FUND BALANCE 903,425 1,310,541 1,860,669 1,860,669 TOTAL BEGINNING FUND BALANCE 903,425 1,310,541 1,860,669 1,860,669
Prior period adjustmentsResidual equity transfers
TOTAL AVAILABLE RESOURCES 2,936,073 4,186,661 4,231,943 4,231,943
Culture and RecreationSalaries and wages 1,018,015 1,370,088 1,254,475 1,254,271 Employee benefits 181,245 220,846 207,586 209,764 Services and supplies 426,272 689,429 725,522 725,522 Capital outlay 45,629 303,691 303,691
Subtotal 1,625,532 2,325,992 2,491,274 2,493,248 OTHER USES
CONTINGENCY (Not to exceed 3% of totalexpenditures)
Operating Transfers Out (Schedule T) Sp. Rev -Special Events 375,000 375,000 ISF Liability Insurance
Budget Reduction Plan
TOTAL EXPENDITURES AND OTHER USES 1,625,532 2,325,992 2,866,274 2,868,248
ENDING FUND BALANCE 1,310,541 1,860,669 1,365,669 1,363,695 TOTAL ENDING FUND BALANCE 1,310,541 1,860,669 1,365,669 1,363,695
TOTAL COMMITMENTS AND FUND BALANCE 2,936,073 4,186,661 4,231,943 4,231,943
CITY OF NORTH LAS VEGAS(Local Government) Page 39
SCHEDULE B - SPECIAL REVENUE FUNDS Form 14FUND - PARKS AND RECREATION SUPPORT 11/1/2013
EXPENDITURES
Intergovernmental Revenues
REVENUES
Miscellaneous
Charges for Services
Fines and Forfeits

(1) (2) (3) (4)ESTIMATED BUDGET YEAR ENDING 06/30/2015
ACTUAL PRIOR CURRENTYEAR ENDING YEAR ENDING TENTATIVE FINAL
06/30/13 06/30/14 APPROVED APPROVED
Judicial 382,308 363,191 363,191 363,191 Trust fund deposits
Other forfeits
Refunds and reimbursements 616,341 675,000 675,000 675,000 SUBTOTAL 998,649 1,038,191 1,038,191 1,038,191 OTHER FINANCING SOURCES
Operating Transfers In (Schedule T)
BEGINNING FUND BALANCE 2,085,770 2,081,986 949,780 949,780 Prior period adjustments
TOTAL BEGINNING FUND BALANCE 2,085,770 2,081,986 949,780 949,780
Residual equity transfersTOTAL AVAILABLE RESOURCES 3,084,419 3,120,177 1,987,971 1,987,971
JudicialSalaries and wages 301,398 299,865 298,867 298,826 Employee benefits 136,996 149,667 146,577 151,613 Services and supplies 264,039 955,865 280,458 280,458 Capital outlay
Subtotal 702,433 1,405,397 725,902 730,897 OTHER USES
CONTINGENCY (Not to exceed 3% of totalexpenditures)
Operating Transfers Out (Schedule T)General fund 465,000 Debt service fund 300,000 300,000 300,000 300,000
Budget Reduction Plan
TOTAL EXPENDITURES AND OTHER USES 1,002,433 2,170,397 1,025,902 1,030,897
ENDING FUND BALANCE 2,081,986 949,780 962,069 957,074 TOTAL ENDING FUND BALANCE 2,081,986 949,780 962,069 957,074
TOTAL COMMITMENTS AND FUND BALANCE 3,084,419 3,120,177 1,987,971 1,987,971
CITY OF NORTH LAS VEGAS
(Local Government) SCHEDULE B - SPECIAL REVENUE FUNDS
FUND - MUNICIPAL COURT SUPPORT Page 40Form 14
11/1/2013
EXPENDITURES
Charges for Services
REVENUES
Miscellaneous
Fines and Forfeits

(1) (2) (3) (4)ESTIMATED BUDGET YEAR ENDING 06/30/2015
ACTUAL PRIOR CURRENTYEAR ENDING YEAR ENDING TENTATIVE FINAL
06/30/13 06/30/14 APPROVED APPROVED
Property Taxes - Current year 28,335,951 27,685,603 28,664,382 28,480,300 Property Taxes - Prior year (4,451)
Federal grants Other
Prisoner board 98,000 98,000 98,000 Other
Other
Interest earnings Misc - Refunds and Reimbursement 98 Other 7,059 4,970
SUBTOTAL 28,338,657 27,788,573 28,762,382 28,578,300
OTHER FINANCING SOURCESSale of Equipment 23,556
Operating Transfers In (Schedule T) General fund 285,490
Motor Equipment fund 590,402
BEGINNING FUND BALANCE 4,087,849 2,168,530 994,495 994,495 179,990
TOTAL BEGINNING FUND BALANCE 4,267,839 2,168,530 994,495 994,495
Residual equity transfersTOTAL AVAILABLE RESOURCES 33,220,454 30,242,593 29,756,877 29,572,795
CITY OF NORTH LAS VEGAS(Local Government)
SCHEDULE B - SPECIAL REVENUE FUNDSPage 41
FUND - PUBLIC SAFETY TAX Form 1211/1/2013
Taxes
REVENUES
Intergovernmental Revenues
Charges for Services
Fines and Forfeitures
Miscellaneous

(1) (2) (3) (4)ESTIMATED BUDGET YEAR ENDING 06/30/2015
ACTUAL PRIOR CURRENTYEAR ENDING YEAR ENDING TENTATIVE FINAL
06/30/13 06/30/14 APPROVED APPROVED
PoliceSalaries and wages 13,083,377 13,434,212 13,312,685 13,296,596 Employee benefits 8,467,829 8,510,171 8,759,594 8,803,400 Services and supplies 2,557,185 2,888,319 2,893,036 2,893,036 Capital outlay
Safe Streets 2000Salaries and wages Employee benefits Services and supplies 67,089 75,000 75,000 75,000 Capital outlay
DetentionSalaries and wages 1,050,523 719,327 706,774 706,156 Employee benefits 702,465 467,732 450,082 451,082 Services and supplies 3,626,459 2,962,184 1,627,126 1,627,126 Capital outlay
Animal ControlSalaries and wages 114,145 121,097 78,365 78,365 Employee benefits 49,572 58,970 34,455 35,455 Services and supplies 9,339 11,086 11,012 11,012 Capital outlay
SUBTOTAL 29,727,983 29,248,098 27,948,129 27,977,228
Salaries and wages 14,248,045 14,274,636 14,097,824 14,081,117 Employee benefits 9,219,866 9,036,873 9,244,131 9,289,937 Services and supplies 6,260,072 5,936,589 4,606,174 4,606,174 Capital outlay
OTHER USES CONTINGENCY (Not to exceed 3% of total
expenditures)
Operating Transfers Out (Schedule T)More Cops Sales Tax 590,402 Capital Projects - Public Safety Police ISF - Employee Benefits 733,539 ISF Liability Insurance Budget Reduction Plan
TOTAL EXPENDITURES AND OTHER USES 31,051,924 29,248,098 27,948,129 27,977,228
ENDING FUND BALANCE 2,168,530 994,495 1,808,748 1,595,567 TOTAL ENDING FUND BALANCE 2,168,530 994,495 1,808,748 1,595,567
TOTAL COMMITMENTS AND FUND BALANCE 33,220,454 30,242,593 29,756,877 29,572,795
CITY OF NORTH LAS VEGAS Page 42(Local Government) Form 13
SCHEDULE B - SPECIAL REVENUE FUNDS 11/1/2013FUND - PUBLIC SAFETY TAX
Function Summary
Public Safety
EXPENDITURES

(1) (2) (3) (4)ESTIMATED BUDGET YEAR ENDING 06/30/2015
ACTUAL PRIOR CURRENTYEAR ENDING YEAR ENDING TENTATIVE FINAL
06/30/13 06/30/14 APPROVED APPROVED
More Cops Sales Tax 9,048,291 9,210,000 9,897,564 9,897,564
Interest earnings 5,304 17,220 13,400 13,400 Miscellaneous-Other
SUBTOTAL 9,053,595 9,227,220 9,910,964 9,910,964 OTHER FINANCING SOURCES
Sale of Equipment 2,347 Operating Transfers In (Schedule T)
Public Safety Tax fund 590,402 Motor Equipment fund 539,020
BEGINNING FUND BALANCE 5,165,868 5,647,492 3,083,198 3,083,198
TOTAL BEGINNING FUND BALANCE 5,165,868 5,647,492 3,083,198 3,083,198
Residual equity transfersTOTAL AVAILABLE RESOURCES 14,812,212 15,413,732 12,994,162 12,994,162
PoliceSalaries and wages 5,103,709 5,371,354 5,539,523 5,523,483 Employee benefits 3,361,607 3,943,815 4,109,503 4,109,503 Services and supplies 439,404 915,365 817,241 817,241 Capital outlay
8,904,720 10,230,534 10,466,267 10,450,227
OTHER USES CONTINGENCY (Not to exceed 3% of total
expenditures) Operating Transfers Out (Schedule T)
Motor Equipment fund 260,000 ISF Liability Insurance 2,100,000 Budget Reduction Plan
TOTAL EXPENDITURES AND OTHER USES 9,164,720 12,330,534 10,466,267 10,450,227
ENDING FUND BALANCE 5,647,492 3,083,198 2,527,895 2,543,935 TOTAL ENDING FUND BALANCE 5,647,492 3,083,198 2,527,895 2,543,935
TOTAL COMMITMENTS AND FUND BALANCE 14,812,212 15,413,732 12,994,162 12,994,162
CITY OF NORTH LAS VEGAS (Local Government) Page 43
SCHEDULE B - SPECIAL REVENUE FUNDS Form 14FUND - MORE COPS SALES TAX 11/1/2013
Public SafetyEXPENDITURES
Intergovernmental
REVENUES
Miscellaneous

(1) (2) (3) (4)ESTIMATED BUDGET YEAR ENDING 06/30/2015
ACTUAL PRIOR CURRENTYEAR ENDING YEAR ENDING TENTATIVE FINAL
06/30/13 06/30/14 APPROVED APPROVED
Regional Transportation 197,088 3,526,820 3,526,820 Clark County Flood Control District 29,389,041 5,493,100 39,861,388 39,861,388
Contributions & Donations 42,646 SUBTOTAL 29,628,775 5,493,100 43,388,208 43,388,208
OTHER FINANCING SOURCES Sale of Equipment
Operating Transfers In (Schedule T) Str Maint., Parks, Fire Tax Override 1,660,000 1,547,500 967,000 967,000
BEGINNING FUND BALANCE 7,228,530 8,040,066 8,065,890 8,065,890
TOTAL BEGINNING FUND BALANCE 7,228,530 8,040,066 8,065,890 8,065,890
Residual equity transfersTOTAL AVAILABLE RESOURCES 38,517,305 15,080,666 52,421,098 52,421,098
Salaries and wages Employee benefits Services and supplies Capital outlay
Salaries and wages 71,682 Employee benefits 42,791 Services and supplies 44,706 765,000 417,000 417,000 Capital outlay 898,493 586,676 2,063,000 2,063,000
1,057,672 1,351,676 2,480,000 2,480,000
Salaries and wages 452,842 330,600 2,101,542 2,101,542 Employee benefits 230,833 144,900 928,849 928,849 Services and supplies 394,321 891,500 2,069,419 2,069,419 Capital outlay 28,341,571 4,296,100 38,288,398 38,288,398
29,419,567 5,663,100 43,388,208 43,388,208
Salaries and wages 524,524 330,600 2,101,542 2,101,542 Employee benefits 273,624 144,900 928,849 928,849 Services and supplies 439,027 1,656,500 2,486,419 2,486,419 Capital outlay 29,240,064 4,882,776 40,351,398 40,351,398
TOTAL EXPENDITURES 30,477,239 7,014,776 45,868,208 45,868,208 OTHER USES CONTINGENCY (Not to exceed 3% of total
expenditures) Operating Transfers Out (Schedule T)
Motor Equipment fund TOTAL EXPENDITURES AND OTHER USES 30,477,239 7,014,776 45,868,208 45,868,208
ENDING FUND BALANCE 8,040,066 8,065,890 6,552,890 6,552,890 TOTAL ENDING FUND BALANCE 8,040,066 8,065,890 6,552,890 6,552,890
TOTAL COMMITMENTS AND FUND BALANCE 38,517,305 15,080,666 52,421,098 52,421,098
CITY OF NORTH LAS VEGAS (Local Government) Page 44
SCHEDULE B - CAPITAL PROJECTS Form 14FUND - PUBLIC SAFETY CAPITAL PROJECTS 11/1/2013
REVENUES
Intergovernmental
Miscellaneous
EXPENDITURES
Function Summary
Public Works
Public Safety
General Government

(1) (2) (3) (4)ESTIMATED BUDGET YEAR ENDING 06/30/2015
ACTUAL PRIOR CURRENTYEAR ENDING YEAR ENDING TENTATIVE FINAL
06/30/13 06/30/14 APPROVED APPROVED
Federal Grants 1,187,846 State Grants 25,418,510 21,386,564 21,386,564 Regional Transportation 11,082,102 5,237,900 43,533,500 43,533,500 Clark County Flood Control District 1,773,162
Contributions & Donations 546,900 157,800 157,800 SUBTOTAL 14,043,110 31,203,310 65,077,864 65,077,864
OTHER FINANCING SOURCES Sale of Equipment
Operating Transfers In (Schedule T) NSP-Neighborhood Stabilization fund 4,010 4,864,000 Community Development fund 454,748 350,000 350,000 350,000 Str Maint., Parks, Fire Tax Override 1,442,500 1,300,000 957,487 957,487 Fuel Taxes - Road Operations fund 149,489
BEGINNING FUND BALANCE 3,355,189 3,677,442 2,820,342 2,820,342
TOTAL BEGINNING FUND BALANCE 3,355,189 3,677,442 2,820,342 2,820,342
Residual equity transfersTOTAL AVAILABLE RESOURCES 19,299,557 41,544,241 69,205,693 69,205,693
Salaries and wages Employee benefits Services and supplies Capital outlay
Salaries and wages 720,573 2,300,727 4,668,982 4,668,982 Employee benefits 408,679 996,775 2,029,811 2,029,811 Services and supplies 1,455,229 3,244,497 4,775,568 4,775,568 Capital outlay 13,037,634 32,181,900 56,752,495 56,752,495
15,622,115 38,723,899 68,226,856 68,226,856
Salaries and wages Employee benefits Services and supplies
TOTAL EXPENDITURES 15,622,115 38,723,899 68,226,856 68,226,856 OTHER USES CONTINGENCY (Not to exceed 3% of total
expenditures) Operating Transfers Out (Schedule T)TOTAL EXPENDITURES AND OTHER USES 15,622,115 38,723,899 68,226,856 68,226,856
ENDING FUND BALANCE 3,677,442 2,820,342 978,837 978,837 TOTAL ENDING FUND BALANCE 3,677,442 2,820,342 978,837 978,837
TOTAL COMMITMENTS AND FUND BALANCE 19,299,557 41,544,241 69,205,693 69,205,693 CITY OF NORTH LAS VEGAS
(Local Government) Page 45SCHEDULE B - CAPITAL PROJECTS Form 14
FUND - CAPITAL PROJECTS STREET IMPROVEMENTS 11/1/2013
Public Works
Culture & Recreation
REVENUES
Intergovernmental
Miscellaneous
EXPENDITURESPublic Safety

(1) (2) (3) (4)ESTIMATED BUDGET YEAR ENDING 06/30/2015
ACTUAL PRIOR CURRENTYEAR ENDING YEAR ENDING TENTATIVE FINAL
06/30/13 06/30/14 APPROVED APPROVED
Federal Grants 40,968,699 10,987,587 1,189,800 1,189,800 County Grants 10,474 6,532,000 6,532,000 Regional Transportation 3,501,000 3,501,000
Contributions & Donations SUBTOTAL 40,968,699 10,998,061 11,222,800 11,222,800
OTHER FINANCING SOURCES Sale of Equipment
Operating Transfers In (Schedule T) Park District III 111,000 639,309 639,309 Park District IV 301,000 113,000 Park District V 123,000 37,000 Str Maint., Parks, Fire Tax Override 654,000 830,800 830,800
BEGINNING FUND BALANCE 1,259,932 1,600,082 2,297,082 2,297,082
TOTAL BEGINNING FUND BALANCE 1,259,932 1,600,082 2,297,082 2,297,082
Residual equity transfersTOTAL AVAILABLE RESOURCES 42,652,631 13,513,143 14,989,991 14,989,991
Salaries and wages Employee benefits Services and supplies
Salaries and wages Employee benefits Services and supplies Capital outlay
Salaries and wages Employee benefits Services and supplies Capital outlay
Salaries and wages 365,842 690,861 607,633 607,633 Employee benefits 206,233 301,934 265,192 265,192 Services and supplies 921,266 828,971 772,975 772,975 Capital outlay 39,559,208 9,394,295 13,039,309 13,039,309
41,052,549 11,216,061 14,685,109 14,685,109 TOTAL EXPENDITURES 41,052,549 11,216,061 14,685,109 14,685,109 OTHER USES CONTINGENCY (Not to exceed 3% of total
expenditures) Operating Transfers Out (Schedule T)TOTAL EXPENDITURES AND OTHER USES 41,052,549 11,216,061 14,685,109 14,685,109
ENDING FUND BALANCE 1,600,082 2,297,082 304,882 304,882 TOTAL ENDING FUND BALANCE 1,600,082 2,297,082 304,882 304,882
TOTAL COMMITMENTS AND FUND BALANCE 42,652,631 13,513,143 14,989,991 14,989,991 CITY OF NORTH LAS VEGAS
(Local Government) Page 46SCHEDULE B - CAPITAL PROJECTS Form 14
FUND - CAPITAL PROJECTS PARKS AND RECREATION 11/1/2013
Public Works
Culture and Recreation
REVENUES
Intergovernmental
Miscellaneous
EXPENDITURESGeneral Government
Public Safety

(1) (2) (3) (4)ESTIMATED BUDGET YEAR ENDING 06/30/2015
ACTUAL PRIOR CURRENTYEAR ENDING YEAR ENDING TENTATIVE FINAL
06/30/13 06/30/14 APPROVED APPROVED
Federal Grants
Contributions & Donations SUBTOTAL
OTHER FINANCING SOURCES Sale of Equipment
Operating Transfers In (Schedule T) Park District III Park District IV Park District V Str Maint., Parks, Fire Tax Override
BEGINNING FUND BALANCE 305,947 184,447 144,447 144,447
TOTAL BEGINNING FUND BALANCE 305,947 184,447 144,447 144,447
Residual equity transfersTOTAL AVAILABLE RESOURCES 305,947 184,447 144,447 144,447
Salaries and wages 25,000 Employee benefits Services and supplies 15,000 Capital outlay 121,500
121,500 40,000
Salaries and wages Employee benefits Services and supplies
Salaries and wages Employee benefits Services and supplies Capital outlay
Salaries and wages Employee benefits Services and supplies Capital outlay
TOTAL EXPENDITURES 121,500 40,000 OTHER USES CONTINGENCY (Not to exceed 3% of total
expenditures) Operating Transfers Out (Schedule T)TOTAL EXPENDITURES AND OTHER USES 121,500 40,000
ENDING FUND BALANCE 184,447 144,447 144,447 144,447 TOTAL ENDING FUND BALANCE 184,447 144,447 144,447 144,447
TOTAL COMMITMENTS AND FUND BALANCE 305,947 184,447 144,447 144,447 CITY OF NORTH LAS VEGAS
(Local Government) Page 47SCHEDULE B - CAPITAL PROJECTS Form 14
FUND - CAPITAL PROJECTS GENERAL GOVERNMENT 11/1/2013
Public Works
Culture and Recreation
REVENUES
Intergovernmental
Miscellaneous
EXPENDITURESGeneral Government
Public Safety

(1) (2) (3) (4)ESTIMATED BUDGET YEAR ENDING 06/30/2015
ACTUAL PRIOR CURRENTYEAR ENDING YEAR ENDING TENTATIVE FINAL
06/30/13 06/30/14 APPROVED APPROVED
Interest earnings 15,046 31,000 11,350 11,350 SUBTOTAL 15,046 31,000 11,350 11,350
OTHER FINANCING SOURCES Sale of Equipment
Operating Transfers In (Schedule T) Public Safety Projects, 2006A Bonds 3,200,000 2,790,000 Parks and Rec Projects, 2006A Bonds 1,450,000 IT Projects, 2006A Bonds 550,000 550,000
BEGINNING FUND BALANCE 9,466,672 7,511,152 5,466,627 5,209,112
TOTAL BEGINNING FUND BALANCE 9,466,672 7,511,152 5,466,627 5,209,112
Residual equity transfersTOTAL AVAILABLE RESOURCES 12,681,718 11,782,152 6,027,977 5,770,462
Salaries and wages 83,266 73,000 8,750 8,750 Employee benefits 5,355 33,000 3,750 3,750 Services and supplies 705,037 1,465,288 983,300 983,300 Capital outlay 1,167,056 431,237 170,000 170,000
1,960,714 2,002,525 1,165,800 1,165,800
Salaries and wages 311 9,125 22,094 22,094 Employee benefits 19 4,125 9,468 9,468 Services and supplies 26,750 319,688 319,688 Capital outlay 7,599 257,515 617,500 617,500
7,929 297,515 968,750 968,750
Salaries and wages 786 15,800 Employee benefits 516 5,900 Services and supplies 21 11,300
1,323 33,000
Salaries and wages 22,175 22,175 Employee benefits 9,551 9,551 Services and supplies 60,358 60,358 Capital outlay 600 1,092,000 1,092,000
600 1,184,084 1,184,084 TOTAL EXPENDITURES 1,970,566 2,333,040 3,318,634 3,318,634 OTHER USES CONTINGENCY (Not to exceed 3% of total
expenditures) Operating Transfers Out (Schedule T)
IT Projects, 2006A Bonds 3,200,000 4,240,000 Public Safety Projects, 2006A Bonds 550,000 550,000
TOTAL EXPENDITURES AND OTHER USES 5,170,566 6,573,040 3,868,634 3,868,634
ENDING FUND BALANCE 7,511,152 5,209,112 2,159,343 1,901,828 TOTAL ENDING FUND BALANCE 7,511,152 5,209,112 2,159,343 1,901,828
TOTAL COMMITMENTS AND FUND BALANCE 12,681,718 11,782,152 6,027,977 5,770,462 CITY OF NORTH LAS VEGAS
(Local Government) Page 48SCHEDULE B - CAPITAL PROJECTS Form 14
FUND - CAPITAL PROJECTS MUNICIPAL BUILDING BONDS 11/1/2013
Public Works
Culture and Recreation
REVENUES
Miscellaneous
EXPENDITURESGeneral Government
Public Safety

(1) (2) (3) (4)ESTIMATED BUDGET YEAR ENDING 06/30/2015
ACTUAL PRIOR CURRENTYEAR ENDING YEAR ENDING TENTATIVE FINAL
06/30/13 06/30/14 APPROVED APPROVED
Interest earnings 11,406 18,400 11,500 11,500 SUBTOTAL 11,406 18,400 11,500 11,500
OTHER FINANCING SOURCES Sale of Equipment
Operating Transfers In (Schedule T) Library fund 155,875
BEGINNING FUND BALANCE 10,093,485 8,475,417 3,500,267 3,500,267
TOTAL BEGINNING FUND BALANCE 10,093,485 8,475,417 3,500,267 3,500,267
Residual equity transfersTOTAL AVAILABLE RESOURCES 10,260,766 8,493,817 3,511,767 3,511,767
Salaries and wages 2,530 Employee benefits 1,217 Services and supplies 24,685 1,128,650 2,779,600 2,779,600 Capital outlay 1,722,133
1,750,565 1,128,650 2,779,600 2,779,600
Salaries and wages 935 Employee benefits 69 Services and supplies 1 Capital outlay
1,005
Salaries and wages 21,052 Employee benefits 12,179 Services and supplies 548
33,779
Salaries and wages Employee benefits Services and supplies Capital outlay
TOTAL EXPENDITURES 1,785,349 1,128,650 2,779,600 2,779,600 OTHER USES CONTINGENCY (Not to exceed 3% of total
expenditures) Operating Transfers Out (Schedule T)
Street Maint., Parks & Fire Tax Override 3,864,900 TOTAL EXPENDITURES AND OTHER USES 1,785,349 4,993,550 2,779,600 2,779,600
ENDING FUND BALANCE 8,475,417 3,500,267 732,167 732,167 TOTAL ENDING FUND BALANCE 8,475,417 3,500,267 732,167 732,167
TOTAL COMMITMENTS AND FUND BALANCE 10,260,766 8,493,817 3,511,767 3,511,767 CITY OF NORTH LAS VEGAS
(Local Government) Page 49SCHEDULE B - CAPITAL PROJECTS Form 14
FUND - CAPITAL PROJECTS CIVIC CENTER BONDS 11/1/2013
Public Works
Culture and Recreation
REVENUES
Miscellaneous
EXPENDITURESGeneral Government
Public Safety

(1) (2) (3) (4)ESTIMATED BUDGET YEAR ENDING 06/30/2015
ACTUAL PRIOR CURRENTYEAR ENDING YEAR ENDING TENTATIVE FINAL
06/30/13 06/30/14 APPROVED APPROVED
Interest earnings 2,281 5,800 8,100 8,100 Interest earnings - Change in Value Other - Sid Assessments 2,202,185 2,040,855 2,016,425 2,016,425
Intergovernmental - Library District 519,000 519,000 Other
Other forfeits 3,040
SUBTOTAL 2,207,506 2,046,655 2,543,525 2,543,525
OTHER FINANCING SOURCESOperating Transfers In (Schedule T)
General fund 4,054,605 2,558,825 7,520,284 7,520,284
Library fund 380,875 530,500 Sp. Rev. - Tax Override fund 714,370 1,482,401 2,320,524 2,320,524 Sp. Rev. - Court Facility Admin fund 300,000 300,000 300,000 300,000
SUBTOTAL OTHER FINANCING SOURCES 5,449,850 4,871,726 10,140,808 10,140,808 TOTAL REVENUES AND OTHER USES 7,657,356 6,918,381 12,684,333 12,684,333
BEGINNING FUND BALANCE 3,109,505 2,933,390 2,939,190 2,939,190 TOTAL BEGINNING FUND BALANCE 3,109,505 2,933,390 2,939,190 2,939,190
Prior period adjustmentsResidual equity transfers
TOTAL AVAILABLE RESOURCES 10,766,861 9,851,771 15,623,523 15,623,523
CITY OF NORTH LAS VEGAS(Local Government)
SCHEDULE C - DEBT SERVICE FUND Page 50Form 15
THE ABOVE DEBT IS REPAID BY OPERATING RESOURCES 11/1/2013
Miscellaneous
REVENUES
Intergovernmental Revenue
Fines and Forfeits

(1) (2) (3) (4)ESTIMATED BUDGET YEAR ENDING 06/30/2015
ACTUAL PRIOR CURRENTYEAR ENDING YEAR ENDING TENTATIVE FINAL
06/30/13 06/30/14 APPROVED APPROVEDType: JUDICIAL/PUBLIC SAFETY BLDGS (5/02)
Principal Interest Fiscal Agent charges Reserves-Increase or (Decrease) Other (Specify)
Subtotal TOTAL RESERVED (MEMO ONLY)Type: JUDICIAL/PUBLIC SAFETY BLDGS (03/03)
Principal 1,555,000 Interest 386,631 324,431 324,431 324,431 Fiscal Agent charges 600 350 1,100 1,100 Reserves-Increase or (Decrease) Other (Specify)
Subtotal 1,942,231 324,781 325,531 325,531 TOTAL RESERVED (MEMO ONLY)Type: CITY HALL BUILDING BONDS
Principal 1,255,000 1,315,000 1,365,000 1,365,000 Interest 4,777,950 4,777,950 Fiscal Agent charges 1,050 400 650 650 Reserves-Increase or (Decrease) Other (Specify)
Subtotal 1,256,050 1,315,400 6,143,600 6,143,600 TOTAL RESERVED (MEMO ONLY)TYPE JUDICIAL/PUBLIC SAFETY BLDGS (2007A)
Principal Interest 316,645 316,645 316,645 316,645 Fiscal Agent charges 350 350 350 350 Reserves-Increase or (Decrease) Other (Specify)
Subtotal 316,995 316,995 316,995 316,995 TOTAL RESERVED (MEMO ONLY)Type: S.I.A.D. #58 02/01/02 (CRAIG ROAD)
Principal Interest Fiscal Agent charges Reserves-Increase or (Decrease) Other (Specify)
Subtotal TOTAL RESERVED (MEMO ONLY)Type: S.I.A.D. #59
Principal 20,700 17,600 Interest 1,240 352 Fiscal Agent charges 4,847 1,510 700 700 Reserves-Increase or (Decrease) Other (Specify)
Subtotal 26,787 19,462 700 700 TOTAL RESERVED (MEMO ONLY)Continued to next page
CITY OF NORTH LAS VEGAS (Local Government)
SCHEDULE C - DEBT SERVICE FUND Page 51Form 16
THE ABOVE DEBT IS REPAID BY OPERATING RESOURCES 11/1/2013
EXPENDITURES AND RESERVES

(1) (2) (3) (4)ESTIMATED BUDGET YEAR ENDING 06/30/2015
ACTUAL PRIOR CURRENTYEAR ENDING YEAR ENDING TENTATIVE FINAL
06/30/13 06/30/14 APPROVED APPROVEDType: S.I.A.D. #61 Ann Road
Principal 598,500 281,200 284,400 284,400 Interest 59,087 42,368 31,572 31,572 Fiscal Agent charges 2,002 2,050 3,925 3,925 Reserves-Increase or (Decrease) Other (Specify)
Subtotal 659,589 325,618 319,897 319,897 TOTAL RESERVED (MEMO ONLY)Type: S.I.A.D. #62 Clayton Street
Principal 126,400 131,200 136,300 136,300 Interest 24,934 20,049 14,977 14,977 Fiscal Agent charges 1,899 2,220 4,095 4,095 Reserves-Increase or (Decrease) Other (Specify)
Subtotal 153,233 153,469 155,372 155,372 TOTAL RESERVED (MEMO ONLY)Type: S.I.A.D. # 63 (Lamb Blvd)
Principal 1,240,000 1,290,000 1,340,000 1,340,000 Interest 300,306 249,706 197,106 197,106 Fiscal Agent charges 2,580 2,600 3,350 3,350 Reserves-Increase or (Decrease) Other (Specify)
Subtotal 1,542,886 1,542,306 1,540,456 1,540,456 TOTAL RESERVED (MEMO ONLY)Type: Building Projects Bond
Principal 1,000,000 2,020,000 2,020,000 Interest 714,362 693,462 630,344 630,344 Fiscal Agent charges 500 500 Reserves-Increase or (Decrease) Other (Specify)
Subtotal 714,362 1,693,462 2,650,844 2,650,844 TOTAL RESERVED (MEMO ONLY)Type: 2011 Refunding Bonds
Principal Interest 1,220,738 1,220,738 1,220,738 1,220,738 Fiscal Agent charges 600 350 600 600 Reserves-Increase or (Decrease) Other (Specify)
Subtotal 1,221,338 1,221,088 1,221,338 1,221,338 TOTAL RESERVED (MEMO ONLY)Continued to next page
CITY OF NORTH LAS VEGAS (Local Government)
SCHEDULE C - DEBT SERVICE FUND Page 52Form 16
THE ABOVE DEBT IS REPAID BY OPERATING RESOURCES 11/1/2013
EXPENDITURES AND RESERVES

(1) (2) (3) (4)ESTIMATED BUDGET YEAR ENDING 06/30/2015
ACTUAL PRIOR CURRENTYEAR ENDING YEAR ENDING TENTATIVE FINAL
06/30/13 06/30/14 APPROVED APPROVEDType:
Principal Interest Fiscal Agent charges Reserves-Increase or (Decrease) Other (Specify)
Subtotal TOTAL RESERVED (MEMO ONLY)Type:
Principal Interest Fiscal Agent charges Reserves-Increase or (Decrease) Other (Specify)
Subtotal TOTAL RESERVED (MEMO ONLY)
Principal 4,795,600 4,035,000 5,145,700 5,145,700 Interest 3,023,943 2,867,751 7,513,763 7,513,763 Fiscal Agent charges 13,928 9,830 15,270 15,270 Reserves-Increase or (Decrease) Refunding Bonds Issuance costs
Total Expenditures 7,833,471 6,912,581 12,674,733 12,674,733
OTHER USES
Operating Transfers Out (Schedule T)
TOTAL EXPENDITURES AND OTHER USES 7,833,471 6,912,581 12,674,733 12,674,733
ENDING FUND BALANCE 2,933,390 2,939,190 2,948,790 2,948,790 TOTAL ENDING FUND BALANCE 2,933,390 2,939,190 2,948,790 2,948,790 TOTAL COMMITMENTS AND FUND BALANCE 10,766,861 9,851,771 15,623,523 15,623,523
CITY OF NORTH LAS VEGAS (Local Government)
Page 53SCHEDULE C - DEBT SERVICE FUND Form 16
THE ABOVE DEBT IS REPAID BY OPERATING RESOURCES 11/1/2013
Summary
EXPENDITURES AND RESERVES

(1) (2) (3) (4)ESTIMATED BUDGET YEAR ENDING 06/30/2015
ACTUAL PRIOR CURRENTYEAR ENDING YEAR ENDING TENTATIVE FINAL
06/30/13 06/30/14 APPROVED APPROVED
Property taxes - Current year 971,544 663,698 Property taxes - Prior year (1,268)
Interest earnings 78
SUBTOTAL 970,354 663,698
OTHER FINANCING SOURCESOperating Transfers In (Schedule T)
SUBTOTAL OTHER FINANCING SOURCES
BEGINNING FUND BALANCE 243,501 351,480 373,922 373,922 Prior period adjustments 6,672
TOTAL BEGINNING FUND BALANCE 250,173 351,480 373,922 373,922
Residual equity transfersTOTAL AVAILABLE RESOURCES 1,220,527 1,015,178 373,922 373,922
CITY OF NORTH LAS VEGAS(Local Government)
SCHEDULE C - DEBT SERVICE FUND Page 54Form 17
THE ABOVE DEBT IS REPAID BY PROPERTY TAXES (DEBT RATE) 11/1/2013
Taxes
REVENUES
Miscellaneous

(1) (2) (3) (4)ESTIMATED BUDGET YEAR ENDING 06/30/2015
ACTUAL PRIOR CURRENTYEAR ENDING YEAR ENDING TENTATIVE FINAL
06/30/13 06/30/14 APPROVED APPROVEDTYPE Debt - 2007 Street Refunding Bonds
Principal 228,000 240,000 247,000 247,000 Interest 28,442 19,481 9,929 9,929 Fiscal Agent charges 500 Reserves-Increase or (Decrease) Other (Specify)
Subtotal 256,942 259,481 256,929 256,929 TOTAL RESERVED (MEMO ONLY)TYPE G.O. Street Refunding 05/01/02
Principal 570,000 365,000 Interest 41,505 16,425 Fiscal Agent charges 600 350 Reserves-Increase or (Decrease) Other (Specify)
Subtotal 612,105 381,775 TOTAL RESERVED (MEMO ONLY)Type: G.O. Jail 2004
Principal Interest Fiscal Agent charges Reserves-Increase or (Decrease) Other (Specify)
Subtotal TOTAL RESERVED (MEMO ONLY)TYPE G.O. Street Improvement 12/01/95
Principal Interest Fiscal Agent charges Reserves-Increase or (Decrease) Other (Specify)
Subtotal TOTAL RESERVED (MEMO ONLY)
Principal 798,000 605,000 247,000 247,000 Interest 69,947 35,906 9,929 9,929 Fiscal Agent charges 1,100 350 Services and supplies Reserves-Increase or (Decrease)
Subtotal 869,047 641,256 256,929 256,929
OTHER USESOperating Transfers Out (Schedule T)
Str Maint., Parks, Fire Tax Override 116,993 116,993
ENDING FUND BALANCE 351,480 373,922 TOTAL ENDING FUND BALANCE 351,480 373,922
TOTAL COMMITMENTS AND FUND BALANCE 1,220,527 1,015,178 373,922 373,922
CITY OF NORTH LAS VEGAS Page 55(Local Government) Form 18
SCHEDULE C - DEBT SERVICE FUND 11/1/2013THE ABOVE DEBT IS REPAID BY PROPERTY TAXES (DEBT RATE)
Summary
EXPENDITURES AND RESERVES

(1) (2) (3) (4)ESTIMATED BUDGET YEAR ENDING 06/30/2015
ACTUAL PRIOR CURRENTYEAR ENDING YEAR ENDING TENTATIVE FINAL
06/30/13 06/30/14 APPROVED APPROVED
Charges for ServiceWater Fees 47,108,554 47,529,000 48,437,000 48,437,000 Connection Fees 722,234 630,000 1,146,000 1,146,000 Construction Fees 240,769 748,000 405,000 405,000 Other charges for services 1,758,806 1,706,000 1,786,000 1,786,000
Fines & Forfeits 1,463,213 1,066,000 1,462,000 1,462,000 Other Miscellaneous 796,783 656,000 843,000 843,000
Total Operating Revenue 52,090,359 52,335,000 54,079,000 54,079,000
Salaries and Wages 6,496,510 6,660,795 6,245,627 6,287,044 Employee Benefits 2,695,633 3,130,221 2,708,973 2,805,388 Services and Supplies
Water Purchases 13,033,085 15,062,021 15,513,882 15,513,882 Connection Charge Pumping Other 4,665,086 9,781,331 6,262,487 10,407,332
Budget Reduction Plan Depreciation/amortization 5,502,340 5,592,000 5,508,370 5,508,370 Total Operating Expense 32,392,654 40,226,368 36,239,339 40,522,016 Operating Income or (Loss) 19,697,705 12,108,632 17,839,661 13,556,984
NONOPERATING REVENUESInterest earnings Disposition of Assets Federal Grants Contribution from developers 1,280,774 Total Nonoperating Revenues 1,280,774
NONOPERATING EXPENSESInterest expense 836,681 709,500 545,917 545,917 Contributions to others Debt issuance costs (78,897)
Total Nonoperating Expenses 757,784 709,500 545,917 545,917
Net Income (Loss) before Operating Transfers 20,220,695 11,399,132 17,293,744 13,011,067 Operating Transfers (Schedule T)
In 454,397 Out 17,703,000 18,419,769 22,400,000 18,256,669 Net Operating Transfers (17,703,000) (17,965,372) (22,400,000) (18,256,669)
NET INCOME (LOSS) 2,517,695 (6,566,240) (5,106,256) (5,245,602)
CITY OF NORTH LAS VEGAS (Local Government)
Page 56SCHEDULE F-1 REVENUES, EXPENSES, AND NET INCOME Form 19
11/1/2013FUND - WATER UTILITY
OPERATING REVENUE
PROPRIETARY FUND
OPERATING EXPENSE

(1) (2) (3) (4)ESTIMATED BUDGET YEAR ENDING 06/30/2015
ACTUAL PRIOR CURRENTYEAR ENDING YEAR ENDING TENTATIVE FINAL
06/30/13 06/30/14 APPROVED APPROVED
ACTIVITIES: Cash received from customers 49,673,297 49,973,000 51,450,000 51,450,000 Cash received from interfund services 1,758,806 1,706,000 1,786,000 1,786,000 Cash received from other sources 547,540 656,000 843,000 843,000 Governmental administrative charges Cash paid to employees for services (9,086,349) (9,791,016) (8,954,600) (9,092,432) Cash paid to suppliers (18,436,670) (24,843,352) (21,776,369) (25,921,214) Cash payments for interfund services 3,825 a. Net cash provided by (or used for ) operating activities 24,460,449 17,700,632 23,348,031 19,065,354
B. CASH FLOWS FROM NONCAPITAL FINANCING ACTIVITIES:
Intergovernmental revenue Net Operating Transfers In 454,397 Net Operating Transfers (Out) (17,703,000) (18,419,769) (22,400,000) (18,256,669) b. Net cash provided by (or used for) noncapital financing activities (17,703,000) (17,965,372) (22,400,000) (18,256,669)
C. CASH FLOWS FROM CAPITAL AND RELATED
FINANCING ACTIVITIES:Interest paid on obligations (871,067) (709,500) (545,917) (545,917) Principal payments on bond obligations (3,707,750) (3,669,000) (3,741,400) (3,741,400) Issuance of bond obligations Premiums, discounts, costs of issuance Proceeds from dispositon of assets Acquisition and construction of capital assets (261,109) (1,648,125) (1,993,628) (1,993,628) c. Net cash provided by (or used for) capital and related financing activities (4,839,926) (6,026,625) (6,280,945) (6,280,945)
D. CASH FLOWS FROM INVESTING ACTIVITIES: Interest and dividends earned on
investments d. Net cash provided by investing activiti
Net INCREASE (DECREASE) in cashand cash equivalents (a+b+c+d) 1,917,523 (6,291,365) (5,332,914) (5,472,260)
CASH AND CASH EQUIVALENTS AT JULY 1 36,784,960 38,702,483 32,411,118 32,411,118
CASH AND CASH EQUIVALENTS AT JUNE 30 38,702,483 32,411,118 27,078,204 26,938,858
CITY OF NORTH LAS VEGAS (Local Government)
Page 57SCHEDULE F-2 STATEMENT OF CASH FLOWS Form 20
11/1/2013FUND - WATER UTILITY
PROPRIETARY FUND
A. CASH FLOWS FROM OPERATING

(1) (2) (3) (4)ESTIMATED BUDGET YEAR ENDING 06/30/2015
ACTUAL PRIOR CURRENTYEAR ENDING YEAR ENDING TENTATIVE FINAL
06/30/13 06/30/14 APPROVED APPROVED
Charges for ServiceSewer Fees 36,178,261 38,121,000 38,105,000 38,105,000 Connection Fees 1,271,790 900,000 945,000 945,000 Construction Fees 252,362 211,000 230,000 230,000
Fines & Forfeits 586,592 839,000 599,000 599,000 Other Miscellaneous 7,303,991 271,000 329,000 329,000
Total Operating Revenue 45,592,996 40,342,000 40,208,000 40,208,000
Salaries and Wages 3,949,179 4,987,384 4,050,796 4,004,222 Employee Benefits 1,594,991 2,291,220 1,787,580 1,815,533 Services and Supplies
Sewage Treatment 100,000 103,000 103,000 Pumping Other 6,915,119 16,852,805 11,637,270 15,748,940
Budget Reduction Plan Depreciation/amortization 10,911,593 19,973,200 13,280,830 13,280,830 Total Operating Expense 23,370,882 44,204,609 30,859,476 34,952,525 Operating Income or (Loss) 22,222,114 (3,862,609) 9,348,524 5,255,475
NONOPERATING REVENUESInterest earnings 136,985 Federal Grants for Capital 3,116,042 3,257,754 3,257,754 3,257,754 Sales Tax for Infrastructure 3,388,666 2,400,000 2,400,000 2,400,000 Contribution from developers 1,187,885 Disposition of Assets Total Nonoperating Revenues 7,829,578 5,657,754 5,657,754 5,657,754
NONOPERATING EXPENSESInterest expense 15,418,509 15,321,000 15,174,359 15,174,359 Contributions to others Debt issuance costs (128,654)
Total Nonoperating Expenses 15,289,855 15,321,000 15,174,359 15,174,359
Net Income (Loss) before Operating Transfers 14,761,837 (13,525,855) (168,081) (4,261,130) Operating Transfers (Schedule T)
In Out 13,797,000 5,579,163 9,600,000 5,486,816 Net Operating Transfers (13,797,000) (5,579,163) (9,600,000) (5,486,816)
NET INCOME (LOSS) 964,837 (19,105,018) (9,768,081) (9,747,946)
CITY OF NORTH LAS VEGAS (Local Government)
Page 58SCHEDULE F-1 REVENUES, EXPENSES, AND NET INCOME Form 19
11/1/2013FUND - WASTEWATER UTILITY
OPERATING REVENUE
PROPRIETARY FUND
OPERATING EXPENSE

(1) (2) (3) (4)ESTIMATED BUDGET YEAR ENDING 06/30/2015
ACTUAL PRIOR CURRENTYEAR ENDING YEAR ENDING TENTATIVE FINAL
06/30/13 06/30/14 APPROVED APPROVED
ACTIVITIES Cash received from customers 37,342,831 40,071,000 39,879,000 39,879,000 Cash received from interfund services Cash received from other sources 7,207,000 Other operating cash receipts 271,000 329,000 329,000 Governmental administrative charges Cash paid to employees for services (5,407,664) (7,278,604) (5,838,376) (5,819,755) Cash paid to suppliers (28,928,998) (16,952,805) (11,740,270) (15,851,940) Cash paid in lieu of taxes a. Net cash provided by (or used for ) operating activities 10,213,169 16,110,591 22,629,354 18,536,305
B. CASH FLOWS FROM NONCAPITAL FINANCING ACTIVITIES
Net Operating Transfers In Net Operating Transfers (Out) (13,797,000) (5,579,163) (9,600,000) (5,486,816) b. Net cash provided by (or used for) noncapital financing activities (13,797,000) (5,579,163) (9,600,000) (5,486,816)
C. CASH FLOWS FROM CAPITAL AND RELATED
FINANCING ACTIVITIESInterest paid on obligations (15,445,857) (15,321,000) (15,174,359) (15,174,359) Proceeds from debt issuance 7,000,000 Principal payments on bond obligations (3,037,250) (4,168,500) (4,367,600) (4,367,600) Issuance of bond obligations Federal Grants for Capital 6,504,708 3,257,754 3,257,754 3,257,754 Sales Tax for Infrastructure 2,400,000 2,400,000 2,400,000 Premiums, discounts, costs of issuance Disposition of Assets Acquisition and construction of capital assets (4,638,612) (5,155,159) (4,771,479) (4,771,479) c. Net cash provided by (or used for) capital and related financing activities (9,617,011) (18,986,905) (18,655,684) (18,655,684)
D. CASH FLOWS FROM INVESTING ACTIVITIES Interest and dividends earned on
investments 136,985 d. Net cash provided by investing activities 136,985
Net INCREASE (DECREASE) in cashand cash equivalents (a+b+c+d) (13,063,857) (8,455,477) (5,626,330) (5,606,195)
CASH AND CASH EQUIVALENTS AT JULY 1 31,681,146 18,617,289 10,161,812 10,161,812
CASH AND CASH EQUIVALENTS AT JUNE 30 18,617,289 10,161,812 4,535,482 4,555,617
CITY OF NORTH LAS VEGAS Page 59(Local Government) Form 20
SCHEDULE F-2 STATEMENT OF CASH FLOWS 11/1/2013FUND - WASTEWATER UTILITY
PROPRIETARY FUND
A. CASH FLOWS FROM OPERATING

(1) (2) (3) (4)ESTIMATED BUDGET YEAR ENDING 06/30/2015
ACTUAL PRIOR CURRENTYEAR ENDING YEAR ENDING TENTATIVE FINAL
06/30/13 06/30/14 APPROVED APPROVED
Charges for ServicesGolf Course Charges 1,791,915 2,180,600 2,247,431 2,247,431 Other Charges 106,955 3,650 30,720 30,720
Total Operating Revenue 1,898,870 2,184,250 2,278,151 2,278,151
Salaries and Wages 159,938 208,215 188,361 188,361 Employee Benefits 38,509 61,336 53,491 53,491 Services and Supplies 1,890,378 2,563,766 2,771,061 2,771,061 Capital OutlayDepreciation/amortization 229,623 9,500 229,626 229,626
Total Operating Expense 2,318,448 2,842,817 3,242,539 3,242,539 Operating Income or (Loss) (419,578) (658,567) (964,388) (964,388)
NONOPERATING REVENUES
Reserves for Capital Replacement Contribution of Fixed Assets
Total Nonoperating Revenues NONOPERATING EXPENSES
Interest expense
Total Nonoperating Expenses Net Income (Loss) before Operating Transfers (419,578) (658,567) (964,388) (964,388) Operating Transfers (Schedule T)
In 66,010 453,220 778,434 778,434 Out Net Operating Transfers 66,010 453,220 778,434 778,434
NET INCOME (LOSS) (353,568) (205,347) (185,954) (185,954)
CITY OF NORTH LAS VEGAS (Local Government)
Page 60SCHEDULE F-1 REVENUES, EXPENSES, AND NET INCOME Form 19
11/1/2013FUND - GOLF COURSE FUNDS
OPERATING REVENUE
PROPRIETARY FUND
OPERATING EXPENSE

(1) (2) (3) (4)ESTIMATED BUDGET YEAR ENDING 06/30/2015
ACTUAL PRIOR CURRENTYEAR ENDING YEAR ENDING TENTATIVE FINAL
06/30/13 06/30/14 APPROVED APPROVED
ACTIVITIES Cash received from customers 1,895,978 2,180,600 2,247,431 2,247,431 Other operating cash receipts 106,955 3,650 30,720 30,720 Cash paid to employees for services (194,806) (269,551) (241,852) (241,852) Cash paid to suppliers (1,972,450) (2,563,766) (2,771,061) (2,771,061) Cash payments for interfund services 60 a. Net cash provided by (or used for ) operating activities (164,263) (649,067) (734,762) (734,762)
B. CASH FLOWS FROM NONCAPITAL FINANCING ACTIVITIES
Operating Transfers In 66,010 453,220 778,434 778,434 Operating Transfers Out b. Net cash provided by (or used for) noncapital financing activities 66,010 453,220 778,434 778,434
C. CASH FLOWS FROM CAPITAL AND RELATED
FINANCING ACTIVITIESInterest paid on obligations Proceeds for Capital Replacement Proceeds from Bonds Proceeds from disposition of assets Acquisition and construction of capital assets (700,000) (700,000) c. Net cash provided by (or used for) capital and related financing activities (700,000) (700,000)
D. CASH FLOWS FROM INVESTING ACTIVITIES Interest and dividends earned on
investments d. Net cash provided by investing activities
Net INCREASE (DECREASE) in cashand cash equivalents (a+b+c+d) (98,253) (195,847) (656,328) (656,328)
CASH AND CASH EQUIVALENTS AT JULY 1 1,030,502 932,249 736,402 736,402
CASH AND CASH EQUIVALENTS AT JUNE 30 932,249 736,402 80,074 80,074
CITY OF NORTH LAS VEGAS (Local Government)
Page 61SCHEDULE F-2 STATEMENT OF CASH FLOWS Form 20
11/1/2013FUND - GOLF COURSE FUNDS
PROPRIETARY FUND
A. CASH FLOWS FROM OPERATING

(1) (2) (3) (4)ESTIMATED BUDGET YEAR ENDING 06/30/2015
ACTUAL PRIOR CURRENTYEAR ENDING YEAR ENDING TENTATIVE FINAL
06/30/13 06/30/14 APPROVED APPROVED
Intergovernmental Revenue-Library Intergovernmental Revenue-Redevelopment Refunds & Reimbursements 21,192,361 21,370,400 21,917,746 21,917,746
Total Operating Revenue 21,192,361 21,370,400 21,917,746 21,917,746
Salaries and Wages 6,732,387 11,679,538 5,559,651 5,559,610 Employee Benefits 2,671,642 527,692 516,711 517,711 Services and Supplies 15,620,046 15,230,116 15,609,437 15,609,437 Capital Outlay Budget Reduction Plan
Depreciation/amortization Total Operating Expense 25,024,075 27,437,346 21,685,799 21,686,758 Operating Income or (Loss) (3,831,714) (6,066,946) 231,947 230,988
NONOPERATING REVENUESInterest earnings 4,864
Total Nonoperating Revenues 4,864
NONOPERATING EXPENSESInterest expense
Total Nonoperating Expenses Net Income (Loss) before Operating Transfers (3,826,850) (6,066,946) 231,947 230,988 Operating Transfers (Schedule T)
In 2,955,510 6,245,922 Out Net Operating Transfers 2,955,510 6,245,922
NET INCOME (LOSS) (871,340) 178,976 231,947 230,988
CITY OF NORTH LAS VEGAS (Local Government)
Page 62SCHEDULE F-1 REVENUES, EXPENSES, AND NET INCOME Form 19
11/1/2013FUND - SELF INSURANCE RESERVE FUND
OPERATING REVENUE
PROPRIETARY FUND
OPERATING EXPENSE

(1) (2) (3) (4)ESTIMATED BUDGET YEAR ENDING 06/30/2015
ACTUAL PRIOR CURRENTYEAR ENDING YEAR ENDING TENTATIVE FINAL
06/30/13 06/30/14 APPROVED APPROVED
ACTIVITIES Cash received from quasi-external operating 22,481,536 21,370,400 21,917,746 21,917,746 transactions with other fundsCash paid for quasi-external transactions Cash paid to employees for services (8,004,945) (12,207,230) (6,076,362) (6,077,321) Cash paid to suppliers (13,108,777) (15,230,116) (15,609,437) (15,609,437) Cash paid in lieu of taxes a. Net cash provided by (or used for ) operating activities 1,367,814 (6,066,946) 231,947 230,988
B. CASH FLOWS FROM NONCAPITAL FINANCING ACTIVITIES
Operating Transfers In 2,955,510 6,245,922 Operating Transfers Out b. Net cash provided by (or used for) noncapital financing activities 2,955,510 6,245,922
C. CASH FLOWS FROM CAPITAL AND RELATED
FINANCING ACTIVITIESInterest paid on obligations Principal payments on bond obligations Proceeds from Bonds Proceeds from disposition of assets Acquisition and construction of capital assets c. Net cash provided by (or used for) capital and related financing activities
D. CASH FLOWS FROM INVESTING ACTIVITIES Interest and dividends earned on
investments 4,864 d. Net cash provided by investing activities 4,864
Net INCREASE (DECREASE) in cashand cash equivalents (a+b+c+d) 4,328,188 178,976 231,947 230,988
CASH AND CASH EQUIVALENTS AT JULY 1 13,703,986 18,032,174 18,211,150 18,211,150
CASH AND CASH EQUIVALENTS AT JUNE 30 18,032,174 18,211,150 18,443,097 18,442,138
CITY OF NORTH LAS VEGAS (Local Government)
Page 63SCHEDULE F-2 STATEMENT OF CASH FLOWS Form 20
11/1/2013FUND - SELF INSURANCE RESERVE FUND
PROPRIETARY FUND
A. CASH FLOWS FROM OPERATING

(1) (2) (3) (4)ESTIMATED BUDGET YEAR ENDING 06/30/2015
ACTUAL PRIOR CURRENTYEAR ENDING YEAR ENDING TENTATIVE FINAL
06/30/13 06/30/14 APPROVED APPROVED
Refunds & Reimbursements 3,301,806 4,818,162 4,494,063 4,494,063 Miscellaneous Other 10,810
Total Operating Revenue 3,312,616 4,818,162 4,494,063 4,494,063
Salaries and Wages 830,093 899,750 778,669 718,639 Employee Benefits 311,179 361,086 332,315 312,191 Services and Supplies 2,984,176 3,202,920 3,109,270 3,107,177 Capital OutlayBudget Reduction Plan
Depreciation/amortization 499,577 960,000 168,305 168,305 Total Operating Expense 4,625,025 5,423,756 4,388,559 4,306,312 Operating Income or (Loss) (1,312,409) (605,594) 105,504 187,751
NONOPERATING REVENUESInterest earnings Replacement Vehicle Reserves 880,960 1,642,040 1,215,120 1,215,120 (Loss)/Proceeds from disposition of assets 22,834 Contributions In
Total Nonoperating Revenues 903,794 1,642,040 1,215,120 1,215,120
NONOPERATING EXPENSESInterest expense Loss from disposition of asset
Total Nonoperating Expenses Net Income (Loss) before Operating Transfers (408,615) 1,036,446 1,320,624 1,402,871 Operating Transfers (Schedule T)
In 694,925 Out 590,402 539,020 Net Operating Transfers 104,523 (539,020)
NET INCOME (LOSS) (304,092) 497,426 1,320,624 1,402,871
CITY OF NORTH LAS VEGAS (Local Government)
Page 64SCHEDULE F-1 REVENUES, EXPENSES, AND NET INCOME Form 19
11/1/2013FUND - MOTOR EQUIPMENT FUND
OPERATING REVENUE
PROPRIETARY FUND
OPERATING EXPENSE

(1) (2) (3) (4)ESTIMATED BUDGET YEAR ENDING 06/30/2015
ACTUAL PRIOR CURRENTYEAR ENDING YEAR ENDING TENTATIVE FINAL
06/30/13 06/30/14 APPROVED APPROVED
ACTIVITIES Cash received from quasi-external operating transactions with other funds 4,193,890 4,818,162 4,494,063 4,494,063 Cash paid to employees for services (1,119,378) (1,260,836) (1,110,984) (1,030,830) Cash paid to suppliers (2,941,637) (3,202,920) (3,109,270) (3,107,177) Cash paid in lieu of taxes a. Net cash provided by (or used for ) operating activities 132,875 354,406 273,809 356,056
B. CASH FLOWS FROM NONCAPITAL FINANCING ACTIVITIES
Operating Transfers In 694,925 Operating Transfers Out (590,402) (539,020) b. Net cash provided by (or used for) noncapital financing activities 104,523 (539,020)
C. CASH FLOWS FROM CAPITAL AND RELATED
FINANCING ACTIVITIESInterest paid on obligations Proceeds from disposition of assets 33,485 Proceeds from other funds for capital replacement reserves 1,642,040 1,215,120 1,215,120 Acquisition of replacement vehicles (2,979,834) (899,875) (899,875) Acquisition and construction of capital assets (308,074) (340,186) (237,960) (237,960) c. Net cash provided by (or used for) capital and related financing activities (274,589) (1,677,980) 77,285 77,285
D. CASH FLOWS FROM INVESTING ACTIVITIES Interest and dividends earned on
investments d. Net cash provided by investing activities
Net INCREASE (DECREASE) in cashand cash equivalents (a+b+c+d) (37,191) (1,862,594) 351,094 433,341
CASH AND CASH EQUIVALENTS AT JULY 1 3,254,475 3,217,284 1,354,690 1,354,690
CASH AND CASH EQUIVALENTS AT JUNE 30 3,217,284 1,354,690 1,705,784 1,788,031
CITY OF NORTH LAS VEGAS (Local Government)
Page 65SCHEDULE F-2 STATEMENT OF CASH FLOWS Form 20
11/1/2013FUND - MOTOR EQUIPMENT FUND
PROPRIETARY FUND
A. CASH FLOWS FROM OPERATING

ALL EXISTING OR PROPOSED * - TypeGENERAL OBLIGATION BONDS, REVENUE BONDS, 1 - General Obligation Bonds 6 - Medium-Term Financing - Lease PurchaseMEDIUM-TERM FINANCING, CAPITAL LEASES AND 2 - G.O. Revenue Supported Bonds 7 - Capital LeasesSPECIAL ASSESSMENT BONDS 3 - G.O. Special Assessment Bonds 8 - Special Assessment Bonds
4 - Revenue Bonds 9 - Mortgages5 - Medium-Term Financing 10 - Other (Specify Type)
11 - Proposed (Specify Type)
(1) (2) (3) (4) (5) (6) (7) (8) (9) (10) (11) REQUIREMENTS FOR FISCAL
BEGINNING (9)+(10)ORIGINAL FINAL OUTSTANDING
NAME OF BOND OR LOAN AMOUNT OF ISSUE PAYMENT INTEREST BALANCE INTEREST PRINCIPALList and Subtotal By Fund * TERM ISSUE DATE DATE RATE 07/01/14 PAYABLE PAYABLE TOTALFUND: Water/Wastewater Utility Operating Resources Funded
Water Refunding Bonds (BB #R-8) 2 12 8,685,000 11/25/03 11/01/15 4.53 900,000 34,000 440,000 474,000 Water & Wastewater RefundingBonds (BB #R-11) 2 13 14,365,000 05/17/05 12/01/17 5.00 6,190,000 269,125 1,615,000 1,884,125 Water & Wastewater RefundingBonds, Series B 2 14 10,030,000 07/01/05 08/01/19 3.74 6,490,000 236,356 975,000 1,211,356 Wastewater ReclamationSystem Bonds 2 30 140,000,000 10/04/06 10/01/36 4.63 126,135,000 5,856,631 3,140,000 8,996,631 Water & Wastewater RefundingBonds 2 8 5,713,000 03/02/07 09/01/14 3.885 839,000 16,296 839,000 855,296 Water & Wastewater Improvement Bonds 2 30 145,000,000 06/17/10 06/01/40 4.222 145,000,000 9,307,868 100,000 9,407,868
Wastewater Sloan Channel Loan 5 9 7,000,000 04/01/13 07/01/22 2.00 6,000,000 1,000,000 1,000,000
TOTAL ALL DEBT SERVICE 330,793,000 291,554,000 15,720,276 8,109,000 23,829,276
SCHEDULE C-1 - INDEBTEDNESSCITY OF NORTH LAS VEGAS Budget Fiscal Year 2014-2015
(Local Government)Page 66Form 22
11/1/2013
YEAR ENDING
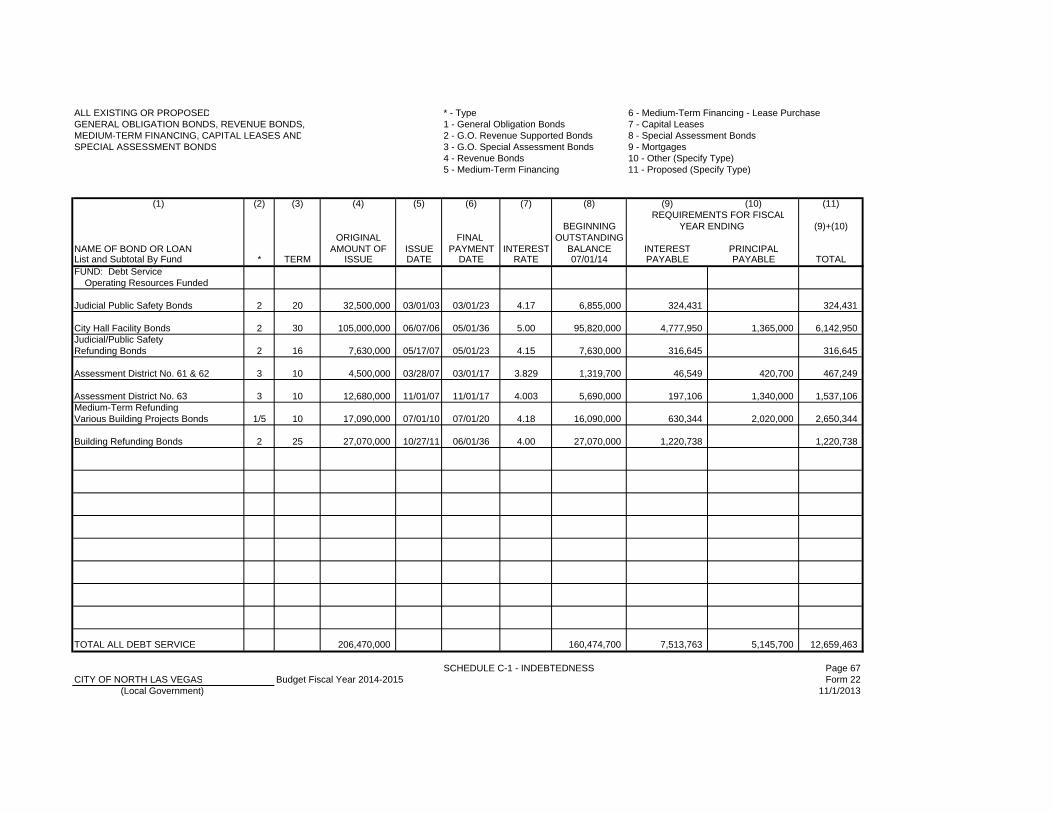
ALL EXISTING OR PROPOSED * - Type 6 - Medium-Term Financing - Lease PurchaseGENERAL OBLIGATION BONDS, REVENUE BONDS, 1 - General Obligation Bonds 7 - Capital LeasesMEDIUM-TERM FINANCING, CAPITAL LEASES AND 2 - G.O. Revenue Supported Bonds 8 - Special Assessment BondsSPECIAL ASSESSMENT BONDS 3 - G.O. Special Assessment Bonds 9 - Mortgages
4 - Revenue Bonds 10 - Other (Specify Type)5 - Medium-Term Financing 11 - Proposed (Specify Type)
(1) (2) (3) (4) (5) (6) (7) (8) (9) (10) (11) REQUIREMENTS FOR FISCAL
BEGINNING (9)+(10)ORIGINAL FINAL OUTSTANDING
NAME OF BOND OR LOAN AMOUNT OF ISSUE PAYMENT INTEREST BALANCE INTEREST PRINCIPALList and Subtotal By Fund * TERM ISSUE DATE DATE RATE 07/01/14 PAYABLE PAYABLE TOTALFUND: Debt Service Operating Resources Funded
Judicial Public Safety Bonds 2 20 32,500,000 03/01/03 03/01/23 4.17 6,855,000 324,431 324,431
City Hall Facility Bonds 2 30 105,000,000 06/07/06 05/01/36 5.00 95,820,000 4,777,950 1,365,000 6,142,950 Judicial/Public SafetyRefunding Bonds 2 16 7,630,000 05/17/07 05/01/23 4.15 7,630,000 316,645 316,645
Assessment District No. 61 & 62 3 10 4,500,000 03/28/07 03/01/17 3.829 1,319,700 46,549 420,700 467,249
Assessment District No. 63 3 10 12,680,000 11/01/07 11/01/17 4.003 5,690,000 197,106 1,340,000 1,537,106 Medium-Term RefundingVarious Building Projects Bonds 1/5 10 17,090,000 07/01/10 07/01/20 4.18 16,090,000 630,344 2,020,000 2,650,344
Building Refunding Bonds 2 25 27,070,000 10/27/11 06/01/36 4.00 27,070,000 1,220,738 1,220,738
TOTAL ALL DEBT SERVICE 206,470,000 160,474,700 7,513,763 5,145,700 12,659,463
SCHEDULE C-1 - INDEBTEDNESS Page 67CITY OF NORTH LAS VEGAS Budget Fiscal Year 2014-2015 Form 22
(Local Government) 11/1/2013
YEAR ENDING

ALL EXISTING OR PROPOSED * - Type 6 - Medium-Term Financing - Lease PurchaseGENERAL OBLIGATION BONDS, REVENUE BONDS, 1 - General Obligation Bonds 7 - Capital LeasesMEDIUM-TERM FINANCING, CAPITAL LEASES AND 2 - G.O. Revenue Supported Bonds 8 - Special Assessment BondsSPECIAL ASSESSMENT BONDS 3 - G.O. Special Assessment Bonds 9 - Mortgages
4 - Revenue Bonds 10 - Other (Specify Type)5 - Medium-Term Financing 11 - Proposed (Specify Type)
(1) (2) (3) (4) (5) (6) (7) (8) (9) (10) (11) REQUIREMENTS FOR FISCAL
BEGINNING (9)+(10)ORIGINAL FINAL OUTSTANDING
NAME OF BOND OR LOAN AMOUNT OF ISSUE PAYMENT INTEREST BALANCE INTEREST PRINCIPALList and Subtotal By Fund * TERM ISSUE DATE DATE RATE 07/01/14 PAYABLE PAYABLE TOTALFUND: Debt Service Property Tax Funded
Street Bonds - Refunding 1 8 1,530,000 05/17/07 06/01/15 3.931 247,000 9,929 247,000 256,929
TOTAL ALL DEBT SERVICE 1,530,000 247,000 9,929 247,000 256,929
SCHEDULE C-1 - INDEBTEDNESSCITY OF NORTH LAS VEGAS Budget Fiscal Year 2014-2015
(Local Government)
Page 68Form 22
11/1/2013
YEAR ENDING

Transfer Schedule for Fiscal Year 2014-2015
FUND TYPE FROM PAGE AMOUNT TO PAGE AMOUNTFUND FUND
GENERAL FUNDWater Fund 15 18,256,669 Wastewater Fund 15 5,486,816
Public Safety Support (PD Grant) 32 130,800 Community Development (Housing) 32 101,880 Debt Service Fund 32 7,520,284
Municipal Golf Course 32 90,000 Aliante Golf Course 32 688,434
Public Safety Support (FD Grant) 32 148,563
SUBTOTAL 23,743,485 8,679,961 SPECIAL REVENUE FUNDS
Community Development Capital Projects-HUD Streets 33 350,000
Community Development (Housing) General Fund 33 101,880 Public Safety Support (PD Grant) General Fund 34 130,800 Public Safety Support (FD Grant) General Fund 34 148,563
Special Purpose (Tax Override) Debt Service (Ad Valorem) 36 116,993 Capital projects - Parks 37 830,800 Special Purpose (Tax Override) Capital projects - Streets fund 37 957,487 Special Purpose (Tax Override) Capital projects - Public Safety fund 37 967,000 Special Purpose (Tax Override) Debt Service 37 2,320,524
Park Constr Tax (Dist. 3) Capital Projects-Parks & Rec fund 38 639,309 PR Support -(Activities & Prog) PR Support -(Activities & Prog) 39 375,000 Parks & Rec Support (Events) 39 375,000
Municipal Court Support Debt Service 40 300,000
SUBTOTAL 873,236 6,740,120
CITY OF NORTH LAS VEGAS(Local Government)
SCHEDULE T - TRANSFER RECONCILIATION Page 69Form 23a11/1/2013
T R A N S F E R S I N T R A N S F E R S O U T

Transfer Schedule for Fiscal Year 2014-2015
FUND TYPE FROM PAGE AMOUNT TO PAGE AMOUNTFUND FUND
CAPITAL PROJECTS FUNDS CAP-Public Safety Projects-Fire Sp. Rev. - Tax Override fund 44 967,000 CAP-Street Projects Community Development 45 350,000 CAP-Street Projects Sp. Rev. - Tax Override fund 45 957,487
CAP-Parks & Recreation Projects Sp. Rev. - Tax Override fund 46 830,800 CAP-Parks & Recreation Projects Parks Construction (Dist. 3) 46 639,309
CAP-Municipal Bldg Bonds CAP-Public Safety, 2006A Bonds 48 550,000 CAP-IT Projects, 2006A Bonds 48 550,000
SUBTOTAL 4,294,596 550,000 DEBT SERVICEDebt Service (Operating) General Fund 50 7,520,284 Debt Service (Operating) Sp. Rev. - Tax Override fund 50 2,320,524 Debt Service (Operating) Sp. Rev. - Court Facility Admin fund 50 300,000
Debt Service (Ad Valorem) Sp. Rev. - Tax Override fund 55 116,993
SUBTOTAL 10,140,808 116,993
CITY OF NORTH LAS VEGAS(Local Government)
SCHEDULE T - TRANSFER RECONCILIATIONPage 70
Form 23b11/1/2013
Transfer Schedule for Fiscal Year 2014-2015
T R A N S F E R S I N T R A N S F E R S O U T

T R A N S F E R S I N
FUND TYPE FROM PAGE AMOUNT TO PAGE AMOUNTFUND FUND
ENTERPRISE FUNDSWater Fund General Fund 56 18,256,669
Wastewater Fund General Fund 58 5,486,816
Municipal Golf Course General Fund 60 90,000 Aliante Golf Course General Fund 60 688,434
SUBTOTAL 778,434 23,743,485 INTERNAL SERVICE FUNDSMotor Equipment Fund Self Insurance Fund
SUBTOTAL - - RESIDUAL EQUITY TRANSFERS
SUBTOTAL
TOTAL TRANSFERS 39,830,559 39,830,559
CITY OF NORTH LAS VEGAS(Local Government)
SCHEDULE T - TRANSFER RECONCILIATIONPage 71
Form 23c11/1/2013
T R A N S F E R S O U T

Pursuant to NRS 354.600 (3), each (emphasis added) local government budget must obtain a
separate statement of anticipated expenses relating to activities designed to influence the passage
or defeat of legislation in an upcoming legislative session.
1. Activity: City of North Las Vegas Lobbying Support
2. Funding Source: General Fund
3. Transportation $ 20,000
4. Lodging and meals $ 11,500
5. Salaries and Wages $ 70,000
6. Compensation to lobbyists $ 106,000
7. Entertainment $ -
8. Supplies, equipment & facilities; other personnel and $ 6,500
services spent in Carson City
Total $ 214,000
Entity: City of North Las Vegas Budget Fiscal Year 2014-2015
Lobbying Expense Estimate, Page 1 of 1
Page 72Form 30
11/1/2013
L O B B Y I N G E X P E N S E E S T I M A T E
Nevada Legislature: 78th Session; February 2, 2015 to June 1, 2015

Local Government:Contact:
E-mail Address:Daytime Telephone:
Line VendorEffective Date
of Contract
Termination Date of
Contract
Proposed Expenditure FY 2014-15
Proposed Expenditure FY 2015-16 Reason or need for contract:
1 Quality Towing 4/1/2006 1/5/2015 $25,000 $25,000 Towing impounded/wrecked vehicles2 Sunrise Towing 4/1/2006 1/5/2015 $25,000 $25,000 Towing impounded/wrecked vehicles3 City Wide Towing 4/1/2006 1/5/2015 $25,000 $25,000 Towing impounded/wrecked vehicles4 MorphoTrack 5/1/2013 2/18/2015 $23,220 $23,220 Maintenance Agreement for Morphotrack Syatem5 Fast Towing 4/1/2006 1/5/2015 $25,000 $25,000 Towing impounded/wrecked vehicles6 MorphoTrack 3/1/2013 3/1/2015 $38,755 $38,755 Support Agreement for Morphotrack7 Opportunity Village 3/24/2011 3/24/2015 $13,440 $13,440 Fire Dept Admin Bldg Janitorial Support8 Sada Systems 4/1/2013 4/1/2014 $1,395 $1,395 Google Applications Support Agreement9 Sada Systems 4/1/2013 4/1/2014 $1,000 $1,000 Google Magic Maintenance Agreement
10 Global Surviellance Associates 4/15/2013 4/15/2014 $645 $645 Prowatch Software Support Agreement11 Fatpipe 4/16/2013 4/16/2014 $4,800 $4,800 Internet Load Balancer Agreement12 Wonderware West 5/2/2013 5/2/2014 $19,766 $19,766 Premium Support Agreement13 CDW 5/2/2013 5/2/2014 $27,262 $27,262 SYA/NDA/NDMP Maintenance Agreement14 Safran 5/8/2013 5/8/2014 $42,690 $42,690 Offendertrack Booking Maintenance Agreement15 National Janitorial 5/29/2010 5/29/2014 $20,979 $20,979 Police Facility Janitorial16 Ted Wiens 5/28/2009 5/28/2014 $25,000 $25,000 Fleet Tires Replacement17 Sage Software 5/31/2013 5/31/2014 $1,360 $1,360 FME Oracle Edition Maintenance Agreement18 Double Barrel Environmental 6/1/2013 6/1/2014 $50,000 $50,000 Environmental Cleaning for Streets19 Special Services Group 6/2/2013 6/2/2014 $4,200 $4,200 Covert Track Renewal20 Dyntek Services 6/7/2013 6/7/2014 $40,948 $40,948 Cisco Software Support21 City of Henderson 6/17/2013 6/17/2014 $20,000 $20,000 BL Interlocal Agreement22 Zoho Corp 6/30/2013 6/30/2014 $2,000 $2,000 Password Software Module and Agreement23 Motorolla 3/1/2013 6/30/2014 $48,000 $48,000 NETRMS and CAD Support Agreement24 Comcate 7/1/2013 7/1/2014 $21,342 $21,342 Comcate Support Agreement25 Oracle 7/1/2013 6/30/2014 $446,212 $446,212 Oracle Service Contract26 Tibeti Fence 7/9/2013 6/30/2014 $161,925 $161,925 Maintenance of City Fences27 Kronos 6/1/2013 6/30/2014 $9,390 $9,390 Software Support Services Renewal28 World Software Co 6/1/2013 6/30/2014 $1,500 $1,500 Worldox maintenance Renewal29 SecurCare 6/30/2013 6/30/2014 $4,095 $4,095 Maintenance for SecureID30 Accuvant 6/30/2013 6/30/2014 $546 $546 RSA Annual Maintenance31 AccessData 7/1/2013 6/30/2014 $840 $840 TFK Forensic Tool Kit32 HOV Services 7/1/2013 6/30/2014 $1,653 $1,653 Digital Scanner Maintenance Renewal
33Environmental Systems Research Institute 7/1/2013 6/30/2014 $48,700 $48,700 ESRI Annual Support
34 Arc Health and Welness 7/1/2013 6/30/2014 $6,800 $6,800 Annual Firefighter Physicals35 City of Las Vegas 7/1/2013 6/30/2014 $832,000 $832,000 City of Las Vegas Fire Dispatch36 Sansio 7/1/2013 6/30/2014 $16,488 $16,488 Sansio Health Subscription37 Ecolab Pest Control 7/1/2013 6/30/2014 $3,036 $3,036 Annual Pest Control Renewal38 Chem‐Aqua 7/1/2013 6/30/2014 $6,574 $6,574 Annual water Treatment Renewal39 Enzis All American Cleaning 7/1/2013 6/30/2014 $1,500 $1,500 External Window Cleaning Contract40 Opportunity Village 7/1/2013 6/30/2014 $13,440 $13,440 Fire Department Cleaning Contract41 Gruber Power Services 7/1/2013 6/30/2014 $6,931 $6,931 Police UPS Annual Support42 Tracstar Systems 7/1/2013 6/30/2014 $5,568 $5,568 Annual Service Agreement43 ATT Mobility 7/1/2013 6/30/2014 $10,846 $10,846 Annual Mobility XE Premium Maintenance44 Battery Systems 7/1/2013 6/30/2014 $10,000 $10,000 Battery Replacement for Fleet45 Fast Towing 7/1/2013 6/30/2014 $10,000 $10,000 Towing impounded/wrecked vehicles
46 Frontier Performance Lunricants 7/1/2013 6/30/2014 $3,500 $3,500 Oil changes for Fleet47 Hertz Equipment Rental 7/1/2013 6/30/2014 $7,500 $7,500 Equipment rental for Fleet48 Lighthouse Inc 7/1/2013 6/30/2014 $5,000 $5,000 Outside Services for Fleet49 Napa Auto Parts 7/1/2013 6/30/2014 $5,000 $5,000 Outside Services for Fleet50 Ozzies BMW 7/1/2013 6/30/2014 $10,000 $10,000 Maintenance for Vehicles51 Reno A and E 7/1/2013 6/30/2014 $5,000 $5,000 Outside Services for Fleet
Page 73
702-633-1906 Total Number of Outsource Vendors: 35
Schedule of Existing ContractsBudget Year 2014-2015
City of North Las Vegas PurchasingPaul [email protected] Total Number of Existing Contracts: 180

Line VendorEffective Date
of Contract
Termination Date of
Contract
Proposed Expenditure FY 2014-15
Proposed Expenditure FY 2015-16 Reason or need for contract:
52 Safelite Auto Glass 7/1/2013 6/30/2014 $5,000 $5,000 Glass Repair for Fleet53 SignPro 7/1/2013 6/30/2014 $10,000 $10,000 Outside Services for Fleet54 Smog Hut 7/1/2013 6/30/2014 $6,000 $6,000 Smog inspections for Fleet55 Thomas Petroleum 7/1/2013 6/30/2014 $5,000 $5,000 Oil Products for Fleet56 West Coast Equipment 7/1/2013 6/30/2014 $10,000 $10,000 Outside Services for Fleet57 Federal Signal Corp 7/1/2013 6/30/2014 $3,500 $3,500 Outside Services for Fleet58 Super Duty Shop 7/1/2013 6/30/2014 $20,000 $20,000 Outside Services for Fleet59 Vegas Fleet 7/1/2013 6/30/2014 $25,000 $25,000 Outside Services for Fleet60 Earls Transmission 7/1/2013 6/30/2014 $15,000 $15,000 Transmission work for Fleet61 Fairway Chevrolet 7/1/2013 6/30/2014 $2,500 $2,500 Maintenance for Vehicles62 Friendly Ford 7/1/2013 6/30/2014 $15,000 $15,000 Maintenance for Vehicles63 Kenworth Sales Company 7/1/2013 6/30/2014 $10,000 $10,000 Outside Services for Fleet64 Drake Equipment of Nevada 7/1/2013 6/30/2014 $9,000 $9,000 Outside Services for Fleet65 Bobcat of Las Vegas 7/1/2013 6/30/2014 $7,500 $7,500 Outside Services for Fleet66 McCandless International 7/1/2013 6/30/2014 $2,500 $2,500 Outside Services for Fleet67 Red Rock Harley 7/1/2013 6/30/2014 $4,000 $4,000 Maintenance on Motorcycles68 Blaine Equipment 7/1/2013 6/30/2014 $18,000 $18,000 Outside Services for Fleet69 BMW Motorcycles of LV 7/1/2013 6/30/2014 $4,000 $4,000 Maintenance on Motorcycles70 Charleston Auto Parts 7/1/2013 6/30/2014 $20,000 $20,000 Auto Parts for Fleet71 Cintas 7/1/2013 6/30/2014 $14,000 $14,000 Uniform and Mat Cleaning and Rental72 Dapper Tire Company 7/1/2013 6/30/2014 $20,000 $20,000 Tire Replacement for Fleet73 Interstate Battery 7/1/2013 6/30/2014 $2,500 $2,500 Battery Replacement for Fleet74 Western Refining Wholesale 7/1/2013 6/30/2014 $2,000 $2,000 Oil Products for Fleet75 Valley Auto Body 7/1/2013 6/30/2014 $30,000 $30,000 Auto Body Repair for Fleet76 Precision Crane 7/1/2013 6/30/2014 $10,000 $10,000 Crane rental for Fleet77 4‐Wheel Sound 7/1/2013 6/30/2014 $2,500 $2,500 Outside Services for Fleet78 Advanced Technology 7/1/2013 6/30/2014 $7,500 $7,500 Outside Services for Fleet79 Tech Equipment 7/1/2013 6/30/2014 $7,500 $7,500 Outside Services for Fleet80 Eagle Service Garage 7/1/2013 6/30/2014 $20,000 $20,000 Maintenance and Repair of Vehicles81 Silver State Trucking 7/1/2013 6/30/2014 $15,000 $15,000 Trucking Services for Fleet82 Motorolla 5/1/2013 6/30/2014 $143,452 $143,452 NETRMS and CAD Maintenance Agreement83 Active Network Ltd 7/1/2013 6/30/2014 $39,258 $39,258 Maintenance and Support Agreement84 Zonar 7/1/2013 6/30/2014 $46,225 $46,225 Annual Zonar Maintenance Agreement85 Safran 1/1/2013 6/30/2014 $3,539 $3,539 Morphotrack Support Agreement86 Dyntek Services 8/1/2013 7/31/2014 $80,858 $80,858 Smartnet Support for Cisco Systems87 DLT Solutions 7/31/2013 7/31/2014 $5,780 $6,780 TOAD Support Agreement88 Network Hardware Resale 8/1/2013 7/31/2014 $23,833 $23,833 Netsure Services Technical Support89 GOV Delivery Inc 8/4/2013 8/3/2014 $21,000 $21,000 GOV Delivery Digital and Email Subscription90 Monson Engineering 8/3/2013 8/3/2014 $3,264 $3,264 Pathfinder Office Support and Renewal91 Branch Hernandez/Travellers 8/17/2012 8/17/2014 $562,111 $562,111 City Property Insurance92 Lawyer Mechanical 8/30/2013 8/30/2014 $7,191 $7,191 Trane Chiller Annual Maintenance93 Cues 9/8/2013 9/7/2014 $3,600 $3,600 Granite XP Support94 Qualys Inc 9/12/2013 9/12/2014 $5,990 $5,990 Annual Renewal for Qualys95 Dell 9/24/2013 9/24/2014 $18,805 $18,805 Secureworks and Isensor Subscription96 Dell 9/24/2013 9/24/2014 $47,605 $47,605 Monitored Server and Network Inrastructure97 ISD Tech 10/9/2013 10/8/2014 $11,960 $11,960 On call PM Services98 CDW 10/16/2013 10/16/2014 $173,812 $173,812 Symantic and Quantum Service Agreement99 Logistical Solutions 10/24/2013 10/24/2014 $10,000 $10,000 Vehicle Decontamination Contract
100 Havison Network Video 10/25/2013 10/25/2014 $37,831 $37,831 Maintenance of Network Video Equipment101 Oracle 10/30/2013 10/30/2014 $21,997 $21,997 Oracle Linux Premier Support102 Iron data 11/1/2013 10/31/2014 $15,913 $15,913 Mobile Highway Support
103Branch Hernandez/National Casualty 11/1/2013 11/1/2014 $562,111 $562,111
Excess Liability Insurance
104 Klickfile Incorporated 11/1/2013 11/1/2014 $675 $675 DR6010 Scanner Maintenance105 PhD Virtual technologies 9/1/2013 11/1/2014 $3,959 $3,959 VM Ware and Vsphere Renewal106 Stanley Security 11/14/2013 11/14/2014 $2,160 $2,160 Annual Service Agreement107 Dyntek Services 11/21/2013 11/20/2014 $8,594 $8,594 Macafee Gateway Annual Support108 Dyntek Services 11/21/2013 11/20/2014 $6,633 $6,633 Macafee Firewall Annual Support109 Vertex 11/29/2013 11/28/2014 $6,330 $6,330 Payroll Tax updates110 Hansen Information Technology 12/7/2011 11/30/2014 $195,906 $195,906 Annual Service Agreement111 Infor Global 12/1/2013 11/30/2014 $90,116 $90,116 Hansen Maintenance Agreement
Page 74

Line VendorEffective Date
of Contract
Termination Date of
Contract
Proposed Expenditure FY 2014-15
Proposed Expenditure FY 2015-16 Reason or need for contract:
112 Dell 11/30/2013 11/30/2014 $2,560 $2,560 V/Ops Foglight Service Agreement113 Courtsmart 12/1/2013 11/30/2014 $5,084 $5,084 Courtsmart Annual Service Agreement114 Quantum Corp 12/3/2012 12/2/2014 $3,771 $3,771 Quantam Annual maintenance115 Brenntag 12/1/2011 12/7/2014 $223,729 $223,729 Ferric Chloride for WRF116 Brenntag 12/1/2011 12/7/2014 $43,790 $43,790 Citric Acid for WRF117 SNF Polydyne 12/1/2011 12/7/2014 $1,169,591 $1,169,591 Liquid Polymer for WRF118 Olin Products 12/1/2011 12/7/2014 $364,200 $364,200 Liquid Sodium Hypochlorite for WRF119 Thatcher 12/1/2011 12/7/2014 $68,045 $68,045 Liquid Sodium Bisulfate for WRF120 Prominent Systems 12/1/2011 12/7/2014 $232,815 $232,815 Grannular Carbon for WRF121 Comworx 12/15/2012 12/15/2014 $82,855 $82,855 Comworx Shortell Maintenance and Support122 Huber Technologies 12/16/2013 12/16/2014 $5,800 $5,800 Service Contract for WRF RPPS123 CDW Government Inc 5/3/2013 12/19/2014 $1,729 $1,729 Symantic Net Back Up Support124 EvansRecreation 12/29/2012 12/28/2014 $50,000 $50,000 Playground Equipment Maintenance125 Ipswitch Incorporated 12/31/2013 12/30/2014 $6,462 $6,462 Whats Up Gold Support Agreement126 Laboratory Instrument Specialists 1/1/2013 12/31/2014 $2,500 $2,500 CEM Smartsystem 5 Service Agreement127 Ipswitch Incorporated 1/1/2013 12/31/2014 $4,524 $4,524 Whats Up Gold Maintenance Agreement128 Courtview Justice Solutions 1/1/2003 12/31/2014 $54,105 $54,105 Courtview Annual Support and maintenance129 Qualtrics Labs 1/1/2014 12/31/2014 $10,000 $10,000 Annual Survey License130 Klickfile Incorporated 1/1/2013 1/1/2015 $1,300 $1,300 cr190i Scanner maintenance131 Rapiscan 1/1/2013 1/1/2015 $4,600 $4,600 Gold Service Agreement132 DLT Solutions 1/26/2013 1/12/2015 $9,704 $9,704 Autocad and Autodesk Annual Renewal133 Dell 1/15/2014 1/15/2015 $69,318 $68,318 Windows Server Software Agreement134 West Coast Technology 1/30/2012 1/29/2015 $9,650 $9,650 Dot Hill Storage for Jaguar135 Harland Technologies 2/1/2014 1/31/2015 $1,158 $1,158 Scantron Renewal Service Agreement136 First Data Govt Solutions 2/1/2014 1/31/2015 $23,761 $23,761 Accessnet Annual Service Agreement137 US Landscaping 2/1/2012 2/1/2015 $127,944 $127,944 Landscaping at Various Parks138 Guardnet 2/1/2014 2/1/2015 $1,300 $1,300 Iron Data Mobile Service Agreement139 Las Vegas Paving 2/12/2014 2/12/2015 $50,000 $50,000 Dirt Hauling from City Washes140 Monson Engineering 2/25/2014 2/25/2015 $2,258 $2,258 GIS Technical Support and maintenance141 DLT Solutions 7/27/2013 3/7/2015 $9,918 $9,918 Autodesk and Autocad renewal142 CDW Government Inc 3/19/2013 3/19/2015 $59 $59 Faronics Deep Freeze renewal143 Sada Systems 3/24/2013 3/23/2015 $119,736 $119,736 Government Google Apps Agreement144 CDW 3/26/2013 3/31/2015 $9,000 $9,000 Radware Support and maintenance Agreement145 Otis Elevator 7/1/2013 3/31/2015 $2,128 $2,128 Fire Dept Elevator service Renewal146 Susteen Inc 5/15/2013 5/15/2015 $1,500 $1,500 Secureview Gold Renewal147 Myers Tire Supply 7/8/2013 7/8/2015 $5,000 $5,000 Tire Replacement for Fleet148 MSA Systems 7/8/2013 7/8/2015 $15,536 $15,536 MC75A8 Renewal Service149 Troon Golf 7/18/2012 8/30/2015 $140,000 $140,000 Aliante Golf Course management150 US Landscaping 9/15/2013 9/15/2015 $44,837 $44,837 Tropical Breeze Park maintenance151 Citrix Systems 7/31/2013 9/16/2015 $3,531 $3,531 Citrix Netscaler VPX Renewal152 Harris and Harris 10/5/2011 10/5/2015 $300,000 $300,000 Debt Receivables for Muni Court153 Opportunity Village 11/2/2011 11/3/2015 $370,632 $370,632 City Hall Custidial Services154 Bobcat of Las Vegas 1/22/2013 1/22/2016 $3,672 $3,672 Warranty for Bobcat S750155 SignPro 3/5/2012 2/22/2016 $10,000 $10,000 Posting of City Public Hearing Signs156 Blind Center of Nevada 3/5/2012 2/26/2016 $10,000 $10,000 Sale and Delivery of Toner cartridges157 Motorolla 7/1/2013 6/30/2016 $42,600 $42,600 Service Agreement for Dispatch Radios158 Red Rock Window Cleaning 7/1/2012 7/1/2016 $50,000 $50,000 City hall Window Washing159 Mercury Cleaning 7/2/2012 7/2/2016 $50,000 $50,000 Pressure Washing Service for City Hall160 Honeywell 11/1/2013 11/1/2016 $9,773 $9,773 City Hall HVAC Maintenance161 Cypress Private Security 11/2/2011 11/2/2016 $400,000 $400,000 Security for City Hall and Various Parks162 Havison Network Video 11/5/2012 11/5/2016 $37,488 $37,488 Tech Support for City Hall Video Equipment163 Dyntek Services 11/6/2012 11/6/2016 $3,436 $3,436 Vsphere License and maintenance164 Netmotion Wireless 11/6/2012 11/6/2016 $11,218 $11,218 Netmotion Server Maintenance165 Noetix Corp 11/14/2012 11/14/2016 $13,416 $13,416 Noetix Views Platform Software Agreement166 NALCO 11/14/2012 11/14/2016 $50,000 $50,000 City Hall HVAC Water Treatment167 Toshiba 11/17/2011 11/17/2016 $508,118 $508,118 City Wide Copier Agreement168 Dyntek Services 11/21/2013 11/20/2016 $12,796 $12,796 Annual Eddpoint Support169 Gwava Technologies 11/26/2012 11/26/2016 $15,783 $15,783 Groupwise Server and Tech Support170 Otis Elevator 1/2/2012 1/5/2017 $50,000 $50,000 Elevator Maintenance for City Hall171 US Landscaping 1/15/2014 1/15/2017 $201,600 $201,600 Craig Ranch Park maintenance172 Suburban Elevator 1/22/2013 1/22/2017 $25,000 $25,000 PD Headquarters Elevator Maintenance173 DK Landscaping 2/1/2012 2/1/2017 $207,240 $207,240 Landscaping at City hall and Justice Facility174 US Landscaping 2/1/2012 2/1/2017 $127,944 $127,944 Landscaping various City Locations175 MSA Systems 2/1/2014 2/1/2017 $16,485 $16,485 MCt5 Bronze Service Agreement176 Bluestar Barricade and Traffic 6/6/2013 6/6/2017 $50,000 $50,000 Traffic Control Signs and Services177 Clark County 7/1/2012 6/30/2017 $8,000 $8,000 GS Interlocal with Clark County178 Dell 11/22/2012 11/22/2017 $640,579 $640,579 Enterprise Storage Solution and Maintenance179 Xerox 10/18/2013 10/18/2018 $60,000 $60,000 Copier Services180 Accurate Building Maintenance 12/16/2004 12/16/2014 $27,053 $27,053 Utilities Facility janitorial Services
$10,920,985 $10,920,985Page 75
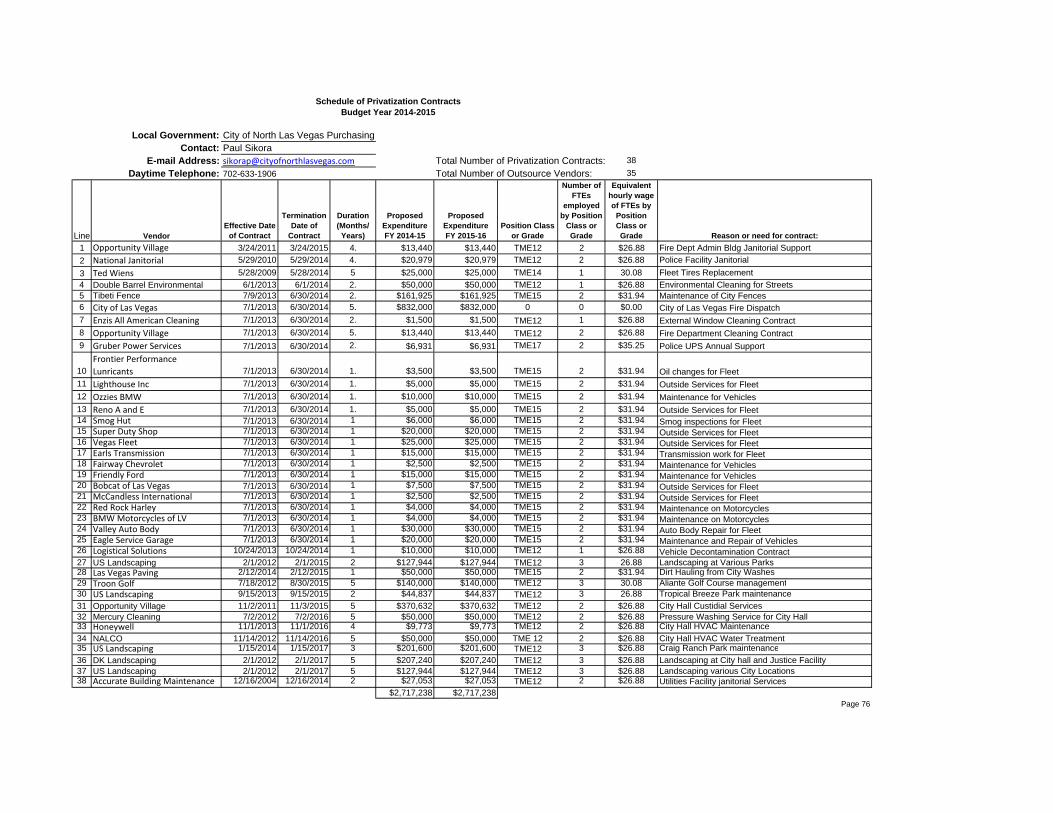
Local Government:Contact:
E-mail Address: 38Daytime Telephone: 35
Line VendorEffective Date
of Contract
Termination Date of
Contract
Duration (Months/
Years)
Proposed Expenditure FY 2014-15
Proposed Expenditure FY 2015-16
Position Class or Grade
Number of FTEs
employed by Position
Class or Grade
Equivalent hourly wage of FTEs by
Position Class or Grade Reason or need for contract:
1 Opportunity Village 3/24/2011 3/24/2015 4. $13,440 $13,440 TME12 2 $26.88 Fire Dept Admin Bldg Janitorial Support2 National Janitorial 5/29/2010 5/29/2014 4. $20,979 $20,979 TME12 2 $26.88 Police Facility Janitorial3 Ted Wiens 5/28/2009 5/28/2014 5 $25,000 $25,000 TME14 1 30.08 Fleet Tires Replacement4 Double Barrel Environmental 6/1/2013 6/1/2014 2. $50,000 $50,000 TME12 1 $26.88 Environmental Cleaning for Streets5 Tibeti Fence 7/9/2013 6/30/2014 2. $161,925 $161,925 TME15 2 $31.94 Maintenance of City Fences6 City of Las Vegas 7/1/2013 6/30/2014 5. $832,000 $832,000 0 0 $0.00 City of Las Vegas Fire Dispatch7 Enzis All American Cleaning 7/1/2013 6/30/2014 2. $1,500 $1,500 TME12 1 $26.88 External Window Cleaning Contract8 Opportunity Village 7/1/2013 6/30/2014 5. $13,440 $13,440 TME12 2 $26.88 Fire Department Cleaning Contract9 Gruber Power Services 7/1/2013 6/30/2014 2. $6,931 $6,931 TME17 2 $35.25 Police UPS Annual Support
10Frontier Performance Lunricants 7/1/2013 6/30/2014 1. $3,500 $3,500 TME15 2 $31.94 Oil changes for Fleet
11 Lighthouse Inc 7/1/2013 6/30/2014 1. $5,000 $5,000 TME15 2 $31.94 Outside Services for Fleet12 Ozzies BMW 7/1/2013 6/30/2014 1. $10,000 $10,000 TME15 2 $31.94 Maintenance for Vehicles13 Reno A and E 7/1/2013 6/30/2014 1. $5,000 $5,000 TME15 2 $31.94 Outside Services for Fleet14 Smog Hut 7/1/2013 6/30/2014 1 $6,000 $6,000 TME15 2 $31.94 Smog inspections for Fleet15 Super Duty Shop 7/1/2013 6/30/2014 1 $20,000 $20,000 TME15 2 $31.94 Outside Services for Fleet16 Vegas Fleet 7/1/2013 6/30/2014 1 $25,000 $25,000 TME15 2 $31.94 Outside Services for Fleet17 Earls Transmission 7/1/2013 6/30/2014 1 $15,000 $15,000 TME15 2 $31.94 Transmission work for Fleet18 Fairway Chevrolet 7/1/2013 6/30/2014 1 $2,500 $2,500 TME15 2 $31.94 Maintenance for Vehicles19 Friendly Ford 7/1/2013 6/30/2014 1 $15,000 $15,000 TME15 2 $31.94 Maintenance for Vehicles20 Bobcat of Las Vegas 7/1/2013 6/30/2014 1 $7,500 $7,500 TME15 2 $31.94 Outside Services for Fleet21 McCandless International 7/1/2013 6/30/2014 1 $2,500 $2,500 TME15 2 $31.94 Outside Services for Fleet22 Red Rock Harley 7/1/2013 6/30/2014 1 $4,000 $4,000 TME15 2 $31.94 Maintenance on Motorcycles23 BMW Motorcycles of LV 7/1/2013 6/30/2014 1 $4,000 $4,000 TME15 2 $31.94 Maintenance on Motorcycles24 Valley Auto Body 7/1/2013 6/30/2014 1 $30,000 $30,000 TME15 2 $31.94 Auto Body Repair for Fleet25 Eagle Service Garage 7/1/2013 6/30/2014 1 $20,000 $20,000 TME15 2 $31.94 Maintenance and Repair of Vehicles26 Logistical Solutions 10/24/2013 10/24/2014 1 $10,000 $10,000 TME12 1 $26.88 Vehicle Decontamination Contract27 US Landscaping 2/1/2012 2/1/2015 2 $127,944 $127,944 TME12 3 26.88 Landscaping at Various Parks28 Las Vegas Paving 2/12/2014 2/12/2015 1 $50,000 $50,000 TME15 2 $31.94 Dirt Hauling from City Washes29 Troon Golf 7/18/2012 8/30/2015 5 $140,000 $140,000 TME12 3 30.08 Aliante Golf Course management30 US Landscaping 9/15/2013 9/15/2015 2 $44,837 $44,837 TME12 3 26.88 Tropical Breeze Park maintenance31 Opportunity Village 11/2/2011 11/3/2015 5 $370,632 $370,632 TME12 2 $26.88 City Hall Custidial Services32 Mercury Cleaning 7/2/2012 7/2/2016 5 $50,000 $50,000 TME12 2 $26.88 Pressure Washing Service for City Hall33 Honeywell 11/1/2013 11/1/2016 4 $9,773 $9,773 TME12 2 $26.88 City Hall HVAC Maintenance34 NALCO 11/14/2012 11/14/2016 5 $50,000 $50,000 TME 12 2 $26.88 City Hall HVAC Water Treatment35 US Landscaping 1/15/2014 1/15/2017 3 $201,600 $201,600 TME12 3 $26.88 Craig Ranch Park maintenance36 DK Landscaping 2/1/2012 2/1/2017 5 $207,240 $207,240 TME12 3 $26.88 Landscaping at City hall and Justice Facility37 US Landscaping 2/1/2012 2/1/2017 5 $127,944 $127,944 TME12 3 $26.88 Landscaping various City Locations38 Accurate Building Maintenance 12/16/2004 12/16/2014 2 $27,053 $27,053 TME12 2 $26.88 Utilities Facility janitorial Services
$2,717,238 $2,717,238 Page 76
702-633-1906 Total Number of Outsource Vendors:
Schedule of Privatization ContractsBudget Year 2014-2015
City of North Las Vegas PurchasingPaul [email protected] Total Number of Privatization Contracts:


FINAL BUDGETFISCAL YEAR 2014 - 2015
NORTH LAS VEGAS REDEVELOPMENT AGENCY


Budget Summary for NORTH LAS VEGAS REDEVELOPMENT AGENCYSchedule S-1
GOVERNMENTAL FUND TYPES AND EXPENDABLE TRUST FUNDS
PROPRIETARYACTUAL ESTIMATED BUDGET FUNDS TOTAL
PRIOR YEAR CURRENT YEAR YEAR BUDGET YEAR (MEMO ONLY)REVENUES 06/30/13 06/30/14 06/30/15 06/30/15 COLUMNS 3+4
(1) (2) (3) (4) (5) Property Taxes 1,257,904$ 1,217,970$ 1,087,890$ $ 1,087,890$ Other Taxes 18,539 - - - Licenses and Permits - Intergovernmental Resources - - - - Charges for Services - Fines and Forfeits 613 - - - Miscellaneous 95,377 39,700 31,600 31,600
TOTAL REVENUES 1,372,433 1,257,670 1,119,490 - 1,119,490
EXPENDITURES-EXPENSES General Government 26,122 164,242 - - Judicial Public Safety Public Works 5,275 - - - Sanitation Health Welfare Culture and Recreation Community Support 2,791,306 1,739,730 1,973,948 1,973,948 Intergovernmental Expenditures - Contingencies Utility Enterprises Hospitals Transit Systems
Other Enterprises Debt Service - Principal Interest Cost
TOTAL EXPENDITURES-EXPENSES 2,822,703 1,903,972 1,973,948 - 1,973,948 Excess of Revenues over (under) Expenditures-Expenses (1,450,270) (646,302) (854,458) - (854,458)
Page 79Form 2
11/1/2013

Budget Summary for NORTH LAS VEGAS REDEVELOPMENT AGENCY
GOVERNMENTAL FUND TYPES AND EXPENDABLE TRUST FUNDS
PROPRIETARYACTUAL ESTIMATED BUDGET FUNDS TOTAL
PRIOR YEAR CURRENT YEAR YEAR BUDGET YEAR (MEMO ONLY)06/30/13 06/30/14 06/30/15 06/30/15 COLUMNS 3+4
(1) (2) (3) (4) (5)OTHER FINANCING SOURCES (USES):
Budget Reduction Plan - - -
Operating Transfers in - - - - Operating Transfers (out) (300,000) (300,000) - -
TOTAL OTHER FINANCING SOURCES (USES) (300,000) (300,000) - - - Excess of Revenues and Other Sources over(under) Expenditures and Other Uses (Net Income) (1,750,270) (946,302) (854,458) - XXXXXXXXXXXXXX
FUND BALANCE JULY 1, BEGINNING OF YEAR: XXXXXXXXXXXXXXXXXXXXXXXXXXXXXXXXXXXXXXXXXXXXXXXXXXXXXXXX
PREVIOUSLY REPORTED BEGINNING FUND BALANCE 12,203,891 10,461,819 9,515,517 XXXXXXXXXXXXXXXXXXXXXXXXXXXX Prior Period Adjustments 8,198 - - XXXXXXXXXXXXXXXXXXXXXXXXXXXX TOTAL BEGINNING FUND BALANCE 12,212,089 10,461,819 9,515,517 XXXXXXXXXXXXXXXXXXXXXXXXXXXX Residual Equity Transfers XXXXXXXXXXXXXXXXXXXXXXXXXXXXFUND BALANCE JUNE 30, END OF YEAR XXXXXXXXXXXXXXXXXXXXXXXXXXXX Designated - Interest Change in Value XXXXXXXXXXXXXXXXXXXXXXXXXXXX Unreserved XXXXXXXXXXXXXXXXXXXXXXXXXXXX
TOTAL ENDING FUND BALANCE 10,461,819 9,515,517 8,661,059 XXXXXXXXXXXXXXXXXXXXXXXXXXXX
Page 80Form 3
11/1/2013

FULL TIME EQUIVALENT EMPLOYEES BY FUNCTION
ACTUAL ESTIMATEDPRIOR YEAR CURRENT YEAR BUDGET YEAR
06/30/13 06/30/14 06/30/15General GovernmentJudicialPublic SafetyPublic WorksSanitationHealthWelfareCulture and RecreationCommunity Support 4.1 5.00 3.9
TOTAL GENERAL GOVERNMENT 4.1 5.00 3.9UtilitiesHospitalsTransit SystemsAirportsOther
TOTAL 4.1 5.00 3.9
July 1, 2011 July 1, 2012 07/01/13
POPULATION (AS OF JULY 1) 223,873 222,009 226,199 Gov Certified Gov Certified Gov Certified
SOURCE OF POPULATION ESTIMATE Population Population Population
Assessed Valuation (Secured and Unsecured Only) 44,331,205 43,154,691 50,973,538 Net Proceeds of MinesTOTAL ASSESSED VALUE 44,331,205 43,154,691 50,973,538
TAX RATE General Fund Special Revenue Funds 3.4038 3.0280 2.4630 Capital Projects Funds Debt Service Funds Enterprise Fund Other
TOTAL TAX RATE 3.4038 3.0280 2.4630
NORTH LAS VEGAS REDEVELOPMENT AGENCY Page 81(Local Government) Form 4
SCHEDULE S-2 - STATISTICAL DATA 11/1/2013

PROPERTY TAX RATE AND REVENUE RECONCILIATION Fiscal Year 2014-2015
(1) (2) (3) (4) (5) (6) (7)TOTAL AD VALOREM AD VALOREM
ALLOWED ASSESSED ALLOWED AD VALOREM TAX RATE REVENUE WITH TAX BUDGETED AD VALOREMTAX RATE VALUATION REVENUE [(1) X (2)/100] LEVIED NO CAP [(2)X(4)/100] ABATEMENT REVENUE WITH CAP
OPERATING RATE: A. PROPERTY TAX Subject to Revenue Limitations 2.4630 50,973,538 1,255,500 2.4630 1,255,500 (167,609) 1,087,890 B. PROPERTY TAX Outside Revenue Limitations: Net Proceeds of Mines Same as Above Same as AboveVOTER APPROVED: C. Voter Approved Overrides
LEGISLATIVE OVERRIDES D. Accident Indigent (NRS 428.185)
E. Medical Indigent (NRS 428.285)
F. Capital Acquisition(NRS 354.59815)
G. Youth Services Levy(NRS 62B.150, 62B.160)
H. Legislative Overrides
I. SCCRT Loss (NRS 354.59813)
J. Other:
K. Other:
L. SUBTOTAL LEGISLATIVE OVERRIDES M. SUBTOTAL A, C, L 2.4630 50,973,538 1,255,500 2.4630 1,255,500 (167,609) 1,087,890
N. Debt
O. TOTAL M AND N2.4630 50,973,538 1,255,500 2.4630 1,255,500 (167,609) 1,087,890
NORTH LAS VEGAS REDEVELOPMENT AGENCY (Local Government)
SCHEDULE S-3 - PROPERTY TAX RATE AND REVENUE RECONCILIATION
Page 82Form 27R11/1/2013

SCHEDULE A - ESTIMATED REVENUES & OTHER RESOURCES - GOVERNMENTAL FUND TYPES, EXPENDABLE TRUST FUNDS & TAX SUPPORTED PROPRIETARY FUND TYPES
Budget For Fiscal Year Ending June 30, 2015 Budget Summary for NORTH LAS VEGAS REDEVELOPMENT AGENCY(Local Government)
OTHERFINANCING
GOVERNMENTAL FUNDS AND PROPERTY SOURCESEXPENDABLE TRUST FUNDS BEGINNING TAX OTHER THAN
FUND CONSOLIDATED REQUIRED TAX OTHER TRANSFERS OPERATINGBALANCES TAX REVENUE RATE REVENUE IN TRANSFERS IN TOTAL
(1) (2) (3) (4) (5) (6) (7) (8)Redevelopment 9,515,517 1,087,890 2.4630 31,600 - 10,635,007
DEBT SERVICESubtotal Governmental Fund Types,Expendable Trust Funds 9,515,517 - 1,087,890 2.4630 31,600 - - 10,635,007
PROPRIETARY FUNDSXXXXXXXXXXX XXXXXXXXX XXXXXXXXXXX XXXXXXXXXXX XXXXXXXXXXXXXXXXXXXXXX XXXXXXXXX XXXXXXXXXXX XXXXXXXXXXX XXXXXXXXXXXXXXXXXXXXXX XXXXXXXXX XXXXXXXXXXX XXXXXXXXXXX XXXXXXXXXXXXXXXXXXXXXX XXXXXXXXX XXXXXXXXXXX XXXXXXXXXXX XXXXXXXXXXXXXXXXXXXXXX XXXXXXXXX XXXXXXXXXXX XXXXXXXXXXX XXXXXXXXXXX
Subtotal Proprietary Funds XXXXXXXXXXX XXXXXXXXX XXXXXXXXXXX XXXXXXXXXXX XXXXXXXXXXX
TOTAL ALL FUNDS XXXXXXXXXXX - 1,087,890 2.4630 XXXXXXXXX XXXXXXXXXXX XXXXXXXXXXX XXXXXXXXXXX
Page 83Form 5
11/1/2013

SCHEDULE A-1 ESTIMATED EXPENDITURES AND OTHER FINANCING USES
Budget For Fiscal Year Ending June 30, 2015 Budget Summary for NORTH LAS VEGAS REDEVELOPMENT AGENCY(Local Government)
SERVICES, CONTINGENCIESSUPPLIES AND USES
GOVERNMENTAL FUNDS AND AND OTHER THANEXPENDABLE TRUST FUNDS SALARIES OTHER CAPITAL OPERATING OPERATING
AND EMPLOYEE CHARGES OUTLAY TRANSFERS TRANSFERS ENDING FUND FUND NAME WAGES BENEFITS ** *** OUT OUT BALANCES TOTAL
* (1) (2) (3) (4) (5) (6) (7) (8)Redevelopment - 378,518 182,681 762,749 650,000 - - 8,661,059 10,635,007
-
TOTAL GOVERNMENTAL FUND TYPESAND EXPENDABLE TRUST FUNDS 378,518 182,681 762,749 650,000 - - 8,661,059 10,635,007
* FUND TYPES: R - Special RevenueC - Capital ProjectsD - Debt ServiceT - Expendable Trust
** Include Debt Service Requirements in this column Page 84Form 6
*** Capital Outlay must agree with CIP. 11/1/2013

(1) (2) (3) (4)ESTIMATED BUDGET YEAR ENDING 06/30/2015
ACTUAL PRIOR CURRENTYEAR ENDING YEAR ENDING TENTATIVE FINAL
06/30/13 06/30/14 APPROVED APPROVED
Property taxes - Current year 1,257,904 1,217,970 1,087,890 1,087,890 Property taxes - Prior year 18,539
1,276,443 1,217,970 1,087,890 1,087,890
Federal Grant CNLV Intergovernmental Revenue
Late Penalties 613
Interest earnings 18,044 39,700 31,600 31,600 Miscellaneous Other 77,333
95,990 39,700 31,600 31,600 Subtotal 1,372,433 1,257,670 1,119,490 1,119,490
OTHER FINANCING SOURCESOperating Transfers In (Schedule T)
Sale of land Subtotal Revenue & Other Financing Sources 1,372,433 1,257,670 1,119,490 1,119,490 BEGINNING FUND BALANCE
Previously reported Beginning Fund Balance 12,203,891 10,461,819 9,515,517 9,515,517 Adjustment 8,198
TOTAL BEGINNING FUND BALANCE 12,212,089 10,461,819 9,515,517 9,515,517
TOTAL AVAILABLE RESOURCES 13,584,522 11,719,489 10,635,007 10,635,007
NORTH LAS VEGAS REDEVELOPMENT AGENCY (Local Government)
SCHEDULE B - REDEVELOPMENT FUND Page 85Form 14
11/1/2013
Taxes
REVENUES
Miscellaneous
Intergovernmental
Fines and Forfeitures

(1) (2) (3) (4)ESTIMATED BUDGET YEAR ENDING 06/30/2015
ACTUAL PRIOR CURRENTYEAR ENDING YEAR ENDING TENTATIVE FINAL
06/30/13 06/30/14 APPROVED APPROVEDGeneral Government
Salaries and wages 18,000 111,493 Employee benefits 7,651 49,406 Services and supplies 471 3,343
Subtotal 26,122 164,242 Public Works
Salaries and wages 3,281 Employee benefits 1,911 Services and supplies 83 Capital outlay
Subtotal 5,275 Community Support
Salaries and wages 380,530 286,839 378,647 378,518 Employee benefits 160,375 131,845 180,481 182,681 Services and supplies 179,545 671,046 762,749 762,749 Capital outlay 2,070,856 650,000 650,000 650,000
Subtotal 2,791,306 1,739,730 1,971,877 1,973,948
Salaries and wages 401,811 398,332 378,647 378,518 Employee benefits 169,937 181,251 180,481 182,681 Services and supplies 180,099 674,389 762,749 762,749 Capital outlay 2,070,856 650,000 650,000 650,000
TOTAL EXPENDITURES 2,822,703 1,903,972 1,971,877 1,973,948
OTHER USES CONTINGENCY (Not to exceed 3% of total
expenditures) General Fund 300,000 300,000
Budget Reduction Plan
TOTAL EXPENDITURES AND OTHER USES 3,122,703 2,203,972 1,971,877 1,973,948 ENDING FUND BALANCE
10,461,819 9,515,517 8,663,130 8,661,059
TOTAL ENDING FUND BALANCE 10,461,819 9,515,517 8,663,130 8,661,059
TOTAL COMMITMENTS AND FUND BALANCE 13,584,522 11,719,489 10,635,007 10,635,007
NORTH LAS VEGAS REDEVELOPMENT AGENCY (Local Government)
SCHEDULE B - REDEVELOPMENT FUND Page 86Form 14
11/1/2013
Function Summary
EXPENDITURES

FINAL BUDGETFISCAL YEAR 2014 - 2015
NORTH LAS VEGAS LIBRARY DISTRICT


Budget Summary for NORTH LAS VEGAS LIBRARY DISTRICTSchedule S-1
GOVERNMENTAL FUND TYPES AND EXPENDABLE TRUST FUNDS
PROPRIETARYACTUAL ESTIMATED BUDGET FUNDS TOTAL
PRIOR YEAR CURRENT YEAR YEAR BUDGET YEAR (MEMO ONLY)REVENUES 06/30/13 06/30/14 06/30/15 06/30/15 COLUMNS 3+4
(1) (2) (3) (4) (5) Property Taxes 2,451,422$ 2,396,873$ 2,499,855$ 2,499,855$ Other Taxes - Licenses and Permits - Intergovernmental Resources 4,600 - 55,000 55,000 Charges for Services - Fines and Forfeits 72,055 69,050 70,000 70,000 Miscellaneous 57,624 60,440 60,000 60,000
TOTAL REVENUES 2,585,701 2,526,363 2,684,855 - 2,684,855
EXPENDITURES-EXPENSES General Government - Judicial - Public Safety - Public Works - Sanitation - Health - Welfare - Culture and Recreation 2,552,141 2,334,729 2,254,557 2,254,557 Community Support - Intergovernmental Expenditures 519,000 519,000 Contingencies - - - - Utility Enterprises - Hospitals - Transit Systems -
- Other Enterprises - Debt Service - Principal 335,000 350,000 365,000 365,000 Interest Cost 137,751 123,100 107,748 107,748
TOTAL EXPENDITURES-EXPENSES 3,024,892 2,807,829 3,246,305 - 3,246,305 Excess of Revenues over (under) Expenditures-Expenses (439,191) (281,466) (561,450) - (561,450)
Page 88Form 2
11/1/2013

Budget Summary for NORTH LAS VEGAS LIBRARY DISTRICTSchedule S-1
GOVERNMENTAL FUND TYPES AND EXPENDABLE TRUST FUNDS
PROPRIETARYACTUAL ESTIMATED BUDGET FUNDS TOTAL
PRIOR YEAR CURRENT YEAR YEAR BUDGET YEAR (MEMO ONLY)06/30/13 06/30/14 06/30/15 06/30/15 COLUMNS 3+4
(1) (2) (3) (4) (5)OTHER FINANCING SOURCES (USES):
Budget Reduction Plan - - -
Operating Transfers in 49,640 760,543 - - Operating Transfers (out) (562,264) (530,500) - -
TOTAL OTHER FINANCING SOURCES (USES) (512,624) 230,043 - - - Excess of Revenues and Other Sources over(under) Expenditures and Other Uses (Net Income) (951,815) (51,423) (561,450) - XXXXXXXXXXXXXX
FUND BALANCE JULY 1, BEGINNING OF YEAR: XXXXXXXXXXXXXXXXXXXXXXXXXXPREVIOUSLY REPORTED BEGINNING FUND BALANCE 1,678,931 743,022 691,599 XXXXXXXXXXXXXXXXXXXXXXXXXX Prior Period Adjustments 15,906 - - XXXXXXXXXXXXXXXXXXXXXXXXXX TOTAL BEGINNING FUND BALANCE 1,694,837 743,022 691,599 XXXXXXXXXXXXXXXXXXXXXXXXXX Prior Period Adjustments XXXXXXXXXXXXXXXXXXXXXXXXXX Residual Equity Transfers XXXXXXXXXXXXXXXXXXXXXXXXXXFUND BALANCE JUNE 30, END OF YEAR XXXXXXXXXXXXXXXXXXXXXXXXXX Designated - Interest Change in Value XXXXXXXXXXXXXXXXXXXXXXXXXX Unreserved 743,022 691,599 130,149 XXXXXXXXXXXXXXXXXXXXXXXXXX
TOTAL ENDING FUND BALANCE 743,022 691,599 130,149 XXXXXXXXXXXXXXXXXXXXXXXXXX
Page 89Form 3
11/1/2013

FULL TIME EQUIVALENT EMPLOYEES BY FUNCTION
ACTUAL ESTIMATEDPRIOR YEAR CURRENT YEAR BUDGET YEAR
06/30/13 06/30/14 06/30/15General GovernmentJudicialPublic SafetyPublic WorksSanitationHealthWelfareCulture and Recreation 24.00 23.50 20.00 Community Support
TOTAL GENERAL GOVERNMENT 24.00 23.50 20.00 UtilitiesHospitalsTransit SystemsAirportsOther
TOTAL 24.00 23.50 20.00
July 1, 2011 July 1, 2012 07/01/13
POPULATION (AS OF JULY 1) 223,873 222,009 226,199 Gov Certified Gov Certified Gov Certified
SOURCE OF POPULATION ESTIMATE Population Population Population
Assessed Valuation (Secured and Unsecured Only) 3,987,869,401 4,068,384,524 4,730,877,154 Net Proceeds of MinesTOTAL ASSESSED VALUE 3,987,869,401 4,068,384,524 4,730,877,154
TAX RATE General Fund Special Revenue Funds 0.0632 0.0632 0.0632 Capital Projects Funds Debt Service Funds Enterprise Fund Other
TOTAL TAX RATE 0.0632 0.0632 0.0632
NORTH LAS VEGAS LIBRARY DISTRICT(Local Government)
SCHEDULE S-2 - STATISTICAL DATA
Page 90Form 4
11/1/2013

PROPERTY TAX RATE AND REVENUE RECONCILIATION Fiscal Year 2014-2015
(1) (2) (3) (4) (5) (6) (7)TOTAL AD VALOREM AD VALOREM
ALLOWED ASSESSED ALLOWED AD VALOREM TAX RATE REVENUE WITH TAX BUDGETED AD VALOREMTAX RATE VALUATION REVENUE [(1) X (2)/100] LEVIED NO CAP [(2)X(4)/100] ABATEMENT REVENUE WITH CAP
OPERATING RATE: A. PROPERTY TAX Subject to Revenue Limitations 0.0956 4,730,877,154 4,522,700 0.0632 2,989,900 (490,045) 2,499,855 B. PROPERTY TAX Outside Revenue Limitations: Net Proceeds of Mines Same as Above Same as AboveVOTER APPROVED: C. Voter Approved Overrides
LEGISLATIVE OVERRIDES D. Accident Indigent (NRS 428.185)
E. Medical Indigent (NRS 428.285)
F. Capital Acquisition (NRS 354.59815) G. Youth Services Levy (NRS 62B.150, 62B.160) H. Legislative Overrides
I. SCCRT Loss (NRS 354.59813)
J. Other:
K. Other:
L. SUBTOTAL LEGISLATIVE OVERRIDES M. SUBTOTAL A, C, L 0.0956 4,730,877,154 4,522,700 0.0632 2,989,900 (490,045) 2,499,855
N. Debt
O. TOTAL M AND N0.0956 4,730,877,154 4,522,700 0.0632 2,989,900 (490,045) 2,499,855
NORTH LAS VEGAS LIBRARY DISTRICT (Local Government)
SCHEDULE S-3 - PROPERTY TAX RATE AND REVENUE RECONCILIATION
Page 91Form 27R11/1/2013

SCHEDULE A - ESTIMATED REVENUES & OTHER RESOURCES - GOVERNMENTAL FUND TYPES, EXPENDABLE TRUST FUNDS & TAX SUPPORTED PROPRIETARY FUND TYPES
Budget For Fiscal Year Ending June 30, 2015 Budget Summary for NORTH LAS VEGAS LIBRARY DISTRICT(Local Government)
OTHERFINANCING
GOVERNMENTAL FUNDS AND PROPERTY SOURCESEXPENDABLE TRUST FUNDS BEGINNING TAX OTHER THAN
FUND CONSOLIDATED REQUIRED TAX OTHER TRANSFERS OPERATINGBALANCES TAX REVENUE RATE REVENUE IN TRANSFERS IN TOTAL
(1) (2) (3) (4) (5) (6) (7) (8)Library 691,599 2,499,855 0.0632 185,000 - 3,376,454
-
DEBT SERVICESubtotal Governmental Fund Types,Expendable Trust Funds 691,599 - 2,499,855 0.0632 185,000 - - 3,376,454
PROPRIETARY FUNDSXXXXXXXXXXX XXXXXXXXX XXXXXXXXXXX XXXXXXXXXXX XXXXXXXXXXXXXXXXXXXXXX XXXXXXXXX XXXXXXXXXXX XXXXXXXXXXX XXXXXXXXXXXXXXXXXXXXXX XXXXXXXXX XXXXXXXXXXX XXXXXXXXXXX XXXXXXXXXXXXXXXXXXXXXX XXXXXXXXX XXXXXXXXXXX XXXXXXXXXXX XXXXXXXXXXXXXXXXXXXXXX XXXXXXXXX XXXXXXXXXXX XXXXXXXXXXX XXXXXXXXXXX
Subtotal Proprietary Funds XXXXXXXXXXX XXXXXXXXX XXXXXXXXXXX XXXXXXXXXXX XXXXXXXXXXX
TOTAL ALL FUNDS XXXXXXXXXXX - 2,499,855 0.0632 XXXXXXXXX XXXXXXXXXXX XXXXXXXXXXX XXXXXXXXXXX
Page 92Form 5
11/1/2013

SCHEDULE A-1 ESTIMATED EXPENDITURES AND OTHER FINANCING USES
Budget For Fiscal Year Ending June 30, 2015 Budget Summary for NORTH LAS VEGAS LIBRARY DISTRICT(Local Government)
SERVICES, CONTINGENCIESSUPPLIES AND USES
GOVERNMENTAL FUNDS AND AND OTHER THANEXPENDABLE TRUST FUNDS SALARIES OTHER CAPITAL OPERATING OPERATING
AND EMPLOYEE CHARGES OUTLAY TRANSFERS TRANSFERS ENDING FUND FUND NAME WAGES BENEFITS ** *** OUT OUT BALANCES TOTAL
* (1) (2) (3) (4) (5) (6) (7) (8)Library Fund - 1,155,970 550,814 1,539,521 - 130,149 3,376,454
TOTAL GOVERNMENTAL FUND TYPESAND EXPENDABLE TRUST FUNDS 1,155,970 550,814 1,539,521 - - - 130,149 3,376,454
* FUND TYPES: R - Special RevenueC - Capital ProjectsD - Debt ServiceT - Expendable Trust
** Include Debt Service Requirements in this column Page 93Form 6
*** Capital Outlay must agree with CIP. 11/1/2013

(1) (2) (3) (4)ESTIMATED BUDGET YEAR ENDING 06/30/2015
ACTUAL PRIOR CURRENTYEAR ENDING YEAR ENDING TENTATIVE FINAL
06/30/13 06/30/14 APPROVED APPROVED
Property taxes - Current year 2,450,136 2,396,873 2,499,855 2,499,855 Property taxes - Prior year 1,286 Subtotal 2,451,422 2,396,873 2,499,855 2,499,855
Intergovernmental revenue 40,000 55,000 State grants 4,600 Subtotal 4,600 40,000 55,000
Other 72,055 69,050 70,000 70,000
Contributions and donations from private sources 750 20,000 Other 56,874 40,440 60,000 60,000 Subtotal 57,624 60,440 60,000 60,000 SUBTOTAL 2,585,701 2,526,363 2,669,855 2,684,855 OTHER FINANCING SOURCES
Operating Transfers In (Schedule T) General fund 760,543 Community Development fund 49,640
Subtotal Revenue & Other Financing Sources 2,635,341 3,286,906 2,669,855 2,684,855 BEGINNING FUND BALANCE 1,678,931 743,022 691,599 691,599
Prior period adjustments 15,906 TOTAL BEGINNING FUND BALANCE 1,694,837 743,022 691,599 691,599
Prior period adjustmentsResidual equity transfers
TOTAL AVAILABLE RESOURCES 4,330,178 4,029,928 3,361,454 3,376,454
Culture and RecreationSalaries and wages 1,418,592 1,224,728 1,156,175 1,155,970 Employee benefits 593,503 578,702 534,635 550,814 Services and supplies 540,046 531,299 547,773 547,773
Intergovernmental expense 519,000 519,000 Interest Expense 137,751 123,100 107,748 107,748 Principal 335,000 350,000 365,000 365,000
Subtotal 3,024,892 2,807,829 3,230,331 3,246,305 OTHER USES
CONTINGENCY (Not to exceed 3% of totalexpenditures)
Transfer Out to Debt Service 380,875 530,500 Transfer Out to Capital Projects - City Hall Bonds 155,875 Transfer Out to Employee Benefits fund 25,514 Budget Reduction Plan
Total Expenditures and Other Uses 3,587,156 3,338,329 3,230,331 3,246,305
ENDING FUND BALANCE 743,022 691,599 131,123 130,149 TOTAL ENDING FUND BALANCE 743,022 691,599 131,123 130,149
TOTAL COMMITMENTS AND FUND BALANCE 4,330,178 4,029,928 3,361,454 3,376,454
NORTH LAS VEGAS LIBRARY DISTRICT(Local Government)
Page 94SCHEDULE B - LIBRARY Form 14
11/1/2013
EXPENDITURES
Taxes
REVENUES
Intergovernmental Revenues
Fines and Forfeits
Miscellaneous

ALL EXISTING OR PROPOSED * - TypeGENERAL OBLIGATION BONDS, REVENUE BONDS, 1 - General Obligation Bonds 6 - Medium-Term Financing - Lease PurchaseMEDIUM-TERM FINANCING, CAPITAL LEASES AND 2 - G.O. Revenue Supported Bonds 7 - Capital LeasesSPECIAL ASSESSMENT BONDS 3 - G.O. Special Assessment Bonds 8 - Special Assessment Bonds
4 - Revenue Bonds 9 - Mortgages5 - Medium-Term Financing 10 - Other (Specify Type)
11 - Proposed (Specify Type)
(1) (2) (3) (4) (5) (6) (7) (8) (9) (10) (11) REQUIREMENTS FOR FISCAL
BEGINNING (9)+(10)ORIGINAL FINAL OUTSTANDING
NAME OF BOND OR LOAN AMOUNT OF ISSUE PAYMENT INTEREST BALANCE INTEREST PRINCIPALList and Subtotal By Fund * TERM ISSUE DATE DATE RATE 07/01/14 PAYABLE PAYABLE TOTALFUND: Library Debt Service Operating Resources Funded
Library Facility (Aliante) 1/5 10 3,145,000 05/27/10 04/01/20 4.38 2,460,000 107,748 365,000 472,748
Library Facility (Alexander) 10 11 9,500,000 02/01/08 01/01/19 5.00 5,780,000 289,000 230,000 519,000
TOTAL ALL DEBT SERVICE 12,645,000 8,240,000 396,748 595,000 991,748
SCHEDULE C-1 - INDEBTEDNESS
NORTH LAS VEGAS LIBRARY DISTRICT Budget Fiscal Year 2014-2015 (Local Government)
Page 95NOTE: Debt Service on Alexander Library paid from Debt Service Fund 311 and is shown as an Intergovernmental expense on the Library Schedule B Form 22
11/1/2013
YEAR ENDING