state unemployment insurance trust fund solvency … · 1. average high cost multiple (ahcm) value-...
TRANSCRIPT
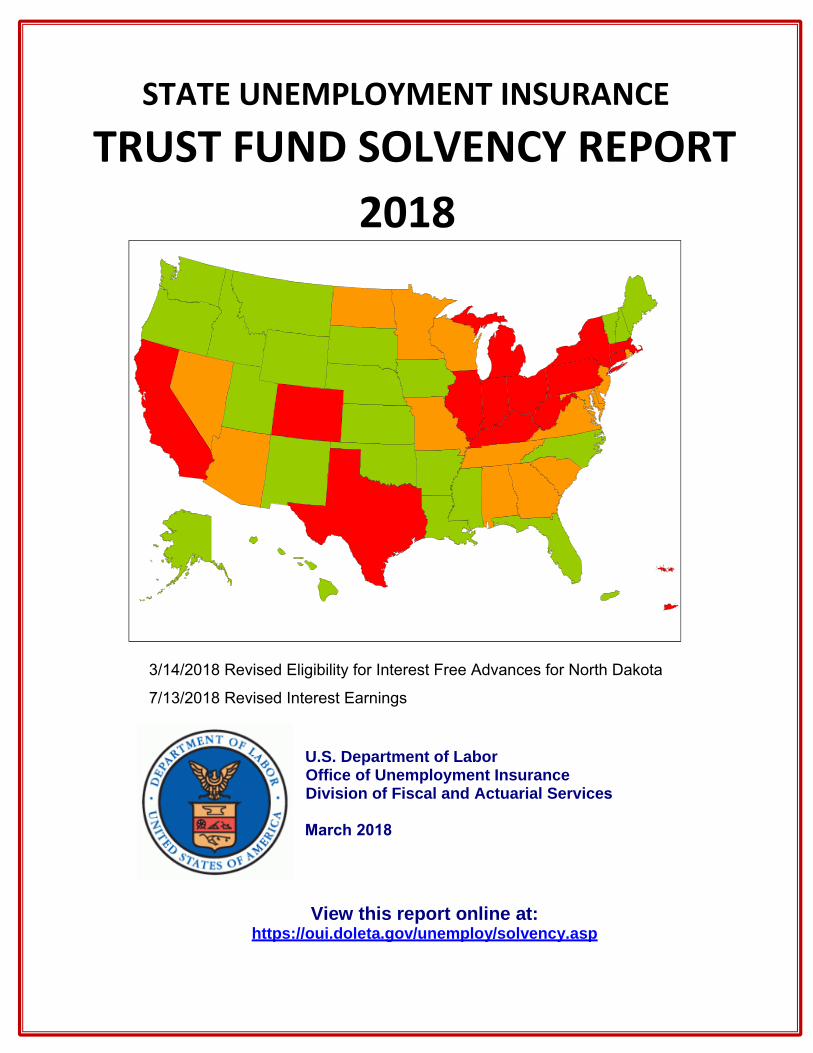
STATE UNEMPLOYMENT INSURANCE
TRUST FUND SOLVENCY REPORT
2018
U.S. Department of Labor Office of Unemployment Insurance Division of Fiscal and Actuarial Services
March 2018
View this report online at: https://oui.doleta.gov/unemploy/solvency.asp
3/14/2018 Revised Eligibility for Interest Free Advances for North Dakota
7/13/2018 Revised Interest Earnings
Unemployment Insurance State Solvency Report2018 Highlights
The measures in this report describe the solvency of state Unemployment Insurance
systems at the beginning of 2018. At this time:
The solvency levels of state UI trust funds intwenty-four states is greater than the recommendedminimum solvency standard. Twenty-nine statesand jurisdictions are below the recommendstandard.
One state and one jurisdiction still haveoutstanding Federal Title XII advances ofapproximately $1.2 billion. Both, may be subject toa reduction of their Federal tax credit if they do notrepay the advances by November 10, 2018.
Three states have outstanding private borrowinginstruments of approximately $3.9 billion.
For 2018, thirty states meet the eligibility criteria forinterest-free borrowing.
1 State Pages

Report User Guide
Evaluating State Trust Fund Solvency Using the Solvency Report
The following description is provided to assist users in effectively evaluating a state’s UnemploymentInsurance (UI) trust fund solvency level. The individual state metrics in this report are divided into threesections. The first eleven variables provide the status of the State Trust fund, the next two items coverthe state’s Solvency Measures, followed by the Calculations of Federal Borrowing Statutes and FUTACredit Reductions. An explanation and derivation of each item can be found in the report glossary.
State Trust Fund StatusUI taxes, paid primarily by employers on the wages paid to employees, flow into state UI trust fundaccounts maintained at the U.S. Treasury. These same accounts are the source of benefit paymentsto eligible claimants in the regular state UI program. There are no federal requirements for the amountof funds that should be kept in a state’s trust fund, however each state operates on a forward funding
basis by building up reserves in anticipation of paying a higher amount of benefits during recessionaryperiods.
The dollar amount of the fund at the beginning of this year (item 1) is shown followed by the amount ofinterest that the fund, which accrues quarterly, has earned in the previous (fiscal) year (item 2).If a state uses all of its funds it is able to borrow from the Federal government through the Title XIIprogram. The amount of Federal advances is shown since the beginning of the last recession (item 3-9). Interest on these advances is charged on a daily basis, states are also able to repay the outstandingloan on a daily basis as the Treasury department will apply all tax revenue greater than the amount forbenefit payments to the outstanding loan. States are also able to use private sector borrowinginstruments, such as revenue bonds, to repay the federal government for their outstanding loans (item10-11), eight states used the private market to finance UI debt following this past recession..
The dollar amount in the state trust fund is not a very useful measure of state solvency since nocomparison is made to the fund’s benefit liabilities or state size. The simplest solvency measure calledthe Reserve Ratio is derived by taking the trust fund balance and dividing by the state’s total wages
paid for the year (item 12). This measure can be compared against the level of benefits paid in the yeardivided by the same yearly wages- this ratio is referred to as the Benefit Cost Rate. A commoncomparison is to take the highest Benefit Cost Rate in the state’s history and compare it to the Reserve
Ratio, or to take the average of the three highest Benefit Cost Rates in the last twenty years andcompare that to the Reserve Ratio (this is called the Average High Cost Multiple). In the latter case,values greater than one (Reserve Ratio divided by Average Benefit Cost Rate) are considered theminimum level for adequate state solvency going into a recession (item 13)1.
1 Advisory Council on Unemployment Compensation, (1996), recommendation 1995-2.
2 State Pages

In 2013 the Federal government put in place a change to CFR 606.32 which allows a state to borrowinterest free if a state takes a Federal advance after January 1 and repays it by September 30 in thesame year. The new statute added a solvency and tax maintenance requirements to the eligibility forthese interest free loans. For 2018 a state must have reached a .9 Average High Cost Multiple in oneof the last five years, and since reaching that level they must have maintained an average tax rate thatis at least 75% of the average of the previous five years Benefit Cost Rates, also the average tax ratemust be at least 80% of the previous year’s average tax rate (items 14-16).
If a state fails to repay the outstanding Federal Title XII advance by November 10th of the year in whicha second January 1st has passed then all taxable employers in that state will be subject to a reducedcredit on their FUTA tax of .3%. The reduced credit will increase by .3% for each January 1 that ispassed without full repayment by November 10 of that year. In addition the state may be subject toadditional FUTA credit reductions depending on the size of its average tax rate and changes in statelaws with respect to reduction of its state trust fund. States subject to a reduced FUTA credit reductionin the previous two years and those potentially subject in the current year are published in item 17.
3 State Pages
CLICK ON DESIRED STATE:
Individual State Pages: Trust Fund Solvency Report
UNITED STATES
4 State Pages
UNITED STATES
Trust Fund Status
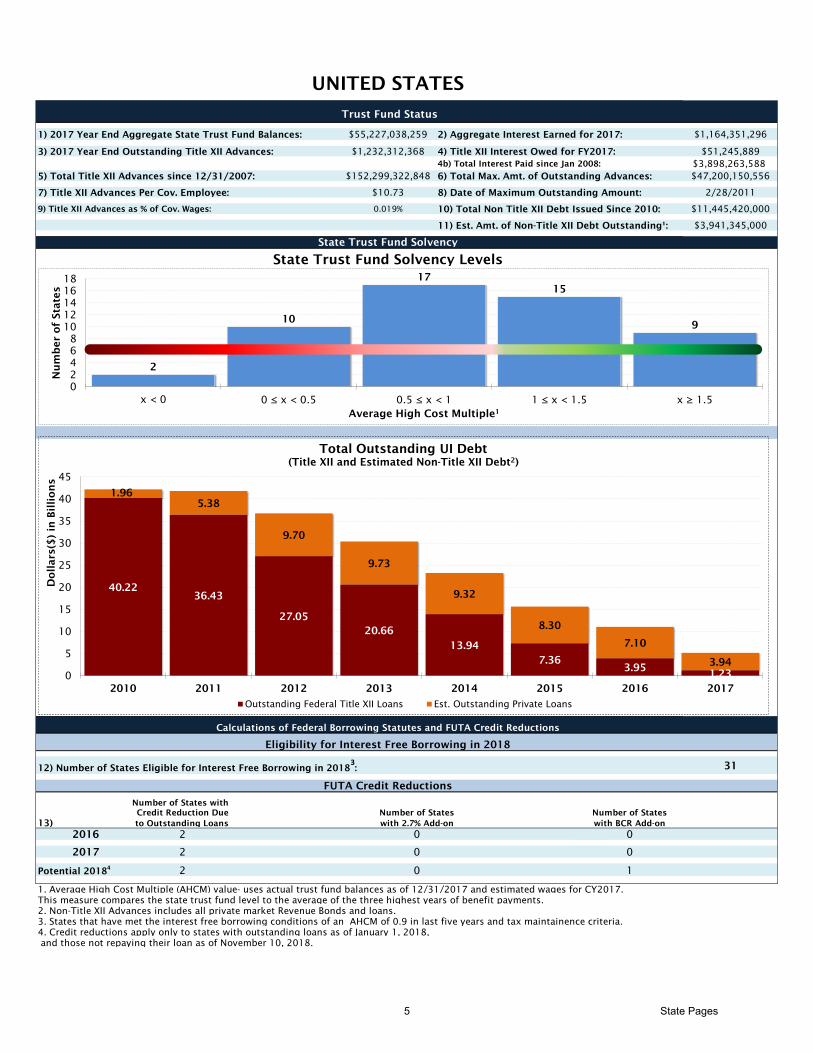
1) 2017 Year End Aggregate State Trust Fund Balances: $55,227,038,259 2) Aggregate Interest Earned for 2017: $1,164,351,296
3) 2017 Year End Outstanding Title XII Advances: $1,232,312,368 4) Title XII Interest Owed for FY2017: $51,245,889
4b) Total Interest Paid since Jan 2008: $3,898,263,588
5) Total Title XII Advances since 12/31/2007: $152,299,322,848 6) Total Max. Amt. of Outstanding Advances: $47,200,150,556
7) Title XII Advances Per Cov. Employee: $10.73 8) Date of Maximum Outstanding Amount: 2/28/2011
9) Title XII Advances as % of Cov. Wages: 0.019% 10) Total Non Title XII Debt Issued Since 2010: $11,445,420,000
11) Est. Amt. of Non-Title XII Debt Outstanding¹: $3,941,345,000
State Trust Fund Solvency
State Trust Fund Solvency Levels
Calculations of Federal Borrowing Statutes and FUTA Credit Reductions
Eligibility for Interest Free Borrowing in 2018
12) Number of States Eligible for Interest Free Borrowing in 20183: 31
FUTA Credit Reductions
Number of States with
Credit Reduction Due
13) to Outstanding Loans
2016
2017
Potential 20184
1. Average High Cost Multiple (AHCM) value- uses actual trust fund balances as of 12/31/2017 and estimated wages for CY2017.
This measure compares the state trust fund level to the average of the three highest years of benefit payments.
2. Non-Title XII Advances includes all private market Revenue Bonds and loans.
3. States that have met the interest free borrowing conditions of an AHCM of 0.9 in last five years and tax maintainence criteria.
4. Credit reductions apply only to states with outstanding loans as of January 1, 2018,
and those not repaying their loan as of November 10, 2018.
2
2
2
Number of States
0
with BCR Add-on
0
0 1
Number of States
with 2.7% Add-on
0
0
2
10
17
15
9
0
2
4
6
8
10
12
14
16
18
x < 0 0 ≤ x < 0.5 0.5 ≤ x < 1 1 ≤ x < 1.5 x ≥ 1.5
Nu
mb
er o
f States
Average High Cost Multiple1
40.22
36.43
27.05
20.66
13.94
7.36
3.951.23
1.96
5.38
9.70
9.73
9.32
8.30
7.10
3.94
0
5
10
15
20
25
30
35
40
45
2010 2011 2012 2013 2014 2015 2016 2017
Do
llars($
) in
Billio
ns
Total Outstanding UI Debt
(Title XII and Estimated Non-Title XII Debt2)
Outstanding Federal Title XII Loans Est. Outstanding Private Loans
5 State Pages

ALASKA
State Trust Fund Status
1) UI Trust Fund Balance as of 1/1/2018: $454,832,414 2) Interest Earned for 2017: $9,983,472
3) Outstanding Title XII Advance as of 1/1/2018: $0 4) Title XII Interest Owed for FY2017: $0
5) Total Title XII Advances Since 12/31/2007: $0 6) Max. Amount of Outstanding Advances:
7) Title XII Advances Per Cov. Employee: $0.00 8) Date of Maximum Outstanding Amount:
9) Title XII Advances as % of Cov. Wages: 0.00% 10) Non Title XII Debt Issued Since 2010: $0
11) Est. Amt. of Non-Title XII Debt Outstanding¹: $0
State Trust Fund Solvency
12) Trust Fund Balance Compared to Yearly Benefit Costs
0.0 4
13) Solvency Level - Using Average High Cost Multiple²
0.0 2.5
Calculations of Federal Borrowing Statutes and FUTA Credit Reductions
Eligibility for Interest Free Borrowing in 2018
14) Last year in which State achieved a 0.9 Avg. High Cost Multiple3
: 2017
15) Lowest Percentage Avg. Tax rate is of the Previous 5 yr. Ben Cost Rate (>75% elig. Req.) N/A*
16) Lowest Percentage Avg. Tax Rate is of the Previous Avg. Year's Tax Rate (>80% elig. Req.) N/A*
FUTA Tax Rate
Credit Reduction Due
17) to Outstanding Loans Credit Reduction FUTA Tax Rate4
2016 0.0% 0.0% 0.6%
2017 0.0% 0.0% 0.6%
Potential 2018⁵ 0.0% 0.0% 0.6%
1. Estimated from original Bond issue information from: http://emma.msrb.org/
2. Average High Cost Multiple (AHCM) value- uses actual trust fund balances as of 12/31/2017 and estimated wages for CY2017. This measure
compares the state trust fund balance to the average of the three highest years of benefit payments.
3. Must occur in the last 5 years to be eligible for an interest free loan.
4. Represents the difference between total FUTA credit (with any reductions) and the FUTA tax rate of 6.0%.
5. Credit reductions apply only to states with outstanding loans as of January 1, 2018, and not repaid by November 10, 2018.
* Not Applicable
Eligible
2.7% Add-on BCR Add-on
Total
0.0% 0.00%
0.0% 0.00%
0.0% 0.00%
1.66
3.74
0.83 2.26 2.31
Reserve Ratio
High 3 Yr. Avg.
Benefit Cost Rate
2017 Benefit
Cost Rate
Highest Yr.
Benefit Cost Rate
6 State Pages

ALABAMA
State Trust Fund Status
1) UI Trust Fund Balance as of 1/1/2018: $560,163,698 2) Interest Earned for 2017: $12,325,903
3) Outstanding Title XII Advance as of 1/1/2018: $0 4) Title XII Interest Owed for FY2017: $0
5) Total Title XII Advances Since 12/31/2007: $574,683,841 6) Max. Amount of Outstanding Advances: $283,001,164
7) Title XII Advances Per Cov. Employee: $0.00 8) Date of Maximum Outstanding Amount: 3/31/2010
9) Title XII Advances as % of Cov. Wages: 0.00% 10) Non Title XII Debt Issued Since 2010: $0
11) Est. Amt. of Non-Title XII Debt Outstanding¹: $0
State Trust Fund Solvency
12) Trust Fund Balance Compared to Yearly Benefit Costs
0.0 3.5
13) Solvency Level - Using Average High Cost Multiple²
0.0 2.5
Calculations of Federal Borrowing Statutes and FUTA Credit Reductions
Eligibility for Interest Free Borrowing in 2018
14) Last year in which State achieved a 0.9 Avg. High Cost Multiple3
: 1996
15) Lowest Percentage Avg. Tax rate is of the Previous 5 yr. Ben Cost Rate (>75% elig. Req.) 74%
16) Lowest Percentage Avg. Tax Rate is of the Previous Avg. Year's Tax Rate (>80% elig. Req.) 73%
FUTA Tax Rate
Credit Reduction Due
17) to Outstanding Loans Credit Reduction FUTA Tax Rate4
2016 0.0% 0.0% 0.6%
2017 0.0% 0.0% 0.6%
Potential 2018⁵ 0.0% 0.0% 0.6%
1. Estimated from original Bond issue information from: http://emma.msrb.org/
2. Average High Cost Multiple (AHCM) value- uses actual trust fund balances as of 12/31/2017 and estimated wages for CY2017. This measure
compares the state trust fund balance to the average of the three highest years of benefit payments.
3. Must occur in the last 5 years to be eligible for an interest free loan.
4. Represents the difference between total FUTA credit (with any reductions) and the FUTA tax rate of 6.0%.
5. Credit reductions apply only to states with outstanding loans as of January 1, 2018, and not repaid by November 10, 2018.
* Not Applicable
Ineligible
2.7% Add-on BCR Add-on
Total
0.0% 0.00%
0.0% 0.00%
0.0% 0.00%
0.86
0.80
0.23 0.92 1.14
Reserve Ratio
High 3 Yr. Avg.
Benefit Cost Rate
2017 Benefit
Cost Rate
Highest Yr.
Benefit Cost Rate
7 State Pages
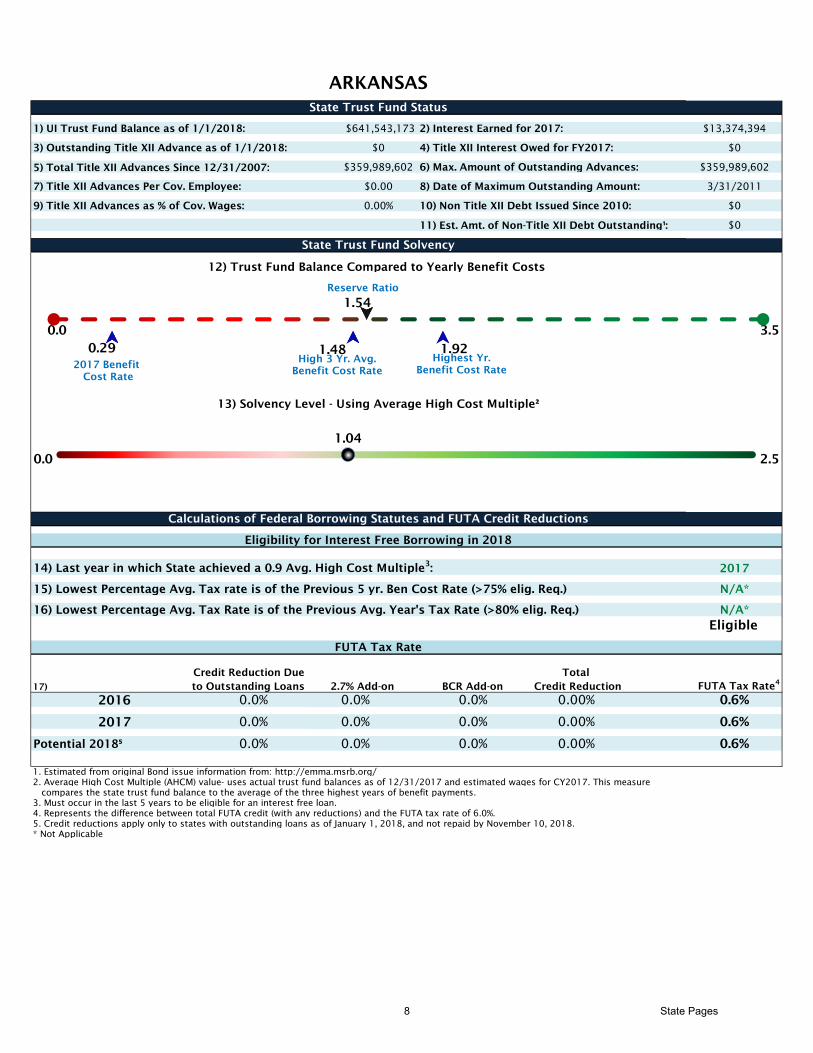
ARKANSAS
State Trust Fund Status
1) UI Trust Fund Balance as of 1/1/2018: $641,543,173 2) Interest Earned for 2017: $13,374,394
3) Outstanding Title XII Advance as of 1/1/2018: $0 4) Title XII Interest Owed for FY2017: $0
5) Total Title XII Advances Since 12/31/2007: $359,989,602 6) Max. Amount of Outstanding Advances: $359,989,602
7) Title XII Advances Per Cov. Employee: $0.00 8) Date of Maximum Outstanding Amount: 3/31/2011
9) Title XII Advances as % of Cov. Wages: 0.00% 10) Non Title XII Debt Issued Since 2010: $0
11) Est. Amt. of Non-Title XII Debt Outstanding¹: $0
State Trust Fund Solvency
12) Trust Fund Balance Compared to Yearly Benefit Costs
0.0 3.5
13) Solvency Level - Using Average High Cost Multiple²
0.0 2.5
Calculations of Federal Borrowing Statutes and FUTA Credit Reductions
Eligibility for Interest Free Borrowing in 2018
14) Last year in which State achieved a 0.9 Avg. High Cost Multiple3
: 2017
15) Lowest Percentage Avg. Tax rate is of the Previous 5 yr. Ben Cost Rate (>75% elig. Req.) N/A*
16) Lowest Percentage Avg. Tax Rate is of the Previous Avg. Year's Tax Rate (>80% elig. Req.) N/A*
FUTA Tax Rate
Credit Reduction Due
17) to Outstanding Loans Credit Reduction FUTA Tax Rate4
2016 0.0% 0.0% 0.6%
2017 0.0% 0.0% 0.6%
Potential 2018⁵ 0.0% 0.0% 0.6%
1. Estimated from original Bond issue information from: http://emma.msrb.org/
2. Average High Cost Multiple (AHCM) value- uses actual trust fund balances as of 12/31/2017 and estimated wages for CY2017. This measure
compares the state trust fund balance to the average of the three highest years of benefit payments.
3. Must occur in the last 5 years to be eligible for an interest free loan.
4. Represents the difference between total FUTA credit (with any reductions) and the FUTA tax rate of 6.0%.
5. Credit reductions apply only to states with outstanding loans as of January 1, 2018, and not repaid by November 10, 2018.
* Not Applicable
Eligible
2.7% Add-on BCR Add-on
Total
0.0% 0.00%
0.0% 0.00%
0.0% 0.00%
1.04
1.54
0.29 1.48 1.92
Reserve Ratio
High 3 Yr. Avg.
Benefit Cost Rate2017 Benefit
Cost Rate
Highest Yr.
Benefit Cost Rate
8 State Pages
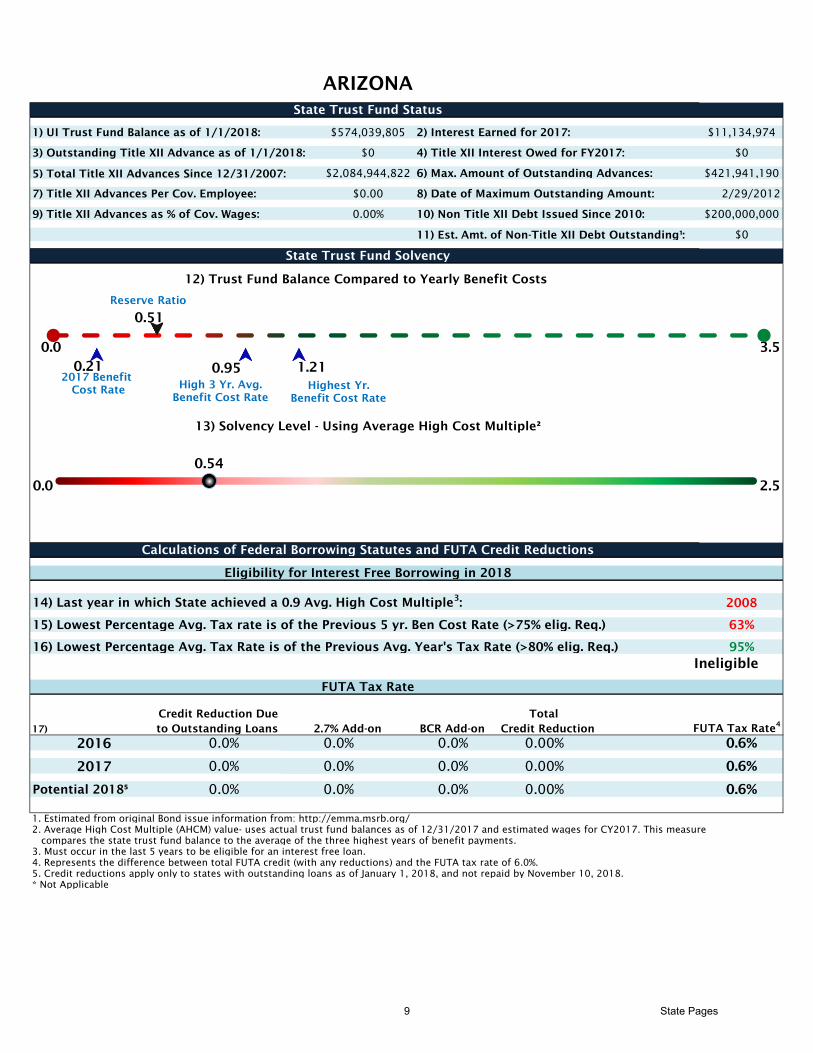
ARIZONA
State Trust Fund Status
1) UI Trust Fund Balance as of 1/1/2018: $574,039,805 2) Interest Earned for 2017: $11,134,974
3) Outstanding Title XII Advance as of 1/1/2018: $0 4) Title XII Interest Owed for FY2017: $0
5) Total Title XII Advances Since 12/31/2007: $2,084,944,822 6) Max. Amount of Outstanding Advances: $421,941,190
7) Title XII Advances Per Cov. Employee: $0.00 8) Date of Maximum Outstanding Amount: 2/29/2012
9) Title XII Advances as % of Cov. Wages: 0.00% 10) Non Title XII Debt Issued Since 2010: $200,000,000
11) Est. Amt. of Non-Title XII Debt Outstanding¹: $0
State Trust Fund Solvency
12) Trust Fund Balance Compared to Yearly Benefit Costs
0.0 3.5
13) Solvency Level - Using Average High Cost Multiple²
0.0 2.5
Calculations of Federal Borrowing Statutes and FUTA Credit Reductions
Eligibility for Interest Free Borrowing in 2018
14) Last year in which State achieved a 0.9 Avg. High Cost Multiple3
: 2008
15) Lowest Percentage Avg. Tax rate is of the Previous 5 yr. Ben Cost Rate (>75% elig. Req.) 63%
16) Lowest Percentage Avg. Tax Rate is of the Previous Avg. Year's Tax Rate (>80% elig. Req.) 95%
FUTA Tax Rate
Credit Reduction Due
17) to Outstanding Loans Credit Reduction FUTA Tax Rate4
2016 0.0% 0.0% 0.6%
2017 0.0% 0.0% 0.6%
Potential 2018⁵ 0.0% 0.0% 0.6%
1. Estimated from original Bond issue information from: http://emma.msrb.org/
2. Average High Cost Multiple (AHCM) value- uses actual trust fund balances as of 12/31/2017 and estimated wages for CY2017. This measure
compares the state trust fund balance to the average of the three highest years of benefit payments.
3. Must occur in the last 5 years to be eligible for an interest free loan.
4. Represents the difference between total FUTA credit (with any reductions) and the FUTA tax rate of 6.0%.
5. Credit reductions apply only to states with outstanding loans as of January 1, 2018, and not repaid by November 10, 2018.
* Not Applicable
Ineligible
2.7% Add-on BCR Add-on
Total
0.0% 0.00%
0.0% 0.00%
0.0% 0.00%
0.54
0.51
0.21 0.95 1.21
Reserve Ratio
High 3 Yr. Avg.
Benefit Cost Rate
2017 Benefit
Cost RateHighest Yr.
Benefit Cost Rate
9 State Pages

CALIFORNIA
State Trust Fund Status
1) UI Trust Fund Balance as of 1/1/2018: $11,714,728 2) Interest Earned for 2017: $26,902
3) Outstanding Title XII Advance as of 1/1/2018: $1,163,484,771 4) Title XII Interest Owed for FY2017: $49,753,231
5) Total Title XII Advances Since 12/31/2007: $62,224,550,240 6) Max. Amount of Outstanding Advances: $10,957,982,217
7) Title XII Advances Per Cov. Employee: $84.41 8) Date of Maximum Outstanding Amount: 4/30/2011
9) Title XII Advances as % of Cov. Wages: 0.13% 10) Non Title XII Debt Issued Since 2010: $0
11) Est. Amt. of Non-Title XII Debt Outstanding¹: $0
State Trust Fund Solvency
12) Trust Fund Balance Compared to Yearly Benefit Costs
0.0 3.5
13) Solvency Level - Using Average High Cost Multiple²
0.0 2.5
Calculations of Federal Borrowing Statutes and FUTA Credit Reductions
Eligibility for Interest Free Borrowing in 2018
14) Last year in which State achieved a 0.9 Avg. High Cost Multiple3
: 1990
15) Lowest Percentage Avg. Tax rate is of the Previous 5 yr. Ben Cost Rate (>75% elig. Req.) 66%
16) Lowest Percentage Avg. Tax Rate is of the Previous Avg. Year's Tax Rate (>80% elig. Req.) 90%
FUTA Tax Rate
Credit Reduction Due
17) to Outstanding Loans Credit Reduction FUTA Tax Rate4
2016 1.8% 0.0% 2.4%
2017 2.1% 0.0% 2.7%
Potential 2018⁵ 2.4% 0.0% 3.0%
1. Estimated from original Bond issue information from: http://emma.msrb.org/
2. Average High Cost Multiple (AHCM) value- uses actual trust fund balances as of 12/31/2017 and estimated wages for CY2017. This measure
compares the state trust fund balance to the average of the three highest years of benefit payments.
3. Must occur in the last 5 years to be eligible for an interest free loan.
4. Represents the difference between total FUTA credit (with any reductions) and the FUTA tax rate of 6.0%.
5. Credit reductions apply only to states with outstanding loans as of January 1, 2018, and not repaid by November 10, 2018.
* Not Applicable
Ineligible
2.7% Add-on BCR Add-on
Total
0.0% 1.80%
0.0% 2.10%
0.0% 2.40%
0.00
0.00
0.56 1.54 1.86
Reserve Ratio
High 3 Yr. Avg.
Benefit Cost Rate
2017 Benefit
Cost Rate
Highest Yr.
Benefit Cost Rate
10 State Pages
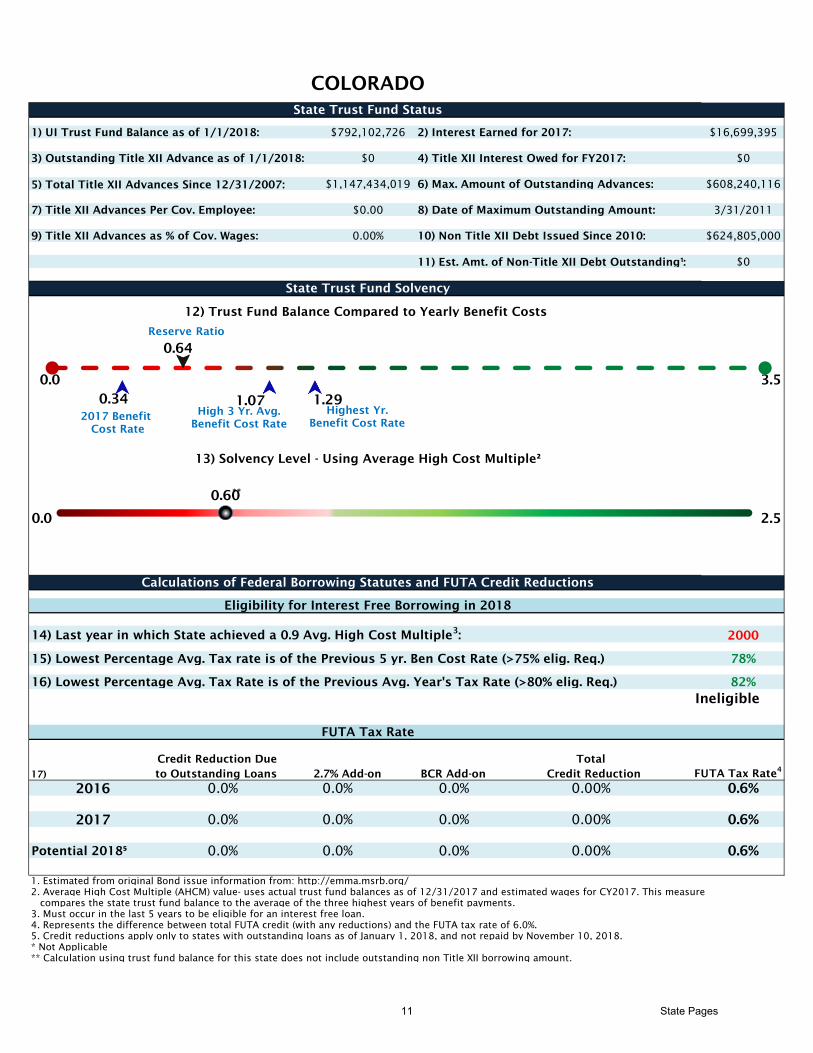
COLORADO
State Trust Fund Status
1) UI Trust Fund Balance as of 1/1/2018: $792,102,726 2) Interest Earned for 2017: $16,699,395
3) Outstanding Title XII Advance as of 1/1/2018: $0 4) Title XII Interest Owed for FY2017: $0
5) Total Title XII Advances Since 12/31/2007: $1,147,434,019 6) Max. Amount of Outstanding Advances: $608,240,116
7) Title XII Advances Per Cov. Employee: $0.00 8) Date of Maximum Outstanding Amount: 3/31/2011
9) Title XII Advances as % of Cov. Wages: 0.00% 10) Non Title XII Debt Issued Since 2010: $624,805,000
11) Est. Amt. of Non-Title XII Debt Outstanding¹: $0
State Trust Fund Solvency
12) Trust Fund Balance Compared to Yearly Benefit Costs
0.0 3.5
13) Solvency Level - Using Average High Cost Multiple²
0.0 2.5
Calculations of Federal Borrowing Statutes and FUTA Credit Reductions
Eligibility for Interest Free Borrowing in 2018
14) Last year in which State achieved a 0.9 Avg. High Cost Multiple3
: 2000
15) Lowest Percentage Avg. Tax rate is of the Previous 5 yr. Ben Cost Rate (>75% elig. Req.) 78%
16) Lowest Percentage Avg. Tax Rate is of the Previous Avg. Year's Tax Rate (>80% elig. Req.) 82%
FUTA Tax Rate
Credit Reduction Due
17) to Outstanding Loans Credit Reduction FUTA Tax Rate4
2016 0.0% 0.0% 0.6%
2017 0.0% 0.0% 0.6%
Potential 2018⁵ 0.0% 0.0% 0.6%
1. Estimated from original Bond issue information from: http://emma.msrb.org/
2. Average High Cost Multiple (AHCM) value- uses actual trust fund balances as of 12/31/2017 and estimated wages for CY2017. This measure
compares the state trust fund balance to the average of the three highest years of benefit payments.
3. Must occur in the last 5 years to be eligible for an interest free loan.
4. Represents the difference between total FUTA credit (with any reductions) and the FUTA tax rate of 6.0%.
5. Credit reductions apply only to states with outstanding loans as of January 1, 2018, and not repaid by November 10, 2018.
* Not Applicable
** Calculation using trust fund balance for this state does not include outstanding non Title XII borrowing amount.
0.00%
0.00%
Ineligible
2.7% Add-on BCR Add-on
0.0%
Total
0.00%
0.0%
0.0%
0.60
0.64
0.34 1.07 1.29
Reserve Ratio
High 3 Yr. Avg.
Benefit Cost Rate2017 Benefit
Cost Rate
Highest Yr.
Benefit Cost Rate
**
11 State Pages
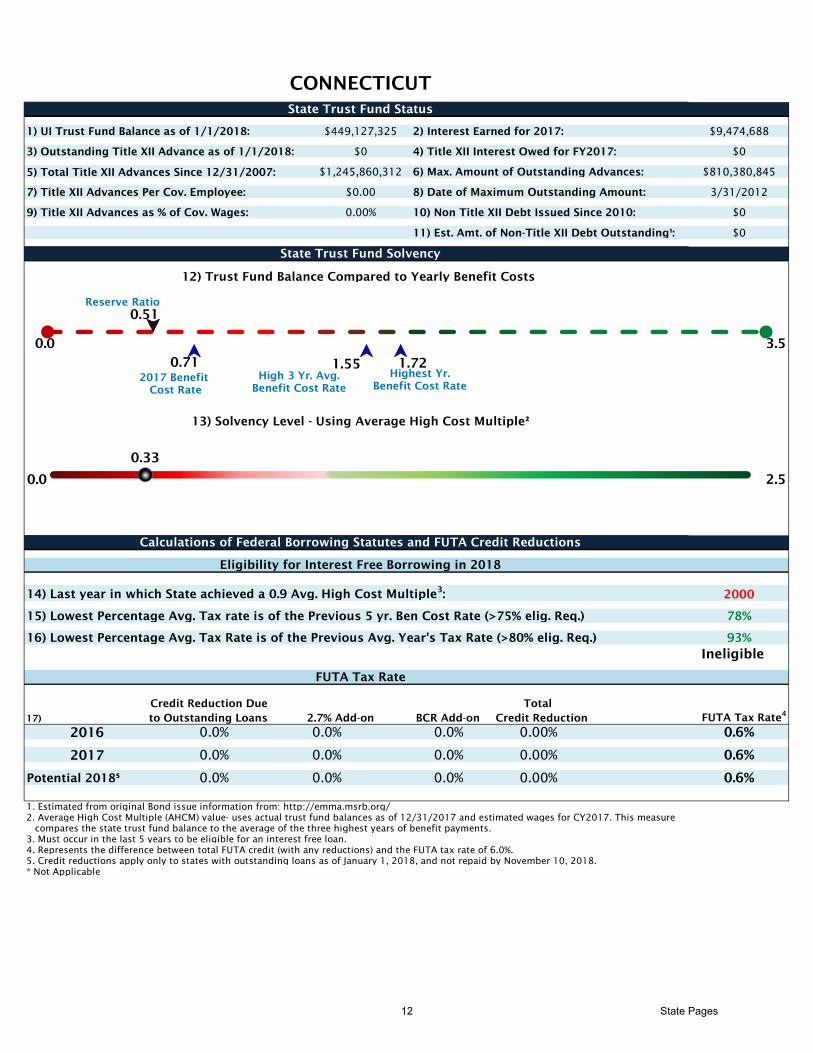
CONNECTICUT
State Trust Fund Status
1) UI Trust Fund Balance as of 1/1/2018: $449,127,325 2) Interest Earned for 2017: $9,474,688
3) Outstanding Title XII Advance as of 1/1/2018: $0 4) Title XII Interest Owed for FY2017: $0
5) Total Title XII Advances Since 12/31/2007: $1,245,860,312 6) Max. Amount of Outstanding Advances: $810,380,845
7) Title XII Advances Per Cov. Employee: $0.00 8) Date of Maximum Outstanding Amount: 3/31/2012
9) Title XII Advances as % of Cov. Wages: 0.00% 10) Non Title XII Debt Issued Since 2010: $0
11) Est. Amt. of Non-Title XII Debt Outstanding¹: $0
State Trust Fund Solvency
12) Trust Fund Balance Compared to Yearly Benefit Costs
0.0 3.5
13) Solvency Level - Using Average High Cost Multiple²
0.0 2.5
Calculations of Federal Borrowing Statutes and FUTA Credit Reductions
Eligibility for Interest Free Borrowing in 2018
14) Last year in which State achieved a 0.9 Avg. High Cost Multiple3
: 2000
15) Lowest Percentage Avg. Tax rate is of the Previous 5 yr. Ben Cost Rate (>75% elig. Req.) 78%
16) Lowest Percentage Avg. Tax Rate is of the Previous Avg. Year's Tax Rate (>80% elig. Req.) 93%
FUTA Tax Rate
Credit Reduction Due
17) to Outstanding Loans Credit Reduction FUTA Tax Rate4
2016 0.0% 0.0% 0.6%
2017 0.0% 0.0% 0.6%
Potential 2018⁵ 0.0% 0.0% 0.6%
1. Estimated from original Bond issue information from: http://emma.msrb.org/
2. Average High Cost Multiple (AHCM) value- uses actual trust fund balances as of 12/31/2017 and estimated wages for CY2017. This measure
compares the state trust fund balance to the average of the three highest years of benefit payments.
3. Must occur in the last 5 years to be eligible for an interest free loan.
4. Represents the difference between total FUTA credit (with any reductions) and the FUTA tax rate of 6.0%.
5. Credit reductions apply only to states with outstanding loans as of January 1, 2018, and not repaid by November 10, 2018.
* Not Applicable
Ineligible
2.7% Add-on BCR Add-on
Total
0.0% 0.00%
0.0% 0.00%
0.0% 0.00%
0.33
0.51
0.71 1.55 1.72
Reserve Ratio
High 3 Yr. Avg.
Benefit Cost Rate
2017 Benefit
Cost Rate
Highest Yr.
Benefit Cost Rate
12 State Pages
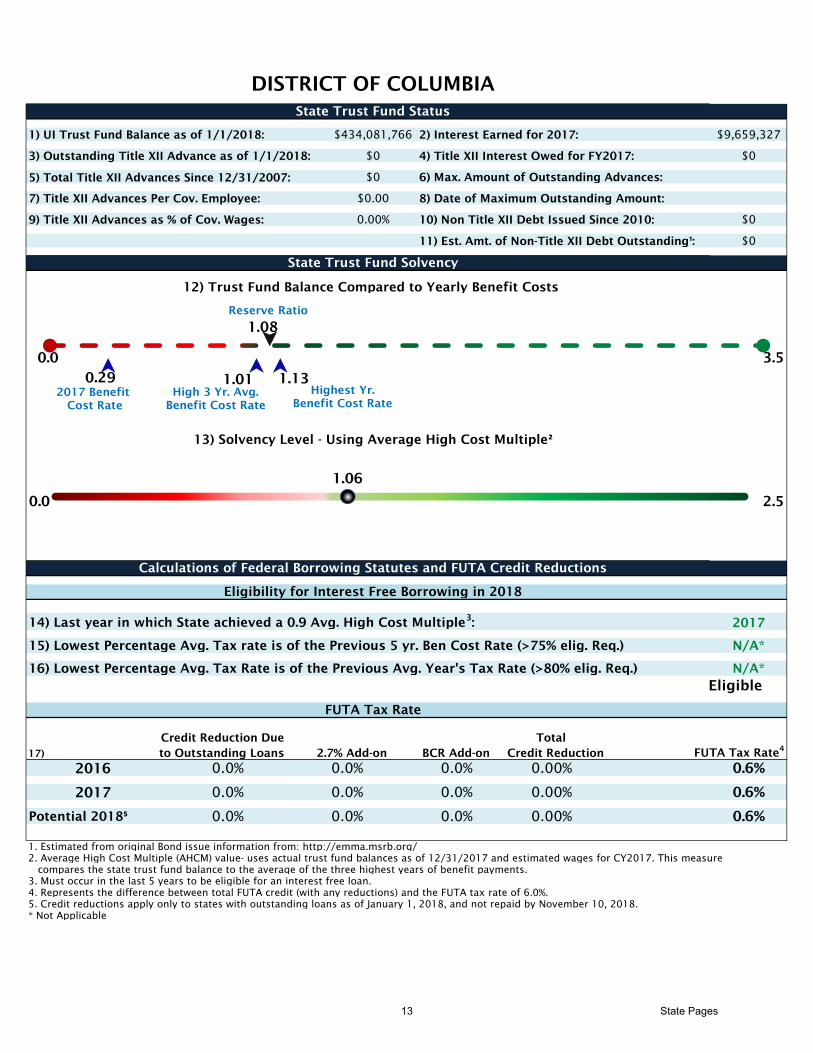
DISTRICT OF COLUMBIA
State Trust Fund Status
1) UI Trust Fund Balance as of 1/1/2018: $434,081,766 2) Interest Earned for 2017: $9,659,327
3) Outstanding Title XII Advance as of 1/1/2018: $0 4) Title XII Interest Owed for FY2017: $0
5) Total Title XII Advances Since 12/31/2007: $0 6) Max. Amount of Outstanding Advances:
7) Title XII Advances Per Cov. Employee: $0.00 8) Date of Maximum Outstanding Amount:
9) Title XII Advances as % of Cov. Wages: 0.00% 10) Non Title XII Debt Issued Since 2010: $0
11) Est. Amt. of Non-Title XII Debt Outstanding¹: $0
State Trust Fund Solvency
12) Trust Fund Balance Compared to Yearly Benefit Costs
0.0 3.5
13) Solvency Level - Using Average High Cost Multiple²
0.0 2.5
Calculations of Federal Borrowing Statutes and FUTA Credit Reductions
Eligibility for Interest Free Borrowing in 2018
14) Last year in which State achieved a 0.9 Avg. High Cost Multiple3
: 2017
15) Lowest Percentage Avg. Tax rate is of the Previous 5 yr. Ben Cost Rate (>75% elig. Req.) N/A*
16) Lowest Percentage Avg. Tax Rate is of the Previous Avg. Year's Tax Rate (>80% elig. Req.) N/A*
FUTA Tax Rate
Credit Reduction Due
17) to Outstanding Loans Credit Reduction FUTA Tax Rate4
2016 0.0% 0.0% 0.6%
2017 0.0% 0.0% 0.6%
Potential 2018⁵ 0.0% 0.0% 0.6%
1. Estimated from original Bond issue information from: http://emma.msrb.org/
2. Average High Cost Multiple (AHCM) value- uses actual trust fund balances as of 12/31/2017 and estimated wages for CY2017. This measure
compares the state trust fund balance to the average of the three highest years of benefit payments.
3. Must occur in the last 5 years to be eligible for an interest free loan.
4. Represents the difference between total FUTA credit (with any reductions) and the FUTA tax rate of 6.0%.
5. Credit reductions apply only to states with outstanding loans as of January 1, 2018, and not repaid by November 10, 2018.
* Not Applicable
Eligible
2.7% Add-on BCR Add-on
Total
0.0% 0.00%
0.0% 0.00%
0.0% 0.00%
1.06
1.08
0.29 1.01 1.13
Reserve Ratio
High 3 Yr. Avg.
Benefit Cost Rate
2017 Benefit
Cost Rate
Highest Yr.
Benefit Cost Rate
13 State Pages

DELAWARE
State Trust Fund Status
1) UI Trust Fund Balance as of 1/1/2018: $129,262,216 2) Interest Earned for 2017: $2,652,007
3) Outstanding Title XII Advance as of 1/1/2018: $0 4) Title XII Interest Owed for FY2017: $0
5) Total Title XII Advances Since 12/31/2007: $78,861,258 6) Max. Amount of Outstanding Advances: $78,565,258
7) Title XII Advances Per Cov. Employee: $0.00 8) Date of Maximum Outstanding Amount: 1/31/2013
9) Title XII Advances as % of Cov. Wages: 0.00% 10) Non Title XII Debt Issued Since 2010: $0
11) Est. Amt. of Non-Title XII Debt Outstanding¹: $0
State Trust Fund Solvency
12) Trust Fund Balance Compared to Yearly Benefit Costs
0.0 3.5
13) Solvency Level - Using Average High Cost Multiple²
0.0 2.5
Calculations of Federal Borrowing Statutes and FUTA Credit Reductions
Eligibility for Interest Free Borrowing in 2018
14) Last year in which State achieved a 0.9 Avg. High Cost Multiple3
: 2007
15) Lowest Percentage Avg. Tax rate is of the Previous 5 yr. Ben Cost Rate (>75% elig. Req.) 85%
16) Lowest Percentage Avg. Tax Rate is of the Previous Avg. Year's Tax Rate (>80% elig. Req.) 78%
FUTA Tax Rate
Credit Reduction Due
17) to Outstanding Loans Credit Reduction FUTA Tax Rate4
2016 0.0% 0.0% 0.6%
2017 0.0% 0.0% 0.6%
Potential 2018⁵ 0.0% 0.0% 0.6%
1. Estimated from original Bond issue information from: http://emma.msrb.org/
2. Average High Cost Multiple (AHCM) value- uses actual trust fund balances as of 12/31/2017 and estimated wages for CY2017. This measure
compares the state trust fund balance to the average of the three highest years of benefit payments.
3. Must occur in the last 5 years to be eligible for an interest free loan.
4. Represents the difference between total FUTA credit (with any reductions) and the FUTA tax rate of 6.0%.
5. Credit reductions apply only to states with outstanding loans as of January 1, 2018, and not repaid by November 10, 2018.
* Not Applicable
Ineligible
2.7% Add-on BCR Add-on
Total
0.0% 0.00%
0.0% 0.00%
0.0% 0.00%
0.57
0.66
0.33 1.15 1.35
Reserve Ratio
High 3 Yr. Avg.
Benefit Cost Rate
2017 Benefit
Cost Rate
Highest Yr.
Benefit Cost Rate
14 State Pages

FLORIDA
State Trust Fund Status
1) UI Trust Fund Balance as of 1/1/2018: $3,626,299,521 2) Interest Earned for 2017: $78,677,558
3) Outstanding Title XII Advance as of 1/1/2018: $0 4) Title XII Interest Owed for FY2017: $0
5) Total Title XII Advances Since 12/31/2007: $3,529,950,000 6) Max. Amount of Outstanding Advances: $2,305,300,000
7) Title XII Advances Per Cov. Employee: $0.00 8) Date of Maximum Outstanding Amount: 3/31/2011
9) Title XII Advances as % of Cov. Wages: 0.00% 10) Non Title XII Debt Issued Since 2010: $0
11) Est. Amt. of Non-Title XII Debt Outstanding¹: $0
State Trust Fund Solvency
12) Trust Fund Balance Compared to Yearly Benefit Costs
0.0 3.5
13) Solvency Level - Using Average High Cost Multiple²
0.0 2.5
Calculations of Federal Borrowing Statutes and FUTA Credit Reductions
Eligibility for Interest Free Borrowing in 2018
14) Last year in which State achieved a 0.9 Avg. High Cost Multiple3
: 2017
15) Lowest Percentage Avg. Tax rate is of the Previous 5 yr. Ben Cost Rate (>75% elig. Req.) N/A*
16) Lowest Percentage Avg. Tax Rate is of the Previous Avg. Year's Tax Rate (>80% elig. Req.) N/A*
FUTA Tax Rate
Credit Reduction Due
17) to Outstanding Loans Credit Reduction FUTA Tax Rate4
2016 0.0% 0.0% 0.6%
2017 0.0% 0.0% 0.6%
Potential 2018⁵ 0.0% 0.0% 0.6%
1. Estimated from original Bond issue information from: http://emma.msrb.org/
2. Average High Cost Multiple (AHCM) value- uses actual trust fund balances as of 12/31/2017 and estimated wages for CY2017. This measure
compares the state trust fund balance to the average of the three highest years of benefit payments.
3. Must occur in the last 5 years to be eligible for an interest free loan.
4. Represents the difference between total FUTA credit (with any reductions) and the FUTA tax rate of 6.0%.
5. Credit reductions apply only to states with outstanding loans as of January 1, 2018, and not repaid by November 10, 2018.
* Not Applicable
Eligible
2.7% Add-on BCR Add-on
Total
0.0% 0.00%
0.0% 0.00%
0.0% 0.00%
1.04
1.05
0.11 1.01 1.26
Reserve Ratio
High 3 Yr. Avg.
Benefit Cost Rate
2017 Benefit
Cost Rate
Highest Yr.
Benefit Cost Rate
15 State Pages
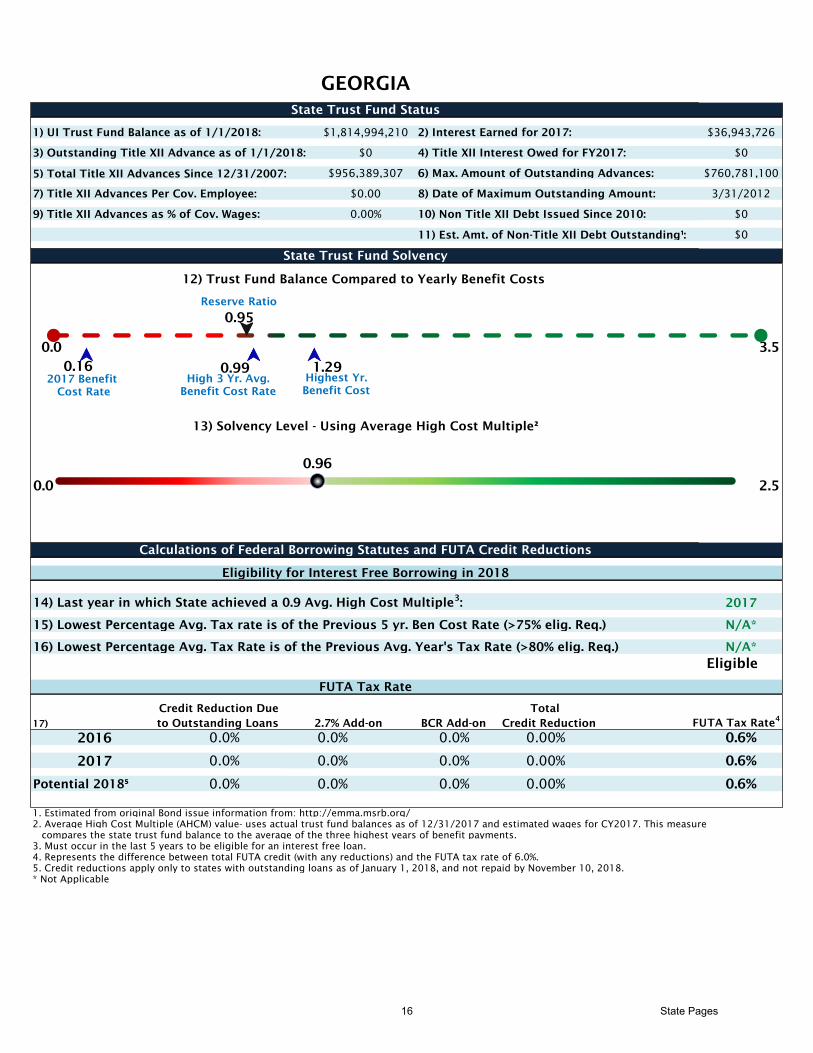
GEORGIA
State Trust Fund Status
1) UI Trust Fund Balance as of 1/1/2018: $1,814,994,210 2) Interest Earned for 2017: $36,943,726
3) Outstanding Title XII Advance as of 1/1/2018: $0 4) Title XII Interest Owed for FY2017: $0
5) Total Title XII Advances Since 12/31/2007: $956,389,307 6) Max. Amount of Outstanding Advances: $760,781,100
7) Title XII Advances Per Cov. Employee: $0.00 8) Date of Maximum Outstanding Amount: 3/31/2012
9) Title XII Advances as % of Cov. Wages: 0.00% 10) Non Title XII Debt Issued Since 2010: $0
11) Est. Amt. of Non-Title XII Debt Outstanding¹: $0
State Trust Fund Solvency
12) Trust Fund Balance Compared to Yearly Benefit Costs
0.0 3.5
13) Solvency Level - Using Average High Cost Multiple²
0.0 2.5
Calculations of Federal Borrowing Statutes and FUTA Credit Reductions
Eligibility for Interest Free Borrowing in 2018
14) Last year in which State achieved a 0.9 Avg. High Cost Multiple3
: 2017
15) Lowest Percentage Avg. Tax rate is of the Previous 5 yr. Ben Cost Rate (>75% elig. Req.) N/A*
16) Lowest Percentage Avg. Tax Rate is of the Previous Avg. Year's Tax Rate (>80% elig. Req.) N/A*
FUTA Tax Rate
Credit Reduction Due
17) to Outstanding Loans Credit Reduction FUTA Tax Rate4
2016 0.0% 0.0% 0.6%
2017 0.0% 0.0% 0.6%
Potential 2018⁵ 0.0% 0.0% 0.6%
1. Estimated from original Bond issue information from: http://emma.msrb.org/
2. Average High Cost Multiple (AHCM) value- uses actual trust fund balances as of 12/31/2017 and estimated wages for CY2017. This measure
compares the state trust fund balance to the average of the three highest years of benefit payments.
3. Must occur in the last 5 years to be eligible for an interest free loan.
4. Represents the difference between total FUTA credit (with any reductions) and the FUTA tax rate of 6.0%.
5. Credit reductions apply only to states with outstanding loans as of January 1, 2018, and not repaid by November 10, 2018.
* Not Applicable
Eligible
2.7% Add-on BCR Add-on
Total
0.0% 0.00%
0.0% 0.00%
0.0% 0.00%
0.96
0.95
0.16 0.99 1.29
Reserve Ratio
High 3 Yr. Avg.
Benefit Cost Rate
2017 Benefit
Cost Rate
Highest Yr.
Benefit Cost
16 State Pages

HAWAII
State Trust Fund Status
1) UI Trust Fund Balance as of 1/1/2018: $520,364,894 2) Interest Earned for 2017: $11,606,583
3) Outstanding Title XII Advance as of 1/1/2018: $0 4) Title XII Interest Owed for FY2017: $0
5) Total Title XII Advances Since 12/31/2007: $182,614,679 6) Max. Amount of Outstanding Advances: $50,696,344
7) Title XII Advances Per Cov. Employee: $0.00 8) Date of Maximum Outstanding Amount: 3/31/2011
9) Title XII Advances as % of Cov. Wages: 0.00% 10) Non Title XII Debt Issued Since 2010: $0
11) Est. Amt. of Non-Title XII Debt Outstanding¹: $0
State Trust Fund Solvency
12) Trust Fund Balance Compared to Yearly Benefit Costs
0.0 3.5
13) Solvency Level - Using Average High Cost Multiple²
0.0 2.5
Calculations of Federal Borrowing Statutes and FUTA Credit Reductions
Eligibility for Interest Free Borrowing in 2018
14) Last year in which State achieved a 0.9 Avg. High Cost Multiple3
: 2017
15) Lowest Percentage Avg. Tax rate is of the Previous 5 yr. Ben Cost Rate (>75% elig. Req.) N/A*
16) Lowest Percentage Avg. Tax Rate is of the Previous Avg. Year's Tax Rate (>80% elig. Req.) N/A*
FUTA Tax Rate
Credit Reduction Due
17) to Outstanding Loans Credit Reduction FUTA Tax Rate4
2016 0.0% 0.0% 0.6%
2017 0.0% 0.0% 0.6%
Potential 2018⁵ 0.0% 0.0% 0.6%
1. Estimated from original Bond issue information from: http://emma.msrb.org/
2. Average High Cost Multiple (AHCM) value- uses actual trust fund balances as of 12/31/2017 and estimated wages for CY2017. This measure
compares the state trust fund balance to the average of the three highest years of benefit payments.
3. Must occur in the last 5 years to be eligible for an interest free loan.
4. Represents the difference between total FUTA credit (with any reductions) and the FUTA tax rate of 6.0%.
5. Credit reductions apply only to states with outstanding loans as of January 1, 2018, and not repaid by November 10, 2018.
* Not Applicable
Eligible
2.7% Add-on BCR Add-on
Total
0.0% 0.00%
0.0% 0.00%
0.0% 0.00%
1.17
2.29
0.70 1.96 2.25
Reserve Ratio
High 3 Yr. Avg.
Benefit Cost Rate
2017 Benefit
Cost Rate
Highest Yr.
Benefit Cost Rate
17 State Pages

IOWA
State Trust Fund Status
1) UI Trust Fund Balance as of 1/1/2018: $1,118,225,591 2) Interest Earned for 2017: $23,214,535
3) Outstanding Title XII Advance as of 1/1/2018: $0 4) Title XII Interest Owed for FY2017: $0
5) Total Title XII Advances Since 12/31/2007: $0 6) Max. Amount of Outstanding Advances:
7) Title XII Advances Per Cov. Employee: $0.00 8) Date of Maximum Outstanding Amount:
9) Title XII Advances as % of Cov. Wages: 0.00% 10) Non Title XII Debt Issued Since 2010: $0
11) Est. Amt. of Non-Title XII Debt Outstanding¹: $0
State Trust Fund Solvency
12) Trust Fund Balance Compared to Yearly Benefit Costs
0.0 3.5
13) Solvency Level - Using Average High Cost Multiple²
0.0 2.5
Calculations of Federal Borrowing Statutes and FUTA Credit Reductions
Eligibility for Interest Free Borrowing in 2018
14) Last year in which State achieved a 0.9 Avg. High Cost Multiple3
: 2017
15) Lowest Percentage Avg. Tax rate is of the Previous 5 yr. Ben Cost Rate (>75% elig. Req.) N/A*
16) Lowest Percentage Avg. Tax Rate is of the Previous Avg. Year's Tax Rate (>80% elig. Req.) N/A*
FUTA Tax Rate
Credit Reduction Due
17) to Outstanding Loans Credit Reduction FUTA Tax Rate4
2016 0.0% 0.0% 0.6%
2017 0.0% 0.0% 0.6%
Potential 2018⁵ 0.0% 0.0% 0.6%
1. Estimated from original Bond issue information from: http://emma.msrb.org/
2. Average High Cost Multiple (AHCM) value- uses actual trust fund balances as of 12/31/2017 and estimated wages for CY2017. This measure
compares the state trust fund balance to the average of the three highest years of benefit payments.
3. Must occur in the last 5 years to be eligible for an interest free loan.
4. Represents the difference between total FUTA credit (with any reductions) and the FUTA tax rate of 6.0%.
5. Credit reductions apply only to states with outstanding loans as of January 1, 2018, and not repaid by November 10, 2018.
* Not Applicable
Eligible
2.7% Add-on BCR Add-on
Total
0.0% 0.00%
0.0% 0.00%
0.0% 0.00%
1.37
2.00
0.71 1.46 1.90
Reserve Ratio
High 3 Yr. Avg.
Benefit Cost Rate
2017 Benefit
Cost Rate
Highest Yr.
Benefit Cost Rate
18 State Pages

IDAHO
State Trust Fund Status
1) UI Trust Fund Balance as of 1/1/2018: $584,760,858 2) Interest Earned for 2017: $11,957,658
3) Outstanding Title XII Advance as of 1/1/2018: $0 4) Title XII Interest Owed for FY2017: $0
5) Total Title XII Advances Since 12/31/2007: $202,401,700 6) Max. Amount of Outstanding Advances: $202,401,700
7) Title XII Advances Per Cov. Employee: $0.00 8) Date of Maximum Outstanding Amount: 3/31/2010
9) Title XII Advances as % of Cov. Wages: 0.00% 10) Non Title XII Debt Issued Since 2010: $187,570,000
11) Est. Amt. of Non-Title XII Debt Outstanding¹: $0
State Trust Fund Solvency
12) Trust Fund Balance Compared to Yearly Benefit Costs
0.0 3.5
13) Solvency Level - Using Average High Cost Multiple²
0.0 2.5
Calculations of Federal Borrowing Statutes and FUTA Credit Reductions
Eligibility for Interest Free Borrowing in 2018
14) Last year in which State achieved a 0.9 Avg. High Cost Multiple3
: 2017
15) Lowest Percentage Avg. Tax rate is of the Previous 5 yr. Ben Cost Rate (>75% elig. Req.) N/A*
16) Lowest Percentage Avg. Tax Rate is of the Previous Avg. Year's Tax Rate (>80% elig. Req.) N/A*
FUTA Tax Rate
Credit Reduction Due
17) to Outstanding Loans Credit Reduction FUTA Tax Rate4
2016 0.0% 0.0% 0.6%
2017 0.0% 0.0% 0.6%
Potential 2018⁵ 0.0% 0.0% 0.6%
1. Estimated from original Bond issue information from: http://emma.msrb.org/
2. Average High Cost Multiple (AHCM) value- uses actual trust fund balances as of 12/31/2017 and estimated wages for CY2017. This measure
compares the state trust fund balance to the average of the three highest years of benefit payments.
3. Must occur in the last 5 years to be eligible for an interest free loan.
4. Represents the difference between total FUTA credit (with any reductions) and the FUTA tax rate of 6.0%.
5. Credit reductions apply only to states with outstanding loans as of January 1, 2018, and not repaid by November 10, 2018.
* Not Applicable
Eligible
2.7% Add-on BCR Add-on
Total
0.0% 0.00%
0.0% 0.00%
0.0% 0.00%
1.44
2.62
0.40 1.82 2.40
Reserve Ratio
High 3 Yr. Avg.
Benefit Cost Rate
2017 Benefit
Cost Rate
Highest Yr.
Benefit Cost Rate
19 State Pages
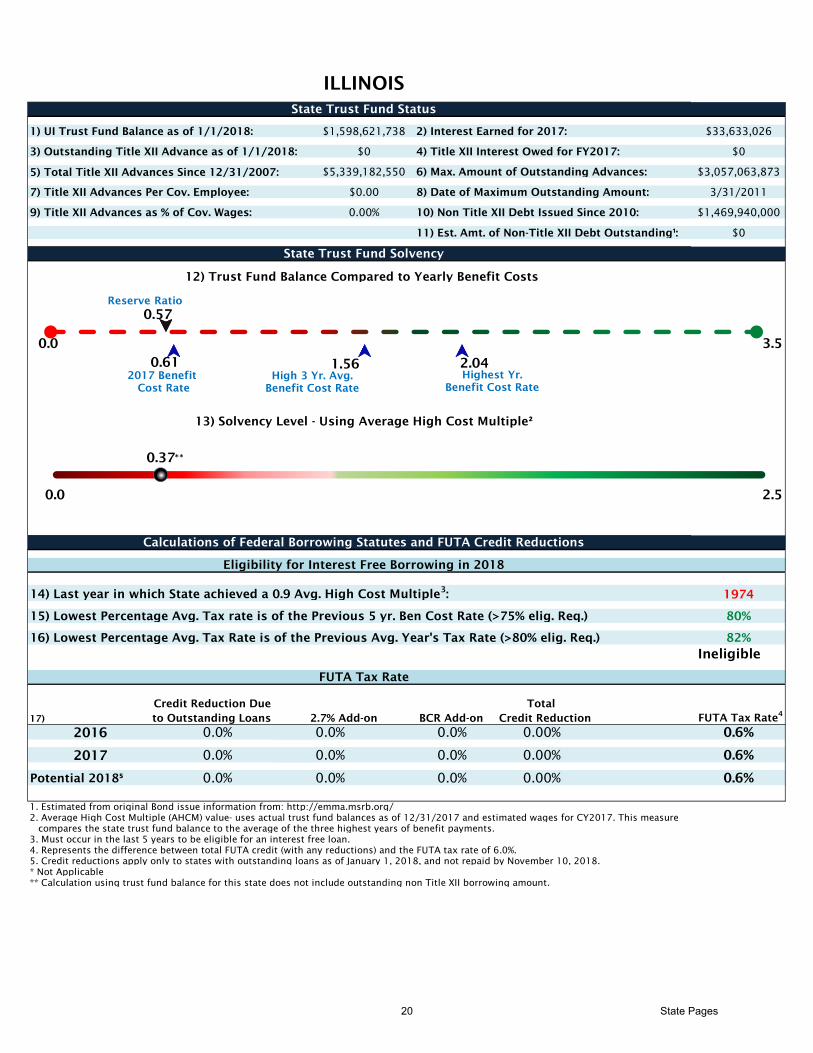
ILLINOIS
State Trust Fund Status
1) UI Trust Fund Balance as of 1/1/2018: $1,598,621,738 2) Interest Earned for 2017: $33,633,026
3) Outstanding Title XII Advance as of 1/1/2018: $0 4) Title XII Interest Owed for FY2017: $0
5) Total Title XII Advances Since 12/31/2007: $5,339,182,550 6) Max. Amount of Outstanding Advances: $3,057,063,873
7) Title XII Advances Per Cov. Employee: $0.00 8) Date of Maximum Outstanding Amount: 3/31/2011
9) Title XII Advances as % of Cov. Wages: 0.00% 10) Non Title XII Debt Issued Since 2010: $1,469,940,000
11) Est. Amt. of Non-Title XII Debt Outstanding¹: $0
State Trust Fund Solvency
12) Trust Fund Balance Compared to Yearly Benefit Costs
0.0 3.5
13) Solvency Level - Using Average High Cost Multiple²
0.0 2.5
Calculations of Federal Borrowing Statutes and FUTA Credit Reductions
Eligibility for Interest Free Borrowing in 2018
14) Last year in which State achieved a 0.9 Avg. High Cost Multiple3
: 1974
15) Lowest Percentage Avg. Tax rate is of the Previous 5 yr. Ben Cost Rate (>75% elig. Req.) 80%
16) Lowest Percentage Avg. Tax Rate is of the Previous Avg. Year's Tax Rate (>80% elig. Req.) 82%
FUTA Tax Rate
Credit Reduction Due
17) to Outstanding Loans Credit Reduction FUTA Tax Rate4
2016 0.0% 0.0% 0.6%
2017 0.0% 0.0% 0.6%
Potential 2018⁵ 0.0% 0.0% 0.6%
1. Estimated from original Bond issue information from: http://emma.msrb.org/
2. Average High Cost Multiple (AHCM) value- uses actual trust fund balances as of 12/31/2017 and estimated wages for CY2017. This measure
compares the state trust fund balance to the average of the three highest years of benefit payments.
3. Must occur in the last 5 years to be eligible for an interest free loan.
4. Represents the difference between total FUTA credit (with any reductions) and the FUTA tax rate of 6.0%.
5. Credit reductions apply only to states with outstanding loans as of January 1, 2018, and not repaid by November 10, 2018.
* Not Applicable
** Calculation using trust fund balance for this state does not include outstanding non Title XII borrowing amount.
Ineligible
2.7% Add-on BCR Add-on
Total
0.0% 0.00%
0.0% 0.00%
0.0% 0.00%
0.37**
0.57
0.61 1.56 2.04
Reserve Ratio
High 3 Yr. Avg.
Benefit Cost Rate
2017 Benefit
Cost Rate
Highest Yr.
Benefit Cost Rate
20 State Pages
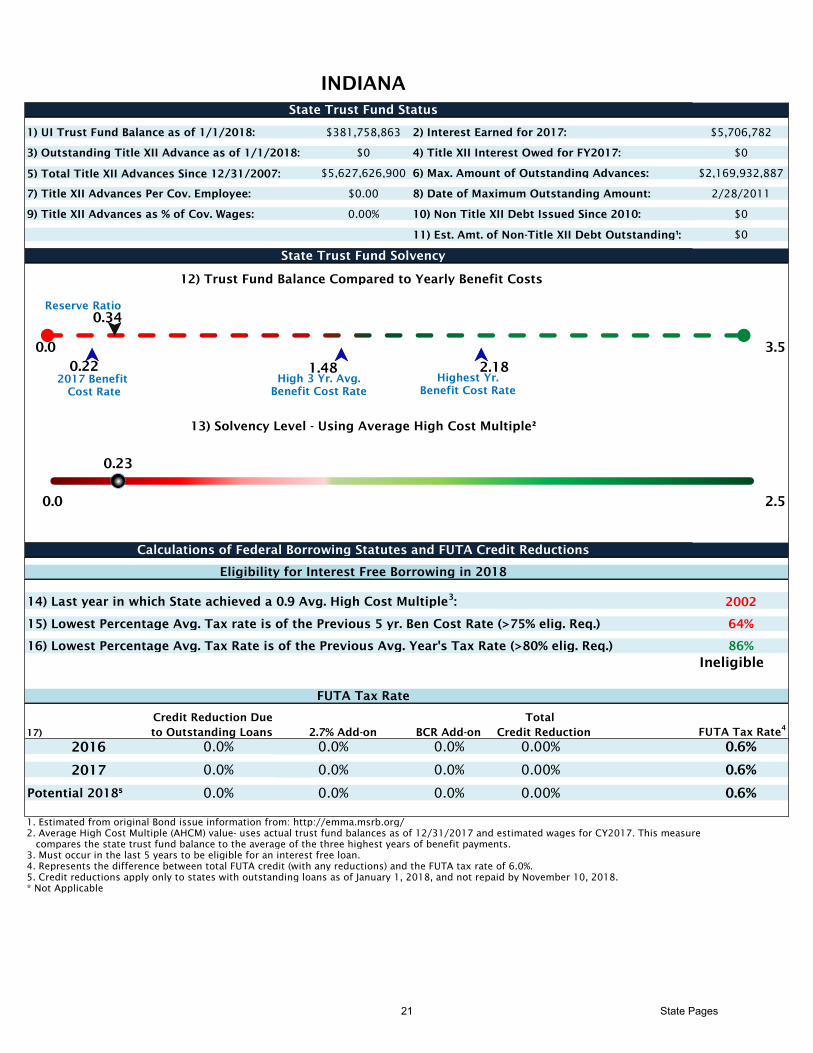
INDIANA
State Trust Fund Status
1) UI Trust Fund Balance as of 1/1/2018: $381,758,863 2) Interest Earned for 2017: $5,706,782
3) Outstanding Title XII Advance as of 1/1/2018: $0 4) Title XII Interest Owed for FY2017: $0
5) Total Title XII Advances Since 12/31/2007: $5,627,626,900 6) Max. Amount of Outstanding Advances: $2,169,932,887
7) Title XII Advances Per Cov. Employee: $0.00 8) Date of Maximum Outstanding Amount: 2/28/2011
9) Title XII Advances as % of Cov. Wages: 0.00% 10) Non Title XII Debt Issued Since 2010: $0
11) Est. Amt. of Non-Title XII Debt Outstanding¹: $0
State Trust Fund Solvency
12) Trust Fund Balance Compared to Yearly Benefit Costs
0.0 3.5
13) Solvency Level - Using Average High Cost Multiple²
0.0 2.5
Calculations of Federal Borrowing Statutes and FUTA Credit Reductions
Eligibility for Interest Free Borrowing in 2018
14) Last year in which State achieved a 0.9 Avg. High Cost Multiple3
: 2002
15) Lowest Percentage Avg. Tax rate is of the Previous 5 yr. Ben Cost Rate (>75% elig. Req.) 64%
16) Lowest Percentage Avg. Tax Rate is of the Previous Avg. Year's Tax Rate (>80% elig. Req.) 86%
FUTA Tax Rate
Credit Reduction Due
17) to Outstanding Loans Credit Reduction FUTA Tax Rate4
2016 0.0% 0.0% 0.6%
2017 0.0% 0.0% 0.6%
Potential 2018⁵ 0.0% 0.0% 0.6%
1. Estimated from original Bond issue information from: http://emma.msrb.org/
2. Average High Cost Multiple (AHCM) value- uses actual trust fund balances as of 12/31/2017 and estimated wages for CY2017. This measure
compares the state trust fund balance to the average of the three highest years of benefit payments.
3. Must occur in the last 5 years to be eligible for an interest free loan.
4. Represents the difference between total FUTA credit (with any reductions) and the FUTA tax rate of 6.0%.
5. Credit reductions apply only to states with outstanding loans as of January 1, 2018, and not repaid by November 10, 2018.
* Not Applicable
Ineligible
2.7% Add-on BCR Add-on
Total
0.0% 0.00%
0.0% 0.00%
0.0% 0.00%
0.23
0.34
0.22 1.48 2.18
Reserve Ratio
High 3 Yr. Avg.
Benefit Cost Rate
2017 Benefit
Cost Rate
Highest Yr.
Benefit Cost Rate
21 State Pages
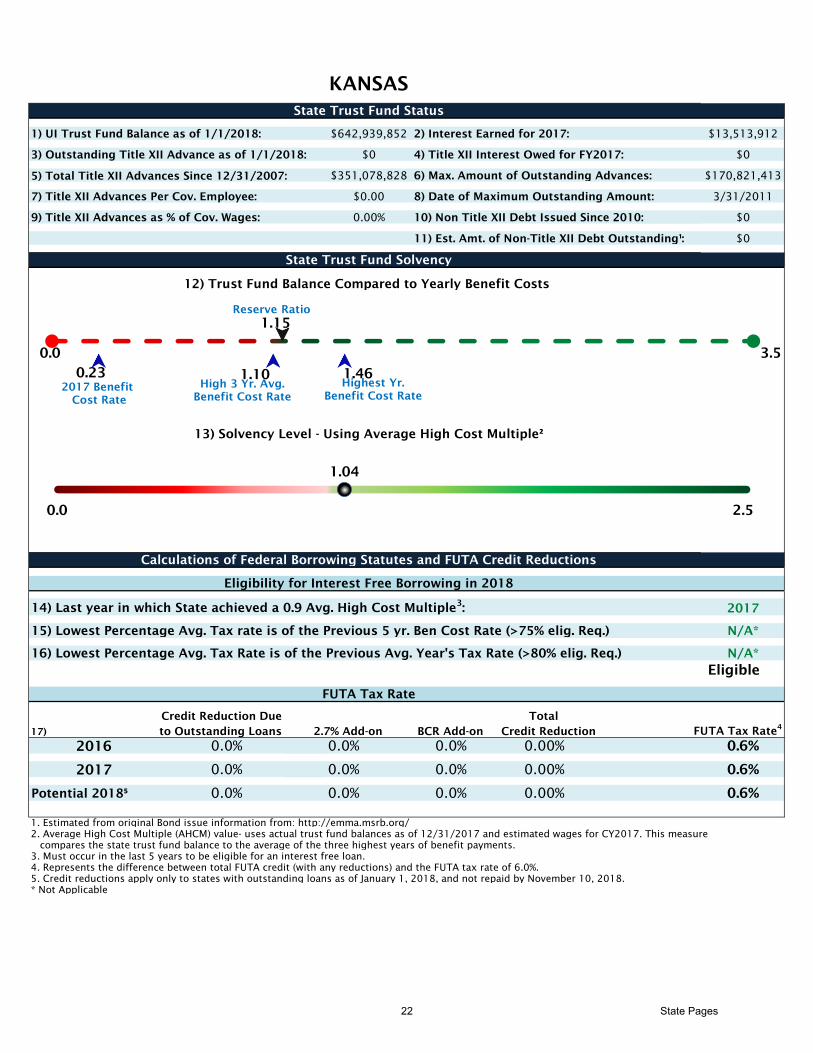
KANSAS
State Trust Fund Status
1) UI Trust Fund Balance as of 1/1/2018: $642,939,852 2) Interest Earned for 2017: $13,513,912
3) Outstanding Title XII Advance as of 1/1/2018: $0 4) Title XII Interest Owed for FY2017: $0
5) Total Title XII Advances Since 12/31/2007: $351,078,828 6) Max. Amount of Outstanding Advances: $170,821,413
7) Title XII Advances Per Cov. Employee: $0.00 8) Date of Maximum Outstanding Amount: 3/31/2011
9) Title XII Advances as % of Cov. Wages: 0.00% 10) Non Title XII Debt Issued Since 2010: $0
11) Est. Amt. of Non-Title XII Debt Outstanding¹: $0
State Trust Fund Solvency
12) Trust Fund Balance Compared to Yearly Benefit Costs
0.0 3.5
13) Solvency Level - Using Average High Cost Multiple²
0.0 2.5
Calculations of Federal Borrowing Statutes and FUTA Credit Reductions
Eligibility for Interest Free Borrowing in 2018
14) Last year in which State achieved a 0.9 Avg. High Cost Multiple3
: 2017
15) Lowest Percentage Avg. Tax rate is of the Previous 5 yr. Ben Cost Rate (>75% elig. Req.) N/A*
16) Lowest Percentage Avg. Tax Rate is of the Previous Avg. Year's Tax Rate (>80% elig. Req.) N/A*
FUTA Tax Rate
Credit Reduction Due
17) to Outstanding Loans Credit Reduction FUTA Tax Rate4
2016 0.0% 0.0% 0.6%
2017 0.0% 0.0% 0.6%
Potential 2018⁵ 0.0% 0.0% 0.6%
1. Estimated from original Bond issue information from: http://emma.msrb.org/
2. Average High Cost Multiple (AHCM) value- uses actual trust fund balances as of 12/31/2017 and estimated wages for CY2017. This measure
compares the state trust fund balance to the average of the three highest years of benefit payments.
3. Must occur in the last 5 years to be eligible for an interest free loan.
4. Represents the difference between total FUTA credit (with any reductions) and the FUTA tax rate of 6.0%.
5. Credit reductions apply only to states with outstanding loans as of January 1, 2018, and not repaid by November 10, 2018.
* Not Applicable
Eligible
2.7% Add-on BCR Add-on
Total
0.0% 0.00%
0.0% 0.00%
0.0% 0.00%
1.04
1.15
0.23 1.10 1.46
Reserve Ratio
High 3 Yr. Avg.
Benefit Cost Rate
2017 Benefit
Cost Rate
Highest Yr.
Benefit Cost Rate
22 State Pages

KENTUCKY
State Trust Fund Status
1) UI Trust Fund Balance as of 1/1/2018: $433,218,118 2) Interest Earned for 2017: $7,891,787
3) Outstanding Title XII Advance as of 1/1/2018: $0 4) Title XII Interest Owed for FY2017: $0
5) Total Title XII Advances Since 12/31/2007: $2,060,398,041 6) Max. Amount of Outstanding Advances: $961,179,155
7) Title XII Advances Per Cov. Employee: $0.00 8) Date of Maximum Outstanding Amount: 3/31/2012
9) Title XII Advances as % of Cov. Wages: 0.00% 10) Non Title XII Debt Issued Since 2010: $0
11) Est. Amt. of Non-Title XII Debt Outstanding¹: $0
State Trust Fund Solvency
12) Trust Fund Balance Compared to Yearly Benefit Costs
0.0 3.5
13) Solvency Level - Using Average High Cost Multiple²
0.0 2.5
Calculations of Federal Borrowing Statutes and FUTA Credit Reductions
Eligibility for Interest Free Borrowing in 2018
14) Last year in which State achieved a 0.9 Avg. High Cost Multiple3
: 1974
15) Lowest Percentage Avg. Tax rate is of the Previous 5 yr. Ben Cost Rate (>75% elig. Req.) 71%
16) Lowest Percentage Avg. Tax Rate is of the Previous Avg. Year's Tax Rate (>80% elig. Req.) 85%
FUTA Tax Rate
Credit Reduction Due
17) to Outstanding Loans Credit Reduction FUTA Tax Rate4
2016 0.0% 0.0% 0.6%
2017 0.0% 0.0% 0.6%
Potential 2018⁵ 0.0% 0.0% 0.6%
1. Estimated from original Bond issue information from: http://emma.msrb.org/
2. Average High Cost Multiple (AHCM) value- uses actual trust fund balances as of 12/31/2017 and estimated wages for CY2017. This measure
compares the state trust fund balance to the average of the three highest years of benefit payments.
3. Must occur in the last 5 years to be eligible for an interest free loan.
4. Represents the difference between total FUTA credit (with any reductions) and the FUTA tax rate of 6.0%.
5. Credit reductions apply only to states with outstanding loans as of January 1, 2018, and not repaid by November 10, 2018.
* Not Applicable
Ineligible
2.7% Add-on BCR Add-on
Total
0.0% 0.00%
0.0% 0.00%
0.0% 0.00%
0.42
0.64
0.41 1.54 2.13
Reserve Ratio
High 3 Yr. Avg.
Benefit Cost Rate
2017 Benefit
Cost Rate
Highest Yr.
Benefit Cost Rate
23 State Pages
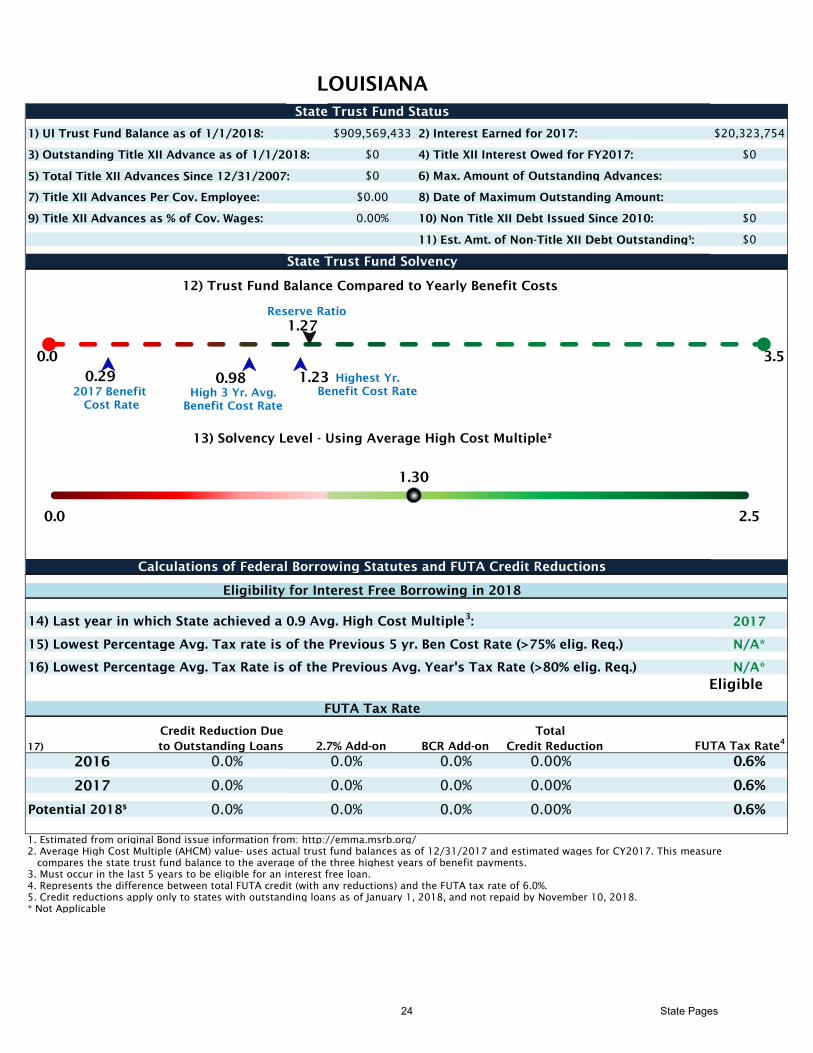
LOUISIANA
State Trust Fund Status
1) UI Trust Fund Balance as of 1/1/2018: $909,569,433 2) Interest Earned for 2017: $20,323,754
3) Outstanding Title XII Advance as of 1/1/2018: $0 4) Title XII Interest Owed for FY2017: $0
5) Total Title XII Advances Since 12/31/2007: $0 6) Max. Amount of Outstanding Advances:
7) Title XII Advances Per Cov. Employee: $0.00 8) Date of Maximum Outstanding Amount:
9) Title XII Advances as % of Cov. Wages: 0.00% 10) Non Title XII Debt Issued Since 2010: $0
11) Est. Amt. of Non-Title XII Debt Outstanding¹: $0
State Trust Fund Solvency
12) Trust Fund Balance Compared to Yearly Benefit Costs
0.0 3.5
13) Solvency Level - Using Average High Cost Multiple²
0.0 2.5
Calculations of Federal Borrowing Statutes and FUTA Credit Reductions
Eligibility for Interest Free Borrowing in 2018
14) Last year in which State achieved a 0.9 Avg. High Cost Multiple3
: 2017
15) Lowest Percentage Avg. Tax rate is of the Previous 5 yr. Ben Cost Rate (>75% elig. Req.) N/A*
16) Lowest Percentage Avg. Tax Rate is of the Previous Avg. Year's Tax Rate (>80% elig. Req.) N/A*
FUTA Tax Rate
Credit Reduction Due
17) to Outstanding Loans Credit Reduction FUTA Tax Rate4
2016 0.0% 0.0% 0.6%
2017 0.0% 0.0% 0.6%
Potential 2018⁵ 0.0% 0.0% 0.6%
1. Estimated from original Bond issue information from: http://emma.msrb.org/
2. Average High Cost Multiple (AHCM) value- uses actual trust fund balances as of 12/31/2017 and estimated wages for CY2017. This measure
compares the state trust fund balance to the average of the three highest years of benefit payments.
3. Must occur in the last 5 years to be eligible for an interest free loan.
4. Represents the difference between total FUTA credit (with any reductions) and the FUTA tax rate of 6.0%.
5. Credit reductions apply only to states with outstanding loans as of January 1, 2018, and not repaid by November 10, 2018.
* Not Applicable
Eligible
2.7% Add-on BCR Add-on
Total
0.0% 0.00%
0.0% 0.00%
0.0% 0.00%
1.30
1.27
0.29 0.98 1.23
Reserve Ratio
High 3 Yr. Avg.
Benefit Cost Rate
2017 Benefit
Cost Rate
Highest Yr.
Benefit Cost Rate
24 State Pages

MASSACHUSETTS
State Trust Fund Status
1) UI Trust Fund Balance as of 1/1/2018: $998,795,673 2) Interest Earned for 2017: $22,642,030
3) Outstanding Title XII Advance as of 1/1/2018: $0 4) Title XII Interest Owed for FY2017: $0
5) Total Title XII Advances Since 12/31/2007: $1,454,827,895 6) Max. Amount of Outstanding Advances: $387,313,005
7) Title XII Advances Per Cov. Employee: $0.00 8) Date of Maximum Outstanding Amount: 3/31/2010
9) Title XII Advances as % of Cov. Wages: 0.00% 10) Non Title XII Debt Issued Since 2010: $0
11) Est. Amt. of Non-Title XII Debt Outstanding¹: $0
State Trust Fund Solvency
12) Trust Fund Balance Compared to Yearly Benefit Costs
0.0 3.5
13) Solvency Level - Using Average High Cost Multiple²
0.0 2.5
Calculations of Federal Borrowing Statutes and FUTA Credit Reductions
Eligibility for Interest Free Borrowing in 2018
14) Last year in which State achieved a 0.9 Avg. High Cost Multiple3
: 2000
15) Lowest Percentage Avg. Tax rate is of the Previous 5 yr. Ben Cost Rate (>75% elig. Req.) 71%
16) Lowest Percentage Avg. Tax Rate is of the Previous Avg. Year's Tax Rate (>80% elig. Req.) 72%
FUTA Tax Rate
Credit Reduction Due
17) to Outstanding Loans Credit Reduction FUTA Tax Rate4
2016 0.0% 0.0% 0.6%
2017 0.0% 0.0% 0.6%
Potential 2018⁵ 0.0% 0.0% 0.6%
1. Estimated from original Bond issue information from: http://emma.msrb.org/
2. Average High Cost Multiple (AHCM) value- uses actual trust fund balances as of 12/31/2017 and estimated wages for CY2017. This measure
compares the state trust fund balance to the average of the three highest years of benefit payments.
3. Must occur in the last 5 years to be eligible for an interest free loan.
4. Represents the difference between total FUTA credit (with any reductions) and the FUTA tax rate of 6.0%.
5. Credit reductions apply only to states with outstanding loans as of January 1, 2018, and not repaid by November 10, 2018.
* Not Applicable
Ineligible
2.7% Add-on BCR Add-on
Total
0.0% 0.00%
0.0% 0.00%
0.0% 0.00%
0.26
0.50
0.63 1.88 2.04
Reserve Ratio
High 3 Yr. Avg.
Benefit Cost Rate
2017 Benefit
Cost Rate
Highest Yr.
Benefit Cost Rate
25 State Pages

MARYLAND
State Trust Fund Status
1) UI Trust Fund Balance as of 1/1/2018: $1,116,818,866 2) Interest Earned for 2017: $24,990,283
3) Outstanding Title XII Advance as of 1/1/2018: $0 4) Title XII Interest Owed for FY2017: $0
5) Total Title XII Advances Since 12/31/2007: $133,840,765 6) Max. Amount of Outstanding Advances: $133,840,765
7) Title XII Advances Per Cov. Employee: $0.00 8) Date of Maximum Outstanding Amount: 3/31/2010
9) Title XII Advances as % of Cov. Wages: 0.00% 10) Non Title XII Debt Issued Since 2010: $0
11) Est. Amt. of Non-Title XII Debt Outstanding¹: $0
State Trust Fund Solvency
12) Trust Fund Balance Compared to Yearly Benefit Costs
0.0 3.5
13) Solvency Level - Using Average High Cost Multiple²
0.0 2.5
Calculations of Federal Borrowing Statutes and FUTA Credit Reductions
Eligibility for Interest Free Borrowing in 2018
14) Last year in which State achieved a 0.9 Avg. High Cost Multiple3
: 2000
15) Lowest Percentage Avg. Tax rate is of the Previous 5 yr. Ben Cost Rate (>75% elig. Req.) 66%
16) Lowest Percentage Avg. Tax Rate is of the Previous Avg. Year's Tax Rate (>80% elig. Req.) 71%
FUTA Tax Rate
Credit Reduction Due
17) to Outstanding Loans Credit Reduction FUTA Tax Rate4
2016 0.0% 0.0% 0.6%
2017 0.0% 0.0% 0.6%
Potential 2018⁵ 0.0% 0.0% 0.6%
1. Estimated from original Bond issue information from: http://emma.msrb.org/
2. Average High Cost Multiple (AHCM) value- uses actual trust fund balances as of 12/31/2017 and estimated wages for CY2017. This measure
compares the state trust fund balance to the average of the three highest years of benefit payments.
3. Must occur in the last 5 years to be eligible for an interest free loan.
4. Represents the difference between total FUTA credit (with any reductions) and the FUTA tax rate of 6.0%.
5. Credit reductions apply only to states with outstanding loans as of January 1, 2018, and not repaid by November 10, 2018.
* Not Applicable
Ineligible
2.7% Add-on BCR Add-on
Total
0.0% 0.00%
0.0% 0.00%
0.0% 0.00%
0.80
0.97
0.40 1.20 1.27
Reserve Ratio
High 3 Yr. Avg.
Benefit Cost Rate
2017 Benefit
Cost Rate
Highest Yr.
Benefit Cost Rate
26 State Pages

MAINE
State Trust Fund Status
1) UI Trust Fund Balance as of 1/1/2018: $426,024,306 2) Interest Earned for 2017: $9,082,573
3) Outstanding Title XII Advance as of 1/1/2018: $0 4) Title XII Interest Owed for FY2017: $0
5) Total Title XII Advances Since 12/31/2007: $0 6) Max. Amount of Outstanding Advances:
7) Title XII Advances Per Cov. Employee: $0.00 8) Date of Maximum Outstanding Amount:
9) Title XII Advances as % of Cov. Wages: 0.00% 10) Non Title XII Debt Issued Since 2010: $0
11) Est. Amt. of Non-Title XII Debt Outstanding¹: $0
State Trust Fund Solvency
12) Trust Fund Balance Compared to Yearly Benefit Costs
0.0 3.5
13) Solvency Level - Using Average High Cost Multiple²
0.0 2.5
Calculations of Federal Borrowing Statutes and FUTA Credit Reductions
Eligibility for Interest Free Borrowing in 2018
14) Last year in which State achieved a 0.9 Avg. High Cost Multiple3
: 2017
15) Lowest Percentage Avg. Tax rate is of the Previous 5 yr. Ben Cost Rate (>75% elig. Req.) N/A*
16) Lowest Percentage Avg. Tax Rate is of the Previous Avg. Year's Tax Rate (>80% elig. Req.) N/A*
FUTA Tax Rate
Credit Reduction Due
17) to Outstanding Loans Credit Reduction FUTA Tax Rate4
2016 0.0% 0.0% 0.6%
2017 0.0% 0.0% 0.6%
Potential 2018⁵ 0.0% 0.0% 0.6%
1. Estimated from original Bond issue information from: http://emma.msrb.org/
2. Average High Cost Multiple (AHCM) value- uses actual trust fund balances as of 12/31/2017 and estimated wages for CY2017. This measure
compares the state trust fund balance to the average of the three highest years of benefit payments.
3. Must occur in the last 5 years to be eligible for an interest free loan.
4. Represents the difference between total FUTA credit (with any reductions) and the FUTA tax rate of 6.0%.
5. Credit reductions apply only to states with outstanding loans as of January 1, 2018, and not repaid by November 10, 2018.
* Not Applicable
Eligible
2.7% Add-on BCR Add-on
Total
0.0% 0.00%
0.0% 0.00%
0.0% 0.00%
1.18
2.25
0.44 1.90 2.34
Reserve Ratio
High 3 Yr. Avg.
Benefit Cost Rate
2017 Benefit
Cost Rate
Highest Yr.
Benefit Cost Rate
27 State Pages

MICHIGANState Trust Fund Status
1) UI Trust Fund Balance as of 1/1/2018: $3,646,237,283 2) Interest Earned for 2017: $77,461,297
3) Outstanding Title XII Advance as of 1/1/2018: $0 4) Title XII Interest Owed for FY2017: $0
5) Total Title XII Advances Since 12/31/2007: $6,305,496,298 6) Max. Amount of Outstanding Advances: $3,991,178,658
7) Title XII Advances Per Cov. Employee: $0.00 8) Date of Maximum Outstanding Amount: 2/28/2011
9) Title XII Advances as % of Cov. Wages: 0.00% 10) Non Title XII Debt Issued Since 2010: $2,917,135,000
11) Est. Amt. of Non-Title XII Debt Outstanding¹: $1,955,600,000
State Trust Fund Solvency
12) Trust Fund Balance Compared to Yearly Benefit Costs
0.0 3.5
13) Solvency Level - Using Average High Cost Multiple²
0.0 2.5
Calculations of Federal Borrowing Statutes and FUTA Credit Reductions
Eligibility for Interest Free Borrowing in 2018
14) Last year in which State achieved a 0.9 Avg. High Cost Multiple3: 2017
15) Lowest Percentage Avg. Tax rate is of the Previous 5 yr. Ben Cost Rate (>75% elig. Req.) N/A*
16) Lowest Percentage Avg. Tax Rate is of the Previous Avg. Year's Tax Rate (>80% elig. Req.) N/A*
FUTA Tax Rate
Credit Reduction Due17) to Outstanding Loans Credit Reduction FUTA Tax Rate4
2016 0.0% 0.0% 0.6%
2017 0.0% 0.0% 0.6%
Potential 2018⁵ 0.0% 0.0% 0.6%
1. Estimated from original Bond issue information from: http://emma.msrb.org/2. Average High Cost Multiple (AHCM) value- uses actual trust fund balances as of 12/31/2017 and estimated wages for CY2017. This measure compares the state trust fund balance to the average of the three highest years of benefit payments.3. Must occur in the last 5 years to be eligible for an interest free loan.4. Represents the difference between total FUTA credit (with any reductions) and the FUTA tax rate of 6.0%.5. Credit reductions apply only to states with outstanding loans as of January 1, 2018, and not repaid by November 10, 2018.* Not Applicable ** Calculation using trust fund balance for this state does not include outstanding non Title XII borrowing amount.
Eligible
2.7% Add-on BCR Add-onTotal
0.0% 0.00%
0.0% 0.00%
0.0% 0.00%
0.92
2.00
0.44 2.17 2.96
Reserve Ratio**
High 3 Yr. Avg.Benefit Cost Rate
2017 BenefitCost Rate
Highest Yr. Benefit Cost Rate
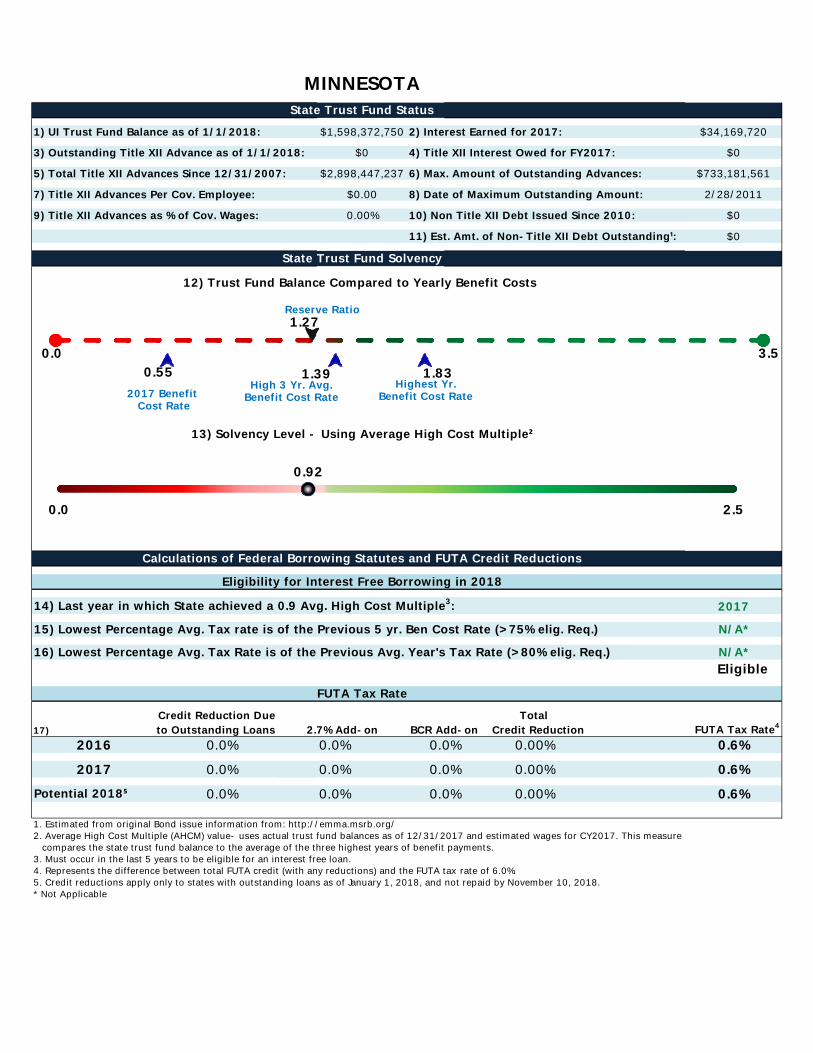
MINNESOTAState Trust Fund Status
1) UI Trust Fund Balance as of 1/1/2018: $1,598,372,750 2) Interest Earned for 2017: $34,169,720
3) Outstanding Title XII Advance as of 1/1/2018: $0 4) Title XII Interest Owed for FY2017: $0
5) Total Title XII Advances Since 12/31/2007: $2,898,447,237 6) Max. Amount of Outstanding Advances: $733,181,561
7) Title XII Advances Per Cov. Employee: $0.00 8) Date of Maximum Outstanding Amount: 2/28/2011
9) Title XII Advances as % of Cov. Wages: 0.00% 10) Non Title XII Debt Issued Since 2010: $0
11) Est. Amt. of Non-Title XII Debt Outstanding¹: $0
State Trust Fund Solvency
12) Trust Fund Balance Compared to Yearly Benefit Costs
0.0 3.5
13) Solvency Level - Using Average High Cost Multiple²
0.0 2.5
Calculations of Federal Borrowing Statutes and FUTA Credit Reductions
Eligibility for Interest Free Borrowing in 2018
14) Last year in which State achieved a 0.9 Avg. High Cost Multiple3: 2017
15) Lowest Percentage Avg. Tax rate is of the Previous 5 yr. Ben Cost Rate (>75% elig. Req.) N/A*
16) Lowest Percentage Avg. Tax Rate is of the Previous Avg. Year's Tax Rate (>80% elig. Req.) N/A*
FUTA Tax Rate
Credit Reduction Due17) to Outstanding Loans Credit Reduction FUTA Tax Rate4
2016 0.0% 0.0% 0.6%
2017 0.0% 0.0% 0.6%
Potential 2018⁵ 0.0% 0.0% 0.6%
1. Estimated from original Bond issue information from: http://emma.msrb.org/2. Average High Cost Multiple (AHCM) value- uses actual trust fund balances as of 12/31/2017 and estimated wages for CY2017. This measure compares the state trust fund balance to the average of the three highest years of benefit payments.3. Must occur in the last 5 years to be eligible for an interest free loan.4. Represents the difference between total FUTA credit (with any reductions) and the FUTA tax rate of 6.0%.5. Credit reductions apply only to states with outstanding loans as of January 1, 2018, and not repaid by November 10, 2018.* Not Applicable
Eligible
2.7% Add-on BCR Add-onTotal
0.0% 0.00%
0.0% 0.00%
0.0% 0.00%
0.92
1.27
0.55 1.39 1.83
Reserve Ratio
High 3 Yr. Avg.Benefit Cost Rate2017 Benefit
Cost Rate
Highest Yr. Benefit Cost Rate

MISSOURIState Trust Fund Status
1) UI Trust Fund Balance as of 1/1/2018: $826,486,941 2) Interest Earned for 2017: $17,143,952
3) Outstanding Title XII Advance as of 1/1/2018: $0 4) Title XII Interest Owed for FY2017: $0
5) Total Title XII Advances Since 12/31/2007: $1,123,115,129 6) Max. Amount of Outstanding Advances: $883,029,105
7) Title XII Advances Per Cov. Employee: $0.00 8) Date of Maximum Outstanding Amount: 3/31/2011
9) Title XII Advances as % of Cov. Wages: 0.00% 10) Non Title XII Debt Issued Since 2010: $0
11) Est. Amt. of Non-Title XII Debt Outstanding¹: $0
State Trust Fund Solvency
12) Trust Fund Balance Compared to Yearly Benefit Costs
0.0 3.5
13) Solvency Level - Using Average High Cost Multiple²
0.0 2.5
Calculations of Federal Borrowing Statutes and FUTA Credit Reductions
Eligibility for Interest Free Borrowing in 2018
14) Last year in which State achieved a 0.9 Avg. High Cost Multiple3: 1979
15) Lowest Percentage Avg. Tax rate is of the Previous 5 yr. Ben Cost Rate (>75% elig. Req.) 78%
16) Lowest Percentage Avg. Tax Rate is of the Previous Avg. Year's Tax Rate (>80% elig. Req.) 74%
FUTA Tax Rate
Credit Reduction Due17) to Outstanding Loans Credit Reduction FUTA Tax Rate4
2016 0.0% 0.0% 0.6%
2017 0.0% 0.0% 0.6%
Potential 2018⁵ 0.0% 0.0% 0.6%
1. Estimated from original Bond issue information from: http://emma.msrb.org/2. Average High Cost Multiple (AHCM) value- uses actual trust fund balances as of 12/31/2017 and estimated wages for CY2017. This measure compares the state trust fund balance to the average of the three highest years of benefit payments.3. Must occur in the last 5 years to be eligible for an interest free loan.4. Represents the difference between total FUTA credit (with any reductions) and the FUTA tax rate of 6.0%.5. Credit reductions apply only to states with outstanding loans as of January 1, 2018, and not repaid by November 10, 2018.* Not Applicable
Ineligible
2.7% Add-on BCR Add-onTotal
0.0% 0.00%
0.0% 0.00%
0.0% 0.00%
0.71
0.80
0.29 1.13 1.38
Reserve Ratio
High 3 Yr. Avg.Benefit Cost Rate
2017 BenefitCost Rate
Highest Yr. Benefit Cost Rate
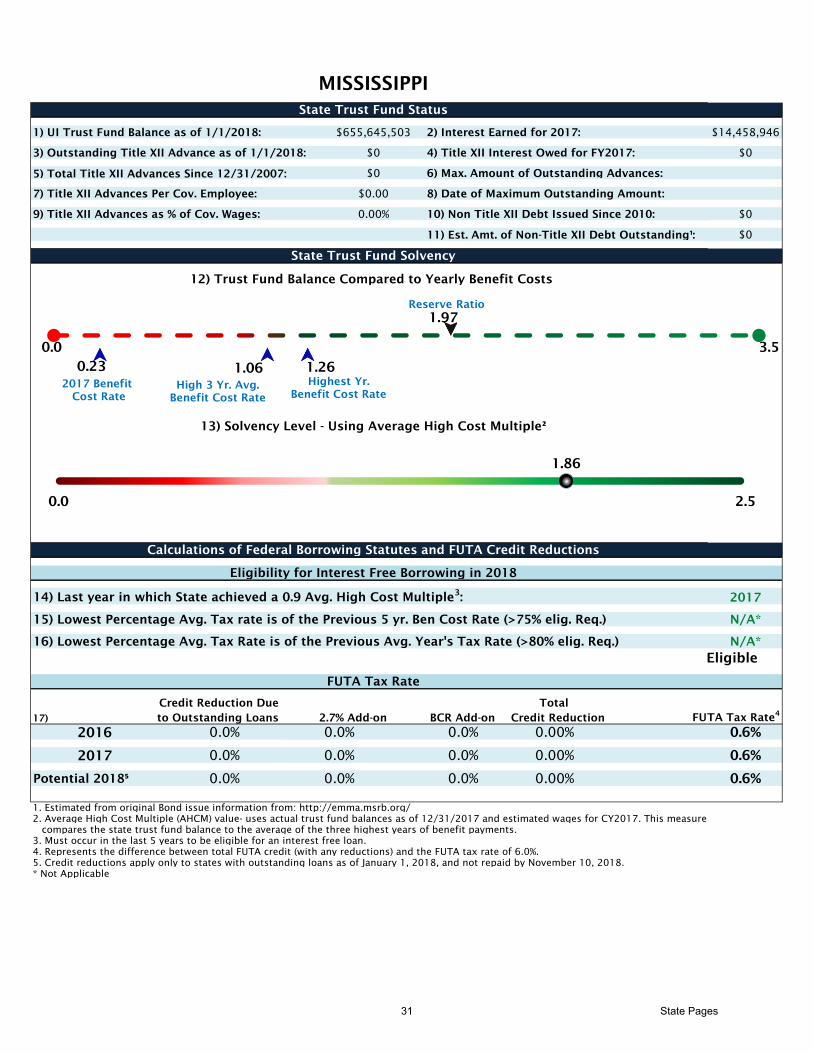
MISSISSIPPI
State Trust Fund Status
1) UI Trust Fund Balance as of 1/1/2018: $655,645,503 2) Interest Earned for 2017: $14,458,946
3) Outstanding Title XII Advance as of 1/1/2018: $0 4) Title XII Interest Owed for FY2017: $0
5) Total Title XII Advances Since 12/31/2007: $0 6) Max. Amount of Outstanding Advances:
7) Title XII Advances Per Cov. Employee: $0.00 8) Date of Maximum Outstanding Amount:
9) Title XII Advances as % of Cov. Wages: 0.00% 10) Non Title XII Debt Issued Since 2010: $0
11) Est. Amt. of Non-Title XII Debt Outstanding¹: $0
State Trust Fund Solvency
12) Trust Fund Balance Compared to Yearly Benefit Costs
0.0 3.5
13) Solvency Level - Using Average High Cost Multiple²
0.0 2.5
Calculations of Federal Borrowing Statutes and FUTA Credit Reductions
Eligibility for Interest Free Borrowing in 2018
14) Last year in which State achieved a 0.9 Avg. High Cost Multiple3
: 2017
15) Lowest Percentage Avg. Tax rate is of the Previous 5 yr. Ben Cost Rate (>75% elig. Req.) N/A*
16) Lowest Percentage Avg. Tax Rate is of the Previous Avg. Year's Tax Rate (>80% elig. Req.) N/A*
FUTA Tax Rate
Credit Reduction Due
17) to Outstanding Loans Credit Reduction FUTA Tax Rate4
2016 0.0% 0.0% 0.6%
2017 0.0% 0.0% 0.6%
Potential 2018⁵ 0.0% 0.0% 0.6%
1. Estimated from original Bond issue information from: http://emma.msrb.org/
2. Average High Cost Multiple (AHCM) value- uses actual trust fund balances as of 12/31/2017 and estimated wages for CY2017. This measure
compares the state trust fund balance to the average of the three highest years of benefit payments.
3. Must occur in the last 5 years to be eligible for an interest free loan.
4. Represents the difference between total FUTA credit (with any reductions) and the FUTA tax rate of 6.0%.
5. Credit reductions apply only to states with outstanding loans as of January 1, 2018, and not repaid by November 10, 2018.
* Not Applicable
Eligible
2.7% Add-on BCR Add-on
Total
0.0% 0.00%
0.0% 0.00%
0.0% 0.00%
1.86
1.97
0.23 1.06 1.26
Reserve Ratio
High 3 Yr. Avg.
Benefit Cost Rate
2017 Benefit
Cost Rate
Highest Yr.
Benefit Cost Rate
31 State Pages

MONTANA
State Trust Fund Status
1) UI Trust Fund Balance as of 1/1/2018: $314,978,838 2) Interest Earned for 2017: $6,830,314
3) Outstanding Title XII Advance as of 1/1/2018: $0 4) Title XII Interest Owed for FY2017: $0
5) Total Title XII Advances Since 12/31/2007: $0 6) Max. Amount of Outstanding Advances:
7) Title XII Advances Per Cov. Employee: $0.00 8) Date of Maximum Outstanding Amount:
9) Title XII Advances as % of Cov. Wages: 0.00% 10) Non Title XII Debt Issued Since 2010: $0
11) Est. Amt. of Non-Title XII Debt Outstanding¹: $0
State Trust Fund Solvency
12) Trust Fund Balance Compared to Yearly Benefit Costs
0.0 3.5
13) Solvency Level - Using Average High Cost Multiple²
0.0 2.5
Calculations of Federal Borrowing Statutes and FUTA Credit Reductions
Eligibility for Interest Free Borrowing in 2018
14) Last year in which State achieved a 0.9 Avg. High Cost Multiple3
: 2017
15) Lowest Percentage Avg. Tax rate is of the Previous 5 yr. Ben Cost Rate (>75% elig. Req.) N/A*
16) Lowest Percentage Avg. Tax Rate is of the Previous Avg. Year's Tax Rate (>80% elig. Req.) N/A*
FUTA Tax Rate
Credit Reduction Due
17) to Outstanding Loans Credit Reduction FUTA Tax Rate4
2016 0.0% 0.0% 0.6%
2017 0.0% 0.0% 0.6%
Potential 2018⁵ 0.0% 0.0% 0.6%
1. Estimated from original Bond issue information from: http://emma.msrb.org/
2. Average High Cost Multiple (AHCM) value- uses actual trust fund balances as of 12/31/2017 and estimated wages for CY2017. This measure
compares the state trust fund balance to the average of the three highest years of benefit payments.
3. Must occur in the last 5 years to be eligible for an interest free loan.
4. Represents the difference between total FUTA credit (with any reductions) and the FUTA tax rate of 6.0%.
5. Credit reductions apply only to states with outstanding loans as of January 1, 2018, and not repaid by November 10, 2018.
* Not Applicable
Eligible
2.7% Add-on BCR Add-on
Total
0.0% 0.00%
0.0% 0.00%
0.0% 0.00%
1.39
2.04
0.63 1.47 1.82
Reserve Ratio
High 3 Yr. Avg.
Benefit Cost Rate
2017 Benefit
Cost Rate
Highest Yr.
Benefit Cost Rate
32 State Pages

NORTH CAROLINA
State Trust Fund Status
1) UI Trust Fund Balance as of 1/1/2018: $3,172,224,039 2) Interest Earned for 2017: $63,574,873
3) Outstanding Title XII Advance as of 1/1/2018: $0 4) Title XII Interest Owed for FY2017: $0
5) Total Title XII Advances Since 12/31/2007: $7,945,266,458 6) Max. Amount of Outstanding Advances: $2,833,067,841
7) Title XII Advances Per Cov. Employee: $0.00 8) Date of Maximum Outstanding Amount: 3/31/2012
9) Title XII Advances as % of Cov. Wages: 0.00% 10) Non Title XII Debt Issued Since 2010: $0
11) Est. Amt. of Non-Title XII Debt Outstanding¹: $0
State Trust Fund Solvency
12) Trust Fund Balance Compared to Yearly Benefit Costs
0.0 3.5
13) Solvency Level - Using Average High Cost Multiple²
0.0 2.5
Calculations of Federal Borrowing Statutes and FUTA Credit Reductions
Eligibility for Interest Free Borrowing in 2018
14) Last year in which State achieved a 0.9 Avg. High Cost Multiple3
: 2017
15) Lowest Percentage Avg. Tax rate is of the Previous 5 yr. Ben Cost Rate (>75% elig. Req.) N/A*
16) Lowest Percentage Avg. Tax Rate is of the Previous Avg. Year's Tax Rate (>80% elig. Req.) N/A*
FUTA Tax Rate
Credit Reduction Due
17) to Outstanding Loans Credit Reduction FUTA Tax Rate4
2016 0.0% 0.0% 0.6%
2017 0.0% 0.0% 0.6%
Potential 2018⁵ 0.0% 0.0% 0.6%
1. Estimated from original Bond issue information from: http://emma.msrb.org/
2. Average High Cost Multiple (AHCM) value- uses actual trust fund balances as of 12/31/2017 and estimated wages for CY2017. This measure
compares the state trust fund balance to the average of the three highest years of benefit payments.
3. Must occur in the last 5 years to be eligible for an interest free loan.
4. Represents the difference between total FUTA credit (with any reductions) and the FUTA tax rate of 6.0%.
5. Credit reductions apply only to states with outstanding loans as of January 1, 2018, and not repaid by November 10, 2018.
* Not Applicable
Eligible
2.7% Add-on BCR Add-on
Total
0.0% 0.00%
0.0% 0.00%
0.0% 0.00%
1.19
1.85
0.10 1.56 2.14
Reserve Ratio
High 3 Yr. Avg.
Benefit Cost Rate
2017 Benefit
Cost Rate
Highest Yr.
Benefit Cost Rate
33 State Pages

NORTH DAKOTA
State Trust Fund Status
1) UI Trust Fund Balance as of 1/1/2018: $145,798,828 2) Interest Earned for 2017: $2,181,813
3) Outstanding Title XII Advance as of 1/1/2018: $0 4) Title XII Interest Owed for FY2017: $0
5) Total Title XII Advances Since 12/31/2007: $0 6) Max. Amount of Outstanding Advances:
7) Title XII Advances Per Cov. Employee: $0.00 8) Date of Maximum Outstanding Amount:
9) Title XII Advances as % of Cov. Wages: 0.00% 10) Non Title XII Debt Issued Since 2010: $0
11) Est. Amt. of Non-Title XII Debt Outstanding¹: $0
State Trust Fund Solvency
12) Trust Fund Balance Compared to Yearly Benefit Costs
0.0 3.5
13) Solvency Level - Using Average High Cost Multiple²
0.0 2.5
Calculations of Federal Borrowing Statutes and FUTA Credit Reductions
Eligibility for Interest Free Borrowing in 2018
14) Last year in which State achieved a 0.9 Avg. High Cost Multiple3
: 2014
15) Lowest Percentage Avg. Tax rate is of the Previous 5 yr. Ben Cost Rate (>75% elig. Req.) 96%
16) Lowest Percentage Avg. Tax Rate is of the Previous Avg. Year's Tax Rate (>80% elig. Req.) 93%
FUTA Tax Rate
Credit Reduction Due
17) to Outstanding Loans Credit Reduction FUTA Tax Rate4
2016 0.0% 0.0% 0.6%
2017 0.0% 0.0% 0.6%
Potential 2018⁵ 0.0% 0.0% 0.6%
1. Estimated from original Bond issue information from: http://emma.msrb.org/
2. Average High Cost Multiple (AHCM) value- uses actual trust fund balances as of 12/31/2017 and estimated wages for CY2017. This measure
compares the state trust fund balance to the average of the three highest years of benefit payments.
3. Must occur in the last 5 years to be eligible for an interest free loan.
4. Represents the difference between total FUTA credit (with any reductions) and the FUTA tax rate of 6.0%.
5. Credit reductions apply only to states with outstanding loans as of January 1, 2018, and not repaid by November 10, 2018.
* Not Applicable
Eligible
2.7% Add-on BCR Add-on
Total
0.0% 0.00%
0.0% 0.00%
0.0% 0.00%
0.85
0.93
0.751.09 1.27
Reserve Ratio
High 3 Yr. Avg.
Benefit Cost Rate
2017 Benefit
Cost RateHighest Yr.
Benefit Cost Rate
34 State Pages

NEBRASKA
State Trust Fund Status
1) UI Trust Fund Balance as of 1/1/2018: $425,098,270 2) Interest Earned for 2017: $9,449,081
3) Outstanding Title XII Advance as of 1/1/2018: $0 4) Title XII Interest Owed for FY2017: $0
5) Total Title XII Advances Since 12/31/2007: $0 6) Max. Amount of Outstanding Advances:
7) Title XII Advances Per Cov. Employee: $0.00 8) Date of Maximum Outstanding Amount:
9) Title XII Advances as % of Cov. Wages: 0.00% 10) Non Title XII Debt Issued Since 2010: $0
11) Est. Amt. of Non-Title XII Debt Outstanding¹: $0
State Trust Fund Solvency
12) Trust Fund Balance Compared to Yearly Benefit Costs
0.0 3.5
13) Solvency Level - Using Average High Cost Multiple²
0.0 2.5
Calculations of Federal Borrowing Statutes and FUTA Credit Reductions
Eligibility for Interest Free Borrowing in 2018
14) Last year in which State achieved a 0.9 Avg. High Cost Multiple3
: 2017
15) Lowest Percentage Avg. Tax rate is of the Previous 5 yr. Ben Cost Rate (>75% elig. Req.) N/A*
16) Lowest Percentage Avg. Tax Rate is of the Previous Avg. Year's Tax Rate (>80% elig. Req.) N/A*
FUTA Tax Rate
Credit Reduction Due
17) to Outstanding Loans Credit Reduction FUTA Tax Rate4
2016 0.0% 0.0% 0.6%
2017 0.0% 0.0% 0.6%
Potential 2018⁵ 0.0% 0.0% 0.6%
1. Estimated from original Bond issue information from: http://emma.msrb.org/
2. Average High Cost Multiple (AHCM) value- uses actual trust fund balances as of 12/31/2017 and estimated wages for CY2017. This measure
compares the state trust fund balance to the average of the three highest years of benefit payments.
3. Must occur in the last 5 years to be eligible for an interest free loan.
4. Represents the difference between total FUTA credit (with any reductions) and the FUTA tax rate of 6.0%.
5. Credit reductions apply only to states with outstanding loans as of January 1, 2018, and not repaid by November 10, 2018.
* Not Applicable
Eligible
2.7% Add-on BCR Add-on
Total
0.0% 0.00%
0.0% 0.00%
0.0% 0.00%
1.70
1.28
0.22 0.75 0.85
Reserve Ratio
High 3 Yr. Avg.
Benefit Cost Rate
2017 Benefit
Cost Rate
Highest Yr.
Benefit Cost Rate
35 State Pages
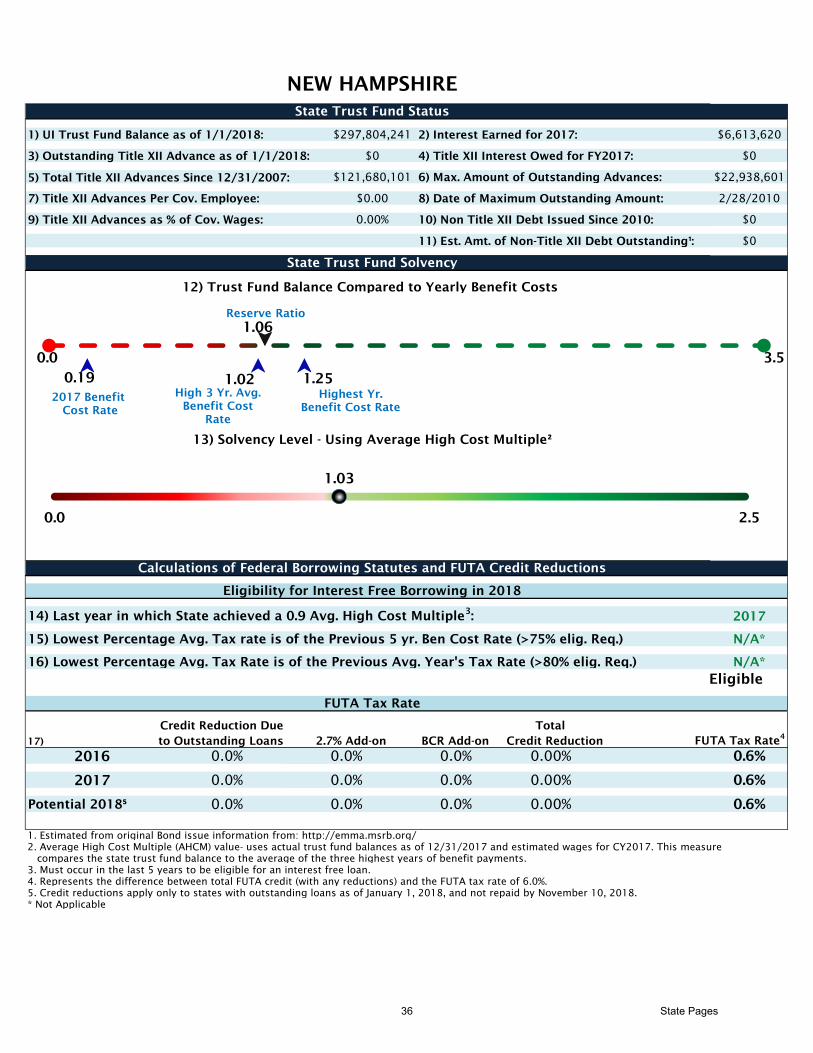
NEW HAMPSHIRE
State Trust Fund Status
1) UI Trust Fund Balance as of 1/1/2018: $297,804,241 2) Interest Earned for 2017: $6,613,620
3) Outstanding Title XII Advance as of 1/1/2018: $0 4) Title XII Interest Owed for FY2017: $0
5) Total Title XII Advances Since 12/31/2007: $121,680,101 6) Max. Amount of Outstanding Advances: $22,938,601
7) Title XII Advances Per Cov. Employee: $0.00 8) Date of Maximum Outstanding Amount: 2/28/2010
9) Title XII Advances as % of Cov. Wages: 0.00% 10) Non Title XII Debt Issued Since 2010: $0
11) Est. Amt. of Non-Title XII Debt Outstanding¹: $0
State Trust Fund Solvency
12) Trust Fund Balance Compared to Yearly Benefit Costs
0.0 3.5
13) Solvency Level - Using Average High Cost Multiple²
0.0 2.5
Calculations of Federal Borrowing Statutes and FUTA Credit Reductions
Eligibility for Interest Free Borrowing in 2018
14) Last year in which State achieved a 0.9 Avg. High Cost Multiple3
: 2017
15) Lowest Percentage Avg. Tax rate is of the Previous 5 yr. Ben Cost Rate (>75% elig. Req.) N/A*
16) Lowest Percentage Avg. Tax Rate is of the Previous Avg. Year's Tax Rate (>80% elig. Req.) N/A*
FUTA Tax Rate
Credit Reduction Due
17) to Outstanding Loans Credit Reduction FUTA Tax Rate4
2016 0.0% 0.0% 0.6%
2017 0.0% 0.0% 0.6%
Potential 2018⁵ 0.0% 0.0% 0.6%
1. Estimated from original Bond issue information from: http://emma.msrb.org/
2. Average High Cost Multiple (AHCM) value- uses actual trust fund balances as of 12/31/2017 and estimated wages for CY2017. This measure
compares the state trust fund balance to the average of the three highest years of benefit payments.
3. Must occur in the last 5 years to be eligible for an interest free loan.
4. Represents the difference between total FUTA credit (with any reductions) and the FUTA tax rate of 6.0%.
5. Credit reductions apply only to states with outstanding loans as of January 1, 2018, and not repaid by November 10, 2018.
* Not Applicable
Eligible
2.7% Add-on BCR Add-on
Total
0.0% 0.00%
0.0% 0.00%
0.0% 0.00%
1.03
1.06
0.19 1.02 1.25
Reserve Ratio
High 3 Yr. Avg.
Benefit Cost
Rate
2017 Benefit
Cost Rate
Highest Yr.
Benefit Cost Rate
36 State Pages

NEW JERSEY
State Trust Fund Status
1) UI Trust Fund Balance as of 1/1/2018: $2,212,907,518 2) Interest Earned for 2017: $46,771,318
3) Outstanding Title XII Advance as of 1/1/2018: $0 4) Title XII Interest Owed for FY2017: $0
5) Total Title XII Advances Since 12/31/2007: $9,835,363,525 6) Max. Amount of Outstanding Advances: $2,054,066,515
7) Title XII Advances Per Cov. Employee: $0.00 8) Date of Maximum Outstanding Amount: 3/31/2011
9) Title XII Advances as % of Cov. Wages: 0.00% 10) Non Title XII Debt Issued Since 2010: $0
11) Est. Amt. of Non-Title XII Debt Outstanding¹: $0
State Trust Fund Solvency
12) Trust Fund Balance Compared to Yearly Benefit Costs
0.0 3.5
13) Solvency Level - Using Average High Cost Multiple²
0.0 2.5
Calculations of Federal Borrowing Statutes and FUTA Credit Reductions
Eligibility for Interest Free Borrowing in 2018
14) Last year in which State achieved a 0.9 Avg. High Cost Multiple3
: 2001
15) Lowest Percentage Avg. Tax rate is of the Previous 5 yr. Ben Cost Rate (>75% elig. Req.) 92%
16) Lowest Percentage Avg. Tax Rate is of the Previous Avg. Year's Tax Rate (>80% elig. Req.) 80%
FUTA Tax Rate
Credit Reduction Due
17) to Outstanding Loans Credit Reduction FUTA Tax Rate4
2016 0.0% 0.0% 0.6%
2017 0.0% 0.0% 0.6%
Potential 2018⁵ 0.0% 0.0% 0.6%
1. Estimated from original Bond issue information from: http://emma.msrb.org/
2. Average High Cost Multiple (AHCM) value- uses actual trust fund balances as of 12/31/2017 and estimated wages for CY2017. This measure
compares the state trust fund balance to the average of the three highest years of benefit payments.
3. Must occur in the last 5 years to be eligible for an interest free loan.
4. Represents the difference between total FUTA credit (with any reductions) and the FUTA tax rate of 6.0%.
5. Credit reductions apply only to states with outstanding loans as of January 1, 2018, and not repaid by November 10, 2018.
* Not Applicable
Ineligible
2.7% Add-on BCR Add-on
Total
0.0% 0.00%
0.0% 0.00%
0.0% 0.00%
0.56
1.05
0.891.86 2.12
Reserve Ratio
High 3 Yr. Avg.
Benefit Cost Rate2017 Benefit
Cost Rate
Highest Yr.
Benefit Cost Rate
37 State Pages
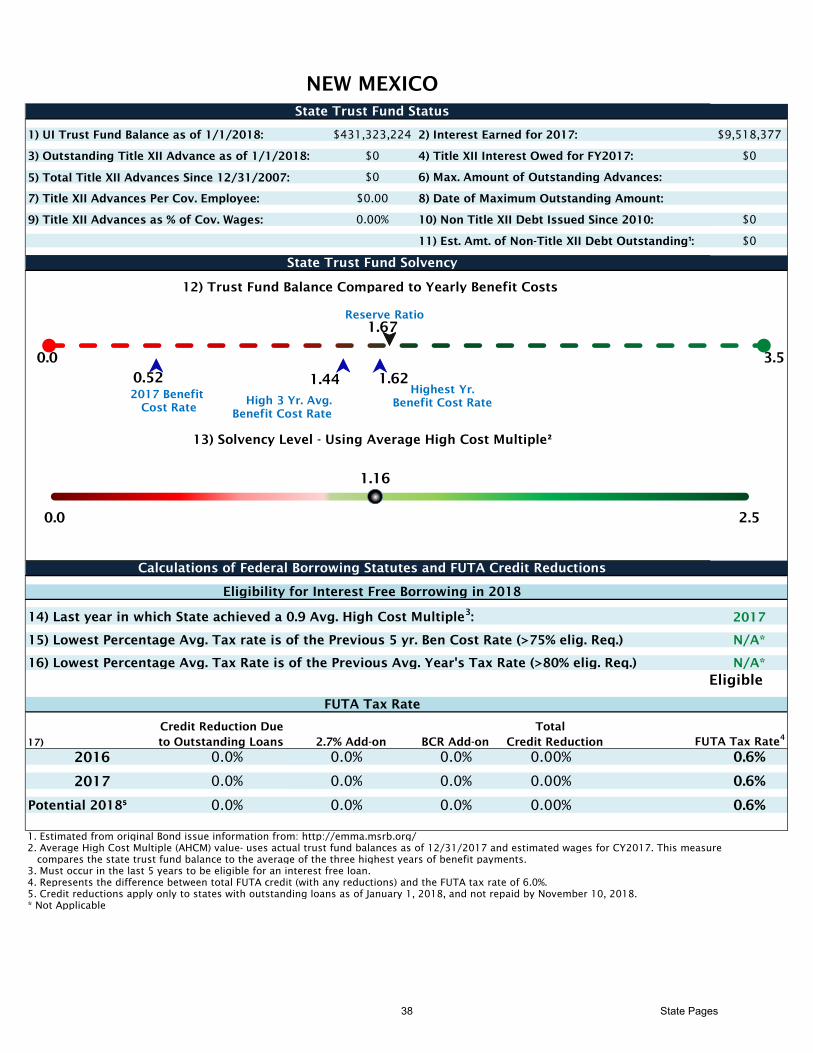
NEW MEXICO
State Trust Fund Status
1) UI Trust Fund Balance as of 1/1/2018: $431,323,224 2) Interest Earned for 2017: $9,518,377
3) Outstanding Title XII Advance as of 1/1/2018: $0 4) Title XII Interest Owed for FY2017: $0
5) Total Title XII Advances Since 12/31/2007: $0 6) Max. Amount of Outstanding Advances:
7) Title XII Advances Per Cov. Employee: $0.00 8) Date of Maximum Outstanding Amount:
9) Title XII Advances as % of Cov. Wages: 0.00% 10) Non Title XII Debt Issued Since 2010: $0
11) Est. Amt. of Non-Title XII Debt Outstanding¹: $0
State Trust Fund Solvency
12) Trust Fund Balance Compared to Yearly Benefit Costs
0.0 3.5
13) Solvency Level - Using Average High Cost Multiple²
0.0 2.5
Calculations of Federal Borrowing Statutes and FUTA Credit Reductions
Eligibility for Interest Free Borrowing in 2018
14) Last year in which State achieved a 0.9 Avg. High Cost Multiple3
: 2017
15) Lowest Percentage Avg. Tax rate is of the Previous 5 yr. Ben Cost Rate (>75% elig. Req.) N/A*
16) Lowest Percentage Avg. Tax Rate is of the Previous Avg. Year's Tax Rate (>80% elig. Req.) N/A*
FUTA Tax Rate
Credit Reduction Due
17) to Outstanding Loans Credit Reduction FUTA Tax Rate4
2016 0.0% 0.0% 0.6%
2017 0.0% 0.0% 0.6%
Potential 2018⁵ 0.0% 0.0% 0.6%
1. Estimated from original Bond issue information from: http://emma.msrb.org/
2. Average High Cost Multiple (AHCM) value- uses actual trust fund balances as of 12/31/2017 and estimated wages for CY2017. This measure
compares the state trust fund balance to the average of the three highest years of benefit payments.
3. Must occur in the last 5 years to be eligible for an interest free loan.
4. Represents the difference between total FUTA credit (with any reductions) and the FUTA tax rate of 6.0%.
5. Credit reductions apply only to states with outstanding loans as of January 1, 2018, and not repaid by November 10, 2018.
* Not Applicable
Eligible
2.7% Add-on BCR Add-on
Total
0.0% 0.00%
0.0% 0.00%
0.0% 0.00%
1.16
1.67
0.52 1.44 1.62
Reserve Ratio
High 3 Yr. Avg.
Benefit Cost Rate
2017 Benefit
Cost Rate
Highest Yr.
Benefit Cost Rate
38 State Pages
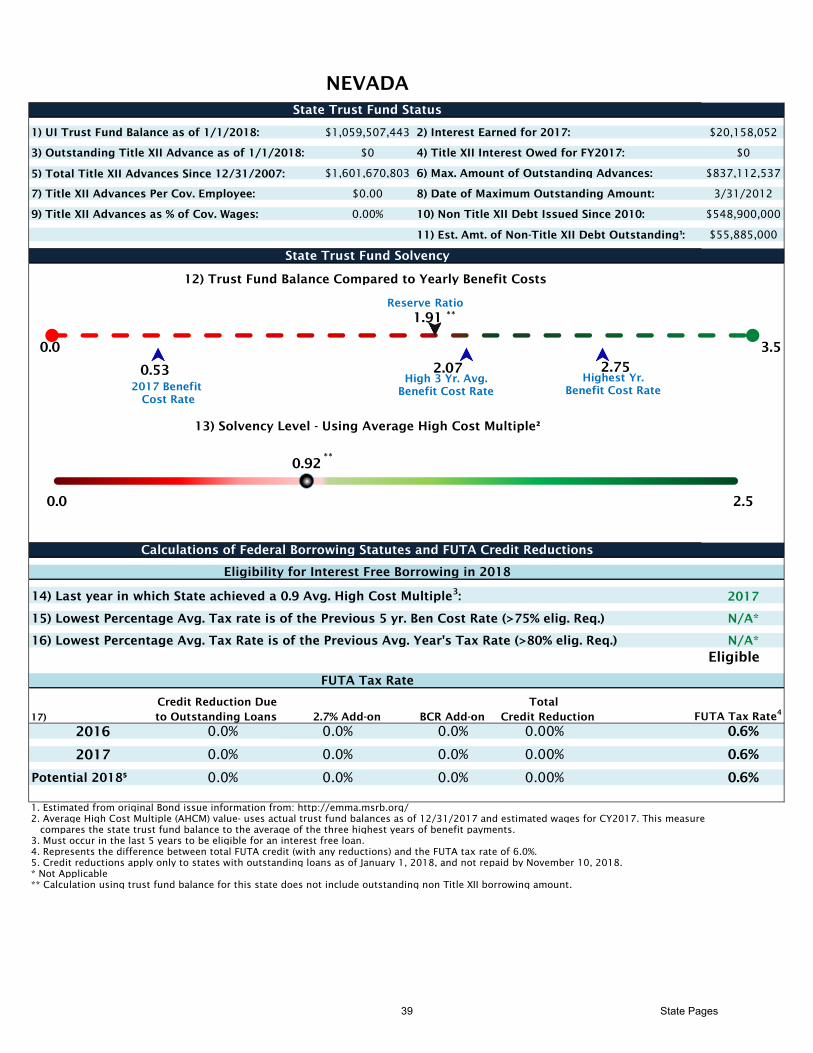
NEVADA
State Trust Fund Status
1) UI Trust Fund Balance as of 1/1/2018: $1,059,507,443 2) Interest Earned for 2017: $20,158,052
3) Outstanding Title XII Advance as of 1/1/2018: $0 4) Title XII Interest Owed for FY2017: $0
5) Total Title XII Advances Since 12/31/2007: $1,601,670,803 6) Max. Amount of Outstanding Advances: $837,112,537
7) Title XII Advances Per Cov. Employee: $0.00 8) Date of Maximum Outstanding Amount: 3/31/2012
9) Title XII Advances as % of Cov. Wages: 0.00% 10) Non Title XII Debt Issued Since 2010: $548,900,000
11) Est. Amt. of Non-Title XII Debt Outstanding¹: $55,885,000
State Trust Fund Solvency
12) Trust Fund Balance Compared to Yearly Benefit Costs
0.0 3.5
13) Solvency Level - Using Average High Cost Multiple²
0.0 2.5
Calculations of Federal Borrowing Statutes and FUTA Credit Reductions
Eligibility for Interest Free Borrowing in 2018
14) Last year in which State achieved a 0.9 Avg. High Cost Multiple3
: 2017
15) Lowest Percentage Avg. Tax rate is of the Previous 5 yr. Ben Cost Rate (>75% elig. Req.) N/A*
16) Lowest Percentage Avg. Tax Rate is of the Previous Avg. Year's Tax Rate (>80% elig. Req.) N/A*
FUTA Tax Rate
Credit Reduction Due
17) to Outstanding Loans Credit Reduction FUTA Tax Rate4
2016 0.0% 0.0% 0.6%
2017 0.0% 0.0% 0.6%
Potential 2018⁵ 0.0% 0.0% 0.6%
1. Estimated from original Bond issue information from: http://emma.msrb.org/
2. Average High Cost Multiple (AHCM) value- uses actual trust fund balances as of 12/31/2017 and estimated wages for CY2017. This measure
compares the state trust fund balance to the average of the three highest years of benefit payments.
3. Must occur in the last 5 years to be eligible for an interest free loan.
4. Represents the difference between total FUTA credit (with any reductions) and the FUTA tax rate of 6.0%.
5. Credit reductions apply only to states with outstanding loans as of January 1, 2018, and not repaid by November 10, 2018.
* Not Applicable
** Calculation using trust fund balance for this state does not include outstanding non Title XII borrowing amount.
Eligible
2.7% Add-on BCR Add-on
Total
0.0% 0.00%
0.0% 0.00%
0.0% 0.00%
0.92**
1.91
0.53 2.07 2.75
Reserve Ratio
**
High 3 Yr. Avg.
Benefit Cost Rate2017 Benefit
Cost Rate
Highest Yr.
Benefit Cost Rate
39 State Pages
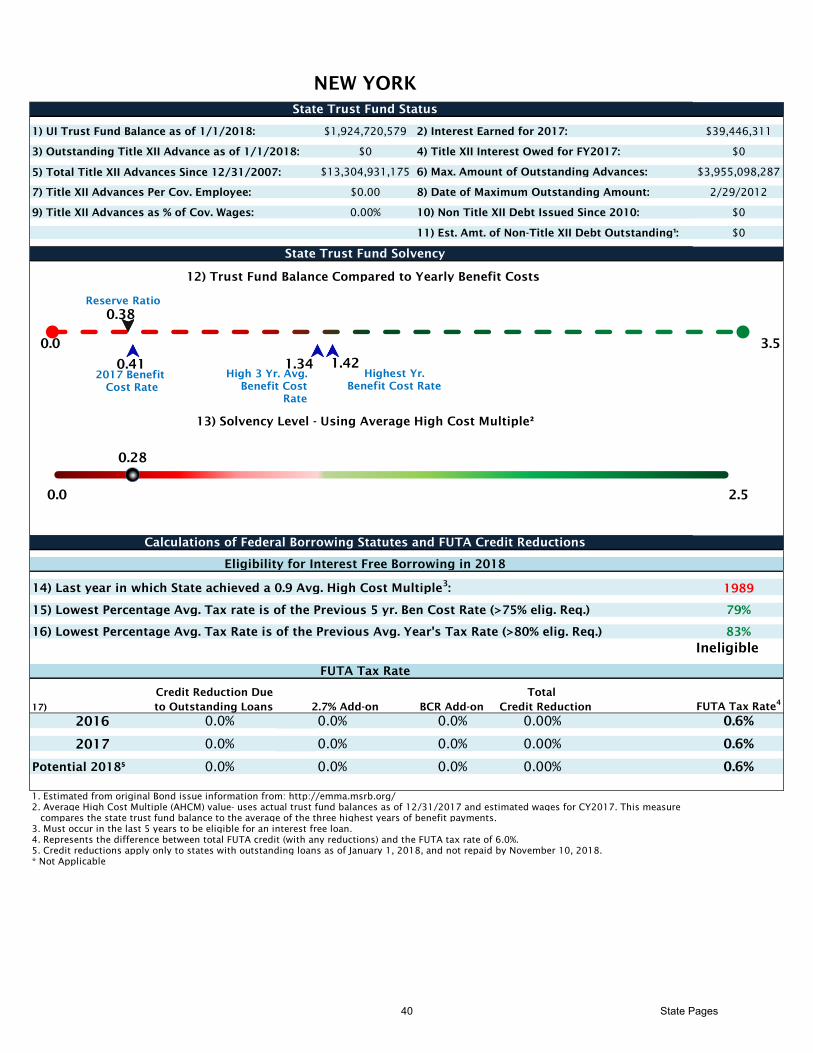
NEW YORK
State Trust Fund Status
1) UI Trust Fund Balance as of 1/1/2018: $1,924,720,579 2) Interest Earned for 2017: $39,446,311
3) Outstanding Title XII Advance as of 1/1/2018: $0 4) Title XII Interest Owed for FY2017: $0
5) Total Title XII Advances Since 12/31/2007: $13,304,931,175 6) Max. Amount of Outstanding Advances: $3,955,098,287
7) Title XII Advances Per Cov. Employee: $0.00 8) Date of Maximum Outstanding Amount: 2/29/2012
9) Title XII Advances as % of Cov. Wages: 0.00% 10) Non Title XII Debt Issued Since 2010: $0
11) Est. Amt. of Non-Title XII Debt Outstanding¹: $0
State Trust Fund Solvency
12) Trust Fund Balance Compared to Yearly Benefit Costs
0.0 3.5
13) Solvency Level - Using Average High Cost Multiple²
0.0 2.5
Calculations of Federal Borrowing Statutes and FUTA Credit Reductions
Eligibility for Interest Free Borrowing in 2018
14) Last year in which State achieved a 0.9 Avg. High Cost Multiple3
: 1989
15) Lowest Percentage Avg. Tax rate is of the Previous 5 yr. Ben Cost Rate (>75% elig. Req.) 79%
16) Lowest Percentage Avg. Tax Rate is of the Previous Avg. Year's Tax Rate (>80% elig. Req.) 83%
FUTA Tax Rate
Credit Reduction Due
17) to Outstanding Loans Credit Reduction FUTA Tax Rate4
2016 0.0% 0.0% 0.6%
2017 0.0% 0.0% 0.6%
Potential 2018⁵ 0.0% 0.0% 0.6%
1. Estimated from original Bond issue information from: http://emma.msrb.org/
2. Average High Cost Multiple (AHCM) value- uses actual trust fund balances as of 12/31/2017 and estimated wages for CY2017. This measure
compares the state trust fund balance to the average of the three highest years of benefit payments.
3. Must occur in the last 5 years to be eligible for an interest free loan.
4. Represents the difference between total FUTA credit (with any reductions) and the FUTA tax rate of 6.0%.
5. Credit reductions apply only to states with outstanding loans as of January 1, 2018, and not repaid by November 10, 2018.
* Not Applicable
Ineligible
2.7% Add-on BCR Add-on
Total
0.0% 0.00%
0.0% 0.00%
0.0% 0.00%
0.28
0.38
0.41 1.34 1.42
Reserve Ratio
High 3 Yr. Avg.
Benefit Cost
Rate
2017 Benefit
Cost Rate
Highest Yr.
Benefit Cost Rate
40 State Pages
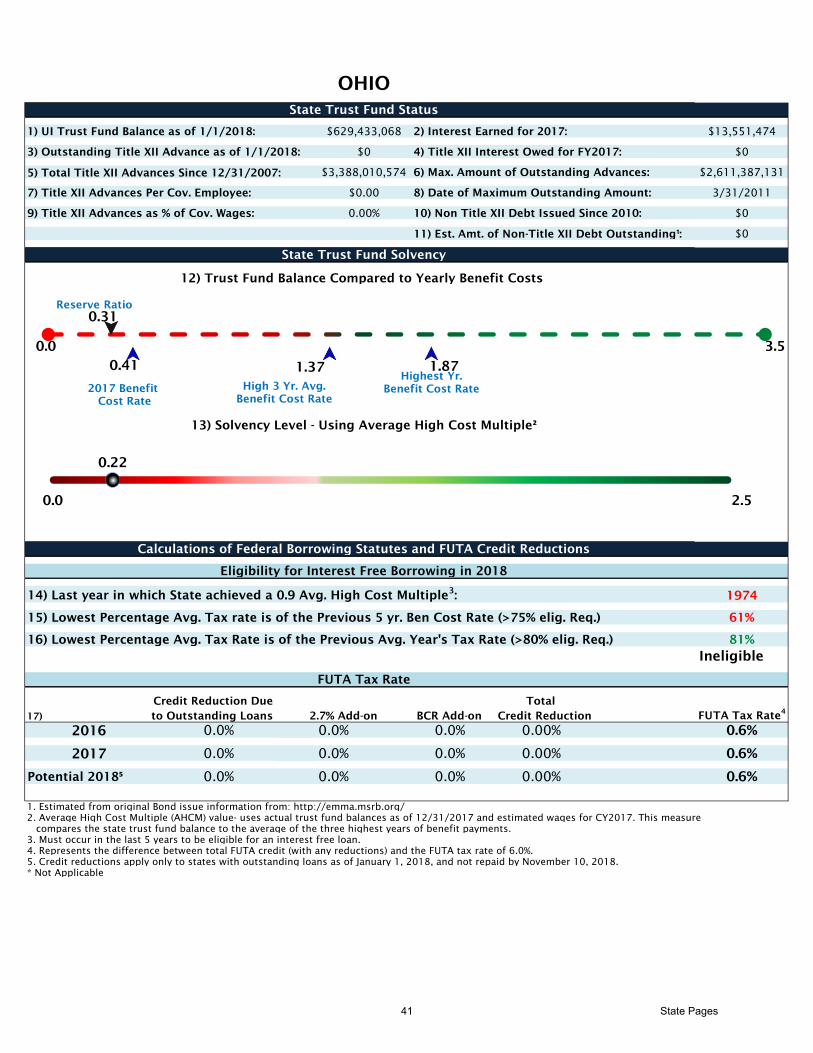
OHIO
State Trust Fund Status
1) UI Trust Fund Balance as of 1/1/2018: $629,433,068 2) Interest Earned for 2017: $13,551,474
3) Outstanding Title XII Advance as of 1/1/2018: $0 4) Title XII Interest Owed for FY2017: $0
5) Total Title XII Advances Since 12/31/2007: $3,388,010,574 6) Max. Amount of Outstanding Advances: $2,611,387,131
7) Title XII Advances Per Cov. Employee: $0.00 8) Date of Maximum Outstanding Amount: 3/31/2011
9) Title XII Advances as % of Cov. Wages: 0.00% 10) Non Title XII Debt Issued Since 2010: $0
11) Est. Amt. of Non-Title XII Debt Outstanding¹: $0
State Trust Fund Solvency
12) Trust Fund Balance Compared to Yearly Benefit Costs
0.0 3.5
13) Solvency Level - Using Average High Cost Multiple²
0.0 2.5
Calculations of Federal Borrowing Statutes and FUTA Credit Reductions
Eligibility for Interest Free Borrowing in 2018
14) Last year in which State achieved a 0.9 Avg. High Cost Multiple3
: 1974
15) Lowest Percentage Avg. Tax rate is of the Previous 5 yr. Ben Cost Rate (>75% elig. Req.) 61%
16) Lowest Percentage Avg. Tax Rate is of the Previous Avg. Year's Tax Rate (>80% elig. Req.) 81%
FUTA Tax Rate
Credit Reduction Due
17) to Outstanding Loans Credit Reduction FUTA Tax Rate4
2016 0.0% 0.0% 0.6%
2017 0.0% 0.0% 0.6%
Potential 2018⁵ 0.0% 0.0% 0.6%
1. Estimated from original Bond issue information from: http://emma.msrb.org/
2. Average High Cost Multiple (AHCM) value- uses actual trust fund balances as of 12/31/2017 and estimated wages for CY2017. This measure
compares the state trust fund balance to the average of the three highest years of benefit payments.
3. Must occur in the last 5 years to be eligible for an interest free loan.
4. Represents the difference between total FUTA credit (with any reductions) and the FUTA tax rate of 6.0%.
5. Credit reductions apply only to states with outstanding loans as of January 1, 2018, and not repaid by November 10, 2018.
* Not Applicable
Ineligible
2.7% Add-on BCR Add-on
Total
0.0% 0.00%
0.0% 0.00%
0.0% 0.00%
0.22
0.31
0.41 1.37 1.87
Reserve Ratio
High 3 Yr. Avg.
Benefit Cost Rate
2017 Benefit
Cost Rate
Highest Yr.
Benefit Cost Rate
41 State Pages

OKLAHOMA
State Trust Fund Status
1) UI Trust Fund Balance as of 1/1/2018: $1,008,585,207 2) Interest Earned for 2017: $22,740,440
3) Outstanding Title XII Advance as of 1/1/2018: $0 4) Title XII Interest Owed for FY2017: $0
5) Total Title XII Advances Since 12/31/2007: $0 6) Max. Amount of Outstanding Advances:
7) Title XII Advances Per Cov. Employee: $0.00 8) Date of Maximum Outstanding Amount:
9) Title XII Advances as % of Cov. Wages: 0.00% 10) Non Title XII Debt Issued Since 2010: $0
11) Est. Amt. of Non-Title XII Debt Outstanding¹: $0
State Trust Fund Solvency
12) Trust Fund Balance Compared to Yearly Benefit Costs
0.0 3.5
13) Solvency Level - Using Average High Cost Multiple²
0.0 2.5
Calculations of Federal Borrowing Statutes and FUTA Credit Reductions
Eligibility for Interest Free Borrowing in 2018
14) Last year in which State achieved a 0.9 Avg. High Cost Multiple3
: 2017
15) Lowest Percentage Avg. Tax rate is of the Previous 5 yr. Ben Cost Rate (>75% elig. Req.) N/A*
16) Lowest Percentage Avg. Tax Rate is of the Previous Avg. Year's Tax Rate (>80% elig. Req.) N/A*
FUTA Tax Rate
Credit Reduction Due
17) to Outstanding Loans Credit Reduction FUTA Tax Rate4
2016 0.0% 0.0% 0.6%
2017 0.0% 0.0% 0.6%
Potential 2018⁵ 0.0% 0.0% 0.6%
1. Estimated from original Bond issue information from: http://emma.msrb.org/
2. Average High Cost Multiple (AHCM) value- uses actual trust fund balances as of 12/31/2017 and estimated wages for CY2017. This measure
compares the state trust fund balance to the average of the three highest years of benefit payments.
3. Must occur in the last 5 years to be eligible for an interest free loan.
4. Represents the difference between total FUTA credit (with any reductions) and the FUTA tax rate of 6.0%.
5. Credit reductions apply only to states with outstanding loans as of January 1, 2018, and not repaid by November 10, 2018.
* Not Applicable
Eligible
2.7% Add-on BCR Add-on
Total
0.0% 0.00%
0.0% 0.00%
0.0% 0.00%
1.69
1.67
0.38 0.99 1.26
Reserve Ratio
High 3 Yr. Avg.
Benefit Cost
2017 Benefit
Cost Rate
Highest Yr.
Benefit Cost Rate
42 State Pages
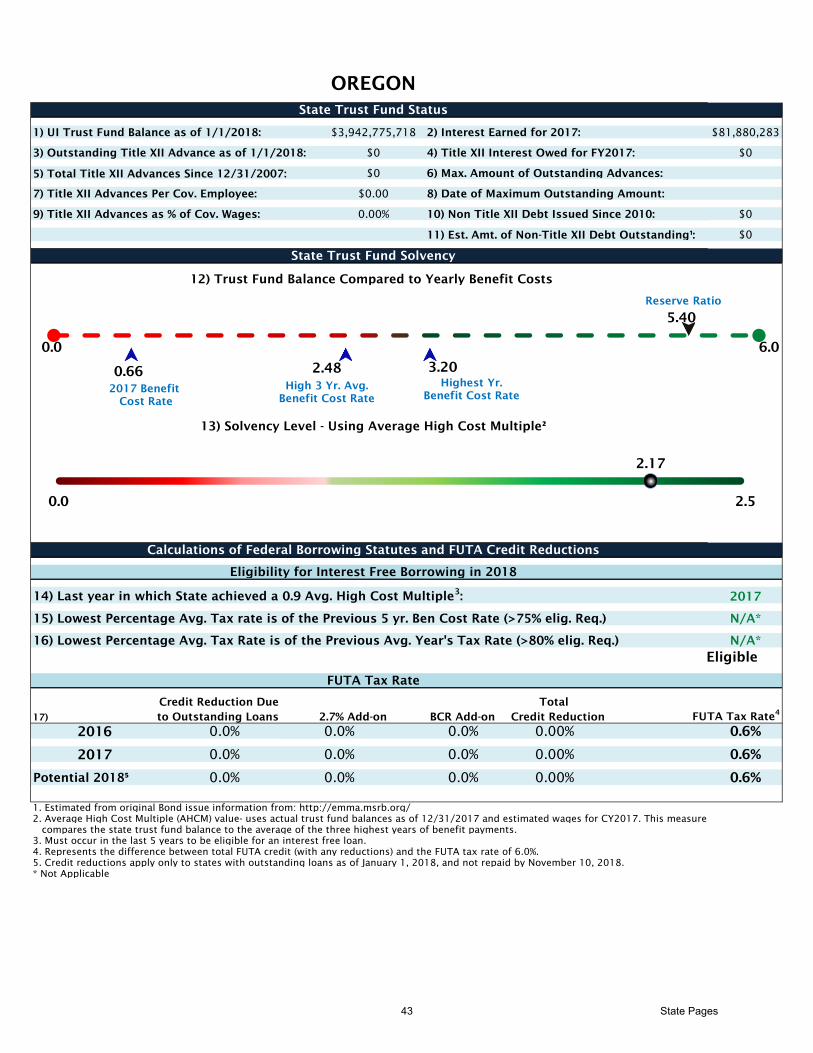
OREGON
State Trust Fund Status
1) UI Trust Fund Balance as of 1/1/2018: $3,942,775,718 2) Interest Earned for 2017: $81,880,283
3) Outstanding Title XII Advance as of 1/1/2018: $0 4) Title XII Interest Owed for FY2017: $0
5) Total Title XII Advances Since 12/31/2007: $0 6) Max. Amount of Outstanding Advances:
7) Title XII Advances Per Cov. Employee: $0.00 8) Date of Maximum Outstanding Amount:
9) Title XII Advances as % of Cov. Wages: 0.00% 10) Non Title XII Debt Issued Since 2010: $0
11) Est. Amt. of Non-Title XII Debt Outstanding¹: $0
State Trust Fund Solvency
12) Trust Fund Balance Compared to Yearly Benefit Costs
0.0 6.0
13) Solvency Level - Using Average High Cost Multiple²
0.0 2.5
Calculations of Federal Borrowing Statutes and FUTA Credit Reductions
Eligibility for Interest Free Borrowing in 2018
14) Last year in which State achieved a 0.9 Avg. High Cost Multiple3
: 2017
15) Lowest Percentage Avg. Tax rate is of the Previous 5 yr. Ben Cost Rate (>75% elig. Req.) N/A*
16) Lowest Percentage Avg. Tax Rate is of the Previous Avg. Year's Tax Rate (>80% elig. Req.) N/A*
FUTA Tax Rate
Credit Reduction Due
17) to Outstanding Loans Credit Reduction FUTA Tax Rate4
2016 0.0% 0.0% 0.6%
2017 0.0% 0.0% 0.6%
Potential 2018⁵ 0.0% 0.0% 0.6%
1. Estimated from original Bond issue information from: http://emma.msrb.org/
2. Average High Cost Multiple (AHCM) value- uses actual trust fund balances as of 12/31/2017 and estimated wages for CY2017. This measure
compares the state trust fund balance to the average of the three highest years of benefit payments.
3. Must occur in the last 5 years to be eligible for an interest free loan.
4. Represents the difference between total FUTA credit (with any reductions) and the FUTA tax rate of 6.0%.
5. Credit reductions apply only to states with outstanding loans as of January 1, 2018, and not repaid by November 10, 2018.
* Not Applicable
Eligible
2.7% Add-on BCR Add-on
Total
0.0% 0.00%
0.0% 0.00%
0.0% 0.00%
2.17
5.40
0.66 2.48 3.20
Reserve Ratio
High 3 Yr. Avg.
Benefit Cost Rate
2017 Benefit
Cost Rate
Highest Yr.
Benefit Cost Rate
43 State Pages

PENNSYLVANIA
State Trust Fund Status
1) UI Trust Fund Balance as of 1/1/2018: $2,083,618,855 2) Interest Earned for 2017: $41,451,467
3) Outstanding Title XII Advance as of 1/1/2018: $0 4) Title XII Interest Owed for FY2017: $0
5) Total Title XII Advances Since 12/31/2007: $6,437,153,834 6) Max. Amount of Outstanding Advances: $3,874,720,165
7) Title XII Advances Per Cov. Employee: $0.00 8) Date of Maximum Outstanding Amount: 3/31/2012
9) Title XII Advances as % of Cov. Wages: 0.00% 10) Non Title XII Debt Issued Since 2010: $2,827,405,000
11) Est. Amt. of Non-Title XII Debt Outstanding¹: $1,929,860,000
State Trust Fund Solvency
12) Trust Fund Balance Compared to Yearly Benefit Costs
0.0 3.5
13) Solvency Level - Using Average High Cost Multiple²
0.0 2.5
Calculations of Federal Borrowing Statutes and FUTA Credit Reductions
Eligibility for Interest Free Borrowing in 2018
14) Last year in which State achieved a 0.9 Avg. High Cost Multiple3
: 1971
15) Lowest Percentage Avg. Tax rate is of the Previous 5 yr. Ben Cost Rate (>75% elig. Req.) 81%
16) Lowest Percentage Avg. Tax Rate is of the Previous Avg. Year's Tax Rate (>80% elig. Req.) 48%
FUTA Tax Rate
Credit Reduction Due
17) to Outstanding Loans Credit Reduction FUTA Tax Rate4
2016 0.0% 0.0% 0.6%
2017 0.0% 0.0% 0.6%
Potential 2018⁵ 0.0% 0.0% 0.6%
1. Estimated from original Bond issue information from: http://emma.msrb.org/
2. Average High Cost Multiple (AHCM) value- uses actual trust fund balances as of 12/31/2017 and estimated wages for CY2017. This measure
compares the state trust fund balance to the average of the three highest years of benefit payments.
3. Must occur in the last 5 years to be eligible for an interest free loan.
4. Represents the difference between total FUTA credit (with any reductions) and the FUTA tax rate of 6.0%.
5. Credit reductions apply only to states with outstanding loans as of January 1, 2018, and not repaid by November 10, 2018.
* Not Applicable
** Calculation using trust fund balance for this state does not include outstanding non Title XII borrowing amount.
Ineligible
2.7% Add-on BCR Add-on
Total
0.0% 0.00%
0.0% 0.00%
0.0% 0.00%
0.42
0.87
0.72 2.04 2.53
Reserve Ratio
**
High 3 Yr. Avg.
Benefit Cost Rate
2017 Benefit
Cost Rate
Highest Yr.
Benefit Cost Rate
44 State Pages

PUERTO RICO
State Trust Fund Status
1) UI Trust Fund Balance as of 1/1/2018: $537,269,059 2) Interest Earned for 2017: $12,050,136
3) Outstanding Title XII Advance as of 1/1/2018: $0 4) Title XII Interest Owed for FY2017: $0
5) Total Title XII Advances Since 12/31/2007: $0 6) Max. Amount of Outstanding Advances:
7) Title XII Advances Per Cov. Employee: $0.00 8) Date of Maximum Outstanding Amount:
9) Title XII Advances as % of Cov. Wages: 0.00% 10) Non Title XII Debt Issued Since 2010: $0
11) Est. Amt. of Non-Title XII Debt Outstanding¹: $0
State Trust Fund Solvency
12) Trust Fund Balance Compared to Yearly Benefit Costs
0.0 3.5
13) Solvency Level - Using Average High Cost Multiple²
0.0 2.5
Calculations of Federal Borrowing Statutes and FUTA Credit Reductions
Eligibility for Interest Free Borrowing in 2018
14) Last year in which State achieved a 0.9 Avg. High Cost Multiple3
: 2017
15) Lowest Percentage Avg. Tax rate is of the Previous 5 yr. Ben Cost Rate (>75% elig. Req.) N/A*
16) Lowest Percentage Avg. Tax Rate is of the Previous Avg. Year's Tax Rate (>80% elig. Req.) N/A*
FUTA Tax Rate
Credit Reduction Due
17) to Outstanding Loans Credit Reduction FUTA Tax Rate4
2016 0.0% 0.0% 0.6%
2017 0.0% 0.0% 0.6%
Potential 2018⁵ 0.0% 0.0% 0.6%
1. Estimated from original Bond issue information from: http://emma.msrb.org/
2. Average High Cost Multiple (AHCM) value- uses actual trust fund balances as of 12/31/2017 and estimated wages for CY2017. This measure
compares the state trust fund balance to the average of the three highest years of benefit payments.
3. Must occur in the last 5 years to be eligible for an interest free loan.
4. Represents the difference between total FUTA credit (with any reductions) and the FUTA tax rate of 6.0%.
5. Credit reductions apply only to states with outstanding loans as of January 1, 2018, and not repaid by November 10, 2018.
* Not Applicable
Eligible
2.7% Add-on BCR Add-on
Total
0.0% 0.00%
0.0% 0.00%
0.0% 0.00%
1.18
3.17
0.85 2.68 2.94
Reserve Ratio
High 3 Yr. Avg.
Benefit Cost Rate
2017 Benefit
Cost Rate
Highest Yr.
Benefit Cost Rate
45 State Pages

RHODE ISLAND
State Trust Fund Status
1) UI Trust Fund Balance as of 1/1/2018: $360,916,841 2) Interest Earned for 2017: $6,964,663
3) Outstanding Title XII Advance as of 1/1/2018: $0 4) Title XII Interest Owed for FY2017: $0
5) Total Title XII Advances Since 12/31/2007: $926,149,213 6) Max. Amount of Outstanding Advances: $288,545,206
7) Title XII Advances Per Cov. Employee: $0.00 8) Date of Maximum Outstanding Amount: 3/31/2012
9) Title XII Advances as % of Cov. Wages: 0.00% 10) Non Title XII Debt Issued Since 2010: $0
11) Est. Amt. of Non-Title XII Debt Outstanding¹: $0
State Trust Fund Solvency
12) Trust Fund Balance Compared to Yearly Benefit Costs
0.0 3.5
13) Solvency Level - Using Average High Cost Multiple²
0.0 2.5
Calculations of Federal Borrowing Statutes and FUTA Credit Reductions
Eligibility for Interest Free Borrowing in 2018
14) Last year in which State achieved a 0.9 Avg. High Cost Multiple3
: 1990
15) Lowest Percentage Avg. Tax rate is of the Previous 5 yr. Ben Cost Rate (>75% elig. Req.) 73%
16) Lowest Percentage Avg. Tax Rate is of the Previous Avg. Year's Tax Rate (>80% elig. Req.) 80%
FUTA Tax Rate
Credit Reduction Due
17) to Outstanding Loans Credit Reduction FUTA Tax Rate4
2016 0.0% 0.0% 0.6%
2017 0.0% 0.0% 0.6%
Potential 2018⁵ 0.0% 0.0% 0.6%
1. Estimated from original Bond issue information from: http://emma.msrb.org/
2. Average High Cost Multiple (AHCM) value- uses actual trust fund balances as of 12/31/2017 and estimated wages for CY2017. This measure
compares the state trust fund balance to the average of the three highest years of benefit payments.
3. Must occur in the last 5 years to be eligible for an interest free loan.
4. Represents the difference between total FUTA credit (with any reductions) and the FUTA tax rate of 6.0%.
5. Credit reductions apply only to states with outstanding loans as of January 1, 2018, and not repaid by November 10, 2018.
* Not Applicable
Ineligible
2.7% Add-on BCR Add-on
Total
0.0% 0.00%
0.0% 0.00%
0.0% 0.00%
0.64
1.93
0.803.01 3.39
Reserve Ratio
High 3 Yr. Avg.
Benefit Cost Rate
2017 Benefit
Cost Rate
Highest Yr.
Benefit
46 State Pages
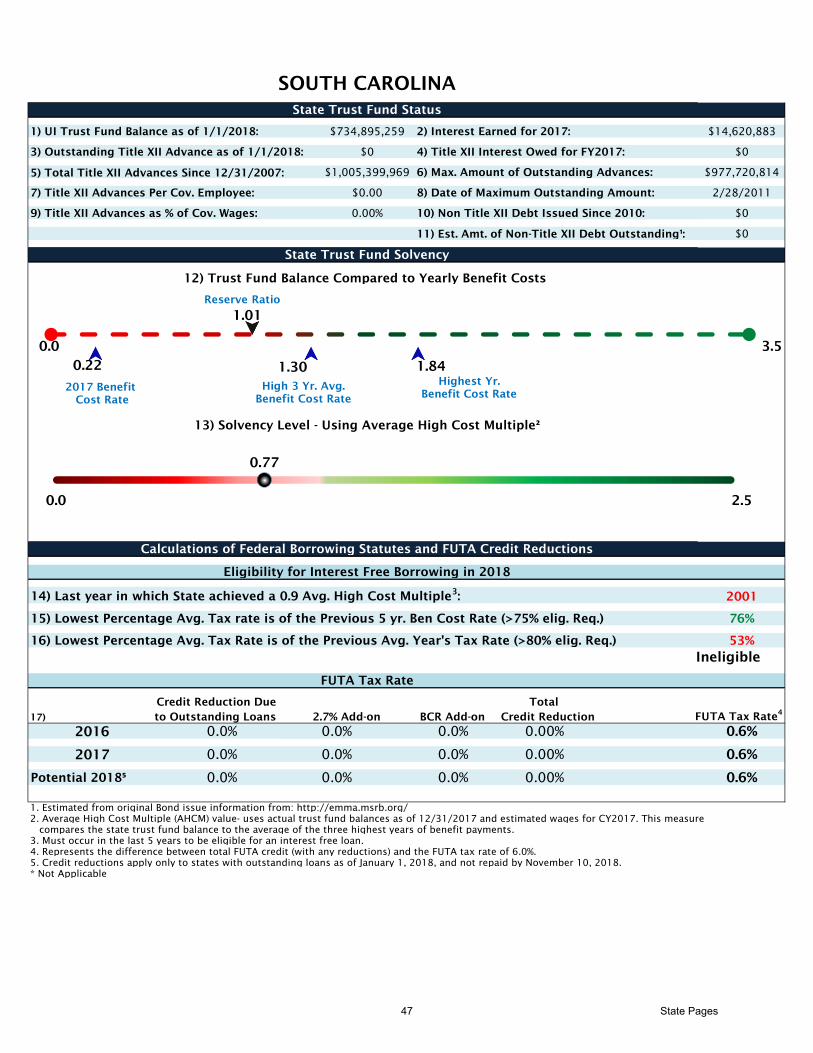
SOUTH CAROLINA
State Trust Fund Status
1) UI Trust Fund Balance as of 1/1/2018: $734,895,259 2) Interest Earned for 2017: $14,620,883
3) Outstanding Title XII Advance as of 1/1/2018: $0 4) Title XII Interest Owed for FY2017: $0
5) Total Title XII Advances Since 12/31/2007: $1,005,399,969 6) Max. Amount of Outstanding Advances: $977,720,814
7) Title XII Advances Per Cov. Employee: $0.00 8) Date of Maximum Outstanding Amount: 2/28/2011
9) Title XII Advances as % of Cov. Wages: 0.00% 10) Non Title XII Debt Issued Since 2010: $0
11) Est. Amt. of Non-Title XII Debt Outstanding¹: $0
State Trust Fund Solvency
12) Trust Fund Balance Compared to Yearly Benefit Costs
0.0 3.5
13) Solvency Level - Using Average High Cost Multiple²
0.0 2.5
Calculations of Federal Borrowing Statutes and FUTA Credit Reductions
Eligibility for Interest Free Borrowing in 2018
14) Last year in which State achieved a 0.9 Avg. High Cost Multiple3
: 2001
15) Lowest Percentage Avg. Tax rate is of the Previous 5 yr. Ben Cost Rate (>75% elig. Req.) 76%
16) Lowest Percentage Avg. Tax Rate is of the Previous Avg. Year's Tax Rate (>80% elig. Req.) 53%
FUTA Tax Rate
Credit Reduction Due
17) to Outstanding Loans Credit Reduction FUTA Tax Rate4
2016 0.0% 0.0% 0.6%
2017 0.0% 0.0% 0.6%
Potential 2018⁵ 0.0% 0.0% 0.6%
1. Estimated from original Bond issue information from: http://emma.msrb.org/
2. Average High Cost Multiple (AHCM) value- uses actual trust fund balances as of 12/31/2017 and estimated wages for CY2017. This measure
compares the state trust fund balance to the average of the three highest years of benefit payments.
3. Must occur in the last 5 years to be eligible for an interest free loan.
4. Represents the difference between total FUTA credit (with any reductions) and the FUTA tax rate of 6.0%.
5. Credit reductions apply only to states with outstanding loans as of January 1, 2018, and not repaid by November 10, 2018.
* Not Applicable
Ineligible
2.7% Add-on BCR Add-on
Total
0.0% 0.00%
0.0% 0.00%
0.0% 0.00%
0.77
1.01
0.22 1.30 1.84
Reserve Ratio
High 3 Yr. Avg.
Benefit Cost Rate
2017 Benefit
Cost Rate
Highest Yr.
Benefit Cost Rate
47 State Pages

SOUTH DAKOTA
State Trust Fund Status
1) UI Trust Fund Balance as of 1/1/2018: $121,235,469 2) Interest Earned for 2017: $2,569,166
3) Outstanding Title XII Advance as of 1/1/2018: $0 4) Title XII Interest Owed for FY2017: $0
5) Total Title XII Advances Since 12/31/2007: $24,088,989 6) Max. Amount of Outstanding Advances: $24,027,178
7) Title XII Advances Per Cov. Employee: $0.00 8) Date of Maximum Outstanding Amount: 3/31/2010
9) Title XII Advances as % of Cov. Wages: 0.00% 10) Non Title XII Debt Issued Since 2010: $0
11) Est. Amt. of Non-Title XII Debt Outstanding¹: $0
State Trust Fund Solvency
12) Trust Fund Balance Compared to Yearly Benefit Costs
0.0 3.5
13) Solvency Level - Using Average High Cost Multiple²
0.0 2.5
Calculations of Federal Borrowing Statutes and FUTA Credit Reductions
Eligibility for Interest Free Borrowing in 2018
14) Last year in which State achieved a 0.9 Avg. High Cost Multiple3
: 2017
15) Lowest Percentage Avg. Tax rate is of the Previous 5 yr. Ben Cost Rate (>75% elig. Req.) N/A*
16) Lowest Percentage Avg. Tax Rate is of the Previous Avg. Year's Tax Rate (>80% elig. Req.) N/A*
FUTA Tax Rate
Credit Reduction Due
17) to Outstanding Loans Credit Reduction FUTA Tax Rate4
2016 0.0% 0.0% 0.6%
2017 0.0% 0.0% 0.6%
Potential 2018⁵ 0.0% 0.0% 0.6%
1. Estimated from original Bond issue information from: http://emma.msrb.org/
2. Average High Cost Multiple (AHCM) value- uses actual trust fund balances as of 12/31/2017 and estimated wages for CY2017. This measure
compares the state trust fund balance to the average of the three highest years of benefit payments.
3. Must occur in the last 5 years to be eligible for an interest free loan.
4. Represents the difference between total FUTA credit (with any reductions) and the FUTA tax rate of 6.0%.
5. Credit reductions apply only to states with outstanding loans as of January 1, 2018, and not repaid by November 10, 2018.
* Not Applicable
Eligible
2.7% Add-on BCR Add-on
Total
0.0% 0.00%
0.0% 0.00%
0.0% 0.00%
1.72
0.93
0.22 0.54 0.68
Reserve Ratio
High 3 Yr. Avg.
Benefit Cost
Rate
2017 Benefit
Cost Rate
Highest Yr.
Benefit Cost Rate
48 State Pages

TENNESSEE
State Trust Fund Status
1) UI Trust Fund Balance as of 1/1/2018: $1,096,250,606 2) Interest Earned for 2017: $24,096,771
3) Outstanding Title XII Advance as of 1/1/2018: $0 4) Title XII Interest Owed for FY2017: $0
5) Total Title XII Advances Since 12/31/2007: $20,736,767 6) Max. Amount of Outstanding Advances: $20,736,767
7) Title XII Advances Per Cov. Employee: $0.00 8) Date of Maximum Outstanding Amount: 3/31/2010
9) Title XII Advances as % of Cov. Wages: 0.00% 10) Non Title XII Debt Issued Since 2010: $0
11) Est. Amt. of Non-Title XII Debt Outstanding¹: $0
State Trust Fund Solvency
12) Trust Fund Balance Compared to Yearly Benefit Costs
0.0 3.5
13) Solvency Level - Using Average High Cost Multiple²
0.0 2.5
Calculations of Federal Borrowing Statutes and FUTA Credit Reductions
Eligibility for Interest Free Borrowing in 2018
14) Last year in which State achieved a 0.9 Avg. High Cost Multiple3
: 2017
15) Lowest Percentage Avg. Tax rate is of the Previous 5 yr. Ben Cost Rate (>75% elig. Req.) N/A*
16) Lowest Percentage Avg. Tax Rate is of the Previous Avg. Year's Tax Rate (>80% elig. Req.) N/A*
FUTA Tax Rate
Credit Reduction Due
17) to Outstanding Loans Credit Reduction FUTA Tax Rate4
2016 0.0% 0.0% 0.6%
2017 0.0% 0.0% 0.6%
Potential 2018⁵ 0.0% 0.0% 0.6%
1. Estimated from original Bond issue information from: http://emma.msrb.org/
2. Average High Cost Multiple (AHCM) value- uses actual trust fund balances as of 12/31/2017 and estimated wages for CY2017. This measure
compares the state trust fund balance to the average of the three highest years of benefit payments.
3. Must occur in the last 5 years to be eligible for an interest free loan.
4. Represents the difference between total FUTA credit (with any reductions) and the FUTA tax rate of 6.0%.
5. Credit reductions apply only to states with outstanding loans as of January 1, 2018, and not repaid by November 10, 2018.
* Not Applicable
Eligible
2.7% Add-on BCR Add-on
Total
0.0% 0.00%
0.0% 0.00%
0.0% 0.00%
0.90
0.92
0.18 1.02 1.30
Reserve Ratio
High 3 Yr. Avg.
Benefit Cost Rate
2017 Benefit
Cost Rate
Highest Yr.
Benefit Cost Rate
49 State Pages

TEXAS
State Trust Fund Status
1) UI Trust Fund Balance as of 1/1/2018: $924,347,603 2) Interest Earned for 2017: $22,135,583
3) Outstanding Title XII Advance as of 1/1/2018: $0 4) Title XII Interest Owed for FY2017: $0
5) Total Title XII Advances Since 12/31/2007: $3,786,332,405 6) Max. Amount of Outstanding Advances: $2,025,964,295
7) Title XII Advances Per Cov. Employee: $0.00 8) Date of Maximum Outstanding Amount: 2/28/2010
9) Title XII Advances as % of Cov. Wages: 0.00% 10) Non Title XII Debt Issued Since 2010*: $2,669,665,000
11) Est. Amt. of Non-Title XII Debt Outstanding¹*:
State Trust Fund Solvency
12) Trust Fund Balance Compared to Yearly Benefit Costs
0.0 3.5
13) Solvency Level - Using Average High Cost Multiple²
0.0 2.5
Calculations of Federal Borrowing Statutes and FUTA Credit Reductions
Eligibility for Interest Free Borrowing in 2018
14) Last year in which State achieved a 0.9 Avg. High Cost Multiple3
: 1990
15) Lowest Percentage Avg. Tax rate is of the Previous 5 yr. Ben Cost Rate (>75% elig. Req.) 69%
16) Lowest Percentage Avg. Tax Rate is of the Previous Avg. Year's Tax Rate (>80% elig. Req.) 82%
FUTA Tax Rate
Credit Reduction Due
17) to Outstanding Loans Credit Reduction FUTA Tax Rate4
2016 0.0% 0.0% 0.6%
2017 0.0% 0.0% 0.6%
Potential 2018⁵ 0.0% 0.0% 0.6%
1. Estimated from original Bond issue information from: http://emma.msrb.org/
2. Average High Cost Multiple (AHCM) value- uses actual trust fund balances as of 12/31/2017 and estimated wages for CY2017. This measure
compares the state trust fund balance to the average of the three highest years of benefit payments.
3. Must occur in the last 5 years to be eligible for an interest free loan.
4. Represents the difference between total FUTA credit (with any reductions) and the FUTA tax rate of 6.0%.
5. Credit reductions apply only to states with outstanding loans as of January 1, 2018, and not repaid by November 10, 2018.
* Not Applicable
** Calculation using trust fund balance for this state does not include outstanding non Title XII borrowing amount.
Ineligible
2.7% Add-on BCR Add-on
Total
0.0% 0.00%
0.0% 0.00%
0.0% 0.00%
0.19**
0.16
0.40 0.85 0.99
Reserve Ratio
High 3 Yr. Avg.
Benefit Cost
Rate
2017 Benefit
Cost Rate
Highest Yr.
Benefit Cost Rate
50 State Pages

UTAH
State Trust Fund Status
1) UI Trust Fund Balance as of 1/1/2018: $1,077,211,363 2) Interest Earned for 2017: $23,341,337
3) Outstanding Title XII Advance as of 1/1/2018: $0 4) Title XII Interest Owed for FY2017: $0
5) Total Title XII Advances Since 12/31/2007: $0 6) Max. Amount of Outstanding Advances:
7) Title XII Advances Per Cov. Employee: $0.00 8) Date of Maximum Outstanding Amount:
9) Title XII Advances as % of Cov. Wages: 0.00% 10) Non Title XII Debt Issued Since 2010: $0
11) Est. Amt. of Non-Title XII Debt Outstanding¹: $0
State Trust Fund Solvency
12) Trust Fund Balance Compared to Yearly Benefit Costs
0.0 3.5
13) Solvency Level - Using Average High Cost Multiple²
0.0 2.5
Calculations of Federal Borrowing Statutes and FUTA Credit Reductions
Eligibility for Interest Free Borrowing in 2018
14) Last year in which State achieved a 0.9 Avg. High Cost Multiple3
: 2017
15) Lowest Percentage Avg. Tax rate is of the Previous 5 yr. Ben Cost Rate (>75% elig. Req.) N/A*
16) Lowest Percentage Avg. Tax Rate is of the Previous Avg. Year's Tax Rate (>80% elig. Req.) N/A*
FUTA Tax Rate
Credit Reduction Due
17) to Outstanding Loans Credit Reduction FUTA Tax Rate4
2016 0.0% 0.0% 0.6%
2017 0.0% 0.0% 0.6%
Potential 2018⁵ 0.0% 0.0% 0.6%
1. Estimated from original Bond issue information from: http://emma.msrb.org/
2. Average High Cost Multiple (AHCM) value- uses actual trust fund balances as of 12/31/2017 and estimated wages for CY2017. This measure
compares the state trust fund balance to the average of the three highest years of benefit payments.
3. Must occur in the last 5 years to be eligible for an interest free loan.
4. Represents the difference between total FUTA credit (with any reductions) and the FUTA tax rate of 6.0%.
5. Credit reductions apply only to states with outstanding loans as of January 1, 2018, and not repaid by November 10, 2018.
* Not Applicable
Eligible
2.7% Add-on BCR Add-on
Total
0.0% 0.00%
0.0% 0.00%
0.0% 0.00%
1.76
2.00
0.27 1.14 1.39
Reserve Ratio
High 3 Yr. Avg.
Benefit Cost Rate
2017 Benefit
Cost Rate
Highest Yr.
Benefit Cost Rate
51 State Pages

VIRGINIA
State Trust Fund Status
1) UI Trust Fund Balance as of 1/1/2018: $1,148,066,322 2) Interest Earned for 2017: $24,658,987
3) Outstanding Title XII Advance as of 1/1/2018: $0 4) Title XII Interest Owed for FY2017: $0
5) Total Title XII Advances Since 12/31/2007: $938,332,438 6) Max. Amount of Outstanding Advances: $487,555,000
7) Title XII Advances Per Cov. Employee: $0.00 8) Date of Maximum Outstanding Amount: 3/31/2011
9) Title XII Advances as % of Cov. Wages: 0.00% 10) Non Title XII Debt Issued Since 2010: $0
11) Est. Amt. of Non-Title XII Debt Outstanding¹: $0
State Trust Fund Solvency
12) Trust Fund Balance Compared to Yearly Benefit Costs
0.0 3.5
13) Solvency Level - Using Average High Cost Multiple²
0.0 2.5
Calculations of Federal Borrowing Statutes and FUTA Credit Reductions
Eligibility for Interest Free Borrowing in 2018
14) Last year in which State achieved a 0.9 Avg. High Cost Multiple3
: 2017
15) Lowest Percentage Avg. Tax rate is of the Previous 5 yr. Ben Cost Rate (>75% elig. Req.) N/A*
16) Lowest Percentage Avg. Tax Rate is of the Previous Avg. Year's Tax Rate (>80% elig. Req.) N/A*
FUTA Tax Rate
Credit Reduction Due
17) to Outstanding Loans Credit Reduction FUTA Tax Rate4
2016 0.0% 0.0% 0.6%
2017 0.0% 0.0% 0.6%
Potential 2018⁵ 0.0% 0.0% 0.6%
1. Estimated from original Bond issue information from: http://emma.msrb.org/
2. Average High Cost Multiple (AHCM) value- uses actual trust fund balances as of 12/31/2017 and estimated wages for CY2017. This measure
compares the state trust fund balance to the average of the three highest years of benefit payments.
3. Must occur in the last 5 years to be eligible for an interest free loan.
4. Represents the difference between total FUTA credit (with any reductions) and the FUTA tax rate of 6.0%.
5. Credit reductions apply only to states with outstanding loans as of January 1, 2018, and not repaid by November 10, 2018.
* Not Applicable
Eligible
2.7% Add-on BCR Add-on
Total
0.0% 0.00%
0.0% 0.00%
0.0% 0.00%
0.92
0.67
0.19 0.73 0.80
Reserve Ratio
High 3 Yr. Avg.
Benefit Cost Rate
2017 Benefit
Cost Rate
Highest Yr.
Benefit Cost Rate
52 State Pages

VIRGIN ISLANDS
State Trust Fund Status
1) UI Trust Fund Balance as of 1/1/2018: $372,688 2) Interest Earned for 2017: $0
3) Outstanding Title XII Advance as of 1/1/2018: $68,827,597 4) Title XII Interest Owed for FY2017: $1,492,658
5) Total Title XII Advances Since 12/31/2007: $93,415,666 6) Max. Amount of Outstanding Advances: $86,306,176
7) Title XII Advances Per Cov. Employee: $2,547.99 8) Date of Maximum Outstanding Amount: 1/31/2014
9) Title XII Advances as % of Cov. Wages: 6.99% 10) Non Title XII Debt Issued Since 2010: $0
11) Est. Amt. of Non-Title XII Debt Outstanding¹: $0
State Trust Fund Solvency
12) Trust Fund Balance Compared to Yearly Benefit Costs
0.0 3.5
13) Solvency Level - Using Average High Cost Multiple²
0.0 2.5
Calculations of Federal Borrowing Statutes and FUTA Credit Reductions
Eligibility for Interest Free Borrowing in 2018
14) Last year in which State achieved a 0.9 Avg. High Cost Multiple3
: 2006
15) Lowest Percentage Avg. Tax rate is of the Previous 5 yr. Ben Cost Rate (>75% elig. Req.) 39%
16) Lowest Percentage Avg. Tax Rate is of the Previous Avg. Year's Tax Rate (>80% elig. Req.) 55%
FUTA Tax Rate
Credit Reduction Due
17) to Outstanding Loans Credit Reduction FUTA Tax Rate4
2016 1.8% 0.0% 2.4%
2017 2.1% 0.0% 2.7%
Potential 2018⁵ 2.4% 0.0% 4.1%
1. Estimated from original Bond issue information from: http://emma.msrb.org/
2. Average High Cost Multiple (AHCM) value- uses actual trust fund balances as of 12/31/2017 and estimated wages for CY2017. This measure
compares the state trust fund balance to the average of the three highest years of benefit payments.
3. Must occur in the last 5 years to be eligible for an interest free loan.
4. Represents the difference between total FUTA credit (with any reductions) and the FUTA tax rate of 6.0%.
5. Credit reductions apply only to states with outstanding loans as of January 1, 2018, and not repaid by November 10, 2018.
* Not Applicable
Ineligible
2.7% Add-on BCR Add-on
Total
0.0% 1.80%
0.0% 2.10%
1.1% 3.50%
0.00
0.00
0.35 2.44 2.90
Reserve Ratio
High 3 Yr. Avg.
Benefit Cost Rate
2017 Benefit
Cost Rate
Highest Yr.
Benefit Cost Rate
53 State Pages

VERMONT
State Trust Fund Status
1) UI Trust Fund Balance as of 1/1/2018: $389,954,455 2) Interest Earned for 2017: $7,843,251
3) Outstanding Title XII Advance as of 1/1/2018: $0 4) Title XII Interest Owed for FY2017: $0
5) Total Title XII Advances Since 12/31/2007: $77,731,861 6) Max. Amount of Outstanding Advances: $77,731,861
7) Title XII Advances Per Cov. Employee: $0.00 8) Date of Maximum Outstanding Amount: 3/31/2011
9) Title XII Advances as % of Cov. Wages: 0.00% 10) Non Title XII Debt Issued Since 2010: $0
11) Est. Amt. of Non-Title XII Debt Outstanding¹: $0
State Trust Fund Solvency
12) Trust Fund Balance Compared to Yearly Benefit Costs
0.0 5
13) Solvency Level - Using Average High Cost Multiple²
0.0 2.5
Calculations of Federal Borrowing Statutes and FUTA Credit Reductions
Eligibility for Interest Free Borrowing in 2018
14) Last year in which State achieved a 0.9 Avg. High Cost Multiple3
: 2017
15) Lowest Percentage Avg. Tax rate is of the Previous 5 yr. Ben Cost Rate (>75% elig. Req.) N/A*
16) Lowest Percentage Avg. Tax Rate is of the Previous Avg. Year's Tax Rate (>80% elig. Req.) N/A*
FUTA Tax Rate
Credit Reduction Due
17) to Outstanding Loans Credit Reduction FUTA Tax Rate4
2016 0.0% 0.0% 0.6%
2017 0.0% 0.0% 0.6%
Potential 2018⁵ 0.0% 0.0% 0.6%
1. Estimated from original Bond issue information from: http://emma.msrb.org/
2. Average High Cost Multiple (AHCM) value- uses actual trust fund balances as of 12/31/2017 and estimated wages for CY2017. This measure
compares the state trust fund balance to the average of the three highest years of benefit payments.
3. Must occur in the last 5 years to be eligible for an interest free loan.
4. Represents the difference between total FUTA credit (with any reductions) and the FUTA tax rate of 6.0%.
5. Credit reductions apply only to states with outstanding loans as of January 1, 2018, and not repaid by November 10, 2018.
* Not Applicable
Eligible
2.7% Add-on BCR Add-on
Total
0.0% 0.00%
0.0% 0.00%
0.0% 0.00%
2.02
4.02
0.62 1.99 2.40
Reserve Ratio
High 3 Yr. Avg.
Benefit Cost Rate
2017 Benefit
Cost Rate
Highest Yr.
Benefit Cost Rate
54 State Pages

WASHINGTONState Trust Fund Status
1) UI Trust Fund Balance as of 1/1/2018: $4,374,067,086 2) Interest Earned for 2017: $95,095,663
3) Outstanding Title XII Advance as of 1/1/2018: $0 4) Title XII Interest Owed for FY2017: $0
5) Total Title XII Advances Since 12/31/2007: $0 6) Max. Amount of Outstanding Advances:
7) Title XII Advances Per Cov. Employee: $0.00 8) Date of Maximum Outstanding Amount:
9) Title XII Advances as % of Cov. Wages: 0.00% 10) Non Title XII Debt Issued Since 2010: $0
11) Est. Amt. of Non-Title XII Debt Outstanding¹: $0
State Trust Fund Solvency
12) Trust Fund Balance Compared to Yearly Benefit Costs
0.0 3.5
13) Solvency Level - Using Average High Cost Multiple²
0.0 2.5
Calculations of Federal Borrowing Statutes and FUTA Credit Reductions
Eligibility for Interest Free Borrowing in 2018
14) Last year in which State achieved a 0.9 Avg. High Cost Multiple3: 2017
15) Lowest Percentage Avg. Tax rate is of the Previous 5 yr. Ben Cost Rate (>75% elig. Req.) N/A*
16) Lowest Percentage Avg. Tax Rate is of the Previous Avg. Year's Tax Rate (>80% elig. Req.) N/A*
FUTA Tax Rate
Credit Reduction Due17) to Outstanding Loans Credit Reduction FUTA Tax Rate4
2016 0.0% 0.0% 0.6%
2017 0.0% 0.0% 0.6%
Potential 2018⁵ 0.0% 0.0% 0.6%
1. Estimated from original Bond issue information from: http://emma.msrb.org/2. Average High Cost Multiple (AHCM) value- uses actual trust fund balances as of 12/31/2017 and estimated wages for CY2017. This measure compares the state trust fund balance to the average of the three highest years of benefit payments.3. Must occur in the last 5 years to be eligible for an interest free loan.4. Represents the difference between total FUTA credit (with any reductions) and the FUTA tax rate of 6.0%.5. Credit reductions apply only to states with outstanding loans as of January 1, 2018, and not repaid by November 10, 2018.* Not Applicable
Eligible
2.7% Add-on BCR Add-onTotal
0.0% 0.00%
0.0% 0.00%
0.0% 0.00%
1.25
2.72
0.58 2.17 2.50
Reserve Ratio
High 3 Yr. Avg.Benefit Cost Rate
2017 BenefitCost Rate
Highest Yr. Benefit Cost Rate

WISCONSINState Trust Fund Status
1) UI Trust Fund Balance as of 1/1/2018: $1,479,554,224 2) Interest Earned for 2017: $29,729,533
3) Outstanding Title XII Advance as of 1/1/2018: $0 4) Title XII Interest Owed for FY2017: $0
5) Total Title XII Advances Since 12/31/2007: $4,911,365,648 6) Max. Amount of Outstanding Advances: $1,682,328,470
7) Title XII Advances Per Cov. Employee: $0.00 8) Date of Maximum Outstanding Amount: 3/31/2011
9) Title XII Advances as % of Cov. Wages: 0.00% 10) Non Title XII Debt Issued Since 2010: $0
11) Est. Amt. of Non-Title XII Debt Outstanding¹: $0
State Trust Fund Solvency
12) Trust Fund Balance Compared to Yearly Benefit Costs
0.0 3.5
13) Solvency Level - Using Average High Cost Multiple²
0.0 2.5
Calculations of Federal Borrowing Statutes and FUTA Credit Reductions
Eligibility for Interest Free Borrowing in 2018
14) Last year in which State achieved a 0.9 Avg. High Cost Multiple3: 2001
15) Lowest Percentage Avg. Tax rate is of the Previous 5 yr. Ben Cost Rate (>75% elig. Req.) 83%
16) Lowest Percentage Avg. Tax Rate is of the Previous Avg. Year's Tax Rate (>80% elig. Req.) 77%
FUTA Tax Rate
Credit Reduction Due17) to Outstanding Loans Credit Reduction FUTA Tax Rate4
2016 0.0% 0.0% 0.6%
2017 0.0% 0.0% 0.6%
Potential 2018⁵ 0.0% 0.0% 0.6%
1. Estimated from original Bond issue information from: http://emma.msrb.org/2. Average High Cost Multiple (AHCM) value- uses actual trust fund balances as of 12/31/2017 and estimated wages for CY2017. This measure compares the state trust fund balance to the average of the three highest years of benefit payments.3. Must occur in the last 5 years to be eligible for an interest free loan.4. Represents the difference between total FUTA credit (with any reductions) and the FUTA tax rate of 6.0%.5. Credit reductions apply only to states with outstanding loans as of January 1, 2018, and not repaid by November 10, 2018.* Not Applicable
Ineligible
2.7% Add-on BCR Add-onTotal
0.0% 0.00%
0.0% 0.00%
0.0% 0.00%
0.78
1.41
0.38 1.81 2.41
Reserve Ratio
High 3 Yr. Avg.Benefit Cost Rate
2017 BenefitCost Rate
Highest Yr. Benefit Cost Rate
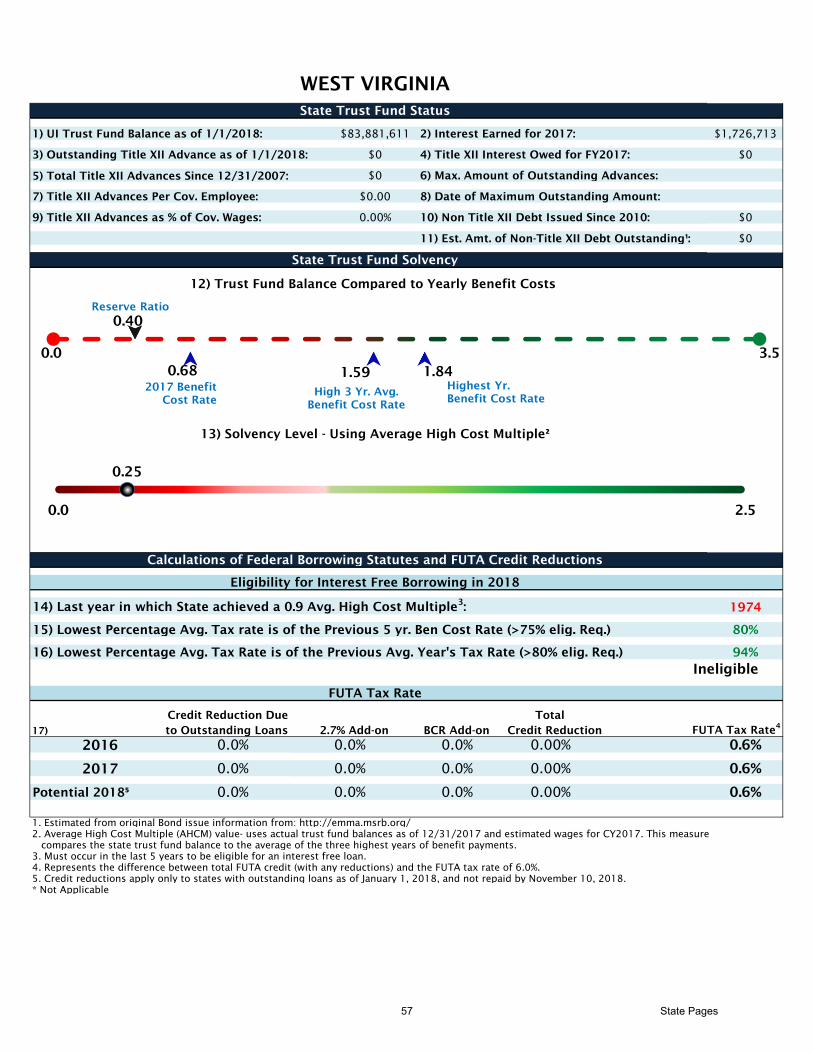
WEST VIRGINIA
State Trust Fund Status
1) UI Trust Fund Balance as of 1/1/2018: $83,881,611 2) Interest Earned for 2017: $1,726,713
3) Outstanding Title XII Advance as of 1/1/2018: $0 4) Title XII Interest Owed for FY2017: $0
5) Total Title XII Advances Since 12/31/2007: $0 6) Max. Amount of Outstanding Advances:
7) Title XII Advances Per Cov. Employee: $0.00 8) Date of Maximum Outstanding Amount:
9) Title XII Advances as % of Cov. Wages: 0.00% 10) Non Title XII Debt Issued Since 2010: $0
11) Est. Amt. of Non-Title XII Debt Outstanding¹: $0
State Trust Fund Solvency
12) Trust Fund Balance Compared to Yearly Benefit Costs
0.0 3.5
13) Solvency Level - Using Average High Cost Multiple²
0.0 2.5
Calculations of Federal Borrowing Statutes and FUTA Credit Reductions
Eligibility for Interest Free Borrowing in 2018
14) Last year in which State achieved a 0.9 Avg. High Cost Multiple3
: 1974
15) Lowest Percentage Avg. Tax rate is of the Previous 5 yr. Ben Cost Rate (>75% elig. Req.) 80%
16) Lowest Percentage Avg. Tax Rate is of the Previous Avg. Year's Tax Rate (>80% elig. Req.) 94%
FUTA Tax Rate
Credit Reduction Due
17) to Outstanding Loans Credit Reduction FUTA Tax Rate4
2016 0.0% 0.0% 0.6%
2017 0.0% 0.0% 0.6%
Potential 2018⁵ 0.0% 0.0% 0.6%
1. Estimated from original Bond issue information from: http://emma.msrb.org/
2. Average High Cost Multiple (AHCM) value- uses actual trust fund balances as of 12/31/2017 and estimated wages for CY2017. This measure
compares the state trust fund balance to the average of the three highest years of benefit payments.
3. Must occur in the last 5 years to be eligible for an interest free loan.
4. Represents the difference between total FUTA credit (with any reductions) and the FUTA tax rate of 6.0%.
5. Credit reductions apply only to states with outstanding loans as of January 1, 2018, and not repaid by November 10, 2018.
* Not Applicable
Ineligible
2.7% Add-on BCR Add-on
Total
0.0% 0.00%
0.0% 0.00%
0.0% 0.00%
0.25
0.40
0.68 1.59 1.84
Reserve Ratio
High 3 Yr. Avg.
Benefit Cost Rate
2017 Benefit
Cost Rate
Highest Yr.
Benefit Cost Rate
57 State Pages

WYOMING
State Trust Fund Status
1) UI Trust Fund Balance as of 1/1/2018: $304,237,595 2) Interest Earned for 2017: $6,602,001
3) Outstanding Title XII Advance as of 1/1/2018: $0 4) Title XII Interest Owed for FY2017: $0
5) Total Title XII Advances Since 12/31/2007: $0 6) Max. Amount of Outstanding Advances:
7) Title XII Advances Per Cov. Employee: $0.00 8) Date of Maximum Outstanding Amount:
9) Title XII Advances as % of Cov. Wages: 0.00% 10) Non Title XII Debt Issued Since 2010: $0
11) Est. Amt. of Non-Title XII Debt Outstanding¹: $0
State Trust Fund Solvency
12) Trust Fund Balance Compared to Yearly Benefit Costs
0.0 4.0
13) Solvency Level - Using Average High Cost Multiple²
0.0 2.5
Calculations of Federal Borrowing Statutes and FUTA Credit Reductions
Eligibility for Interest Free Borrowing in 2018
14) Last year in which State achieved a 0.9 Avg. High Cost Multiple3
: 2017
15) Lowest Percentage Avg. Tax rate is of the Previous 5 yr. Ben Cost Rate (>75% elig. Req.) N/A*
16) Lowest Percentage Avg. Tax Rate is of the Previous Avg. Year's Tax Rate (>80% elig. Req.) N/A*
FUTA Tax Rate
Credit Reduction Due
17) to Outstanding Loans Credit Reduction FUTA Tax Rate4
2016 0.0% 0.0% 0.6%
2017 0.0% 0.0% 0.6%
Potential 2018⁵ 0.0% 0.0% 0.6%
1. Estimated from original Bond issue information from: http://emma.msrb.org/
2. Average High Cost Multiple (AHCM) value- uses actual trust fund balances as of 12/31/2017 and estimated wages for CY2017. This measure
compares the state trust fund balance to the average of the three highest years of benefit payments.
3. Must occur in the last 5 years to be eligible for an interest free loan.
4. Represents the difference between total FUTA credit (with any reductions) and the FUTA tax rate of 6.0%.
5. Credit reductions apply only to states with outstanding loans as of January 1, 2018, and not repaid by November 10, 2018.
* Not Applicable
Eligible
2.7% Add-on BCR Add-on
Total
0.0% 0.00%
0.0% 0.00%
0.0% 0.00%
2.17
3.38
0.67 1.56 1.96
Reserve Ratio
High 3 Yr. Avg.
Benefit Cost Rate
2017 Benefit
Cost Rate
Highest Yr.
Benefit Cost Rate
58 State Pages
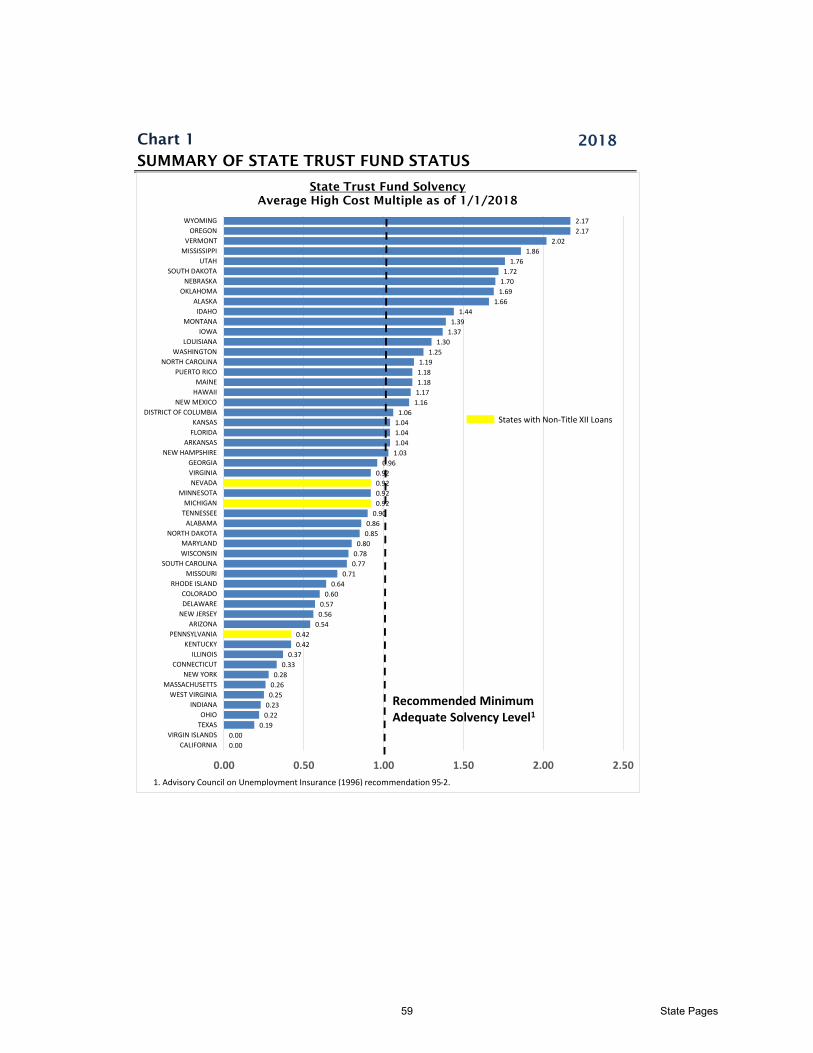
Chart 1 2018
SUMMARY OF STATE TRUST FUND STATUS
10
11
12
13
14
15
16
17
18
19
20
21
22
23
24
25
26
27
28
29
30
31
0.00
0.00
0.19
0.22
0.23
0.25
0.26
0.28
0.33
0.37
0.42
0.42
0.54
0.56
0.57
0.60
0.64
0.71
0.77
0.78
0.80
0.85
0.86
0.90
0.92
0.92
0.92
0.92
0.96
1.03
1.04
1.04
1.04
1.06
1.16
1.17
1.18
1.18
1.19
1.25
1.30
1.37
1.39
1.44
1.66
1.69
1.70
1.72
1.76
1.86
2.02
2.17
2.17
0.00 0.50 1.00 1.50 2.00 2.50
CALIFORNIA
VIRGIN ISLANDS
TEXAS
OHIO
INDIANA
WEST VIRGINIA
MASSACHUSETTS
NEW YORK
CONNECTICUT
ILLINOIS
KENTUCKY
PENNSYLVANIA
ARIZONA
NEW JERSEY
DELAWARE
COLORADO
RHODE ISLAND
MISSOURI
SOUTH CAROLINA
WISCONSIN
MARYLAND
NORTH DAKOTA
ALABAMA
TENNESSEE
MICHIGAN
MINNESOTA
NEVADA
VIRGINIA
GEORGIA
NEW HAMPSHIRE
ARKANSAS
FLORIDA
KANSAS
DISTRICT OF COLUMBIA
NEW MEXICO
HAWAII
MAINE
PUERTO RICO
NORTH CAROLINA
WASHINGTON
LOUISIANA
IOWA
MONTANA
IDAHO
ALASKA
OKLAHOMA
NEBRASKA
SOUTH DAKOTA
UTAH
MISSISSIPPI
VERMONT
OREGON
WYOMING
State Trust Fund Solvency
Average High Cost Multiple as of 1/1/2018
Recommended Minimum Adequate Solvency Level1
1. Advisory Council on Unemployment Insurance (1996) recommendation 95-2.
States with Non-Title XII Loans
59 State Pages

TABLE 1 2018
SUMMARY OF STATE ELIGIBILITY FOR INTEREST FREE ADVANCE
1 ALASKA 1 ALABAMA
2 ARKANSAS 2 ARIZONA
3 DISTRICT OF COLUMBIA 3 CALIFORNIA
4 FLORIDA 4 COLORADO
5 GEORGIA 5 CONNECTICUT
6 HAWAII 6 DELAWARE
7 IOWA 7 ILLINOIS
8 IDAHO 8 INDIANA
9 KANSAS 9 KENTUCKY
10 LOUISIANA 10 MASSACHUSETTS
11 MAINE 11 MARYLAND
12 MICHIGAN 12 MISSOURI
13 MINNESOTA 13 NEW JERSEY
14 MISSISSIPPI 14 NEW YORK
15 MONTANA 15 OHIO
16 NORTH CAROLINA 16 PENNSYLVANIA
17 NORTH DAKOTA 17 RHODE ISLAND
18 NEBRASKA 18 SOUTH CAROLINA
19 NEW HAMPSHIRE 19 TEXAS
20 NEW MEXICO 20 VIRGIN ISLANDS
21 NEVADA 21 WISCONSIN
22 OKLAHOMA 22 WEST VIRGINIA
23 OREGON
24 PUERTO RICO
25 SOUTH DAKOTA
26 TENNESSEE
27 UTAH
28 VIRGINIA
29 VERMONT
30 WASHINGTON
31 WYOMING
States Meeting Eligibility For Interest Free
Advances
States Not Meeting Eligibility For Interest
Free Advances
60 State Pages

TABLE 2 Potential 2018*
POTENTIAL FUTA CREDIT REDUCTIONS
BASIC 2.7 BCR TOTAL CREDIT
REDUCTION ADD-ON ADD-ON REDUCTION
ALASKA - - - - 0.6%
ALABAMA - - - - 0.6%
ARKANSAS - - - - 0.6%
ARIZONA - - - - 0.6%
CALIFORNIA 2.4% - - 2.4% 3.0%
COLORADO - - - - 0.6%
CONNECTICUT - - - - 0.6%
DISTRICT OF COLUMBIA - - - - 0.6%
DELAWARE - - - - 0.6%
FLORIDA - - - - 0.6%
GEORGIA - - - - 0.6%
HAWAII - - - - 0.6%
IOWA - - - - 0.6%
IDAHO - - - - 0.6%
ILLINOIS - - - - 0.6%
INDIANA - - - - 0.6%
KANSAS - - - - 0.6%
KENTUCKY - - - - 0.6%
LOUISIANA - - - - 0.6%
MASSACHUSETTS - - - - 0.6%
MARYLAND - - - - 0.6%
MAINE - - - - 0.6%
MICHIGAN - - - - 0.6%
MINNESOTA - - - - 0.6%
MISSOURI - - - - 0.6%
MISSISSIPPI - - - - 0.6%
MONTANA - - - - 0.6%
NORTH CAROLINA - - - - 0.6%
NORTH DAKOTA - - - - 0.6%
NEBRASKA - - - - 0.6%
NEW HAMPSHIRE - - - - 0.6%
NEW JERSEY - - - - 0.6%
NEW MEXICO - - - - 0.6%
NEVADA - - - - 0.6%
NEW YORK - - - - 0.6%
OHIO - - - - 0.6%
OKLAHOMA - - - - 0.6%
OREGON - - - - 0.6%
PENNSYLVANIA - - - - 0.6%
PUERTO RICO - - - - 0.6%
RHODE ISLAND - - - - 0.6%
SOUTH CAROLINA - - - - 0.6%
SOUTH DAKOTA - - - - 0.6%
TENNESSEE - - - - 0.6%
TEXAS - - - - 0.6%
UTAH - - - - 0.6%
VIRGINIA - - - - 0.6%
VIRGIN ISLANDS 2.4% - 1.1% 3.5% 4.1%
VERMONT - - - - 0.6%
WASHINGTON - - - - 0.6%
WISCONSIN - - - - 0.6%
WEST VIRGINIA - - - - 0.6%
WYOMING - - - - 0.6%
* Credit reductions apply only to states with outstanding loans as of January 1, 2018, and not repaid by November 10, 2018.
2018 Potential
FUTA Tax RateSTATE
POTENTIAL FUTA CREDIT REDUCTIONS
61 State Pages
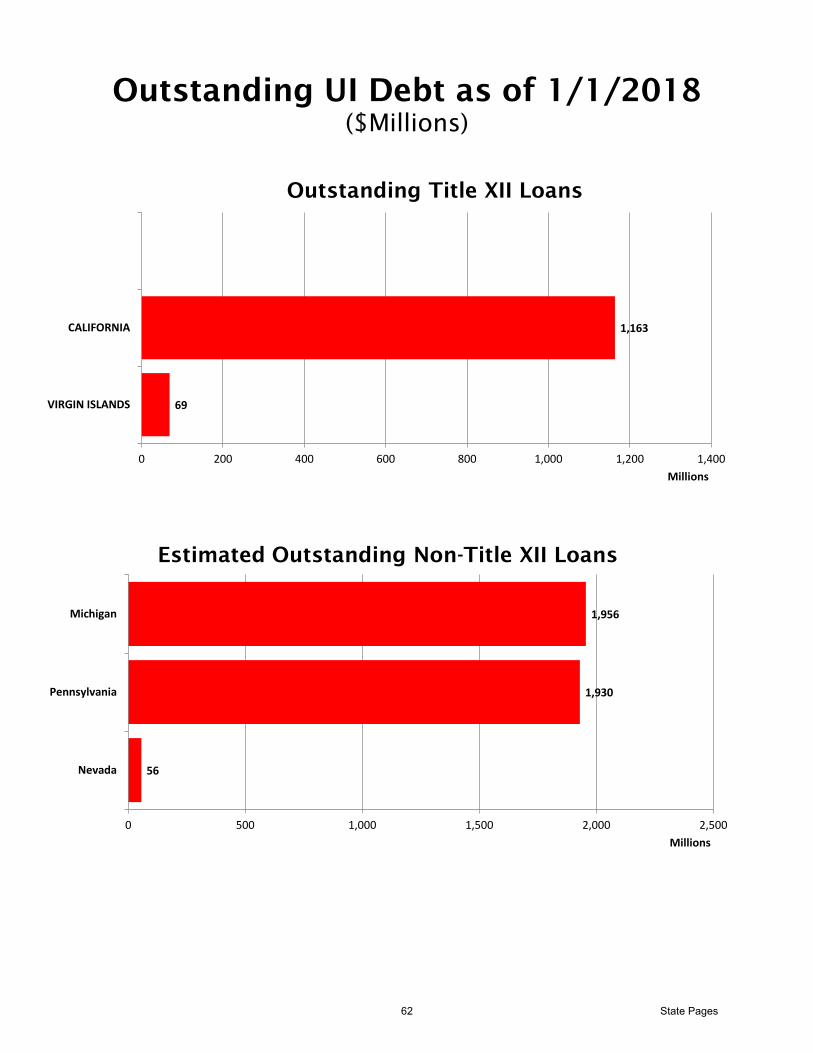
Outstanding UI Debt as of 1/1/2018
($Millions)
56
1,930
1,956
0 500 1,000 1,500 2,000 2,500
Nevada
Pennsylvania
Michigan
Millions
Estimated Outstanding Non-Title XII Loans
69
1,163
0 200 400 600 800 1,000 1,200 1,400
VIRGIN ISLANDS
CALIFORNIA
Millions
Outstanding Title XII Loans
62 State Pages
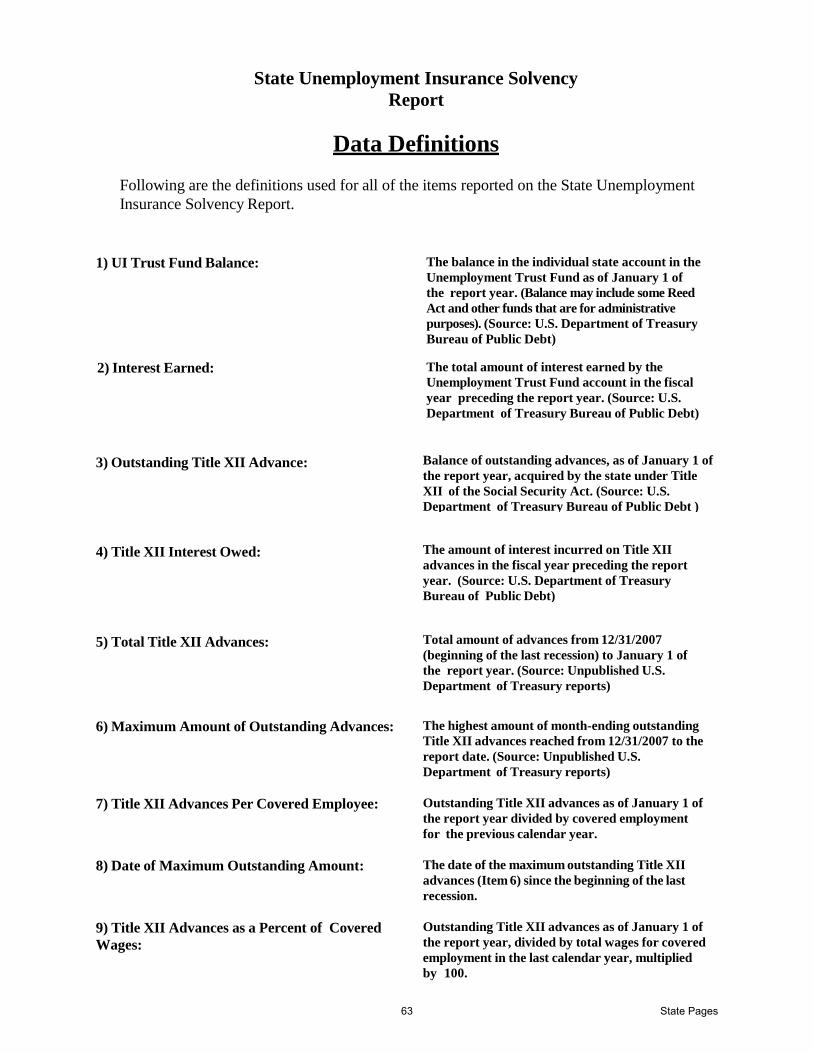
State Unemployment Insurance Solvency
Report
Data Definitions
Following are the definitions used for all of the items reported on the State Unemployment
Insurance Solvency Report.
1) UI Trust Fund Balance: The balance in the individual state account in the
Unemployment Trust Fund as of January 1 of
the report year. (Balance may include some Reed
Act and other funds that are for administrative
purposes). (Source: U.S. Department of Treasury
Bureau of Public Debt)
.
2) Interest Earned: The total amount of interest earned by the
Unemployment Trust Fund account in the fiscal
year preceding the report year. (Source: U.S.
Department of Treasury Bureau of Public Debt)
3) Outstanding Title XII Advance:
Balance of outstanding advances, as of January 1 of
the report year, acquired by the state under Title
XII of the Social Security Act. (Source: U.S.
Department of Treasury Bureau of Public Debt )
4) Title XII Interest Owed:
The amount of interest incurred on Title XII
advances in the fiscal year preceding the report
year. (Source: U.S. Department of Treasury
Bureau of Public Debt)
5) Total Title XII Advances:
Total amount of advances from 12/31/2007
(beginning of the last recession) to January 1 of
the report year. (Source: Unpublished U.S.
Department of Treasury reports)
6) Maximum Amount of Outstanding Advances:
The highest amount of month-ending outstanding
Title XII advances reached from 12/31/2007 to the
report date. (Source: Unpublished U.S.
Department of Treasury reports)
7) Title XII Advances Per Covered Employee: Outstanding Title XII advances as of January 1 of
the report year divided by covered employment
for the previous calendar year.
8) Date of Maximum Outstanding Amount: The date of the maximum outstanding Title XII
advances (Item 6) since the beginning of the last
recession.
9) Title XII Advances as a Percent of Covered
Wages:
Outstanding Title XII advances as of January 1 of
the report year, divided by total wages for covered
employment in the last calendar year, multiplied
by 100.
63 State Pages
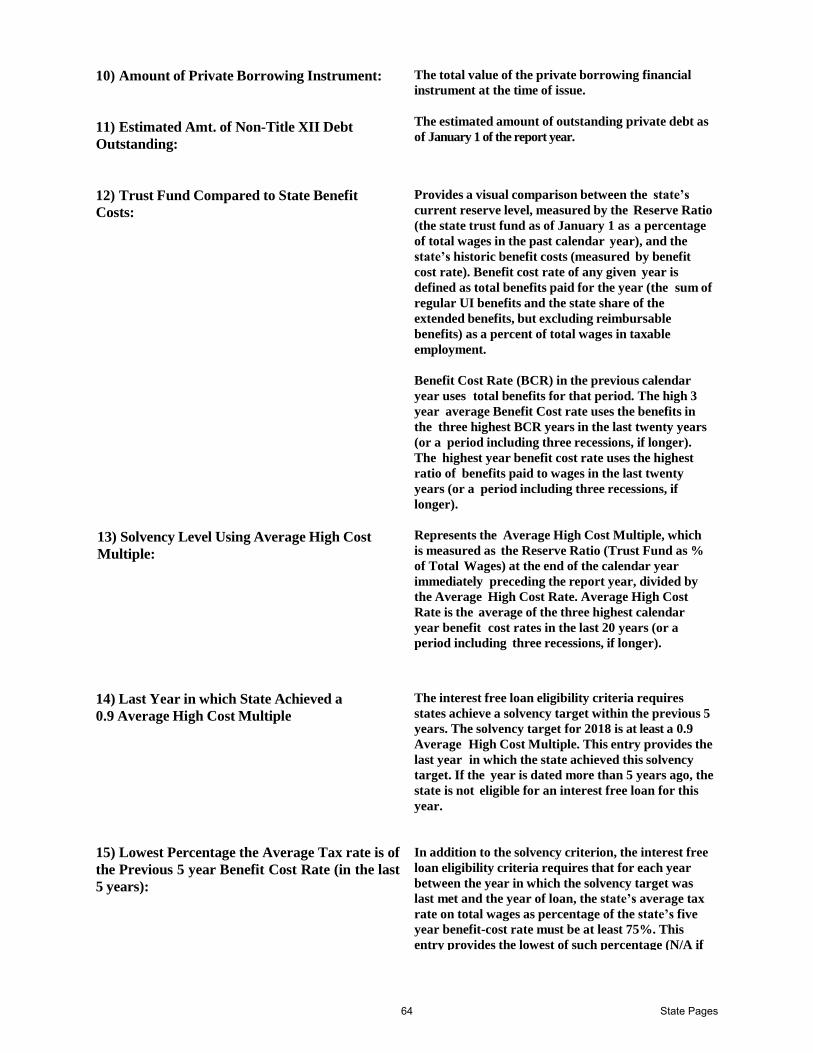
10) Amount of Private Borrowing Instrument:
11) Estimated Amt. of Non-Title XII Debt
Outstanding:
The total value of the private borrowing financial
instrument at the time of issue.
The estimated amount of outstanding private debt as
of January 1 of the report year.
12) Trust Fund Compared to State Benefit
Costs:
13) Solvency Level Using Average High Cost
Multiple:
Provides a visual comparison between the state’s
current reserve level, measured by the Reserve Ratio
(the state trust fund as of January 1 as a percentage
of total wages in the past calendar year), and the
state’s historic benefit costs (measured by benefit
cost rate). Benefit cost rate of any given year is
defined as total benefits paid for the year (the sum of
regular UI benefits and the state share of the
extended benefits, but excluding reimbursable
benefits) as a percent of total wages in taxable
employment.
Benefit Cost Rate (BCR) in the previous calendar
year uses total benefits for that period. The high 3
year average Benefit Cost rate uses the benefits in
the three highest BCR years in the last twenty years
(or a period including three recessions, if longer).
The highest year benefit cost rate uses the highest
ratio of benefits paid to wages in the last twenty
years (or a period including three recessions, if
longer).
Represents the Average High Cost Multiple, which
is measured as the Reserve Ratio (Trust Fund as %
of Total Wages) at the end of the calendar year
immediately preceding the report year, divided by
the Average High Cost Rate. Average High Cost
Rate is the average of the three highest calendar
year benefit cost rates in the last 20 years (or a
period including three recessions, if longer).
14) Last Year in which State Achieved a
0.9 Average High Cost Multiple
15) Lowest Percentage the Average Tax rate is of
the Previous 5 year Benefit Cost Rate (in the last
5 years):
The interest free loan eligibility criteria requires
states achieve a solvency target within the previous 5
years. The solvency target for 2018 is at least a 0.9
Average High Cost Multiple. This entry provides the
last year in which the state achieved this solvency
target. If the year is dated more than 5 years ago, the
state is not eligible for an interest free loan for this
year.
In addition to the solvency criterion, the interest free
loan eligibility criteria requires that for each year
between the year in which the solvency target was
last met and the year of loan, the state’s average tax
rate on total wages as percentage of the state’s five
year benefit-cost rate must be at least 75%. This
entry provides the lowest of such percentage (N/A if
64 State Pages

the solvency target was last met more than 5 years
ago). If this value is N/A or below 75%, the state is
not eligible for an interest free loan.
16) Lowest Percentage the Average Tax Rate is
of the Previous Average Year's Tax Rate (in the
last 5 years):
The interest free loan eligibility criteria also requires
that for each year between the year in which the
solvency target was last met and the year of loan, the
state’s average tax rate on total wages as percentage
of the state’s previous year’s average tax rate must
be at least 80%. This entry provides the lowest of
such percentage (N/A if the solvency target was last
met more than 5 years ago). If this value is N/A or
below 80%, the state is not eligible for an interest
free loan.
17) FUTA Tax Rate
17a) FUTA Credit Reduction
17b) 2.7 Add-on Credit Reduction:
17c) Benefit Cost Rate Add-on Credit
Reduction:
The Federal Unemployment Tax Act of the Internal
Revenue Code stipulates that the full FUTA tax rate
is 6.0%, levied on the first $7000 of an employee’s
earnings. States in full compliance with federal
requirements will receive a credit of 5.4% against the
FUTA tax.
When a state has an outstanding loan balance on
January 1st
for two or more consecutive years, and
the full amount of the loan is not repaid by November
10 of the second year, the FUTA credit will be
reduced until the loan is repaid. The basic reduction
schedule consists of a 0.3% annual increment in credit
loss.
If a state has an outstanding loan balance on January
1st
for three or more consecutive years, and the full
amount of the loan is not repaid by November 10 of
the tax year, then from the third year on, an
add-on may apply in the amount the state’s average
tax rate on total wages is below a threshold defined
by 2.7% x 7,000/ (U.S. Avg. Annual Wage).
If a state has an outstanding loan balance on January
1st
for five or more consecutive years, and the full
amount of the loan is not repaid by November 10 of
the tax year, then from the fifth year on, a Benefit
Cost Rate (BCR) add-on may apply if the state’s
average tax rate on taxable wages is lower than its 5
year benefit cost rate (or 2.7%, whichever is higher).
The amount of the BCR add-on is derived by taking
the average of the previous five years of total benefits
paid, ending on the second prior year, divided by the
total taxable wages in the previous calendar year.
From this number, or 2.7% (whichever is higher), is
subtracted the average tax rate on taxable wages
(total contributions in the past year divided by total
taxable wages as defined above). The difference is the
BCR add-on amount for the specified year.
65 State Pages

17d) Total Credit Reduction
17e) Final FUTA Tax Rate
The sum of the basic credit reduction amount and the
add-on credit reduction amount.
The final FUTA credit a state receives is the full
credit amount (5.4%) minus the total credit
reduction. The difference between the full FUTA tax
rate (currently 6.0%) and the final credit is the
actual FUTA tax rate for the state.
66 State Pages