state-stewardship theory and executive...
TRANSCRIPT
1
State-Stewardship Theory and Executive Compensation
Hao LIANG a 1 Luc RENNEBOOG a
Sunny Li SUN b
a CentER, Tilburg University b Bloch School of Management, University of Missouri
ABSTRACT
We propose a state-stewardship theory competing with the traditional agency theory to explain the
corporate governance model and executive compensation policy in China. Under China’s highly
politically-oriented institutional environment, Chinese managers (business elites) are not just professional
managers but also government officials (political elites) directly appointed – even in ‘private’ firms – by the
state. Consequently, they do not face inherent conflicts of interest with the state, but are expected to act as
responsible ‘stewards’ of the state. This state-steward relationship is amplified when more state-owned shares
are sold to the market. We test the state-stewardship theory on all non-financial listed firms in China for the
period 2001 to 2011. Consistent with our conjectures, we find that Chinese managers are paid much less than
their international counterparts and that remuneration is lower in firms with larger state-ownership or stronger
(ultimate) state-control. Also, Chinese managers seem to be remunerated not for maximizing equity value but
for increasing the value of the state-owned assets. The board of directors only plays a symbolic role; it does
not have much influence in terms of advice or supervision and does not seem to regulate managerial pay.
Managerial duality does not seem to grant the general manager more power in influencing his own
remuneration. Furthermore, managers’ remuneration is not linked to competence and personal traits, but rather
to their political connections and prestige, and to the contribution that their firms make to the local, regional,
or national (macro-)economic targets and hence the (local) officials’ political achievements. Most of the above
effects are stronger in the pre-2006 period, because after the split-share reform of 2006, companies became
more market-oriented though state influence still prevails. The results remain robust when we control for
endogeneity, measurement errors, outlier effects, and sector and regional differences.
Keywords: State-stewardship theory, agency theory, executive compensation, political connections.
JEL Code: G34, H70, M12, P26, P31
Acknowledgements: We thank Thorsten Beck, Fabio Braggion, Marco Da Rin, Joost Driessen, Olivier de
Jonghe, Wayne Guay, Xu Lang, Dwight Perkins, Henriette Prast, Bing Ren, Oliver Spalt, Dylan Sutherland,
Francisco Urzua Infante, Yuhai Xuan, and the seminar and conference participants at Harvard Kennedy School,
London School of Economics, Copenhagen Business School, CESifo Venice Summer Institute, Peking University,
Tsinghua University, Nankai University, and Tilburg University for their valuable comments. Special thanks to
Bing Ren at Nankai University for providing data on Chinese directors’ interlocking network to us. We are also
grateful to Yan Wang, Ying Zheng, Haoyu Wu, and Haikun Zhu for the excellent research assistant work.
1 Hao Liang (Corresponding author) CentER Graduate School, Tilburg University, P.O.Box 90153, 5000 LE Tilburg, the Netherlands, [email protected]; Luc Renneboog, [email protected]; Sunny Li Sun: [email protected]
2
State-Stewardship Theory and Executive Compensation
“The key to getting the China story right is to recognize the existence of two Chinas – an entrepreneurial rural
China and a state-controlled urban China.”
Yasheng Huang (MIT Sloan): Capitalism with Chinese
Characteristics: Entrepreneurship and the State (2008). Cambridge
University Press: Cambridge.
I. Introduction
In 2010, Jiangling Motors, one of China’s biggest commercial vehicle companies, achieved sales
revenues of over $2.5 billion following strong growth. Its CEO, York Chen, received an annual total
compensation of $375,000, at par with his 2009 pay (but higher than that of any other CEO in this
sector). In marked contrast, Dieters Zetsche, the CEO of the European automobile giant Daimler AG,
earned €8.7 million euro ($12 million), twice his pay in 2009 and more than 30 times Chen’s salary. This
discrepancy in pay is even larger when one considers Ford ’s CEO Allan Mulally, who received $26.5
million in 2010, 48% more than 2009 (Bloomberg, April 1, 2011). The above example is not a unique case.
Conyon and He (2011) document that the executive pay (salary and bonus) of US top managers is about
seventeen times higher than that in China, even after controlling for economic and governance factors.
When stock options and equity compensation are considered, the difference augments to approximately
42 times.
Why do such huge differences in remuneration between China and the US (and Europe and Japan)
exist? Why are Chinese top managers who lead large, internationally diversified firms that also operate in
western economies willing to accept a comparatively slim income? Can we apply the western
compensation models to developing countries and economies with strong state involvement?
The majority of the extant literature resorts to agency theory to explain executive compensation
policies (e.g., Jensen and Murphy, 1990; Garen, 1994; Core, Holthausen, and Larcker, 1999). The interests
of the managers (the agent) and shareholders (the principal) can be in conflict, and agency problems may
arise if managers abuse their power, for instance, by awarding themselves generous pay packages neither
justified by high managerial skills nor related to a meaningful contribution to the firm’s performance.
Consequently, the compensation scheme should be designed in such a way as to elicit effort from the
management while avoiding the above conflicts of interest (Bebchuk and Fried, 2004; Jensen, Murphy,
and Wruck, 2004). However, is this agency logic valid for emerging economies? The answer is negative
because in countries in political and institutional transition such as China, the state and the political
authorities own significant equity stakes (and their political influence extends beyond ownership). The
3
use of non-cash compensation is very rare and, if it is used at all, disclosure is incomplete, but perquisite
consumption may be more prevalent (Adithipyangkul, Alon, and Zhang, 2011).2 Business activities are
heavily influenced by the government and other political powers through the government’s deliberate
policy to transfer resources, as well as the vast presence of government ownership and political
connection of firms. In Russia, for example, politically-connected firms represent over 85 percent of the
market capitalization (Shleifer, 1998; Faccio, 2006). It is reasonable to believe that such strong political
influence on business activities results in relatively less market-based managerial compensation schemes.
Several papers have examined executive compensation in China (e.g., Firth, Fung, and Rui, 2006;
Chen, Liu, and Li, 2010; Conyon and He, 2011; Chen, Ezzamel, and Cai, 2011), but their focus was
mainly on testing western corporate governance theories in the Chinese context. These include agency
theory which propounds a pay-performance sensitivity analysis (Murphy, 1985), and the managerial
power conjectures (Bebchuk, Fried, and Walker, 2002; Grabke-Rundell and Gomez-Mejia, 2002) which
argue that managers’ influence enables them to extract rents through excessive pay. Unsurprisingly, the
validity of the agency theory in Chinese business is weak. An alternative theoretical framework
incorporating the broader political and institutional determinants of China’s corporate governance
system is lacking. It is also important to take an evolutionary perspective as significant shifts of state
powers in the economy and businesses have arisen over the last decade. Therefore, in the context of
remuneration contracting in China, two main research questions emerge: (1) What roles (other than
‘agents’) do managers play and how are they remunerated? (2) How do such roles and remuneration
evolve over time?
In this paper, we confirm that the level and structure of Chinese executive compensation does not
tie in with the traditional principal-agent relationship in which the manager’s compensation is linked to
equity-based returns (stock returns, return on equity, Tobin’s Q, etc). The low remuneration of Chinese
managers (relative to their international peers) is prevalent in firms with stronger state control, and when
self-dealing opportunities are larger. Managers are also rewarded more for maximizing the value of
state-owned assets (rather than for maximizing shareholder value). Furthermore, their remuneration is
not closely linked to ability or personality, but to their political connections and prestige, as well as to their
firms’ contribution to the local officials’ political goals. All these effects have evolved over time, whereby
especially the major privatization effort of 2006 (the split-share structure reform) has had a big impact on
the roles of managers and their remuneration contracts. In our analysis, we control for potential
endogeneity issues, measurement errors, outlier effects, and we distinguish between state-owned
enterprises (SOEs) and so-called ‘private’ companies by regional development.
2 Stock options were rarely used before 2008, and even subsequently, merely 5% of listed companies report the use of stock options to remunerate their managers.
4
Our work makes the following contributions. First, as the traditional agency theory is not able to
explain the level, composition, and evolution of executive compensation in China (e.g., Firth et al. , 2006,
2007; Conyon and He, 2011), we focus on state influence and managers’ political connections and
formulate a state-stewardship theory for Chinese corporations. This institutional perspective has
stronger explanatory power as it incorporates the organizing principle, incentive structures, and
enforcement mechanism of firms and managers within China’s authoritarian political system after the
economic reform and incomplete privatization. Second, we take an evolutionary perspective to study
how the Chinese state controls the economy - by means of ownership stakes and stewardship relations
with the 2006 split-share reform as a watershed. Such evolution also implies a shift of wealth from the
state (the government) to the nation (the private citizens), while the authoritarian state still maintains
tight control over (corporate) employees (Xu, 2011). Third, the state-manager relationship has broader
implications for China’s economic and political development. Economic reform without reforming the
human resources policies at the executive level enables the autocratic state to exert political power on
corporate decision making, so as to ensure that firms’ business activities fulfill the state’s political
objectives. Therefore, this study also has some welfare implications.
The rest of this paper proceeds as follows. Section II discusses China’s institutional background and
the typical characteristics of Chinese corporate governance and executive compensation practices.
Embedded in this institutional background, Section III develops the state-stewardship theory and its
building blocks. Section IV develops five sets of testable conjectures, and Section IV describes the data
and outlines the empirical model. Section VI provides the empirical results and robustness checks.
Section VII concludes with a discussion on the relationship between the state-elites and private citizens
under our state-stewardship theory.
II. Institutional Background
2.1. Privatization and the split-share structure reform
China adopted the former Soviet Union’s socialist ideology and turned into a centralized command
economy ruled by the Communist Party in 1949. All firms were state-owned, with production and
operations strictly following state orders. When China started its economic reform in 1978, one of the
key elements was the privatization (or ‘corporatization’ (Clarke, 2003)) of the formerly state-owned
enterprises. Two stock exchanges, in Shanghai and Shenzhen, were established in 1990. Listed companies
became increasingly accountable to shareholders (in addition to the state). The managerial resource
allocation system has been improved since the modern industrial and corporate reforms were initiated in
1978 and continued throughout the 1980s and 1990s (Groves, Hong, McMillan, and Naughton, 1994,
5
1995). Initially a dual share structure was established for all listed companies: approximately two-thirds
of domestically listed shares (A-shares) were not tradable on the market and were usually owned by the
government and state agencies, which hindered the privatization process considerably. In April 2005
(effective from 2006), the Chinese government initiated the split-share structure reform of turning
non-tradable shares into tradable ones (called the share issue privatization (SIP)) for all listed domestic
firms. More than 1,400 listed companies could ‘gradually’ convert their tradable shares3. Holders of
non-tradable shares4 compensated holders of tradable shares in each individual firm for about three
shares per 10 shares on average so as to make the non-tradable shares tradable through negotiated
compensation plans which differed from firm to firm. All Chinese listed companies completed their
negotiations by the end of 2008, and all of their restricted shares became fully tradable by the end of
2011. Even after the split-share structural reform, the state is still playing a major role in regulating
companies’ strategic-decision making, developing corporate governance regulation, and setting executive
compensation schemes through retaining the executive-level employees as state-appointees, maintaining
a stake in privatized firms, and supervision through the China Securities Regulatory Commission (CSRC).
In many firms, especially those within the electronic, automobile manufacturing, steel, natural resource
exploitation and extraction industries, the state has kept majority control and foreign share stakes are
restricted; the managers, the board’s chairperson, the political secretary of the firm (the Communist
Party representative), and other managers are usually directly appointed by the state. As a consequence,
corporate governance and executive compensation contracting in China’s state-oriented economy exhibit
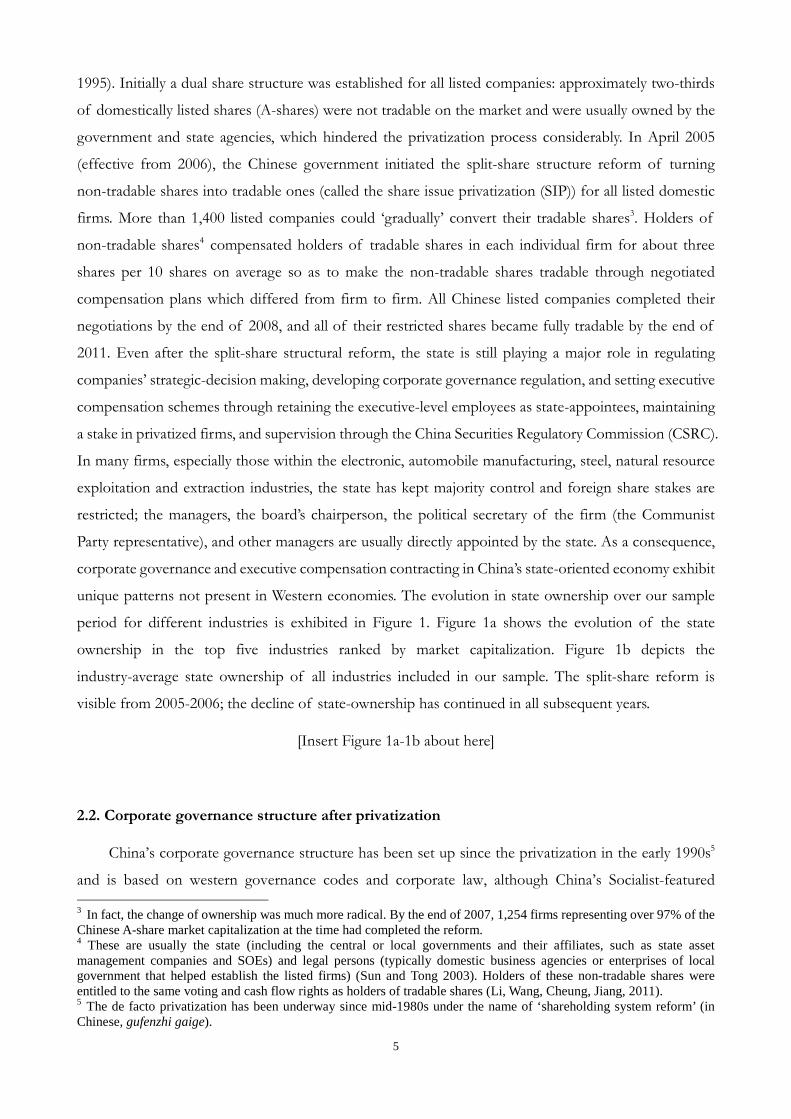
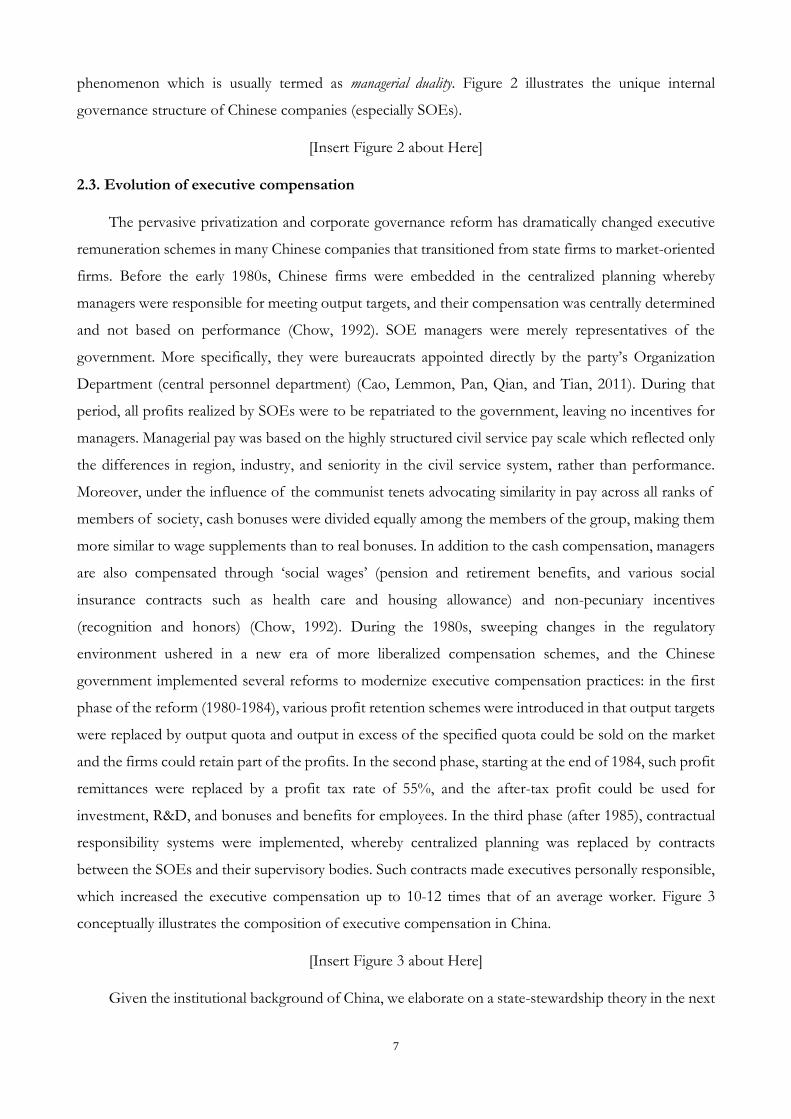
unique patterns not present in Western economies. The evolution in state ownership over our sample
period for different industries is exhibited in Figure 1. Figure 1a shows the evolution of the state
ownership in the top five industries ranked by market capitalization. Figure 1b depicts the
industry-average state ownership of all industries included in our sample. The split-share reform is
visible from 2005-2006; the decline of state-ownership has continued in all subsequent years.
[Insert Figure 1a-1b about here]
2.2. Corporate governance structure after privatization
China’s corporate governance structure has been set up since the privatization in the early 1990s5
and is based on western governance codes and corporate law, although China’s Socialist-featured 3 In fact, the change of ownership was much more radical. By the end of 2007, 1,254 firms representing over 97% of the Chinese A-share market capitalization at the time had completed the reform. 4 These are usually the state (including the central or local governments and their affiliates, such as state asset management companies and SOEs) and legal persons (typically domestic business agencies or enterprises of local government that helped establish the listed firms) (Sun and Tong 2003). Holders of these non-tradable shares were entitled to the same voting and cash flow rights as holders of tradable shares (Li, Wang, Cheung, Jiang, 2011). 5 The de facto privatization has been underway since mid-1980s under the name of ‘shareholding system reform’ (in Chinese, gufenzhi gaige).

6
company law and related codes (in particular, the CSRC Codes) comprise some singularities. For instance,
the Chinese corporate board structure combines some aspects of the Anglo-American one-tier board
model and the German two-tier one. In general, executive directors and non-executive directors of US
and UK firms man one organizational body which is chaired by the CEO (as is frequently the case in the
US) or not (in the UK). Such one-tier boards also comprise audit, remuneration and nomination
committees. In contrast, firms from German legal origin countries such as Austria, Germany, and Japan,
separate the executive and supervisory boards (the latter then only consists of non-executive directors
with advisory and monitoring roles who represent shareholders and employees). China’s board structure
is loosely based on the two-tier structure, but in practice more like a muddled one-tier Anglo-American
board (IIF, 2006) whereby the board6 (i) consists of several independent directors (CSRC requires the
independent director ratio of the board to be above 1/3), (ii) is the main decision-making authority
within the firm, and (iii) oversees and aids management practice. In practice, the Chinese supervisory
board has only a symbolic function and hence does not play an effective governance role (Tam, 2002;
Tenev and Zhang, 2002). Since the bureaucrats (e.g. the party committee) in charge of the company
nominate and remove directors and supervisors alike, the supervisory board members have little say in
the major corporate decisions.
Moreover, there are significant differences in board structure between SOEs and private companies
in China. Most SOEs are directly (or ultimately) controlled by the central government under China’s
State-owned Assets Supervision and Administration Commission of the State Council (SASAC), and
enjoy monopoly power in certain industries such as energy and telecommunication. Other SOEs are
controlled by local government under the local SASAC. In both types of SOEs, the dominant
shareholder is the state, and their boards of directors usually consist of members directly appointed by
the central or local government to serve on e.g. the strategy committee (which makes the strategic
investment and development decisions) or the compensation committee. At the same level with the
board of directors are a supervisory board and a representative Party committee led by the Party secretary
who ensures the ideological influence over the board and the entire firm.7 It is clear that this board(s)
structure can lead to confusion and induce some ambiguity about the board member duties (Financial
Times, April 2, 2008). The counterpart of the Western CEO of a Chinese SOE is usually called ‘general
manager’ who does not own shares of the company. In many cases, especially in large SOEs, the
functions of general manager (CEO) and chairperson of the board are combined by one person, a
6 Henceforth, when we mention the ‘board’, we refer to the board of directors consisting of both executive and non-executive directors, but not the supervisory board. 7 The main difference and connections between the supervisory board and the party committee is that the supervisory board is usually chaired by an employee representative from the All China Federation of Trade Unions (China’s only government-sanctioned union), and among the other board members is typically an official from the company’s internal party committee and at least one other person elected by shareholders. Company directors and other senior managers are not allowed to sit on the board of supervisors.
7
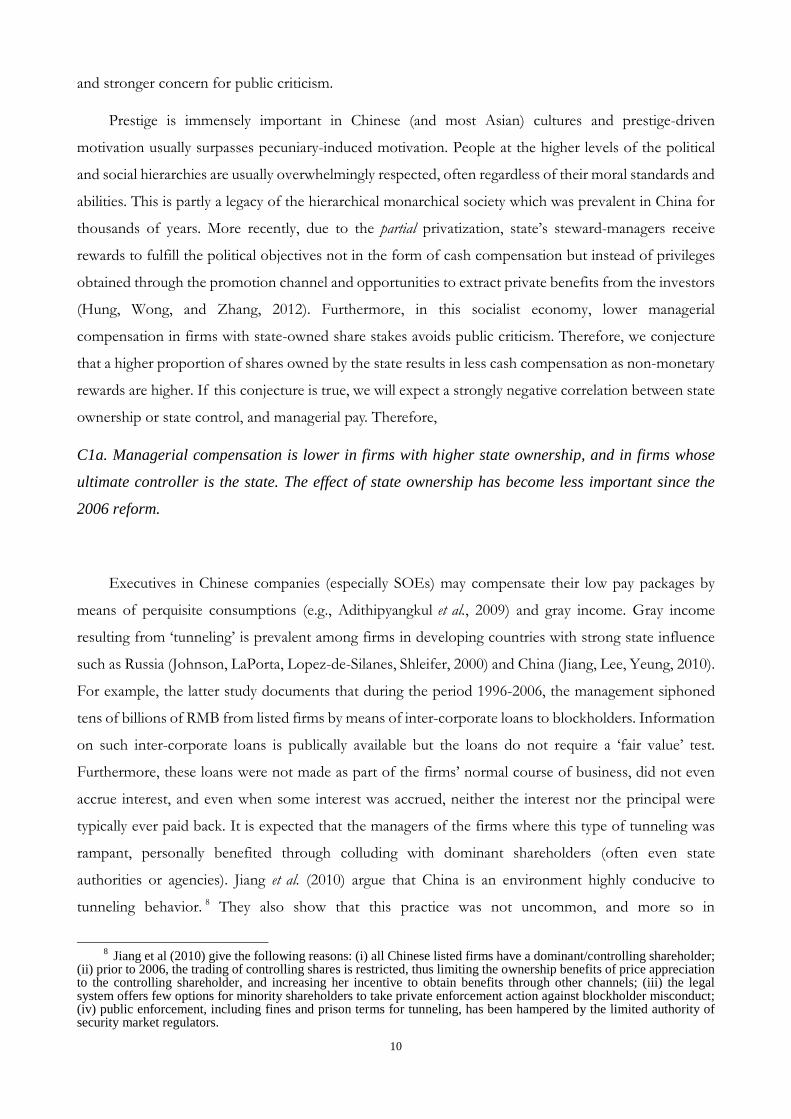
phenomenon which is usually termed as managerial duality. Figure 2 illustrates the unique internal
governance structure of Chinese companies (especially SOEs).
[Insert Figure 2 about Here]
2.3. Evolution of executive compensation
The pervasive privatization and corporate governance reform has dramatically changed executive
remuneration schemes in many Chinese companies that transitioned from state firms to market-oriented
firms. Before the early 1980s, Chinese firms were embedded in the centralized planning whereby
managers were responsible for meeting output targets, and their compensation was centrally determined
and not based on performance (Chow, 1992). SOE managers were merely representatives of the
government. More specifically, they were bureaucrats appointed directly by the party’s Organization
Department (central personnel department) (Cao, Lemmon, Pan, Qian, and Tian, 2011). During that
period, all profits realized by SOEs were to be repatriated to the government, leaving no incentives for
managers. Managerial pay was based on the highly structured civil service pay scale which reflected only
the differences in region, industry, and seniority in the civil service system, rather than performance.
Moreover, under the influence of the communist tenets advocating similarity in pay across all ranks of
members of society, cash bonuses were divided equally among the members of the group, making them
more similar to wage supplements than to real bonuses. In addition to the cash compensation, managers
are also compensated through ‘social wages’ (pension and retirement benefits, and various social
insurance contracts such as health care and housing allowance) and non-pecuniary incentives
(recognition and honors) (Chow, 1992). During the 1980s, sweeping changes in the regulatory
environment ushered in a new era of more liberalized compensation schemes, and the Chinese
government implemented several reforms to modernize executive compensation practices: in the first
phase of the reform (1980-1984), various profit retention schemes were introduced in that output targets
were replaced by output quota and output in excess of the specified quota could be sold on the market
and the firms could retain part of the profits. In the second phase, starting at the end of 1984, such profit
remittances were replaced by a profit tax rate of 55%, and the after-tax profit could be used for
investment, R&D, and bonuses and benefits for employees. In the third phase (after 1985), contractual
responsibility systems were implemented, whereby centralized planning was replaced by contracts
between the SOEs and their supervisory bodies. Such contracts made executives personally responsible,
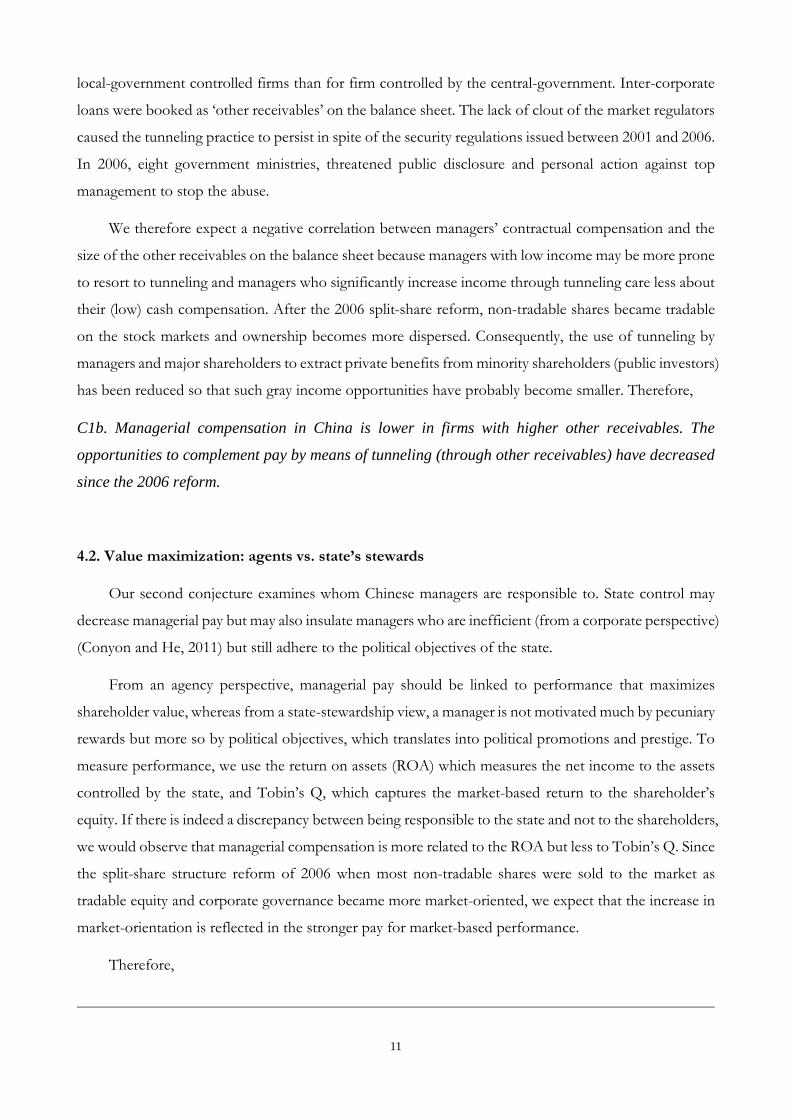
which increased the executive compensation up to 10-12 times that of an average worker. Figure 3
conceptually illustrates the composition of executive compensation in China.
[Insert Figure 3 about Here]
Given the institutional background of China, we elaborate on a state-stewardship theory in the next

8
section to explain the determinants and evolution of remuneration of China’s corporate executives.
III. A State-stewardship Theory for China
Since the ground-breaking work by Donaldson and Davis (1991), scholars have resorted to the
stewardship theory of management as a basis for managers’ and shareholders’ philosophical alignment.
This theory, a sociological and psychological approach to governance, hinges on the assumption that
executives feel a strong sense of attachment to and psychological ownership of their firm, and hence are
more likely to behave as stewards. This perspective stands in marked contrast with agency theory in
which managers are assumed to act in their own interest at the expense of shareholders. Higher levels of
‘psychic income’ (Gimeno, Folta, Cooper, and Woo, 1997) should make such ‘organizationally centered’
executives (Davis, Schoorman, and Donaldson 1997: 25) accept lower cash compensation to continue
working in the organization. In the economics and finance literature, the stewardship theory has never
been regarded as a valid alternative to agency theory, has not lead to practical managerial decision rules,
and has gained little empirical support. However, we adjust this stewardship concept to the Chinese
context, and use this term to describe the fact that in principle Chinese managers are (required to be)
accountable to the state. Chinese managers are usually appointed by the state, and maintain close political
connections with the government. As a result they actually act like the stewards of the state, and work
towards fulfilling both the economic objectives of the firm and the political ones of the state. We
illustrate this state-stewardship concept from three angles: (a) the organizing principles of the company,
(b) the incentive structures of the manager, and (c) the enforcement mechanisms imposed by the state.
(a) In terms of the organizing principle, the state is involved in every level of activity of the firm,
both political and economical. The political organizing principle requires that firms’ business
activities be fundamentally state-driven, be aligned with goals such as safeguarding the political
power/social demand, and be conform to the ideological requirements. The economic
organizing principle requires that firms’ business activities achieve economic growth in
state-related sectors’ and maintain some degree of monopoly power in some ‘national strategic
industries’.
(b) The incentive structures for state-appointed (or state-influenced) managers are based on a
political cadre promotion system with different hierarchical levels. Each level of the cadre is
equipped with different set of benefits, but by nature, all are entitled as government officers to
enjoy miscellaneous political and economic types of rewards. For instance, under the career
promotion system, a manager who wants to secure his job and ensure promotion has to show
loyalty to the party.

9
(c) The enforcement mechanisms rely on the coercive power of the state to punish the stewards
when they violate the state’s will or when their behavior and performance are perceived as
unsatisfactory. The punishment comprises lowering a SOE manager’s rank (seniority) in the
civil service hierarchy or removing a manager from his political cadre position. Moreover, the
government regularly rotates its officers and state-appointed managers between political and
corporate positions to make sure that they are absolutely loyal to the government (the party).
This state-stewardship concept is not static but has evolved over the past 2 decades. The massive
privatization has reformed the ownership of Chinese enterprises, transiting from entirely state-owned to
semi-state owned or privately owned, especially after the split-share structure reform. Correspondingly,
the form of control by the Communist-Party-led state has transited from pure state-ownership to
state-stewardship. We argue that the reforms only privatized the ownership structure and composition
but did not really reform the human resources policies at the managerial level. To maintain its control
legitimacy, the state boosts the economy through privatization (which leads to more efficient allocation of
resources and improves production efficiency), and controls the economy through maintaining its
stewardship system within firms to carry out its political objectives. Table 1 shows a comparison between
these two major types of control exerted by China’s state, in terms of their representative periods, control
methods, governance models, and managerial incentive structures.
[Insert Table 1 about Here]
Within this state-stewardship framework, we develop five testable conjectures in the next section.
IV. Conjectures
4.1. State control, gray income, and executive compensation
Our first set of conjectures explores this question: What drives the managerial compensation in China?
(Or why is Chinese compensation so low?) We have seen above that the state puts more emphasis on
political and macroeconomic objectives rather than on firm profitability. Consequently, a manager’s
incentive structure may be geared towards the former objectives. As state’s stewards, Chinese managers
face the threat of punishment for lack of political loyalty (dismissal) but also are offered lower firm-based
pecuniary rewards, and lower pay-for-corporate performance. The prevailing presence of state
ownership and state control in Chinese firms is the legacy of China’s incomplete privatization. Especially
for the largest companies and companies in key industries such as oil and telecommunication, the state
wants to retain its absolute control in ‘national strategic industries’ (‘retain the large’). Higher state
ownership is usually associated with various non-pecuniary benefits for the management such as higher
prestige, stronger political cadre promotion incentives, but also with stronger coercive state influence,
10
and stronger concern for public criticism.
Prestige is immensely important in Chinese (and most Asian) cultures and prestige-driven
motivation usually surpasses pecuniary-induced motivation. People at the higher levels of the political
and social hierarchies are usually overwhelmingly respected, often regardless of their moral standards and
abilities. This is partly a legacy of the hierarchical monarchical society which was prevalent in China for
thousands of years. More recently, due to the partial privatization, state’s steward-managers receive
rewards to fulfill the political objectives not in the form of cash compensation but instead of privileges
obtained through the promotion channel and opportunities to extract private benefits from the investors
(Hung, Wong, and Zhang, 2012). Furthermore, in this socialist economy, lower managerial
compensation in firms with state-owned share stakes avoids public criticism. Therefore, we conjecture
that a higher proportion of shares owned by the state results in less cash compensation as non-monetary
rewards are higher. If this conjecture is true, we will expect a strongly negative correlation between state
ownership or state control, and managerial pay. Therefore,
C1a. Managerial compensation is lower in firms with higher state ownership, and in firms whose
ultimate controller is the state. The effect of state ownership has become less important since the
2006 reform.
Executives in Chinese companies (especially SOEs) may compensate their low pay packages by
means of perquisite consumptions (e.g., Adithipyangkul et al., 2009) and gray income. Gray income
resulting from ‘tunneling’ is prevalent among firms in developing countries with strong state influence
such as Russia (Johnson, LaPorta, Lopez-de-Silanes, Shleifer, 2000) and China (Jiang, Lee, Yeung, 2010).
For example, the latter study documents that during the period 1996-2006, the management siphoned
tens of billions of RMB from listed firms by means of inter-corporate loans to blockholders. Information
on such inter-corporate loans is publically available but the loans do not require a ‘fair value’ test.
Furthermore, these loans were not made as part of the firms’ normal course of business, did not even
accrue interest, and even when some interest was accrued, neither the interest nor the principal were
typically ever paid back. It is expected that the managers of the firms where this type of tunneling was
rampant, personally benefited through colluding with dominant shareholders (often even state
authorities or agencies). Jiang et al. (2010) argue that China is an environment highly conducive to
tunneling behavior. 8 They also show that this practice was not uncommon, and more so in
8 Jiang et al (2010) give the following reasons: (i) all Chinese listed firms have a dominant/controlling shareholder;
(ii) prior to 2006, the trading of controlling shares is restricted, thus limiting the ownership benefits of price appreciation to the controlling shareholder, and increasing her incentive to obtain benefits through other channels; (iii) the legal system offers few options for minority shareholders to take private enforcement action against blockholder misconduct; (iv) public enforcement, including fines and prison terms for tunneling, has been hampered by the limited authority of security market regulators.
11
local-government controlled firms than for firm controlled by the central-government. Inter-corporate
loans were booked as ‘other receivables’ on the balance sheet. The lack of clout of the market regulators
caused the tunneling practice to persist in spite of the security regulations issued between 2001 and 2006.
In 2006, eight government ministries, threatened public disclosure and personal action against top
management to stop the abuse.
We therefore expect a negative correlation between managers’ contractual compensation and the
size of the other receivables on the balance sheet because managers with low income may be more prone
to resort to tunneling and managers who significantly increase income through tunneling care less about
their (low) cash compensation. After the 2006 split-share reform, non-tradable shares became tradable
on the stock markets and ownership becomes more dispersed. Consequently, the use of tunneling by
managers and major shareholders to extract private benefits from minority shareholders (public investors)
has been reduced so that such gray income opportunities have probably become smaller. Therefore,
C1b. Managerial compensation in China is lower in firms with higher other receivables. The
opportunities to complement pay by means of tunneling (through other receivables) have decreased
since the 2006 reform.
4.2. Value maximization: agents vs. state’s stewards
Our second conjecture examines whom Chinese managers are responsible to. State control may
decrease managerial pay but may also insulate managers who are inefficient (from a corporate perspective)
(Conyon and He, 2011) but still adhere to the political objectives of the state.
From an agency perspective, managerial pay should be linked to performance that maximizes
shareholder value, whereas from a state-stewardship view, a manager is not motivated much by pecuniary
rewards but more so by political objectives, which translates into political promotions and prestige. To
measure performance, we use the return on assets (ROA) which measures the net income to the assets
controlled by the state, and Tobin’s Q, which captures the market-based return to the shareholder’s
equity. If there is indeed a discrepancy between being responsible to the state and not to the shareholders,
we would observe that managerial compensation is more related to the ROA but less to Tobin’s Q. Since
the split-share structure reform of 2006 when most non-tradable shares were sold to the market as
tradable equity and corporate governance became more market-oriented, we expect that the increase in
market-orientation is reflected in the stronger pay for market-based performance.
Therefore,
12
C2. The managerial compensation in China is significantly positively correlated with the return
on assets, but not with the market-based return (e.g., Tobin’s Q) in the pre-2006 period. In the
subsequent period, we expect that the former relation is attenuated and that pay is significantly
positively related to the market-based return.
4.3. Political connections and managerial backgrounds
If corporate performance in China is a benchmark of lesser importance for managerial pay, what are
the main corporate characteristics and managerial traits that are related to higher remuneration? Let us
first examine whether pay is related to a manager’s personality, ability, and political-connections. If the
state-stewardship concept is valid, we expect managers not to be rewarded for their real abilities to
generate financial returns, but to their connectedness to the state and politicians, and to their degree of
compliance to the state order. China is notable for being an environment where friendly connections
with government officials can pave the way through a bureaucratic labyrinth (Wall Street Journal, September
6, 2011), even easing access to capital that is scarce for pure private-sector enterprises (Fan, Wong, and
Zhang, 2007). Furthermore, a political background increases one’s prestige in China. Managers of listed
firms who are politically connected are perceived to belong to both the business and political elites which
reflects their achievements and level in the social hierarchy of the Chinese society. Therefore, one could
conjecture that managers are paid in line with their hierarchical status. As the direct ownership stakes in
the hands of the state have decreased since the (partial) privatization, the importance of state control
through political connections has increased, which may be reflected in higher pay for connectedness
(especially since 2006).
C3a. Politically connected managers receive higher compensation. This relation is stronger in
the post-2006 period.
Under the rule of the communism tenets, the state and its stewards may window-dress their
relationship in order to prevent public criticism. They may appease the public by setting relatively higher
compensation for some easily observable managerial traits, such as degrees from prestigious universities
or academic scholarship. These factors contribute to one’s prestige in China which has a long history and
tradition (Confucianism) of respecting knowledge and intellectuals. Moreover, in the light of China’s
lagging intellectual and educational development in the modern history (the past 60 years), Chinese hold
people who have been educated at foreign top universities or have worked overseas in high esteem.
Obviously, academic and international experience is not just a factor of prestige, it will also increase
Chinese executives’ abilities to manage state assets and generate more benefits for the state as their
13
responsible stewards. We distinguish between prestige and ability variables by also testing whether
experience in specialized fields (technology, finance, accounting) is priced in the manager’s
remuneration.
We classify the managerial characteristics according to three dimensions: the prestige, ability, and
personal dimensions in order to explore which types of characteristics account for higher compensation.
Prestige increases for managers with Political Experience, with International Work Experience, with Overseas
Education, with Academic Experience, with a higher Educational Degree. Ability is captured by Accounting
Experience, Financial Experience, Technological Experience. The personal dimension is determined by Gender,
Nationality, Age (which also proxies for seniority and entrenchment within the firm). Based on our above
discussion, we expect that managerial pay significantly positively correlates to a manager’s political and
prestige dimensions, but less so to ability and personal characteristics. Therefore,
C3b. Managerial compensation is significantly positively related to the manager’s ‘prestige’,
mirrored by international work experience, overseas education, or academic background.
4.4. The role of internal corporate governance
Our fourth set of conjectures looks into the internal corporate governance mechanisms (mainly the
structure of the board) that could regulate managerial compensation. An effective board structure could
alleviate moral hazard problems and reduce agency costs (Rosenstein and Wyatt, 1990). The
effectiveness of the board structure (especially in monitoring managers) should be stronger when firms
become more market-oriented, and executive compensation could consequently be driven more towards
the Western pay-for-performance model.
For China, we question the effectiveness of board structures in relation to regulating managerial
compensation. Some studies suggest that as China’s corporate governance gradually converges to the
Western market-based model, especially since the issuance of the 2002 CSRC Code which requires the
presence of more independent directors and the separation of management and supervision. Since then,
board structure should play a stronger role in aligning managerial pay to firm performance (e.g., Conyon
and He, 2011; Cao et al., 2011). However, the blending of the Anglo-Saxon model and the German model
of corporate governance actually dilutes the effectiveness of the independent directors and the
supervisory board and duplicates administrative costs. IIF (2006) reports that independent directors have
little leeway to influence corporate strategy in China. Furthermore, as is the case with the nomination of
managers, directors are also usually selected by the government and many of them have political
connections. In this sense, they are also stewards of the state, and share the same interests as (‘collude’
with) the managers instead of monitoring them.
14
In this light, setting up modern board structures may just be an example of window dressing, as the
boards do not function to effectively monitor managers. For instance, the setting up of compensation
and strategy committees is voluntary, and firms do so mainly to appease public investors. The state has
little incentive to implement a real corporate governance reform leading to firms’ independence from the
state. The reforms should therefore be seen as ‘window dressing’. We therefore expect not to see any
significant relation between board characteristics (such as the ratio of independent directors and the use
of board committees) on the one hand, and compensation on the other.
C4a. Managerial compensation is only significantly related to ‘window-dressing’ features of board
structures such as setting up a compensation committee.
Managerial duality whereby the manager is also the chairman of the board, and in some cases, even
the secretary of the party committee, is still prevalent in Chinese corporations9. In an agency framework,
managerial duality creates conflicts of interests as the manager is put in a position where he has to
evaluate and monitor his own performance.10 Given that most managers who hold dual positions in
China usually also have significant political stakes and aligned interests with the state as its stewards, it is
not likely that they would put their own political fate at risk. Since the 2006 reform, the state has
decreased its ownership stakes significantly but still exerts control more through controlling executive
employees. The state relies more on appointing (re)liable managers, and such liability becomes
particularly important when the manager holds a duality position. Therefore, managerial duality should
be more positively related to managerial compensation in the post-2006 period. We conjecture that:
C4b. Managerial compensation in China is less related to managerial duality in the pre-2006 period,
but subsequently becomes more positively significantly related to managerial duality.
4.5. Link with local political achievements
Our final conjecture deals with the macroeconomic determinants of managerial compensation, as
the political dimension is based on issues beyond the individual and firm level. The organizing principles
9 A good example of this managerial duality is the General Manager of PetroChina Jiang Jiemin, who served as the Deputy Provincial Governor of the Qinghai Province and the deputy secretary of the province during 2000-2003. He has been the General Manager of CNPC, the chairman, the president and the party secretary of PetroChina all at the same time, and he is also an alternate member of the 17th CPC Central Committee. However, Jiang’s compensation was not high: according to Reuters, Jiang’s 2010 compensation was only RMB 916,000 yuan (approximately $140,000). 10 For example, Core, Holthausen, and Larcker (1999) provide empirical evidence that managerial duality is associated with significantly higher managerial compensation.

15
of the state require that firms’ business activities should be fundamentally state-driven, and be conform
to the ideological requirements. Macroeconomic performance at the regional level is an important
political indicator of how well local politicians are doing in terms of reaching the political goals of the
state and the government(s). Following this logic, our state-stewardship theory argues that managerial
compensation also reflects those political goals (in Chinese: Zheng Ji). We focus on three major
political/economic goals that the Chinese government cares about most: GDP growth, employment, and
inward foreign direct investment. More precisely, as the executives in the local state-controlled firms are
usually selected by the local provincial officers who control huge amounts of resources and enjoy broad
autonomies (Xu, 2011), or have closer connections and aligned interests with the local government, their
compensation should be positively correlated with the local provincial GDP growth and employment.
To test the link between managerial compensation and macroeconomic factors, we use the gross
domestic product (GDP), the total employment of the local province where the firm is headquartered,
and the number of employees hired by the firm, as measures of how the managers as state’s stewards
fulfill the local governors’ political aims. Prior to 2006, inward FDI (attracting foreign capital and
obtaining technological knowhow) was emphasized in the national economic strategy, but subsequently
GDP growth was stressed, also as a consequence of the global economic crisis. It should be noted that
the political priorities differ across regions, for instance, the eastern coastal provinces with their high
level of economic development versus the inner continental provinces (northern and western regions)
with lower level of development. The more developed regions have been the engines of China’s
economic growth, and there the local governors’ priorities hinge on GDP growth, whereas in less
developed regions, attracting foreign direct investment to upgrade the industrial structure is the focus.
Therefore we conjecture that,
C5. Managerial compensation is positively related to the local macroeconomic (political)
achievement indicators such as growth in GDP, inward FDI, and corporate employment.
We control for province-fixed-effects to capture those unobserved macroeconomic factors such as local
income, local property prices, local population growth, social safety net, as well as other geographical and
demographical factors.
V. Data and Descriptive Statistics
Data
We test our conjectures on firms listed on the Shanghai and Shenzhen exchanges11. We collect our
11 We exclude Chinese firms listed in Hong Kong or abroad as they operate in a different institutional environment and are subject to different regulations.

16
data from the Wind Database, CSMAR, and Peking University’s China Center for Economic Research
(CCER) database, which comprise all A-share companies12 listed on the above exchanges since 1990.
Financial and operational data, along with information about industry classification, location of
headquarters (city and province) are collected from Wind. Information on executive compensation,
stock ownership, corporate governance, and board structure are gathered from CSMAR, and
information on the ultimate shareholders’ names is from CCER. In addition, we manually collected the
variables capturing CEOs’ characteristics and backgrounds from their curricula published on Wind and
CSMAR. To supplement the managerial background data, we collect the profiles from the annual reports,
more specifically from the ‘Profile of Directors and Senior Managers’ sections that comprise the
manager’s name, gender, education, academic and professional background, and career history. The
dataset consists of 17,272 firm-year observations covering more than 92% of all listed firms in mainland
China over the period 2001 to 2011. We excluded the financial and insurance companies, and the firms
labeled by the stock exchanges as Special Treatment (ST). The latter are firms in financial distress or
experiencing financial difficulties (e.g. negative net earnings for two consecutive years) as defined by
CSRC. We follow the Industry Classification Guide of Listed Companies issued by CSRC in April 2001 to
partition our sample firms into 21 industries. Table 2 summarizes the variable definitions, Table 3
exhibits the summary statistics on the main variables, and Table 4 comprises of the correlation matrix.
[Insert Tables 2-4 about Here]
Methodology
We estimate the determinants of managerial pay using fixed effects models as the Hausman tests
suggest this estimation techniques given that the covariates are not uncorrelated with the unobserved
firm effects. As some of key independent variables are time-invariant (e.g. managers’ personal
background), we also estimate random effect models. The dependent variable is top managerial pay,
which is defined as the logarithm of the total compensation of the top three highest-paid top managers as
there is no transparency requirement at the individual manager or director level. Our independent
variables comprise firm performance (ROA, Tobin’s Q), macro-economic factors (the natural logarithm
of the local province’s annual GDP, of the annual inward foreign direct investment, and of corporate
employment13), state-ownership and state-control (shares owned by the state, and the dummy variable
indicating whether the ultimate controller of the firm is the state), board structure (independent director
ratio, the existence of a compensation committee and of a strategy committee, CEO-chairman duality,
top management team size, board size), political connections, managerial backgrounds (education,
12 A-shares are stocks valued in RMB and available only to Chinese citizens; B-shares are also denominated in RMB but traded in such foreign currencies (USD or Hong Kong dollar). 13 As both the macro(-economic) variables and the dependent variables are in natural logarithms, the beta coefficient also measures the effects of change of these variables, since the first-order approximation of its Taylor serial is its growth rate.

17
international experience) and ability (specialized experience). We control for industry, year and province
fixed effects. We cluster standard errors at the firm level to further adjust for correlation of unobserved
characteristics across firms.
Endogeneity is potentially an issue as there may be reverse causality between managerial pay and
firm performance. Such endogeneity problems may be especially severe in a Western context where
managers receive a significant amount of their total compensation in the form of stock options or
restricted stock, and it’s hard to unbundle the short-term and long-term financial incentives. However,
this is much less of a concern in the case of China because equity-based compensation is rare, and
executive compensation packages are produced bureaucratically, with weak links to share price (Buck, Liu,
and Skovoroda, 2008). There has been no tradition of (marked-oriented) pay-for-performance for
individual executives owing to the Chinese national culture with high collectivism and high
power-distance tolerance. We still address this endogeneity issue by implementing an instrument variable
approach as a robustness check on our results.
VI. Results and Discussion
6.1. Benchmark results
It is important not just to test the state-stewardship for the whole sample period but to distinguish
between the periods before and after the regulatory structural break of 2006 (the split-share reform) and
study the economic transition patterns. To examine the impact of the state on top managerial
compensation, we estimate the regression including the degree of state-ownership and of state control,
Provincial Economic Performance predictors (Ln(Local GDP) and Ln(Inward FDI))14 (for definitions, see
Table 2). A first important observation is that state ownership has a significantly negative impact on
managerial pay for the full sample (full sample in Table 5), but this relation only occurs for the pre-2006
period when a 1% increase in state ownership results in an average 0.225% decrease in the managerial pay,
ceteris paribus. That entails that, for instance, a 30% higher percentage of state ownership drives down the
managerial compensation by about 7%. This supports Conjecture 1a in that managers in more
state-oriented companies receive a lower pecuniary remuneration, especially when the state control is
strong (through direct ownership). This effect disappears from 2006 when the state significantly reduced
its (non-tradable) share stakes and direct state control became weaker.
Jiang et al. (2010) suggest that high other receivables represent inter-company loans to firms of
blockholders. As the use of this type of loans has been shown to be an aspect of tunneling, managers of
14 We do not include both Ln(Local GDP) and Ln(Inward FDI) in the same regression equation in order to avoid multicollinearity (their correlation is above 80%).

18
firms with high other receivables are suspected of self-dealing and hence may care less about their regular
cash income. Other receivables are always significantly negative in Table 5 (for the full and pre-2006
samples), which supports conjecture C1b and indicates that gray income and cash compensation are to
some extent substitutes. The fact that the negative relation is not statistically significant in the more
recent years implies that tunneling by managers (along with dominant shareholders) is no longer (or less)
prevalent and that the government crackdown on this type of self-dealing has been successful (and/or
that other channels have been found for tunneling).
We document a strong relation between firm performance and managerial compensation (Table 5).
For the full sample, the economic significance of the coefficient of ROA (12.5% [2.3%×5.44]) is four
times bigger than that of Tobin’s Q (3.15% [1.4%×2.25]) which implies that the accounting performance
is more important than the market-based benchmark. A more detailed analysis reveals that ROA is only
positively significant in the pre-2006 sample whereas both the accounting and market-based measures are
significant for the post-2006 sample. This provides some support for conjectures C2a and C2b in that the
managerial compensation depends on accounting returns, but only since 2006 also on the market-based
return, which is conform with China’s move towards a more market-based economy.
Managers with political experience receive a higher remuneration, and this relation between pay and
the political background is stronger in the post-reform period. Managers with a political background
received 4.5% more compensation prior to 2006, but this increased to 5% post 2006 (a difference which
is statistically significantly different but economically small)15. This echoes – although only weakly – Xu’s
(2011) claim on the government’s control over executive personnel: stronger political ties are reflected in
higher executive compensation. These findings fail to reject Conjectures 3a.
Next, we relate the top managers’ ‘prestige’, which is captured by their international work
experience, overseas education, educational level, academic background, to their remuneration. We find
that international work experience is rewarded (and even increasingly so), certainly for reasons of prestige
in the home country, but possibly also because this type of experience may bring valuable expertise to the
company. It should be noted that since Chinese firms turned more market-oriented, international
exposure is rewarded more16 (Table 5) but top management’s specialized expertise in finance, accounting,
or technology is not priced. We also observe that managers with a higher level of education, overseas
education, or an academic (university) background receive higher pay. From a human capital view,
specialized expertise, international experience, and education could all contribute to managers’
competence, but in China, only those factors with a strong connotation to prestige are priced in
15 We generate a dummy variable indicating whether the observation belongs to the post-2006 sample (or not), and an interaction term between this dummy variable and the “manager political” variable. We then test whether the coefficients of these variables are jointly zero. The F-test rejects the null hypothesis that they are jointly zero, implying the coefficients of “manager political” in the pre-2006 and post-2006 samples are statistically significantly different. 16 An F-test on difference in impact of manager’s political experience across sample subperiods is statistically different.
19
managerial remuneration. This result gives some support our C3b, and is reinforced by Chinese culture in
which prestige factors play a prominent role. As managerial pay is strongly related to prestige factors, but
less to ability factors, one could call the Chinese remuneration policy as a window-dressing corporate
governance practice with as aim to cherry pick managers who are loyal to the state. We also control for
age, which is strongly positively related to compensation, and gender which has a negative (but not
statistically significant) impact.
Regarding the internal corporate governance structure, we find that the proportion of independent
directors does not have an impact on compensation implying that independent directors are not effective
in regulating managerial pay. The larger the size of the board and of the management team (which is not
part of the board see Figure 2 and has a low correlation with board size), the higher the pay of the top
management. The fact that managerial pay is higher in firms with a compensation committee than in
firms with a strategy committee supports conjecture 4a. In addition, managerial duality did not
significantly influence managerial compensation prior to 2006, but gained significant influence
subsequently. This is consistent with our prediction in C4b as the state appoints more (re)liable or trusted
people whom they give more responsibilities and thus compensate better.
Furthermore, we show that the number of employees of the firm (Ln(Employees)), which proxies for
both the level of responsibilities of top management and the firm’s contribution to local employment, is
positively related to pay. Interestingly, the coefficients of local GDP (Ln(GDP)) and inward foreign direct
investment (Ln(inward FDI)), which measure the local provincial governors’ political goals and
achievements, are significant but in different samples17: the growth of inward FDI is significant pre-2006,
whereas GDP growth only plays a role post-2006. This implies that the priority in local governors’
political goals has evolved over time: prior to 2006, attracting foreign investment to upgrade industrial
structure and obtain technological knowhow was a major political concern, but since 2006, the stronger
market-orientation and widespread financial crisis put more pressure on the state and local governors to
boost economic growth so as to maintain legitimacy and political stability. Table 5 also shows that
securing employment has gained importance, especially since the economic crisis struck. This supports
conjecture 5: managerial compensation is tied to macroeconomic political achievement indicators.
We do not find the typical pay-performance relationship documented in some other papers, such as
Conyon and He (2011), Chen et al. (2011), Cao, Pan, and Tian (2011). One key distinction between our
model and theirs is that we control for the political dimension such as state ownership, state control,
managers’ political connections, political achievement variables, etc. We argue that ignoring the strong
state involvement could bias the empirical findings and reduce the ability to judge how Chinese managers
17 Because Ln(GDP) and Ln(Inward FDI) are highly correlated (over 80%), we do not include both variables in the same regression.
20
are actually evaluated. Furthermore, given the large heterogeneity in industrial and regional development
within China’s economy, what is missing in previous studies are industry and province fixed effects.
[Insert Table 5 about Here]
6.2. State-owned enterprises versus private firms
In the previous section, we have found that contrary to the predictions of agency theory, managerial
compensation is negatively related to state ownership/control and other receivables, positively related to
managers’ prestige factors and local governors’ political achievements, and not related to shareholder
values (e.g., Tobin’s Q), managers’ ability, and board structure (with exception of the compensation
committee which can be regarded as a ‘window dressing’ tool). We expect that the impact of the above
explanatory variables differ across firm type, and be stronger for SOEs. In this section, we analyze two
subsamples: SOEs in which the proportion of state-owned shares amounts to more than 25% and
‘privately-owned’ firms with state ownership below that threshold. We expect that SOEs and private
firms generally have different operating objectives and are subject to specific levels of political
monitoring. It should be noted that the Chinese definition of a private firm is different from that in
western economies: although the average ownership in a Chinese private firm stake can be low, the
influence of the party (through the board, party representatives in the company, etc.) is still significant. As
a robustness check, we employ an alternative definition for SOEs, namely these are firms in which the
state is the ultimate controlling owner (see Table 2).
Table 6 compares the results for SOEs and private firms for the full sample period and the two
sub-periods. For SOEs, the previous results supporting our state-stewardship conjectures still hold for
both types of SOE classifications, especially in the pre-2006 sample: (1) State ownership is significantly
negatively correlated with managerial pay for SOEs, while such effect is not significant private firms
(including the State Control variable gives similar results; not shown). As before, the tunneling effect
through other receivables is significant in the pre-2006 sample but not in the post-2006 sample, and it is
particularly strong for private firms. This strengthens our argument that managers collude with the
dominant shareholders (usually state representatives; see Jiang et al. (2010) and Li et al. (2012)) to extract
private benefits especially in private (less state-owned) firms. (3) ROA still has a positive influence on
managerial pay, whereas Tobin’s Q only shows a significant impact after 2006. The increased focus on
market-based performance is visible both for SEOs and for private firms. (4) Prestige (such as
international experience) translates into higher remuneration, especially for SOEs, while the level of
education and some specialized expertise (such as technology) is appreciated especially in private firms.
(6) Internal corporate governance mechanisms such as the proportion of independent director are still
21
not statistically significant for SOEs, but are for private firms prior to 2006. The window-dressing role of
the compensation committee remains consistently stronger for SOEs than for private firms. (7) Political
achievement (firm employment and provincial economic performance) variables still matter for
managerial pay. In general, our theory is still robust within SOE and private subsamples.
[Insert Table 6 about Here]
6.3. The regional analysis
One important characteristic of China is its geographic heterogeneity. Even though we have
controlled for province fixed effects, an analysis by region is warranted. There are 31 provinces/regions
in mainland China that they are grouped based on geographic and demographic characteristics (excluded
are Hong Kong, Macau and Taiwan, and included are five ethnic minority autonomous regions: Inner
Mongolia, Xinjiang, Tibet, Ningxia, Guangxi, and four municipalities: Beijing, Shanghai, Tianjin,
Chongqing). We group the provinces as North China, South China, East China and West China18, and
also analyze the Northwest and Southwest19 separately given their lower level of industrialization and
development.20
Table 7 displays that the effects of state influence vary substantially across regions.21 For example,
in East China which is the most economically developed and market-oriented region, the influence of
state ownership is insignificant (model (1) in Table 7). This is not unexpected because those regional
economies are more market-oriented and internationally-positioned; the East China region consists of
mostly coastal provinces which opened their ports to foreign trade already more than one century ago).
In the North, West, or Northwest regions (models (3), (4), and (6)), state influence is much stronger than
in the South (model (2)) or Southwest (model (7)), which can be explained by the fact that these regions
were historically considered as strategically located. Most of the ancient imperial capitals were established
in these regions (for example, Xi’an, the capital city of Shaanxi Province, was the capital for six imperial
dynasties) and they are now the key places in which the state is implementing the pervasive ‘Western
Development Strategy’ (in Chinese, Xibu Dakaifa Zhanlve). It is therefore not surprising that the tradition of
state-influence remains most significant in these regions. It is also interesting to note that wherever the
18 Our regional partition of China’s provinces is slightly different from the conventional administrative division that classifies China into six regions. We distinguish between: (i) North China (including the North East and North but excluding Inner Mongolia): Heilongjiang, Jilin, Liaoning, Beijing, Tianjin, Hebei, Shanxi. (ii) South China: Guangdong, Guangxi, Hainan. (iii) West China (including Southwest, Northwest. Inner Mongolia and Guangxi): Sichuan, Chongqing, Yunnan, Guizhou, Tibet, Shaanxi, Gansu, Qinghai, Ningxia, Xinjiang, Inner Mongolia, Guangxi. (iv) East China: Shandong, Jiangsu, Zhengjiang, Anhui, Fujian, Shanghai. 19 Northwest includes the following provinces: Liaoning, Jilin, Heilongjiang; southwest includes Sichuan, Yunnan, Guizhou, Tibet, and Chongqing. 20 For reasons of conciseness, we only report the results for the full sample by region. 21 In unreported regressions, we replace state ownership by state control and reach similar conclusions.
22
state ownership does not have a significant impact on managerial pay, the manager’s political background
variable has a significant effect. This confirms our argument that state-ownership and state-stewardship
are substitutes for the state to maintain control over the firms.
[Insert Table 7 about Here]
6.4. Robustness Checks
6.4.1 Results from alternative panel data models
To test the robustness of our results, we conduct some more empirical tests with different specifications.
Our afore-mentioned results are based on a random effect model controlling for year, industry, and
province fixed effects. As alternative estimation methods, we use pooled OLS models (while controlling
for year, industry and province), pure random effect models (without controlling for year, industry and
province effects), and fixed effect models (controlling for firm fixed effects). Obviously, the
non-time-variant variables yield no results in a firm-fixed effects model. The first three columns in Table
8 report that the coefficients on the state ownership variable are significantly negative and the
coefficients on the politically-connected managers are significantly positive, which fails to reject our
state-stewardship conjectures. Other receivables have a significant negative relationship with managerial
pay, in line with conjecture C3; and the pay for performance (ROA and Tobin’s Q) is positively
significant. The coefficients on independent directors are again not significant when we control for year,
industry, and province fixed effects, but are significant when we use the purely random effect model. We
argue that the insignificance of the results with fixed effects models make more sense than the results
from purely random effect models: given the large heterogeneity among different industries and regions,
we need to control for provincial and industrial variation by including their fixed effects. The same
arguments apply to the sign and significance of compensation committee and strategy committee – again,
we find that the compensation committee is set up as a mere symbolic feature of the board. The results of
the managerial characteristics remain as before; prestige factors are positively and significantly
influencing managerial pay whereas the variables capturing ability are not.
6.4.2 Pay and performance revisited: IV strategy
A major problem in many corporate governance studies is the interpretation of the causality in the
pay-performance relation: while managerial compensation can be determined by corporate performance,
performance is the result of managerial effort and incentives which may hinge on remuneration. Most
studies deal with this causation issue by including the one-year lagged value of profitability measures as
independent variables. An alternative (and maybe more robust) approach is an instrumental variable (IV)
strategy. In the IV approach, an exogenous variable is needed as an instrument which closely relates to
23
the firm performance measure but does not directly influence the managerial pay. A valid IV should be
correlated with the endogenous regressor (performance measure) but orthogonal to any other omitted
characteristics (i.e., uncorrelated with the outcomes of interest through any channel other than their
effect via the endogenous performance variable). One should search for a good instrument at the firm-,
industry- or regional-level financial and economic factors as they are most relevant to performance.
However, one major difficulty is that almost all these variables are formal economic factors, are
significantly affected by the state’s political influence, and are thus correlated with managerial pay
through those channels. Therefore, we turn to informal and individual-level factors. The Chinese unique
social and cultural background gives us a plausible IV: the interlocking network of directors among
Chinese firms.
A key issue of Chinese business is the extensive use of personal connections (in Chinese, Guanxi)
and network strategies (Ren et al., 2009). Such connections and networks are part of the informal
institutions that also influence business activities and economic development. Informal institutions are
developed to reduce the costs of social interactions when formal institutions such as property rights and
contracting institutions are neither well-established nor trusted (North, 1990). This is especially true in
the case of China where the legal infrastructure and law enforcement are weak. Drawing on the social
network literature, we know that a firm does not act autonomously but its behavior is influenced by other
firms in the social networks (Davis and Greve, 1997; Granovetter, 1985). The structural position of a
firm in its social network therefore influences its performance. Director interlocks are an important form
of such network ties that can shape firm behavior and hence performance (Renneboog and Zhao, 2011).
Such a professional network may give access to information within the network (Davis, 1991) and
enables network members to handle uncertainties better (Shropshire, 2010; Shipilov, Greve, and Rowley,
2010). However, in the Chinese context, we expect interlocked director networks to have little direct impact
on managerial compensation, because as managers are not directors and usually (in contrast to the
directors) do not own an equity stake. Director networks in China are developed because of (past)
informal and political connections (Ren et al., 2009) but are not the result of current and past firm
performance. Therefore, director network variables could very well serve as valid IVs for firm
performance in the managerial compensation model because director networks could directly influence
firm performance and are not directly related to managers’ compensation.
A network based on director interlocks can be represented by the information centrality which
measures the position of the firm within the network and is based on the ‘information’ contained in all
possible geodesic paths between pairs of nodes (firms). The centrality measurement method assumes
that each link in a network path is independent, with the variance of a single link between nodes being
unity. Therefore, the variance of a path is simply its length. This measure captures communication in

24
corporate interlocks that occurs along reachable, non-geodetic pathways (Stephenson and Zelen, 1989:
3).22 We estimate the information centrality of a vertex i (firm i) as the harmonic mean of all the
information measures between i and all other vertices in the network, and the information measure
between two vertices i and j is the inverse of the variance of the weighted function23. We then use it to run
a 2SLS regression, controlling for the same variables as in the regressions explained in sections 6.1 to 6.3,
except that we exclude the five control variables, because these financial performance measures may be
highly influenced by information centrality as well24. The last two columns of Table 8 report the IV
results from 2SLS estimation, with information centrality of the director networks as an instrument
variable for ROA. The one but last column is the first-stage estimation with ROA as dependent variable,
and information centrality along with all other key and control variables as independent variables. It is
reasonable to see negative signs of Ln(Employee) within the 90% significance level in the first stage, as
firms sacrifice economic returns in pursuit of political achievements under the state’s political-dominant
organizing principles. It is also shown that managers’ international experience does not matter much for
firm profitability (ROA). Rather, managers’ abilities (specialized expertise proxied by their industry
experience) matter for firm performance but they are not priced in remuneration. This result further
indicates that managers in China are not selected to pursue economic returns. The last column is the
second-stage estimation with managerial pay as dependent variable and a ‘predicted’ ROA along with all
other variables as independent variables. One can easily verify that the results remain the same as in
previous estimations, and most key variables (ROA, Ln(inward FDI), international prestige, education
degree, compensation committee, etc.) are highly significant except for the coefficients on state
ownership. This could be due to the fact that the effects of information centrality are captured by various
fixed effects, because a director network can exist within the same province or industry but can also
extend across different provinces or industries. In unreported regressions (random effects and pooled
OLS) we do indeed find that the coefficients of state-ownership are consistently negative at above the 5%
significance level when not controlling for various fixed effects. Therefore most of our five conjectures
are still receiving support in the IV estimations. In addition, since the IV results are not significantly
different from our basic results, this implies that the endogeneity problem may not be that severe in our
basic specifications.
[Insert Table 8 about Here]
In sum, the empirical evidence so far largely confirms our five sets of conjectures developed under
22 We calculate this information centrality measure using software Ucinet 6 as in Borgatti, Evereff, and Freeman (2002).
23 The information centrality is therefore calculated asIi ��
∑ �/� �� ��
, where I, refers to the centrality or information of (i),
the harmonic average of the information associated with the path from (i) to the other points. 24 Due to the data availability issue, we currently only perform this IV exercise on the pre-2006 sample.

25
the state-stewardship framework.
VII. Conclusion
This paper proposes a state-stewardship theory as a competing theory for the agency framework to
explain China’s state-manager relationship, as well as the corporate governance model and executive
compensation schemes which are under the political influence of the state. As the world’s largest country
transiting from a fully state-controlled economy to a market-oriented one through partial privatizations
of firms, China offers the right context to test this theory. We conjecture that Chinese executives act as
responsible stewards of the state and run their companies in such a way that the firm objectives are
aligned with those of the state. Consequently, managers’ compensation schemes are set to reflect their
loyalty to the state and abilities to fulfill both the political objectives and the economic targets, with the
political ones dominating. Since the 2006 reforms, the state influence has transited from state ownership
to state-stewardship. Our state-stewardship framework hinges on five sets of testable conjectures. We
use firm-level micro data for almost all public non-financial listed firms for the period 2001 to 2011, as
well as regional-level macro data to test our conjectures. The empirical results reveal that Chinese
managers are paid much less than their international counterparts. The lower is the remuneration, the
more shares the state owns (or the stronger is the ultimate control of the state). Also, the management
seems to be remunerated not for maximizing the value of the shareholders but that of the state-owned
assets. In addition, the percentage of independent directors on the board and the abandonment of
CEO-chairman duality only seems to be used for reasons of window dressing and only has a symbolic
nature. Furthermore, remuneration is not linked to ability or personality, but to political connections and
prestige, as well as to local officials’ political goals and achievements. These effects are stronger in the
pre-2006 period because subsequent to the split-share reform, companies became more market-oriented.
The results are robust after controlling for endogeneity, measurement errors, outlier effects, and
distinguishing between state and private sectors and among the different regions.
Our empirical results lead to a critical evaluation of the relationships among the state, the firm, and
the manager. Whereas most academic studies apply the western agency theory on China’s corporate
governance and executive compensation, we propose a state-stewardship theory and argue that the state
is actually seized by and represents the interest of the ruling government and its politicians, rather than
that of the citizens, as argued by North’s (1990) predatory theory of the state and the seminal work by
Acemoglu and Johnson (2005). Note that our basic argument is that Chinese managers are the stewards
of the state, but not necessarily of the nation – the private citizens. Given so, the motivation of the
manager would be substantially different. The threat to political and social order calls for a hierarchical
social structure, which distributes rents according to individuals’ social status (as shown by our ‘tunneling’
26
variable). The hierarchy is used by the privileged class to pursue their interests at the cost of society.
As China has been a communist country with a single ruling party for decades, the ideas of
socialism still have a strong impact on how companies are run. This is enhanced by the fact that many
managers are politically appointed and that there is a party secretary in each firm in parallel to the board
of directors to strengthen the political and ideological alignment. As a powerful social elite, the
state-steward managers in China – and possibly in other economies with institutional settings similar to
China’s – have the same interests as the state (the government), namely extracting rents from the whole
society. Therefore the term state should be distinguished from the nation which stands for the collective
private citizens. The normative justifications of our state-stewardship theory are also offered on a welfare
ground. We argue that the main agency problems exist between the general public (the private citizens)
who are supposed to be the ultimate shareholders, and the state (along with its steward elites), instead of
between the managers and the state. The state and its steward-managers in China form the same interest
group and expropriate the private sector and the citizens. The legitimacy of their privileged rights over
private sectors is central to our question.
27
References
Acemoglu, D., Johnson, S., 2005. Unbundling institutions. Journal of Political Economy 113(5), 949-995.
Adithipyangkul, P., Alon, I., Zhang, T., 2009. Executive perks: compensation and corporate
performance in China. Asia Pacific Journal of Management 28(2), 401-425.
Bebchuk, L. A., Fried, J. M., Walker, D. I., 2002. Managerial power and rent extraction in the design of
executive compensation. University of Chicago Law Review 69(3), 751-846.
Bebchuk, L. A., and Fried, J. M., 2004. Pay without Performance: The Unfulfilled Promise of Executive
Compensation. Harvard University Press, Cambridge, MA.
Buck, T., Liu, X., and Skovoroda, R., 2008. Top executive pay and firm performance in China. Journal of
International Business Studies 39, 833-850.
Cao, J., Lemmon, M., Pan, X., Qian, M., Tian. G., 2011. Political promotion, CEO incentives, and the
relationship between pay and performance. Wharton Financial Institutions Center working paper
#11-53: http://fic.wharton.upenn.edu/fic/papers/11/p1153.htm.
Cao, J. Pan, X., Tian, G., 2011. Disproportional ownership structure and pay-performance relationship:
Evidence from China’s Listed Firms. Journal of Corporate Finance 17, 541-554.
Chaney, P. K., Faccio, M., Parsley, D. C, 2011. The quality of accounting information in politically
connected firms. Journal of Accounting and Economics 51, 58-76.
Chen, J.J., Liu, X., Li., W., 2010. The effect of insider control and global benchmarks on Chinese
executive compensation. Corporate Governance: An International Review 18(2), 107-123.
Chen, J., Ezzamel, M., Cai, Z., 2011. Managerial power theory, tournament theory, and executive pay in
China. Journal of Corporate Finance 17(4), 1176-1199.
Chow, I.H., 1992. Chinese workers’ attitudes towards compensation practices in the People’s Republic of
China. Employee Relations 14(3), 41-55.
Clarke, D.C., 2003. Corporate governance in China: an overview. China Economic Review 14(4),
494-507.
Conyon, M.J., He., L., 2011. Executive compensation and corporate governance in China. Journal of
Corporate Finance 17(4), 1158-1175.
Core, J.E., Holthausen, R., Larcker, D., 1999. Corporate governance, chief executive officer
compensation, and firm performance. Journal of Financial Economics 51, 371-406.
Davis, G.F., 1991. Directors without principles? The spread of the poison pill through the intercorporate
network. Administrative Science Quarterly 36(4), 583-613.
Davis, J.H., Schoorman, F.D., Donaldson, L., 1997. Toward a stewardship theory of management.
Academy of Management Review 22(1), 20-47.
Donaldson, L., Davis, J.H., 1991. Stewardship theory or agency theory: CEO governance and
shareholder returns. Australian Journal of Management 16(1), 49-65.
Faccio, M., 2006. Politically connected firms. American Economic Review 96(1), 369-386.
Fan, J. P.H., Wong, T.J., Zhang, T., 2007. Politically connected CEOs, corporate governance, and
post-IPO performance of China’s newly partially privatized firms. Journal of Financial Economics
84(2), 330-357.
Firth, M., Fung, P.M.Y., Rui, O.M., 2006. Corporate performance and CEO compensation in China.
Journal of Corporate Finance 12, 693-714.
Firth, M., Fung, P.M.Y., Rui, O.M., 2007. How ownership and corporate governance influence chief
executive pay in China’s listed firms. Journal of Business Research 60(7), 776-785.
Garen, J.E., 1994. Executive compensation and principal-agent theory. Journal of Political Economy
102(6), 1175-1199.
28
Gimeno, J.F., Folta, T.B., Cooper, A.C., Woo, C.Y., 1997. Survival of the fittest? Entrepreneurial human
capital and the persistence of underperforming firms. Administrative Science Quarterly 42,
750-783,
Grabke-Rundell, A., Gomez Mejia, L.R., 2002. Power as a determinant of executive compensation.
Human Resource Management Review 12, 3-23.
Groves, T., Hong, Y., McMillan, J., Naughton, B., 1994. Autonomy and incentives in Chinese state
enterprises. Quarterly Journal of Economics 109, 183-209.
Groves, T., Hong, Y., McMillan, J., Naughton, B., 1995. China’s evolving managerial labor market. Journal
of Political Economy 4, 873-892.
Hung, M., Wong, T.J., Zhang. T., 2012. Political considerations in the decision of Chinese SOEs to list in
Hong Kong. Journal of Accounting and Economics 53, 435-449.
IFF Task Force Report, 2006. Corporate governance in China: an investor perspective. Institute of
International Finance: Washington.
Jensen, M.C., Murphy, K.J., 1990. Performance pay and top-management incentives. Journal of Political
Economy 98(2), 225-264.
Jensen, M.C., Murphy, K.J., Wruck, E., 2004. Remuneration: where we’ve been, how we got to here, what
are the problems, and how to fix them. ECGI Working Paper Series in Finance, No. 44–2004, July
2004. (Also in the Negotiation, Organizations and Markets Research Paper Series, Harvard
Business School NOM Research Paper No. 04-28.)
Jiang, G., Lee, C. MC., Yeung, H., 2010. Tunneling through intercorporate loans: the Chinese experience.
Journal of Financial Economics 98, 1-20.
Johnson, S., La Porta, R., Lopez-de-Silanes, F., Shleifer, A., 2000. Tunneling. American Economic
Review 90, 22-27.
Li, K, Wang, T., Cheung, Y.L. Jiang, P., 2011. Privatization and risk sharing: evidence from the split share
structure reform in China. Review of Financial Studies 24(7), 2499-2525.
Megginson, W.L., Nash, R.C., van Randenborgh, M., 1994. The financial and operating performance of
newly privatized firms: an international empirical analysis. Journal of Finance 49, 403-452.
Murphy, K. J. 1985. Corporate Performance and Managerial Remuneration – An Empirical Analysis.
Journal of Accounting and Economics 7: 11-42.
North, D.C., 1990. Institutions, Institutional Change and Economic Performance. Cambridge University
Press, Cambridge.
Ren, B., Au, K., Birtch, T., 2009. China’s business network structure during institutional transitions. Asia
Pacific Journal of Management 26(2), 219-240.
Renneboog, L. Zhao, Y., 2011 Us knows us in UK: on director networks and managerial compensation.
Journal of Corporate Finance 17(4), 1132-1157.
Rosenstein, R., and Wyatt, J.G., 1990. Outside directors, board independence, and shareholder wealth.
Journal of Financial Economics 26, 175-191.
Segal, L., Lehrer, M., 2012. The institutionalization of stewardship: theory, propositions, and insights
from change in the Edmonton public schools. Organization Studies 33(2), 169-201.
Shipilov, A.V., Greve, H.R., Rowley, T.J., 2010. When do interlocks matter? Institutional logics and the
diffusion of multiple corporate governance practices. Academy of Management Journal 53,
846-864.
Shropshire, C., 2010. The role of the interlocking director and board receptivity in the diffusion of
practices. Academy of Management Review 35(2), 246-263.
Shleifer, A., 1998. State versus private ownership. Journal of Economic Perspectives 12(4), 133-150.
Stephenson, K., Zelen, M., 1989. Rethinking centrality: methods and examples. Social Network 11(1),
29
1-37.
Tam, O.K., 2002. Ethical issues in evolution of corporate governance in China. Journal of Business
Ethics 37(3), 303-320.
Tenev, D., Zhang, C., 2002. Corporate Governance and Enterprise Reform in China. World Bank and the
International Finance Corporation, Washington, D.C.
Xu, C., 2011. The fundamental institutions of China’s reforms and development. Journal of Economic
Literature 49(4), 1076-1151.
Figure 1a. Evolution of average state ownership of
The vertical axis denotes the percentage of industry
Figure 1b. Evolution of average state ownership of all sample industriesThe vertical axis denotes the percentage of industryincluded in our sample (based on the CSRC Industry Code).
30
Figure 1a. Evolution of average state ownership of the top five industries by market capitalization
axis denotes the percentage of industry-average state ownership.
Figure 1b. Evolution of average state ownership of all sample industriesaxis denotes the percentage of industry-average state ownership. The figure comprises a
the CSRC Industry Code).
top five industries by market
Figure 1b. Evolution of average state ownership of all sample industries The figure comprises all industries
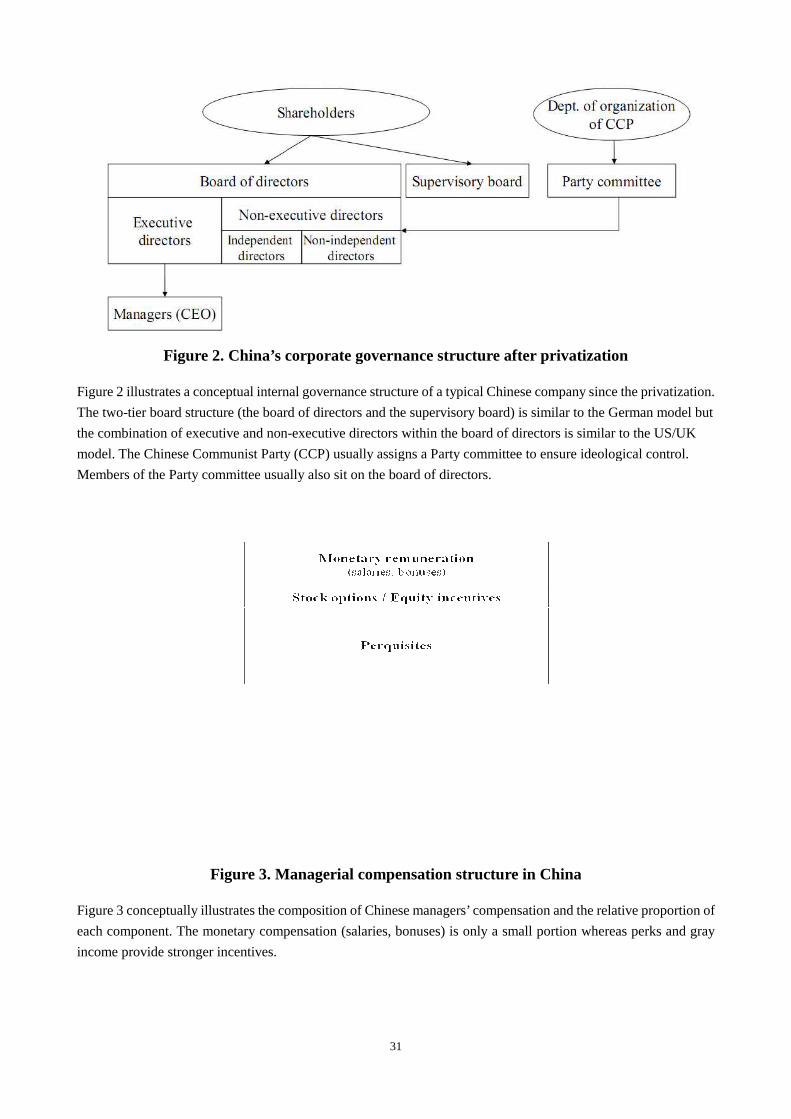
Figure 2. China’s corporate governance structure after privatization
Figure 2 illustrates a conceptual internal governance structure of a typical Chinese company since the privatiza
The two-tier board structure (the board of directors and the supervisory board) is similar to the German model but
the combination of executive and non
model. The Chinese Communist Party (CCP) usually assigns a Party committee to ensure ideological control.
Members of the Party committee usually also sit on the board of directors.
Figure 3. Managerial compensation structure in China
Figure 3 conceptually illustrates the composition of Chinese managers’ compensation and the relative proportion of
each component. The monetary compensation (salaries, bonuses)
income provide stronger incentives.
31
Figure 2. China’s corporate governance structure after privatization
Figure 2 illustrates a conceptual internal governance structure of a typical Chinese company since the privatiza
tier board structure (the board of directors and the supervisory board) is similar to the German model but
the combination of executive and non-executive directors within the board of directors is similar to the US/UK
nist Party (CCP) usually assigns a Party committee to ensure ideological control.
Members of the Party committee usually also sit on the board of directors.
Figure 3. Managerial compensation structure in China
composition of Chinese managers’ compensation and the relative proportion of
monetary compensation (salaries, bonuses) is only a small portion wh
Figure 2. China’s corporate governance structure after privatization
Figure 2 illustrates a conceptual internal governance structure of a typical Chinese company since the privatization.
tier board structure (the board of directors and the supervisory board) is similar to the German model but
executive directors within the board of directors is similar to the US/UK
nist Party (CCP) usually assigns a Party committee to ensure ideological control.
Figure 3. Managerial compensation structure in China
composition of Chinese managers’ compensation and the relative proportion of
a small portion whereas perks and gray
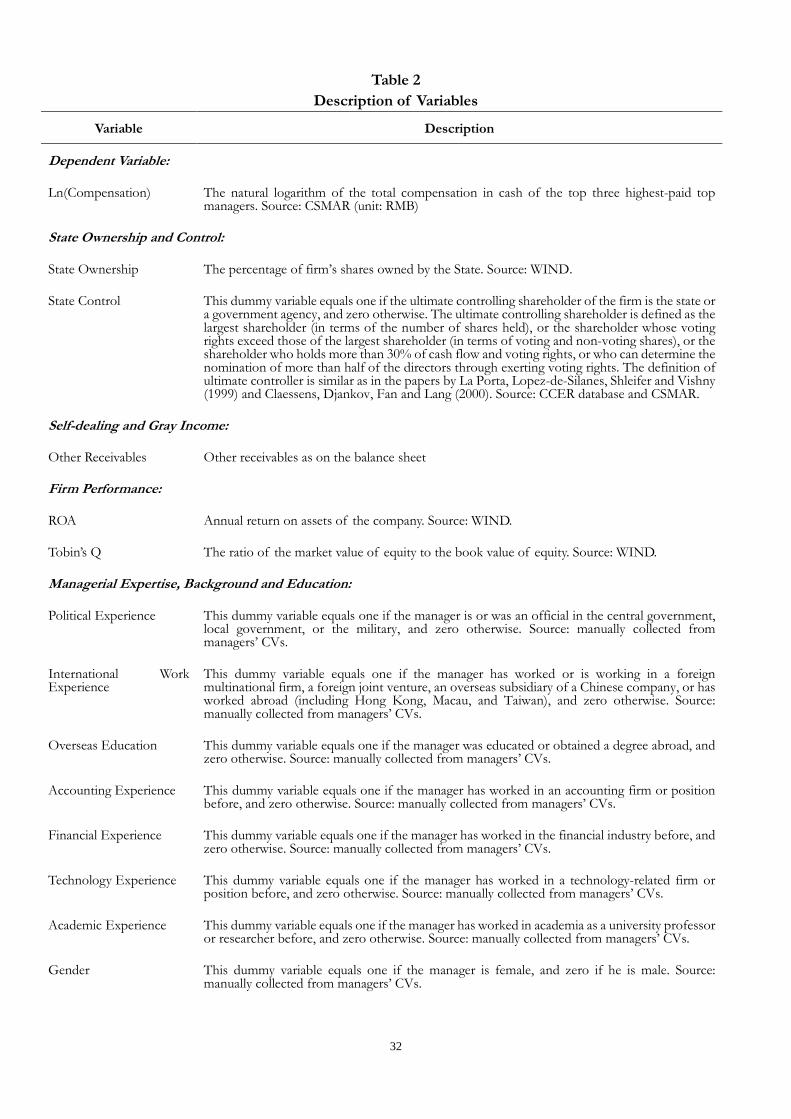
32
Table 2
Description of Variables
Variable Description
Dependent Variable:
Ln(Compensation) The natural logarithm of the total compensation in cash of the top three highest-paid top managers. Source: CSMAR (unit: RMB)
State Ownership and Control:
State Ownership The percentage of firm’s shares owned by the State. Source: WIND.
State Control This dummy variable equals one if the ultimate controlling shareholder of the firm is the state or a government agency, and zero otherwise. The ultimate controlling shareholder is defined as the largest shareholder (in terms of the number of shares held), or the shareholder whose voting rights exceed those of the largest shareholder (in terms of voting and non-voting shares), or the shareholder who holds more than 30% of cash flow and voting rights, or who can determine the nomination of more than half of the directors through exerting voting rights. The definition of ultimate controller is similar as in the papers by La Porta, Lopez-de-Silanes, Shleifer and Vishny (1999) and Claessens, Djankov, Fan and Lang (2000). Source: CCER database and CSMAR.
Self-dealing and Gray Income:
Other Receivables Other receivables as on the balance sheet
Firm Performance:
ROA Annual return on assets of the company. Source: WIND.
Tobin’s Q The ratio of the market value of equity to the book value of equity. Source: WIND.
Managerial Expertise, Background and Education:
Political Experience This dummy variable equals one if the manager is or was an official in the central government, local government, or the military, and zero otherwise. Source: manually collected from managers’ CVs.
International Work Experience
This dummy variable equals one if the manager has worked or is working in a foreign multinational firm, a foreign joint venture, an overseas subsidiary of a Chinese company, or has worked abroad (including Hong Kong, Macau, and Taiwan), and zero otherwise. Source: manually collected from managers’ CVs.
Overseas Education This dummy variable equals one if the manager was educated or obtained a degree abroad, and zero otherwise. Source: manually collected from managers’ CVs.
Accounting Experience This dummy variable equals one if the manager has worked in an accounting firm or position before, and zero otherwise. Source: manually collected from managers’ CVs.
Financial Experience This dummy variable equals one if the manager has worked in the financial industry before, and zero otherwise. Source: manually collected from managers’ CVs.
Technology Experience This dummy variable equals one if the manager has worked in a technology-related firm or position before, and zero otherwise. Source: manually collected from managers’ CVs.
Academic Experience This dummy variable equals one if the manager has worked in academia as a university professor or researcher before, and zero otherwise. Source: manually collected from managers’ CVs.
Gender This dummy variable equals one if the manager is female, and zero if he is male. Source: manually collected from managers’ CVs.
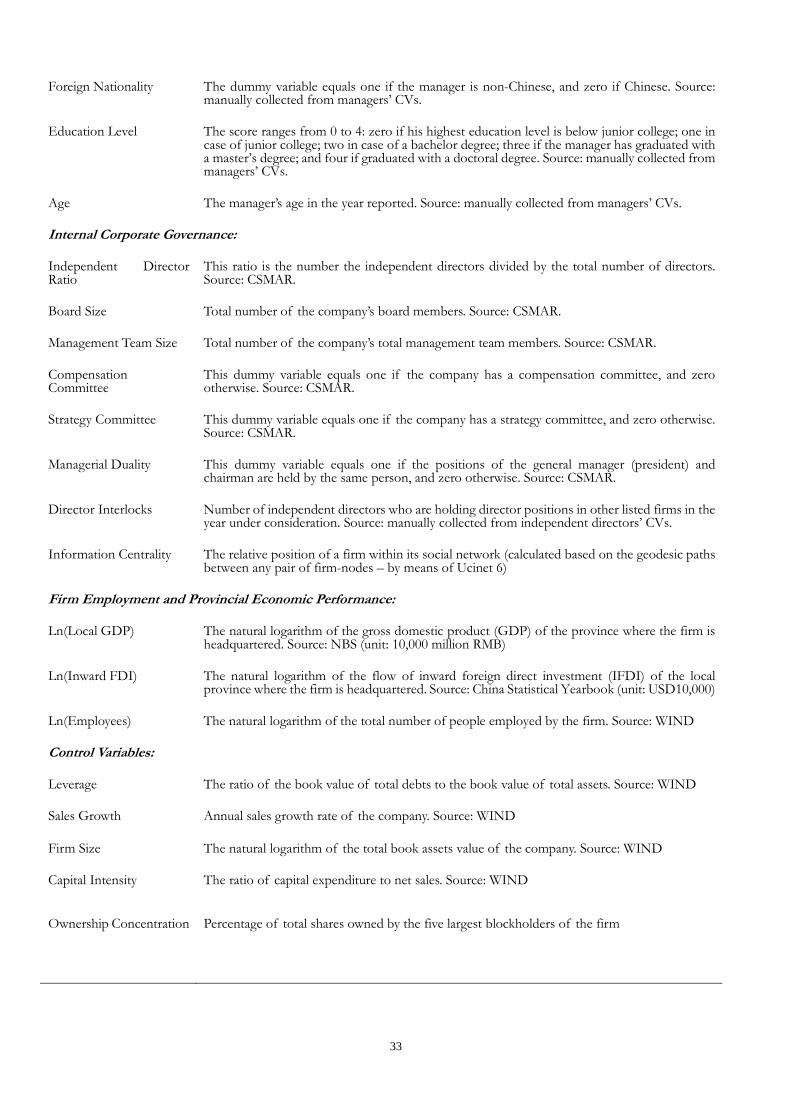
33
Foreign Nationality The dummy variable equals one if the manager is non-Chinese, and zero if Chinese. Source: manually collected from managers’ CVs.
Education Level The score ranges from 0 to 4: zero if his highest education level is below junior college; one in case of junior college; two in case of a bachelor degree; three if the manager has graduated with a master’s degree; and four if graduated with a doctoral degree. Source: manually collected from managers’ CVs.
Age The manager’s age in the year reported. Source: manually collected from managers’ CVs.
Internal Corporate Governance:
Independent Director Ratio
This ratio is the number the independent directors divided by the total number of directors. Source: CSMAR.
Board Size Total number of the company’s board members. Source: CSMAR.
Management Team Size Total number of the company’s total management team members. Source: CSMAR.
Compensation Committee
This dummy variable equals one if the company has a compensation committee, and zero otherwise. Source: CSMAR.
Strategy Committee This dummy variable equals one if the company has a strategy committee, and zero otherwise. Source: CSMAR.
Managerial Duality This dummy variable equals one if the positions of the general manager (president) and chairman are held by the same person, and zero otherwise. Source: CSMAR.
Director Interlocks Number of independent directors who are holding director positions in other listed firms in the year under consideration. Source: manually collected from independent directors’ CVs.
Information Centrality The relative position of a firm within its social network (calculated based on the geodesic paths between any pair of firm-nodes – by means of Ucinet 6)
Firm Employment and Provincial Economic Performance:
Ln(Local GDP) The natural logarithm of the gross domestic product (GDP) of the province where the firm is headquartered. Source: NBS (unit: 10,000 million RMB)
Ln(Inward FDI) The natural logarithm of the flow of inward foreign direct investment (IFDI) of the local province where the firm is headquartered. Source: China Statistical Yearbook (unit: USD10,000)
Ln(Employees) The natural logarithm of the total number of people employed by the firm. Source: WIND
Control Variables:
Leverage The ratio of the book value of total debts to the book value of total assets. Source: WIND
Sales Growth Annual sales growth rate of the company. Source: WIND
Firm Size The natural logarithm of the total book assets value of the company. Source: WIND
Capital Intensity The ratio of capital expenditure to net sales. Source: WIND
Ownership Concentration Percentage of total shares owned by the five largest blockholders of the firm
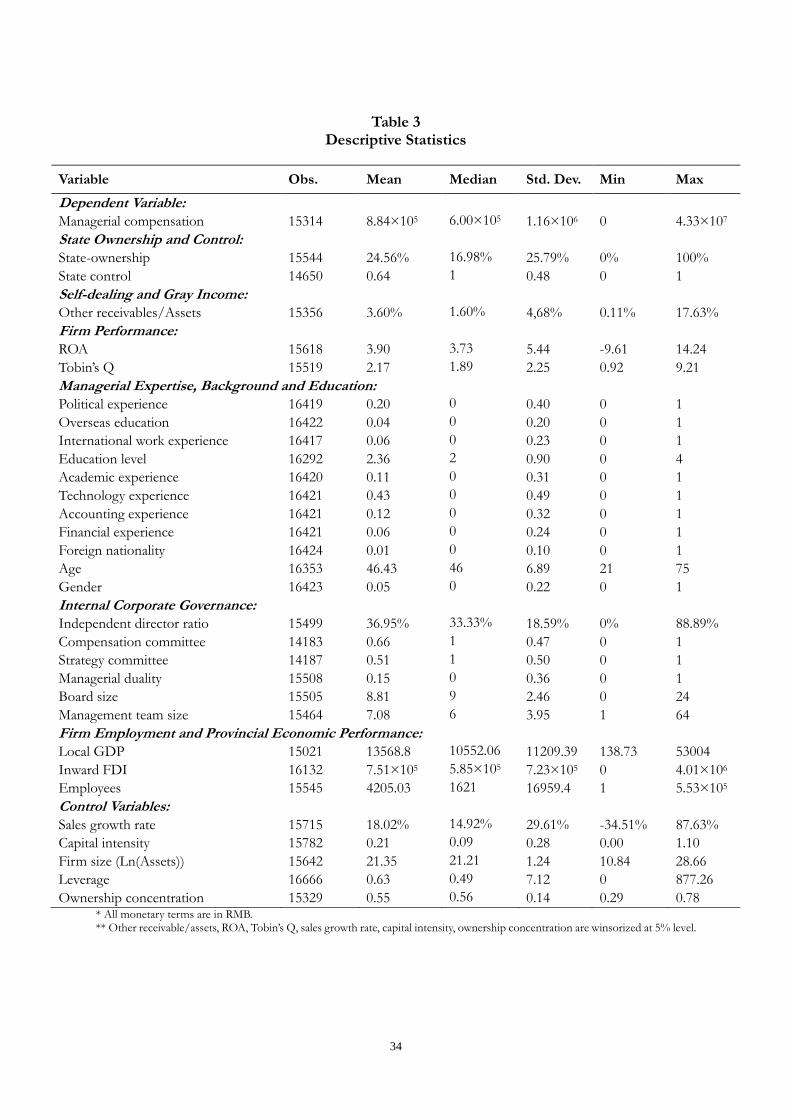
34
Table 3
Descriptive Statistics
Variable Obs. Mean Median Std. Dev. Min Max
Dependent Variable:
Managerial compensation 15314 8.84×10⁵ 6.00×10⁵ 1.16×10⁶ 0 4.33×10⁷
State Ownership and Control:
State-ownership 15544 24.56% 16.98% 25.79% 0% 100%
State control 14650 0.64 1 0.48 0 1
Self-dealing and Gray Income:
Other receivables/Assets 15356 3.60% 1.60% 4,68% 0.11% 17.63%
Firm Performance:
ROA 15618 3.90 3.73 5.44 -9.61 14.24
Tobin’s Q 15519 2.17 1.89 2.25 0.92 9.21
Managerial Expertise, Background and Education:
Political experience 16419 0.20 0 0.40 0 1
Overseas education 16422 0.04 0 0.20 0 1
International work experience 16417 0.06 0 0.23 0 1
Education level 16292 2.36 2 0.90 0 4
Academic experience 16420 0.11 0 0.31 0 1
Technology experience 16421 0.43 0 0.49 0 1
Accounting experience 16421 0.12 0 0.32 0 1
Financial experience 16421 0.06 0 0.24 0 1
Foreign nationality 16424 0.01 0 0.10 0 1
Age 16353 46.43 46 6.89 21 75
Gender 16423 0.05 0 0.22 0 1
Internal Corporate Governance:
Independent director ratio 15499 36.95% 33.33% 18.59% 0% 88.89%
Compensation committee 14183 0.66 1 0.47 0 1
Strategy committee 14187 0.51 1 0.50 0 1
Managerial duality 15508 0.15 0 0.36 0 1
Board size 15505 8.81 9 2.46 0 24
Management team size 15464 7.08 6 3.95 1 64
Firm Employment and Provincial Economic Performance:
Local GDP 15021 13568.8 10552.06 11209.39 138.73 53004
Inward FDI 16132 7.51×10⁵ 5.85×10⁵ 7.23×10⁵ 0 4.01×10⁶
Employees 15545 4205.03 1621 16959.4 1 5.53×10⁵
Control Variables:
Sales growth rate 15715 18.02% 14.92% 29.61% -34.51% 87.63%
Capital intensity 15782 0.21 0.09 0.28 0.00 1.10
Firm size (Ln(Assets)) 15642 21.35 21.21 1.24 10.84 28.66
Leverage 16666 0.63 0.49 7.12 0 877.26
Ownership concentration 15329 0.55 0.56 0.14 0.29 0.78 * All monetary terms are in RMB. ** Other receivable/assets, ROA, Tobin’s Q, sales growth rate, capital intensity, ownership concentration are winsorized at 5% level.

35
Table 4. Correlations of Key Variables
Ln(Comp) State ownership
State control
Ln(Other Receivable) ROA (w) Tobin’s Q
(w) Indep. dir. ratio Board size Mgmt team
size Compens. committee
Strategy committee
manager duality
Ln(local GDP) Ln(employee) Ln(Inward
FDI) Ln(Compensation) 1.0000 State ownership -0.1773 1.0000 State control -0.0371 0.5804 1.0000 Ln(Other Receiv.) 0.0834 0.0959 0.1382 1.0000 ROA (w)a 0.3544 -0.0489 -0.0927 -0.1778 1.0000 Tobin's Q (w) 0.1793 -0.2224 -0.1731 -0.1289 0.1680 1.0000 Indep. dir. ratio 0.2222 -0.2048 -0.1183 -0.0614 0.0341 0.1894 1.0000 Board size -0.0223 0.2207 0.1760 0.1290 0.0091 -0.1944 -0.5208 1.0000 Mgmt. team size 0.2028 -0.0266 0.0820 0.1037 0.0083 0.0587 0.3091 -0.1871 1.0000 Compens committee 0.3639 -0.2122 -0.0658 -0.0718 0.1307 0.2595 0.3146 -0.1304 0.1320 1.0000 Stra committee 0.2823 -0.1679 -0.0570 -0.0622 0.0929 0.2120 0.2435 -0.1105 0.0908 0.6314 1.0000 Manager duality 0.0430 -0.1310 -0.1744 -0.0969 0.0547 0.0756 0.0280 -0.0706 -0.0380 0.0304 0.0144 1.0000 Ln(local GDP) 0.4021 -0.2983 -0.1867 -0.1242 0.1559 0.1837 0.2575 -0.1795 0.1382 0.3238 0.2588 0.0912 1.0000 Ln(employee) 0.1614 0.1495 0.2039 0.3016 0.0880 -0.1124 -0.0219 0.1674 0.1220 0.0235 0.0026 -0.0614 0.0241 1.0000 Ln(inward FDI) 0.3759 -0.2296 -0.1397 -0.0733 0.1213 0.1121 0.1624 -0.1205 0.0814 0.1988 0.1591 0.0850 0.8395 -0.0354 1.0000 Political experience -0.0078 -0.0011 -0.0255 0.0076 0.0388 -0.0185 0.0152 -0.0366 0.0235 -0.0388 -0.0392 0.1729 -0.0457 -0.0518 -0.0374 Tech experience 0.0346 0.1340 0.1682 -0.0146 0.0612 -0.0469 -0.0055 0.0609 0.0702 -0.0026 -0.0250 -0.0467 -0.0105 0.1678 -0.0368 Acct experience -0.0891 0.0639 0.0340 0.0697 -0.0716 -0.1158 -0.0917 0.0741 -0.0670 -0.1057 -0.1022 -0.0291 -0.1242 -0.0259 -0.0583 Financial experience 0.0204 -0.0589 -0.0735 0.0352 -0.0041 0.0332 0.0520 -0.0603 0.0777 0.0266 0.0151 0.0001 0.0168 -0.1384 0.0207 Academic experience 0.0442 0.0130 0.0053 0.0022 0.0283 0.0349 -0.0162 0.0094 0.0203 0.0006 0.0041 0.0365 0.0354 -0.0528 0.0437 Overseas education 0.0769 -0.0524 -0.0667 0.0055 0.0352 0.0146 0.0286 -0.0267 -0.0088 0.0270 0.0216 -0.0178 0.0136 0.0086 0.0414 Internat. work exp. 0.0751 -0.0408 -0.0927 -0.0103 0.0349 0.0203 -0.0270 0.0040 -0.0422 -0.0205 -0.0060 -0.0020 0.0248 -0.0355 0.0608 Education level 0.1767 -0.0097 0.0360 0.0757 0.0497 0.0831 0.0824 -0.0180 0.0455 0.1207 0.1008 -0.0171 0.0700 0.0435 0.0797 Foreign nationality 0.0626 -0.0643 -0.0808 -0.0303 0.0308 0.0434 -0.0037 -0.0017 -0.0123 0.0053 0.0022 -0.0035 0.0410 -0.0138 0.0395 Age 0.1735 0.0262 0.1263 0.0185 0.0566 0.0324 0.0419 0.0326 0.0390 0.1149 0.0844 0.0886 0.1008 0.1011 0.0885 Gender 0.0121 -0.0618 -0.0625 0.0010 0.0349 0.0118 0.0250 -0.0395 -0.0066 0.0147 0.0214 0.0189 0.0412 -0.0440 0.0317 Leverage -0.0186 -0.0028 -0.0186 -0.0252 -0.0340 -0.0140 0.0177 -0.0015 0.0414 0.0072 0.0076 -0.0030 0.0117 -0.0396 -0.0032 Sales growth rate -0.0164 -0.0009 -0.0110 -0.0067 0.0166 0.0056 0.0121 -0.0214 -0.0066 -0.0170 -0.0106 0.0293 -0.0063 -0.0117 -0.0051 Capital intensity -0.0750 -0.0016 -0.0008 0.0139 -0.0784 -0.0230 -0.0334 0.0118 -0.0270 -0.0459 -0.0325 -0.0065 -0.0415 -0.0325 -0.0227 Firm size 0.4390 0.1201 0.2320 0.4769 0.1781 -0.1270 0.0560 0.1616 0.1563 0.1507 0.1187 -0.0994 0.1429 0.5770 0.1272 Ownership concentr. -0.0096 0.3797 0.0978 -0.0391 0.2091 -0.0897 -0.1686 0.1797 -0.1232 -0.1068 -0.0803 0.0004 -0.0530 0.1359 -0.0273
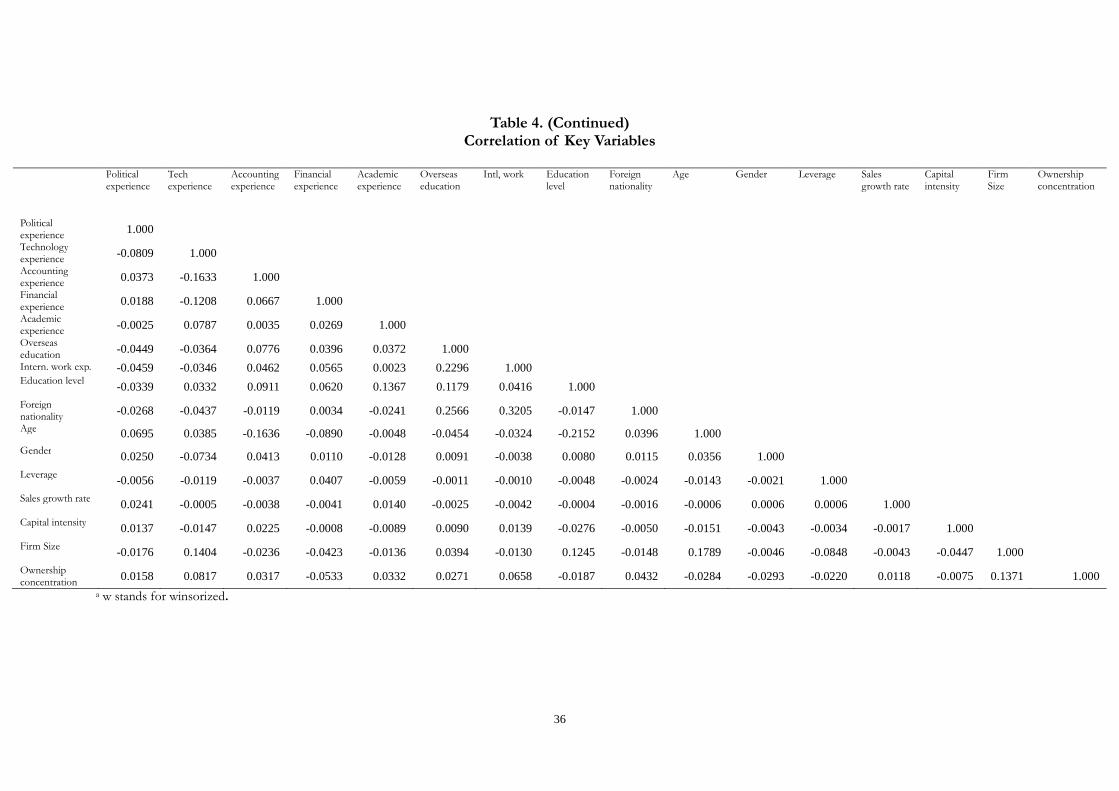
36
Table 4. (Continued)
Correlation of Key Variables
Political experience
Tech experience
Accounting experience
Financial experience
Academic experience
Overseas education
Intl, work Education level
Foreign nationality
Age Gender Leverage Sales growth rate
Capital intensity
Firm Size
Ownership concentration
Political experience 1.000
Technology experience -0.0809 1.000
Accounting experience 0.0373 -0.1633 1.000
Financial experience 0.0188 -0.1208 0.0667 1.000
Academic experience -0.0025 0.0787 0.0035 0.0269 1.000
Overseas education -0.0449 -0.0364 0.0776 0.0396 0.0372 1.000
Intern. work exp. -0.0459 -0.0346 0.0462 0.0565 0.0023 0.2296 1.000
Education level -0.0339 0.0332 0.0911 0.0620 0.1367 0.1179 0.0416 1.000
Foreign nationality -0.0268 -0.0437 -0.0119 0.0034 -0.0241 0.2566 0.3205 -0.0147 1.000
Age 0.0695 0.0385 -0.1636 -0.0890 -0.0048 -0.0454 -0.0324 -0.2152 0.0396 1.000
Gender
0.0250 -0.0734 0.0413 0.0110 -0.0128 0.0091 -0.0038 0.0080 0.0115 0.0356 1.000
Leverage
-0.0056 -0.0119 -0.0037 0.0407 -0.0059 -0.0011 -0.0010 -0.0048 -0.0024 -0.0143 -0.0021 1.000
Sales growth rate
0.0241 -0.0005 -0.0038 -0.0041 0.0140 -0.0025 -0.0042 -0.0004 -0.0016 -0.0006 0.0006 0.0006 1.000
Capital intensity
0.0137 -0.0147 0.0225 -0.0008 -0.0089 0.0090 0.0139 -0.0276 -0.0050 -0.0151 -0.0043 -0.0034 -0.0017 1.000
Firm Size
-0.0176 0.1404 -0.0236 -0.0423 -0.0136 0.0394 -0.0130 0.1245 -0.0148 0.1789 -0.0046 -0.0848 -0.0043 -0.0447 1.000
Ownership concentration
0.0158 0.0817 0.0317 -0.0533 0.0332 0.0271 0.0658 -0.0187 0.0432 -0.0284 -0.0293 -0.0220 0.0118 -0.0075 0.1371 1.000
a w stands for winsorized.

37
Table 5. Test for State-Stewardship Theory on Managers
The dependent variable is the natural logarithm of the top 3 highest paid managers’ compensation. Independent variables are state ownership (%), a state control dummy, ROA (winsorized at the 95% level), Tobin’s Q (winsorized at the 95% level) , Independent director ratio , board size, management team size, compensation committee dummy, strategy committee dummy, managerial duality dummy (equals 1 if the manager and chairman is the same person), logarithm of local province’s GDP and inward FDI, and of the total number of employees of the firm, a series of managerial background dummies, and control variables (leverage, sales growth rate, capital intensity, firm size (total asset value), and the ownership concentration of the top 5 blockholders. More information on variable definitions can be found in Table 1. *, **, and *** stand for significance at the 10%, 5% and 1%, respectively. Standard errors are clustered at the firm level and reported in parentheses. GLS estimations are used.
Full sample Pre-2006 period Post-2006 period Coef. Std. Err. Coef. Std. Err. Coef. Std. Err. Coef. Std. Err. Coef. Std. Err. Coef. Std. Err.
State Ownership and Control:
State ownership -0.091** (0.029) -0.225*** (0.057) 0.004 (0.034)
State control -0.013 (0.017) -0.061** (0.028) 0.014 (0.021)
Self-dealing and Gray Income:
Ln(Other Receivables) -0.011** (0.005) -0.010** (0.005) -0.020** (0.008) -0.019** (0.008) -0.001 (0.005) -0.000 (0.006)
Firm Performance:
ROA 0.023*** (0.001) 0.023*** (0.002) 0.020*** (0.002) 0.021*** (0.002) 0.020*** (0.001) 0.020*** (0.001)
Tobin’s Q 0.015*** (0.003) 0.014*** (0.003) 0.004 (0.009) 0.004 (0.009) 0.012*** (0.003) 0.012*** (0.001)
Managerial Expertise, Background and Education:
Political experience 0.041*** (0.015) 0.038** (0.015) 0.045* (0.026) 0.046* (0.026) 0.049** (0.022) 0.047** (0.022)
Overseas education 0.057* (0.031) 0.041 (0.032) 0.091 (0.059) 0.075 (0.059) 0.074* (0.041) 0.050 (0.043)
International work experience 0.116*** (0.027) 0.112*** (0.027) 0.091** (0.044) 0.077* (0.044) 0.154*** (0.042) 0.147*** (0.043)
Education level 0.028*** (0.007) 0.028*** (0.007) 0.024* (0.013) 0.025* (0.013) 0.023** (0.010) 0.024** (0.010)
Academic experience 0.025 (0.019) 0.021 (0.019) 0.080** (0.034) 0.073** (0.034) 0.016 (0.028) 0.017 (0.029)
Technology experience 0.031** (0.013) 0.030** (0.013) 0.036 (0.024) 0.036 (0.024) -0.007 (0.018) -0.011 (0.019)
Accounting experience -0.008 (0.017) -0.009 (0.017) -0.022 (0.027) -0.020 (0.027) 0.029 (0.034) 0.016 (0.035)
Financial experience -0.037 (0.025) -0.032 (0.025) -0.034 (0.048) -0.033 (0.048) -0.063* (0.035) -0.059* (0.035)
Foreign nationality 0.231*** (0.072) 0.258*** (0.073) 0.139 (0.144) 0.156 (0.144) 0.154* (0.091) 0.208** (0.094)
Age 0.005*** (0.001) 0.004*** (0.001) 0.001 (0.002) 0.001 (0.002) 0.006*** (0.001) 0.006*** (0.001)
Gender -0.031 (0.028) -0.040 (0.029) -0.086 (0.055) -0.091* (0.055) -0.029 (0.037) -0.037 (0.037)
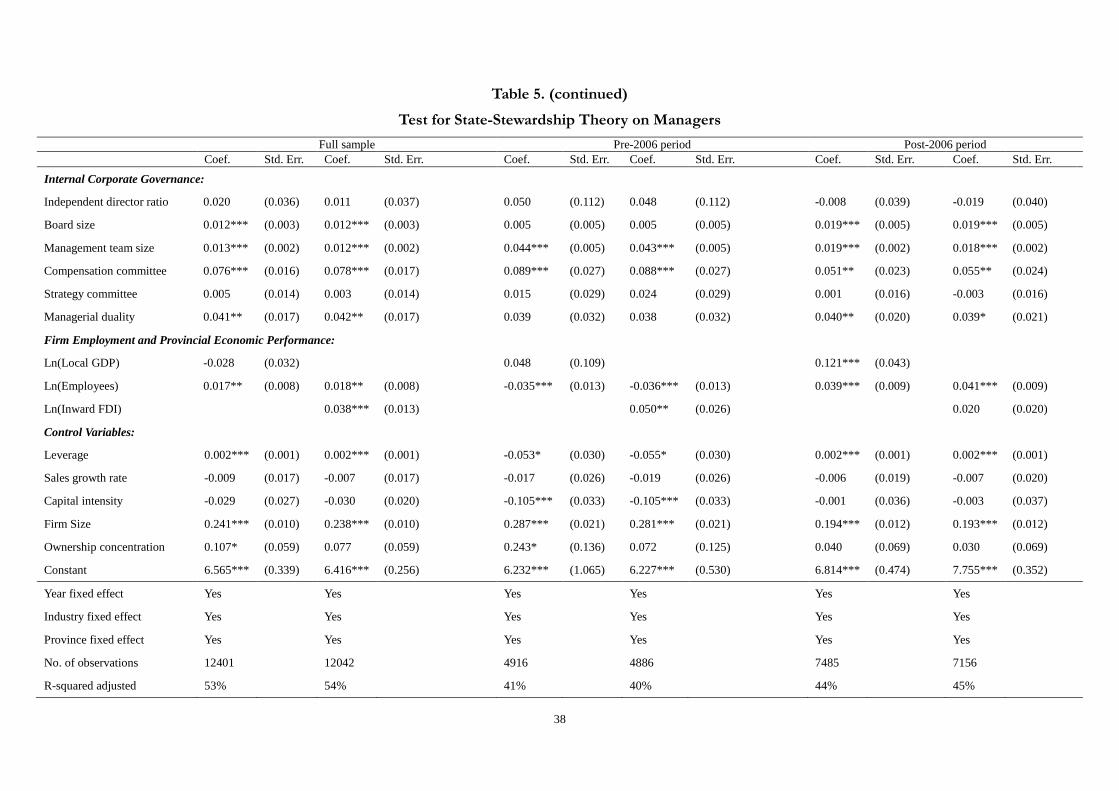
38
Table 5. (continued)
Test for State-Stewardship Theory on Managers
Full sample Pre-2006 period Post-2006 period Coef. Std. Err. Coef. Std. Err. Coef. Std. Err. Coef. Std. Err. Coef. Std. Err. Coef. Std. Err.
Internal Corporate Governance:
Independent director ratio 0.020 (0.036) 0.011 (0.037) 0.050 (0.112) 0.048 (0.112) -0.008 (0.039) -0.019 (0.040)
Board size 0.012*** (0.003) 0.012*** (0.003) 0.005 (0.005) 0.005 (0.005) 0.019*** (0.005) 0.019*** (0.005)
Management team size 0.013*** (0.002) 0.012*** (0.002) 0.044*** (0.005) 0.043*** (0.005) 0.019*** (0.002) 0.018*** (0.002)
Compensation committee 0.076*** (0.016) 0.078*** (0.017) 0.089*** (0.027) 0.088*** (0.027) 0.051** (0.023) 0.055** (0.024)
Strategy committee 0.005 (0.014) 0.003 (0.014) 0.015 (0.029) 0.024 (0.029) 0.001 (0.016) -0.003 (0.016)
Managerial duality 0.041** (0.017) 0.042** (0.017) 0.039 (0.032) 0.038 (0.032) 0.040** (0.020) 0.039* (0.021)
Firm Employment and Provincial Economic Performance:
Ln(Local GDP) -0.028 (0.032) 0.048 (0.109) 0.121*** (0.043)
Ln(Employees) 0.017** (0.008) 0.018** (0.008) -0.035*** (0.013) -0.036*** (0.013) 0.039*** (0.009) 0.041*** (0.009)
Ln(Inward FDI) 0.038*** (0.013) 0.050** (0.026) 0.020 (0.020)
Control Variables:
Leverage 0.002*** (0.001) 0.002*** (0.001) -0.053* (0.030) -0.055* (0.030) 0.002*** (0.001) 0.002*** (0.001)
Sales growth rate -0.009 (0.017) -0.007 (0.017) -0.017 (0.026) -0.019 (0.026) -0.006 (0.019) -0.007 (0.020)
Capital intensity -0.029 (0.027) -0.030 (0.020) -0.105*** (0.033) -0.105*** (0.033) -0.001 (0.036) -0.003 (0.037)
Firm Size 0.241*** (0.010) 0.238*** (0.010) 0.287*** (0.021) 0.281*** (0.021) 0.194*** (0.012) 0.193*** (0.012)
Ownership concentration 0.107* (0.059) 0.077 (0.059) 0.243* (0.136) 0.072 (0.125) 0.040 (0.069) 0.030 (0.069)
Constant 6.565*** (0.339) 6.416*** (0.256) 6.232*** (1.065) 6.227*** (0.530) 6.814*** (0.474) 7.755*** (0.352)
Year fixed effect Yes Yes Yes Yes Yes Yes
Industry fixed effect Yes Yes Yes Yes Yes Yes
Province fixed effect Yes Yes Yes Yes Yes Yes
No. of observations 12401 12042 4916 4886 7485 7156
R-squared adjusted 53% 54% 41% 40% 44% 45%
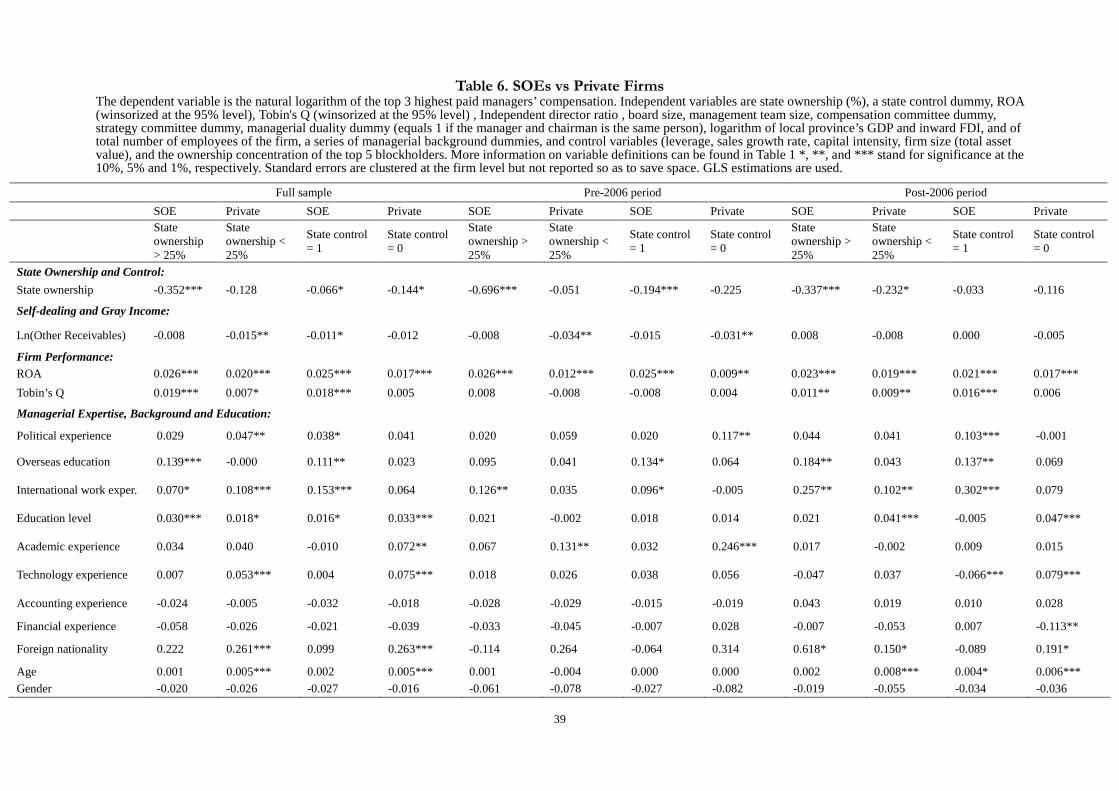
39
Table 6. SOEs vs Private Firms The dependent variable is the natural logarithm of the top 3 highest paid managers’ compensation. Independent variables are state ownership (%), a state control dummy, ROA (winsorized at the 95% level), Tobin's Q (winsorized at the 95% level) , Independent director ratio , board size, management team size, compensation committee dummy, strategy committee dummy, managerial duality dummy (equals 1 if the manager and chairman is the same person), logarithm of local province’s GDP and inward FDI, and of total number of employees of the firm, a series of managerial background dummies, and control variables (leverage, sales growth rate, capital intensity, firm size (total asset value), and the ownership concentration of the top 5 blockholders. More information on variable definitions can be found in Table 1 *, **, and *** stand for significance at the 10%, 5% and 1%, respectively. Standard errors are clustered at the firm level but not reported so as to save space. GLS estimations are used.
Full sample Pre-2006 period Post-2006 period
SOE Private SOE Private SOE Private SOE Private SOE Private SOE Private
State ownership > 25%
State ownership < 25%
State control = 1
State control = 0
State ownership > 25%
State ownership < 25%
State control = 1
State control = 0
State ownership > 25%
State ownership < 25%
State control = 1
State control = 0
State Ownership and Control:
State ownership -0.352*** -0.128 -0.066* -0.144* -0.696*** -0.051 -0.194*** -0.225 -0.337*** -0.232* -0.033 -0.116
Self-dealing and Gray Income:
Ln(Other Receivables) -0.008 -0.015** -0.011* -0.012 -0.008 -0.034** -0.015 -0.031** 0.008 -0.008 0.000 -0.005
Firm Performance: ROA 0.026*** 0.020*** 0.025*** 0.017*** 0.026*** 0.012*** 0.025*** 0.009** 0.023*** 0.019*** 0.021*** 0.017***
Tobin’s Q 0.019*** 0.007* 0.018*** 0.005 0.008 -0.008 -0.008 0.004 0.011** 0.009** 0.016*** 0.006
Managerial Expertise, Background and Education:
Political experience 0.029 0.047** 0.038* 0.041 0.020 0.059 0.020 0.117** 0.044 0.041 0.103*** -0.001
Overseas education 0.139*** -0.000 0.111** 0.023 0.095 0.041 0.134* 0.064 0.184** 0.043 0.137** 0.069
International work exper. 0.070* 0.108*** 0.153*** 0.064 0.126** 0.035 0.096* -0.005 0.257** 0.102** 0.302*** 0.079
Education level 0.030*** 0.018* 0.016* 0.033*** 0.021 -0.002 0.018 0.014 0.021 0.041*** -0.005 0.047***
Academic experience 0.034 0.040 -0.010 0.072** 0.067 0.131** 0.032 0.246*** 0.017 -0.002 0.009 0.015
Technology experience 0.007 0.053*** 0.004 0.075*** 0.018 0.026 0.038 0.056 -0.047 0.037 -0.066*** 0.079***
Accounting experience -0.024 -0.005 -0.032 -0.018 -0.028 -0.029 -0.015 -0.019 0.043 0.019 0.010 0.028
Financial experience -0.058 -0.026 -0.021 -0.039 -0.033 -0.045 -0.007 0.028 -0.007 -0.053 0.007 -0.113**
Foreign nationality 0.222 0.261*** 0.099 0.263*** -0.114 0.264 -0.064 0.314 0.618* 0.150* -0.089 0.191*
Age 0.001 0.005*** 0.002 0.005*** 0.001 -0.004 0.000 0.000 0.002 0.008*** 0.004* 0.006***
Gender -0.020 -0.026 -0.027 -0.016 -0.061 -0.078 -0.027 -0.082 -0.019 -0.055 -0.034 -0.036
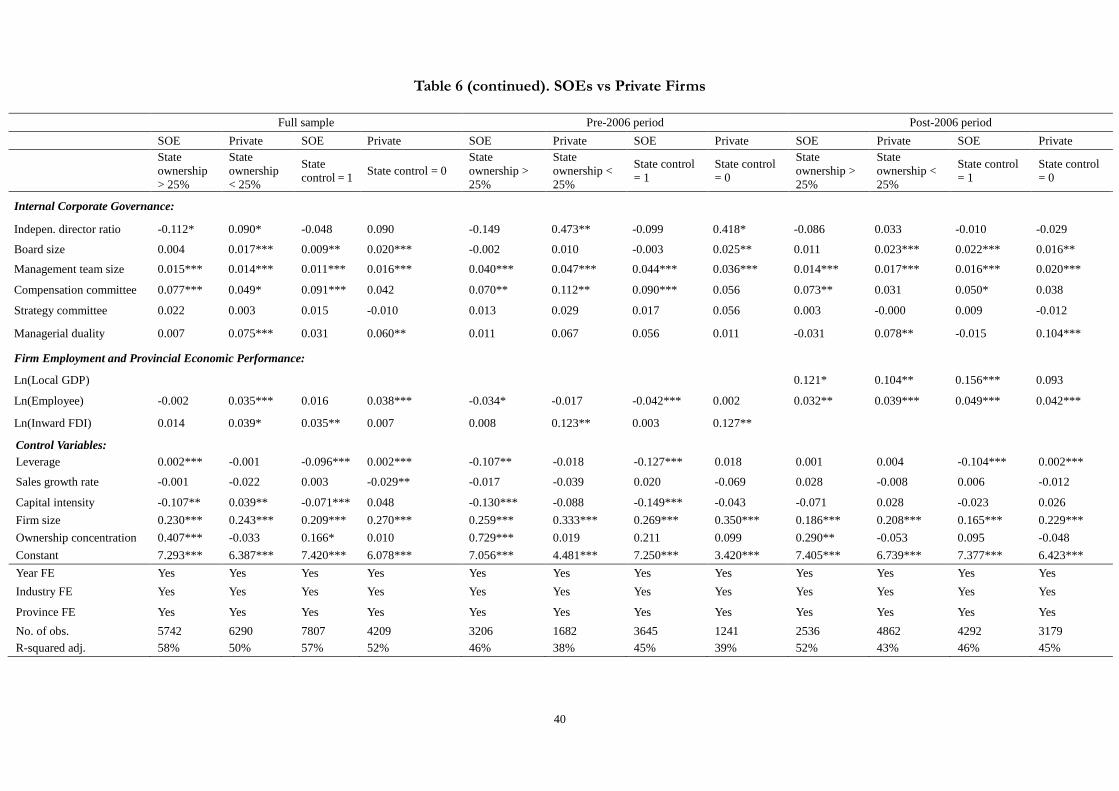
40
Table 6 (continued). SOEs vs Private Firms
Full sample Pre-2006 period Post-2006 period
SOE Private SOE Private SOE Private SOE Private SOE Private SOE Private
State ownership > 25%
State ownership < 25%
State control = 1
State control = 0 State ownership > 25%
State ownership < 25%
State control = 1
State control = 0
State ownership > 25%
State ownership < 25%
State control = 1
State control = 0
Internal Corporate Governance:
Indepen. director ratio -0.112* 0.090* -0.048 0.090 -0.149 0.473** -0.099 0.418* -0.086 0.033 -0.010 -0.029
Board size 0.004 0.017*** 0.009** 0.020*** -0.002 0.010 -0.003 0.025** 0.011 0.023*** 0.022*** 0.016**
Management team size 0.015*** 0.014*** 0.011*** 0.016*** 0.040*** 0.047*** 0.044*** 0.036*** 0.014*** 0.017*** 0.016*** 0.020***
Compensation committee 0.077*** 0.049* 0.091*** 0.042 0.070** 0.112** 0.090*** 0.056 0.073** 0.031 0.050* 0.038
Strategy committee 0.022 0.003 0.015 -0.010 0.013 0.029 0.017 0.056 0.003 -0.000 0.009 -0.012
Managerial duality 0.007 0.075*** 0.031 0.060** 0.011 0.067 0.056 0.011 -0.031 0.078** -0.015 0.104***
Firm Employment and Provincial Economic Performance:
Ln(Local GDP) 0.121* 0.104** 0.156*** 0.093
Ln(Employee) -0.002 0.035*** 0.016 0.038*** -0.034* -0.017 -0.042*** 0.002 0.032** 0.039*** 0.049*** 0.042***
Ln(Inward FDI) 0.014 0.039* 0.035** 0.007 0.008 0.123** 0.003 0.127**
Control Variables: Leverage 0.002*** -0.001 -0.096*** 0.002*** -0.107** -0.018 -0.127*** 0.018 0.001 0.004 -0.104*** 0.002***
Sales growth rate -0.001 -0.022 0.003 -0.029** -0.017 -0.039 0.020 -0.069 0.028 -0.008 0.006 -0.012
Capital intensity -0.107** 0.039** -0.071*** 0.048 -0.130*** -0.088 -0.149*** -0.043 -0.071 0.028 -0.023 0.026
Firm size 0.230*** 0.243*** 0.209*** 0.270*** 0.259*** 0.333*** 0.269*** 0.350*** 0.186*** 0.208*** 0 .165*** 0.229***
Ownership concentration 0.407*** -0.033 0.166* 0.010 0.729*** 0.019 0.211 0.099 0.290** -0.053 0.095 -0.048
Constant 7.293*** 6.387*** 7.420*** 6.078*** 7.056*** 4.481*** 7.250*** 3.420*** 7.405*** 6.739*** 7.3 77*** 6.423***
Year FE Yes Yes Yes Yes Yes Yes Yes Yes Yes Yes Yes Yes
Industry FE Yes Yes Yes Yes Yes Yes Yes Yes Yes Yes Yes Yes
Province FE Yes Yes Yes Yes Yes Yes Yes Yes Yes Yes Yes Yes
No. of obs. 5742 6290 7807 4209 3206 1682 3645 1241 2536 4862 4292 3179
R-squared adj. 58% 50% 57% 52% 46% 38% 45% 39% 52% 43% 46% 45%
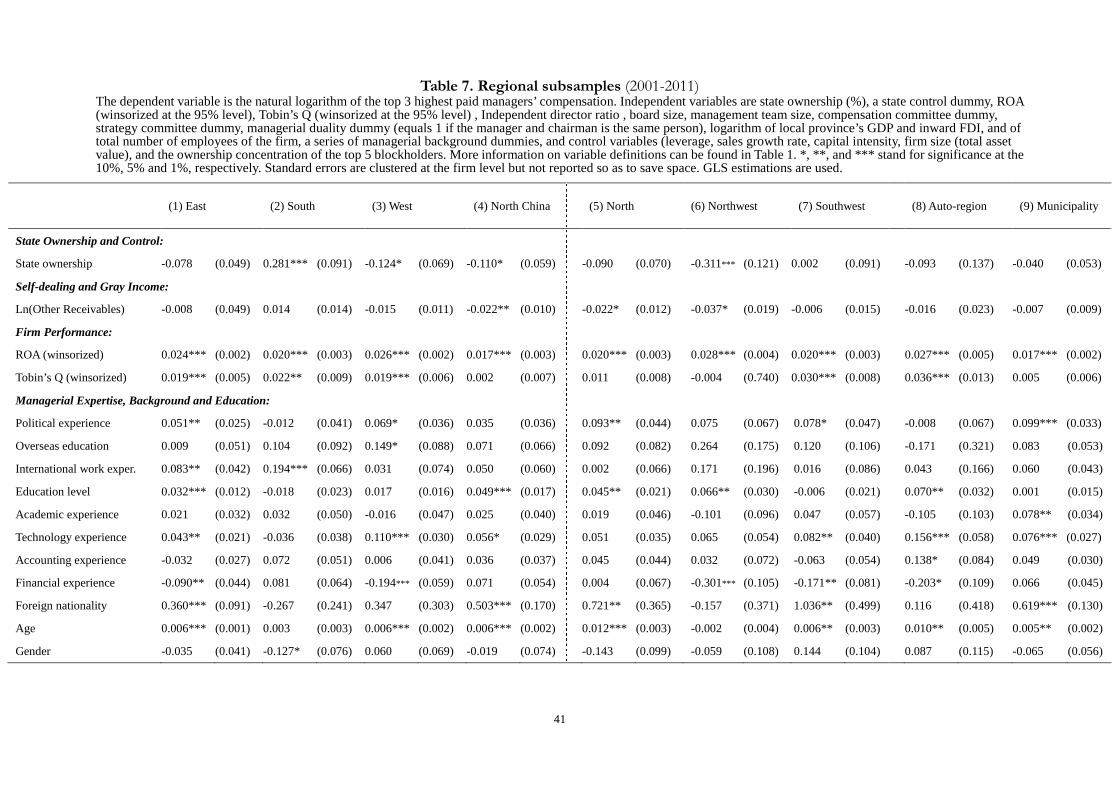
41
Table 7. Regional subsamples (2001-2011) The dependent variable is the natural logarithm of the top 3 highest paid managers’ compensation. Independent variables are state ownership (%), a state control dummy, ROA (winsorized at the 95% level), Tobin’s Q (winsorized at the 95% level) , Independent director ratio , board size, management team size, compensation committee dummy, strategy committee dummy, managerial duality dummy (equals 1 if the manager and chairman is the same person), logarithm of local province’s GDP and inward FDI, and of total number of employees of the firm, a series of managerial background dummies, and control variables (leverage, sales growth rate, capital intensity, firm size (total asset value), and the ownership concentration of the top 5 blockholders. More information on variable definitions can be found in Table 1. *, **, and *** stand for significance at the 10%, 5% and 1%, respectively. Standard errors are clustered at the firm level but not reported so as to save space. GLS estimations are used.
(1) East (2) South (3) West (4) North China (5) North (6) Northwest (7) Southwest (8) Auto-region (9) Municipality
State Ownership and Control:
State ownership -0.078 (0.049) 0.281*** (0.091) -0.124* (0.069) -0.110* (0.059) -0.090 (0.070) -0.311*** (0.121) 0.002 (0.091) -0.093 (0.137) -0.040 (0.053)
Self-dealing and Gray Income:
Ln(Other Receivables) -0.008 (0.049) 0.014 (0.014) -0.015 (0.011) -0.022** (0.010) -0.022* (0.012) -0.037* (0.019) -0.006 (0.015) -0.016 (0.023) -0.007 (0.009)
Firm Performance:
ROA (winsorized) 0.024*** (0.002) 0.020*** (0.003) 0.026*** (0.002) 0.017*** (0.003) 0.020*** (0.003) 0.028*** (0.004) 0.020*** (0.003) 0.027*** (0.005) 0.017*** (0.002)
Tobin’s Q (winsorized) 0.019*** (0.005) 0.022** (0.009) 0.019*** (0.006) 0.002 (0.007) 0.011 (0.008) -0.004 (0.740) 0.030*** (0.008) 0.036*** (0.013) 0.005 (0.006)
Managerial Expertise, Background and Education:
Political experience 0.051** (0.025) -0.012 (0.041) 0.069* (0.036) 0.035 (0.036) 0.093** (0.044) 0.075 (0.067) 0.078* (0.047) -0.008 (0.067) 0.099*** (0.033)
Overseas education 0.009 (0.051) 0.104 (0.092) 0.149* (0.088) 0.071 (0.066) 0.092 (0.082) 0.264 (0.175) 0.120 (0.106) -0.171 (0.321) 0.083 (0.053)
International work exper. 0.083** (0.042) 0.194*** (0.066) 0.031 (0.074) 0.050 (0.060) 0.002 (0.066) 0.171 (0.196) 0.016 (0.086) 0.043 (0.166) 0.060 (0.043)
Education level 0.032*** (0.012) -0.018 (0.023) 0.017 (0.016) 0.049*** (0.017) 0.045** (0.021) 0.066** (0.030) -0.006 (0.021) 0.070** (0.032) 0.001 (0.015)
Academic experience 0.021 (0.032) 0.032 (0.050) -0.016 (0.047) 0.025 (0.040) 0.019 (0.046) -0.101 (0.096) 0.047 (0.057) -0.105 (0.103) 0.078** (0.034)
Technology experience 0.043** (0.021) -0.036 (0.038) 0.110*** (0.030) 0.056* (0.029) 0.051 (0.035) 0.065 (0.054) 0.082** (0.040) 0.156*** (0.058) 0.076*** (0.027)
Accounting experience -0.032 (0.027) 0.072 (0.051) 0.006 (0.041) 0.036 (0.037) 0.045 (0.044) 0.032 (0.072) -0.063 (0.054) 0.138* (0.084) 0.049 (0.030)
Financial experience -0.090** (0.044) 0.081 (0.064) -0.194*** (0.059) 0.071 (0.054) 0.004 (0.067) -0.301*** (0.105) -0.171** (0.081) -0.203* (0.109) 0.066 (0.045)
Foreign nationality 0.360*** (0.091) -0.267 (0.241) 0.347 (0.303) 0.503*** (0.170) 0.721** (0.365) -0.157 (0.371) 1.036** (0.499) 0.116 (0.418) 0.619*** (0.130)
Age 0.006*** (0.001) 0.003 (0.003) 0.006*** (0.002) 0.006*** (0.002) 0.012*** (0.003) -0.002 (0.004) 0.006** (0.003) 0.010** (0.005) 0.005** (0.002)
Gender -0.035 (0.041) -0.127* (0.076) 0.060 (0.069) -0.019 (0.074) -0.143 (0.099) -0.059 (0.108) 0.144 (0.104) 0.087 (0.115) -0.065 (0.056)

42
Table 7 (Continued). Regional subsamples (2001-2011)
(1) East (2) South (3) West (4) North China (5) North (6) Northwest (7) Southwest (8) Auto-region (9) Municipality
Internal Corporate Governance:
Independent director ratio 0.058 (0.082) 0.065 (0.079) 0.059 (0.075) -0.105 (0.085) -0.073 (0.113) -0.130 (0.183) 0.139 (0.085) 0.109 (0.216) -0.150 (0.096)
Board size 0.012** (0.005) 0.042*** (0.009) 0.011 (0.007) -0.003 (0.007) -0.009 (0.008) -0.001 (0.012) 0.021** (0.009) 0.010 (0.015) 0.000 (0.006)
Management team size 0.013*** (0.003) 0.017*** (0.004) 0.017*** (0.004) 0.008** (0.004) 0.004 (0.005) 0.017** (0.007) 0.013*** (0.005) 0.027*** (0.007) 0.004 (0.004)
Compensation committee 0.068*** (0.026) 0.032 (0.051) 0.136*** (0.040) 0.039 (0.037) 0.007 (0.045) 0.171** (0.069) 0.144*** (0.054) 0.065 (0.072) 0.124*** (0.032)
Strategy committee 0.032 (0.022) -0.020 (0.042) -0.119*** (0.035) 0.082*** (0.031) 0.087** (0.038) -0.103* (0.058) -0.129*** (0.049) -0.084 (0.062) 0.008 (0.027)
Managerial duality 0.054** (0.027) 0.044 (0.047) 0.037 (0.041) -0.008 (0.038) -0.020 (0.052) 0.035 (0.082) 0.078 (0.053) 0.007 (0.078) 0.091** (0.036)
Firm Employment and Provincial Economic Performance:
Ln(Local GDP) 0.131*** (0.131) 0.020 (0.030) -0.049 (0.043) 0.191*** (0.054)
Ln(Employee) 0.020 (0.013) 0.073*** (0.020) -0.016 (0.017) -0.008 (0.017) -0.001 (0.020) -0.080*** (0.031) -0.020 (0.023) 0.004 (0.036) 0.001 (0.013)
Ln(Inward FDI) 0.035 (0.021) 0.158*** (0.026) 0.138*** (0.031) -0.059 (0.036) 0.022 (0.032)
Control Variables:
Leverage 0.004 (0.008) -0.004 (0.009) 0.002*** (0.001) -0.147*** (0.042) -0.059 (0.046) -0.063 (0.095) 0.002*** (0.001) -0.112 (0.116) 0.009 (0.008)
Sales growth rate -0.056** (0.027) -0.057 (0.047) 0.003 (0.037) 0.073** (0.036) 0.026 (0.044) -0.002 (0.062) -0.000 (0.050) -0.013 (0.066) 0.019 (0.031)
Capital intensity -0.032 (0.036) 0.044 (0.058) -0.122*** (0.043) -0.066 (0.042) -0.083 (0.054) -0.072 (0.074) -0.170*** (0.058) -0.127 (0.081) -0.090** (0.040)
Firm size 0.211*** (0.018) 0.211*** (0.029) 0.275*** (0.024) 0.251*** (0.021) 0.250*** (0.025) 0.323*** (0.042) 0.294*** (0.032) 0.206*** (0.047) 0.227*** (0.019)
Ownership concentration 0.088 (0.098) 0.090 (0.157) 0.044 (0.148) 0.308** (0.140) 0.266 (0.176) 0.641** (0.265) -0.125 (0.199) -0.119 (0.279) 0.216* (0.129)
Constant 6.453*** (0.430) 5.584*** (0.634) 5.602*** (0.475) 4.855*** (0.495) 4.892*** (0.582) 6.201*** (0.821) 5.996*** (0.659) 6.688*** (0.873) 5.626*** (0.537)
Year fixed effect Yes Yes Yes Yes Yes Yes Yes Yes Yes
Industry fixed effect Yes Yes Yes Yes Yes Yes Yes Yes Yes
Province fixed effect Yes Yes Yes Yes Yes Yes Yes Yes Yes
No. of observations 4289 1810 2384 2340 1591 800 1220 770 2376
R-squared adj. 48% 50% 48% 57% 59% 58% 53% 49% 58%
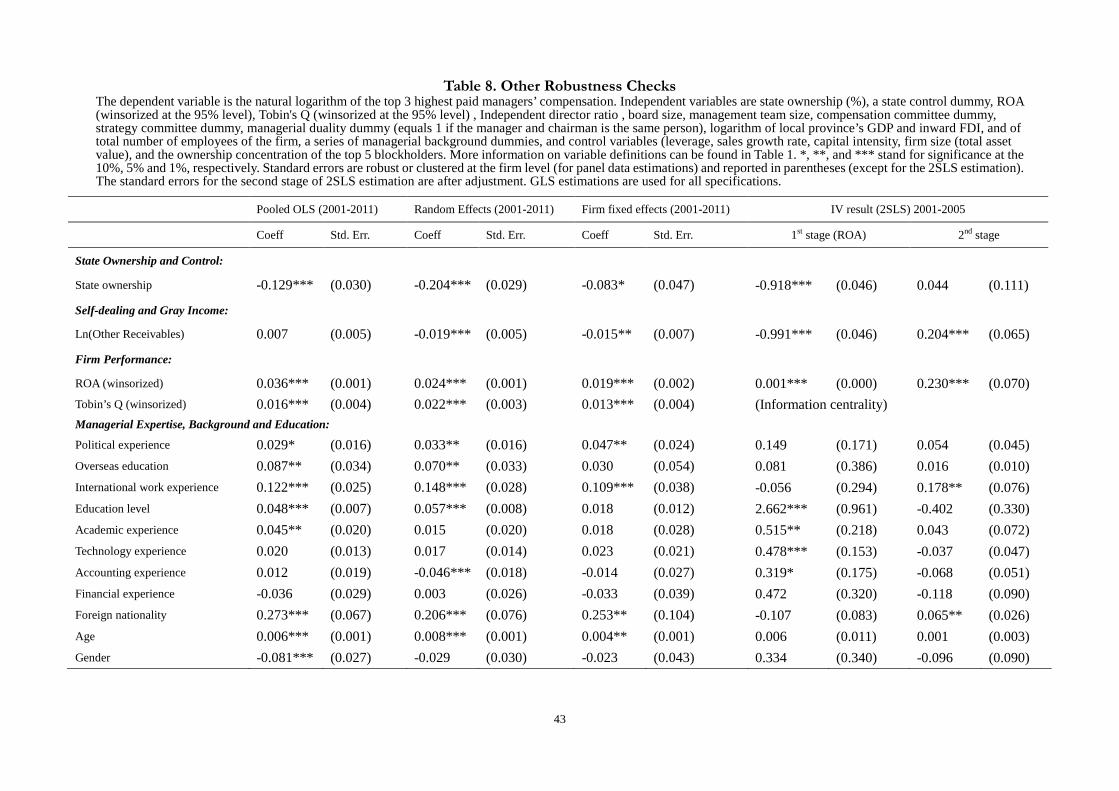
43
Table 8. Other Robustness Checks The dependent variable is the natural logarithm of the top 3 highest paid managers’ compensation. Independent variables are state ownership (%), a state control dummy, ROA (winsorized at the 95% level), Tobin's Q (winsorized at the 95% level) , Independent director ratio , board size, management team size, compensation committee dummy, strategy committee dummy, managerial duality dummy (equals 1 if the manager and chairman is the same person), logarithm of local province’s GDP and inward FDI, and of total number of employees of the firm, a series of managerial background dummies, and control variables (leverage, sales growth rate, capital intensity, firm size (total asset value), and the ownership concentration of the top 5 blockholders. More information on variable definitions can be found in Table 1. *, **, and *** stand for significance at the 10%, 5% and 1%, respectively. Standard errors are robust or clustered at the firm level (for panel data estimations) and reported in parentheses (except for the 2SLS estimation). The standard errors for the second stage of 2SLS estimation are after adjustment. GLS estimations are used for all specifications.
Pooled OLS (2001-2011) Random Effects (2001-2011) Firm fixed effects (2001-2011) IV result (2SLS) 2001-2005
Coeff Std. Err. Coeff Std. Err. Coeff Std. Err. 1st stage (ROA) 2nd stage
State Ownership and Control:
State ownership -0.129*** (0.030) -0.204*** (0.029) -0.083* (0.047) -0.918*** (0.046) 0.044 (0.111)
Self-dealing and Gray Income:
Ln(Other Receivables) 0.007 (0.005) -0.019*** (0.005) -0.015** (0.007) -0.991*** (0.046) 0.204*** (0.065)
Firm Performance:
ROA (winsorized) 0.036*** (0.001) 0.024*** (0.001) 0.019*** (0.002) 0.001*** (0.000) 0.230*** (0.070)
Tobin’s Q (winsorized) 0.016*** (0.004) 0.022*** (0.003) 0.013*** (0.004) (Information centrality) Managerial Expertise, Background and Education:
Political experience 0.029* (0.016) 0.033** (0.016) 0.047** (0.024) 0.149 (0.171) 0.054 (0.045)
Overseas education 0.087** (0.034) 0.070** (0.033) 0.030 (0.054) 0.081 (0.386) 0.016 (0.010)
International work experience 0.122*** (0.025) 0.148*** (0.028) 0.109*** (0.038) -0.056 (0.294) 0.178** (0.076)
Education level 0.048*** (0.007) 0.057*** (0.008) 0.018 (0.012) 2.662*** (0.961) -0.402 (0.330)
Academic experience 0.045** (0.020) 0.015 (0.020) 0.018 (0.028) 0.515** (0.218) 0.043 (0.072)
Technology experience 0.020 (0.013) 0.017 (0.014) 0.023 (0.021) 0.478*** (0.153) -0.037 (0.047)
Accounting experience 0.012 (0.019) -0.046*** (0.018) -0.014 (0.027) 0.319* (0.175) -0.068 (0.051)
Financial experience -0.036 (0.029) 0.003 (0.026) -0.033 (0.039) 0.472 (0.320) -0.118 (0.090)
Foreign nationality 0.273*** (0.067) 0.206*** (0.076) 0.253** (0.104) -0.107 (0.083) 0.065** (0.026)
Age 0.006*** (0.001) 0.008*** (0.001) 0.004** (0.001) 0.006 (0.011) 0.001 (0.003)
Gender -0.081*** (0.027) -0.029 (0.030) -0.023 (0.043) 0.334 (0.340) -0.096 (0.090)

44
Table 8 (Continued). Other robustness checks
Pooled OLS (2001-2011) Random Effect (2001-2011) Firm fixed effect (2001-2011) IV result (2SLS) 2001-2005
Coeff Std. Err. Coeff Std. Err. Coeff Std. Err. 1st stage 2nd stage
Internal Corporate Governance:
Independent director ratio -0.019 (0.045) 0.284*** (0.034) 0.021 (0.058) 0.868 (0.758) 0.038 (0.193)
Board size 0.023*** (0.003) 0.012*** (0.003) 0.006 (0.005) -0.080* (0.042) 0.001 (0.009)
Management team size 0.019*** (0.002) 0.013*** (0.002) 0.009*** (0.003) 0.055* (0.032) 0.042*** (0.009)
Compensation committee 0.095*** (0.020) 0.196*** (0.016) 0.069*** (0.023) -0.053 (0.174) 0.095** (0.045)
Strategy committee 0.024 (0.016) 0.056*** (0.014) 0.000 (0.019) -0.037 (0.189) 0.067 (0.050)
Managerial duality 0.028 (0.019) 0.053*** (0.018) 0.045* (0.027) 0.126 (0.208) -0.033 (0.056)
Firm Employment and Provincial Economic Performance:
Ln(Local GDP) 0.305*** (0.012)
Ln(Employee) -0.008 (0.007) -0.015** (0.008) 0.028* (0.015) 0.413*** (0.074) -0.023 (0.031)
Ln(Inward FDI) 0.042** (0.018) 0.033* (0.020) -0.462*** (0.176) 0.169*** (0.054)
Control Variables:
Leverage 0.002*** (0.000) 0.002*** (0.001) 0.002*** (0.000)
Sales growth rate 0.002 (0.023) -0.002 (0.017) -0.007 (0.019)
Capital intensity -0.100*** (0.023) -0.096*** (0.020) -0.004 (0.029)
Firm size 0.252*** (0.009) 0.306*** (0.010) 0.211*** (0.021)
Ownership concentration -0.116*** (0.050) -0.149** (0.060) 0.339*** (0.118)
Constant 5.888*** (0.281) 3.326*** (0.185) 6.958*** (0.438) 5.508*** (1.796)
Year fixed effect Yes No Yes Yes Yes
Industry fixed effect Yes No No Yes Yes
Province fixed effect Yes No No Yes Yes
Firm fixed effect No No Yes No No
No. of observations 12032 12401 12032 5697 5488
R-squared adj. 55% 43% 43% 21% 22%