state retirement system - mass. · pdf filepublic employee retirement administration...
TRANSCRIPT

PUBLIC EMPLOYEE RETIREMENT ADMINISTRATION COMMISSIONCOMMONWEALTH OF MASSACHUSETTS
State Retirement SystemActuarial Valuation Report
January 1, 2017


TABLE OF CONTENTS Section Page 1. Introduction & Certification ............................................................................................................. 1 2. Executive Summary A. Principal Valuation Results ..................................................................................................... 2 B. Comparison with Prior Valuation and Experience Analysis ............................................ 3 C. Funding Progress ...................................................................................................................... 7 3. Summary of Valuation Results ........................................................................................................ 11 4. Development of the Actuarial Gain or Loss ............................................................................... 12 5. Plan Assets A. Summary of Assets ................................................................................................................. 13 B. Actuarial Value of Assets ..................................................................................................... 14 6. Information on System Membership A. Active Members ...................................................................................................................... 15 B. Retirees and Survivors ........................................................................................................... 17 7. Valuation Cost Methods A. Actuarial Cost Method .......................................................................................................... 19 B. Asset Valuation Method ........................................................................................................ 19 8. Actuarial Assumptions ...................................................................................................................... 20 9. Summary of Plan Provisions ............................................................................................................ 24 10. Glossary of Terms ........................................................................................................................... 31


S T A T E A C T U A R I A L V A L U A T I O N R E P O R T | J A N U A R Y 1 , 2 0 1 7 1
1. INTRODUCTION & CERTIFICATION This report presents the results of the actuarial valuation of the State Retirement System. The valuation was performed as of January 1, 2017, pursuant to Chapter 32 of the General Laws of the Commonwealth of Massachusetts and based on the plan provisions at that time. The actuarial assumptions used to calculate the accrued liability and the normal cost primarily reflect our most recent Experience Study Analysis report which we issued in 2014. The actuarial assumptions used in this valuation are the same as those used in the January 1, 2016 actuarial valuation with the exception of the mortality assumption, which was updated to reflect more recent experience. This valuation was based on member data as of December 31, 2016, which was supplied by the State Retirement Board. Asset information as of December 31, 2016, was provided by the Pension Reserves Investment Management Board. Both the membership data and financial information were reviewed for reasonableness but not audited by us. Future actuarial measurements may differ significantly from the current measurements presented in this report due to such factors as the following: plan experience differing from that anticipated by the economic or demographic assumptions; changes in economic or demographic assumptions; increases or decreases expected as part of natural operation of the methodology used for these measurements such as additional contribution requirements based on the plan’s funded status; and changes in plan provisions or applicable law. As part of this valuation, we have not performed an analysis of the potential range of future measurements. I am a member of the American Academy of Actuaries and meet the Qualification Standards of the American Academy of Actuaries to render the actuarial opinion contained in this report. In my opinion, the actuarial assumptions used in this report are reasonable, are related to plan experience and expectations, and represent my best estimate of anticipated experience. I believe this report represents an accurate appraisal of the actuarial status of the State Retirement System performed in accordance with generally accepted actuarial principles and practices relating to pension plans.
Respectfully submitted, Public Employee Retirement Administration Commission
___________________________________ James R. Lamenzo Member of the American Academy of Actuaries Associate of the Society of Actuaries Enrolled Actuary Number 17-4709 __________________________________ Joseph E. Connarton Executive Director
Dated: May 26, 2017

S T A T E A C T U A R I A L V A L U A T I O N R E P O R T | J A N U A R Y 1 , 2 0 1 7 2
2. EXECUTIVE SUMMARY PART A | PRINCIPAL VALUATION RESULTS
The provisions of Chapter 32, Section 22C mandate the establishment of a funding schedule for the Commonwealth of Massachusetts pension obligation. The State Retirement System (SRS) reflects one component of the Commonwealth schedule. The other components are the Massachusetts Teachers’ Retirement System, liabilities for Boston teachers, and State reimbursements to local systems to reflect COLAs granted from 1982 through 1996. The schedule, as mandated by law, calls for payment of the Normal Cost plus an amortization payment on the Unfunded Actuarial Liability (UAL).
The Commonwealth’s current funding schedule was filed in January, 2017 and was based on the results of the January 1, 2016 Commonwealth Actuarial Valuation. The FY18 appropriation under the schedule is $2.394 billion. The total appropriation under the schedule will increase 8.94% each year until FY36. The amortization of the 2015 Early Retirement Incentive (ERI) will be completed in FY27.
The SRS’s share of the FY18 Commonwealth appropriation is $910 million. The 2015 ERI amortization payment is $28.7 million and is included in this figure.
The principal results of the January 1, 2017 actuarial valuation are as follows (in thousands):
Total Normal Cost $832,322
Expected Employee Contributions $530,597
Net Normal Cost $301,725
Total Expenses and Transfers $55,200
Net Normal Cost Plus Expenses $356,925
Total Actuarial Liability $38,316,719
Assets $24,773,042
Unfunded Actuarial Liability $13,543,677
Funded Ratio 64.7%

S T A T E A C T U A R I A L V A L U A T I O N R E P O R T | J A N U A R Y 1 , 2 0 1 7 3
2. EXECUTIVE SUMMARY (continued)
PART B | COMPARISON WITH PRIOR VALUATION AND EXPERIENCE ANALYSIS
A comparison of the current valuation and the January 1, 2016 valuation is shown below (in thousands).
1/1/17 1/1/16 Increase (Decrease)
Increase (Decrease)
Total Normal Cost $832,322 $799,026 $33,296 4.2%
Expected Employee Contributions 530,597 517,446 13,151 2.5%
Net Normal Cost $301,725 $281,580 $20,145 7.2%
Administrative Expenses $20,600 $16,000 $4,600 28.8%
Optional Retirement Plan Transfer 18,600 17,500 1,100 6.3%
3(8)(c) Amounts Transferred to Other Systems 16,000 12,000 4,000 33.3%
Total Expenses and Transfers $55,200 $45,500 $9,700 21.3%
Net Normal Cost Plus Expenses and Transfers $356,925 $327,080 $29,845 9.1%
Actuarial Liability
Actives $16,783,379 $16,442,844 $340,535 2.1%
Retirees and Inactives 21,533,340 20,523,434 1,009,906 4.9%
Total $38,316,719 $36,966,278 $1,350,441 3.7%
Assets (Actuarial Value) $24,773,042 $23,465,963 $1,307,079 5.6%
Unfunded Actuarial Liability $13,543,677 $13,500,315 $43,362 0.3%
Funded Ratio 64.7% 63.5% 1.2%
In prior valuations, we included total expenses and transfers in the total normal cost and net normal cost. For this valuation, we have shown the expense and transfer items separately. Administrative expenses reflect the expenses from the most recent Annual Statement excluding investment related expenses and the Optional Retirement Plan (ORP) transfer which is shown separately. The ORP transfer is the amount transferred by statute from the SRS to the ORP for higher education employees. By including this transfer in the normal cost, we have treated it as a reimbursement to the pension trust fund. Finally, $16 million is included for amounts transferred to other systems under Section 3(8)(c) for members with State service who retired from another system. Historically, Section 3(8)(c) receipts from other systems have been transferred to the State’s general account. By including the Section 3(8)(c) disbursements in normal cost, the net Section 3(8)(c) cash flow is zero for funding purposes.

S T A T E A C T U A R I A L V A L U A T I O N R E P O R T | J A N U A R Y 1 , 2 0 1 7 4
2. EXECUTIVE SUMMARY (continued)
PART B | COMPARISON WITH PRIOR VALUATION AND EXPERIENCE ANALYSIS (continued) Actives
1/1/17
1/1/16 Increase
(Decrease) Number 90,014 88,081 2.2% Total Payroll $5,927,011,814 $5,792,288,086 2.3% Average Salary $65,845 $65,761 0.1% Average Age 46.9 46.9 0.0% Average Service 12.4 12.6 (1.6%)
There were 80,969 active members as of January 1, 2016 who remained in active status as of January 1, 2017. Pay for these members increased 3.4%. Retirees and Survivors
1/1/17
1/1/16 Increase
(Decrease) Number 62,259 61,377 1.4% Total Benefits $2,096,890,776 $2,003,072,099 4.7% Average Benefits $33,680 $32,636 3.2% Average Age 71.7 71.6 0.1%
The development of the actuarial gain/(loss) is shown on page 12. During 2016 there was an overall actuarial gain of $758 million. There was a non-investment related gain (gain on actuarial accrued liability) of $517 million. There was a gain of $241 million on the actuarial value of assets (AVA). The return on assets was approximately 8.4% on an AVA basis, compared to 8.0% on a market value basis. PERAC values system assets using a smoothing technique which spreads gains and losses over short periods (5 years) and employs a “corridor” so that the actuarial value is within 10% of the market value of assets. The calculated AVA as of January 1, 2017 is 101.7% of the market value and is within the specified corridor. The UAL increased from $13.50 billion as of January 1, 2016 to $13.54 billion as of January 1, 2017. The UAL would have decreased if there were no change in the actuarial assumptions (see next section). Actuarial Assumptions The January 1, 2017 report uses a 7.50% investment return assumption which is the same as the January 1, 2016 report. The investment return assumption had previously decreased from 8.25% as of January 1, 2012 to 7.5% as of January 1, 2016. As part of this valuation, we considered whether to maintain the 7.50% assumption or reduce it further. Earlier this year, NEPC, PRIT’s investment consultant, completed its annual study of expected returns on both a short-term and long term basis. The results showed a 30-year average annual expected return of 7.8%. The 5-7 year expected return is 6.8%. We believe both a 7.50% assumption and an assumption slightly lower (7.25% to 7.40%) are in a reasonable range as of January 1, 2017 and we will maintain the 7.50% assumption. However, we note that not adjusting the assumption in this valuation makes it more likely we will recommend this assumption be reduced as of January 1, 2018. For comparison, if a 7.40% investment return assumption were used in this valuation, the UAL would be approximately $13.95 billion and the funded ratio would be 64.0% .

S T A T E A C T U A R I A L V A L U A T I O N R E P O R T | J A N U A R Y 1 , 2 0 1 7 5
2. EXECUTIVE SUMMARY (continued) PART B | COMPARISON WITH PRIOR VALUATION AND EXPERIENCE ANALYSIS (continued) In our 2011 actuarial valuation, we began reflecting future mortality improvement (increasing life expectancy). Each year we modified this assumption as we moved closer to a fully generational mortality assumption (a two dimensional table based on a member’s age and calendar year that includes all expected future mortality improvements). Based on our analysis in early 2015 of State retiree mortality during 2012, 2013, and 2014, we adopted a fully generational assumption in the 2015 valuation. Based on our 2017 analysis of State retiree mortality during 2015 and 2016, we adjusted the mortality assumption in this valuation. The mortality assumption used in prior valuations is a version of the RP-2000 Mortality Table. We have used a number of versions of this table for 15 years including a fully generational table since 2015. In our 2015 analysis, we compared our actual retiree mortality to a more recent table known as the RP-2014 table. We found the base RP-2014 table did not match our experience so we maintained the RP-2000 table at that time. Our 2017 analysis showed female deaths, in total, were about as expected. However, actual deaths were less than expected at all ages between 65 and 75, and greater than expected at all ages after 80. The male results showed actual deaths less than expected. Based on these results, we must adjust the male table. Since we need to revise the male table, we also looked for a table to better match our results at individual ages for both males and females. The table we adopted for this valuation is based on a blue collar version of the RP-2014 table. The mortality assumption is the fully generational RP-2014 Blue Collar table with Mortality Improvement Scale MP-2016 with females set forward 1 year. The actuarial liability increased $304 million due to this change. Early Retirement Incentive Chapter 79 of the Acts of 2014 established an early retirement incentive (ERI) program for certain employees of the highway division of the Department of Transportation whose positions have been eliminated due to the cessation of manual toll collection. The law provided that eligible members who elected to participate had their retirement allowances determined by adding 5 years to age and/or creditable service (any combination in full years). Most members retiring under the ERI had a date of retirement of October 28, 2016. The ERI was taken by 112 members who retired during 2016. We recently received the data to prepare our cost analysis. The increase in actuarial liability due to the toll collector ERI is approximately $9.9 million. Optional Retirement Plan transfers Chapter 176 of the Acts of 2011, An Act Providing for Pension Reform and Benefit Modernization made a number of changes to the Chapter 32 pension law. One of the changes concerns the Optional Retirement Plan (ORP), a defined contribution plan for higher education employees. The law provided a one-time opportunity for ORP members (and former ORP members) to transfer to the State Retirement System (SRS) and purchase service for the period while subject to the ORP. The amount of payments required is the greater of the ORP balance less employer funded contributions and the amount that would have otherwise been paid into the SRS had these employees been members of the SRS plus interest for the period spent as an active member of the ORP.

S T A T E A C T U A R I A L V A L U A T I O N R E P O R T | J A N U A R Y 1 , 2 0 1 7 6
2. EXECUTIVE SUMMARY (continued) PART B | COMPARISON WITH PRIOR VALUATION AND EXPERIENCE ANALYSIS (continued) Due to concerns regarding potential plan qualification issues with respect to this provision, the State requested a private letter ruling from the Internal Revenue Service (IRS) on issues concerning the taxation of the transferred assets, transfer of participation, and treatment of future employee contributions in both plans. In September, 2013, the IRS responded favorably to the request and the process of transfers began. For the 2016 valuation, we estimated the liability of these members since the data provided was incomplete with respect to the number of members who transferred, credited service, and assets to be transferred from the ORP to SRS. In the 2017 valuation, approximately 1,375 members formerly in the ORP were included in the data provided to us (most are on the active file). This year, the data for these members appears to reflect the full transfer of service and assets to the SRS. Job groups We noted several issues relating to job group as part of the valuation data we received from SRS. A number of members are coded as Job Group 1 but we believe these members should be coded as Job Group 2. This list consists of approximately 5,200 members in the Department of Mental Health (DMH), Social Services and University of Massachusetts Police (only UMass Dartmouth police were coded as Group 2 in the data submission). In addition, it appears there are 446 State Police who are coded as Group 1 but should be coded as Group 3. As we noted in last year’s valuation, these State Police members are not contributing at the 12% contribution rate we would expect for State Police hired after July 1, 1996. We adjusted the job group for DMH, Social Services, UMass Police and State Police in our files. We made these same adjustments in the 2016 valuation except Social Services members were already coded as Group 2 in last years’ data. DMH members with certain titles and Social Services workers with 10 years of service in certain capacities are eligible to be in Group 2. By assuming these members will ultimately be in Group 2, we are being somewhat conservative. Based on our discussions with SRS, most of these members will ultimately be eligible for Group 2 status. After these adjustments, the actuarial liability is approximately $135 million greater than the results using the data as provided. Other Chapter 176 issues There are several other changes under Chapter 176 that we have discussed in previous valuations that have the most impact on decreasing plan liabilities over the longer term. These include an increase in the normal retirement age by two years (for example, from age 65 to age 67 for Group 1 members), an increase in the age (early retirement) reduction factor for ages below the maximum age (from a 4.0% to a 6.0% annual reduction), and an increase in the period for determining a member’s average annual compensation (from 3 years to 5 years). These changes are effective only for members hired after April 1, 2012.
As of January 1, 2017, there were approximately 26,000 members hired after April 1, 2012. Since these members have less than five years of service and are generally young, there is relatively little impact on plan costs (on a percentage basis) in this valuation. The employer normal cost is approximately $32 million lower than it would have been if the prior provisions were in place for these members. The actuarial liability is approximately $75 million lower than it would have been if the prior provisions were in place.
S T A T E A C T U A R I A L V A L U A T I O N R E P O R T | J A N U A R Y 1 , 2 0 1 7 7
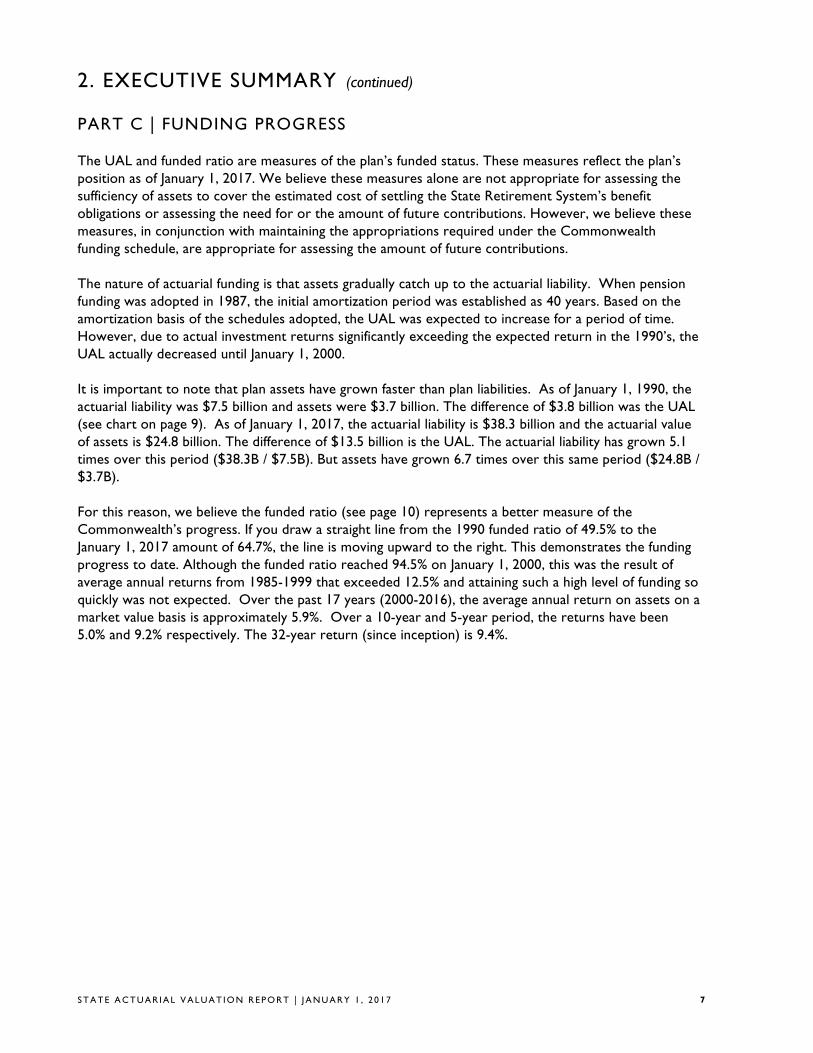
2. EXECUTIVE SUMMARY (continued) PART C | FUNDING PROGRESS The UAL and funded ratio are measures of the plan’s funded status. These measures reflect the plan’s position as of January 1, 2017. We believe these measures alone are not appropriate for assessing the sufficiency of assets to cover the estimated cost of settling the State Retirement System’s benefit obligations or assessing the need for or the amount of future contributions. However, we believe these measures, in conjunction with maintaining the appropriations required under the Commonwealth funding schedule, are appropriate for assessing the amount of future contributions. The nature of actuarial funding is that assets gradually catch up to the actuarial liability. When pension funding was adopted in 1987, the initial amortization period was established as 40 years. Based on the amortization basis of the schedules adopted, the UAL was expected to increase for a period of time. However, due to actual investment returns significantly exceeding the expected return in the 1990’s, the UAL actually decreased until January 1, 2000. It is important to note that plan assets have grown faster than plan liabilities. As of January 1, 1990, the actuarial liability was $7.5 billion and assets were $3.7 billion. The difference of $3.8 billion was the UAL (see chart on page 9). As of January 1, 2017, the actuarial liability is $38.3 billion and the actuarial value of assets is $24.8 billion. The difference of $13.5 billion is the UAL. The actuarial liability has grown 5.1 times over this period ($38.3B / $7.5B). But assets have grown 6.7 times over this same period ($24.8B / $3.7B). For this reason, we believe the funded ratio (see page 10) represents a better measure of the Commonwealth’s progress. If you draw a straight line from the 1990 funded ratio of 49.5% to the January 1, 2017 amount of 64.7%, the line is moving upward to the right. This demonstrates the funding progress to date. Although the funded ratio reached 94.5% on January 1, 2000, this was the result of average annual returns from 1985-1999 that exceeded 12.5% and attaining such a high level of funding so quickly was not expected. Over the past 17 years (2000-2016), the average annual return on assets on a market value basis is approximately 5.9%. Over a 10-year and 5-year period, the returns have been 5.0% and 9.2% respectively. The 32-year return (since inception) is 9.4%.

S T A T E A C T U A R I A L V A L U A T I O N R E P O R T | J A N U A R Y 1 , 2 0 1 7 8
2. EXECUTIVE SUMMARY (continued) PART C | FUNDING PROGRESS (continued) We indicated previously that the actuarial liability as of January 1, 2017 increased $304 million to reflect a revised mortality assumption and $9.9 million for the toll collector ERI. There have been a number of other plan and assumption changes since 2009 that have increased the State’s actuarial liability. These changes include three separate reductions in the investment return assumption and annual adjustments to the mortality assumption prior to the change to a fully generational assumption as of January 1, 2015. The other changes include the adoption of a $13,000 COLA base, the transfer of active members of sheriff departments in six counties to the SRS, the transfer of former members of the Massachusetts Turnpike Authority Retirement System to the SRS, the transfer of ORP members to the SRS, and the 2015 Early Retirement Incentive. Including the changes as of January 1, 2017, the unfunded actuarial liability is approximately $4.26 billion greater than it would have been using the 2009 valuation assumptions and plan provisions. Therefore, on a comparable basis with 2009, the UAL on January 1, 2017 would be $9.3 billion and the funded ratio would be 72.7%. The chart below provides further detail on these changes. Change in Unfunded Actuarial Liability since 2009 Valuation (Dollars in billions)
Assumption changes (with valuation date reflected) (In millions)
Reduction in investment return assumption from 8.25% to 8.0% (2013) $703 Reduction in investment return assumption from 8.0% to 7.75% (2015) 804 Reduction in investment return assumption from 7.75% to 7.50% (2016) 933 Adoption of fully generational mortality assumption (2015) 593 Other mortality adjustments (2012, 2013, 2014) Mortality adjustment (2017)
324 304
Other experience study changes (2013) (541) Total
3 ,120
Plan amendments (with valuation date reflected)
Transfer of Massachusetts Turnpike Authority (2010) 136 Transfer of sheriff departments (2011) 225 $13,000 COLA base (2012) 138 Early Retirement Incentive (2016) 230 Transfer of ORP members (2016) 400 Early Retirement Incentive for toll collectors (2017) Total
10 1 ,139
State
Assumption Changes $3.12
Plan Amendments 1.14
Total $4.26

The chart below compares the Unfunded Actuarial Accrued Liability (UAL) since 1990. The UAL represents the actuarial accrued liability less the actuarial value of plan assets. When there is no UAL, a system is said to be “fully funded”. In this exhibit, estimates were developed for years prior to 2000 to reflect our implementation of updated actuarial software at that time.
On a market value basis the UAL is $13.95 billion.
The UAL increased $43.4 million since January 1, 2016. The revised mortality assumption increased the actuarial liability by $304 million. If the 2017 valuation reflected the 2016 valuation assumptions and plan provisions, the UAL would be $13.24 billion as of January 1, 2017.
2. EXECUTIVE SUMMARY (continued)
PART C | FUNDING PROGRESS (continued)
S T A T E A C T U A R I A L V A L U A T I O N R E P O R T | J A N U A R Y 1 , 2 0 17 9

The chart below shows the State’s funded ratio progress since 1990. The funded ratio represents the actuarial value of plan assets divided by the actuarial accrued liability. When the funded ratio reaches 100%, a system is said to be “fully funded”. In this exhibit, estimates were developed for years prior to 2000 to reflect our implementation of updated actuarial software at that time.
On a market value basis the funded ratio is 63.6%
The funded ratio increased from 63.5% as of January 1, 2016 to 64.7% as of January 1, 2017. The revised mortality assumption decreased the funded ratio. If the 2017 valuation reflected the 2016 valuation assumptions and plan provisions, the funded ratio would be 65.2% as of January 1, 2017.
2. EXECUTIVE SUMMARY (continued)
PART C | FUNDING PROGRESS (continued)
S T A T E A C T U A R I A L V A L U A T I O N R E P O R T | J A N U A R Y 1 , 2 0 17 10
S T A T E A C T U A R I A L V A L U A T I O N R E P O R T | J A N U A R Y 1 , 2 0 1 7 11
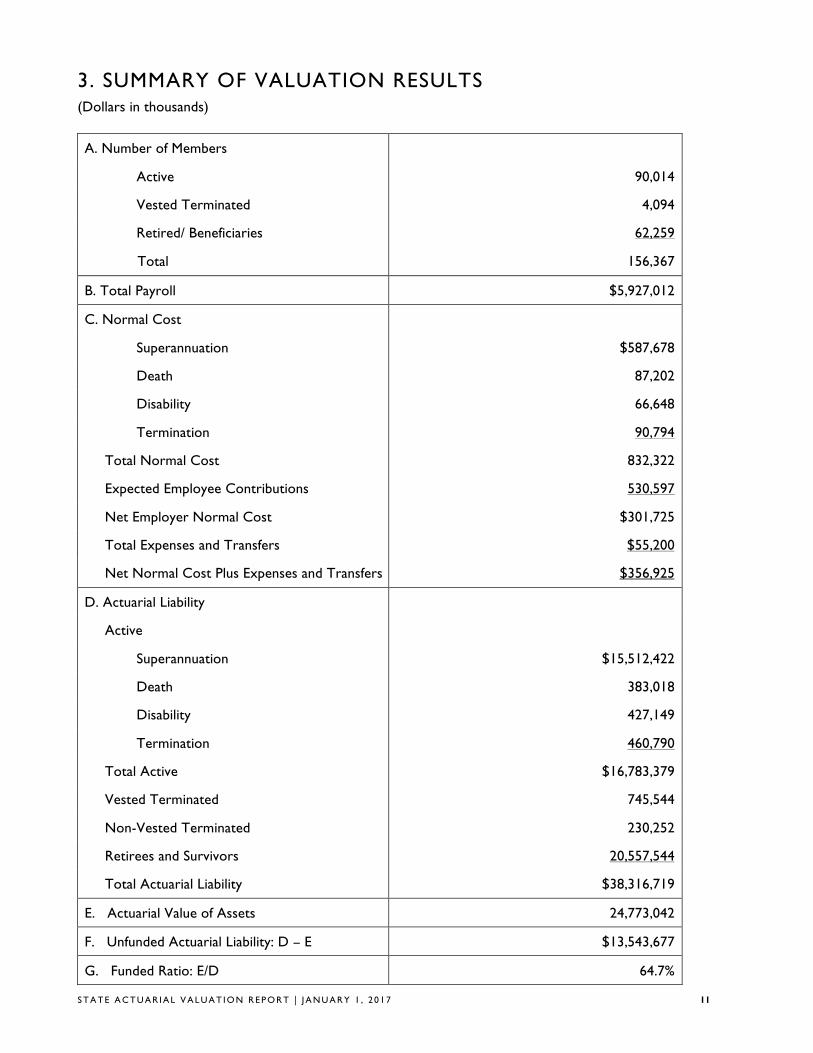
3. SUMMARY OF VALUATION RESULTS (Dollars in thousands)
A. Number of Members
Active 90,014
Vested Terminated 4,094
Retired/ Beneficiaries 62,259
Total 156,367
B. Total Payroll $5,927,012
C. Normal Cost
Superannuation $587,678
Death 87,202
Disability 66,648
Termination 90,794
Total Normal Cost 832,322
Expected Employee Contributions 530,597
Net Employer Normal Cost $301,725
Total Expenses and Transfers $55,200
Net Normal Cost Plus Expenses and Transfers $356,925
D. Actuarial Liability
Active
Superannuation $15,512,422
Death 383,018
Disability 427,149
Termination 460,790
Total Active $16,783,379
Vested Terminated 745,544
Non-Vested Terminated 230,252
Retirees and Survivors 20,557,544
Total Actuarial Liability $38,316,719
E. Actuarial Value of Assets 24,773,042
F. Unfunded Actuarial Liability: D – E $13,543,677
G. Funded Ratio: E/D 64.7%

S T A T E A C T U A R I A L V A L U A T I O N R E P O R T | J A N U A R Y 1 , 2 0 1 7 12
4. DEVELOPMENT OF THE ACTUARIAL GAIN OR LOSS
(in millions)
A. Gain/(loss) on Actuarial Liability
1. Actuarial Liability 1/1/16 36,966
2. Total Normal Cost 1/1/16 845
3. Interest on (1) and (2) at 7.5% 2,836
4. Benefits paid during 2016 [a] 2,050
5. Interest on (4) assuming mid-year payment 77
6. Expected Actuarial Liability 1/1/17 before adjustments: (1)+(2)+(3)-(4)-(5) 38,520
7. Increase due to change in assumptions
304
12 8. Increase due to plan amendment, toll collectors ERI (estimated) 10
9. Expected Actuarial Liability 1/1/17: (6)+(7)+(8) 38,834
10. Actuarial Liability 1/1/17 38,317
11. Gain/(loss): (9)-(10) 517
B. Gain/(loss) on assets
12. Actuarial Value of Assets (AVA) 1/1/16 23,465
13. Interest on (12) at 7.5% 1,760
14. Net Receipts [b] 892
15. Net Disbursements [b] 1,560
16. Net Cash Flow: (14)-(15) (668)
17. Interest on (16) assuming mid-year payment (25)
18. Expected AVA 1/1/17: (12)+(13)+(16)+(17) 24,532
19. AVA 1/1/17 24,773
20. Gain/(loss): (19)-(18) 241
C. Total Gain/(loss): (11)+(20) 758
[a] Estimated [b] Amounts actually received or disbursed by the fund.

S T A T E A C T U A R I A L V A L U A T I O N R E P O R T | J A N U A R Y 1 , 2 0 1 7 13
5. PLAN ASSETS
PART A | SUMMARY OF ASSETS (dollars in thousands unless otherwise specified)
Pension Reserves Investment Trust (State Retirement System) Market value $24,366,420 Actuarial value $24,773,042
The actuarial value of assets (AVA) is determined so that 20% of the investment gain and loss in a given year is recognized annually for the ensuing five years. Therefore, these investment gains and losses are fully recognized after five years. In addition to this treatment of gains and losses, we use a “corridor” approach so that the AVA can never be too far from the market value of assets. Under our approach for the Commonwealth, the AVA cannot be less than 90% nor greater than 110% of the market value. Due to the severity of the 2008 investment loss, and later the 2011 investment loss, the calculated AVA was greater than 110% of the market value each year from January 1, 2009 through January 1, 2012. Therefore, the AVA was set at 110% of the market value for those years. As of January 1, 2013, the 2008 loss was completely recognized and the AVA was 99.6% of the market value. As of January 1, 2014, the AVA was 95.0% of the market value. As of January 1, 2015 the AVA was 95.7% of the market value and as of January 1, 2016, the AVA was 101.2% of the market value. As of January 1, 2017, the AVA is 101.7% of the market value. The AVA is within the specified corridor.

S T A T E A C T U A R I A L V A L U A T I O N R E P O R T | J A N U A R Y 1 , 2 0 1 7 14
5. PLAN ASSETS (cont inued) PART B | ACTUARIAL VALUE OF ASSETS A. Development of 12/31/16 expected actuarial value of assets (Dollars in thousands) 1. Market value of assets (MVA) 12/31/15 $23,176,451 2. Actuarial value of assets (AVA) 12/31/15 (as calculated) $23,465,963 3. Net Receipts 2016 * $891,962 4. Net Disbursements 2016 * $1,559,110 5. Net Cash Flow (3) - (4) ($667,148) 6. Expected investment return on (2): 0.075 x (2) $1,759,947 7. Expected investment return on (5): ½ x 0.075 x (5) ($25,018) 8. Expected AVA 12/31/16: (2) + (5) + (6) + (7) $24,533,744 B. Previous differences not yet amortized 1. Unrecognized amount of 12/31/15 difference a. .2 x 2012 gain $173,289 b. .4 x 2013 gain $597,467 c. .6 x 2014 gain $94,863 d. .8 x 2015 gain ($1,155,131) e. Total ($289,512) C. Gain/(loss) from 2016 1. Market value of assets 12/31/16 $24,366,420 2. Expected market value 12/31/16: A(8) + B(1e) $24,244,232 3. Gain/ (loss) from 2016 investment: (1) – (2) $122,188 D. Development of AVA 12/31/16 1. 2016 gain/(loss) $122,188 2. 2015 gain/(loss) ($1,443,914) 3. 2014 gain/(loss) $158,105 4. 2013 gain/(loss) $1,493,668 5. 2012 gain/(loss) $866,444 6. 20% of 2016 gain/(loss) $24,438 7. 20% of 2015 gain/(loss) ($288,783) 8. 20% of 2014 gain/(loss) $31,621 9. 20% of 2013 gain/(loss) $298,734 10. 20% of 2012 gain/(loss) $173,289 11. Total: (6) + (7) + (8) + (9) + (10) $239,298 12. Calculated actuarial value 12/31/16: A(8) + D(11) $24,773,042 13. Percentage of market value 101.7% 14. Actuarial value: (12) but not less than 90% nor greater than 110% of C(1) $24,773,042 * Reflects actual cash flow of PRIT fund.

S T A T E A C T U A R I A L V A L U A T I O N R E P O R T | J A N U A R Y 1 , 2 0 1 7 15
6. INFORMATION ON SYSTEM MEMBERSHIP A critical element of an actuarial valuation is accurate and up-to-date membership information. PERAC conducted an extensive review of member data submitted for this valuation.
PART A | ACTIVE MEMBERS Actives Vested Terminations
Number of Members 90,014 4,094
Average Age 46.9 53.7
Average Service 12.4 15.4
Average Salary $65,845 $58,010
Average Annuity Savings Fund Balance
$62,643
$64,284
Age by Service Distribution of Active Members
Years of Service
Present Age
0 – 4 5 – 9 10 – 14 15 – 19 20 – 24 25 – 29 30+ Total
0 - 24 2,305 7 2,312
25 - 29 6,858 798 14 7,670
30 - 34 5,677 2,978 891 12 9,558
35 - 39 3,816 2,367 2,309 636 8 9,136
40 - 44 2,743 1,846 1,964 2,220 523 16 9,312
45 - 49 2,758 1,878 2,063 2,456 2,037 907 51 12,150
50 - 54 2,383 1,725 1,896 2,004 1,851 2,169 1,156 13,184
55 - 59 1,935 1,507 1,726 1,861 1,549 1,854 2,504 12,936
60 - 64 1,079 1,056 1,274 1,462 1,148 1,096 1,817 8,932
65+ 433 617 671 713 607 532 1,251 4,824
Total 29,987 14,779 12,808 11,364 7,723 6,574 6,779 90,014
S T A T E A C T U A R I A L V A L U A T I O N R E P O R T | J A N U A R Y 1 , 2 0 1 7 16
6. INFORMATION ON SYSTEM MEMBERSHIP (continued)
PART A | ACTIVE MEMBERS (continued)
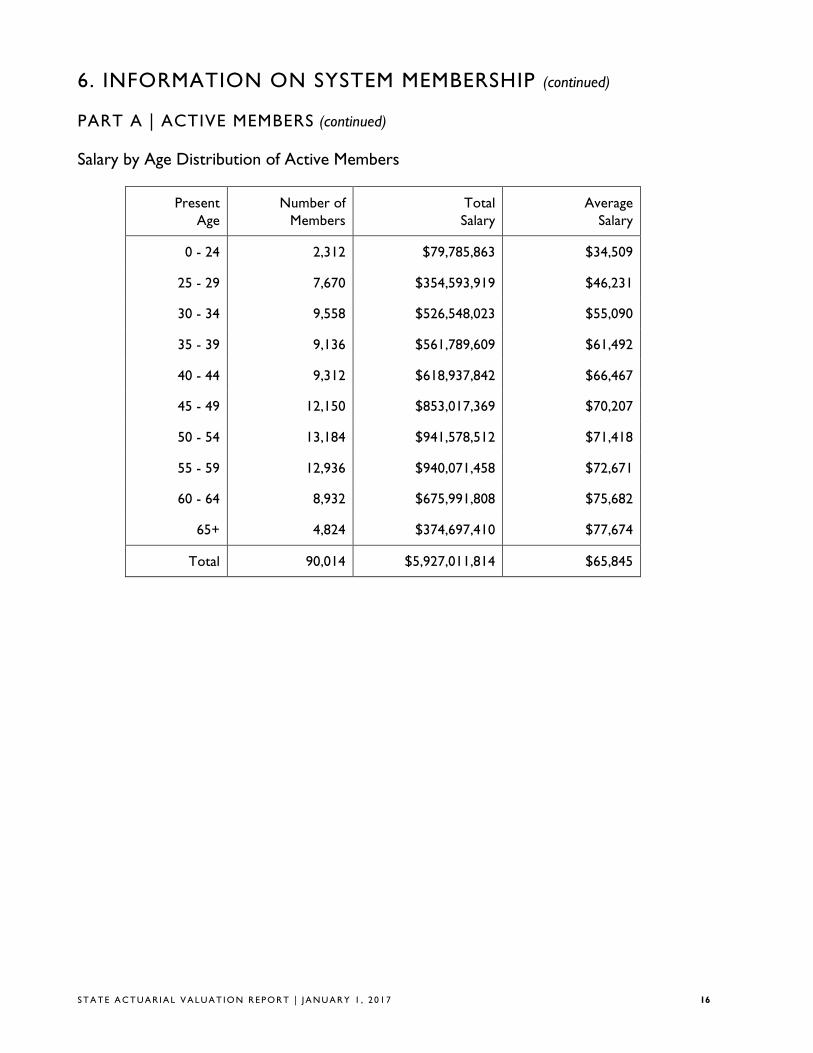
Salary by Age Distribution of Active Members
Present Age
Number of Members
Total Salary
Average Salary
0 - 24 2,312 $79,785,863 $34,509
25 - 29 7,670 $354,593,919 $46,231
30 - 34 9,558 $526,548,023 $55,090
35 - 39 9,136 $561,789,609 $61,492
40 - 44 9,312 $618,937,842 $66,467
45 - 49 12,150 $853,017,369 $70,207
50 - 54 13,184 $941,578,512 $71,418
55 - 59 12,936 $940,071,458 $72,671
60 - 64 8,932 $675,991,808 $75,682
65+ 4,824 $374,697,410 $77,674
Total 90,014 $5,927,011,814 $65,845

S T A T E A C T U A R I A L V A L U A T I O N R E P O R T | J A N U A R Y 1 , 2 0 1 7 17
6. INFORMATION ON SYSTEM MEMBERSHIP (continued)
PART B | RETIREES AND SURVIVORS
Superannuation Ordinary Disability
Accidental Disability
Survivors Total
Number of Members 51,844 636 3,305 6,474 62,259
Average Age 71.9 64.7 64.3 75.2 71.7
Average Annual Benefit $35,343 $20,063 $40,181 $18,385 $33,680
Benefit by Payment and Retirement Type
Superannuation Ordinary Disability
Accidental Disability
Survivors Total
Annuity $355,001,510 $2,098,760 $10,348,046 $18,587,668 $386,035,984
Pension $1,477,309,307 $10,661,163 $122,448,654 $100,435,668 $1,710,854,792
Total $1,832,310,817 $12,759,923 $132,796,700 $119,023,336 $2,096,890,776

S T A T E A C T U A R I A L V A L U A T I O N R E P O R T | J A N U A R Y 1 , 2 0 1 7 18
6. INFORMATION ON SYSTEM MEMBERSHIP (continued)
PART B | RETIREES & SURVIVORS (continued)
Benefit by Age Distribution
Present Age Number of Members
Total Benefits Average Benefits
Less than 40 137 $3,508,527 $25,610
40 - 44 160 $5,126,949 $32,043
45 - 49 821 $28,855,796 $35,147
50 - 54 1,649 $58,087,566 $35,226
55 - 59 4,221 $147,392,196 $34,919
60 - 64 8,692 $330,964,287 $38,077
65 - 69 13,438 $512,496,199 $38,138
70 - 74 11,778 $417,060,150 $35,410
75 - 79 7,786 $250,751,978 $32,205
80 - 84 6,026 $172,687,801 $28,657
85 - 89 4,369 $106,574,809 $24,393
90+ 3,182 $63,384,520 $19,920
Totals 62,259 $2,096,890,776 $33,680

S T A T E A C T U A R I A L V A L U A T I O N R E P O R T | J A N U A R Y 1 , 2 0 1 7 19
7. VALUATION COST METHODS
PART A | ACTUARIAL COST METHOD
The Actuarial Cost Method which was used to determine pension liabilities in this valuation is known as the Entry Age Normal Cost Method. Under this method the Normal Cost for each active member on the valuation date is determined as the level percent of salary, which, if paid annually from the date the employee first became a member of the retirement system, would fully fund by retirement, death, disability or termination, the projected benefits which the member is expected to receive. The Actuarial Liability for each member is determined as the present value as of the valuation date of all projected benefits which the member is expected to receive, minus the present value of future annual Normal Cost payments expected to be made to the fund. Since only active members have a Normal Cost, the Actuarial Liability for inactives, retirees and survivors is simply equal to the present value of all projected benefits. The sum of Normal Cost and Actuarial Liability for each member is equal to the Normal Cost and Actuarial Liability for the Plan. The Unfunded Actuarial Liability is the Actuarial Liability less current assets.
The Normal Cost for a member will remain a level percent of salary for each year of membership except for changes in provisions of the Plan or the actuarial assumptions employed in projection of benefits and present value determinations. The Normal Cost for the entire system will also change due to the addition of new members or the retirement, death or termination of members. The Actuarial Liability for a member will increase each year to reflect the additional accrual of Normal Cost. It will also change if the Plan provisions or actuarial assumptions are changed.
Differences each year between the actual experience of the Plan and the experience projected by the actuarial assumptions are reflected by adjustments to the Unfunded Actuarial Liability. An experience difference which increases the Unfunded Actuarial Liability is called an Actuarial Loss and one which decreases the Unfunded Actuarial Liability is called an Actuarial Gain.
PART B | ASSET VALUATION METHOD In valuations prior to 1998, plan assets were determined at market value. As part of the 1998 valuation, this methodology was adjusted so that investment gains and losses for a given year would not be fully recognized until five years have passed. This calculation recognizes 20% of the gain or loss occurring in the prior year, 40% of the gain or loss occurring two years ago, etc., so that 100% of the gain or loss occurring 5 or more years ago is fully recognized. This approach reduces the potential volatility in the market value approach from year to year. Under our corridor approach, the actuarial value of assets cannot be less than 90% nor greater than 110% of the market value. The actuarial value of assets as of January 1, 2017 is 101.7% of the market value.

S T A T E A C T U A R I A L V A L U A T I O N R E P O R T | J A N U A R Y 1 , 2 0 1 7 20
8. ACTUARIAL ASSUMPTIONS Investment Return 7.50% per year net of investment expenses The investment return assumption is a long term assumption and is based on capital market expectations by asset class, historical returns, and professional judgment. We considered analysis prepared by PRIM’s investment advisor using a building block approach which included expected returns by asset class, risk analysis, and the determination of a 30 year expected target rate of return. Interest Rate Credited to the Annuity Savings Fund 3.5% per year Assumed Rate of Cost of Living Increases (COLA) 3.0% per year (on the first $13,000 of an allowance) Mortality Pre-retirement mortality reflects RP-2014 Blue Collar Employees table projected generationally with Scale MP-2016 set forward 1 year for females. (Prior assumption: RP-2000 Employees table projected generationally with Scale BB and a base year of 2009 (gender distinct)). Post-retirement mortality reflects RP-2014 Blue Collar Healthy Anniitant table projected generationally with Scale MP-2016 set forward 1 year for females (Prior assumption: RP-2000 Healthy Annuitant table projected generationally with Scale BB and a base year of 2009 (gender distinct)). For disabled members, the mortality rate is assumed to be in accordance with the RP-2000 Healthy Annuitant Table projected generationally with Scale BB and a base year of 2015 (gender distinct). It is assumed that 75% of pre-retirement deaths are job-related for Group 1 and 2 members and 90% are job-related for Group 4 members. For members retired under an Accidental Disability, 40% of deaths are assumed to be from the same cause as the disability. The mortality assumptions reflect our recent experience analysis published in 2014 (based on the years 2006-2011), updated to reflect actual experience from 2012 through 2016 for post-retirement mortality, and professional judgment. As such, this assumption reflects observed current mortality as well as expected mortality improvement. The disabled member assumptions remain unchanged from last valuation.

S T A T E A C T U A R I A L V A L U A T I O N R E P O R T | J A N U A R Y 1 , 2 0 1 7 21
8. ACTUARIAL ASSUMPTIONS (cont inued) Salary Increase Based on an analysis of past experience. Annual rates are shown below. Service Groups 1& 2 Group 3 Group 4 0 7.00% 7.00% 9.00% 1 6.50% 7.00% 8.00% 2 6.00% 7.00% 7.50% 3 5.50% 7.00% 7.00% 4 5.50% 6.75% 6.75% 5 5.25% 6.25% 6.25% 6 5.00% 5.25% 5.75% 7 4.75% 4.75% 5.25% 8-12 4.75% 4.75% 4.75% 13-15 4.50% 4.75% 4.75% 16-19 4.25% 4.75% 4.75% 20+ 4.00% 4.50% 4.50% The salary increase assumption reflects both prior experience (2014 study) and professional judgment. The assumption for 2013 to 2015 was modified to reflect current conditions. Disability Based on an analysis of past experience. Sample annual rates are shown below. Age Group 1 Group 2 Group 3 Group 4 20 0.00010 0.00052 0.0010 0.0020 30 0.00010 0.00072 0.0016 0.0021 40 0.00068 0.00210 0.0036 0.0071 50 0.00133 0.00420 0.0094 0.0110 60 0.00120 0.00500 0.0430 0.0080 It is also assumed that 75% of disabilities will be job-related for Group 1 and 2 members, and 95% will be job-related for Group 3 and 4 members. Disability rates are based on our most recent experience analysis (2014) which reviewed age, gender and job group. Final assumptions reflect this analysis as well as professional judgment.

S T A T E A C T U A R I A L V A L U A T I O N R E P O R T | J A N U A R Y 1 , 2 0 1 7 22
8. ACTUARIAL ASSUMPTIONS (continued) Retirement
Group 1 Group 2 Group 3 Group 4
Age Male Female
45 0.000 0.000 0.000 0.020 0.060 46 0.000 0.000 0.000 0.020 0.060 47 0.000 0.000 0.000 0.050 0.060 48 0.000 0.000 0.000 0.050 0.060 49 0.000 0.000 0.000 0.050 0.060 50 0.030 0.030 0.020 0.050 0.060 51 0.030 0.030 0.020 0.060 0.060 52 0.030 0.030 0.020 0.070 0.060 53 0.030 0.030 0.030 0.080 0.075 54 0.030 0.035 0.040 0.090 0.150 55 0.035 0.050 0.075 0.100 0.250 56 0.035 0.050 0.075 0.100 0.150 57 0.040 0.055 0.080 0.110 0.150 58 0.050 0.060 0.100 0.110 0.150 59 0.060 0.065 0.120 0.120 0.150 60 0.090 0.075 0.150 0.140 0.200 61 0.110 0.100 0.150 0.150 0.200 62 0.150 0.150 0.150 0.150 0.200 63 0.150 0.150 0.150 0.150 0.200 64 0.160 0.150 0.200 0.250 0.300 65 0.200 0.200 0.200 0.250 0.500 66 0.200 0.200 0.200 0.250 0.250 67 0.200 0.200 0.200 0.250 0.250 68 0.200 0.200 0.200 0.250 0.250 69 0.200 0.200 0.200 0.250 0.250 70 1.000 1.000 1.000 1.000 1.000
See page 20 for an explanation of retirement rates for employees hired on or after April 2, 2012. Retirement rates are based on our most recent experience analysis (2014) which reviewed age, service, gender and job group. Final assumptions reflect this analysis as well as professional judgment.

S T A T E A C T U A R I A L V A L U A T I O N R E P O R T | J A N U A R Y 1 , 2 0 1 7 23
8. ACTUARIAL ASSUMPTIONS (continued) Withdrawal Based on an analysis of past experience. For Groups 1 and 2, rates are both age and service based for service up to 10 years. After 10 years of service, rates are age based. For groups 3 and 4 rates are service based. Sample annual rates are shown below. Groups 1 & 2
Age Service 0 5 10+
20 0.270 0.120 0.045 30 0.230 0.100 0.045 40 0.160 0.080 0.030 50 0.180 0.060 0.030
Groups 3 & 4
Service Group 3 Group 4 0 0.007 0.090 5 0.007 0.060 10 0.005 0.035 15 0.005 0.020
20+ 0.005 0.015 See below for an explanation of withdrawal rates for employees hired on or after April 2, 2012. Withdrawal rates are based on our most recent experience analysis (2014) which reviewed age, service, gender and job group. Final assumptions reflect this analysis as well as professional judgment. Members Hired on or After April 2, 2012 Chapter 176 of the Acts of 2011 changed the retirement eligibility for the different job groups. For example, Group 1 eligibility changed from 55 years old with 10 years of service to 60 years old with 10 years of service (Chapter 176 removed the provision that allowed retirement at any age with 20 years of service). Our software system is programmed such that at any given age, a member is assumed to either retire or terminate, but not both. Therefore, we adjusted the retirement and termination rates for members impacted by Chapter 176. For example, for Group 1 members, we removed retirement rates for ages 50-59. Termination rates remain in effect for those years. We will monitor these assumptions going forward. Loading and Administrative Expenses We increased the normal cost by 2% and the actuarial accrued liability of active members by $250 million to account for certain Chapter 32 benefits that cannot be readily valued with our software system. Such benefits include, but are not limited to, benefits provided under Sections10, 28M, 28N, 65D, and 100.

S T A T E A C T U A R I A L V A L U A T I O N R E P O R T | J A N U A R Y 1 , 2 0 1 7 24
9. SUMMARY OF PLAN PROVISIONS ADMINISTRATION
There are 104 contributory retirement systems for public employees in Massachusetts. Each system is governed by a retirement board and all boards, although operating independently, are governed by Chapter 32 of the Massachusetts General Laws. This law in general provides uniform benefits, uniform contribution requirements and a uniform accounting and funds structure for all systems.
PARTICIPATION Participation is mandatory for all full-time employees. Eligibility with respect to part-time, provisional, temporary, seasonal or intermittent employment is governed by regulations promulgated by the retirement board, and approved by PERAC. Membership is optional for certain elected officials. There are 4 classes of membership in the retirement system:
Group 1: General employees, including clerical, administrative, technical and all other employees not otherwise classified.
Group 2: Certain specified hazardous duty positions. Group 3: Officers and inspectors of the Department of State Police.
Group 4: Corrections officers, and other specified hazardous positions.
MEMBER CONTRIBUTIONS Member contributions vary depending on the most recent date of membership:
Prior to 1975: 5% of regular compensation 1975 – 1983: 7% of regular compensation 1984 to 6/30/96: 8% of regular compensation 7/1/96 to present: 9% of regular compensation 12% of regular compensation for State Police officers 1979 to present: an additional 2% of regular
compensation in excess of $30,000. In addition, members of Group 1 who join the system on or after April 2, 2012 will have their withholding rate reduced to 6% after achieving 30 years of creditable service.

S T A T E A C T U A R I A L V A L U A T I O N R E P O R T | J A N U A R Y 1 , 2 0 1 7 25
9. SUMMARY OF PLAN PROVISIONS (cont inued)
RATE OF INTEREST Interest on regular deductions made after January 1, 1984 is at a rate established by PERAC in consultation with the Commissioner of Banks. The rate is obtained from the average rates paid on individual savings accounts by a representative sample of at least 10 financial institutions.
RETIREMENT AGE The mandatory retirement age for some Group 2 and Group 4 employees is age 65. Most Group 2 and Group 4 members may remain in service after reaching age 65. Group 2 and Group 4 members who are employed in certain public safety positions are required to retire at age 65. There is no mandatory retirement age for employees in Group 1.
SUPERANNUATION RETIREMENT A person who became a member before April 2, 2012 is eligible for a superannuation retirement allowance (service retirement) upon meeting the following conditions:
• completion of 20 years of service, or • attainment of age 55 if hired prior to 1978, or if classified in Group 4, or • attainment of age 55 with 10 years of service, if hired after 1978, and if classified in Group 1 or 2
A person who became a member on or after April 2, 2012 is eligible for a superannuation retirement allowance (service retirement) upon meeting the following conditions:
• attainment of age 60 with 10 years of service if classified in Group 1, or • attainment of age 55 with 10 years of service if classified in Group 2, or • attainment of age 55 if classified in Group 4.
S T A T E A C T U A R I A L V A L U A T I O N R E P O R T | J A N U A R Y 1 , 2 0 1 7 26
9. SUMMARY OF PLAN PROVISIONS (cont inued) AMOUNT OF BENEFIT
A member’s annual allowance is determined by multiplying average salary by a benefit rate related to the member’s age and job classification at retirement, and the resulting product by his or her creditable service. The amount determined by the benefit formula cannot exceed 80% of the member’s highest three-year (or five-year salary as discussed below) average salary. For veterans as defined in G.L. c. 32, s. 1, there is an additional benefit of $15 per year for each year of creditable service, up to a maximum of $300. • Salary is defined as gross regular compensation. For employees who become members after January 1, 2011, regular compensation is limited to 64% of the federal limit found in 26 U.S.C. 401(a)(17). In addition, regular compensation for members who retire after April 2, 2012 will be limited to prohibit “spiking” of a member’s salary to increase the retirement benefit. • For persons who became members prior to April 2, 2012, average salary is the average annual rate of regular compensation received during the three consecutive years that produce the highest average, or, if greater, during the last three years (whether or not consecutive) preceding retirement. • For persons who became members on or after April 2, 2012, average salary is the average annual rate of regular compensation received during the 5 consecutive years that produce the highest average, or, if greater, during the last 5 years (whether or not consecutive) preceding retirement. • The benefit rate varies with the member’s retirement age. For persons who became members prior to April 2, 2012 the highest rate of 2.5% applies to Group 1 employees who retire at or after age 65, Group 2 employees who retire at or after age 60, and Group 4 employees who retire at or after age 55. A .1% reduction is applied for each year of age under the maximum age for the member’s group. For Group 2 employees who terminate from service under age 55, the benefit rate for a Group 1 employee shall be used. • For persons who became members on or after April 2, 2012 and retire with less than 30 years of creditable service, the highest rate of 2.5% applies to Group 1 employees who retire at or after age 67, Group 2 employees who retire at or after age 62, and to Group 4 employees who retire at or after age 57. A .15% reduction is applied for each year of age under the maximum age for the member’s group. • For persons who became members on or after April 2, 2012 and retire with more than 30 years of creditable service, the highest rate of 2.5% applies to Group 1 employees who retire at or after age 67, Group 2 employees who retire at or after age 62, and Group 4 employees who retire at or after age 55. A .125% reduction is applied for each year of age under the maximum age for the member’s group. The allowance of state police officers is calculated using a slightly different formula. Information regarding this formula can be obtained directly from the State Retirement Board.

S T A T E A C T U A R I A L V A L U A T I O N R E P O R T | J A N U A R Y 1 , 2 0 1 7 27
9. SUMMARY OF PLAN PROVISIONS (cont inued)
DEFERRED VESTED BENEFIT A participant who has attained the requisite years of creditable service can elect to defer his or her retirement until a later date. Group 4 employees cannot defer beyond age 65. All participants must begin to receive a retirement allowance or withdraw their accumulated deductions no later than April 15 of the calendar year following the year they reach age 70½.
WITHDRAWAL OF CONTRIBUTIONS Member contributions may be withdrawn upon termination of employment. The interest rate for employees who first become members on or after January 1, 1984 who voluntarily withdraw their contributions with less than 10 years of service will be 3%. Interest payable on all other withdrawals will be set at regular interest.
DISABILITY RETIREMENT The Massachusetts Retirement Plan provides two types of disability retirement benefits:
ORDINARY DISABILITY Eligibility: Non-veterans who become totally and permanently disabled by reason of a non-job related condition with at least ten years of creditable service. Veterans with ten years of creditable service who become totally and permanently disabled by reason of a non-job related condition prior to reaching “maximum age”. “Maximum age” applies only to employees classified in Group 4 who are subject to mandatory retirement. Retirement Allowance: For persons who became members prior to April 2, 2012, the benefit is equal to the accrued superannuation retirement benefit as if the member were age 55. If the member is a veteran, the benefit is 50% of the member’s final rate of salary during the preceding 12 months, plus an annuity based upon accumulated member contributions plus credited interest. If the member is over age 55, he or she will receive not less than the superannuation allowance to which he or she is entitled. For persons in Group 1 who became members on or after April 2, 2012, the benefit is equal to the accrued superannuation retirement benefit as if the member were age 60. If the member is a veteran, the benefit is 50% of the member’s final rate of salary during the preceding 12 months, plus an annuity based upon accumulated member contributions plus credited interest. If the member is over age 60, he or she will receive not less than the superannuation allowance to which he or she would have been entitled had they retired for superannuation. For persons in Group 2 and Group 4 who became members on or after April 2, 2012, the benefit is equal to the accrued superannuation retirement benefit as if the member was age 55. If the member is a veteran, the benefit is 50% of the member’s final rate of salary during the preceding 12 months, plus an annuity based upon accumulated member contributions plus credited interest. If the member is over age 55, he or she will receive not less than the superannuation allowance to which he or she is entitled.

S T A T E A C T U A R I A L V A L U A T I O N R E P O R T | J A N U A R Y 1 , 2 0 1 7 28
9. SUMMARY OF PLAN PROVISIONS (cont inued) ACCIDENTAL DISABILITY
Eligibility: Applies to members who become permanently and totally unable to perform the essential duties of the position as a result of a personal injury sustained or hazard undergone while in the performance of duties. There is no minimum age or service requirement. Retirement Allowance: 72% of salary plus an annuity based on accumulated member contributions, with interest. This amount is not to exceed 100% of pay. For those who became members-in-service after January 1, 1988 or who have not been members-in-service continually since that date, the amount is limited to 75% of pay. There is an additional pension of $871.56 per year per child who is under 18 at the time of the member’s retirement, with no age limitation if the child is mentally or physically incapacitated from earning. The additional pension may continue up to age 22 for any child who is a full-time student at an accredited educational institution. Veterans, as defined in G.L. c. 32, s. 1, receive an additional benefit of $15 per year for each year of creditable service, up to a maximum of $300.
ACCIDENTAL DEATH Eligibility: Applies to members who die as a result of a work-related injury or if the member was retired for accidental disability and the death was the natural and proximate result of the injury or hazard undergone on account of which such member was retired. Allowance: An immediate payment to a named beneficiary equal to the accumulated deductions at the time of death, plus a pension equal to 72% of current salary and payable to the surviving spouse, dependent children or the dependent parent, plus a supplement of $871.56 per year, per child payable to the spouse or legal guardian until all dependent children reach age 18 or 22 if a full-time student, unless mentally or physically incapacitated. The surviving spouse of a member of a police or fire department or any corrections officer who, under specific and limited circumstances detailed in the statute, suffers an accident and is killed or sustains injuries while in the performance of his duties that results in his death, may receive a pension equal to the maximum salary for the position held by the member upon his death. In addition, an eligible family member of such a firefighter, public prosecutor, police officer or corrections officer may receive a one-time payment of $150,000.00 from the State Retirement Board.

S T A T E A C T U A R I A L V A L U A T I O N R E P O R T | J A N U A R Y 1 , 2 0 1 7 29
9. SUMMARY OF PLAN PROVISIONS (cont inued) DEATH AFTER ACCIDENTAL DISABILITY RETIREMENT
Effective November 7, 1996, Accidental Disability retirees were allowed to select Option C at retirement and provide a benefit for an eligible survivor. For Accidental Disability retirees prior to November 7, 1996, who could not select Option C, if the member’s death is from a cause unrelated to the condition for which the member received accidental disability benefits, a surviving spouse will receive an annual allowance of $12,000.
DEATH IN ACTIVE SERVICE Allowance: An immediate allowance equal to the Option C benefit that would have been payable had the member retired and selected Option C on the day before his or her death. For a member who became a member prior to April 2, 2012 whose death occurred prior to the member’s superannuation retirement age, the age 55 benefit rate is used. If the member died after age 55, the rate for the actual age is used. For a member classified in Group 1 who became a member on or after April 2, 2012 whose death occurred prior to the member’s superannuation retirement age, the age 60 benefit rate is used. If the member died after age 60, the rate for the actual age is used. The minimum annual allowance payable to the surviving spouse of a member-in-service who dies with at least two years of creditable service is $6,000, provided that the member and the spouse were married for at least one year and living together on the member’s date of death. The surviving spouse of such a member-in-service receives an additional allowance equal to the sum of $1,440 per year for the first child and $1,080 per year for each additional child until all dependent children reach age 18 or 22 if a full-time student, unless mentally or physically incapacitated.
COST OF LIVING A cost of living adjustment (COLA) is determined based upon the increase in the Consumer Price Index (CPI) used for indexing Social Security benefits, but cannot exceed 3.0% on the first $13,000 of a retiree’s benefit.

S T A T E A C T U A R I A L V A L U A T I O N R E P O R T | J A N U A R Y 1 , 2 0 1 7 30
9. SUMMARY OF PLAN PROVISIONS (cont inued) METHODS OF PAYMENT
A member may elect to receive his or her retirement allowance in one of 3 forms of payment. Option A: Total annual allowance, payable in monthly installments, commencing at retirement and terminating at the member’s death. Option B: A reduced annual allowance, payable in monthly installments, commencing at retirement and terminating at the death of the member, provided, however, that if the total amount of the annuity portion received by the member is less than the amount of his or her accumulated deductions, including interest, the difference or balance of his accumulated deductions will be paid in a lump sum to the retiree’s beneficiary or beneficiaries of choice. Option C: A reduced annual allowance, payable in monthly installments, commencing at retirement. At the death of the retired employee, 2/3 of the allowance is payable to the member’s designated beneficiary (who may be the spouse, or former spouse who is unmarried at the time of retirement for a member whose retirement becomes effective on or after February 2, 1992, the child, parent, or sibling of the employee) for the life of the beneficiary. If the beneficiary pre-deceases the retiree, the benefit payable to the retiree increases (or “pops up”) to Option A based on the factor used to determine the Option C benefit at retirement. The Option C became available to accidental disability retirees on November 7, 1996.
ALLOCATION OF PENSION COSTS
If a member’s total creditable service was partly earned by employment in more than one retirement system, the cost of the "pension portion" is allocated between the different systems pro rata based on the member’s service within each retirement system. If a member received regular compensation concurrently from two or more systems on or after January 1, 2010, and was not vested in both systems as of January 1, 2010, and did not meet certain other requirements as set forth in the statute, such a pro-ration will be undertaken. This is because such a person will receive a separate retirement allowance from each system.

S T A T E A C T U A R I A L V A L U A T I O N R E P O R T | J A N U A R Y 1 , 2 0 1 7 31
10. GLOSSARY OF TERMS
ACTUARIAL ACCRUED LIABILITY That portion of the Actuarial Present Value of pension plan benefits which is not provided by future Normal Costs or employee contributions. It is the portion of the Actuarial Present Value attributable to service rendered as of the Valuation Date.
ACTUARIAL ASSUMPTIONS Assumptions, based upon past experience or standard tables, used to predict the occurrence of future events affecting the amount and duration of pension benefits, such as: mortality, withdrawal, disablement and retirement; changes in compensation; rates of investment earnings and asset appreciation or depreciation; and any other relevant items.
ACTUARIAL COST METHOD (OR FUNDING METHOD) A procedure for allocating the Actuarial Present Value of all past and future pension plan benefits to the Normal Cost and the Actuarial Accrued Liability.
ACTUARIAL GAIN OR LOSS (OR EXPERIENCE GAIN OR LOSS) A measure of the difference between actual experience and that expected based upon the set of Actuarial Assumptions, during the period between two Actuarial Valuation dates. Note: The effect on the Accrued Liability and/or the Normal Cost resulting from changes in the Actuarial Assumptions, the Actuarial Cost Method or pension plan provisions would be described as such, not as an Actuarial Gain (Loss).
ACTUARIAL PRESENT VALUE The dollar value on the valuation date of all benefits expected to be paid to current members based upon the Actuarial Assumptions and the terms of the Plan.
AMORTIZATION PAYMENT That portion of the pension plan appropriation which represents payments made to pay interest on and the reduction of the Unfunded Accrued Liability.

S T A T E A C T U A R I A L V A L U A T I O N R E P O R T | J A N U A R Y 1 , 2 0 1 7 32
1 0 . GLOSSARY OF TERMS (continued)
ANNUAL STATEMENT The statement submitted to PERAC each year that describes the asset holdings and Fund balances as of December 3l and the transactions during the calendar year that affected the financial condition of the retirement system.
ANNUITY RESERVE FUND The fund into which total accumulated deductions, including interest, is transferred at the time a member retires, and from which annuity payments are made.
ANNUITY SAVINGS FUND The fund in which employee contributions plus interest credited are held for active members and for former members who have not withdrawn their contributions and are not yet receiving a benefit (inactive members).
ASSETS The value of securities held by the plan.
COST OF BENEFITS The estimated payment from the pension system for benefits for the fiscal year.
FUNDING SCHEDULE The schedule based upon the most recently approved actuarial valuation which sets forth the amount which would be appropriated to the pension system in accordance with Section 22C of M.G.L. Chapter 32.
GASB Governmental Accounting Standards Board

S T A T E A C T U A R I A L V A L U A T I O N R E P O R T | J A N U A R Y 1 , 2 0 1 7 33
10. GLOSSARY OF TERMS (continued)
NORMAL COST Total Normal Cost is that portion of the Actuarial Present Value of pension plan benefits, which is to be paid in a single fiscal year. The Employee Normal Cost is the amount of the expected employee contributions for the fiscal year. The Employer Normal Cost is the difference between the Total Normal Cost and the Employee Normal Cost.
PENSION FUND The fund into which appropriation amounts as determined by PERAC are paid and from which pension benefits are paid.
PENSION RESERVE FUND The fund which shall be credited with all amounts set aside by a system for the purpose of establishing a reserve to meet future pension liabilities. These amounts would include excess interest earnings.
SPECIAL FUND FOR MILITARY SERVICE CREDIT The fund which is credited with amounts paid by the retirement board equal to the amount which would have been contributed by a member during a military leave of absence as if the member had remained in active service of the retirement board. In the event of retirement or a non-job related death, such amount is transferred to the Annuity Reserve Fund. In the event of termination prior to retirement or death, such amount shall be transferred to the Pension Fund.
UNFUNDED ACCRUED LIABILITY The excess of the Actuarial Accrued Liability over the Assets.


PUBLIC EMPLOYEE RETIREMENT ADMINISTRATION COMMISSIONFive Middlesex Avenue | Suite 304 | Somerville, MA 02145Ph: 617.666.4446 | Fax: 617.628.4002TTY: 617.591.8917 | Web: www.mass.gov/perac