state parks and forests: funding parks and forests... · individual parks to be ... the parks...
TRANSCRIPT

Staff Findings and Recommendations
State Parks and Forests: Funding
January 23, 2014
Legislative Program Review
and Investigations Committee Connecticut General Assembly
2013-2014 Committee Members
Senate
John A. Kissel, Co-Chair
John W. Fonfara
Steve Cassano
Eric D. Coleman
Anthony Guglielmo
Joe Markley
House
Mary M. Mushinsky, Co-Chair
Christie M. Carpino
Brian Becker
Marilyn Giuliano
Brenda L. Kupchick
Diana S. Urban
(860) 240-0300
Committee Staff on Project
Brian Beisel, Principal Analyst
Eric Michael Gray, Associate Legislative Analyst
Legislative Program Review and Investigations Committee
Connecticut General Assembly
State Capitol Room 506
Hartford, CT 06106
www.cga.ct.gov/pri/index.asp [email protected]
PRI Staff Findings and Recommendations Highlights January 2014
State Parks and Forests: Funding
Background
In June 2013, the program review committee authorized a study of Connecticut’s state parks and forests. The study focuses on funding of the state park system, including a comparison of revenues and expenditures within the park system and an assessment of the adequacy of funding to support short- and long-term operational needs.
State parks were first established in Connecticut 100 years ago, under the supervision of the State Park Commission. Now under the Department of Energy and Environmental Protection (DEEP), there are 139 state parks and forests (255,000 acres) providing public outdoor recreation areas in the state. While several divisions and bureaus within DEEP are involved in parks, park operations are handled within the State Parks and Public Outreach Division (Parks Division) by a combination of park supervisors, maintainers, and seasonal employees.
The state park season runs from Memorial Day to Labor Day, though park operations extend beyond these months. During the season, 35 (of 139) parks charge fees for parking, admission, or camping. Fee levels are set by regulation and can vary by location, residency status, and time of day. The last fee change occurred in 2010. Prior to FY 10, a portion of the revenues from collection of park fees was used by the Parks Division through a non-lapsing special fund. Since FY 10, park-generated revenues have gone to the General Fund.
Committee staff used a variety of data collection methods to conduct the study, including a review of financial and informational documentation provided by DEEP and interviews with DEEP staff as well as knowledgeable persons and interested parties outside of DEEP. Nationwide state parks comparison data were reviewed and selected other states were interviewed.
Main Staff Findings
The Parks Division FY 13 budget expenditure level is comparable to the level of FY 06 using constant 2013 dollars. Although several funding sources exist, the system has become heavily reliant on the state’s General Fund, with little directive or incentive to focus on revenue generating activities.
Connecticut’s state park fees are at or above other states in the region. There has been a decrease in paid attendance following fee increases in FY 10. The percentage of use by residents (~80% of day use) was not impacted by the fee increase.
Staffing levels are down and have reached a critical point regarding operations. Several management units do not have permanent, full-time supervisors. Connecticut’s use of seasonal workers exceeds the national average.
Planning for the state park system has defaulted to “crisis management” as the level of resources available to parks has decreased. Though there is some collection of data, information is not analyzed and park performance is not measured in meaningful ways to fully inform planning and resource allocation.
Either an increase in funding and staffing or a decrease in services is necessary for continued adequate state park operations in the long-term. It is possible the current service offerings can be maintained with new, lower levels of staffing and funding for a short while longer. However, it is unlikely the current situation can be maintained indefinitely as the current balance relies on deferring maintenance, which may lead to increased future costs.
PRI Staff Recommendations
Staff makes recommendations throughout the report in support of the key improvement areas mentioned here. In order to enhance planning efforts, the Parks Division should perform regular reviews of all park resources and annually track park performance through the development of a Results Based Accountability report card.
Specific recommendations contribute to the recommended reviews and report card, including requiring measurement of three key areas: attendance, safety, and customer satisfaction. The major aspects of individual parks to be considered during each park review are: staffing needs; the use and level of fees; and the condition of existing facilities.
A portion of park-generated revenues should be appropriated to the Parks Division, contingent upon demonstration of park performance through the RBA process. The division must develop a plan for use and distribution of this increased funding. Any appropriated park-generated revenue should not supplant existing General Fund monies.
Legislative Program Review and Investigations Committee Staff Office
State Capitol * 210 Capitol Avenue * Room 506 * Hartford, CT 06106-1591 P: (860) 240-0300 * F: (860) 240-0327 * E-mail: [email protected]

Acronyms
AIX National Association of State Park Directors Annual Information Exchange
ATV All Terrain Vehicle
BESB Bureau of Education and Services for the Blind
BOR Bureau of Outdoor Recreation
DCS Department of Construction Services
DEEP Department of Energy and Environmental Protection
EC Fund Environmental Conservation Fund
EnCon Environmental Conservation Police Division
FTE Full-time equivalent
OFA Legislative Office of Fiscal Analysis
PRC DEEP’s Project Review Committee
RBA Results Based Accountability
RTP Recreation Trails Program
SCORP State Comprehensive Outdoor Recreation Plan
Program Review and Investigations Committee Staff Findings and Recommendations: January 23, 2014
i
Executive Summary State Parks and Forests: Funding
In 2013, Connecticut celebrated the hundredth anniversary of its state parks. Under the
governance of the Department of Environmental Protection (DEEP), Connecticut’s state park
system consists of 107 parks and 32 forests covering over 255,000 acres. The purpose of state
parks is to provide: outdoor recreation, including hiking, biking, boating, fishing, swimming,
picnicking, and camping; protection of natural areas; and educational opportunities and
programs.
In June 2013, the Legislative Program Review and Investigations Committee authorized a
study of state parks and forests. Specifically, the study focused on funding for state parks and
forests and whether it is “adequate” to support short- and long-term operational needs. The
committee formally adopted the study scope on September 26, 2013.1
Within this report, committee staff provides information and analysis of resource trends
for state parks, including expenditures (operational and capital), revenue, and staffing. To further
help determine whether resources are adequate, the study examined three metrics of park use:
attendance, safety, and customer satisfaction; additional information and analysis of park system
performance measurement and planning are provided. Although this report examines funding for
state parks and makes conclusions on resource levels, ultimately, the determination of whether
state park funding is adequate is a public policy decision.
Connecticut’s state park system provides a wide range of recreational services for
residents and non-residents while also protecting the state’s natural resources and heritage. The
system is a network of land types and involves different programs across several bureaus within
the Department of Energy and Environmental Protection for its overall operation. To keep the
study scope manageable, and still allow for proper examination of state park system funding, a
comprehensive review of the department’s State Parks and Public Outreach Division (Parks
Division) was made. The division has primary responsibility within DEEP for the operation of
state parks, which is accomplished through a system of central and field-level programs.
Overall, committee staff found funding for state parks steadily increased during FYs 05-
10, but has been on a downward trend since then. The funding level for FY 13, adjusted for
inflation, is slightly below the FY 06 level. Connecticut is also more reliant on general fund
support than most other states. Conversely, almost all other states have funding mechanisms
allowing them to retain either all or a portion of the revenue they generate within their systems of
state parks. Connecticut law currently allows some parks to retain revenues from renting
facilities in special accounts, but the revenue generated through parking, admission, and camping
fees – which is the vast majority of revenue – goes to the state’s General Fund.
1 The Connecticut state park system includes parks and forests. The remainder of this report will use the term
“parks” to refer collectively to parks and forests.
Program Review and Investigations Committee Staff Findings and Recommendations: January 23, 2014
ii
Staffing levels within the park system are down since FY 08. Decreases in key field
personnel, namely park maintainers and supervisors, have occurred generally since FY 09. This
has resulted in some park management areas with maintenance staff levels below what would
normally be considered functional and safe, given the types of work performed. In addition, there
are not enough field supervisors to fill all current supervisory positions. As a result, the
department has required staff to take on additional supervisory responsibilities, resulting in some
supervisors working in a “temporary service in a higher class” capacity. In the final analysis,
committee staff recommends a partial realignment of the funding mechanism for state parks
intended to allow the system to regain a portion of the funding decreases over the last several
years.
Park-generated revenues have exceeded $6 million annually since CY 11. After a spike in
revenues in CY 10 due to an increase in fees (35 percent increase for residents and 50 percent
increase for non-residents), both paid attendance and overall revenue have dipped and may be
trending downward. Connecticut’s fees are at or above regional and national averages for state
parks, though fees are only collected at one-quarter of all parks and most fees are also limited to
the peak park season between Memorial Day and Labor Day.
Operationally, planning within the park system is primarily “crisis” driven. The system
lacks structured attention to performance-based measurement. Important performance data are
undergathered and underutilized for analysis purposes. Further, budget cuts and the lack of
position refill authority may hamper the division’s efforts in these areas. At the same time,
additional focus on overall system performance, based on accurate and adequate data is
necessary. Committee staff recommends a Results Based Accountability (RBA) approach,
including development of an RBA report card, as a streamlined way for the division to increase
its performance-based analysis.
Taken together, the committee staff recommendations presented in this report are
intended to provide a solid foundation for achieving a state park system funding mechanism that
is better balanced with system needs, and operations and planning efforts that are more
performance oriented.
List of Recommendations
1. DEEP should fully develop and submit the necessary reports required under C.G.S.
Sec. 23-15b(c), and ensure each report is available on the department’s website for state
parks in accordance with the statutory timeframes.
2. A portion of the proceeds, as determined by the Department of Energy and
Environmental Protection on an annual basis, from renting cabins located within state
parks or forests should be deposited within a Maintenance, Repair, and Improvement
account for the specific park where such cabin(s) is located. The funds should be used
to help offset maintenance costs of the cabins. If specific MRI accounts are not yet
established for parks with cabins, they should be developed by DEEP.
3. The Department of Energy and Environmental Protection Parks Division should fully
coordinate with Friends groups and other parks associations to ensure in-kind labor

Program Review and Investigations Committee Staff Findings and Recommendations: January 23, 2014
iii
and financial resources provided by such groups are taken into consideration for
budget and planning purposes.
4. The use of season and lifetime passes should be tracked by pass type when parks are
otherwise charging for parking or admissions.
5. The Parks Division should create a Results Based Accountability-style report card
regarding park performance in accordance with the guidelines established by the
legislature’s Appropriations Committee. The report card should include measures
regarding park use (e.g., attendance, safety, and satisfaction), as well as measures of
park operations (e.g., planning efforts) and park personnel. The division’s first report
card should be developed by January 1, 2015, and annually thereafter. The report
cards should be provided to the legislative committees of cognizance and made available
on the Parks Division website.
6. The Parks Division should develop an improved attendance estimation methodology
that: 1) spreads responsibility for point-in-time counts; 2) requires the performance of
focused counts every five years; 3) uses quantitative numbers already available via
revenue collection; and 4) expands the use of car counters.
7. The Parks Division should review the use and level of fees for each park location not
less than once every five years, as part of an overall park review.
8. The Department of Energy and Environmental Protection should use a portion of its
bonding authorization for improving parks for purchasing car counters, such that
vehicular traffic at all parks can be counted for weeklong or more portions of on- and
off-season time periods by 2020, and during each subsequent five-year time period.
9. As part of its RBA report card, the Parks Division should develop formal metrics of
safety within the state park system, including safety of the general public and division
employees. The division should collect and analyze applicable safety-related data
necessary to identify trends in the annual number and types of safety-related incidents
on a system-wide basis.
10. The Parks Division should develop written criteria and procedures for project approval
based on the division’s system-wide priorities. This should be updated regularly and
distributed to park unit supervisors and district managers upon revision. The status
and evaluation of merit, based on fit with the established criteria and priorities, of all
project applications that move beyond the district level should be communicated, in
writing, to the park unit supervisor who first completed the application.
11. The Parks Division shall perform a formal review of a portion of the park system
locations and resources therein on a rolling basis such that all park system locations are
reviewed at least once by 2020. The review shall include an inventory and assessment of
the condition of resources and facilities as well as an examination of the staffing needs
of each location and shall be updated for each park location at least once throughout
every subsequent five year period.

Program Review and Investigations Committee Staff Findings and Recommendations: January 23, 2014
iv
12. The Department of Energy and Environmental Protection should involve field staff (i.e.,
district managers and unit supervisors) in the budget development and administration
process for the Parks Division. Specifically, park unit budgets should be administered
in coordination with the field staff throughout the fiscal year for non-personal service
costs in a manner such that field personnel are aware of yearly budget limitations and
allowed to retain some portion, as determined by the department, of any realized
savings within the same park unit and/or district.
13. Between one quarter and one half of revenue generated in state parks shall be
appropriated biennially to the Parks Division, with the specific proportion at the
request of the Department of Energy and Environmental Protection and the approval
of the Appropriations Committee. This appropriation shall be contingent upon the
Parks Division’s satisfactory participation in the Results Based Accountability process
of the Appropriations Committee, or a similar performance-based measurement
requested by the Appropriations Committee. The shared park-generated revenue shall
not supplant the General Fund obligation to the Parks Division. The portion of park-
generated revenues not appropriated to the Parks Division shall continue to support the
General Fund.
The Parks Division shall create a plan for use of park-generated revenue that balances
the distribution of park revenue-based funds among the park or park units that
generated the revenue and the needs of the entire system of parks and present such
plan, along with the initial RBA-style report card, to the relevant Appropriations sub-
committees, and the Environment Committee. The initial fund distribution plan should
emphasize implementation of performance metrics and related data-gathering and
analysis.

Program Review and Investigations Committee Staff Findings and Recommendations: January 23, 2014
1
Introduction State Parks and Forests: Funding
A system of 107 state parks and 32 state forests covering over 255,000 acres exists in
Connecticut. The purpose of state parks and forests is to provide: outdoor recreation, including
hiking, biking, boating, fishing, swimming, picnicking, and camping; protection of natural areas;
and educational opportunities and programs. The Department of Energy and Environmental
Protection (DEEP) is charged with acquiring land for state parks and forests, and with overseeing
and managing system operations.
Scope of Study
In June 2013, the Legislative Program Review and Investigations Committee authorized a
study of state parks and forests. Specifically, the study focused on funding for state parks and
forest and whether it is “adequate” to support short- and long-term operational needs. The
committee formally adopted the study scope on September 26, 2013.2
Research Methods
Committee staff research began with understanding the organizational structure of the
state park system, including a review of relevant state laws and policies. Additional research
included compiling data on the park system’s funding sources and levels, other states’ park
operations and funding, and performance measures within the division. As a primary information
source for this study, committee staff interviewed central and field personnel of the Parks
Division, other relevant parks-related program staff within DEEP, and non-governmental
stakeholders. Specifically, program review staff met with:
agency leadership, program managers, and staff within DEEP’s Bureau of
Outdoor Recreation (BOR), Bureau of Natural Resources, and Bureau of
Financial and Support Services;
a majority of field supervisors, individually or within larger focus groups;
Connecticut Friends of State Parks, Friends of Gillette Castle State Park, and
Connecticut Forest and Park Association; and
the legislature’s Office of Fiscal Analysis.
Committee staff visited the following state parks to gain a better understanding of the
services they provide and their operations: Hammonasset Beach State Park; Harkness Memorial
State Park; Gillette Castle State Park; Topsmead State Forest; and Penwood State Park.
Supervisors at each of the parks were interviewed.
2 The Connecticut state park system includes parks and forests. The remainder of this report will use the term
“parks” to refer collectively to parks and forests.

Program Review and Investigations Committee Staff Findings and Recommendations: January 23, 2014
2
On September 26, 2013, staff provided the committee a study update, which was
followed by public hearing held by the committee. Materials from the hearing are available on
the committee staff’s website.
Several key data sources were analyzed by committee staff: all Parks Division budget
expenditures for FYs 05-13; National Association of State Park Directors-Annual Information
Exchange (AIX) statistical reports for FYs 08-12; Connecticut state park revenues and fees; and
park system attendance reports. The information from these sources served as the primary data
for analysis within this report. Committee staff encountered some challenges in gathering and
analyzing accurate park use information for this study, as discussed more fully later in the report.
PRI staff recognizes cuts in operating budgets and staff often impede collection and analysis of
relevant park system data, yet accurate and timely data are vital for determining overall
performance.
Report Organization
This report contains six chapters outlining committee staff’s analysis, findings, and
recommendations. The first chapter provides necessary background information about
Connecticut’s state park system to help provide overall context. The second chapter contains an
analysis of the Park Division’s expenditures. Chapter III provides an examination of park-
generated revenue in Connecticut and nationally. A review of park staffing resources is provided
in Chapter IV. Chapter V examines three key metrics of state park use, performance
measurement, and planning. The final chapter presents operations and funding options and the
potential impact of several scenarios on the state park system.

Program Review and Investigations Committee Staff Findings and Recommendations: January 23, 2014
3
Chapter I Background
State parks and forests have been part of Connecticut’s heritage for the past century. In
1913, the legislature created a six-member State Park Commission responsible for developing an
inventory of land throughout the state. The commission’s priority was to understand the land
available along Long Island Sound and the state’s inland lakes and rivers, given the public’s
propensity to be near water. In 1921, the commission became known as the State Park and Forest
Commission, to reflect its new authority over state forests. In 1971, the commission was merged
into the newly-created Department of Environmental Protection, now the Department of Energy
and Environmental Protection.
DEEP is the state agency responsible for managing Connecticut’s state park and forest
resources. State law specifies the DEEP commissioner is charged with supervising “all lands
acquired by the state, as public reservations, for the purposes of public recreation or the
preservation of natural beauty or historic association.”3 The DEEP commissioner further has the
authority to adopt regulations “for the maintenance of order, safety and sanitation upon the lands
under the commissioner’s control….”4 These two statutes refer in large part to the state parks and
forests system. While there are no statutory definitions of parks and forests, in the early years it
was explained that state parks were primarily for recreation or conservation of natural scenic
beauty, wildlife, and historic interest sites, while state forests were primarily for the provision of
timber for economic purposes. Even in 1922, though, it was acknowledged they had many
features in common,5 and the similarities have increased. When used in this report, the term
“parks” refers collectively to state parks and forests.
Land Acquisition for State Park System
Connecticut’s park system is state-protected open space consisting of a combination of
land and water types. A map showing the location of state parks and forests, along with various
other state-protected natural areas, is provided in Figure I-1. The dividing lines within the map
are the designations used by DEEP for resource supervision purposes, as described in more detail
later in this chapter.
3 C.G.S. Sec. 23-5
4 C.G.S. Sec. 23-4
5 State Park and Forest Commission Report (1922).

Program Review and Investigations Committee Staff Findings and Recommendations: January 23, 2014
4
Figure I-1: State Park and Forest System.
Wes
tern
Dis
tric
t
East
ern
Dis
tric
t

Program Review and Investigations Committee Staff Findings and Recommendations: January 23, 2014
5
The Department of Energy and Environmental Protection administers the Recreation and
Natural Heritage Trust Program to acquire state-owned open space for the state park and forest
system.6 The program is administered to meet the statutory goal of preserving 21 percent of the
state’s land as open space for recreational and natural resource conservation purposes.7 The goal,
set in 1997, calls for the state to protect 10 percent (320,576 acres) of Connecticut’s land, while
municipalities and other stakeholders preserve the remaining 11 percent.8
According to DEEP, the state has acquired almost 80 percent of its share of the goal, or
just over 255,000 acres within its state system of park, forest, wildlife, fishery, and natural
resource management areas.9 The following types of land have been preserved under the state’s
portion of the Open Space program:
State Park: 36,630 acres;
State Forest: 160,243 acres;
Wildlife Management Area: 31,880 acres;
Water Access: 6,172 acres;
Flood Control: 3,821 acres; and
Other (including easements/restrictions): 16,279 acres.
State Park Inventory
According to DEEP, the mission of the Connecticut state park system is to provide
natural resource-based public recreational opportunities and educational opportunities through
a system of state park and forest recreation areas, environmental centers and nature centers
which provide an understanding of, access to, and enjoyment of the state’s historic, cultural, and
natural resources. The mission is achieved through the 107 state parks and 32 state forests
statewide. The park system provides: outdoor recreation, including hiking, biking, boating,
fishing, swimming, picnicking, and camping; protection of natural areas; and educational
opportunities and programs provided at several state parks. A full listing of state parks and
forests, and the activities available within each park, is provided in Appendix A.
Growth over time. The number of individual state parks has increased over time, as has
the size of the overall park system. According to DEEP, there was growth in the designation of
state parks through the 1920s, followed by a slowdown during the Depression era (although the
Pavilion at Rocky Neck State Park, one of the shoreline’s largest structures, was built in the mid-
1930s.) The system again saw steady growth over the next several decades, until another period
6 For additional information on state open space, see: Open Space Acquisition, Legislative Program Review and
Investigations Committee, 1998. 7 C.G.S. Sec. 23-8(b)
8 DEEP also manages the Open Space and Watershed Land Acquisition Grant Program. The program offers grants
to municipalities, non-profit land conservation organizations, and water companies (i.e., partners of the state) to
acquire open space. This acquisition is intended to help meet the statutory goal of 11 percent (352,634 acres) of the
state’s land under non-state control.
9 DEEP estimates that nonprofit land conservation organizations, municipalities, and water companies own just
under 239,000 acres, or 68 percent of their targeted open space goal.

Program Review and Investigations Committee Staff Findings and Recommendations: January 23, 2014
6
of decline in the 1970s and 80s, before resuming in late 1990s. In recent years, there has not been
much open space acquisition; the department is focusing its efforts on maintaining the current
open space inventory, including gathering more accurate boundary lines and enforcing
encroachment laws.10
It is important to note that land purchases over time also consist of adding
to already existing parcels within the park system, which does not increase the total number of
parks but allows for expansion of overall park acreage.
Park System Organization
As noted above, the state park system is managed by the Department of Energy and
Environmental Protection. Figure I-2 shows three bureaus within DEEP have primary
responsibility for overseeing the operations of state parks and forests: Bureau of Outdoor
Recreation (parks, environmental police, and boating divisions),11
Bureau of Natural Resources
(forestry, fisheries, and wildlife divisions), and Bureau of Financial and Support Services
(budget and project management.) Although the bulk of the state park system operations falls
under the purview of the BOR’s State Parks and Public Outreach Division (Parks Division),
several divisions within the natural resources bureau administer programs affecting the state park
system, including forestry, fishery, and wildlife programs. As PRI staff noted at the September
update with the committee, this study focuses on the functions within BOR’s Parks Division,
since the division has operational responsibility for the state park system.
Figure I-2. Department of Energy and Environmental Protection: Bureaus with State
Parks and Forests Responsibilities.
10
The most recent addition of a state park to the system was made in 2008, when the state purchased the 146-acre
Sunrise Resort property and designated it a state park. 11
The Bureau of Outdoor Recreation is without a bureau chief; a deputy commissioner serves as the bureau chief in
addition to her other responsibilities. The department reports it is in the process of filling the position.
Boating Division
DEEP
Bureau of Natural Resources Bureau of Outdoor Recreation
Environmental
Conservation Police Div.
State Parks and
Public Outreach
Division Inland & Marine
Fisheries Division
Wildlife Division
Forestry
Division
Bureau of Financial
and Support
Services
Program Review and Investigations Committee Staff Findings and Recommendations: January 23, 2014
7
In addition to the Parks Division, two other divisions exist within BOR with
responsibility for the park system. The Environmental Conservation Police Division (EnCon
Police) provides the bulk of the security and public protection services within state parks.
Environmental conservation officers are trained municipal police officers appointed by the
commissioner to enforce the state’s fish and game, boating, recreational vehicle, and state park
and forest laws and regulations. The division provides public education and prevention services,
and the officers have full police powers on all DEEP-owned lands and within department
facilities. The bureau’s Boating Division offers a variety of boating-related services, including
safety and education programs, boater certification and registration, and oversight for the
construction, operation, and maintenance of the 118 state-owned boat launches.
State Parks and Public Outreach Division
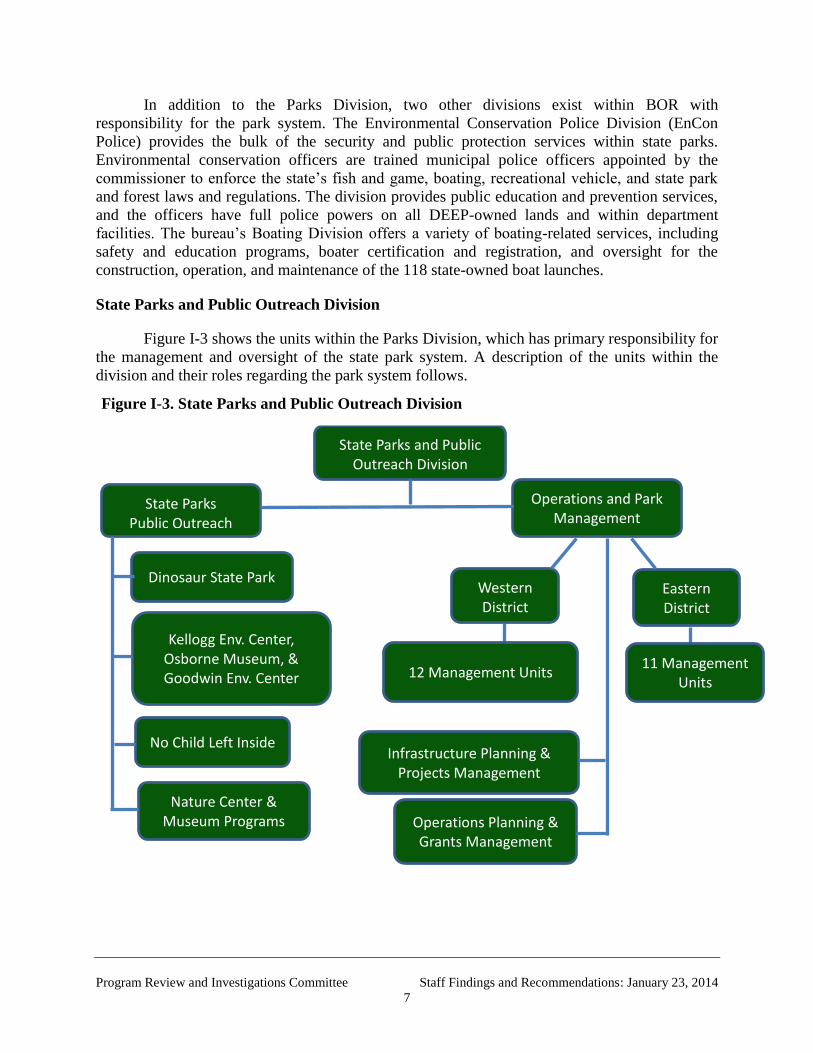
Figure I-3 shows the units within the Parks Division, which has primary responsibility for
the management and oversight of the state park system. A description of the units within the
division and their roles regarding the park system follows.
Dinosaur State Park
State Parks and Public Outreach Division
State Parks Public Outreach
Operations and Park Management
Operations Planning & Grants Management
Infrastructure Planning & Projects Management
Western District
No Child Left Inside
Nature Center & Museum Programs
Kellogg Env. Center, Osborne Museum, & Goodwin Env. Center
Eastern District
12 Management Units 11 Management
Units
Figure I-3. State Parks and Public Outreach Division

Program Review and Investigations Committee Staff Findings and Recommendations: January 23, 2014
8
Operations and Park Management. The bulk of the division’s responsibility for the
state’s park system falls within the Operations and Park Management unit. The unit is overseen
by an assistant division director who reports to the division director. For FY 13, a total of 88
employees staffed the division, with most staff located at the field level.
Within the operations section, DEEP has divided the state into two districts: Eastern and
Western, each overseen by a district manager. The district managers are responsible for
overseeing supervisors located within each district, setting district priorities, and supervising
development and maintenance projects. The two district managers report to the assistant division
director.
The two districts are further divided into management units, each overseen by a
supervisor (see Figure I-1 above). There are 12 units in the Western District and 11 units in the
Eastern District. Within each management unit’s boundaries is a collection of state parks, forests,
boat launches, and wildlife management areas. The management unit supervisor is accountable
for the supervision and operations of the parks and forests recreational areas within the unit. The
management units provide the daily grounds-keeping, maintenance, and overall cleanliness of
such resources. Unit supervisors are classified as a Supervisor 1, 2, or 3, based on their
experience levels, with a Supervisor 3 being the most experienced. For FY 13, there were 17
supervisors for the 23 management units (including two supervisors at Hammonasset Beach
State Park.)12
Besides supervisors, the staff positions within the management units are mostly
maintainers. Similar to supervisors, maintainer positions are classified as Maintainer 1, 2, or 3,
with a Maintainer 3 being the highest classification. Maintainers perform a variety of duties,
including general maintenance of park grounds and buildings, carpentry, painting, road and trail
maintenance, and some minor electrical work. Maintainers also help ensure park cleanliness and
safety, as well as assist in job planning, daily project oversight, and supervision of seasonal
workers. For FY 13, there were 51 full-time maintainers for the 23 management units.
In addition to full-time staff, seasonal workers help perform many functions within the
park system mainly during peak visitation months of April-September. Seasonal workers,
including maintenance staff, life guards, fee collectors, campground supervisors, interpretive
guides, office assistants, and park rangers augment the full-time park staff. Seasonal workers
with experience also may work in a supervisory capacity. As discussed later in Chapter IV,
various rules and requirements are in place regarding seasonal workers. The division annually
averages approximately 500 seasonal workers during peak operating months for parks.
Operations Planning and Grants Management. This unit is primarily responsible for
coordinating planning functions for recreational trails and greenways, water safety and
lifeguards, and alternative use permits within the state park system. The unit also administers
several outdoor recreation grants. Key among those grants is the federal Recreational Trails
Program (RTP), which provides funds to states to distribute for developing and maintaining
recreational trails and trail-related facilities for nonmotorized and motorized recreational trail
12
Dinosaur State Park is considered a management unit. The park supervisor’s title is Environmental Education
Coordinator, not Environmental Protection Supervisor as in the other units, and is not included in the total of 17
supervisors.

Program Review and Investigations Committee Staff Findings and Recommendations: January 23, 2014
9
uses, as well as competitive grants provided to non-profit agencies and municipalities for trail
maintenance and improvements. Five employees staffed the unit during FY 13.
Infrastructure Planning and Project Management. The Infrastructure Planning and
Project Management unit is currently not staffed due to recent retirements and no approval to
refill the positions. The unit was responsible for planning and oversight of construction projects
within the state park system. The unit also served a liaison function between DEEP and the
Department of Construction Services (DCS) for major state parks capital projects under the
purview of DCS. The liaison and oversight functions are currently performed through DEEP’s
Agency Support Services Division (Field Support Unit).
State Parks Public Outreach. This unit offers a variety of programs to engage public
use of the state park system. The unit helps develop and implement education programs provided
at various state parks, including Goodwin State Forest and Conservation Education Center,
Osborne Homestead Museum, Dinosaur State Park, Gillette Castle State Park, and Fort Trumbull
State Park. A key set of programs administered by the unit is No Child Left Inside, which
focuses on connecting children with the natural resources of state parks. For FY 13, there were
five full-time employees in this division.
Services
The state park system offers numerous activities and services for visitors. In addition to
outdoor recreational activities, such as hiking, swimming, biking, camping, bird-watching,
water-related sports, and educational activities, parks offer rental of several of its facilities. This
includes:
21 open air picnic shelters at 17 different parks, which can typically hold
between 50-100 people;
a 230-acre estate and 42-room mansion at Harkness Memorial State Park for
weddings, receptions, seminars, and conferences;
the Pavilion at Rocky Neck State Park with a capacity of 300 people; and
28 rustic cabin rentals within six parks, with intention to build up to 100
cabins in total.
Fees. Although a majority of the activities provided within the state park system are free
to the public, one-quarter of the parks and forests (35 of 139) charge fees for parking, admission,
or camping. Fee levels are set by regulation and vary by residence status and time and day (i.e.,
weekend or weekday) of entrance. In many cases, the fees are assessed from April through
October, although parks are open year-round. A full listing of the current fees is provided in
Appendix B, and fees and revenues are discussed in more detail later in the report.
Attendance. Attendance figures from state parks are collected by the Parks Division. As
provided in more detail in Chapter V, attendance data are not wholly reliable, and the division
does not collect attendance information from every state park. Moreover, of the parks submitting
data, often the figures are based on estimates made by park supervisors. In total, DEEP estimates
state park attendance during 2012 of roughly 8 million visitors.

Program Review and Investigations Committee Staff Findings and Recommendations: January 23, 2014
10
Operating and Capital Expenditures
Although a detailed analysis of expenditures is provided in the next chapter, FY 13
expenditures for the state Parks Division totaled $12.8 million. Of the total expenditures, $11.2
million was from the state General Fund, while the remaining $2 million was from other funding
sources, including the federal government, private contributions and donations, such as trusts for
individual parks, and restricted revenue (i.e., facility rental fees kept by certain parks). In
addition, bond funding is available to support parks.
Revenue. For calendar year 2012, state parks generated $6.7 million in revenue. Revenue
sources include parking fees, camping fees, proceeds from park passes, and sales of
miscellaneous items (e.g., firewood). A full analysis of revenue generated through the park
system is provided in Chapter III.

Program Review and Investigations Committee Staff Findings and Recommendations: January 23, 2014
11
Chapter II Park System Expenditures
Funding for state parks depends on various factors. The main cost drivers for ongoing
operations of state parks are staffing, what the state classifies as “other expenses,” and capital
expenses. Funding available to support park operations also comes from various sources, with
the state General Fund serving as the primary funding source. Over time, however, several
mechanisms have been implemented to fund operations of state parks.
This chapter analyzes budget expenditures of the Parks Division as they relate to state
park operations to provide an overall understanding of park system resource trends.
Key Findings
In constant 2013 dollars, the Parks Division’s operating expenditures for FY
13 were slightly lower than in FY 06.
State parks expenditures steadily increased during FYs 05-10 followed by a
three-year decline since then.
On average, 80 percent of the division’s expenditures were funded from the
state’s General Fund for FYs 05-13; it was 87 percent in FY 13; Connecticut
also relies more heavily on general fund contributions than most other states.
Seasonal worker expenditures increased for FY 05-12, followed by a slight
decrease in FY 13.
There has been an upward trend in capital expenditures for parks-related
projects since FY 11, although FY 11 expenditures were the lowest for the
period analyzed (FYs 10-13).
In-kind contributions to state parks are substantial, yet the division does not
fully recognize and incorporate them it its overall budget planning process.
In addition to identifying the functions and services provided in state parks, as
summarized in Chapter I, an important step in trying to determine whether funding for parks is
adequate is to understand: 1) how the state park system is funded; 2) the current level of
resources expended to operate parks; and 3) how present funding compares with previous years.
Although several divisions and units within DEEP have some role in the overall system of state
parks, the Parks Division provides the bulk of the daily operation of state parks and forests.13
As
such, the expenditure information provided below is for the division.
13
Other areas within DEEP contributing to the overall parks system include the Bureau of Fiscal and Support
Services, the Bureau of Natural Resources, the Bureau of Outdoor Recreation’s Boating and Environmental
Conservation Police divisions, and the Open Space Acquisition program. Given the BOR and BNR bureaus include
multiple programs partially related to the state’s park system but also to other services, it is difficult to fully isolate
their direct parks-related expenses. The FY 12 budgets for the natural resources and fiscal and support services
bureaus totaled $18 million and $27 million respectively. Within BOR, the Boating Division’s FY 13 budget was
$778,000, and the environmental police division’s budget was $4.7 million.
Program Review and Investigations Committee Staff Findings and Recommendations: January 23, 2014
12
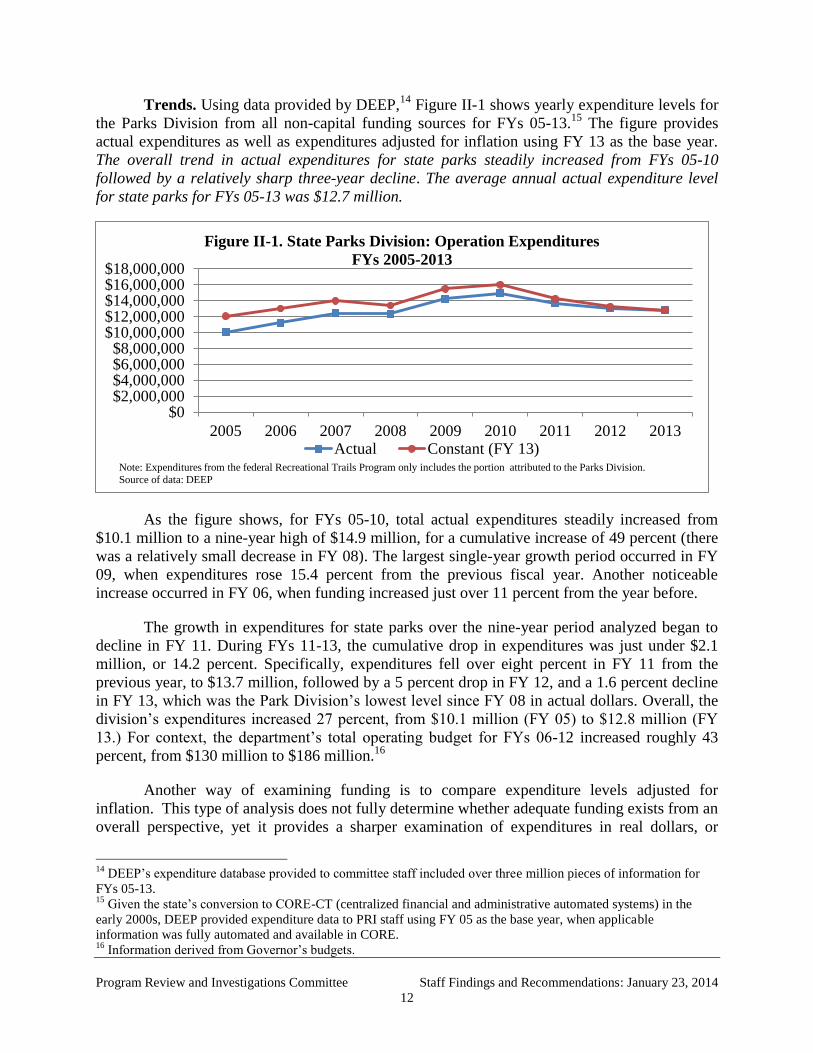
Trends. Using data provided by DEEP,14
Figure II-1 shows yearly expenditure levels for
the Parks Division from all non-capital funding sources for FYs 05-13.15
The figure provides
actual expenditures as well as expenditures adjusted for inflation using FY 13 as the base year.
The overall trend in actual expenditures for state parks steadily increased from FYs 05-10
followed by a relatively sharp three-year decline. The average annual actual expenditure level
for state parks for FYs 05-13 was $12.7 million.
As the figure shows, for FYs 05-10, total actual expenditures steadily increased from
$10.1 million to a nine-year high of $14.9 million, for a cumulative increase of 49 percent (there
was a relatively small decrease in FY 08). The largest single-year growth period occurred in FY
09, when expenditures rose 15.4 percent from the previous fiscal year. Another noticeable
increase occurred in FY 06, when funding increased just over 11 percent from the year before.
The growth in expenditures for state parks over the nine-year period analyzed began to
decline in FY 11. During FYs 11-13, the cumulative drop in expenditures was just under $2.1
million, or 14.2 percent. Specifically, expenditures fell over eight percent in FY 11 from the
previous year, to $13.7 million, followed by a 5 percent drop in FY 12, and a 1.6 percent decline
in FY 13, which was the Park Division’s lowest level since FY 08 in actual dollars. Overall, the
division’s expenditures increased 27 percent, from $10.1 million (FY 05) to $12.8 million (FY
13.) For context, the department’s total operating budget for FYs 06-12 increased roughly 43
percent, from $130 million to $186 million.16
Another way of examining funding is to compare expenditure levels adjusted for
inflation. This type of analysis does not fully determine whether adequate funding exists from an
overall perspective, yet it provides a sharper examination of expenditures in real dollars, or
14
DEEP’s expenditure database provided to committee staff included over three million pieces of information for
FYs 05-13. 15
Given the state’s conversion to CORE-CT (centralized financial and administrative automated systems) in the
early 2000s, DEEP provided expenditure data to PRI staff using FY 05 as the base year, when applicable
information was fully automated and available in CORE. 16
Information derived from Governor’s budgets.
$0$2,000,000$4,000,000$6,000,000$8,000,000
$10,000,000$12,000,000$14,000,000$16,000,000$18,000,000
2005 2006 2007 2008 2009 2010 2011 2012 2013
Figure II-1. State Parks Division: Operation Expenditures
FYs 2005-2013
Actual Constant (FY 13)Note: Expenditures from the federal Recreational Trails Program only includes the portion attributed to the Parks Division.
Source of data: DEEP

Program Review and Investigations Committee Staff Findings and Recommendations: January 23, 2014
13
buying power. Using FY 13 as the constant year, when adjusted for inflation, expenditures rose
33 percent overall from FY 05 through FY 10, followed by a 20 percent decline in FYs 11-13. In
constant dollars, Parks Division expenditures for FY 13 ($12.8 million) were slightly lower than
in FY 06 ($12.9 million.) Overall, for FYs 05-13, there was a 6.5 percent increase in the
division’s operations expenditures when adjusted for inflation, compared to an unadjusted
increase of 27 percent.
Funding sources. Funding for the operation of state parks currently comes from four
sources: the state General Fund; the federal government; contributions/donations made to the
park system, including private trust funds; and revenue generated by individual state parks that is
restricted for use by those parks per state law. The specific funding sources and their expenditure
amounts (not adjusted for inflation) since FY 05 are provided in Figure II-2 and described below.
The figure does not include capital expenditures, which are examined separately in this chapter,
or fringe benefit costs, except in association with special funds given DEEP was responsible for
such costs. In addition, actual revenues generated by user fees are discussed in Chapter III.
General Fund: Expenses associated with the state General Fund consist of personal
services (e.g., full-time and seasonal staff salaries and wages) and other expenses (e.g.,
maintenance supplies and services, utilities, motor fuel, heating oil). Since FY 05, General Fund
expenditures for the Parks Division have ranged between $8.1 million (FY 06) and $12.5 million
(FY 10), and averaged $10.2 million a year.
DEEP data show 80 percent of the state’s park system expenditures came from the
General Fund for FYs 05-13. Beginning in FY 10, this percentage is even higher, when the
division’s funding mechanism was changed and special funds from park-generated revenue were
no longer a source of funding for the state park system. The funding lost from special funds was
initially replaced with additional General Fund monies. In FY 13, the most recent year examined,
$0
$2,000,000
$4,000,000
$6,000,000
$8,000,000
$10,000,000
$12,000,000
$14,000,000
$16,000,000
2005 2006 2007 2008 2009 2010 2011 2012 2013
Figure II-2. State Parks Operations Expenditures by Fund Source
FYs 2005-2013
General Fund Special Funds Other Federal*
* Expenditures from federal sources considered "pass through to non-state entities" - mainly from the federal Recreational Trails
Program - are not included in the figure. Funding for DEEP-incurred expenses under this grant program are included.
Source of data: DEEP

Program Review and Investigations Committee Staff Findings and Recommendations: January 23, 2014
14
the General Fund supported 85 percent of the division’s expenditures, up from 67 percent in FY
09, the last year special funds existed.
Special Funds: Special funds within the state budget are earmarked for specific purposes
and funded outside the General Fund. The Parks Division received a relatively sizable portion of
its funding from special funds prior to FY 10. At that time, due in part to the state’s budget crisis,
special funds were absorbed within the General Fund and no longer available as a funding source
for numerous programs, including state parks. At the highest point of their use before being
eliminated as a funding source for the Parks Division, special funds accounted for 26 percent of
the division’s overall budget in FYs 07 and 09.
The Environmental Conservation Fund (EC) was the primary funding source for DEEP’s
State Park, EnCon police, Boating, Fisheries, Wildlife and Forestry programs. EC funding was
derived from a variety of sources, including parking and camping fees collected at state parks,
hunting, trapping, and fishing licenses collected mainly through the department’s online
licensing system, and boat registration fees. A portion of the revenue generated by parks was
maintained in an EC non-lapsing account to help offset expenses, while the remaining share went
to the General Fund. As such, the Parks Division typically generated more in revenue from park
and camping fees than it received from the Environmental Conservation Fund.
The department also maintained a reserve in EC funding from year to year to ensure
expenses were covered during years when revenue collection was low. Given the seasonal nature
of outdoor recreational activities and the impact events such as natural disasters can have on the
public’s outdoor recreational habits and DEEP’s facilities, it was essential to maintain a robust
carry-over balance to be able to finance existing salaries and ongoing expenses when revenue
collections fluctuated. Revenue generated by state parks is greatly influenced by weather and
annual receipts can dramatically fluctuate due in large part to inclement weather during peak
admission periods.
The Parks Division’s EC funding totaled $11.4 million for FYs 05-09, or 80 percent of
the division’s special fund-sourced expenditures for those years. Annual EC funding ranged from
$1.1 million in FY 05, to $3 million in FY 09, and averaged almost $2.3 million a year.
Committee staff was told by DEEP that the Environmental Conservation Fund supported
personal services expenses (including fringe benefit costs) for approximately 13 positions in the
Parks Division, along with other expenses.
Several special funds in addition to the Environmental Conservation Fund helped support
the Parks Division before their elimination. The next largest fund was the Maintenance, Repair,
and Improvement (MRI) account. The MRI account was established along the lines of a
statewide revolving fund for use by all parks. The fund was sustained through revenue generated
from the rental of specific facilities at various parks, including pavilion and wedding event
rentals, and used for specific projects within parks. Overall, the account averaged $400,000 in
annual expenses before it was eliminated as a special fund beginning FY 11.
State parks generating revenue through park-specific initiatives, such as sales of firewood
and ice, were permitted to retain the revenue in individual park “enterprise” accounts. The
money was used to help offset miscellaneous park expenses. During the years the accounts were

Program Review and Investigations Committee Staff Findings and Recommendations: January 23, 2014
15
available, they averaged $53,000 annually. An interesting project arising from the use of
enterprise funds was the construction of two cabins at Hammonasset Beach State Park in 2009,
which started the department’s initiative to build cabins on state land.17
The cabins have been
rented to the public with the original thought that the park’s enterprise account would support the
upkeep of the cabins. With the loss of the enterprise account, such costs are now part of the
park’s operating budget. Prior to their elimination, other parks used enterprise accounts for new
equipment purchases, to replace/repair current equipment, or to complete minor capital repairs.
Having funds available meant a park did not have to request extra funding.
Federal government: The Parks Division received a total of $7.4 million in federal
funding for FYs 05-13. In reality, only $2.7 million was for division-related services, with the
remainder distributed (i.e., passed through) to municipalities and non-profit organizations mainly
via the federal Recreational Trails Program (RTP) grant program. The program is overseen by
the Federal Highway Administration and provides funding to develop and maintain recreational
trails and trail-related facilities for nonmotorized and motorized recreational uses.
RTP represented the bulk of federal funding for the Parks Division for FYs 05-13, at $6.3
million. Of this total, $1.5 million (25 percent) was available to the division, mostly to help
offset its costs to administer the grant program and for some of its own smaller trails projects.
(Note: the federal funding portion of Figure II-2 above, as it relates to RTP, only includes the
$2.6 million attributed to the Parks Division and not the remaining amount distributed through
the division via grants.)
In addition to RTP, almost $900,000 in federal funding was provided through two federal
programs: Land and Water Conservation (grants to states for the acquisition and development of
public outdoor recreation areas and facilities) and Nonpoint Source Implementation grants to
help manage nonpoint source pollution caused by rainfall or snowmelt collecting natural and
human-made pollutants and depositing them into bodies of water. In total, federal funding
accounted for 2.3 percent of the division’s expenditures for FYs 05-13.
Contributions/donations: Non-government sources provide contributions for state parks
with expenses incurred against those contributions. Trust funds established for individual state
parks account for a sizable portion of this funding source. For example, since FY 05, three
prominent trust funds have contributed over $2 million to fund state parks: the Kellogg
Conservation Program ($1.5 million), Topsmead ($469,000) and Harkness Memorial State Park
($381,000). This funding category offers certain parks the ability to augment their state General
Fund monies, although the funding from trusts generally comes with restrictions on how it may
be spent. Overall, funding from contributions/donations totaled $3.4 million for FYs 05-13, or 3
percent of the division’s total funding for that nine-year period, and has averaged just over
$382,000 a year.
Restricted revenue: As noted above, some state parks generate revenue through fees from
renting park facilities and use the revenue in part to help offset expenses associated with facility
rentals. After special funds, including the MRI fund, were eliminated, P.A. 10-3, effective April
2010, created a separate General Fund Maintenance, Repair, and Improvement account,
17
To date, 28 cabins in six parks have been built, with a total of 100 planned.

Program Review and Investigations Committee Staff Findings and Recommendations: January 23, 2014
16
mirroring the MRI special fund as far as the purpose of the account. The public act transferred $1
million from the EC special fund to the new General Fund MRI account. Subaccounts for 17
specific parks have been established. In essence, the legislation created a separate fund for
certain parks to use to help mitigate costs associated with renting their facilities, even though the
new fund is within the General Fund. Restricted revenue accounted for 2 percent of the
division’s budget for FYs 05-13, or $2.1 million.
The act allows the subaccounts to also receive funds from other private and public
sources, including federal and municipal funds, and does not prevent use of funds from sources
outside the MRI account to maintain and improve state park property and buildings. Parks with
MRI accounts may use their funds to help offset property maintenance, repair, and improvement
expenses, and to build new structures. MRI accounts are non-lapsing and cannot be used by other
parks.
MRI funds may not replace state appropriations for general park operations, but may be
used for personnel expenses such as park staff overtime related to rentals, repairs, and upkeep
incurred with facility rentals. The purposes for which MRI funds may be used are up to
individual park managers. To date, 10 out of 17 parks have incurred expenses against their MRI
accounts since accounts were established in FY 11. MRI expenditures for FYs 11-13 totaled $1.1
million, with 85 percent of those expenditures attributed to Harkness Memorial State Park.
Semi-annual expense reports must be submitted by DEEP to the legislature’s Office of
Fiscal Analysis (OFA) and made available on the department’s website.18
The reports are
intended to serve as a public accounting of how MRI funds are used and help the public to more
easily track state park projects and expenses associated with the MRI accounts. However, the
reports have not been developed routinely, resulting in only some reports submitted and put
online.
Recommendation
1. DEEP should fully develop and submit the necessary reports required under
C.G.S. Sec. 23-15b(c), and ensure each report is available on the department’s
website for state parks in accordance with the statutory timeframes.
As noted above, a 2009 initiative by the department was implemented to build and rent
100 cabins in several state parks in celebration of the park system’s current 100th
anniversary.
The initiative is financed through a $3 million bond authorization.
At first, the revenue generated from a park’s enterprise activities, including revenue from
the newly-build cabins, was used to help maintain the cabins. Given the enterprise funds no
longer exist for individual parks, maintenance costs have been transferred to the General Fund.
As a result, each park is now responsible for the upkeep of the cabins through its operating
budget, which unit supervisors told committee staff they are already underfunded for current
service. PRI staff believes cabin rentals should be considered in a similar way as rental of other
park facilities, such as pavilions, with a portion of the proceeds going to the park’s MRI account.
18
C.G.S. Sec. 23-15b(c).
Program Review and Investigations Committee Staff Findings and Recommendations: January 23, 2014
17
The parks should be able to use the account to help offset some of the additional maintenance
costs associated with cabins.
Recommendation
2. A portion of the proceeds, as determined by the Department of Energy and
Environmental Protection on an annual basis, from renting cabins located
within state parks or forests should be deposited within a Maintenance, Repair,
and Improvement account for the specific park where such cabin(s) is located.
The funds should be used to help offset maintenance costs of the cabins. If
specific MRI accounts are not yet established for parks with cabins, they should
be developed by DEEP.
In-kind contributions. Not reflected in any funding information for the state park system
are the in-kind contributions made to the system by volunteers. For example, there are 23 various
state parks “Friends” groups statewide and several additional parks associations. Combined,
these organizations donate labor, including gardening, general maintenance, operating gift shops,
and guiding tours, to help maintain the state parks with which they are associated. The groups
also make financial donations to specific park programs. For example, the Friends group of
Harkness Memorial State Park is contributing $500,000 to help refurbish the park’s historic
greenhouse. In addition, half the salary of the seasonal interpreter at the Meigs Point Nature
Center at Hammonasset Beach State Park is paid for by that park’s Friends group.
According to the Friends of Connecticut State Parks, Friends groups statewide total
approximately 6,900 members who donate 79,000 hours of volunteer time worth $2.2 million
annually.19
The number of hours of donated labor equates to roughly 38 full-time staff. In short,
the Friends groups of Connecticut’s park system provide a level of labor and financial resources
that the state has come to rely on, intentionally or not. Without these additional resources, and
those provided by other park-related associations, the state park system either would have to
fund the financial and labor shortfalls in some manner, or do without the in-kind contributions
provided to maintain park resources, which is unlikely if maintaining current service levels is
expected. Moreover, Friends groups have indicated their efforts and contributions have reached
their limit, as has the groups’ willingness to have their contributions supplant state funding.
Recommendation
3. The Department of Energy and Environmental Protection Parks Division should
fully coordinate with Friends groups and other parks associations to ensure in-
kind labor and financial resources provided by such groups are taken into
consideration for budget and planning purposes.
Comparative national data. Nationwide, state park operations are funded through a
combination of park-generated revenues, general funds, and other dedicated funds. There has
been a nationwide shift away from reliance on general fund monies for state park operations, as
19
These figures were provided to committee staff by Friends of Connecticut State Parks, and have not been
independently confirmed by staff. Further, Connecticut’s Statewide Comprehensive Outdoor Recreation Plan
references the in-kind contributions made by Friends groups and provides general numbers.

Program Review and Investigations Committee Staff Findings and Recommendations: January 23, 2014
18
shown in Figure II-3. Collectively, state park operations have become more reliant on park-
generated revenues and other dedicated sources. However, Connecticut relies more heavily on
general fund monies than almost all other states, does not use park-generated revenue to fund
park operations, and has recently moved toward greater reliance on the General Fund.
Appendix C provides additional information on the use of various funding source types
nationally.
Key State Park Cost Drivers
Each funding source discussed above helps support staffing-related costs and the
remaining expenses necessary to operate Connecticut state parks. Figure II-4 provides the
breakdown of funding sources used to operate the park system for FYs 05-13. As previously
noted, the General Fund supports the bulk of park operations, averaging 80 percent of funding
over the nine-year period examined. Special funds, before eliminated as a funding source,
accounted for 13 percent, followed by “other” sources (5 percent), and federal funding (2
percent).
$0
$100
$200
$300
$400
$500
$600
$700
$800
$900
$1,000
20122011201020092008
Mil
lio
ns
Figure II-3. Nationwide State Park Funding Source Amounts
Park
Generated
Revenue
General
Fund
Dedicated
Funds
Federal
Funds
Other
Source: National Association of State Parks Directors, Annual Information Exchange
91,593,069 (80%)
14,174,567 (13%)
5,583,334 (5%)
2,653,196 (2%)
Figure II-4. State Parks Division: Connecticut
Total Expenditures by Fund Source: FYs 05-13
General Fund
Special Funds
Other
Federal
Source of data: DEEP
Program Review and Investigations Committee Staff Findings and Recommendations: January 23, 2014
19
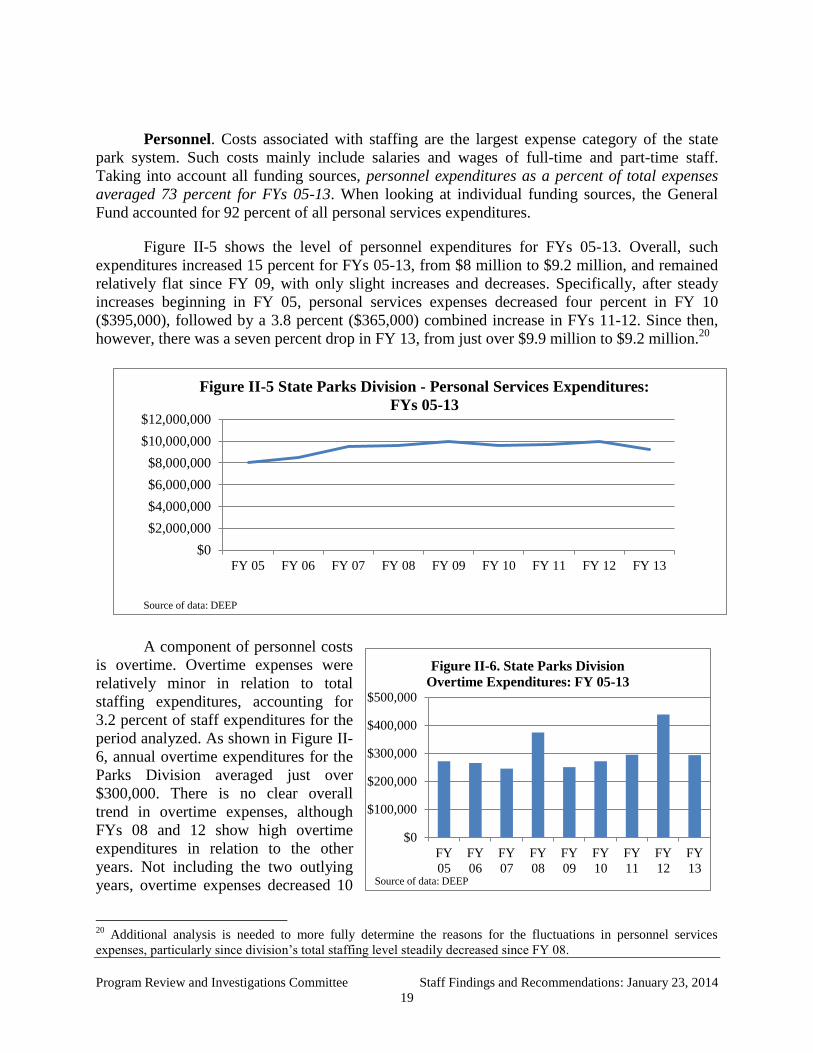
Personnel. Costs associated with staffing are the largest expense category of the state
park system. Such costs mainly include salaries and wages of full-time and part-time staff.
Taking into account all funding sources, personnel expenditures as a percent of total expenses
averaged 73 percent for FYs 05-13. When looking at individual funding sources, the General
Fund accounted for 92 percent of all personal services expenditures.
Figure II-5 shows the level of personnel expenditures for FYs 05-13. Overall, such
expenditures increased 15 percent for FYs 05-13, from $8 million to $9.2 million, and remained
relatively flat since FY 09, with only slight increases and decreases. Specifically, after steady
increases beginning in FY 05, personal services expenses decreased four percent in FY 10
($395,000), followed by a 3.8 percent ($365,000) combined increase in FYs 11-12. Since then,
however, there was a seven percent drop in FY 13, from just over $9.9 million to $9.2 million.20
A component of personnel costs
is overtime. Overtime expenses were
relatively minor in relation to total
staffing expenditures, accounting for
3.2 percent of staff expenditures for the
period analyzed. As shown in Figure II-
6, annual overtime expenditures for the
Parks Division averaged just over
$300,000. There is no clear overall
trend in overtime expenses, although
FYs 08 and 12 show high overtime
expenditures in relation to the other
years. Not including the two outlying
years, overtime expenses decreased 10
20
Additional analysis is needed to more fully determine the reasons for the fluctuations in personnel services
expenses, particularly since division’s total staffing level steadily decreased since FY 08.
$0
$2,000,000
$4,000,000
$6,000,000
$8,000,000
$10,000,000
$12,000,000
FY 05 FY 06 FY 07 FY 08 FY 09 FY 10 FY 11 FY 12 FY 13
Figure II-5 State Parks Division - Personal Services Expenditures:
FYs 05-13
Source of data: DEEP
$0
$100,000
$200,000
$300,000
$400,000
$500,000
FY
05
FY
06
FY
07
FY
08
FY
09
FY
10
FY
11
FY
12
FY
13
Figure II-6. State Parks Division
Overtime Expenditures: FY 05-13
Source of data: DEEP

Program Review and Investigations Committee Staff Findings and Recommendations: January 23, 2014
20
percent ($26,000) for FYs 05-07 and increase 18 percent ($44,000) for FYs 09-11. The increase
since FY 09 could be attributed to a steady decrease in park maintainers and supervisors, as
discussed more later in the report. Park staff have also noted that overtime has occurred due to
clean-up after heavy storms, which could be a plausible explanation for the increase in FY 12. It
was during that fiscal year (August 2011) that Hurricane Irene hit the state, dramatically
impacting parks during the parks season, namely the shoreline parks.
Other expenses. Beyond personnel services, the other key cost driver within state park
operations is “other” expenses (non-capital) necessary for overall sustainability and betterment
of state parks. This broad expense category incorporates over 250 types of expenses in CORE-
CT. Of those, approximately 150 are associated with park operations, such as utilities,
maintenance services, maintenance supplies, and waste removal. Examining these expenses
provides a greater understanding of how much money is spent operating state parks and the
specific categories in which the expenditures occur.
On average, other expenses accounted for 27 percent of all Park Division non-capital
expenses for FYs 05-13. The primary funding source for other expenses during FYs 05-09 was
special funds (62 percent), mainly the Environmental Conservation Fund. For FYs 10-13, the
General Fund supported 71 percent of other expenses. Over the nine-year period analyzed, the
General Fund funded 49 percent of the division’s other expenses, special funds (31 percent),
restricted revenue (5 percent), contribution/donations (7 percent), and federal funds (8 percent).
Again, the reason for the increase in General Fund support beginning in FY 10 was a result of
the elimination of special funds as a funding source.
Figure II-7 highlights the trend in other expenses for the Parks Division for FYs 05-13.
Overall, expenditures increased 74 percent, from $2.1 million to $3.6 million. Other expenditures
almost doubled between FYs 08-10, from $2.7 million to $5.3 million, followed by a 43 percent
decline in FYs 11 and 12, to just over $3 million. In FY 13, other expenses increased 17 percent,
to $3.6 million.
By funding source. Analysis of DEEP expenditure data shows increases in other expenses
under each funding source, specifically for FYs 09-10. For example, in FY 09, special funds
increased 54 percent, to $2.3 million, General Fund expenditures rose 14 percent to $1.1 million,
$0
$1,000,000
$2,000,000
$3,000,000
$4,000,000
$5,000,000
$6,000,000
FY 05 FY 06 FY 07 FY 08 FY 09 FY 10 FY 11 FY 12 FY 13
Figure II-7. State Parks Division - Other Expenses: FYs 05-13
Source of data: DEEP
Program Review and Investigations Committee Staff Findings and Recommendations: January 23, 2014
21
and federal funds increased 180 percent, to just under $400,000. Regarding specific types of
expenditures that year, there was a marked increase for premises repair and maintenance services
(i.e., oil burners, furnaces, sewer lines, sewage pumps, and heating and ventilation systems). In
addition, other expenses for the division’s Public Outreach function ($345,000) began showing
up in CORE-CT that year after it was reorganized into the Parks Division from the department’s
centralized communications division, which contributed to the overall rise in FY 09.
Other expenses continued to increase in FY 10, up 27 percent from FY 09, which could
be a result of deferred maintenance. The largest percentage increases occurred within federal
funds and contributions/donations. Federal funding increased almost threefold, to $1 million,
mainly due to a one-time inflow of $782,000 to fund expenses associated with government
buildings. Other expenses funded through contributions/donations more than tripled, to
$537,000, primarily for premises repair/maintenance services. As discussed in more detail
below, maintenance-related expenses more than doubled in FY 10, to $2.1 million.21
A two-year decline in other expenditures started in FY 11, mainly due to decreases in
federal funding (86 percent) and the General Fund (26 percent). As far as specific expenditure
cutbacks, two of the more prevalent decreases occurred in premises repair/maintenance supplies
(42 percent), and premises repair/maintenance services (84 percent) – among the park system’s
largest expenditure categories.
Fixed or discretionary expenditures. Other expenses are categorized either as “fixed” or
“discretionary.” Fixed expenses are recurring expenses an agency or program must account for
within its annual budget, including utilities, motor fuel, heating oil/gas, waste/trash removal, and
cellular communication services. Discretionary expenses are important to the overall operation of
a program in any given year, and include maintenance and repair supplies and services, office
supplies, motor vehicle maintenance and repairs, and premises cleaning services.
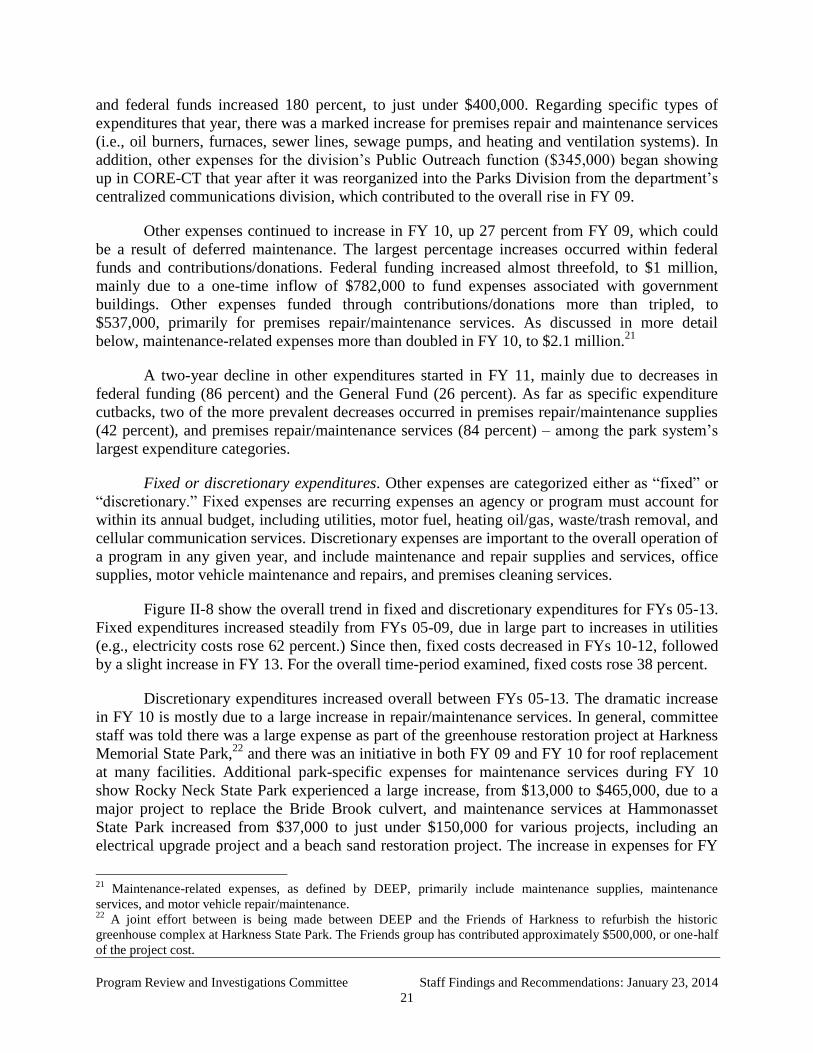
Figure II-8 show the overall trend in fixed and discretionary expenditures for FYs 05-13.
Fixed expenditures increased steadily from FYs 05-09, due in large part to increases in utilities
(e.g., electricity costs rose 62 percent.) Since then, fixed costs decreased in FYs 10-12, followed
by a slight increase in FY 13. For the overall time-period examined, fixed costs rose 38 percent.
Discretionary expenditures increased overall between FYs 05-13. The dramatic increase
in FY 10 is mostly due to a large increase in repair/maintenance services. In general, committee
staff was told there was a large expense as part of the greenhouse restoration project at Harkness
Memorial State Park,22
and there was an initiative in both FY 09 and FY 10 for roof replacement
at many facilities. Additional park-specific expenses for maintenance services during FY 10
show Rocky Neck State Park experienced a large increase, from $13,000 to $465,000, due to a
major project to replace the Bride Brook culvert, and maintenance services at Hammonasset
State Park increased from $37,000 to just under $150,000 for various projects, including an
electrical upgrade project and a beach sand restoration project. The increase in expenses for FY
21
Maintenance-related expenses, as defined by DEEP, primarily include maintenance supplies, maintenance
services, and motor vehicle repair/maintenance. 22
A joint effort between is being made between DEEP and the Friends of Harkness to refurbish the historic
greenhouse complex at Harkness State Park. The Friends group has contributed approximately $500,000, or one-half
of the project cost.
Program Review and Investigations Committee Staff Findings and Recommendations: January 23, 2014
22
13 is most likely due to repairs beginning after hurricanes Irene (August 2011) and Sandy
(October 2012).
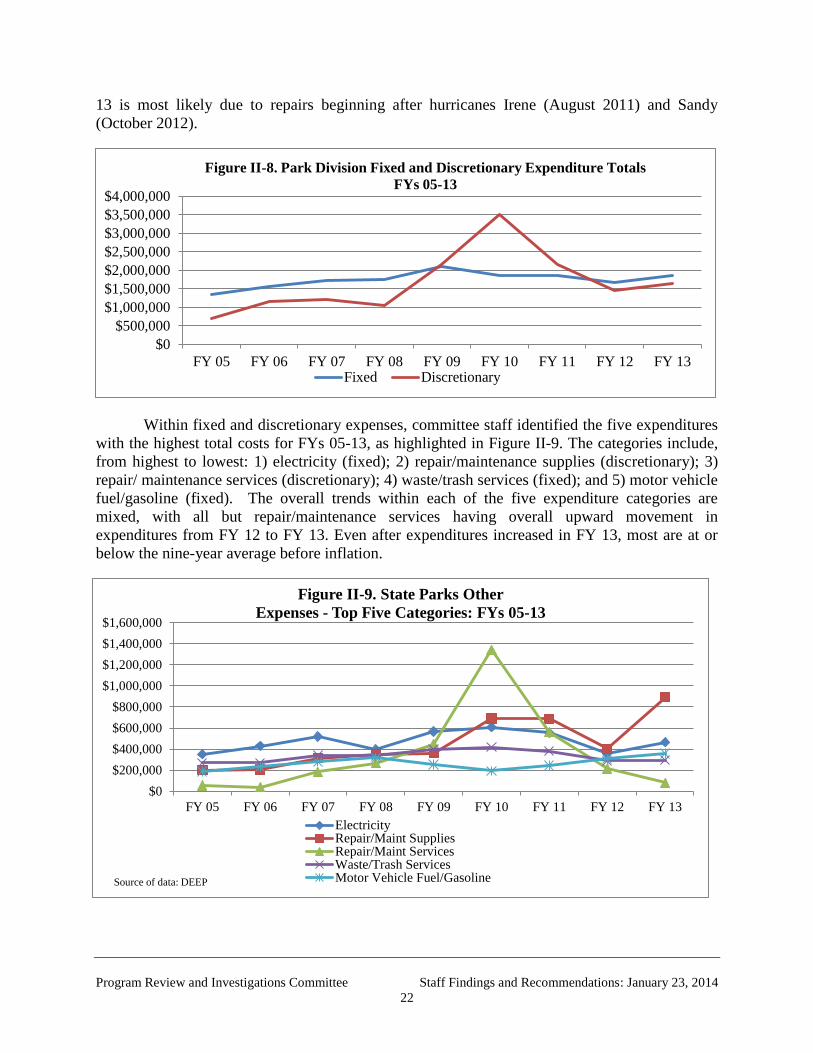
Within fixed and discretionary expenses, committee staff identified the five expenditures
with the highest total costs for FYs 05-13, as highlighted in Figure II-9. The categories include,
from highest to lowest: 1) electricity (fixed); 2) repair/maintenance supplies (discretionary); 3)
repair/ maintenance services (discretionary); 4) waste/trash services (fixed); and 5) motor vehicle
fuel/gasoline (fixed). The overall trends within each of the five expenditure categories are
mixed, with all but repair/maintenance services having overall upward movement in
expenditures from FY 12 to FY 13. Even after expenditures increased in FY 13, most are at or
below the nine-year average before inflation.
$0
$500,000
$1,000,000
$1,500,000
$2,000,000
$2,500,000
$3,000,000
$3,500,000
$4,000,000
FY 05 FY 06 FY 07 FY 08 FY 09 FY 10 FY 11 FY 12 FY 13Fixed Discretionary
Figure II-8. Park Division Fixed and Discretionary Expenditure Totals
FYs 05-13
$0
$200,000
$400,000
$600,000
$800,000
$1,000,000
$1,200,000
$1,400,000
$1,600,000
FY 05 FY 06 FY 07 FY 08 FY 09 FY 10 FY 11 FY 12 FY 13
Figure II-9. State Parks Other
Expenses - Top Five Categories: FYs 05-13
ElectricityRepair/Maint SuppliesRepair/Maint ServicesWaste/Trash ServicesMotor Vehicle Fuel/GasolineSource of data: DEEP
Program Review and Investigations Committee Staff Findings and Recommendations: January 23, 2014
23
A consistent theme among Parks Division field staff is that funding for property
maintenance, supplies, and minor repairs has decreased over time. The two expenditure
categories accounting for the largest maintenance-related expenses are premises repair and
maintenance supplies, and premises repair and maintenance services. These are broad expense
categories covering various types of maintenance-related costs. For example, expenses for
maintenance supplies cover items such as nuts and bolts, stone, concrete, lumber, toilet tissue,
and other general maintenance and building-related supplies. As noted above, repair/maintenance
services include work on oil burners, furnaces, sewer lines, sewage pumps, and
heating/ventilation systems. The two expense categories totaled $7.3 million, or just under half
of all discretionary expenses for FYs 05-13.
Figure II-9 above shows overall, repair/maintenance services experienced a dramatic
two-year spike in FYs 09-10. There was a concerted effort on part of the state to address several
large maintenance-related projects, including the examples cited above. In FY 13, however,
funding for maintenance services was at its lowest level since FY 06 before accounting for
inflation. Also shown in the figure, the trend in maintenance supplies expenses steadily increased
during FYs 05-09, until a relatively sharp jump in FY 10, again most likely due to supplies for
specific projects occurring that year. Supplies expenditures decreased again in FY 12, followed
by another increase in FY 13 to their highest level since FY 05, at just under $900,000.
Expenditures by Management Unit
Using the DEEP expenditure database, personnel and other expenses at the management
unit level were analyzed. As discussed in Chapter I, the state park system is organized according
to 23 management units statewide, with each unit responsible for a collection of state parks.
Supervisors oversee the daily operations of the units, including scheduling maintainers, deciding
daily project priorities, managing seasonal staff, and tracking capital projects. As such, funding
for park operations is based on the management unit structure, and each unit is budgeted funding
by the department’s central fiscal office.
Table II-1 provides a general overview of the personnel and other expenses by
management unit for FY 13. Appendix D shows a broader summary of management unit
expenditures for FY 05-13. (A detailed examination of actual expenditures at the management
unit level to determine where increases or decreases occurred in any fiscal year is not part of this
analysis.) The department is starting to attribute personnel and other expenses to individual
parks, and has told committee staff additional work is necessary before it is fully able to
determine exact resources dedicated to each park. At the same time, some analysis is currently
done at the park level, but strictly for capital expenditures. Committee staff encourages the
department to continue examining expenses at the park level. This information could be an
important element for analyzing overall park performance and whether to adjust resources
among parks within a management unit or determining resources are no longer necessary within
a particular park.
Seasonal Employee Expenditures
A key staffing resource used by the parks system is seasonal workers. Budgets for
seasonal staff are determined through the department’s fiscal services bureau in conjunction with

Program Review and Investigations Committee Staff Findings and Recommendations: January 23, 2014
24
the Parks Division. Each management unit supervisor then receives a seasonal worker budget.
Unlike general budgets, unit supervisors have some flexibility to determine the specific
allocations within their seasonal worker budgets (additional discussion about seasonal staffing,
including limits on seasonal budgets, is provided later in this report).
Table II-1. Parks Division Expenditures: FY 13.
Unit* Personal Services $
% of Unit Total
Expenses Other Expenses $
% of Total Unit
Expenses
Burr Pond 204,606 88.2 27,333 11.8
Cockaponsett 346,669 78.1 97,037 21.9
Dinosaur 277,131 80.5 67,137 19.5
Ft. Trumbull 278,956 66.0 143,846 34.0
Gillette Castle 397,185 74.9 133,091 25.1
Hammonasset 941,753 69.0 422,852 31.0
Harkness 528,916 39.8 798,541 60.2
Lake Waramaug 160,667 75.7 51,597 24.3
Macedonia 169,096 58.9 117,790 41.1
Mashamoquet 308,015 77.9 87,235 22.1
Osborndale 359,151 83.0 73,752 17.0
Pauchaug/Hopeville 487,748 74.7 165,032 25.3
Penwood 315,203 81.9 69,857 18.1
Peoples 182,052 77.8 51,974 22.2
Putnam 413,184 81.5 94,096 18.5
Rocky Neck 606,684 78.2 168,963 21.8
Salmon River 264,617 78.4 73,088 21.6
Shenipsit 96,611 70.3 40,735 29.7
Sherwood Island 453,020 72.7 169,788 27.3
Sleeping Giant 336,856 81.5 76,497 18.5
Squantz Pond 221,471 77.0 66,315 23.0
Topsmead 401,073 77.0 120,033 23.0
Director* 608,969 73.8 216,676 26.2
East Distr HQ* 97,727 93.1 7,198 6.9
Kellogg,Osborne,Goodwin* 343,780 74.4 118,002 25.6
Public Outreach* 278,416 95.6 12,797 4.4
West Distr HQ* 152,557 58.9 106,274 41.1
Grand Total 9,232,113 72.1 3,577,536 27.9
*Budgeted areas within the Parks Division beyond park management units, which were included to show total
expenditures for the division.
Source of data: DEEP
Figure II-10 shows Parks Division expenditures for seasonal workers for FYs 05-13. For
the period analyzed, the division experienced steady annual growth in its seasonal worker
expenditures each year except FY 13. Overall, seasonal worker expenditures increased 39
percent for the nine-year period analyzed, from $2.3 million to $3.1 million. Expenditures ranged
from a low of $2.2 million in FY 05, to $3.3 million in FY 12. The decline in FY 13 from the
previous year was $175,000, or just over 5 percent. On average, the Parks Division expended
$2.9 million on seasonal staff since FY 05. In addition, seasonal worker expenditures were
highest at the three main shoreline parks (Hammonasset, Rocky Neck, and Sherwood Island.)

Program Review and Investigations Committee Staff Findings and Recommendations: January 23, 2014
25
Capital Expenditures
In 1997, following years of park closures, the legislature announced that it would bond
$114 million to help repair and improve the state park system. Known as the 2010 Plan, the
initiative was established to begin rebuilding the infrastructure of Connecticut’s parks that was
curtailed in earlier years. An outside completion date of 2010 was given to complete the projects.
As a way to help DEEP assess state park capital inventory needs, an independent
consultant was hired to conduct a review within 51 of the most used state parks. The 2003 report
provided a detailed listing of the capital infrastructure needs within state parks, costs of the
recommended improvements, and the staff levels necessary to adequately maintain the system.
The study estimated the improvements would cost $187 million over a ten-year time horizon. In
addition, the report stated 204 full-time staff and 1,943 seasonal staff would be needed for
system-wide operations and maintenance.
To date, roughly half of the $114 million cost of the 2010 Plan has been allocated by the
state bond commission for state park infrastructure capital improvements. Given the 2010
completion date has passed, DEEP has rolled the 2010 Plan for state parks into a department-
wide 2020 Plan, which incorporates all of the department’s capital improvement plans, not just
those associated with state parks.
There are other bond authorizations for park system projects. The department selects
capital projects for which to seek funding for from the bond commission. Within those
authorizations, the department has allocations for different projects. The department has several
holding accounts for projects fitting under broader funding categories, including minor capital
repairs, health/safety, demolition, or paving. As discussed below, there is a process in place to
determine funding levels, and management, of projects based on overall cost. Table II-2 provides
a summary of the requirements of the various thresholds (post-bond commission approval.)
$0
$500,000
$1,000,000
$1,500,000
$2,000,000
$2,500,000
$3,000,000
$3,500,000
$4,000,000
$4,500,000
$5,000,000
FY 05 FY 06 FY 07 FY 08 FY 09 FY 10 FY 11 FY 12 FY 13
Figure II-10. State Park Seasonal Worker Expenditures: FYs 05-13
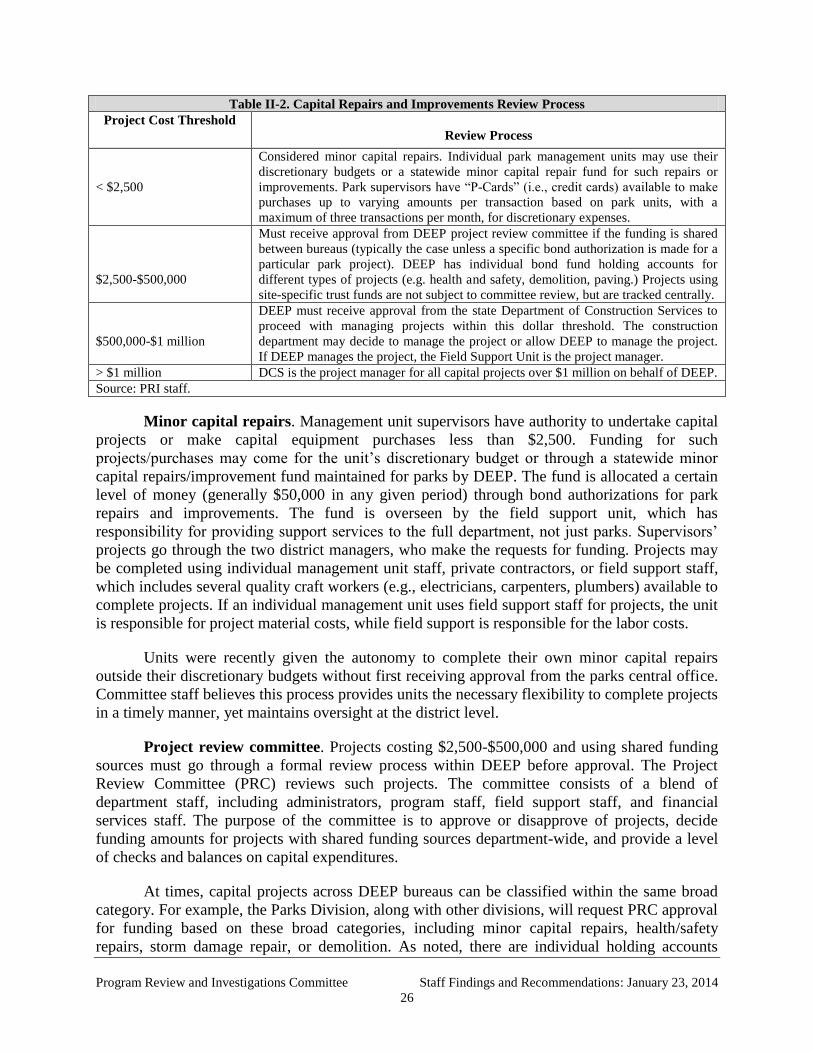
Program Review and Investigations Committee Staff Findings and Recommendations: January 23, 2014
26
Table II-2. Capital Repairs and Improvements Review Process
Project Cost Threshold
Review Process
< $2,500
Considered minor capital repairs. Individual park management units may use their
discretionary budgets or a statewide minor capital repair fund for such repairs or
improvements. Park supervisors have “P-Cards” (i.e., credit cards) available to make
purchases up to varying amounts per transaction based on park units, with a
maximum of three transactions per month, for discretionary expenses.
$2,500-$500,000
Must receive approval from DEEP project review committee if the funding is shared
between bureaus (typically the case unless a specific bond authorization is made for a
particular park project). DEEP has individual bond fund holding accounts for
different types of projects (e.g. health and safety, demolition, paving.) Projects using
site-specific trust funds are not subject to committee review, but are tracked centrally.
$500,000-$1 million
DEEP must receive approval from the state Department of Construction Services to
proceed with managing projects within this dollar threshold. The construction
department may decide to manage the project or allow DEEP to manage the project.
If DEEP manages the project, the Field Support Unit is the project manager.
> $1 million DCS is the project manager for all capital projects over $1 million on behalf of DEEP.
Source: PRI staff.
Minor capital repairs. Management unit supervisors have authority to undertake capital
projects or make capital equipment purchases less than $2,500. Funding for such
projects/purchases may come for the unit’s discretionary budget or through a statewide minor
capital repairs/improvement fund maintained for parks by DEEP. The fund is allocated a certain
level of money (generally $50,000 in any given period) through bond authorizations for park
repairs and improvements. The fund is overseen by the field support unit, which has
responsibility for providing support services to the full department, not just parks. Supervisors’
projects go through the two district managers, who make the requests for funding. Projects may
be completed using individual management unit staff, private contractors, or field support staff,
which includes several quality craft workers (e.g., electricians, carpenters, plumbers) available to
complete projects. If an individual management unit uses field support staff for projects, the unit
is responsible for project material costs, while field support is responsible for the labor costs.
Units were recently given the autonomy to complete their own minor capital repairs
outside their discretionary budgets without first receiving approval from the parks central office.
Committee staff believes this process provides units the necessary flexibility to complete projects
in a timely manner, yet maintains oversight at the district level.
Project review committee. Projects costing $2,500-$500,000 and using shared funding
sources must go through a formal review process within DEEP before approval. The Project
Review Committee (PRC) reviews such projects. The committee consists of a blend of
department staff, including administrators, program staff, field support staff, and financial
services staff. The purpose of the committee is to approve or disapprove of projects, decide
funding amounts for projects with shared funding sources department-wide, and provide a level
of checks and balances on capital expenditures.
At times, capital projects across DEEP bureaus can be classified within the same broad
category. For example, the Parks Division, along with other divisions, will request PRC approval
for funding based on these broad categories, including minor capital repairs, health/safety
repairs, storm damage repair, or demolition. As noted, there are individual holding accounts
Program Review and Investigations Committee Staff Findings and Recommendations: January 23, 2014
27
within DEEP’s broader bond authorizations for the various categories. The holding accounts are
common funding sources for projects across several bureaus within DEEP. As such, there needs
to be a mechanism to formally decide which projects receive funding and how much; the
committee serves this purpose.
Within the parks system, unit supervisors and district managers confer about capital
projects. Once a project is decided upon, a request form is completed and reviewed in advance of
the PRC meeting (held quarterly) by all the relevant bureaus, including financial services and
field support. The committee uses the forms as guidance for project scope and cost, and to decide
whether to approve, deny, or modify a project. Whenever funds from specific holding accounts
are drawn down, a new request from the bond commission is made. The committee does not get
involved when bond authorizations are for a project at a specific location, since previous review
and justification were completed, namely through the bond commission.
A criticism by some within DEEP of the project review committee process is that various
programs, including parks, will request funding for projects without fully analyzing whether the
project is the most efficient way to solve a problem given limited resources. Some also question
whether enough planning occurs prior to requesting project funding to determine if the project
fits into a larger, more strategic plan for capital expenditures or if the project is vital to the
overall parks system.
Committee staff attended one PRC meeting. Several projects before the committee were
questioned on its necessity by members as to their expense and overall purpose within a viable,
long-term parks system. One particular project proposed by the Parks Division was questioned
whether it was necessary, given attendance at the specific park where the project would occur
was sparse at best. Although this is only a single event within one PRC meeting, committee staff,
through its observations at the meeting combined with information from its broader interviews
with department staff, believes it is indicative of a more systemic issue: the lack of proper long-
term facilities planning, as discussed in Chapter V.
Major capital projects. The Department of Construction Services has specific teams of
architects, engineers, and construction specialists to provide capital project planning and
management services for any state construction project over $500,000 (not including the
transportation department or University of Connecticut projects.) A DCS project manager will
develop an agency’s project concept from inception through project delivery, including scope
development, creation of a project budget, formal selection for a design professional, oversight
of the design process, recommendation and award of a construction contract, oversight and
enforcement of the construction process, and project completion and turnover of the final product
to the client agency. The project teams also provide technical assistance and troubleshoot various
facility problems when requested from the client agency. For projects over $1 million, DCS takes
responsibility for overall project management and delivery, while projects between $500,000 and
$1 million may include coordinated efforts between DCS and DEEP staff.
Capital expenditure trends. DEEP provided capital expenditure information for FYs
10-13. Prior to FY 10, capital projects over $1 million did not show up as a DEEP expense on its
general ledger. Instead, the expense was considered a DCS expense since that department was
responsible for the overall management of such projects. A change was made to ensure expenses

Program Review and Investigations Committee Staff Findings and Recommendations: January 23, 2014
28
for all capital projects – regardless of which department managed the projects – would show up
on DEEP’s general ledger. To get a truer picture of capital expenses, therefore, only information
for FY 10 and after was examined. Figure II-11 shows the results.
The overall trend in expenditures for parks-related capital projects shows an increase
since FY 11, although expenses that fiscal year were their lowest of the four years examined.
Capital expenditures for FY 13 were the highest of all four years. Annual expenditures for
capital parks projects for FYs 10-13 averaged $2.3 million, and ranged from $1.5 million in FY
11, to $3.2 million in FY 13. In addition, the number of capital projects within state parks ranged
from 28 (FY 11) to 81 (FY 10). On average, 57 projects occurred annually. Examples of the most
expensive projects incurring capital expenses during FYs 10-13 include: Silver Sands Walnut
Beach Boardwalk ($909,000); Hammonasset beach stabilization ($478,000); Peoples State
Forest new toilet building and other improvements ($406,000); and Harkness paving ($357,000).
$0
$500,000
$1,000,000
$1,500,000
$2,000,000
$2,500,000
$3,000,000
$3,500,000
FY 10 FY 11 FY 12 FY 13
Figure II-11. State Parks - Capital Project Expenditures: FYs 10-13
Source of data: DEEP
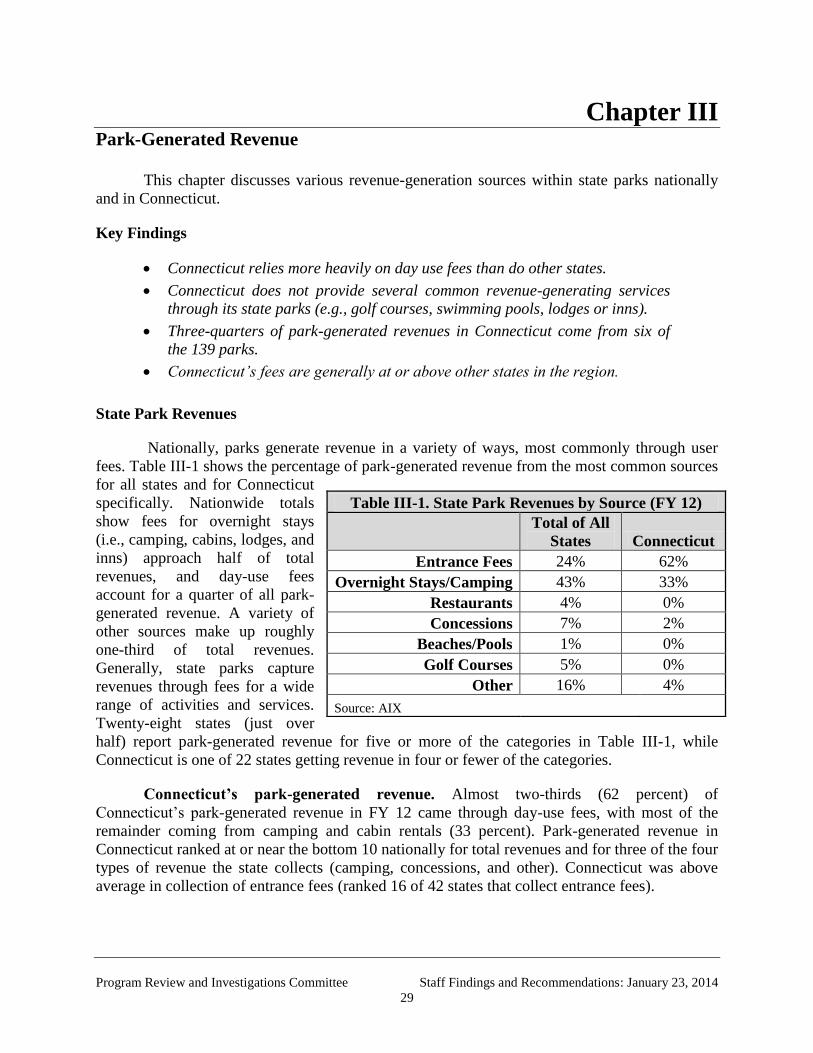
Program Review and Investigations Committee Staff Findings and Recommendations: January 23, 2014
29
Chapter III Park-Generated Revenue
This chapter discusses various revenue-generation sources within state parks nationally
and in Connecticut.
Key Findings
Connecticut relies more heavily on day use fees than do other states.
Connecticut does not provide several common revenue-generating services
through its state parks (e.g., golf courses, swimming pools, lodges or inns).
Three-quarters of park-generated revenues in Connecticut come from six of
the 139 parks.
Connecticut’s fees are generally at or above other states in the region.
State Park Revenues
Nationally, parks generate revenue in a variety of ways, most commonly through user
fees. Table III-1 shows the percentage of park-generated revenue from the most common sources
for all states and for Connecticut
specifically. Nationwide totals
show fees for overnight stays
(i.e., camping, cabins, lodges, and
inns) approach half of total
revenues, and day-use fees
account for a quarter of all park-
generated revenue. A variety of
other sources make up roughly
one-third of total revenues.
Generally, state parks capture
revenues through fees for a wide
range of activities and services.
Twenty-eight states (just over
half) report park-generated revenue for five or more of the categories in Table III-1, while
Connecticut is one of 22 states getting revenue in four or fewer of the categories.
Connecticut’s park-generated revenue. Almost two-thirds (62 percent) of
Connecticut’s park-generated revenue in FY 12 came through day-use fees, with most of the
remainder coming from camping and cabin rentals (33 percent). Park-generated revenue in
Connecticut ranked at or near the bottom 10 nationally for total revenues and for three of the four
types of revenue the state collects (camping, concessions, and other). Connecticut was above
average in collection of entrance fees (ranked 16 of 42 states that collect entrance fees).
Table III-1. State Park Revenues by Source (FY 12)
Total of All
States Connecticut
Entrance Fees 24% 62%
Overnight Stays/Camping 43% 33%
Restaurants 4% 0%
Concessions 7% 2%
Beaches/Pools 1% 0%
Golf Courses 5% 0%
Other 16% 4%
Source: AIX

Program Review and Investigations Committee Staff Findings and Recommendations: January 23, 2014
30
Figure III-1 shows total park-generated revenues in constant 2013 dollars for CYs 05-
13.23
In 2013 dollars, total revenues were relatively stable around $5 million annually during
CYs 05-08, before increasing past the $6 million annual threshold for CYs 09-13, with the
exception of a 38 percent jump from CY 09 to CY 10, which preceded a 20 percent drop from
CY 10 to CY 11. While the graph shows something of a plateau for CYs 11-13, there may be a
steadier decline from CY 10 to the present once the hurricane-based losses of CY 11 are
considered.24
Fee increase. Connecticut’s state parks fees were changed twice in the last six years.
First, the fees were doubled over their FY 09 values effective October 1, 2009 as part of
implementation of the state’s operating budget that increased all of the fees in the state (not just
parks’ fees). Fee levels in state parks were subsequently reduced from the doubled rates to
current figures (135 percent of FY 09 levels for residents and 150 percent of FY 09 for non-
residents) as part of a broader deficit mitigation package in April 2010. Because of the timing of
the initial doubling of fees and subsequent reductions, the doubled fee levels were only charged
at a handful of parks with ongoing paid activities in October 2009. Table III-2 shows a summary
of the timing and amount of the fee increases relative the fee levels in place in FY 09. Also
included is one example (weekend fees at Hammonasset) of the actual fee values in each time
frame.
23
All CY 13 numbers were preliminary through November 2013. Park-generated revenue figures do not include
revenues from concessions agreements, which were less than $150,000 in FY 12 and are administered at the Parks
Division central office. 24
Hurricane Irene hit Connecticut in late August 2011, greatly limiting park access for at least two weekends,
including the normally busy Labor Day weekend.
$5.34 $4.90
$5.38 $5.23
$6.18
$8.44
$6.56 $6.81 $6.50
$0
$1
$2
$3
$4
$5
$6
$7
$8
$9
2005 2006 2007 2008 2009 2010 2011 2012 2013
Co
nst
an
t 2
01
3 D
oll
ars
M
illi
on
s
Figure III-1. Connecticut State Park Revenues (CYs 05-13)
Source: DEEP revenue data
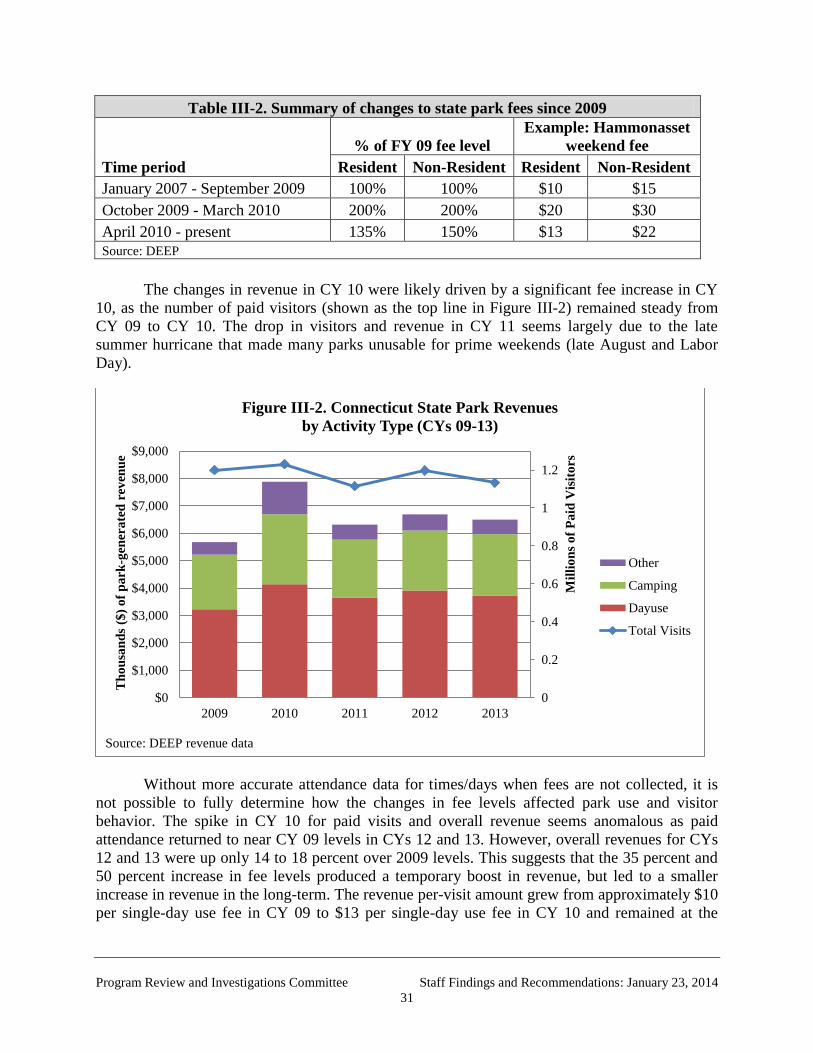
Program Review and Investigations Committee Staff Findings and Recommendations: January 23, 2014
31
Table III-2. Summary of changes to state park fees since 2009
Time period
% of FY 09 fee level
Example: Hammonasset
weekend fee
Resident Non-Resident Resident Non-Resident
January 2007 - September 2009 100% 100% $10 $15
October 2009 - March 2010 200% 200% $20 $30
April 2010 - present 135% 150% $13 $22
Source: DEEP
The changes in revenue in CY 10 were likely driven by a significant fee increase in CY
10, as the number of paid visitors (shown as the top line in Figure III-2) remained steady from
CY 09 to CY 10. The drop in visitors and revenue in CY 11 seems largely due to the late
summer hurricane that made many parks unusable for prime weekends (late August and Labor
Day).
Without more accurate attendance data for times/days when fees are not collected, it is
not possible to fully determine how the changes in fee levels affected park use and visitor
behavior. The spike in CY 10 for paid visits and overall revenue seems anomalous as paid
attendance returned to near CY 09 levels in CYs 12 and 13. However, overall revenues for CYs
12 and 13 were up only 14 to 18 percent over 2009 levels. This suggests that the 35 percent and
50 percent increase in fee levels produced a temporary boost in revenue, but led to a smaller
increase in revenue in the long-term. The revenue per-visit amount grew from approximately $10
per single-day use fee in CY 09 to $13 per single-day use fee in CY 10 and remained at the
0
0.2
0.4
0.6
0.8
1
1.2
$0
$1,000
$2,000
$3,000
$4,000
$5,000
$6,000
$7,000
$8,000
$9,000
2009 2010 2011 2012 2013
Mil
lio
ns
of
Pa
id V
isit
ors
Th
ou
san
ds
($)
of
pa
rk-g
ener
ate
d r
ev
enu
e
Figure III-2. Connecticut State Park Revenues
by Activity Type (CYs 09-13)
Other
Camping
Dayuse
Total Visits
Source: DEEP revenue data
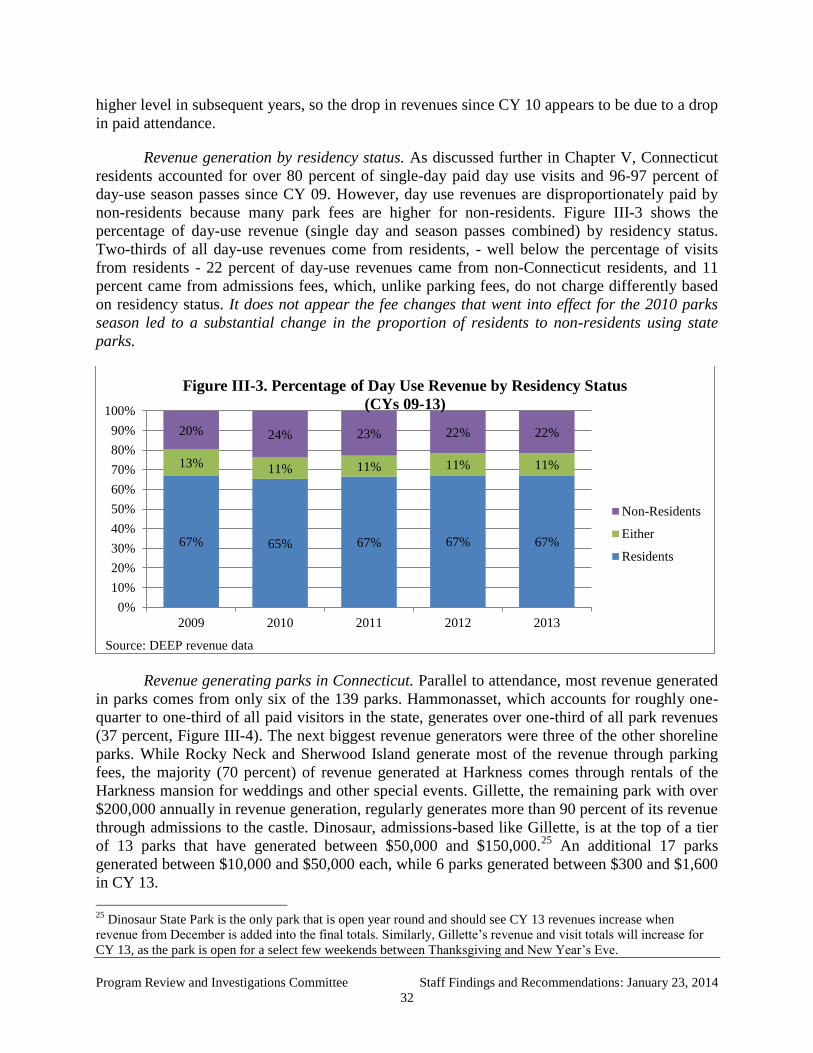
Program Review and Investigations Committee Staff Findings and Recommendations: January 23, 2014
32
higher level in subsequent years, so the drop in revenues since CY 10 appears to be due to a drop
in paid attendance.
Revenue generation by residency status. As discussed further in Chapter V, Connecticut
residents accounted for over 80 percent of single-day paid day use visits and 96-97 percent of
day-use season passes since CY 09. However, day use revenues are disproportionately paid by
non-residents because many park fees are higher for non-residents. Figure III-3 shows the
percentage of day-use revenue (single day and season passes combined) by residency status.
Two-thirds of all day-use revenues come from residents, - well below the percentage of visits
from residents - 22 percent of day-use revenues came from non-Connecticut residents, and 11
percent came from admissions fees, which, unlike parking fees, do not charge differently based
on residency status. It does not appear the fee changes that went into effect for the 2010 parks
season led to a substantial change in the proportion of residents to non-residents using state
parks.
Revenue generating parks in Connecticut. Parallel to attendance, most revenue generated
in parks comes from only six of the 139 parks. Hammonasset, which accounts for roughly one-
quarter to one-third of all paid visitors in the state, generates over one-third of all park revenues
(37 percent, Figure III-4). The next biggest revenue generators were three of the other shoreline
parks. While Rocky Neck and Sherwood Island generate most of the revenue through parking
fees, the majority (70 percent) of revenue generated at Harkness comes through rentals of the
Harkness mansion for weddings and other special events. Gillette, the remaining park with over
$200,000 annually in revenue generation, regularly generates more than 90 percent of its revenue
through admissions to the castle. Dinosaur, admissions-based like Gillette, is at the top of a tier
of 13 parks that have generated between $50,000 and $150,000.25
An additional 17 parks
generated between $10,000 and $50,000 each, while 6 parks generated between $300 and $1,600
in CY 13.
25
Dinosaur State Park is the only park that is open year round and should see CY 13 revenues increase when
revenue from December is added into the final totals. Similarly, Gillette’s revenue and visit totals will increase for
CY 13, as the park is open for a select few weekends between Thanksgiving and New Year’s Eve.
67% 65% 67% 67% 67%
13% 11% 11% 11% 11%
20% 24% 23% 22% 22%
0%
10%
20%
30%
40%
50%
60%
70%
80%
90%
100%
2009 2010 2011 2012 2013
Figure III-3. Percentage of Day Use Revenue by Residency Status
(CYs 09-13)
Non-Residents
Either
Residents
Source: DEEP revenue data

Program Review and Investigations Committee Staff Findings and Recommendations: January 23, 2014
33
Entrance fees. Entrance fees (parking or admission) were collected in state parks in 42
states in FY 12. These fees account for nearly a quarter of total state park revenues nationwide.
Fee levels vary widely by state, activity/location, and residency status.
Parking fees. Parking fees are the most common entrance fee for all states and for
Connecticut. A summary of passenger vehicle fees nationwide is shown in Table III-3.26
Altogether, 32 states charge fees for passenger vehicle admission or parking, ranging from $0.50
to $30 per car, with most states being near the $5-7 per resident passenger vehicle and $6-10 per
non-resident passenger vehicle ranges. Where and how often per vehicle fees are assessed varies,
as slightly more than a third of the states that charge for parking at any of their state parks charge
at fewer than 25 percent of their parks, another third charge at between 25 and 75 percent of
parks, and slightly under a third charge at over 75 percent of parks (including 10 states that
charge at all parks).
Table III-3. Summary of Passenger Vehicle Entrance/Parking Fees (FY 12)
% of park
locations
charging for
entrance
Resident
Min
Resident
Max
Non-Resident
Min
Non-
Resident
Max
High 100% $15.00 $30.00 $20.00 $30.00
Median 49% $5.00 $5.50 $5.00 $6.00
Average 47% $5.34 $8.71 $6.01 $9.65
Low (non-zero) 1% $0.50 $3.00 $0.50 $3.00
Connecticut 19% $6.00 $13.00 $10.00 $22.00 32 states charge passenger vehicle entrance or parking fees.
Table does not include 18 states without vehicle fees in analysis.
Source: AIX.
26
This table looks only at passenger vehicle entrance/parking. Some states without per vehicle charges charge per
person. Many states have separate fees for busses at higher rates.
Hammonasset,
$2,256,292, 37%
Rocky Neck,
$944,724, 15%
Sherwood Island,
$607,030, 10%
Harkness, $480,334,
8%
Gillette Castle,
$262,320, 4%
Dinosaur, $131,560,
2%
Other (35 parks),
$1,512,204, 24%
Figure III-4. Revenues by Park (CY 13)
Source: DEEP revenue data

Program Review and Investigations Committee Staff Findings and Recommendations: January 23, 2014
34
Connecticut’s parking fees. Connecticut charges parking for part of the year at 26 parks,
though there is wide variation in whether and
when paid admission is required on
weekdays during the park season, while there
are no parking fees at any park during the
winter.27
A summary of Connecticut’s
parking fees is shown in Table III-4.
(Appendix B provides summaries of all
Connecticut park fees.) The resident vehicle
parking rate range is from $6 to $13 while
the non-resident range is $10-22. Connecticut
charges more per vehicle than the nationwide
median, regardless of residency status, but
does not charge for parking at most of the
parks in the state. Regionally, Connecticut’s parking fees are higher than those in Massachusetts
and New York ($2-10 per vehicle), but in line with those in New Jersey and Rhode Island ($5-28
per vehicle).
Fewer than half of all states report charging a separate bus or group fee, which ranges
from $5 to $150 per bus or group. Connecticut’s bus fee is the highest reported at $100 for
residents and $150 for non-residents, compared to the median group/bus fee of $20-25.
Individual admission. Twenty-eight states charge individual admission to some state
parks, though individual admission is more scarcely used than per vehicle admission. More than
half (15) of the 28 states that charge some individual admission are doing so at less than one-
third of the parks in those states. The range of admission fees is $1 per adult resident to $36 for
adult residents. Only three states have a maximum individual charge greater than $10 per visitor.
Connecticut charges $2 to $6 admission at three sites (Gillette Castle, Dinosaur, and Fort
Trumbull State Parks) for specific building entry, but does not charge for parking at those state
parks. Connecticut also offers the Heritage Season Pass specifically for these three sites, at a cost
of $67 per year per family (two adults and up to four children).
Entrance passes. Almost all states that charge parking or admission offer annual passes.
The pricing of these passes is such that a park visitor will be better off having bought a pass for
unlimited visits than paying per visit in as few as one to two visits to as many as twenty visits.
The median number of visits necessary to have equal value between paying for individual visits
and paying for a season pass is seven.28
Connecticut charges $67 for resident season passes and $112 for non-resident season
passes, which provide unlimited parking for one vehicle only. To get a full pass’s worth of visits
from a season pass, pass-holders would need to enter state parks when fees are being charged for
27
Generally, the season is Memorial Day to Labor Day, though some parks begin charging for parking in April and
continue until October. 28
Season passes work differently in different states. It is possible some state season passes include non-entrance
based benefits, including discounts on camping fees or concessions.
Table III-4. Parking Fees in Connecticut
Number
of parks Residents
Non-
Residents
Weekend 26 $9-13 $15-22
Weekday 11 $6-9 $10-15
Late-day
(after 4 pm) 10 $5-6 $6-7
None 113 - - Note: Number of parks for each category is non-exclusive
of other categories. The group of parks charging for
weekend parking is inclusive of the sub-groups that
charge for weekday or late-day admissions.
Source: DEEP (2013)

Program Review and Investigations Committee Staff Findings and Recommendations: January 23, 2014
35
parking at least five to 10 times, depending on days visited (i.e., weekdays or weekends) and the
specific parks visited. Regionally, Connecticut’s season pass costs are similar to resident passes
in New York ($65 resident), Rhode Island ($60 resident, $120 non-resident), and New Jersey
($50), but higher than Massachusetts ($35-45) and higher than New Jersey’s non-resident pass
($75).
The number of season passes sold (including Heritage Passes) has been between 8,400
and 8,700 since CY 10, a noticeable drop-off from CY 09 when 9,600 passes were sold, as
shown in Figure III-5. The price of a season pass increased from $50 for residents and $75 for
non-residents in CY 09 to $67 for residents and $112 for non-residents since CY 10. Revenues
from season passes increased from $510,000 in CY 09 to $600,000 or more in CYs 10-13, an
increase of 17 to 22 percent. Though the number of visits for value remained the same, it is likely
the increase in overall price is partially responsible for the decrease in season passes.
Connecticut also offers two lifetime passes free of charge, the Charter Oak Pass for
Connecticut residents 65 and older and another pass for disabled veterans who are Connecticut
residents. Parks Division staff estimates that over 100,000 Charter Oak passes have been
distributed since the beginning of the program in 1992, with approximately 50,000 Charter Oak
passes still active. Between 2,300 and 4,200 Charter Oak Passes have been distributed annually
since 2009. There are far fewer disabled veterans passes in circulation, with just over 600
distributed in 2012 and under 200 in 2013.
Connecticut does not track the number of times a season or lifetime pass is used, so, aside
from comparisons to other states, it is not currently possible to determine the impact of the
passes on park revenue generation. More data on use of these passes would assist in creating
9,662 8,386 8,588 8,705 8,409
$509,700 $599,269 $609,562 $622,142 $603,234
-$50,000
$50,000
$150,000
$250,000
$350,000
$450,000
$550,000
$650,000
$750,000
-
2,000
4,000
6,000
8,000
10,000
12,000
2009 2010 2011 2012 2013
Figure III-5. Season Passes per Calendar Year
(Number and Revenue) (CYs 09-13)
Source: DEEP revenue data

Program Review and Investigations Committee Staff Findings and Recommendations: January 23, 2014
36
better attendance estimates and inform the Parks Division on the relationship between revenues,
attendance, and fee levels, in part to determine if the fee levels for passes should be altered.
Recommendation
4. The use of season and lifetime passes should be tracked by pass type when parks
are otherwise charging for parking or admissions.
This responsibility should be little to no added burden for park staff, especially in parks
with electronic registers. In preparing to collect pass use totals, the Parks Division should
determine where it is currently possible to track individual pass use and make an effort to track
individual pass use for at least the shoreline parks.
Some states offer season passes via non-park venues. For example, in 2011, Michigan
instituted a program to make season passes available as part of the car registration process. This
approach is different than using a portion of registration fees for park operations, as the program
is entirely voluntary and includes several ways to opt out.
If, from the data collected about season passes, the Parks Division determines that selling
additional season passes would be beneficial to the parks system or parks visitors, it should
explore new ways of marketing and selling season passes, including in collaboration with the
Department of Motor Vehicles.
Overnight stays. Nationwide, 43 percent of park-generated revenues comes from
overnight stays compared to 33 percent in Connecticut. All states generate revenue through
camping and all but one state have cabins available for rent. Twenty-nine states also have lodges
available in state parks as another overnight visit option. Campsite fees range from $2-60 for
primitive or non-improved sites to $6-80 for improved sites.29
The median cost of sites is
between $10-30, depending on the amenities. Connecticut appears near the median for non-
improved ($14-30) or primitive ($5) sites, and just slightly above average for improved sites
($33-52). Likewise, Connecticut is near the median price for cabin rentals ($70 versus a median
minimum of $50).
Nationwide, over two-thirds of all overnight stay revenue came from camping ($307
million of $452 million total), with cabins ($86 million) and lodges ($55 million) contributing
most of the rest. In Connecticut, almost all of the $2.1 million in overnight state revenue came
from campsite rental, with less than $14,000 for cabin rentals in FY 12. The revenue from cabin
rentals is likely to increase as more cabins are built around the state, especially from cabins at
campsites that are already at or near capacity at peak times.
Concessions. Nationwide, the biggest revenue generator outside of entrance fees and
overnight stays is concessions, which accounted for 7 percent ($72 million) of total state park
revenues in FY 12. Almost every state reported generating money through concessions (48
states). Concessions include a wide range of goods and services, including food service, camp
stores, and recreation rentals (e.g., jet-ski rental, canoe rental). From conversations with state
parks personnel in other states, it appears that concessions are perhaps the most commonly
29
“Improved sites” typically have one, some, or all of electricity, water, or sewage hookups.
Program Review and Investigations Committee Staff Findings and Recommendations: January 23, 2014
37
privatized parks element, with all case study states reporting a mix of state and private provision
of concession services.30
For FY 12, Connecticut reported $144,000 in concessions revenue, up from $109,000 in
FY 08. Connecticut’s concession total ranks 39 of the 48 states generating concessions revenue.
Connecticut’s percentage of revenue from concessions (2 percent) is less than one-third the
national average (7 percent).
Currently, several of the state’s busiest parks have concessions controlled by the Bureau
of Education and Services for the Blind (BESB). Through statutory authority,31
BESB has the
right of first refusal for concessions service provision at all state agencies. While other service
providers provide either a flat or revenue-based fee to parks for the right to operate in state parks,
BESB operators pay no such fee. As BESB has no reporting requirement to parks, the extent of
the lost revenues for parks is not evident.
It is possible BESB operations of a limited number of concessions opportunities impacts
overall service provision in state parks in indirect ways. For instance, a contractor may be willing
to operate on a limited basis in multiple parks, but not willing to operate in lesser-used parks
without a highly-attended park as a home base or anchor for the operation. If the Park Division
would like to provide more contracted services at a wider range of parks, it might explore
requiring the bundling of minimum service provision levels across multiple parks in future
requests-for-proposals.
Other revenue-generating services. Nationwide, some state parks generate revenue
through restaurants (19 states), golf courses (17 states), and swimming pools (23 states).
Combined, these three types of activities account for 10 percent of nationwide state park
revenues, with another 16 percent of nationwide revenues labeled under a broader “other”
category. Connecticut does not provide any of the three services and collects no revenue in this
area, aside from the revenue derived from parking and camping at swimming areas (i.e., beaches,
lakes, and ponds). If the Parks Division seeks to generate additional revenue, it should explore
the viability of providing these resource- and location-based services, either internally by the
division or through contracts with private vendors. Possibilities for increased revenue generation
are discussed in greater detail in Chapter VI.
Special use licenses. In some instances, Connecticut grants special use licenses to
organizations for events at state parks that would otherwise be outside the rules or guidelines of
parks. These events are often meetings or fundraisers for private organizations or governmental
groups. Generally, groups are charged a fee to apply for a special permit ($50 for non-profits,
$625 for for-profits) and then are responsible for fully covering the other staff and resource costs
necessary to hold the events. Over the last 5 years, there has been a declining number of special
use licenses issued annually, with the application fees totaling approximately $10,000 or less
annually during this timeframe. Estimates of the number of special use licenses issued and the
application fees are provided in Figure III-6. A new tracking system for special use licenses was
enacted in CY 09. The figures for CYs 03-09 represent the educated guesses of Parks Division
staff. 30
Committee staff interviewed state parks personnel in select other states, as discussed in Appendix E. 31
C.G.S. Sec. 10-298b.

Program Review and Investigations Committee Staff Findings and Recommendations: January 23, 2014
38
The state recoups the actual expenses incurred by the event (e.g., staff overtime), but does
not gain revenue from special permits beyond the application fee. There is some concern among
park personnel and Friends groups that the general wear and tear from the special events,
especially those with large numbers of people in attendance, is not accounted for within the cost
reimbursement. The Parks Division does not use special permits as a significant revenue source,
but it may be worthwhile for the division to determine whether long-term costs of maintenance
should be considered as part of special use license cost reimbursements.
Donations and sponsorships. Both donations and sponsorships are funding sources with
the potential to enhance parks and the underlying revenues. Donations may come in the form of
cash, equipment, or in-kind service provision, as can sponsorship arrangements. Through
interviews with parks personnel in other states, staff determined there was general agreement that
these funding sources can be helpful in broadening or enhancing parks and programs, but are not
necessarily reliable ongoing funding sources.
There are varying thoughts among park directors in other states on the proper use and
allowance of donations and, more particularly, of sponsorships. Some states support limiting
sponsorship arrangements to organizations with preservation or outdoor recreation goals similar
to those of a state’s park system. Other states can be more lenient about sharing goals, so long as
the efforts of the sponsoring company are not at cross purposes to the goals of parks. But because
of other factors unique to each state, there is little evident agreement on what constitutes goal
conflict. For instance, it would likely be more difficult to limit sponsorships in states that
otherwise lease park land for energy production purposes.
As mentioned in Chapter II, state parks in Connecticut are assisted by arrangements with
and donations from non-profit parks assistance groups. The state also allows sponsorships in
particular instances. Most notably, some of the programs put on by the Parks Division are
implemented to some degree with sponsors. These sponsors generally provide equipment or
121 127 144
119
194
236
196 179
148
123 135
$0
$2,000
$4,000
$6,000
$8,000
$10,000
$12,000
$14,000
0
50
100
150
200
250
2003 2004 2005 2006 2007 2008 2009 2010 2011 2012 2013
Figure III-6. Special Use Licenses (CYs 03-13)
# of Special Use Licenses Total License Application Fees
Source: DEEP estimates. Missing data is possible, especially for CYs 03-08.
Program Review and Investigations Committee Staff Findings and Recommendations: January 23, 2014
39
personnel for particular programs. Additionally, there is now a Connecticut state parks app for
mobile devices that was created at no cost to the state through a sponsorship agreement with the
app designers. Generally, Connecticut is deliberate in pursuit and use of sponsorships
arrangements. It may be possible for the state to find additional ways for sponsorships to be
helpful for state parks’ programs, but it is likely program offerings would need to be expanded to
realize greater funding in this area.

Program Review and Investigations Committee Staff Findings and Recommendations: January 23, 2014
40

Program Review and Investigations Committee Staff Findings and Recommendations: January 23, 2014
41
Chapter IV Staffing
As discussed in Chapter II, the bulk of expenditures for state parks are for personnel
costs. Full-time staff within the Parks Division either are field staff (maintainers, supervisors,
and district managers) within the 23 park units divided across two districts statewide, or central
office staff (division director and assistant director, analysts, and public outreach staff).
Key Findings
Between FYs 06-13, staffing levels reached a high of 110 in FY 08. In FY 13,
staffing was down 19 percent, to 88 staff, the lowest level in the past eight
fiscal years.
Staffing levels for key park operations staff - park maintainers and
supervisors – is at or near their lowest levels since FY 06.
There are an inadequate number of supervisors at appropriate levels to fill the
needs of the current 23 management units - several management units do not
have full-time supervisors, are supervised with supervisors or maintainers
temporarily serving in a higher class, or are overseen by supervisors from
other units.
Daily operations within state parks are performed by the following types of staff:
Maintainer - responsible for overall operations of state parks. Major
responsibilities include: landscaping; skilled labor (carpentry, masonry,
roofing, minor electrical repairs); painting; road and trail maintenance; general
maintenance on buildings, dams, and other DEEP-owned facilities; hand and
power tool use and repair (mowing equipment, tractors, trucks, chainsaws, and
firefighting equipment); and supervising seasonal staff.
Supervisor - schedules, assigns, oversees, and reviews staff work; provides
staff training and assistance; conducts performance evaluations; plans and
prioritizes daily work or unit staff; acts as liaison with other units, central
office, and other agencies; establishes and maintains unit procedures; manages
unit business activities, including purchase requisitions, inventories, revenue
deposits, and time and attendance reports; participates in fire suppression
crews and boundary maintenance; interacts with park visitors and Friends
groups; and prioritizes, assigns, and supervises maintenance projects; hires
and trains seasonal staff.
Operations supervisor (i.e., district manager) – provides many of the same
duties and responsibilities of unit supervisors, but on a district-wide basis,
schedules, assigns, oversees, and reviews work of staff within district;
coordinates and provides staff training and assistance; conducts performance

Program Review and Investigations Committee Staff Findings and Recommendations: January 23, 2014
42
evaluations of unit supervisors; determines and plans area work; analyzes
maintenance operations and programs; oversees special area programs; may
assist in preparation of land acquisition, use, and development plans; and
coordinates with central office regarding district staff and projects.
Seasonal staff - includes maintenance staff, life guards, park rangers,
campground supervisors, and ticket booth attendees. Seasonal staff assist
permanent staff in most park operations, including projects and ongoing
maintenance.
In addition to field staff, staff in the central office provide overall coordination with field
staff, implementing federal grant programs, such as the Recreational Trails Program, ensuring
proper hiring, scheduling, and certification of lifeguards, and performing public outreach
activities, including the No Child Left Inside initiative.
Staffing levels within the Parks Division have fluctuated over time, as have certain
requirements associated with parks personnel. In addition, there is a relatively large number of
staff eligible to retire and, if authority is not given to refill those positions, the operations within
state parks will need to be adjusted accordingly.
Overall staffing levels. Figure IV-1 shows the trend in staffing levels for the Parks
Division. Overall, the number of full-time staff within the division for FY 13 is almost the same
as its FY 06 level. The division had 88 full-time staff in FY 13, and 91 staff in FY 06 (not
including vacancies). Throughout the intervening years, however, there were several fluctuations
in the total number of staff. For example, staffing increased by 19 positions between FY 06 and
its overall high in FY 08. Since that time, the number of staff steadily decreased to 88 positions
in FY 13.
A closer look at various types of staff within the division and the staffing levels
associated with those positions shows several trends. Namely, both field staff (i.e., maintainers
91 93
110 106 100 96 92 88
0
20
40
60
80
100
120
FY 06 FY 07 FY 08 FY 09 FY 10 FY 11 FY 12 FY 13
# o
f S
taff
Figure IV-1. Parks Division Full Time Staffing Levels: FYs 06-13
Source of data: DEEP

Program Review and Investigations Committee Staff Findings and Recommendations: January 23, 2014
43
and supervisors) and administration staff increased increase from FYs 05-08, though the drop
since FY 08 has been mainly in field staff.
Maintainers and supervisors. As shown in Figure IV-2, the number of maintainers –
employees who provide the bulk of park operations – decreased from 54 to 51 (6 percent) during
FYs 06-13, after reaching a high of 63 in FY 09. (The Parks Division also notes, since FY 03,
maintenance staffing levels have decreased 23 percent, due mainly to an early retirement
incentive program in 2003 and a subsequent hiring freeze.)
Maintainers are classified either as Maintainer 1, 2, or 3, with Maintainer 3 being the
highest level (i.e., most experienced with the most responsibilities.) The number of Maintainer 3
staff within the Parks Division decreased from 45 in FY 06, to 34 in FY 13 – almost a 25 percent
decline. At the same time, there was a doubling of Maintainer 2 staff, from 8 to 17. Moreover,
there has not been any Maintainer 1 staff within the Parks Division since FY 10. The increase in
Maintainer 2 staff and lack of Maintainer 1 staff are likely due to hiring freezes. New
maintainers are not being hired at the Maintainer 1 level, and current Maintainer 2 staff are not
being promoted as Maintainer 3 staff leave.
As illustrated in Figure IV-3, there was a downward trend in the number of supervisors
within management units for FYs 08-12, from 21 to 16, with an increase of one supervisor in FY
13. Similar to maintainers, supervisors are classified as Supervisor 1 (fewest responsibilities),
Supervisor 2, or Supervisor 3 (most responsibilities).32
32
The official title of the person heading the Dinosaur State Park management unit is Environmental Education
Coordinator, which has supervisory responsibilities but is not within the Environmental Protection Supervisor
classification as all the other supervisor positions. As such, it is not included as part of the supervisor position
analysis. For context, the position at Dinosaur has been filled since FY 06.
54 55
62 63 60
58 56
51
25
30
35
40
45
50
55
60
65
FY 06 FY 07 FY 08 FY 09 FY 10 FY 11 FY 12 FY 13
# o
f S
taff
Figure IV-2. Parks Division Maintenance Staffing Levels: FYs 06-13
Source of data: DEEP
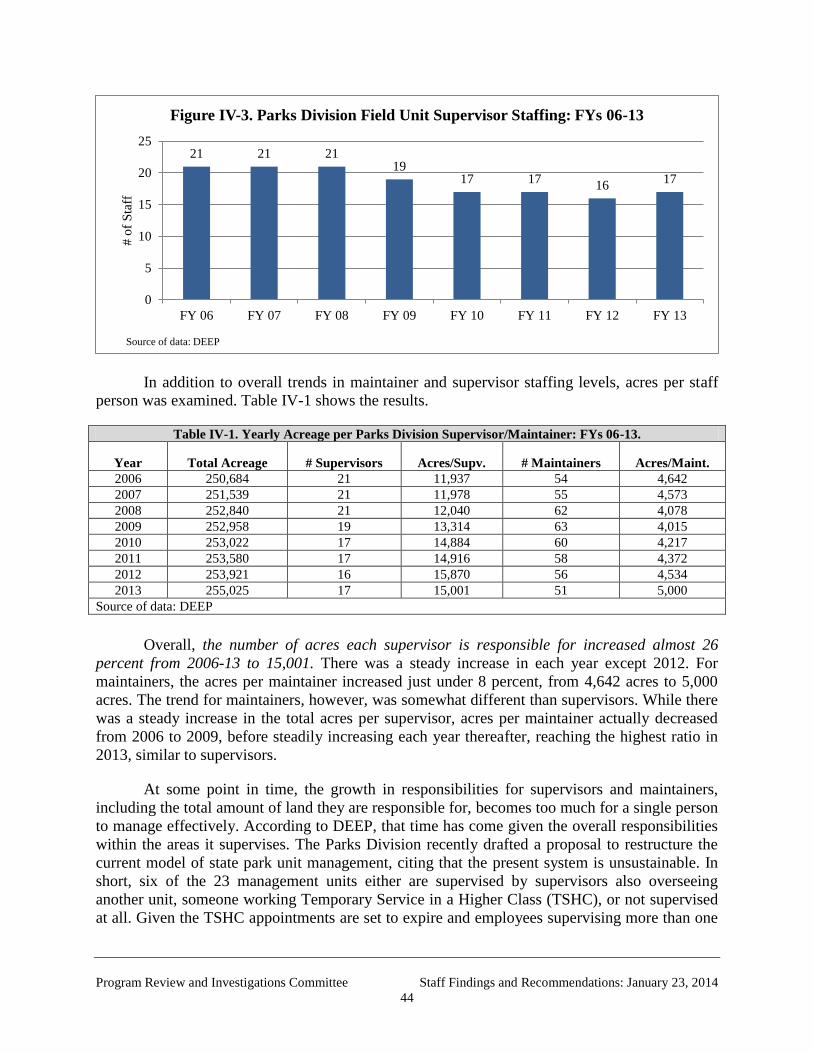
Program Review and Investigations Committee Staff Findings and Recommendations: January 23, 2014
44
In addition to overall trends in maintainer and supervisor staffing levels, acres per staff
person was examined. Table IV-1 shows the results.
Table IV-1. Yearly Acreage per Parks Division Supervisor/Maintainer: FYs 06-13.
Year Total Acreage # Supervisors Acres/Supv. # Maintainers Acres/Maint.
2006 250,684 21 11,937 54 4,642
2007 251,539 21 11,978 55 4,573
2008 252,840 21 12,040 62 4,078
2009 252,958 19 13,314 63 4,015
2010 253,022 17 14,884 60 4,217
2011 253,580 17 14,916 58 4,372
2012 253,921 16 15,870 56 4,534
2013 255,025 17 15,001 51 5,000
Source of data: DEEP
Overall, the number of acres each supervisor is responsible for increased almost 26
percent from 2006-13 to 15,001. There was a steady increase in each year except 2012. For
maintainers, the acres per maintainer increased just under 8 percent, from 4,642 acres to 5,000
acres. The trend for maintainers, however, was somewhat different than supervisors. While there
was a steady increase in the total acres per supervisor, acres per maintainer actually decreased
from 2006 to 2009, before steadily increasing each year thereafter, reaching the highest ratio in
2013, similar to supervisors.
At some point in time, the growth in responsibilities for supervisors and maintainers,
including the total amount of land they are responsible for, becomes too much for a single person
to manage effectively. According to DEEP, that time has come given the overall responsibilities
within the areas it supervises. The Parks Division recently drafted a proposal to restructure the
current model of state park unit management, citing that the present system is unsustainable. In
short, six of the 23 management units either are supervised by supervisors also overseeing
another unit, someone working Temporary Service in a Higher Class (TSHC), or not supervised
at all. Given the TSHC appointments are set to expire and employees supervising more than one
21 21 21 19
17 17 16
17
0
5
10
15
20
25
FY 06 FY 07 FY 08 FY 09 FY 10 FY 11 FY 12 FY 13
# o
f S
taff
Figure IV-3. Parks Division Field Unit Supervisor Staffing: FYs 06-13
Source of data: DEEP

Program Review and Investigations Committee Staff Findings and Recommendations: January 23, 2014
45
management unit cannot do so effectively, several options have been presented by the
department:
1) reconfigure the current management units for a more manageable structure for the
current number of supervisors to reduce distances traveled among parks/forests with a
unit, increase oversight and/or supervision of seasonal workers, and decrease response
time for emergencies;
2) reduce public services available at parks where no supervision is available;
3) find a new corps of employees to serve in a TSHC capacity similar to now; or
4) have the two district supervisors begin supervising management units and risk
reducing their ability to manage statewide projects. A more detailed discussion about
minimum staffing both for supervisors and maintainers is provided later in this
chapter.
Park unit point evaluation system. Another staffing-related issue within the Parks
Division is how to determine the overall boundary lines of park management units (see Figure I-
1 in Chapter I) and, more specifically, the supervisor classification level (i.e., Supervisor 1, 2, or
3) necessary to oversee the management unit. Each of the division’s management units is diverse
in its overall characteristics. As such, their boundary lines and the corresponding level of
supervisor should be based on objective criteria.
The Parks Division created a system to evaluate management unit characteristics in early
1993 and revised it in late 2012. The revised system has 28 different criteria upon which to base
the management unit boundaries, and the subsequent level of supervisor required within the unit.
The criteria include high and low use acreage, public use buildings and other physical plant
characteristics, attendance, trails, paved/unpaved roads, campsites, and facility rentals. Each
criterion is given a score and the total score determines the overall category of management unit
– small, medium, or large. The corresponding supervisor levels are Supervisor 1 (small
management unit), Supervisor 2 (medium management unit), and Supervisor 3 (large
management unit).
The revised point system has not been implemented. This is due in large part to the
ramifications of the shift and work location provision of the NP-5 union contract that impacts
park supervisors and maintainers.33
The Parks Division has said it is apprehensive about
applying results of the revised point system given several of the criteria used in the system could
change as a result of possible transfers every two years, impacting the overall staffing resources
of the units. Another reason the appropriate supervisor levels have not been assigned to each
management unit is due to the recent hiring freeze. There are not an adequate number of
supervisors at appropriate levels to fill the needs of the current 23 management units. As a
result, the supervisor structure within management units is not in accordance with the division’s
point evaluation system.
33
The collective bargaining group is the Protective Services Employee Coalition IUPA/IAFF, AFL-CIO. The
term of the current collective bargaining agreement is July 1, 2008 through June 30, 2012, with an extension through
June 30, 2016.

Program Review and Investigations Committee Staff Findings and Recommendations: January 23, 2014
46
Shift bid and location clause. Parks Division maintainers, management unit supervisors,
and district operations supervisors (known as district managers) all belong to the same NP-5
collective bargaining unit, along with all other DEEP employees working in the same job
classifications. Beginning the mid-2000s, the collective bargaining agreement contained the
biennial posting of shift and location assignments. This provision requires DEEP, including the
Parks Division and all other department divisions with similarly classified employees, to open its
maintainer and supervisor positions every two years for lateral transfers.34
Seniority is the
governing factor to decide any transfer, provided the person making the transfer is qualified for
the position.
In short, every two years, maintainers and supervisors within their particular
classifications (e.g., Maintainer 2 or Supervisor 3) are given the opportunity to decide where
they want to work. This includes maintainer and supervisor positions within other DEEP areas,
namely the Fisheries and Wildlife Management Divisions and the Field Support Services unit.
The process begins as soon as one person decides to change locations and “bump” a person of
lower seniority. Given this structure, it is unclear how many positions could be affected in any
round of transfers until the process plays itself out and no other transfers occur.
Three rounds of transfers have occurred since the contract provision for shift and location
bidding was first fully implemented within DEEP. Committee staff was told by Parks Division
staff there were some transfers during the first two rounds in 2009 and 2011. Although these
transfers caused some consternation among supervisors and managers, the overall number of
moves was considered relatively minor by the division in comparison with the latest changes. In
the most recent round in November, 24 maintainers– a full one-third – of the 71 eligible
maintainer positions just within the Parks Division transferred to other positions: 18 (25
percent) transferred to other parks within the division and 6 (8 percent) to other divisions within
either natural resources or fiscal and support services bureaus. These transfers are shown in
Table IV-2, which also shows that no one at the Parks Division supervisor level transferred in the
most recent round, meaning all management unit supervisors and district supervisors stayed at
the same locations as in 2011.
As the table shows, all of the transfers occurred within the maintainer job classification.
Regarding Park Division employees, of the 34 Maintainer 3 staff within the division, nine (26
percent) transferred to another park location, while 4 (12 percent) transferred from a park to
another division within another bureau (3 transferred to Fisheries, and 1 transferred to Field
Support Services.) At the Maintainer 2 level, half of the 18 maintainers relocated to another park,
and an additional 2 maintainers (11 percent) were transferred to another area outside of the Parks
Division (i.e., Fisheries, Wildlife Management, and Field Support Services).
34
This is because the position of Environmental Protection Maintainer, for example, is a broad job classification
intended to be applicable experience-wise across multiple program divisions within DEEP.
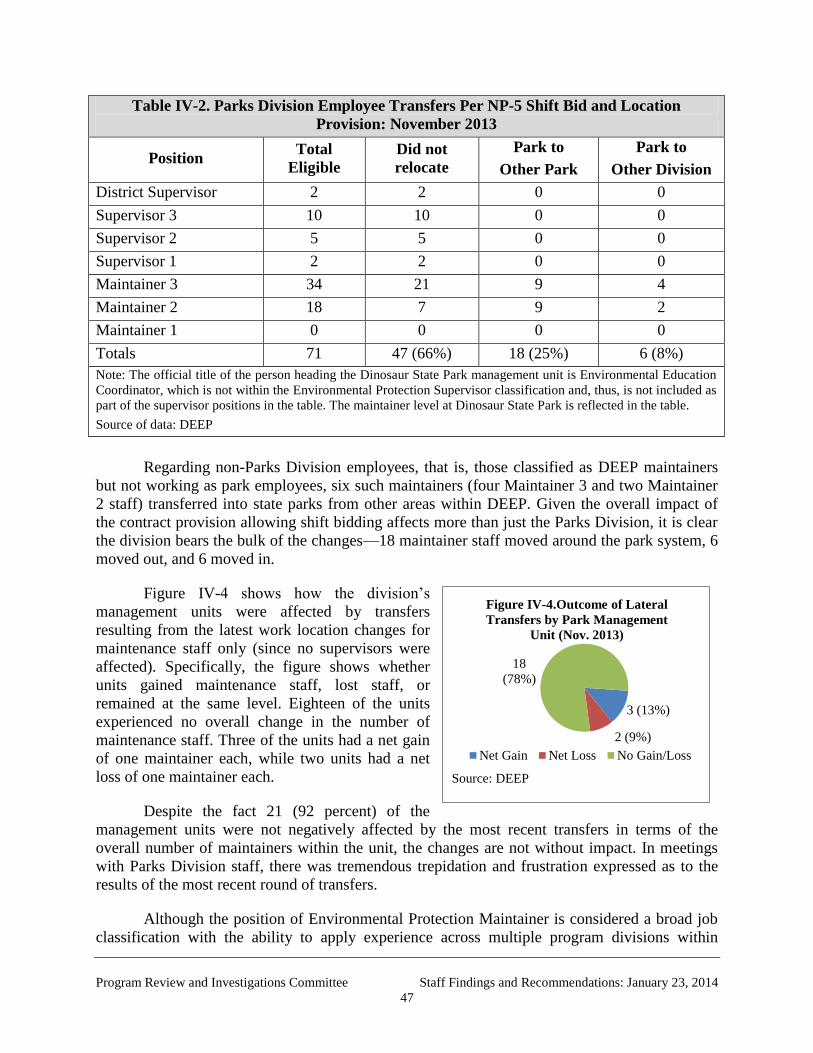
Program Review and Investigations Committee Staff Findings and Recommendations: January 23, 2014
47
Table IV-2. Parks Division Employee Transfers Per NP-5 Shift Bid and Location
Provision: November 2013
Position Total
Eligible
Did not
relocate
Park to
Other Park
Park to
Other Division
District Supervisor 2 2 0 0
Supervisor 3 10 10 0 0
Supervisor 2 5 5 0 0
Supervisor 1 2 2 0 0
Maintainer 3 34 21 9 4
Maintainer 2 18 7 9 2
Maintainer 1 0 0 0 0
Totals 71 47 (66%) 18 (25%) 6 (8%)
Note: The official title of the person heading the Dinosaur State Park management unit is Environmental Education
Coordinator, which is not within the Environmental Protection Supervisor classification and, thus, is not included as
part of the supervisor positions in the table. The maintainer level at Dinosaur State Park is reflected in the table.
Source of data: DEEP
Regarding non-Parks Division employees, that is, those classified as DEEP maintainers
but not working as park employees, six such maintainers (four Maintainer 3 and two Maintainer
2 staff) transferred into state parks from other areas within DEEP. Given the overall impact of
the contract provision allowing shift bidding affects more than just the Parks Division, it is clear
the division bears the bulk of the changes—18 maintainer staff moved around the park system, 6
moved out, and 6 moved in.
Figure IV-4 shows how the division’s
management units were affected by transfers
resulting from the latest work location changes for
maintenance staff only (since no supervisors were
affected). Specifically, the figure shows whether
units gained maintenance staff, lost staff, or
remained at the same level. Eighteen of the units
experienced no overall change in the number of
maintenance staff. Three of the units had a net gain
of one maintainer each, while two units had a net
loss of one maintainer each.
Despite the fact 21 (92 percent) of the
management units were not negatively affected by the most recent transfers in terms of the
overall number of maintainers within the unit, the changes are not without impact. In meetings
with Parks Division staff, there was tremendous trepidation and frustration expressed as to the
results of the most recent round of transfers.
Although the position of Environmental Protection Maintainer is considered a broad job
classification with the ability to apply experience across multiple program divisions within
3 (13%)
2 (9%)
18
(78%)
Figure IV-4.Outcome of Lateral
Transfers by Park Management
Unit (Nov. 2013)
Net Gain Net Loss No Gain/Loss
Source: DEEP
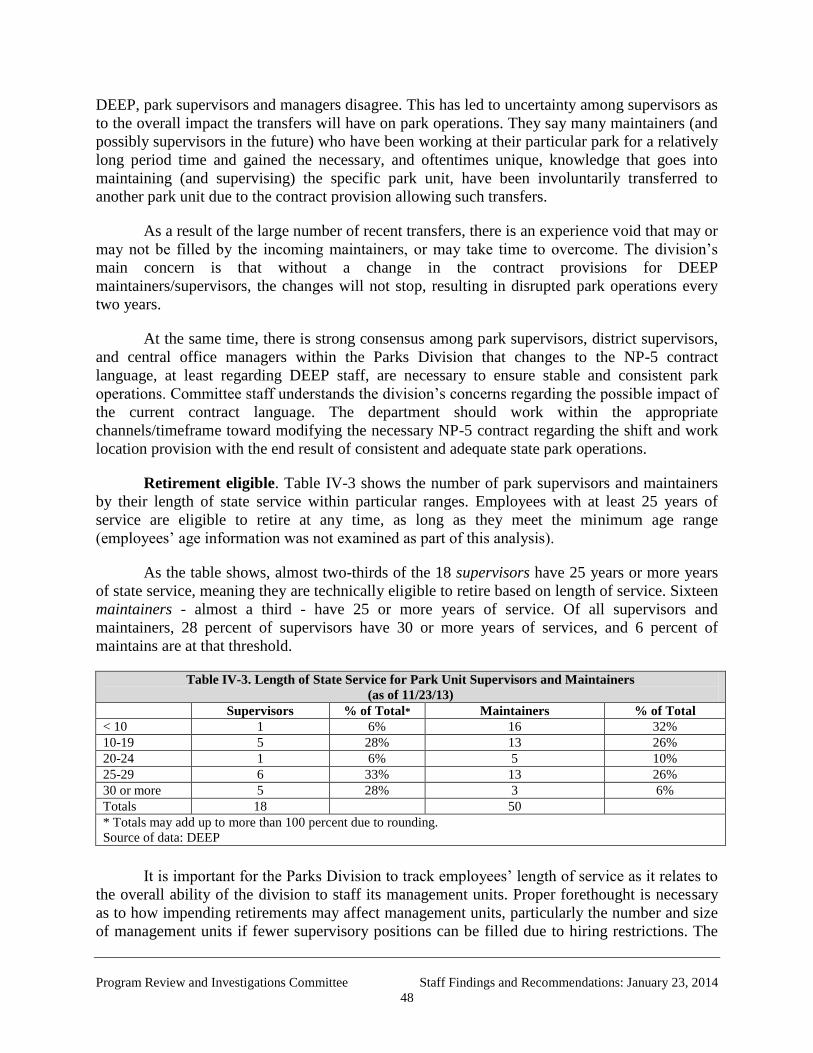
Program Review and Investigations Committee Staff Findings and Recommendations: January 23, 2014
48
DEEP, park supervisors and managers disagree. This has led to uncertainty among supervisors as
to the overall impact the transfers will have on park operations. They say many maintainers (and
possibly supervisors in the future) who have been working at their particular park for a relatively
long period time and gained the necessary, and oftentimes unique, knowledge that goes into
maintaining (and supervising) the specific park unit, have been involuntarily transferred to
another park unit due to the contract provision allowing such transfers.
As a result of the large number of recent transfers, there is an experience void that may or
may not be filled by the incoming maintainers, or may take time to overcome. The division’s
main concern is that without a change in the contract provisions for DEEP
maintainers/supervisors, the changes will not stop, resulting in disrupted park operations every
two years.
At the same time, there is strong consensus among park supervisors, district supervisors,
and central office managers within the Parks Division that changes to the NP-5 contract
language, at least regarding DEEP staff, are necessary to ensure stable and consistent park
operations. Committee staff understands the division’s concerns regarding the possible impact of
the current contract language. The department should work within the appropriate
channels/timeframe toward modifying the necessary NP-5 contract regarding the shift and work
location provision with the end result of consistent and adequate state park operations.
Retirement eligible. Table IV-3 shows the number of park supervisors and maintainers
by their length of state service within particular ranges. Employees with at least 25 years of
service are eligible to retire at any time, as long as they meet the minimum age range
(employees’ age information was not examined as part of this analysis).
As the table shows, almost two-thirds of the 18 supervisors have 25 years or more years
of state service, meaning they are technically eligible to retire based on length of service. Sixteen
maintainers - almost a third - have 25 or more years of service. Of all supervisors and
maintainers, 28 percent of supervisors have 30 or more years of services, and 6 percent of
maintains are at that threshold.
Table IV-3. Length of State Service for Park Unit Supervisors and Maintainers
(as of 11/23/13)
Supervisors % of Total* Maintainers % of Total
< 10 1 6% 16 32%
10-19 5 28% 13 26%
20-24 1 6% 5 10%
25-29 6 33% 13 26%
30 or more 5 28% 3 6%
Totals 18 50
* Totals may add up to more than 100 percent due to rounding.
Source of data: DEEP
It is important for the Parks Division to track employees’ length of service as it relates to
the overall ability of the division to staff its management units. Proper forethought is necessary
as to how impending retirements may affect management units, particularly the number and size
of management units if fewer supervisory positions can be filled due to hiring restrictions. The

Program Review and Investigations Committee Staff Findings and Recommendations: January 23, 2014
49
division has told committee staff it is aware of employees’ length of service and takes that factor
into consideration when examining supervisor positions and the overall configuration of park
management units.
Minimum supervisor and maintainer staffing. Many routine tasks require two
maintainers to be present to perform safely (notably, using chainsaws, working with heavy
equipment, or performing construction activities). Assuming the number of park management
units should not be lower than the current 23 (including Dinosaur State Park), perhaps the
simplest way to determine minimum staffing would be to assign one park management unit
supervisor (to oversee general operation of the park unit and be available for weekend
supervision of seasonal employees) and two maintainers (for daily operations and safety
reasons).
With the current 23 park units, this would require 23 park unit managers (5 more than
current employment given Hammonasset has 2 supervisors and Dinosaur has a supervisory
education coordinator) and 46 maintainers (5 less than current employment). However, this
situation is unlikely to be practical because of the increased responsibilities and duties for those
in the busiest parks. In short, different management units have different minimum staffing
requirements to maintain current services and safety. Throughout the recent hiring freeze and
resultant loss of staff due to attrition, the Parks Division has put priority on having more than two
full-time maintainers in a few park units, even at the expense of having one or none at other park
units.
A more realistic estimate of system-wide minimum staffing would not reassign positions
away from units with more than two maintainers or one supervisor. Eleven park units have more
than two full-time maintainers and six units are at the minimum level of two, leaving six units
with only one maintainer. Keeping the current second supervisor in place at Hammonasset (and
supervisory position at Dinosaur), there are six units without supervisors.35
Under this scenario,
the parks division would need 12 new hires (6 unit supervisors and 6 maintainers) in order to
come back to an acceptable, ongoing staffing level for full-time employees under the current 23
park management unit organization. The minimum ongoing staff level of 80 full-time maintainer
and supervisor positions (up 12 positions from the current total of 68) would still leave the Parks
Division at a slightly lower level than in FY 08 (84 positions).
Since several of the parks units without a dedicated supervisor are currently being
overseen by a high-level maintainer working temporarily out of class and because the majority of
current supervisors are former maintainers, it is likely that most of the supervisor positions will
be filled from the maintainer ranks. Adding staff positions, in general, may help boost morale,
which seems generally low based on committee staff interviews with DEEP field personnel.
More specifically, the additional 6 to 12 refilled or new positions available at various locations
across the state would be offered first as internal transfers, which could go a long way towards
addressing the side-effects of the shift-bidding relocations, as discussed earlier. A full
recommendation on the overall funding mechanism for state parks, that incorporates funding for
staffing, is provided in Chapter VI.
35
According to the Parks Division, the following units are covered by a supervisor from another unit or have
employees working temporarily in a higher class: Lake Waramaug; Macedonia; Sleeping Giant; Peoples;
Mashamoquet; and Pachaug.

Program Review and Investigations Committee Staff Findings and Recommendations: January 23, 2014
50
Seasonal staff. The Parks Division relies on seasonal workers to augment its full-time
operations staff. Seasonal workers include maintenance staff, campground managers, life guards,
park rangers, and maintenance supervisors. The budget for seasonal staff accounts for roughly
one-third of the overall personal services budget for the division.
Table IV-4 shows the overall trends in the number of seasonal staff as well as the number
of workers converted to full-time equivalents (FTEs). The FTE comparison is made to better
understand the overall trend in seasonal workers, given they are not full-time. The table also
provides information on the number of seasonal staff hired for the first time in a given year and
those rehired from the previous year.
Table IV-4. Seasonal Staff Totals and Original or Rehire: FYs 08-13
Total Seasonal Staff Full-Time Equivalent Original Hire Rehire
FY 08 636 266.8 281 (44%) 355 (56%)
FY 09 567 278.3 199 (35%) 368 (65%)
FY 10 649 294.5 235 (36%) 414 (64%)
FY 11 553 283.8 137 (25%) 416 (75%)
FY 12 583 279.3 186 (32%) 397 (68%)
FY 13 554 Data not available 181 (33%) 373 (67%)
Source of data: DEEP
Three main issues were raised by the Parks Division regarding recent requirements
placed on seasonal staff: 1) the maximum number of hours seasonal staff may work during a
given year of 1,040 hours (26 weeks) per person, with a required three-month break in service
between periods of employment, is too rigid for the most effective use of seasonal staff; 2)
changes made in 2009 for retired state employees who participate in the temporary worker retiree
program (i.e., works up to 120 days a year following retirement), which includes parks seasonal
staff,36
establish a maximum of two periods that a retired employee may participate in the
program and do not allow for the rehire of experienced state employees who work as seasonal
staff;37
and 3) the current pay scales for seasonal staff are too low to consistently attract
employees.
The first and second issues above are state policies that would require statewide changes
unless the department was able to get a special exemption for its seasonal staff. Regarding the
pay scale issue, if using the percent of rehires as a benchmark, as shown in Table IV-4 above,
there does not seem to be a problem attracting seasonal workers from year to year: a full two-
thirds of seasonal workers are rehires from the previous year. Additional analysis is needed,
however, to determine if specific seasonal positions are difficult to fill.
Seasonal staffing compared to full-time staffing. In FY 12, according to national data,
Connecticut had 99 full-time staff compared to 523 seasonal employees,38
for a ratio of 5.28
seasonal staff to full-time staff. This puts Connecticut among the most dependent on seasonal
staff (ranked 6th
according to National Association of State Parks Directors FY 12 data for
36
See Executive Order 27-A, October 2009. 37
Any Parks Division seasonal worker who is a retired state employee may only work a maximum 960 hours per
year, instead of the 1,040 hours per year as other seasonal workers. 38
AIX data show that Connecticut reported 99 full-time staff for FY 12, which differs from the 92 full-time staff
count provided to committee staff by the Parks Division.

Program Review and Investigations Committee Staff Findings and Recommendations: January 23, 2014
51
highest number of seasonal to full-time), well above the national average of 1.65 full-time to
seasonal staff. Including Connecticut, twelve states had more than 3 seasonal employees per full-
time staff, with 14 states having more full-time staff than seasonal (leading to a ratio less than 1).
While Connecticut’s ratio is quite high, the comparison may not be valid as some states
report this information to AIX as full-time equivalents (FTEs) rather than total number of staff.
In FY 12, Connecticut had 279 FTE of seasonal staff, or a 2.8 full-time staff to seasonal FTE
ratio. This would mean the state ranks 12th
highest rather than 6th
- on the high side of average,
but no longer among the very highest users of seasonal staff.
Without a major influx of funding specifically for adding full-time staff, it seems
implausible there would be a significant shift away from the current reliance on seasonal staff to
a higher degree than all but five other states. However, if the Parks Division is given more
flexibility on hiring full-time staff in place of some seasonal staff (which are currently budgeted
independent of each other), it is likely the state’s relatively high dependence on seasonal staff
would begin to move towards the national norm.
An important caveat for national comparisons regarding seasonal staff is that the
employment rules and responsibilities of seasonal staff can differ considerably between states.
Connecticut’s seasonal staff is capped at 1,040 hours per person for the year, meaning a 40-hour
per week seasonal employee can work 26 weeks, with a minimum layoff period of three months
between periods of employment.
Other states may have similar requirements, but the differences can have a significant
impact on park operations and planning. For example, most seasonal employees in the
Pennsylvania park system are nine-month full-time employees with a three month discharge
period before rehire. The extra three months allow Pennsylvania parks to have full staffing for
the months in preparation for the busiest periods and a mostly full allotment of staff to help close
the park after the busiest season, with most seasonal staff absent for only the least used months in
the winter. The longer-duration seasonal contract may also allow long-time seasonal employees
greater stability. Staff in Pennsylvania indicated there were many returning seasonal staff who
had other season-appropriate jobs in the winter.
Some other states, including Missouri, have approximately the same 1,040 hour annual
limit, but have the flexibility to hire someone for those hours spread over the entire year. This
means the individual parks can decide if a person is 6 months full-time, 12 months part time, or
some combination of the two, depending on the needs of the park.

Program Review and Investigations Committee Staff Findings and Recommendations: January 23, 2014
52

Program Review and Investigations Committee Staff Findings and Recommendations: January 23, 2014
53
Chapter V Park Use, Performance Measurement, and Planning
The state park system has different meanings and uses to different people; therefore
determining whether service provision, and thus funding, is “adequate” depends on how the term
is defined and who is defining it. Some view state parks as a way to provide outdoor recreation
for the state’s citizens, while others view parks as a way to protect natural spaces and/or preserve
the state’s heritage. Still others see the park system as a means of employment, while others may
not use state park resources, but know their tax dollars support the system.
Adequacy of state park resources means finding the balance between the public’s goals
for parks and policymakers’ willingness to fund a park system to meet those goals. For purposes
of this study, committee staff examines three key measures of use as they relate to the overall
adequacy of funding for state parks: attendance; safety; and customer satisfaction. Committee
staff also assessed the collection, analysis, and use of performance measures related to the key
areas.
Key Findings
The Parks Division methodology to collect accurate attendance statistics is
flawed, and the current estimate is likely well off the actual number (probably
undercounted). Although used in public discussion of the state’s park system,
attendance is not formally considered for planning or performance purposes.
There is currently not enough full-time maintenance and supervisory staff to
cover necessary park operation responsibilities within adequate safety
guidelines; full-time park law enforcement officer levels are down, and the
trend in public safety incidents within parks is mixed over the past five years.
Ad hoc attempts have been made to collect customer feedback, yet no ongoing
centralized system exists to collect and analyze such information.
Short-term planning for the state park system has defaulted to attrition-based
“crisis management” as the level of resources available to parks has
decreased. Though various long-term planning documents have been created,
there is little evidence suggesting these documents are used systematically.
The Parks Division budget is based on previous expenditure levels rather than
system needs. Field personnel are not involved in budget administration,
which may lead to increased costs.
Program Review and Investigations Committee Staff Findings and Recommendations: January 23, 2014
54
Park Use Measurement
DEEP personnel at multiple organizational levels were asked how they measure park
performance. The prevailing answers include examining attendance levels, safety information (of
the public and of staff), and overall customer satisfaction (including cleanliness of parks and
availability of varying programs and experiences). These areas were also the most commonly
cited measurement areas by state park personnel in other states. Despite there being a system-
wide emphasis on these key areas of performance, there was little evidence that data regarding
these areas were analyzed by the Parks Division.
This chapter includes further discussion of the information currently collected by DEEP,
an assessment of the methodologies in place to obtain park-use data, and an examination of how
such data is, and might be, used to inform the division’s planning efforts. From an overarching
perspective, there is a lack of reliable aggregate information about park performance, and there is
a “crisis management” nature regarding short- and long-term planning efforts. As such, it is
apparent the Parks Division does not engage in measurement of park performance to guide
management decisions and resource allocations. Further, the division does not collect
information on park use in a reliable, accurate manner such that the measure of use trends is
currently possible.
Recommendation
5. The Parks Division should create a Results Based Accountability-style report
card regarding park performance in accordance with the guidelines established
by the legislature’s Appropriations Committee. The report card should include
measures regarding park use (e.g., attendance, safety, and satisfaction), as well
as measures of park operations (e.g., planning efforts) and park personnel. The
division’s first report card should be developed by January 1, 2015, and
annually thereafter. The report cards should be provided to the legislative
committees of cognizance and made available on the Parks Division website.
Creating the report card on an annual basis will assist the Parks Division in assessing, and
attempting to meet, the needs of the public. It is expected that the regular reviews of park
locations will play an important role in the report card development, especially with regard to
individual park or park unit status and improvements. To further the implementation of the above
recommendation, DEEP will need to first develop a Quality of Life statement, in RBA terms, to
help guide the necessary data collection and performance measurement efforts to create its RBA
report card(s). As an agency, DEEP has familiarity with Results Based Accountability, and has
previously created report cards for its forestry and solid waste programs, which should aid in
developing a state park system report card.
While committee staff attempt to describe state park use within this chapter, the Parks
Division does not possess adequate information to accurately describe park use trends in a
comprehensive manner. What follows are descriptions of park use given the scarce and
sometimes inaccurate information currently available, along with analysis of the department’s
current use information-gathering methodology for the key areas of attendance, safety, and
customer satisfaction.

Program Review and Investigations Committee Staff Findings and Recommendations: January 23, 2014
55
Attendance
The Parks Division cites attendance information on a regular basis. Official presentations
and budget requests often include the division’s overall estimate that approximately 8 million
visitors, or more accurately visitor days, occur in Connecticut parks annually. However, the
accuracy of the overall system-wide attendance estimate and of many individual park estimates
is suspect. Inaccurate attendance information may lead to misallocation of scarce resources to or
within the Parks Division that, in turn, may lead to declines in safety or customer satisfaction.
The following are key findings regarding park attendance:
Attendance estimates and paid attendance records show park use has held
relatively stable over the last decade.
While the Parks Division has a formal policy on creating daily attendance
estimates, the methodology has several flaws and is not currently followed in
a consistent manner.
The current attendance estimate methodology is overly burdensome to park
supervisors, especially given the unreliable results it produces.
The Parks Division is not using the reliable attendance data (i.e., numbers
from paid day use and camping fees) already being collected in a meaningful
way.
There are several components of park use that, in aggregate, should lead to overall
attendance figures for state parks, including day use receipts (parking and/or admission),
camping fees, and estimates of use during non-fee days or hours. Park supervisors are asked to
estimate day use (fee-based and non) and camping numbers daily and report those numbers to
the Parks Division office. Figure V-1 shows overall estimated attendance for CYs 03-12, along
with the attendance estimates for the eight most attended parks, which collectively account for
roughly half of the overall park attendance.
Total park attendance has been reported by DEEP as fairly steady, with between 7 and 8
million visitors per year within the past decade. Hammonasset, shown by the top line in the
figure below, accounts for over a quarter of overall statewide attendance, so it is not surprising
that total attendance trends mirror those at Hammonasset and vice versa. Rocky Neck and
Sherwood Island form the second tier of highest attendance, each accounting for between 5-10
percent of the state’s total. Aside from those three, no other park represents more than 5 percent
of the total.
Attendance methodology. The Parks Division has a formal methodology for estimating
the attendance at individual state parks. The individual park estimates are then aggregated to
come up with an estimate of total statewide visits. The attendance methodology relies on park
supervisors recording daily attendance estimates for some of the most-used parks in the state,
based on the number of vehicles observed in the park. These daily estimates are recorded in a
centralized database accessible to the unit supervisors and to Parks Division staff in the central
administrative office. In total, estimates are required at 55 parks, inclusive of the 29 parks that
charge for parking or admission.

Program Review and Investigations Committee Staff Findings and Recommendations: January 23, 2014
56
Methodological problems with creating the attendance estimates largely prevent these
numbers from being valid or useful. In particular, there are three major issues affecting the
overall estimate of attendance.
First, attendance estimates are only recorded for 55 of the state’s 139 parks and forests.
Without any information regarding the attendance in the 84 parks and forests that are not among
the 55 where an estimate is supposed to be provided, it is not possible to determine if the 55
parks that are part of the attendance estimate represent: 1) the most-used of all 139 parks (in
which case the overall attendance numbers would slightly increase if the other parks are
included); 2) a majority of the most-used parks (whereby there may be a noticeable increase in
overall park attendance estimates), or 3) a random sample of parks (which may lead to a sizeable
increase in the attendance estimates).
Parks Division personnel indicate the list of 55 parks is used in order to maintain
comparability to previous estimates, dating back decades, that also limited the estimates to the
7,262 7,233 7,246
7,758 7,816
7,359
8,031 8,055 7,676 7,751
0
1,000
2,000
3,000
4,000
5,000
6,000
7,000
8,000
9,000
0
500,000
1,000,000
1,500,000
2,000,000
2,500,000
3,000,000
200
3
200
4
200
5
200
6
200
7
200
8
200
9
201
0
201
1
201
2
To
tal
Att
end
an
ce E
stim
ate
Th
ou
san
ds
Hig
hes
t A
tten
ded
Pa
rks
Est
ima
tes
Figure V-1. Overall Attendance Estimates and the Most-used Individual
Park Attendance Estimates (CYs 03-12)
Total Hammonasset Beach State Park
Rocky Neck State Park Sherwood Island State Park
Bluff Point State Park Silver Sands State Park
Mansfield Hollow State Park Gillette Castle State Park
Harkness Memorial State Park
Source: DEEP attendance estimates
Program Review and Investigations Committee Staff Findings and Recommendations: January 23, 2014
57
same parks. While it is unlikely that any single park of the remaining 84 accounts for a large
difference in overall attendance, there should be some estimate given for these parks, even if
only collectively. From this factor alone, it would appear the attendance estimates underrepresent
overall park attendance.
Second, the division is not fully administering the methodology it has in place. In some
instances, the designated parks are in park management units that do not currently have a park
supervisor or are overseen by a park supervisor who is temporarily overseeing multiple units. For
CY 12, there were attendance estimates for 49 of the 55 designated areas, with the number
falling to 40 parks with any reported attendance for CY 13 by December of that year. Even
within the parks that reported some amount of attendance for CYs 12-13, there are visible gaps
for weeks or months when examining the daily attendance logs. Some of these data gaps are
created because a supervisor is recording a month, or even a year, of attendance data in one day
and leaving the rest of the days blank, while many of the gaps are because no information is
entered for days, weeks, or even years at a time. Like the limitation to 55 parks, addressing the
issue of non- or underreporting would increase the overall attendance estimate.
Third, the estimates themselves have large potential for error. Attendance estimates are
calculated by counting the number of cars in parking areas at the designated parks each day and
extrapolated for how many cars there were the entire day and then by how many visitors present
in each car. Each factor of this process of estimation is subject to error (under- or over-
reporting), which is multiplied by errors in the extrapolation process. It is unlikely that all park
supervisors, especially those in geographically large units with multiple parks, are able to get to
each park each day and further unlikely that they will be able to get to each individual parking
area, if there are multiple entry points for a single park. Frequency of visits by park personnel for
attendance estimates is lessened for those park units without a park supervisor assigned or with a
supervisor who is temporarily overseeing multiple units.
Little, if any, uniform guidance has been given to the park supervisors on how to estimate
a full day’s worth of cars based on point in time observations. Per the attendance methodology,
supervisors are given instruction to estimate four visitors per car, but multiple parks staff relayed
that the number can and does vary by park and/or supervisor, sometimes with a higher than six or
eight visitor per car factor. The attendance methodology does allow for variation in the visitor
per car factor with the consent of the Parks Division director. It seems likely that the number of
visitors per car will systematically differ among parks, but there should be some record or
justification for the change as part of the formal methodology.
Further issues around the subjectivity of the current estimates include some park
supervisors having incentive (even if subconsciously) to overstate their park’s attendance to help
secure additional resources for the park and/or better a unit’s standing in the points system
(discussed in Chapter IV). Additionally, it is understandably difficult to measure the attendance
of walk-in visitors, especially for large parks with relatively easy walk-in access. As such, the
issues with the subjectivity of park supervisor estimates of attendance may be leading to under-
and/or over-reporting.
Taken together, the flaws in the current attendance estimates suggest that the
approximately 8 million visitor estimate the Parks Division uses in describing the park system is

Program Review and Investigations Committee Staff Findings and Recommendations: January 23, 2014
58
likely underrepresenting the true number of visitors to state parks. However, given the issues
described above, it is not currently possible to know if the true attendance is more than double or
less than half the current estimate, or anywhere in between.39
Improving attendance estimates. There are several less subjective and less labor intensive
ways to develop an attendance estimate that are more accurate and representative than the current
methodology. Variations of solid attendance estimation methodologies are used in many other
states and by the National Park Service. Recording the exact number of visitors is near
impossible and expensive, so a more reasonable goal is determining an estimate that is reliable,
not labor intensive, and useful. More accurate overall and individual park attendance estimates
should allow for better long-term allocation of resources for relatively little on-going cost outside
current responsibilities. Connecticut’s current attendance estimation methods can and should be
improved.
Recommendation
6. The Parks Division should develop an improved attendance estimation
methodology that: 1) spreads responsibility for point-in-time counts; 2) requires
the performance of focused counts every five years; 3) uses quantitative numbers
already available via revenue collection, and 4) expands the use of car counters.
The first two components of the recommendation would relieve supervisors of the need
to attempt to be everywhere every day. Instead of asking supervisors for full, extrapolated
estimates in 55 areas each day, multiple employees can be asked to provide point-in-time
observations in the course of their current responsibilities (e.g., supervisors, maintainers, and
perhaps EnCon police may be asked to log the number of cars in a parking lot when they arrive
at particular locations). Daily attendance would not be tracked each day, but the number of more
accurate samples coming in would more than make up for this.
Next, each park should have a comprehensive count of visitors performed for at least one
week in-season and one out-of-season on a rotating basis, in an attempt to look at complete
attendance for these time periods. A major purpose of these counts will be to review and
reestablish various extrapolation factors, such as determining the number of individuals per car
and the relationship between total attendance for a day and point-in-time vehicle visitation.
These comprehensive counts should be performed for each park at least once every five years, to
reassess the extrapolation factors on a regular basis.
Fee-based attendance information. As previously mentioned, DEEP already collects
public use data at 29 parks via collection of user fees. Park supervisors of units with parking
and/or admissions fees are instructed to use the quantities of paid entrances as part of their
overall attendance estimates. Looking simply at day-use fees (parking and admissions) can help
capture overall attendance trends. Figure V-2 shows the growth in the overall attendance
39
The counts of day-use fees show over 300,000 vehicles paying for parking at state parks annually, which can be
extrapolated to over 1 million paid visitors each year using a factor of 3 to 4 people per vehicle. Since there are no
parking fees outside the parks season and relatively few parks charge for parking (and those that do charge often do
not charge for weekday admissions), it is reasonable to conclude that even conservative estimates of attendance are
likely to push the number of total visitors to well above the number of visitors who paid for entrance.
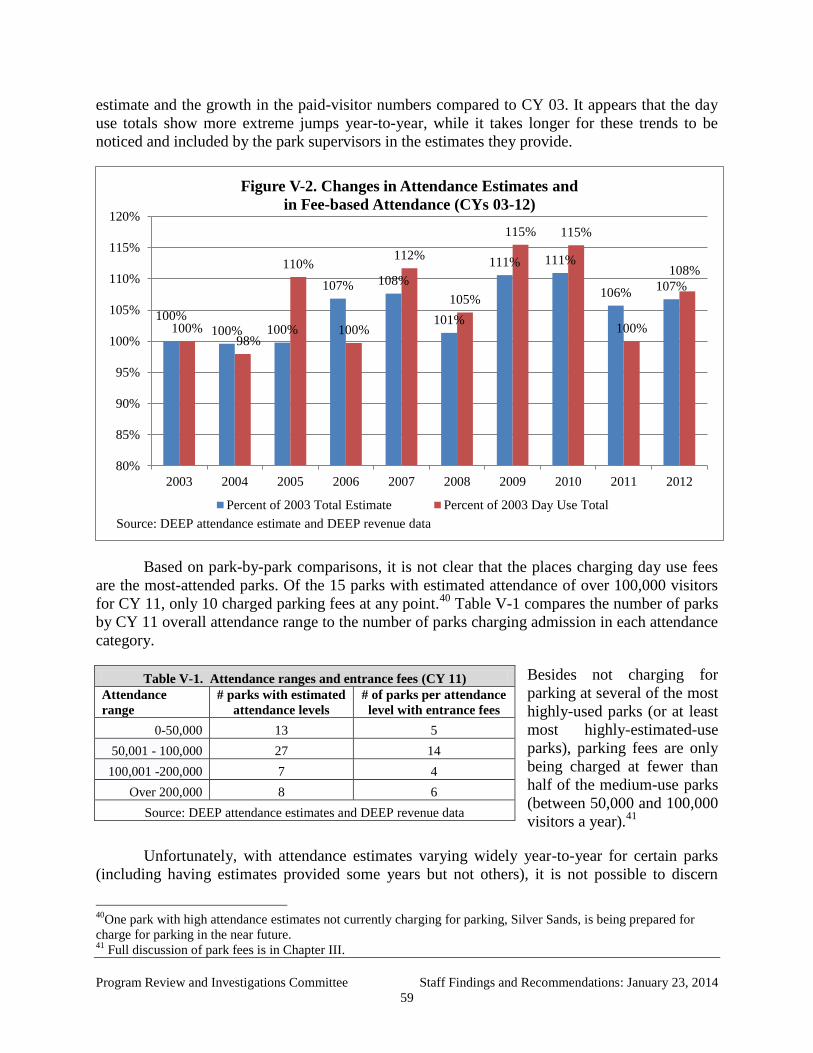
Program Review and Investigations Committee Staff Findings and Recommendations: January 23, 2014
59
estimate and the growth in the paid-visitor numbers compared to CY 03. It appears that the day
use totals show more extreme jumps year-to-year, while it takes longer for these trends to be
noticed and included by the park supervisors in the estimates they provide.
Based on park-by-park comparisons, it is not clear that the places charging day use fees
are the most-attended parks. Of the 15 parks with estimated attendance of over 100,000 visitors
for CY 11, only 10 charged parking fees at any point.40
Table V-1 compares the number of parks
by CY 11 overall attendance range to the number of parks charging admission in each attendance
category.
Besides not charging for
parking at several of the most
highly-used parks (or at least
most highly-estimated-use
parks), parking fees are only
being charged at fewer than
half of the medium-use parks
(between 50,000 and 100,000
visitors a year).41
Unfortunately, with attendance estimates varying widely year-to-year for certain parks
(including having estimates provided some years but not others), it is not possible to discern
40
One park with high attendance estimates not currently charging for parking, Silver Sands, is being prepared for
charge for parking in the near future. 41
Full discussion of park fees is in Chapter III.
100% 100% 100%
107% 108%
101%
111% 111%
106% 107%
100% 98%
110%
100%
112%
105%
115% 115%
100%
108%
80%
85%
90%
95%
100%
105%
110%
115%
120%
2003 2004 2005 2006 2007 2008 2009 2010 2011 2012
Figure V-2. Changes in Attendance Estimates and
in Fee-based Attendance (CYs 03-12)
Percent of 2003 Total Estimate Percent of 2003 Day Use Total
Source: DEEP attendance estimate and DEEP revenue data
Table V-1. Attendance ranges and entrance fees (CY 11)
Attendance
range
# parks with estimated
attendance levels
# of parks per attendance
level with entrance fees
0-50,000 13 5
50,001 - 100,000 27 14
100,001 -200,000 7 4
Over 200,000 8 6
Source: DEEP attendance estimates and DEEP revenue data

Program Review and Investigations Committee Staff Findings and Recommendations: January 23, 2014
60
whether the above analysis shows that there is misalignment between park use and parking fees
or whether the analysis further indicates the range of error in attendance estimates. However, the
previously recommended regular park reviews and use of improved attendance estimates should
allow the Parks Division to better understand and align fees and public use.
Recommendation
7. The Parks Division should review the use and level of fees for each park location
not less than once every five years, as part of an overall park review.
For those parks that have been charging day-use fees, Figure V-3 shows overall paid day-
use visitors as well as the paid day-use visitors for the top nine attended parks in CY 11.42
Overall paid attendance has been approximately 20 percent of the total attendance estimate since
1999. The figure shows paid entrance to the state’s most-used parks (Hammonasset, Rocky
Neck, and Sherwood Island), which strongly mirrors the overall attendance estimate in that
Hammonasset accounts for between one-quarter and one-third of all paid day use with the next
two accounting for more than 5 percent of the total paid day use amount in a given year.
42
Estimates in the figure include admissions and parking and assumes four visitors per vehicle, which is notably low
for buses and mini-buses.
1,144
1,016
1,159
1,296
1,020 999
1,124
1,017
1,139
1,067
1,177 1,176
1,020
1,101
1,036
0
200
400
600
800
1,000
1,200
1,400
0
50,000
100,000
150,000
200,000
250,000
300,000
350,000
400,000
450,000
500,000
1999 2000 2001 2002 2003 2004 2005 2006 2007 2008 2009 2010 2011 2012 2013
To
tal
Pa
id D
ay
Use
T
ho
usa
nd
s
Ind
vid
ua
l P
ark
Pa
id D
ay
Use
Figure V-3. Number of Day Use Paid Visitors (CYs 99-13)
Total Hammonasset Beach St Park Rocky Neck State ParkSherwood Island St Park Harkness Memorial St Park Gillette Castle St ParkSleeping Giant State Park Indian Well State Park Kent FallsDinosaur State Park Squantz Pond State Park
Source: DEEP Revenue Data. Assumes 4 visitors per vehicle.
Parks with fewer than 20,000 paid vehicles in CY 13 are not shown individually, but are included in the total.
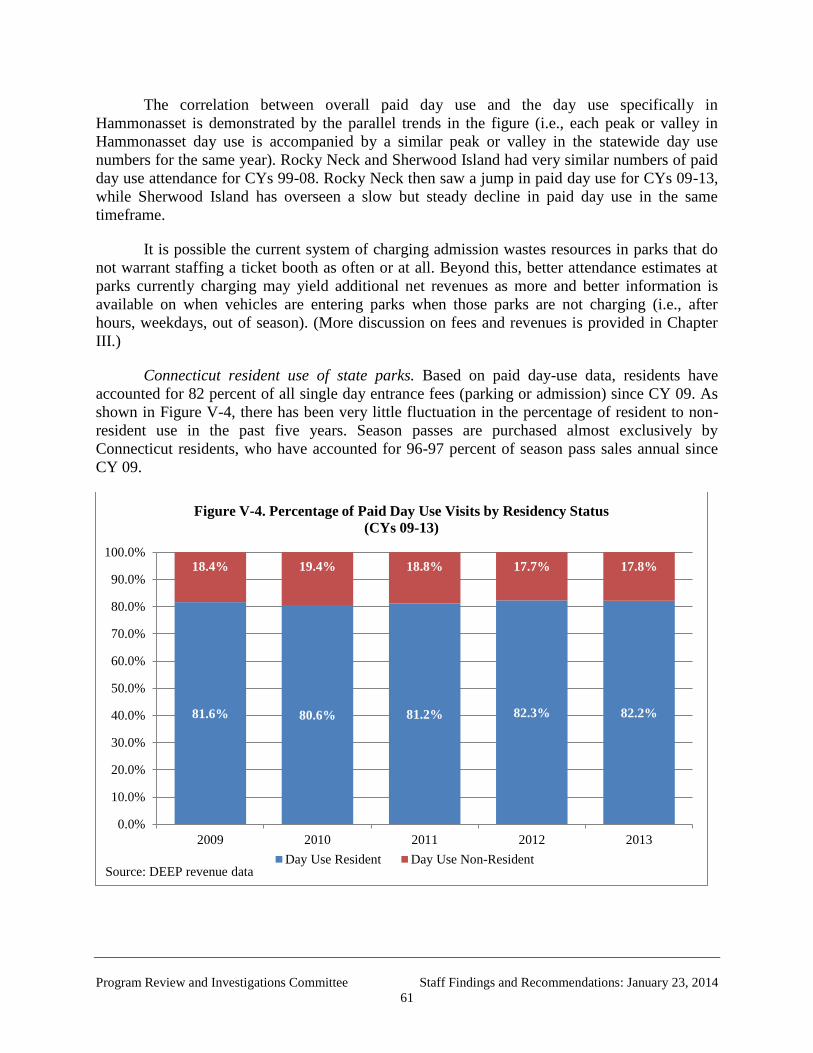
Program Review and Investigations Committee Staff Findings and Recommendations: January 23, 2014
61
The correlation between overall paid day use and the day use specifically in
Hammonasset is demonstrated by the parallel trends in the figure (i.e., each peak or valley in
Hammonasset day use is accompanied by a similar peak or valley in the statewide day use
numbers for the same year). Rocky Neck and Sherwood Island had very similar numbers of paid
day use attendance for CYs 99-08. Rocky Neck then saw a jump in paid day use for CYs 09-13,
while Sherwood Island has overseen a slow but steady decline in paid day use in the same
timeframe.
It is possible the current system of charging admission wastes resources in parks that do
not warrant staffing a ticket booth as often or at all. Beyond this, better attendance estimates at
parks currently charging may yield additional net revenues as more and better information is
available on when vehicles are entering parks when those parks are not charging (i.e., after
hours, weekdays, out of season). (More discussion on fees and revenues is provided in Chapter
III.)
Connecticut resident use of state parks. Based on paid day-use data, residents have
accounted for 82 percent of all single day entrance fees (parking or admission) since CY 09. As
shown in Figure V-4, there has been very little fluctuation in the percentage of resident to non-
resident use in the past five years. Season passes are purchased almost exclusively by
Connecticut residents, who have accounted for 96-97 percent of season pass sales annual since
CY 09.
81.6% 80.6% 81.2% 82.3% 82.2%
18.4% 19.4% 18.8% 17.7% 17.8%
0.0%
10.0%
20.0%
30.0%
40.0%
50.0%
60.0%
70.0%
80.0%
90.0%
100.0%
2009 2010 2011 2012 2013
Figure V-4. Percentage of Paid Day Use Visits by Residency Status
(CYs 09-13)
Day Use Resident Day Use Non-ResidentSource: DEEP revenue data
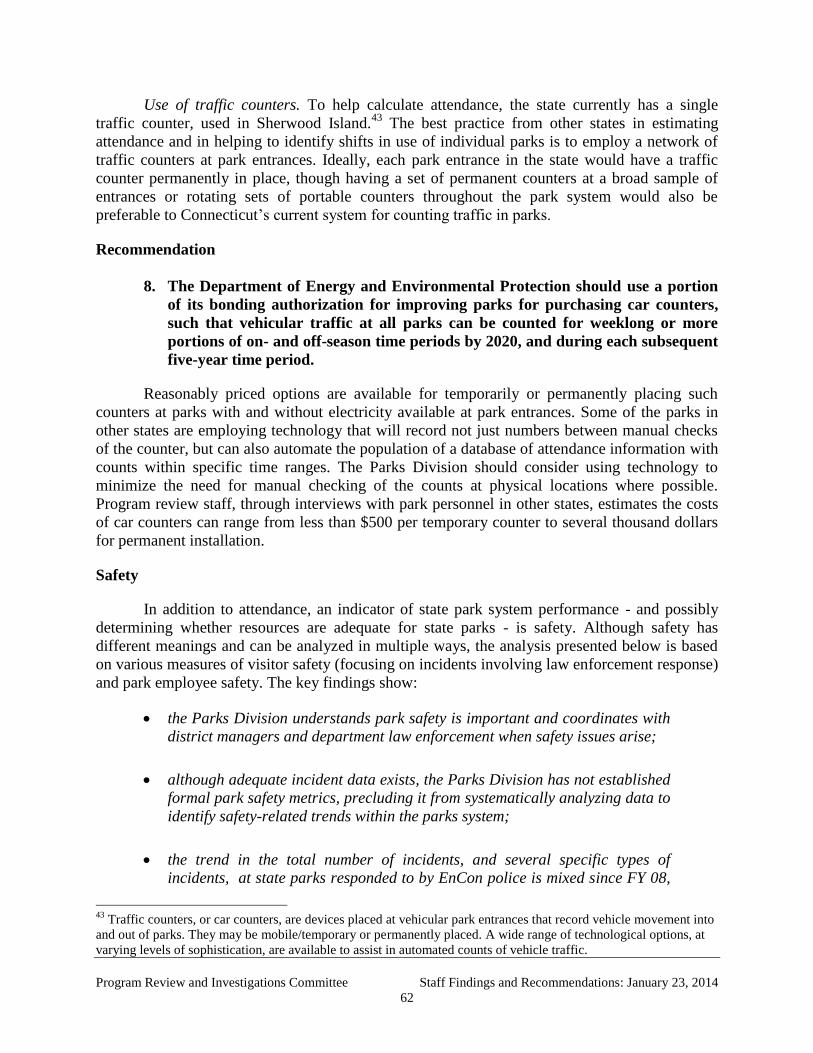
Program Review and Investigations Committee Staff Findings and Recommendations: January 23, 2014
62
Use of traffic counters. To help calculate attendance, the state currently has a single
traffic counter, used in Sherwood Island.43
The best practice from other states in estimating
attendance and in helping to identify shifts in use of individual parks is to employ a network of
traffic counters at park entrances. Ideally, each park entrance in the state would have a traffic
counter permanently in place, though having a set of permanent counters at a broad sample of
entrances or rotating sets of portable counters throughout the park system would also be
preferable to Connecticut’s current system for counting traffic in parks.
Recommendation
8. The Department of Energy and Environmental Protection should use a portion
of its bonding authorization for improving parks for purchasing car counters,
such that vehicular traffic at all parks can be counted for weeklong or more
portions of on- and off-season time periods by 2020, and during each subsequent
five-year time period.
Reasonably priced options are available for temporarily or permanently placing such
counters at parks with and without electricity available at park entrances. Some of the parks in
other states are employing technology that will record not just numbers between manual checks
of the counter, but can also automate the population of a database of attendance information with
counts within specific time ranges. The Parks Division should consider using technology to
minimize the need for manual checking of the counts at physical locations where possible.
Program review staff, through interviews with park personnel in other states, estimates the costs
of car counters can range from less than $500 per temporary counter to several thousand dollars
for permanent installation.
Safety
In addition to attendance, an indicator of state park system performance - and possibly
determining whether resources are adequate for state parks - is safety. Although safety has
different meanings and can be analyzed in multiple ways, the analysis presented below is based
on various measures of visitor safety (focusing on incidents involving law enforcement response)
and park employee safety. The key findings show:
the Parks Division understands park safety is important and coordinates with
district managers and department law enforcement when safety issues arise;
although adequate incident data exists, the Parks Division has not established
formal park safety metrics, precluding it from systematically analyzing data to
identify safety-related trends within the parks system;
the trend in the total number of incidents, and several specific types of
incidents, at state parks responded to by EnCon police is mixed since FY 08,
43
Traffic counters, or car counters, are devices placed at vehicular park entrances that record vehicle movement into
and out of parks. They may be mobile/temporary or permanently placed. A wide range of technological options, at
varying levels of sophistication, are available to assist in automated counts of vehicle traffic.

Program Review and Investigations Committee Staff Findings and Recommendations: January 23, 2014
63
although numbers may be indicative of changes in law enforcement staffing
rather than changes in the actual number of incidents.
the number of full-time and seasonal law enforcement officers patrolling the
state parks system decreased almost 10 percent since 2008;
no grievances have been filed for employee safety issues in the last five years,
and the trend in workers’ compensation claims has remained relatively flat.
During committee staff’s interviews with various DEEP employees and outside
stakeholders, it became clear the department views safety as one of its primary responsibilities
regarding operation of the state’s park system. As a way to begin examining safety within state
parks, committee staff inquired of the Parks Division how it measures safety in general.
Although the division views safety as a key component of park operations, there is no aggregate
analysis of incident data, including responses by law enforcement and accident/injury reports
filed by lifeguards, by the division to determine system-wide trends in park safety. Instead, the
division is focused on handling day-to-day issues as they arise. There also was agreement among
the division’s field staff interviewed that there is not enough focus on overall safety trends or
system-wide planning.
At the same time, division management does contact the division’s two district managers
and park unit supervisors at times as a way to understand what safety-related issues are
occurring. The division also is in communication with the environmental police (i.e., EnCon
Police) division as a way to identify where resources are needed, namely on busy days in the
summer months. (The police division has primary law enforcement jurisdiction within state
parks.)
Despite this interaction, the Parks Division does not regularly collect or analyze safety-
related trend data, nor has it established safety performance measures. Committee staff believes
the Parks Division should begin monitoring overall safety trends to more fully understand what
safety and incident trends are occurring on a macro level through a more proactive approach to
safety data analysis.
Recommendation
9. As part of its RBA report card, the Parks Division should develop formal
metrics of safety within the state park system, including safety of the general
public and division employees. The division should collect and analyze
applicable safety-related data necessary to identify trends in the annual number
and types of safety-related incidents on a system-wide basis.

Program Review and Investigations Committee Staff Findings and Recommendations: January 23, 2014
64
Park Incidents
The state park system offers a variety of recreational opportunities across a range of
outdoor resources, including swimming, hiking, boating, and camping. Providing adequate safety
within those vast resources is challenging. EnCon Police has primary law enforcement
jurisdiction within state parks and forests, as conservation duties. The division provides patrol
services through a combination of full-time police officers and seasonal officers.
Committee staff examined park safety in two ways: visitor safety and park staff safety.
Given the Parks Division does not track aggregate safety measures, visitor safety was measured
by the number of incidents occurring at state parks responded to by EnCon Police. Although a
formal review of the EnCon Police division was not a part of this study, committee staff obtained
incident data from the division.44
Safety of park staff was made by examining workers’
compensation claims and safety-related grievances.
Incidents occurring at parks are wide-ranging and include motor vehicle and parking
violations, fish/game regulation enforcement, dog violations, alcohol violations, and domestic
violence situations. There are times when safety issues within the park system involve the EnCon
police, state police, municipal police, or other first responders, as well as non-police staff,
namely lifeguards and seasonal park rangers, though the percent responded to by EnCon is
unknown.
Incident information provided by EnCon was analyzed as one way to describe park
safety. Figure V-5 shows the number of incidents on an annual basis and the trend in incidents
for FYs 08-13. An incident is defined as any time an EnCon officer (full-time or seasonal)
responded to a call for service or self-initiated an enforcement activity.
The figure includes all types of incidents occurring at state parks and forests. The overall
trend in incidents at state parks responded to by park law enforcement is mixed. For FYs 09-11,
the total number of incidents at parks and forests decreased from 2,989 to 2,813. The number
44
The Legislative Program Review and Investigations Committee conducted a full study of the State Environmental
Conservation Police in 2006.
2,989 2,902 2,813
3,254 3,024
0
500
1,000
1,500
2,000
2,500
3,000
3,500
FY 09 FY 10 FY 11 FY 12 FY 13
Figure V-5. Incidents at State Parks/Forests Responded to by
EnCon Police: FYs 09-13
Source of data: DEEP

Program Review and Investigations Committee Staff Findings and Recommendations: January 23, 2014
65
then increased to 3,254 in FY 12, before decreasing again to 3,024 in FY 13. As expected,
incidents occurring at the three main shoreline parks accounted for a large percentage of
incidents in comparison with the other parks. In addition, it is important to note that the number
of reported incidents may be influenced by attendance and police other than EnCon responded to
incidents.
Types of incidents. There
are dozens of types of incidents
occurring at state parks that EnCon
responds to and tracks, including
motor vehicle law enforcement,
enforcement of alcohol rules,
disorderly conduct/breach of peace,
dog regulation enforcement, and
trespassing enforcement. Although
all types of incidents may affect a
visitor’s overall enjoyment of a state
park, the vast majority of incidents
are non-violent and do not appear to
directly impact visitor safety,
namely parking violations, which are
among the highest of all incidents.
At the same time, there are certain
categories of incidents that could impact safety within parks or a person’s perception of whether
parks are safe.
Committee staff examined the following relevant categories to identify whether trends
exists: 1) disorderly conduct/breach of peace; 2) enforcement of alcohol violations; 3) larceny;
and 4) enforcement of motor vehicles laws (e.g. speeding). Figure V-6 shows the number of such
incidents since FY 09. In short, the highest number of incidents occurred within the category
motor vehicle enforcement, which increased since FY 11. Alcohol violations have been on a
downward trend, while disorderly conduct/breach of peace showed an upward swing since FY
10, but decreased somewhat in FY 13. Incidents involving larceny remained relatively steady
over the five years examined.
EnCon staffing. The EnCon police division’s staffing levels were examined to identify
any possible trends related to safety resources.45
Figure V-7 shows the total number of
conservation officers (i.e., full-time) and the full-time equivalent special conservation officers
(i.e., seasonal officers).46
Staffing levels ranged from a high of 73.6 in FY 09, to a low of 62.2 in
FY 13. There has been an overall decrease of 11.4 (15 percent) full-time and seasonal staff over
the five-year period examined. Specifically, full-time staffing decreased from 56 to 47, while
45
An obvious measure of safety within state parks is determining whether adequate police coverage is available to
meet their needs. Ultimately, the level of safety within state parks is predicated in large part upon annual policy
decisions to fund a certain number of environmental conservation police officer positions to patrol state parks. The
allocation of EnCon officers by location and shift as they relate to state parks was not reviewed in this study. 46
Seasonal EnCon officers receive the same training as municipal police officers throughout the state.
0
50
100
150
200
250
300
350
400
FY 09 FY 10 FY 11 FY 12 FY 13
Figure V-6. Public Safety-Related Incidents in
State Parks/Forests: FYs 09-13
Motor Vehicle
Enf.
Disorderly
Conduct/Breach
of Peace
Alcohol
Violation
Larceny
Source: DEEP
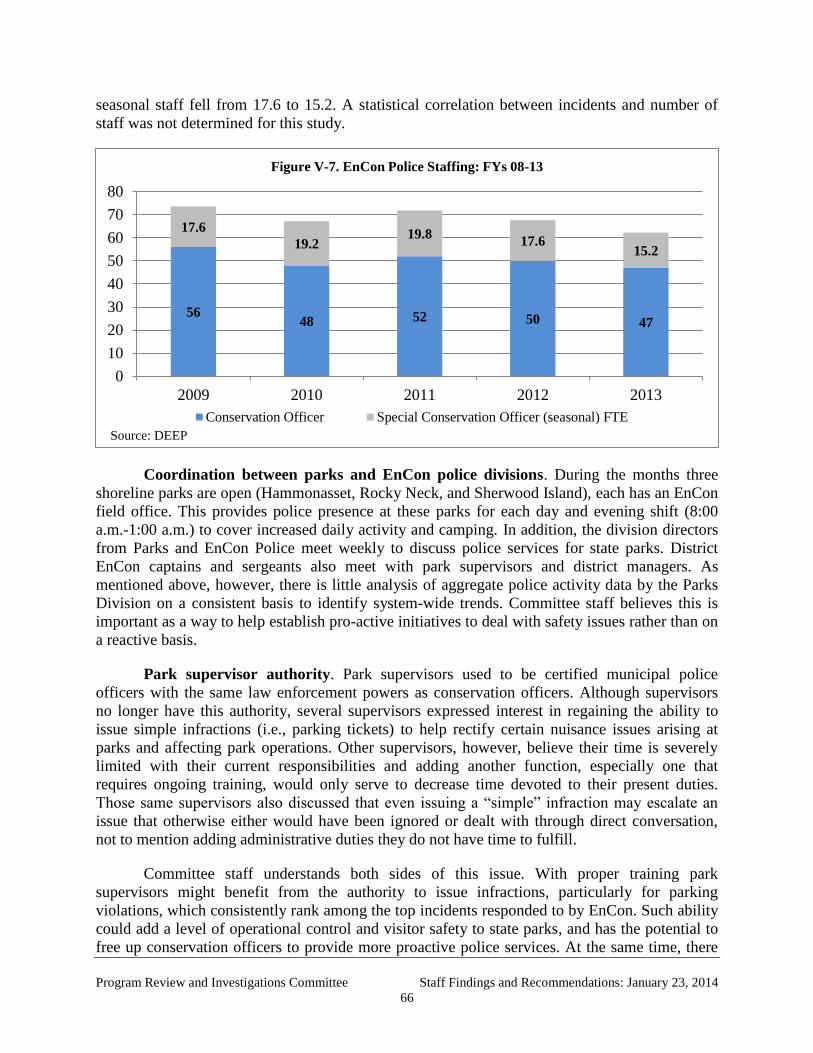
Program Review and Investigations Committee Staff Findings and Recommendations: January 23, 2014
66
seasonal staff fell from 17.6 to 15.2. A statistical correlation between incidents and number of
staff was not determined for this study.
Coordination between parks and EnCon police divisions. During the months three
shoreline parks are open (Hammonasset, Rocky Neck, and Sherwood Island), each has an EnCon
field office. This provides police presence at these parks for each day and evening shift (8:00
a.m.-1:00 a.m.) to cover increased daily activity and camping. In addition, the division directors
from Parks and EnCon Police meet weekly to discuss police services for state parks. District
EnCon captains and sergeants also meet with park supervisors and district managers. As
mentioned above, however, there is little analysis of aggregate police activity data by the Parks
Division on a consistent basis to identify system-wide trends. Committee staff believes this is
important as a way to help establish pro-active initiatives to deal with safety issues rather than on
a reactive basis.
Park supervisor authority. Park supervisors used to be certified municipal police
officers with the same law enforcement powers as conservation officers. Although supervisors
no longer have this authority, several supervisors expressed interest in regaining the ability to
issue simple infractions (i.e., parking tickets) to help rectify certain nuisance issues arising at
parks and affecting park operations. Other supervisors, however, believe their time is severely
limited with their current responsibilities and adding another function, especially one that
requires ongoing training, would only serve to decrease time devoted to their present duties.
Those same supervisors also discussed that even issuing a “simple” infraction may escalate an
issue that otherwise either would have been ignored or dealt with through direct conversation,
not to mention adding administrative duties they do not have time to fulfill.
Committee staff understands both sides of this issue. With proper training park
supervisors might benefit from the authority to issue infractions, particularly for parking
violations, which consistently rank among the top incidents responded to by EnCon. Such ability
could add a level of operational control and visitor safety to state parks, and has the potential to
free up conservation officers to provide more proactive police services. At the same time, there
56 48 52 50 47
17.6
19.2 19.8
17.6 15.2
0
10
20
30
40
50
60
70
80
2009 2010 2011 2012 2013
Figure V-7. EnCon Police Staffing: FYs 08-13
Conservation Officer Special Conservation Officer (seasonal) FTE
Source: DEEP
Program Review and Investigations Committee Staff Findings and Recommendations: January 23, 2014
67
are administrative and training responsibilities that park supervisors and EnCon police may not
have the resources to fulfill.
Employee safety. As discussed earlier, having a minimum staffing level of two
maintainers per park unit for safety reasons is not met within some units. The possibility of
decreasing employee safety, therefore, exists in those units. To more fully examine overall
employee safety within the parks system, committee staff examined two indicators relative to
safety: 1) the trend in the number of workers’ compensation claims filed by maintainers and
supervisors; and 2) the number of safety-related grievances filed by maintainers or supervisors,
or their union. Any increases in these areas could be an indication of decreased employee safety
within state parks.
Park supervisors and maintainers receive initial and periodic health and safety training
through the DEEP Office of Health and Safety, and on-the-job training at the management unit
level. The annual number of workers’ compensation claims for FYs 10-13 ranged from 12 to 23.
Although there was an increase in the number of claims filed in FY 13, committee staff cannot
draw any definitive conclusions with respect to the overall number of claims. That claims
remained relatively constant, except for FY 13, suggests there was nothing extraordinary in any
of the previous years as far as overall employee safety is concerned.
According to DEEP, there were no safety-related grievances filed for FYs 09-13 by
maintainers, supervisors, or their union. On one level, this indicates workplace safety is
satisfactory among field employees. On another level, there are many reasons why union
grievances either are or are not filed, which would need additional analysis to fully determine.
Customer Satisfaction
People use state parks for different purposes and have different experiences based on
multiple factors. As a way to understand visitors’ satisfaction with park operations, committee
staff examined whether the Parks Division has a structured system in place to measure customer
satisfaction, the measures used within that system to determine performance, and the overall
performance of parks. The key findings show:
Various methods exist to collect customer feedback, yet no customer
satisfaction metrics have been developed; no aggregate review of customer
satisfaction data exists to determine systemic problem areas, or areas where
performance is positive.
Results from an online survey conducted by the Parks Division shows the
public is satisfied with their state park experience, yet some improvements
should be made.
Parks serve a wide cross-section of the public with varied interests, yet park
supervisors say conflicting park uses do not cause many problems within the
parks system; one issue of consistent debate, however, is the use of all-terrain
vehicles on park land.

Program Review and Investigations Committee Staff Findings and Recommendations: January 23, 2014
68
As highlighted in the main recommendation at the start of this chapter, committee staff
proposes the department use customer satisfaction measures to help determine the overall
performance of the state park system. Similar to measurement of attendance and park safety, the
development and measurement of customer satisfaction should be geared toward the department
answering the three primary RBA questions of “how much did we do?” “how well did we do it?”
and “is anyone better off?” as they relate to the overall results statement (i.e., Quality of Life in
RBA terms) developed for the state park system and necessary for completion of the
recommended RBA report card.
Several methods to collect customer feedback have been implemented by the Parks
Division with varying degrees of success toward a system-wide understanding of customer
satisfaction. Two formal methods for park attendees to rate their satisfaction and indicate areas
for improvement are an online survey developed by the division and implemented in 2008, and
postcards available at park unit and district offices. Both methods have been helpful to the
division to understanding issues at individual parks, yet there is no formal aggregate review of
customer satisfaction data to identify areas systematically in need of improvement based on
specific performance measures. The division recognizes its analysis of customer service
information is more on a reactive basis than proactive. For example, there is no “customer
satisfaction” database for the postcard information, and the online survey is examined on a case-
by-case basis without analysis of overall themes or trends. This is not to say the customer
feedback information is not used, but a system-wide analysis could make it more useful. At the
same time, the division notes the vast majority of park customers simply provide their feedback
directly to park staff, which is difficult to quantify, but still important for park operations.
DEEP online survey results. Customer feedback information from the division’s
online survey was examined by committee staff. The survey consists of 20 questions about a
variety of topics. Responses to several of the more relevant issues to this study are summarized
below. The results are aggregate (i.e., not by fiscal year), and include all 1,450 responses
received by the division since mid-2008.
92 percent said they enjoyed their visit (n=1,416).
78 percent said staff were helpful (n=869).
When asked to rate the conditions/use of 22 different factors of the park they
visited, the top three responses receiving the most number “excellent” or
“good” ratings were (in order):47
Parking area (n=988); Highway signs to locate
park/forest (n=971); Buildings/grounds (n=846).
When asked to rate the conditions/use of 22 different factors of the park they
visited, the bottom three responses receiving the most number “fair” or “poor”
ratings were (in order): Restrooms (n=233); Informational signs within
park/forest (n=166); Trail maps (n=162).
55 percent said the parking fee does not deter them from visiting a
Connecticut state park/forest; 45 percent said it does. (n=1,332)
47
The rating scale used for each factor was “excellent,” “good,” “average,” “fair,” “poor,” and N/A.

Program Review and Investigations Committee Staff Findings and Recommendations: January 23, 2014
69
Using the survey results above, it is clear that most people enjoyed their visit to a
Connecticut state park/forest.48
The results also show areas where customers rated parks
services well and areas where improvement seems to be necessary. Committee staff
understands there are caveats with the survey and its results, particularly given the low number
of responses in relation to the overall number of visitors over the timespan examined. The
overall results, however, show mostly positive customer satisfaction with state parks and
forests.
Another area of interest to the committee regarding state park use is the overall
accessibility within parks. The department is cognizant of making parks, to the extent feasible
within their overall natural condition, accessible to visitors of all physical capacities. For
example, all capital projects associated with physical structures are completed in compliance
with federal and state accessibility requirements. The department’s park system website lists all
the amenities that are accessible for park visitors with physical challenges.49
For example,
accessible parking and picnic tables are available at all park and forest recreation areas, and
most of its public buildings and restrooms are accessible. There are accessible campsites,
fishing piers, and swimming areas/beach surf chairs at various state parks and forests. One trail
(Saugatuck Universal Access Trail in Redding) is wheelchair-accessible with a platform
overlooking the Saugatuck Reservoir.
Conflicting uses. The consensus among park supervisors during this study was despite
public perception at times, there are relatively few conflicts with regard to how parks are used
(e.g., hiking, bird watching, beach-going, horseback riding), and that the general public seems
satisfied. The supervisors referenced some parties have isolated issues with people using parks
in ways that conflict with their own, but from a system-wide perspective the issues are usually
relatively minor and resolved quickly.
It should be noted that conflicting uses is not the same as whether or not adequate
opportunities exist for a particular category of use or users. For example, even though customer
satisfaction is relatively high, based on the information provided above, users of Connecticut’s
park system may not believe enough of a certain type of use is available.
One such issue area that receives frequent attention is the use of all-terrain vehicles
(ATVs) on state park and forest lands.50
Within the statutory language governing state parks
and forests, ATV operation is prohibited on state land without first obtaining a certificate from
the DEEP commissioner and unless the vehicle is properly registered.51
State law also requires DEEP to evaluate the properties under its jurisdiction and the
jurisdiction of other state agencies for potential use by ATV operators, and must make
available some of the properties for ATV use.52
In making the properties available, the 48
At least of those who have selected to find and complete the online survey. 49
http://www.ct.gov/deep/cwp/view.asp?a=2716&q=325078&deepNav_GID=1650 50
C.G.S. Sec. 23-26a defines an all-terrain vehicle as a motorized vehicle, not suitable for operation on a highway
that (1) is not more than fifty inches in width, (2) has a dry weight of not more than six hundred pounds, (3) travels
on two or more tires specifically designed for unimproved terrain, (4) has a seat or saddle designed to be straddled
by the operator, and (5) has an engine with a piston displacement of more than fifty cubic centimeters. 51
C.G.S. Sec. 23-26b. 52
C.G.S Sec. 23-26c.

Program Review and Investigations Committee Staff Findings and Recommendations: January 23, 2014
70
department must consider minimizing the impact of all-terrain vehicles on the environment.
Before making any property available that is under the jurisdiction of another state agency, the
department must consult with such agency. The department is also required to adopt
regulations, in consultation with the motor vehicle department, to: 1) establish standards and
procedures for ATV operator certification and the use of all-terrain vehicles on state land; 2)
setting a fee sufficient to cover the cost of implementing the certification program; and 3)
establishing safety requirements for the operation of all-terrain vehicles on state land.
To date, no regulations have been adopted as required by statute regarding an ATV
certification program for use on state land. DEEP, however, has developed a set of internal
guidelines governing the certification process for ATV use on state land.53
A procedure has
been established for DEEP’s review of any organization proposing an ATV facility on state
land. Among other requirements, the organization must be a corporation registered with the
state, and be able to demonstrate it has the resources and capacity to fully develop, operate, and
maintain an off-road vehicle facility.
There is a two-step review process within DEEP, including a public meeting with the
municipality where the proposed facility would be located, to examine ATV facility proposals.
The key factor guiding the proposal process is the organization proposing the facility must
show the facility is compatible with protection of the natural resources within the site. Any
organization with an approved proposal must then enter into a concession agreement with the
department for the ATV facility site’s development, operation, and maintenance. At the same
time, however, DEEP’s position on its ATV policy and procedures is that they require
additional legislation to become effective.
Given increased attention to use state land for off-road vehicle use, DEEP
commissioned an evaluation of possible areas to operate ATV facilities in 2010. The study
developed criteria for siting an ATV facility, and identified six state forests that should be evaluated
against those criteria to determine if such parks could contain ATV facilities based on the criteria.54
The study also recommended a second study phase to actually do the evaluation, which has yet to
begin.
Public Act 13-237 required DEEP to implement its 2002 ATV facility proposals. The
public act, however, was vetoed by the governor. In his veto message, the governor cited that any
new legislation regarding ATV use be a balanced approach, which he believed the act did not.
The governor also urged all parties interested in changing policies for ATV use on state land to
craft legislation that would support creation of sustainable ATV trails. The current procedures
developed by DEEP remain unimplemented.
53
See: State of Connecticut, Department of Environmental Protection, All TerrainVehicle Policy and Procedures,
November 2002. 54
These criteria are based upon similar criteria adopted by Massachusetts Department Conservation and Recreation;
field observations during part one of the evaluation, a review of existing documents on the effects of ATVs,
informal interviews with ATV users throughout the United States, and knowledge of State environmental laws and
regulations (see: Connecticut Department of Environmental Protection: All Terrain Vehicle Facility Siting Study,
Baystate Environmental Consultants, Inc. (A GZA Company), May 2010
Program Review and Investigations Committee Staff Findings and Recommendations: January 23, 2014
71
Practices in several surrounding states show Rhode Island does not specifically
designate trails in state forests for off-road vehicles, including ATVs (all-terrain vehicles
cannot be legally registered in the state). The state does allow legally registered motorcycles
(including off-road motorcycles) to ride along dirt roads within state forests as long as the rider
holds a valid motorcycle license. In Massachusetts, ATV trails have been designated in eight
state forests. Special permits are required to ride in three of those forests and there is a cap on
the number of riders per day in those three parks. In New York, the state bans ATVs (and other
off-road vehicles) from state parks and forests.
Planning
Another piece of examining park use and performance measurement is determining the
extent to which the Parks Division uses the available data to make informed decision for short-
and long-term planning. The key findings in this area include:
Parks system planning is “crisis” driven.
Park operations and planning are not performance-based, with data under-
gathered and under-used.
It is not clear whether current resources are optimized; budget cuts and the
lack of position refill authority may hamper these efforts.
Budgeting for parks is based on a top-down approach that requires the
division to do as much as possible given a resource level, rather than being
based upon the amount of resources required to efficiently operate the park
system.
Planning for state parks is performed in several ways and at multiple organizational
levels within DEEP. As previously mentioned, capital projects in parks are subject to normal
bond reviews, with smaller capital projects (under $500,000) subject to specific review by
DEEP’s project review committee.
Statewide Comprehensive Outdoor Recreation Plan. A formal planning document, the
Statewide Comprehensive Outdoor Recreation Plan (SCORP), is produced by DEEP every five
years as part of a federal requirement for fund appropriation. Creation of the SCORP allows the
state to continue to receive an annual apportionment of the federal Land and Water Conservation
Fund. The most recent SCORP for Connecticut was created by DEEP in 2011 and runs through
2016. As the title suggests, the SCORP focuses on outdoor recreation provision, the primary
responsibility of the Parks Division and its parent Bureau of Outdoor Recreation. Within the
current SCORP, the plan is described as “a planning document that identifies outdoor recreation
issues of statewide significance and evaluates the supply of and the demand for outdoor
recreation resources and facilities in Connecticut.”
The department conducted surveys about park use for the 2005 version of the plan, but,
because of Connecticut’s broader budget issues at the time, the 2011 plan was created to be an
update to the more comprehensive 2005 plan. The division asked users to give preferences for a
variety of outdoor activities and related facilities. The SCORP also includes a number of major
goals, and accompanying sub-goals, for the department. Most of the stated goals include some
Program Review and Investigations Committee Staff Findings and Recommendations: January 23, 2014
72
parks division involvement, but also require broader cooperation within the agency, especially
with the Bureau of Natural Resources (BNR). Three of the plan’s six goals appear particularly
relevant to the parks division:
Connecticut will maximize public access to outdoor recreation resources.
Connecticut will maximize the variety of outdoor recreation resources.
Connecticut will engage in public outreach to better inform residents and
visitors about the availability of outdoor recreation resources and of the many
personal and community benefits of participation.
Each of the goals is accompanied by a detailed list of recent accomplishments, ongoing
initiatives, challenges in meeting the goal, and objectives to overcome those challenges. The plan
does provide a good overview of the current system and attempts to quantify user demand
(including changes in use). However, beyond listing objectives for each goal, the plan does not
specifically prioritize those objectives or outline specific steps to enact the listed objectives.
Further, while the SCORP is recognized as the parks planning document of record throughout
the relevant bureaus and divisions of DEEP, no formal or systematic use of the plan was evident
for either system-wide budgeting purposes or day-to-day operations decisions.
2003 Infrastructure Conditions Assessment. As discussed in Chapter II, the 2003
Clough, Harbor and Associates (CHA) Infrastructure Conditions Assessment provided a detailed
inventory of the parks system’s most-used areas and resources while giving estimates of the
personnel and other resources necessary to maintain all of the parks and related facilities on an
ongoing basis. The estimates of the resources necessary were large increases over the 2003 staff
and budget levels, which would be even larger increases today given the declines in staff since
that time. However, the CHA document may have represented more of a best-case scenario for
park operations than a minimum baseline. The CHA report did provide useful budget estimates
for repairs and capital improvements, but such estimates seemingly did not account for scenarios
in which under- or unused resources are removed from the system. However, the report provided
tools and information with which DEEP could prioritize projects within individual parks and
across the state park system (see Appendix E), but, a decade later, there is not evidence these
tools have been used recently.
There are now significant issues with reliance on the document going forward. The
document is over 10 years old. Park resources have changed through additions and subtractions
to the system since the time of the report, but the underlying inventory and conditions of the park
infrastructure have not been consistently updated. Additionally, because the budget and
personnel allotted to parks never matched the amounts listed in the report, it is likely any
prioritization efforts at the time the report was introduced were mostly limited to projects
deemed urgent and/or health or safety related. The result is a large backlog of projects that were
not listed as urgent at the time.
Parks Division planning. Overall, there is evidence of planning at all levels of the parks
division, but the group of plans does not appear to be systematic or guided by overarching
division-wide priorities. Further, while projects proposed by park unit supervisors are vetted by
several levels of administration before they are implemented, there is not sufficient guidance
Program Review and Investigations Committee Staff Findings and Recommendations: January 23, 2014
73
given from the management levels to the district and park supervisors on project priorities.
Additionally, there is not clear communication to park unit supervisors regarding rejected or non-
approved project proposals for at least those proposals put before the Project Review Committee,
so that such proposals may be modified for future consideration.
Projects may be efficiently implemented in individual parks, park management units, or
within the Eastern and Western Districts. However, without guidance on division-wide priorities,
it is likely that there is duplication of effort across park units or districts or even projects
implemented that work at cross purposes.
Recommendation
10. The Parks Division should develop written criteria and procedures for project
approval based on the division’s system-wide priorities. This should be updated
regularly and distributed to park unit supervisors and district managers upon
revision. The status and evaluation of merit, based on fit with the established
criteria and priorities, of all project applications that move beyond the district
level should be communicated, in writing, to the park unit supervisor who first
completed the application.
This recommendation should help ensure the limited resources available to the
department, including the time and effort to develop project proposals, are devoted to those
projects that fit into the division’s system-wide priorities. Additionally, these changes should
inform park unit supervisors as to whether non-approved projects are worth resubmitting for
consideration.
Budgeting process. The current budgeting process for the state park system, like most
state agencies, is a top-down approach and one that is based, in large part, on current services
and reductions, where possible or when requested as part of the statewide budget. Development
of the Parks Division budget is no exception.
At present, DEEP’s Financial and Support Services Bureau, which develops the budget
for the entirety of DEEP, examines individual park management unit expenditures from the
previous year, including full-time and seasonal staff expenditures, fixed expenses, and
discretionary expenses. This budgeting process is not unique to parks or DEEP. Like most state
agencies, much of the budget for parks is been determined by factors outside the department’s
control, including personnel costs for full-time employees (i.e., through collective bargaining
restrictions and the recent state employee concession agreements) and the fixed costs associated
with each park unit (e.g., utilities). After applying any department-wide reduction budget
directives from the Office of Policy and Management, a Parks Division budget is set.
Very little of the budget, if any, is determined by park personnel at the field level
explaining to DEEP management the financial needs of an efficiently run park. Rather, the Parks
Division is given a level of financial resources and asked to do as much as possible while
keeping public services available. This has led to a disconnect within the budgeting process for
state parks. Neither the two district managers nor park unit managers are substantially involved

Program Review and Investigations Committee Staff Findings and Recommendations: January 23, 2014
74
in the budgeting process and do not provide input on budget matters. As a result, true budgetary
needs, at the management unit level or in aggregate for state parks, are not fully considered.
Recommendation
11. The Parks Division shall perform a formal review of a portion of the park
system locations and resources therein on a rolling basis such that all park
system locations are reviewed at least once by 2020. The review shall include an
inventory and assessment of the condition of resources and facilities as well as an
examination of the staffing needs of each location and shall be updated for each
park location at least once throughout every subsequent five year period.
The timing of these reviews is such that the results should inform the department in
developing future SCORPs. The reviews should aid the budgeting and planning process by
creating a regularly updated list of the maintenance status and financial needs of the entire
inventory of park’s facilities and other resources. Having this complete list and keeping it current
is crucial towards long-term planning goals and should allow for greater coordination of effort
between park units, districts, and other park-related divisions of DEEP. Also, these reviews can
serve as a time to take stock of current uses and offerings of particular parks to determine if and
how public needs for outdoor recreation are being met and to reiterate how each park might best
meet the outdoor recreation goals of the state, as outlined in the SCORP.
Field staff’s role in the budgeting process. Field staff are only formally involved in the
administration of the budget for seasonal employees. The overall state park seasonal employee
budget is divided into management unit shares by DEEP’s Financial Services unit in consultation
with Parks Division management. Each park unit supervisor is given a lump sum budget for
seasonal employees for his or her particular park unit near the beginning of the parks season.55
Park unit supervisors are expected to meet the personnel needs within the total and under the
restrictions detailed in Chapter IV. Though unit supervisors have control and responsibility for
managing their unit’s seasonal budgets, the seasonal budget amount for each unit is typically
based on prior budgets, minus any reductions, and not necessarily on unit supervisor or district
manager input.
Prior to the elimination of the Environmental Conservation Fund in FY 10, park unit
supervisors retained a small portion of park-generated revenue through the use of park unit
specific enterprise funds (i.e., revenue from sale of firewood and ice), which could be used for
minor projects or new equipment at the unit supervisors’ discretion. With that source of funding
no longer available to the unit supervisors, there is no direct control of park unit discretionary
budgets by unit supervisors.
Non-seasonal budget responsibility for field staff. Park unit supervisors do not have, and
did not previously have, budget responsibility for the wider category of discretionary spending
beyond the enterprise funds. Instead, each park unit supervisor is given a spending card with a
55
There are some issues with parks budgeting for a calendar year season that crosses two state fiscal years. Parks
division staff reported that unexpected changes in budget because of changes in the state budget at the fiscal year is
more of a problem now that the Parks Division no longer has control of the non-lapsing funds from park-generated
revenue.
Program Review and Investigations Committee Staff Findings and Recommendations: January 23, 2014
75
daily and monthly maximum specific to each unit. The monthly limit amounts to a spending cap,
but the overall discretionary budget is less than twelve months’ worth of the monthly limit. Park
unit supervisors and district managers are not part of the process to develop the annual
discretionary budget limits, except insomuch as spending in one year guides the budget in the
next.
In general, park unit supervisors would like more input and control regarding
discretionary spending. Some reported that absent knowledge of and accountability to the park
unit discretionary budget, it is likely that spending in a unit is higher than would be absolutely
necessary. Also, they are sometimes put in a position to purchase inefficiently. For example,
because of the spending limits, they may buy an item every other week, rather than in bulk every
other month or once for the season. Or they may spend more purchasing a collection of cheaper
items day-to-day rather than requesting a single item that is above the daily limit.
Beyond the knowledge, involvement, and control of park unit supervisors over a park
unit’s seasonal employee costs, there is no financial incentive for park unit directors to be aware
of and minimize discretionary or fixed costs. Giving park unit supervisors greater budgetary
discretion and control could create an incentive to find savings in the fixed and discretionary
budgets if some portion of future savings remains within the park system. This is not to suggest
that park unit supervisors are not currently looking for ways to improve the parks they oversee.
Instead, there may be added benefit to the units, and through them the public, if there is more
flexibility afforded to the unit supervisors regarding budget control. Likewise, if district
managers have greater budgetary awareness and responsibility, regional funding efficiencies may
be discovered.
Recommendation
12. The Department of Energy and Environmental Protection should involve field
staff (i.e., district managers and unit supervisors) in the budget development and
administration process for the Parks Division. Specifically, park unit budgets
should be administered in coordination with the field staff throughout the fiscal
year for non-personal service costs in a manner such that field personnel are
aware of yearly budget limitations and allowed to retain some portion, as
determined by the department, of any realized savings within the same park unit
and/or district.

Program Review and Investigations Committee Staff Findings and Recommendations: January 23, 2014
76

Program Review and Investigations Committee Staff Findings and Recommendations: January 23, 2014
77
Chapter VI Operations and Funding Options
This chapter presents an overview of the potential impact of a number of possible courses
of action regarding state park operations and funding and a recommendation.
Key Findings
Closing parks is a complicated proposition because of the state’s statutory
open space goal and the general desire by the Parks Division to preserve
existing resources.
Current resources may be adequate for maintaining current service provision
levels in the short-term, but either an increase in funding and staffing or a
decrease in services is necessary for continued adequate state park operations
in the long-term.
Increased revenues may be available if desired, but would likely need an
initial investment to realize.
The information presented throughout this report shows financial and staff resources are
both down from previous levels and the major cuts to each have come primarily through attrition
rather than targeted, purposeful cuts to programmatic offerings. The Parks Division is under
pressure to maintain or expand publicly-visible services and park offerings (e.g., keeping less
frequently used parks open, keeping busier parks relatively clean) despite the downward trend in
resources for operations.
In response to declining staff numbers and available funding, the Parks Division has
made a series of cuts to service and operations, but has done so under the guideline that
decreases in service that are obvious to the public should be avoided. These cuts have taken
many forms, including less frequent regular upkeep (e.g., lawns are mowed less often, bathrooms
are checked and cleaned less often), less availability of parks staff for educational or outreach
purposes, and decreased presence of park staff who would otherwise be available for
informational, customer service, or safety reasons. Though the Parks Division has made efforts
to limit the public exposure of these decreases in service, committee staff finds the current levels
of service are at or below the point where cuts can be made without a decline in the public
perception of the availability or quality of service provided.
Even under the current budget constraints, the lack of data and its analysis regarding park
performance has likely led to less than optimal allocation of increasingly scarce resources within
the Parks Division. The sub-optimal allocation has been amplified by the decline in staffing and
funding to the point where it is unlikely there is an overabundance of resources in any particular
park given current service and programmatic offerings. Taken further, even with improved
planning and priorities, current resources are inadequate to maintain current service levels
indefinitely.

Program Review and Investigations Committee Staff Findings and Recommendations: January 23, 2014
78
Possible Changes to Operations and Funding
There are numerous ways to address the disconnect between expected service provision
and current resource levels. Discussed here are a few possible options, their relative merits, and
the viability of their implementation.
Option One: Reduced Services: One approach is to scale back service levels to realign
current resources with adequate service provision. There are several ways to approach a
significant reduction in park offerings but all of them seem to be unpopular to the point of
infeasibility. The biggest obstacle to closing parks en masse may revolve around the state’s
statutory open space goal to acquire a certain amount of land for outdoor recreation and
conservation.56
It is not clear what would be done with much of the existing park land if it is still
owned by the state for open space purposes but not managed by the Parks Division.57
Still, it is
worth describing the various ways the number of parks and park services may be reduced to
allow for adequate long-term resources of the remaining parks under the current service levels.
Instead of redistributing all current parks, services, and staff to 17 park units instead of 23
(as described in Chapter IV), this approach would be to close 6 units’ worth of parks entirely
across the state. Even when looking to close the smallest, least used parks, there are multiple
issues that must be considered. There is a baseline of care or maintenance for all state lands, so
not all personnel and money currently going to any possibly-closed parks could be transferred to
the remaining locations. There also comes a time where severely limited maintenance once or
twice a year will take more time and resources in the future than regular upkeep.58
Location of closures would also be an important consideration. While it may be tempting
to simply close all the parks in an existing park management unit, especially in those with no
supervisor and limited other staffing, closing an entire park unit will greatly decrease the access
local residents may have to state parks, which specifically goes against the public access priority
of the Parks Division as set out in the state recreation plan. If several parks are closed across a
geographical region, the remaining park management unit is likely to be geographically large –
meaning some of the time saved from closing parks will now be devoted to travel between more
distant parks.
Another consideration is that the smallest parks are also generally not consuming
significant portions of the budget. Closing the 35 smallest or least-used parks (25 percent of the
park total) is unlikely to make up for a 25 percent decrease in staffing. Rather, it would take
disproportionately more closures of the least-used parks to make current staffing and budget
resources align with service offerings.
Option Two: Optimal Staffing. Another way to match services and financial and
personnel resources would be to restore financial and staffing levels back to the early 2000 levels
or even use the 2003 CHA study optimal levels of over 200 full-time employees and 1,900
56
C.G.S. Sec. 23-8 57
In some instances, other states have turned to municipal operation of state-owned parks to reduce state costs. 58
DEEP personnel indicate the park closures of the early 1990s required investment well beyond the temporarily
avoided maintenance costs in order to reopen years later (e.g., Gillette Castle required extensive renovations before
it was reopened in 2002).

Program Review and Investigations Committee Staff Findings and Recommendations: January 23, 2014
79
seasonal staff. As approaching these levels of staffing would involve a sizable ongoing increase
in the Parks Division budget, it seems an unlikely option, even if it meant significant expansion
of programs and services (and increased revenues would be expected, as well). Given
Connecticut’s recent budget issues, this option does not seem viable.
Option Three: Continuation. The default option is to leave the current pieces
unchanged. The drop to current budget and staff levels has been accompanied by few obvious
and visible cuts to park capacity or use. It is possible the current service offerings can be
maintained with new, relatively low levels of staffing and funding for a short while. However, it
is unlikely that the current situation can be maintained indefinitely, even absent additional cuts.
At this point, it appears that virtually any reallocation of current resources to enhance service in
one location can only be made at the expense of service(s) at other locations.
Future staffing is also a concern, as mentioned in Chapter IV, since a large portion of the
work force is at or nearing retirement eligibility. Even if vacancies from future retirees are
refilled in their entirety, outgoing long-time employees have institutional knowledge that may
allow them to stretch limited resources further than newly hired employees. Some of this
institutional loss may be mitigated by hiring new employees to train with the veteran staff, but
this seems impractical to expect given the level of current resources.
Another issue with continuing the status quo revolves around deferred maintenance of the
capital infrastructure. It is likely that some resources that are currently available for use will need
repair in the near future. Likewise, some repairs and maintenance have undoubtedly been
delayed due to the recent budget issues. Besides becoming completely unusable at some point,
aging facilities in various states of disrepair may lead to declining opinions of parks among the
public and eventually to decreased use.
Option Four: Performance Contingent Increases. A more balanced approach would
restore staffing to a minimal but sustainable amount (i.e., the 12 additional staff proposed earlier
in Chapter IV) while giving incentives for demonstrating high-level performance and measurable
gains. A system with dynamic funding and flexibility for innovation could help ensure future
staff and funding levels are adequate for existing (or otherwise appropriate) service levels.
As discussed earlier, linking the state parks’ budget back to park-generated revenues in
some way should give incentives to the Parks Division to grow revenue generating activities and
services within the park system, deemphasize parks and locations with less or decreasing use,
and potentially provide some additional revenues to the state in the long-term (albeit with
additional funding, at least to start).
In order to enact something like a long-term break-even scenario, additional funding to
the department would need to be appropriated based on performance. One avenue to aid
performance measurement and give direct incentive to parks to generate more revenue would be
installing a mechanism to return a portion of annual park-generated revenue to the park system
through an appropriation system. Logistically, all park revenues would continue to go to the
General Fund, but some portion of the revenues would be earmarked for appropriation to the
Parks Division contingent upon demonstration of measured performance.
Program Review and Investigations Committee Staff Findings and Recommendations: January 23, 2014
80
In this scenario there would be no need for mass park closures and there would be natural
incentives for the Parks Division to reallocate resources to services and areas with the greatest
public use. Further, additional funding would potentially be available as new programs and
services are developed and park-generated revenues increased. While an initial funding
commitment is necessary to make implementing this option reasonable, it appears some
additional funding is necessary to avoid long-term service reduction and this balanced approach
builds in performance-based incentives to more effectively operate state parks.
Recommendation
13. Between one quarter and one half of revenue generated in state parks shall be
appropriated biennially to the Parks Division, with the specific proportion at the
request of the Department of Energy and Environmental Protection and the
approval of the Appropriations Committee. This appropriation shall be
contingent upon the Parks Division’s satisfactory participation in the Results
Based Accountability process of the Appropriations Committee, or a similar
performance-based measurement requested by the Appropriations Committee.
The shared park-generated revenue shall not supplant the General Fund
obligation to the Parks Division. The portion of park-generated revenues not
appropriated to the Parks Division shall continue to support the General Fund.
The Parks Division shall create a plan for use of park-generated revenue that
balances the distribution of park revenue-based funds among the park or park
units that generated the revenue and the needs of the entire system of parks and
present such plan, along with the initial RBA-style report card, to the relevant
Appropriations sub-committees, and the Environment Committee. The initial
fund distribution plan should emphasize implementation of performance metrics
and related data-gathering and analysis.
Excepting the relatively minor revenues going to park-specific MRI accounts,
Connecticut’s current funding mechanism for state parks does not include the use of park-
generated revenue, which is at odds with the national norm for state park funding and removes
incentives for increased revenue generation. Appropriating some amount of park-generated
revenue gives the Parks Division access to increased funding, but in return requires increased
accountability regarding park performance. Legislative appropriation of park-generated revenue
does not require the creation of an additional special fund outside the General Fund. This model
is similar to other states, such as Missouri and Minnesota, in that park-generated revenues are
available to state parks, but must go through the legislative appropriation process (though both of
those states recapture 100 percent of park-generated revenues, rather than the 25 to 50 percent
recommended here). Like those states and New York, Connecticut’s state park funding would
move towards being based on demonstrated performance.
Increasing revenue generation. Connecticut ranked 39th
in overall park revenue
generation in FY 12, five spots lower than its overall operating budget rank of 34th
. As
previously mentioned, while self-sufficiency is not necessarily an attainable goal, Connecticut
was lower than average (ranked 36th
in FY 12) when comparing park-generated revenue to
operating expenses. This could suggest that revenues are where they should be and the operating

Program Review and Investigations Committee Staff Findings and Recommendations: January 23, 2014
81
budget is too high. However, given the relatively low standing of both the operating budget and
lower standing of the revenue collected, it appears any perceived imbalance between operating
costs and park-generated revenues is more the fault of the latter being low.
Nationwide, state parks agencies are asked to generate revenue to help support overall
park programming and as a way of passing the costs of park service provision on to those who
use them most. There is always a balance involved between keeping prices at such a level they
remain affordable for the public, but high enough to ensure the services continue to be provided.
As discussed in Chapter III, states approach revenue generation in a wide variety of ways, with
some states charging for entrance at all parks, others (like Connecticut) charging at a select
number of parks, and still others not charging for entrance anywhere. All three models have
endless variations and every state raises revenue through parks in some manner.
It may be that Connecticut’s revenues are comparatively low because the state has
already made a policy choice to make services and resources free to the public when possible and
to avoid user fees generally. However, the revenues generated in Connecticut state parks are
relatively low even in comparison to states that collect no parking or entrance fees. Given
Connecticut’s seemingly low levels of revenue production and the incentive to increase revenue
through the recommendations in this report, the Parks Division will likely need to find ways to
increase revenue generation.
If increased revenue generation is desired, there are several ways in which revenues may
be enhanced. First, given the current staffing limitations, it is possible not all ticket booths are
able to be staffed at all appropriate times (i.e., when use is sufficient to pay for at least the cost of
ticket taking). This situation may occur because parks that currently charge fees are unable to
charge at the correct times or because some of the most-used parks are not charging entrance fees
at all. Second, other states, including New York, are exploring automating parking fees,
especially in parks with regular use that do not otherwise warrant a regularly staffed ticket
booth.59
Connecticut does not use automated technology for parking fees, but could potentially
increase revenues and/or decrease staffing costs through automation in this area. Third, revenues
may increase through an increase in attendance, either through an increase in programmatic
offerings or expanded marketing of parks.
If parks are expected to increase revenue generation, it is likely they will need additional
resources to do so. Similarly, in order to give the Parks Division increased incentive to raise
revenue levels, revenue generation levels should be tied directly to the Parks Division budget. It
is possible that increasing the parks budget through recapture of some of the revenue will
increase total revenue generation and may lead to either a win-win scenario (parks and the state
receive greater revenues) or at least a break-even scenario where parks are more adequately and
consistently funded at little or no greater cost to the state.
For example, the national median revenue generation rate compared to parks’ operating
budgets is 48 percent versus Connecticut’s rate of 36 percent. If Connecticut’s $17.8 million
parks operations budget (including benefits) were increased to $21 million, the revenue
generation might be expected to increase from $6.5 million (36 percent of $17.8 million) to $10
59
Automated parking can be accomplished through automated gates or through the use of parking meters.
Program Review and Investigations Committee Staff Findings and Recommendations: January 23, 2014
82
million (48 percent of $21 million), meaning a $3.5 million increase in revenue for a $3.2 million
increase in expenses. This is only one scenario under many that are possible, many of which
would not involve recouping additional funding through increased revenue. Even under this
scenario, an influx of additional funding would need to happen before any additional revenues
might be realized.

APPENDICES


A-1
Appendix A List of State Parks and Forests
Table A-1. List of State Parks and Forests
Name Mng Unit Town(s) Acres Facilities*
Beckley Furnace Burr Pond North Canaan 12
Satan's Kingdom Peoples New Hartford 1 h,b,x
Above All Lake Waramaug Warren/Litchfield 31 h
Airline Trail Mashamoquet/ Salmon
River
Colchester, Columbia, East Hampton,
Hebron, Lebanon, Pomfret, Putnam,
Willimantic, Windham
40 bk,h,w,y
Algonquin Burr Pond/Peoples Colebrook 2987
American Legion Peoples Barkhamsted 893 f,h,j,w,bk,b
Beaver Brook Mashamoquet Windham 401 h
Becket Hill Rocky Neck Lyme 260 h,p,f,o
Bigelow Hollow Shenipsit Union 516 b,f,h,p,w
Black Rock Topsmead Watertown 444 f,h,p,s,x
Bluff Point Fort Trumbull Groton 806 f,h,bk
Bolton Notch Salmon River Bolton 95 h
Brainard Homestead Gillette East Haddam 25 h
Burr Pond Burr Pond Torrington 438 b,f,h,l,p,s,w,x
Campbell Falls Burr Pond Norfolk 102 f,h,p
Chatfield Hollow Cockaponset Killingworth 412 f,h,l,p,s,w
Cockaponset Cockaponset Deep River, Durham, Haddam,
Killingworth, Westbrook
17186
Valley Railroad Cockaponset Chester, Deep River, Essex, Middletown,
Old Saybrook
332 m,o,x
Dart Island Cockaponset Middletown 19 b,f
Day Pond Salmon River Colchester 180 f,h,l,p,s
Dennis Hill Burr Pond Norfolk 240 h,l,p
Devil's Hopyard Gillette East Haddam 1000 f,h,l,p
Dinosaur Dinosaur Rocky Hill 80 h,m,p
Enders Peoples Barkhamsted, Granby 2105
Farm River Sleeping Giant East Haven 62 b,h,bk
Forster Pond Cockaponset Killingworth 218 h
Fort Griswold Battlefield Fort Trumbull Groton 17 m,o,p
Fort Trumbull Fort Trumbull New London 16 f,o,p
Gardner Lake Gillette Salem 10 b,f,s,p
Gay City Salmon River Bolton, Hebron 1569 f,h,p,s,w,bk
George D. Seymour Salmon River Haddam 222 f,h,j,w
Gillette Castle Gillette Hadlyme 185 h,l,m,o,p,x
James L. Goodwin Mashamoquet Hampton 2003
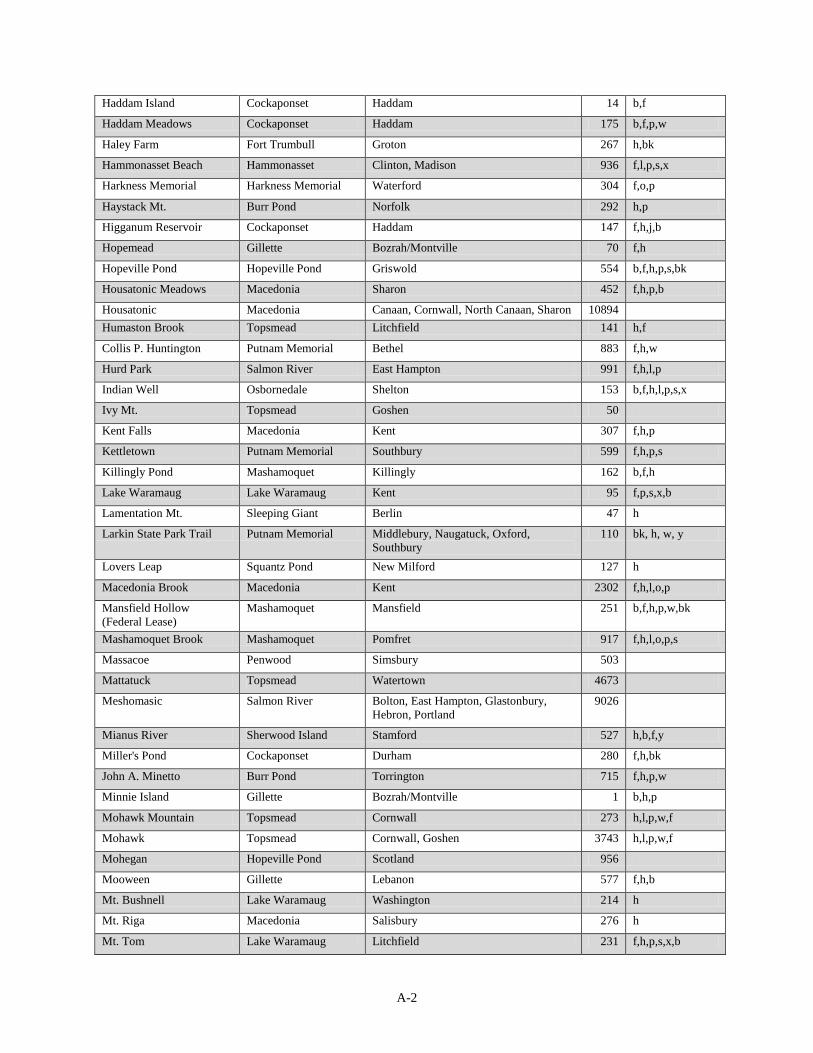
A-2
Haddam Island Cockaponset Haddam 14 b,f
Haddam Meadows Cockaponset Haddam 175 b,f,p,w
Haley Farm Fort Trumbull Groton 267 h,bk
Hammonasset Beach Hammonasset Clinton, Madison 936 f,l,p,s,x
Harkness Memorial Harkness Memorial Waterford 304 f,o,p
Haystack Mt. Burr Pond Norfolk 292 h,p
Higganum Reservoir Cockaponset Haddam 147 f,h,j,b
Hopemead Gillette Bozrah/Montville 70 f,h
Hopeville Pond Hopeville Pond Griswold 554 b,f,h,p,s,bk
Housatonic Meadows Macedonia Sharon 452 f,h,p,b
Housatonic Macedonia Canaan, Cornwall, North Canaan, Sharon 10894
Humaston Brook Topsmead Litchfield 141 h,f
Collis P. Huntington Putnam Memorial Bethel 883 f,h,w
Hurd Park Salmon River East Hampton 991 f,h,l,p
Indian Well Osbornedale Shelton 153 b,f,h,l,p,s,x
Ivy Mt. Topsmead Goshen 50
Kent Falls Macedonia Kent 307 f,h,p
Kettletown Putnam Memorial Southbury 599 f,h,p,s
Killingly Pond Mashamoquet Killingly 162 b,f,h
Lake Waramaug Lake Waramaug Kent 95 f,p,s,x,b
Lamentation Mt. Sleeping Giant Berlin 47 h
Larkin State Park Trail Putnam Memorial Middlebury, Naugatuck, Oxford,
Southbury
110 bk, h, w, y
Lovers Leap Squantz Pond New Milford 127 h
Macedonia Brook Macedonia Kent 2302 f,h,l,o,p
Mansfield Hollow
(Federal Lease)
Mashamoquet Mansfield 251 b,f,h,p,w,bk
Mashamoquet Brook Mashamoquet Pomfret 917 f,h,l,o,p,s
Massacoe Penwood Simsbury 503
Mattatuck Topsmead Watertown 4673
Meshomasic Salmon River Bolton, East Hampton, Glastonbury,
Hebron, Portland
9026
Mianus River Sherwood Island Stamford 527 h,b,f,y
Miller's Pond Cockaponset Durham 280 f,h,bk
John A. Minetto Burr Pond Torrington 715 f,h,p,w
Minnie Island Gillette Bozrah/Montville 1 b,h,p
Mohawk Mountain Topsmead Cornwall 273 h,l,p,w,f
Mohawk Topsmead Cornwall, Goshen 3743 h,l,p,w,f
Mohegan Hopeville Pond Scotland 956
Mooween Gillette Lebanon 577 f,h,b
Mt. Bushnell Lake Waramaug Washington 214 h
Mt. Riga Macedonia Salisbury 276 h
Mt. Tom Lake Waramaug Litchfield 231 f,h,p,s,x,b
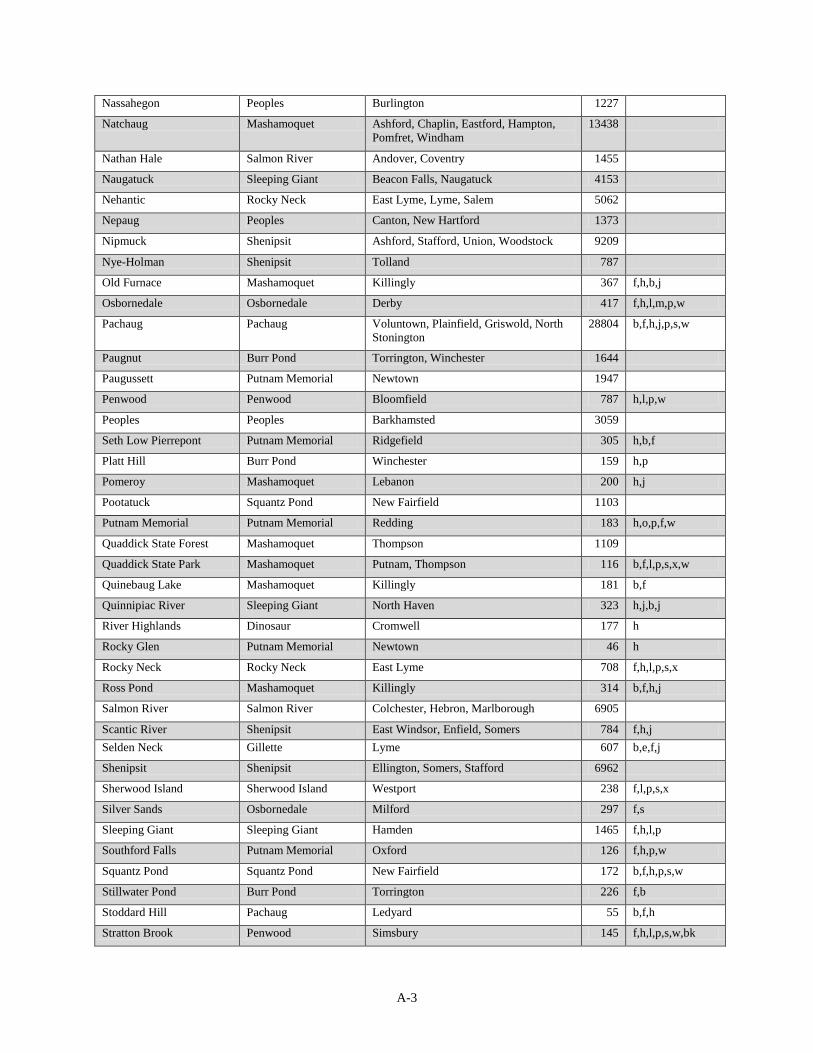
A-3
Nassahegon Peoples Burlington 1227
Natchaug Mashamoquet Ashford, Chaplin, Eastford, Hampton,
Pomfret, Windham
13438
Nathan Hale Salmon River Andover, Coventry 1455
Naugatuck Sleeping Giant Beacon Falls, Naugatuck 4153
Nehantic Rocky Neck East Lyme, Lyme, Salem 5062
Nepaug Peoples Canton, New Hartford 1373
Nipmuck Shenipsit Ashford, Stafford, Union, Woodstock 9209
Nye-Holman Shenipsit Tolland 787
Old Furnace Mashamoquet Killingly 367 f,h,b,j
Osbornedale Osbornedale Derby 417 f,h,l,m,p,w
Pachaug Pachaug Voluntown, Plainfield, Griswold, North
Stonington
28804 b,f,h,j,p,s,w
Paugnut Burr Pond Torrington, Winchester 1644
Paugussett Putnam Memorial Newtown 1947
Penwood Penwood Bloomfield 787 h,l,p,w
Peoples Peoples Barkhamsted 3059
Seth Low Pierrepont Putnam Memorial Ridgefield 305 h,b,f
Platt Hill Burr Pond Winchester 159 h,p
Pomeroy Mashamoquet Lebanon 200 h,j
Pootatuck Squantz Pond New Fairfield 1103
Putnam Memorial Putnam Memorial Redding 183 h,o,p,f,w
Quaddick State Forest Mashamoquet Thompson 1109
Quaddick State Park Mashamoquet Putnam, Thompson 116 b,f,l,p,s,x,w
Quinebaug Lake Mashamoquet Killingly 181 b,f
Quinnipiac River Sleeping Giant North Haven 323 h,j,b,j
River Highlands Dinosaur Cromwell 177 h
Rocky Glen Putnam Memorial Newtown 46 h
Rocky Neck Rocky Neck East Lyme 708 f,h,l,p,s,x
Ross Pond Mashamoquet Killingly 314 b,f,h,j
Salmon River Salmon River Colchester, Hebron, Marlborough 6905
Scantic River Shenipsit East Windsor, Enfield, Somers 784 f,h,j
Selden Neck Gillette Lyme 607 b,e,f,j
Shenipsit Shenipsit Ellington, Somers, Stafford 6962
Sherwood Island Sherwood Island Westport 238 f,l,p,s,x
Silver Sands Osbornedale Milford 297 f,s
Sleeping Giant Sleeping Giant Hamden 1465 f,h,l,p
Southford Falls Putnam Memorial Oxford 126 f,h,p,w
Squantz Pond Squantz Pond New Fairfield 172 b,f,h,p,s,w
Stillwater Pond Burr Pond Torrington 226 f,b
Stoddard Hill Pachaug Ledyard 55 b,f,h
Stratton Brook Penwood Simsbury 145 f,h,l,p,s,w,bk

A-4
Sunnybrook Burr Pond Torrington 464 h,f,p,j
Sunset Rock Peoples Plainville 15 h
Talcott Mt. Penwood Avon, Bloomfield, Simsbury 574 h,l,o,p
Topsmead Topsmead Litchfield 615
Tri - Mountain Sleeping Giant Durham, Wallingford 157 h
Tunxis Peoples Barkhamsted, Granby, Hartland 5519
Wadsworth Falls Cockaponset Middlefield 285 f,h,p,s,w
George C. Waldo Putnam Memorial Southbury 150 h,f,y,j
West Rock Ridge Sleeping Giant Bethany, Hamden, New Haven 1691 f,h,l,o,p,w,b,bk,j,l
Wharton Brook Sleeping Giant Wallingford 96 f,h,l,p,s
Whittemore-Larkin Bridle
Trail
Putnam Memorial Middlebury, Naugatuck, Oxford,
Southbury
242 h,y
Windsor Meadow Penwood Hartford, Windsor 132 h,bk,b,p,f
Wooster Mt. Putnam Memorial Danbury 444 Skeet, J
Wyantenock Lake
Waramaug/Macedonia
Cornwall, Warren 4083
Bennett's Pond Putnam Memorial Ridgefield 460 bk,f,h,j
Camp Columbia Forest Lake Waramaug Morris 591
Camp Columbia Park Lake Waramaug Morris 10 h,o
Centennial Watershed
Forest
Putnam Memorial Canaan, Easton, Fairfield, Monroe,
Newtown, Redding, Ridgefield, Shelton,
Stamford, Trumbull, Weston, Westport
15370
Eagle Landing Cockaponset Haddam 17 f,p
Hop River Trail Salmon River Andover, Bolton, Columbia, Coventry,
Manchester, Vernon
50 h,bk,w,y
Horse Guard Penwood Avon 105 h
Machimoodus Gillette East Haddam 300 f,h,p,y
Mono Pond Reserve Salmon River Columbia 218 f,h,b,w,p,j
Salt Rock Hopeville Pond Sprague 93 f,h,x
Sunrise Resort Gillette East Haddam 143 h
Trout Brook Valley Putnam Memorial Easton 300 h,j
Source: DEEP
(*) Facility Abbreviations bk. biking
b. boating/canoeing l. shelter (picnic) s. swimming
f. fishing m. museum w. winter sports
h. hiking o. historic x. concession
j. hunting p. picnicking y. horseback

B-1
Appendix B State Park Fees Summary
Tables B-1 through B-4 show summaries of various fee types in state parks. The source
for all tables in this Appendix is DEEP.
Table B-1. Parking Fees
Number of parks Residents Non-Residents
Weekend 26 $9-13 $15-22
Weekday 11 $6-9 $10-15
Late-day (after 4 pm) 10 $5-6 $6-7
None 113 - -
Note: Number of parks for each category is non-exclusive of other categories. The group of
parks charging for weekend parking is inclusive of the sub-groups that charge for weekday or
late-day admissions.
Table B-2. Camping Fees (per site per night)
Number of parks Residents Non-Residents
Basic Campsite 13 $14-20 $24-30
Sites w/electricity, water, or sewer 2 $33-40 $45-52
Primitive Riverside Camping 4 $5 per person
Rustic Cabins 5 $50-70 $60-80
•Parks may offer more than one type of camping/campsite.
•14 parks have non-primitive campgrounds.
Table B-3. Historic Site & Museum Admissions
Age 13+ Ages 6-12 Ages 5 and under
Dinosaur State Park $6 $2 Free
Fort Trumbull State Park $6 $2 Free
Gillette Castle State Park $6 $2 Free
Table B-4. Special Passes
Eligibility Use Cost
Charter Oak
Pass CT Residents 65 and over
Lifetime Parking and
Admission Free
Disabled
Veteran Pass
CT Resident Veterans with Service
Related Disability
Lifetime Parking and
Admission Free
Heritage
Passport
One year of unlimited access to Gillette, Dinosaur, Ft. Trumbull
for a family $67
Season Pass Unlimited parking for one car for one calendar year
$67 (CT)
$112
(non)

B-2

C-1
Appendix C Other States Information
Information is provided in this appendix regarding nationwide state park funding sources
and the methodology used to compare Connecticut to other states. The latter includes a
description of the Annual Information Exchange (AIX) data, along with its limitations, and a
discussion of case study states used throughout the report. (All 50-state comparison information
comes via the FYs 08-12 Annual Information Exchange of the National Association of State
Parks Directors, which relies on self-reported data from the states.)
Nationwide Trends in State Park Funding
States use a few major options to fund state park operations. Committee staff examined
state parks data from all 50 states; operations funding is primarily driven by returning park-
generated revenues to the park system and by using general fund monies. The use of dedicated
funds from sources outside park user fees is also relatively common. Operating expenditures for
the 50 state park systems was largely flat from FY 2008 through FY 2012. As seen in Figure C-
1, the total operating expenses for the 50 state park systems remained within the $2.2 to $2.3
billion range for the five-year period.
Funding sources can be grouped together into five broad categories: park generated
revenue, general fund monies, dedicated funds outside of park-generated revenue, federal funds,
and all other sources. Park-generated revenue comes mainly from user fees (e.g., parking,
admissions, camping). Dedicated funds are typically sourced from a percentage of taxes or fees
not directly related to park operations (e.g., motor vehicle registrations or a state sales tax). Other
sources of revenue can include non-profit/philanthropic endeavors or revenue derived from lease
of land or other contractual agreements.
$2.26 $2.27 $2.22 $2.23 $2.28
$0.00
$0.50
$1.00
$1.50
$2.00
$2.50
20122011201020092008
Bil
lio
ns
Figure C-1. 50 State Parks Operating Expenses (FYs 08-12)
Source: AIX
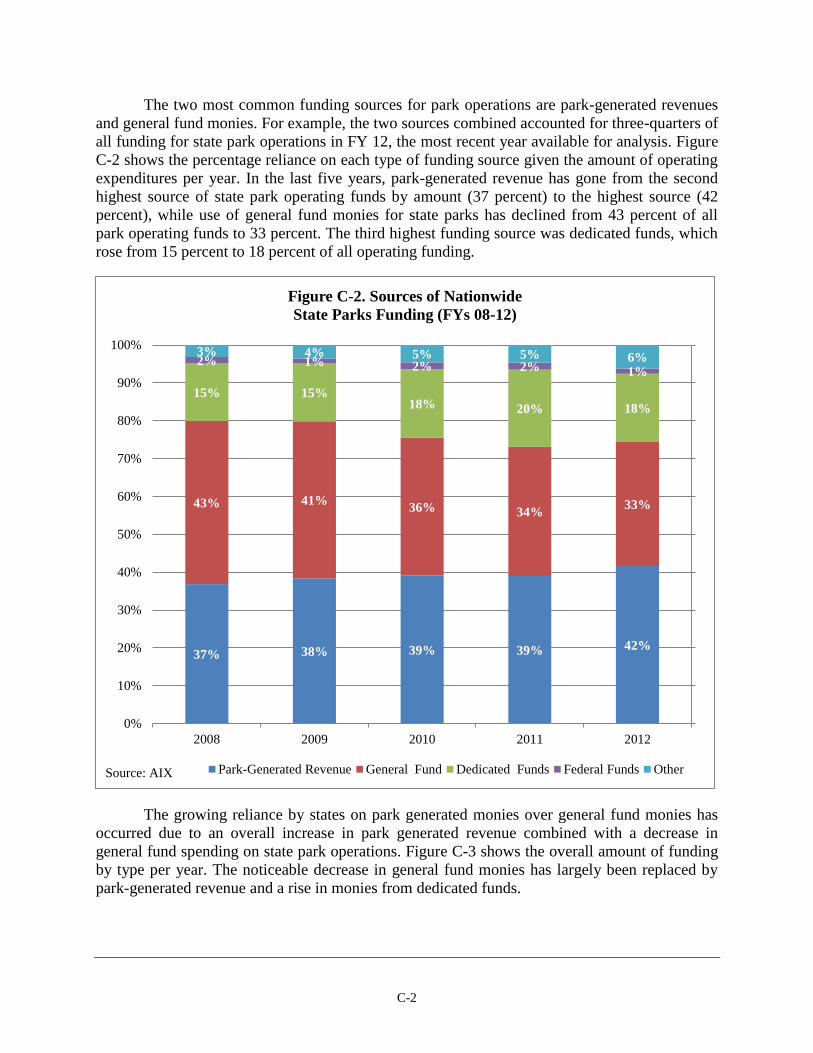
C-2
The two most common funding sources for park operations are park-generated revenues
and general fund monies. For example, the two sources combined accounted for three-quarters of
all funding for state park operations in FY 12, the most recent year available for analysis. Figure
C-2 shows the percentage reliance on each type of funding source given the amount of operating
expenditures per year. In the last five years, park-generated revenue has gone from the second
highest source of state park operating funds by amount (37 percent) to the highest source (42
percent), while use of general fund monies for state parks has declined from 43 percent of all
park operating funds to 33 percent. The third highest funding source was dedicated funds, which
rose from 15 percent to 18 percent of all operating funding.
The growing reliance by states on park generated monies over general fund monies has
occurred due to an overall increase in park generated revenue combined with a decrease in
general fund spending on state park operations. Figure C-3 shows the overall amount of funding
by type per year. The noticeable decrease in general fund monies has largely been replaced by
park-generated revenue and a rise in monies from dedicated funds.
42% 39% 39% 38% 37%
33% 34% 36%
41% 43%
18% 20% 18% 15% 15%
1% 2% 2% 1% 2% 6% 5% 5% 4% 3%
0%
10%
20%
30%
40%
50%
60%
70%
80%
90%
100%
20122011201020092008
Figure C-2. Sources of Nationwide
State Parks Funding (FYs 08-12)
Park-Generated Revenue General Fund Dedicated Funds Federal Funds OtherSource: AIX
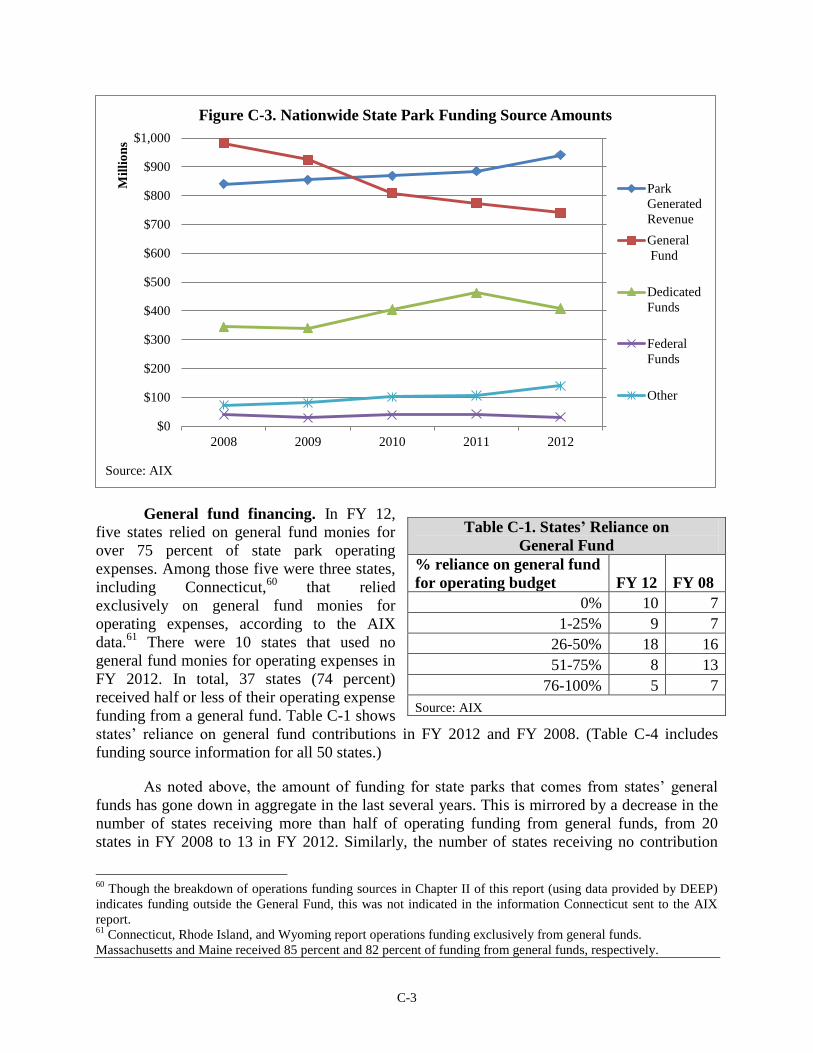
C-3
General fund financing. In FY 12,
five states relied on general fund monies for
over 75 percent of state park operating
expenses. Among those five were three states,
including Connecticut,60
that relied
exclusively on general fund monies for
operating expenses, according to the AIX
data.61
There were 10 states that used no
general fund monies for operating expenses in
FY 2012. In total, 37 states (74 percent)
received half or less of their operating expense
funding from a general fund. Table C-1 shows
states’ reliance on general fund contributions in FY 2012 and FY 2008. (Table C-4 includes
funding source information for all 50 states.)
As noted above, the amount of funding for state parks that comes from states’ general
funds has gone down in aggregate in the last several years. This is mirrored by a decrease in the
number of states receiving more than half of operating funding from general funds, from 20
states in FY 2008 to 13 in FY 2012. Similarly, the number of states receiving no contribution
60
Though the breakdown of operations funding sources in Chapter II of this report (using data provided by DEEP)
indicates funding outside the General Fund, this was not indicated in the information Connecticut sent to the AIX
report. 61
Connecticut, Rhode Island, and Wyoming report operations funding exclusively from general funds.
Massachusetts and Maine received 85 percent and 82 percent of funding from general funds, respectively.
$0
$100
$200
$300
$400
$500
$600
$700
$800
$900
$1,000
20122011201020092008
Mil
lio
ns
Figure C-3. Nationwide State Park Funding Source Amounts
Park
Generated
Revenue
General
Fund
Dedicated
Funds
Federal
Funds
Other
Source: AIX
Table C-1. States’ Reliance on
General Fund
% reliance on general fund
for operating budget FY 12 FY 08
0% 10 7
1-25% 9 7
26-50% 18 16
51-75% 8 13
76-100% 5 7
Source: AIX

C-4
from the general fund rose from seven to 10. The majority of states maintained or slightly
decreased reliance on general fund monies for operating expenses.62
Eight states saw decreases
in reliance over 25 percentage points.
Connecticut’s General Fund use. From FY 11 to the present, Connecticut has relied
exclusively on general fund monies for state park operating expenses, according to AIX data.
Even under the previous funding mechanism which included the use of special funds (FY 10 and
prior), Connecticut’s reliance on general fund monies was among the 10 highest ranging from 65
to 70 percent. Connecticut relies more heavily on general fund monies for state park operating
expenses than most states. Further, Connecticut was the only state that dramatically increased
systematic reliance on general fund monies between FY 08 and the present. This was due to the
elimination of the Environmental Conservation Fund and the movement of parks-related
expenditures and revenues from the Environmental Conservation Fund to the General Fund , as
discussed in Chapter II.
Park-generated revenue. State parks can
generate revenues through user fees, but there are
trade-offs involved in deciding fee structures (i.e.,
when, where, and how much), as well as
determining how much, if any, of park-generated
revenue should be used to fund park operations.
The overall shift towards greater reliance on park-
generated revenues as a funding source has been
accompanied by most states having little or no
change in the percentage reliance and a few states
(17) seeing increases of over 10 percentage points.
This movement is largely the inverse of the
movement away from general funding reliance, but
the changes in park-generated revenues have generally been within the quartiles of use, shown in
Table C-2.
There is some variation in the percentage of park-generated revenue that is used for park
operating expenses. In 32 instances, state parks kept more than 90 percent of park-generated
revenue, with another 12 states keeping between 50 and 90 percent of park-generated revenues.
Four states’ park systems kept no revenue, with only 2 states keeping some amount, but less than
half, of park-generated revenue. Connecticut is among the four states not using park-generated
revenue for state parks operations.
Self-sustainability. Few state park systems generate enough revenue through user-fees to
fund all operating expenditures without other funding mechanisms augmenting the money. For
FYs 08-12, only New Hampshire relied solely on park-generated revenue without an alternative
funding source through general funds or dedicated funds. However, other states generated
enough revenue to pay for operating costs fully, but continue to use a variety of funding sources.
62
27 states had general fund reliance changes less than 10 percentage points and another 13 states saw percentage
point decreases between 11 and 25 percent. No states increased general fund reliance over 10 percentage points and
less than 30 percentage points (Connecticut’s increase). Texas had an increase of 33 percentage points due to a one-
year change in their dedicated revenue policy in FY 2008, but this change was not systemic or ongoing.
Table C-2. States’ Reliance on
Park-Generated Revenue
% reliance on park-
generated revenues
for operating budget FY 12 FY 08
0% 4 3
1-25% 8 10
26-50% 19 20
51-75% 14 14
76-100% 5 3
Source: AIX
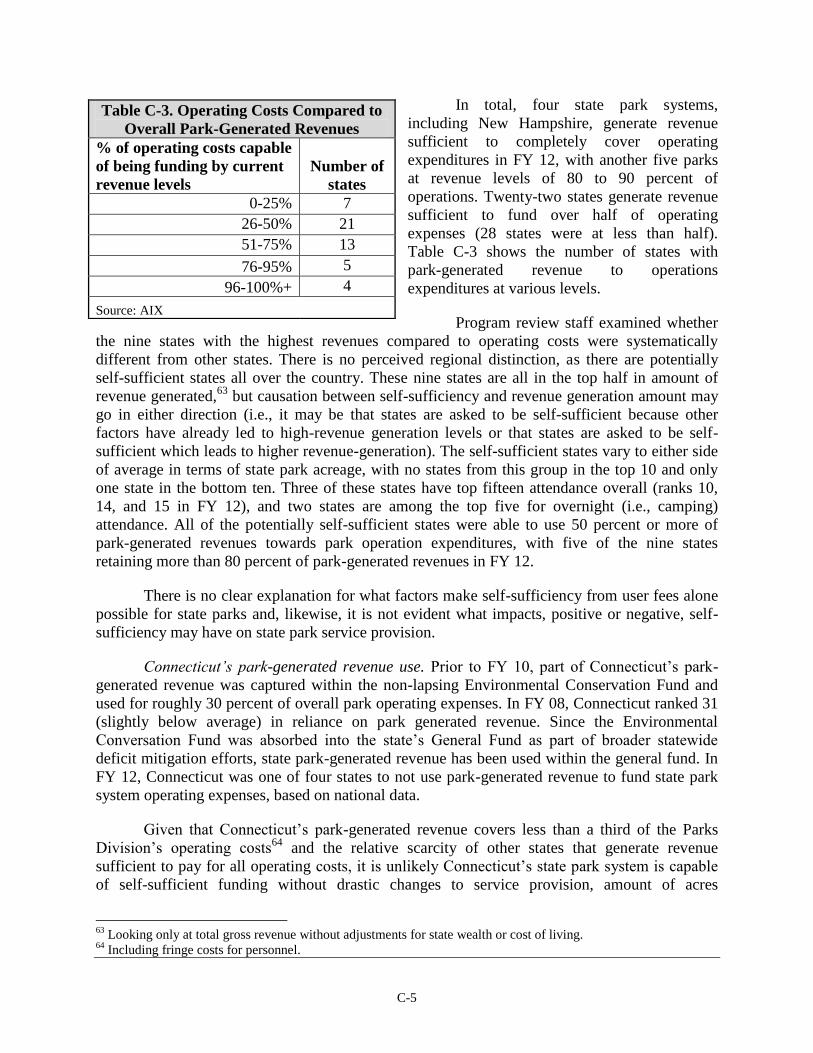
C-5
In total, four state park systems,
including New Hampshire, generate revenue
sufficient to completely cover operating
expenditures in FY 12, with another five parks
at revenue levels of 80 to 90 percent of
operations. Twenty-two states generate revenue
sufficient to fund over half of operating
expenses (28 states were at less than half).
Table C-3 shows the number of states with
park-generated revenue to operations
expenditures at various levels.
Program review staff examined whether
the nine states with the highest revenues compared to operating costs were systematically
different from other states. There is no perceived regional distinction, as there are potentially
self-sufficient states all over the country. These nine states are all in the top half in amount of
revenue generated,63
but causation between self-sufficiency and revenue generation amount may
go in either direction (i.e., it may be that states are asked to be self-sufficient because other
factors have already led to high-revenue generation levels or that states are asked to be self-
sufficient which leads to higher revenue-generation). The self-sufficient states vary to either side
of average in terms of state park acreage, with no states from this group in the top 10 and only
one state in the bottom ten. Three of these states have top fifteen attendance overall (ranks 10,
14, and 15 in FY 12), and two states are among the top five for overnight (i.e., camping)
attendance. All of the potentially self-sufficient states were able to use 50 percent or more of
park-generated revenues towards park operation expenditures, with five of the nine states
retaining more than 80 percent of park-generated revenues in FY 12.
There is no clear explanation for what factors make self-sufficiency from user fees alone
possible for state parks and, likewise, it is not evident what impacts, positive or negative, self-
sufficiency may have on state park service provision.
Connecticut’s park-generated revenue use. Prior to FY 10, part of Connecticut’s park-
generated revenue was captured within the non-lapsing Environmental Conservation Fund and
used for roughly 30 percent of overall park operating expenses. In FY 08, Connecticut ranked 31
(slightly below average) in reliance on park generated revenue. Since the Environmental
Conversation Fund was absorbed into the state’s General Fund as part of broader statewide
deficit mitigation efforts, state park-generated revenue has been used within the general fund. In
FY 12, Connecticut was one of four states to not use park-generated revenue to fund state park
system operating expenses, based on national data.
Given that Connecticut’s park-generated revenue covers less than a third of the Parks
Division’s operating costs64
and the relative scarcity of other states that generate revenue
sufficient to pay for all operating costs, it is unlikely Connecticut’s state park system is capable
of self-sufficient funding without drastic changes to service provision, amount of acres
63
Looking only at total gross revenue without adjustments for state wealth or cost of living. 64
Including fringe costs for personnel.
Table C-3. Operating Costs Compared to
Overall Park-Generated Revenues
% of operating costs capable
of being funding by current
revenue levels
Number of
states
0-25% 7
26-50% 21
51-75% 13
76-95% 5
96-100%+ 4
Source: AIX
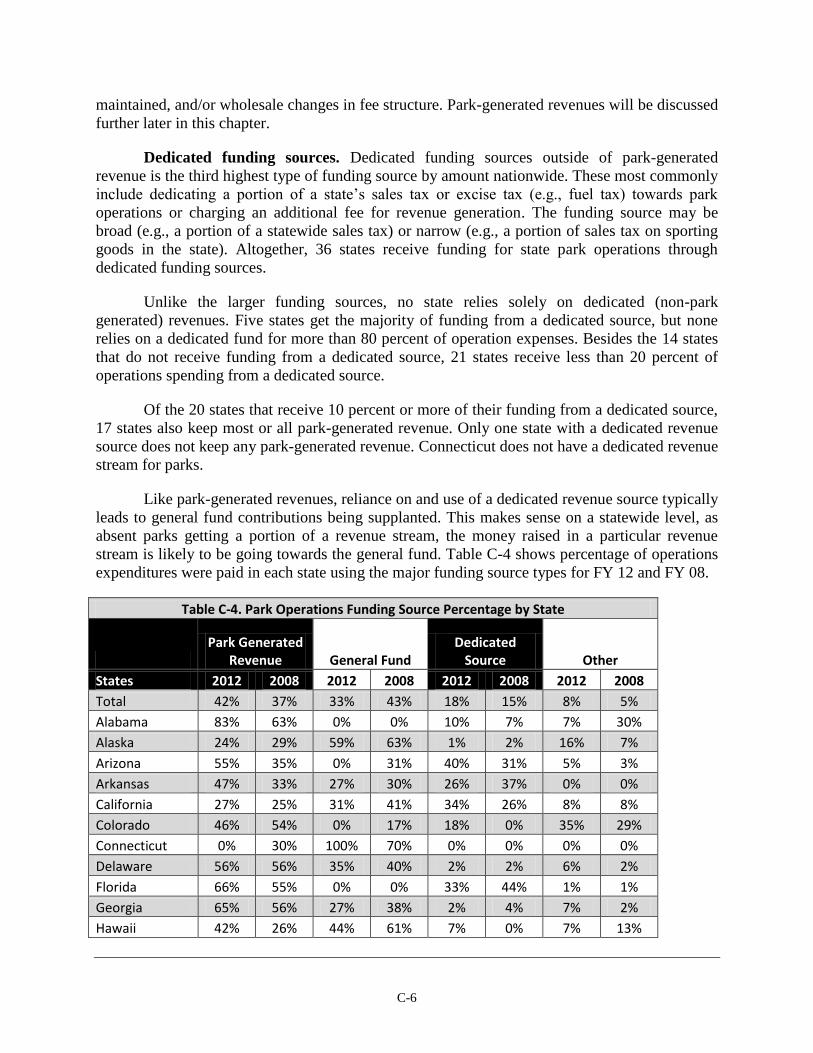
C-6
maintained, and/or wholesale changes in fee structure. Park-generated revenues will be discussed
further later in this chapter.
Dedicated funding sources. Dedicated funding sources outside of park-generated
revenue is the third highest type of funding source by amount nationwide. These most commonly
include dedicating a portion of a state’s sales tax or excise tax (e.g., fuel tax) towards park
operations or charging an additional fee for revenue generation. The funding source may be
broad (e.g., a portion of a statewide sales tax) or narrow (e.g., a portion of sales tax on sporting
goods in the state). Altogether, 36 states receive funding for state park operations through
dedicated funding sources.
Unlike the larger funding sources, no state relies solely on dedicated (non-park
generated) revenues. Five states get the majority of funding from a dedicated source, but none
relies on a dedicated fund for more than 80 percent of operation expenses. Besides the 14 states
that do not receive funding from a dedicated source, 21 states receive less than 20 percent of
operations spending from a dedicated source.
Of the 20 states that receive 10 percent or more of their funding from a dedicated source,
17 states also keep most or all park-generated revenue. Only one state with a dedicated revenue
source does not keep any park-generated revenue. Connecticut does not have a dedicated revenue
stream for parks.
Like park-generated revenues, reliance on and use of a dedicated revenue source typically
leads to general fund contributions being supplanted. This makes sense on a statewide level, as
absent parks getting a portion of a revenue stream, the money raised in a particular revenue
stream is likely to be going towards the general fund. Table C-4 shows percentage of operations
expenditures were paid in each state using the major funding source types for FY 12 and FY 08.
Table C-4. Park Operations Funding Source Percentage by State
Park Generated
Revenue General Fund Dedicated
Source Other
States 2012 2008 2012 2008 2012 2008 2012 2008
Total 42% 37% 33% 43% 18% 15% 8% 5%
Alabama 83% 63% 0% 0% 10% 7% 7% 30%
Alaska 24% 29% 59% 63% 1% 2% 16% 7%
Arizona 55% 35% 0% 31% 40% 31% 5% 3%
Arkansas 47% 33% 27% 30% 26% 37% 0% 0%
California 27% 25% 31% 41% 34% 26% 8% 8%
Colorado 46% 54% 0% 17% 18% 0% 35% 29%
Connecticut 0% 30% 100% 70% 0% 0% 0% 0%
Delaware 56% 56% 35% 40% 2% 2% 6% 2%
Florida 66% 55% 0% 0% 33% 44% 1% 1%
Georgia 65% 56% 27% 38% 2% 4% 7% 2%
Hawaii 42% 26% 44% 61% 7% 0% 7% 13%

C-7
Idaho 40% 25% 8% 43% 41% 23% 11% 8%
Illinois 22% 41% 24% 38% 54% 21% 0% 0%
Indiana 83% 76% 16% 22% 0% 0% 1% 2%
Iowa 28% 25% 41% 53% 22% 17% 9% 5%
Kansas 52% 45% 29% 44% 9% 1% 10% 11%
Kentucky 62% 69% 38% 31% 0% 0% 0% 0%
Louisiana 4% 1% 68% 94% 28% 0% 0% 5%
Maine 0% 0% 82% 80% 17% 18% 1% 2%
Maryland 34% 49% 1% 48% 62% 0% 3% 2%
Massachusetts 12% 9% 85% 89% 0% 0% 2% 2%
Michigan 74% 75% 0% 0% 26% 25% 0% 0%
Minnesota 19% 29% 22% 59% 58% 11% 1% 0%
Mississippi 64% 52% 36% 48% 0% 0% 0% 0%
Missouri 25% 18% 0% 5% 70% 76% 5% 2%
Montana 50% 36% 0% 0% 41% 57% 10% 7%
Nebraska 67% 66% 31% 31% 1% 3% 1% 0%
Nevada 42% 23% 30% 59% 14% 10% 14% 7%
New Hampshire 100% 100% 0% 0% 0% 0% 0% 0%
New Jersey 32% 11% 68% 89% 0% 0% 0% 0%
New Mexico 31% 17% 51% 48% 2% 1% 15% 34%
New York 41% 28% 56% 66% 1% 4% 2% 1%
North Carolina 19% 14% 66% 74% 0% 2% 14% 10%
North Dakota 39% 40% 56% 59% 0% 0% 5% 1%
Ohio 46% 41% 47% 54% 7% 5% 0% 0%
Oklahoma 54% 53% 38% 42% 8% 1% 0% 4%
Oregon 37% 36% 0% 0% 31% 56% 33% 8%
Pennsylvania 24% 20% 41% 75% 4% 5% 32% 0%
Rhode Island 0% 0% 100% 100% 0% 0% 0% 0%
South Carolina 84% 63% 0% 0% 0% 0% 16% 37%
South Dakota 66% 62% 14% 22% 8% 4% 13% 12%
Tennessee 42% 44% 55% 54% 0% 1% 4% 0%
Texas 25% 33% 34% 2% 39% 64% 1% 2%
Utah 66% 30% 25% 38% 2% 19% 7% 12%
Vermont 48% 87% 2% 12% 0% 0% 50% 0%
Virginia 52% 35% 48% 65% 0% 0% 0% 0%
Washington 40% 23% 15% 70% 6% 5% 39% 2%
West Virginia 58% 56% 30% 26% 12% 18% 0% 0%
Wisconsin 85% 70% 11% 24% 1% 0% 4% 7%
Wyoming 0% 0% 100% 100% 0% 0% 0% 0%
Source: AIX

C-8
OTHER STATES: METHODOLOGY
Annual Information Exchange
Program review staff relied primarily on the National Association of State Park Directors
Annual Information Exchange (AIX) data for national information and interstate comparisons.
While extremely helpful in putting Connecticut’s parks into context, there are a number of flaws
in the data, as described below.
The AIX report is based on self-reported data from each of the 50 states. Extensive
information is sought in seven areas: inventory, facilities, attendance, land, revenue, personnel,
groups. The data is gathered annually for a time period covering July 1 of one year through June
30 of the next. There may be reporting issues due to the timeframe as states use alternative fiscal
years – for instance, though the timeframe coincides with Connecticut’s fiscal year, much of the
information collected by the Parks Division is based on the calendar year. Other states may face
similar issues in reporting precisely for the time period listed. This should not be a large concern
for overall trends, but may lead to unexpected problems in any given year.
While AIX seeks data about many specific resources, there is not an industry standard for
parks operations or administrative organization, so states may vary in naming conventions of
particular features. For instance, though parks and forests are referred to mostly in combination
and interchangeably in Connecticut and in this report, operations for these two types of public
land are sometimes controlled by distinct divisions, bureaus, or even by different agencies
entirely in other states. As such, comparing the parks (i.e., parks and forests combined) of
Connecticut to the parks (excluding forests) of other states is complicated. Another example of
disparities in reporting comes regarding counts of seasonal employees. As mentioned in Chapter
II, staff learned that some states report a full count of individuals as the number of seasonal
employees, while other states report the full-time equivalent of seasonal work, regardless of the
number of individuals hired.
Committee staff was in position to compare state park data from DEEP with the
information reported to AIX regarding Connecticut. One major discrepancy is the inclusion of
fringe costs in the total operational costs reported to AIX whereas most operation costs
descriptions from DEEP exclude fringe costs. Both depictions are accurate, but, short of
surveying all fifty states, it is not possible to determine whether fringe costs are included or
excluded from operating costs elsewhere.
There are also instances were DEEP is overgeneralizing or misreporting data for the AIX
reports. As an example, AIX reports for years before DEEP’s Environmental Conservation Fund
was eliminated indicate that 100 percent of park-generated revenue was used as a funding source
for operations, when, as discussed in Chapter II, actual expense information shows that a bit less
than half of park-generated revenue was going back to the Parks Division, with some portion
going to the General Fund and the rest going to a variety of related expenses within the
Environmental Conservation Fund. This issue is not limited to Connecticut, as there are some
instances where another state mislabels funding or revenue within the catchall “other” categories,
rather than in a more appropriate named category. As with most collections of raw data,

C-9
representations of broad characteristics for the entire data set, in this case the nationwide data,
are likely to be less error-prone than specific, direct comparisons between states.
Case Studies
As a supplement to the AIX information, committee staff interviewed state parks
personnel in Missouri, Minnesota, New York, and Pennsylvania, as well as conducting email
correspondence with personnel in Massachusetts. These parks were selected for further study
because of their similarity to Connecticut’s parks in some respect (including size and number of
parks), their proximity to Connecticut, or being mentioned in national literature as successful and
notable organizations (though no state matched all three criteria areas). Table C-5 provides a
summary of some key points about the state park system in each case study state. Total park
acreage was considered in narrowing the list of comparable states before the discrepancies
surrounding reporting of forest acres was established. Committee staff contacted at least one
state per funding group except New Hampshire, as the study found Connecticut is unlikely to be
able to operate parks purely from park-generated revenues.
Table C-5. Summary of Key Indicators of Selected Other States
Possible
Comparable
States
Park
Acres
Total
Park
Revenue
General
Fund
Dedicated
Fund Other
Total Operating
Funds
Operations $
/acre
New Hampshire 233,071 100% 0% 0% 0% $15,224,193 $65
Michigan 292,721 74% 0% 26% 0% $55,403,403 $189
Missouri 204,331 25% 0% 70% 5% $28,871,747 $141
Minnesota 284,131 19% 22% 58% 1% $76,400,000 $269
Pennsylvania 297,055 24% 41% 4% 32% $84,839,000 $286
New Mexico 196,677 31% 51% 2% 15% $18,027,806 $92
Tennessee 190,144 42% 55% 0% 4% $80,893,200 $425
New York 1,351,569 41% 56% 1% 2% $214,266,000 $159
North Carolina 215,404 19% 66% 0% 14% $33,764,282 $157
New Jersey 441,110 32% 68% 0% 0% $28,609,930 $65
Massachusetts 353,889 12% 85% 0% 2% $61,069,895 $173
Connecticut 206,633 0% 100% 0% 0% $17,756,210 $86
Source: AIX FY 12.
Notes: Colors in the first six columns group states with similar distributions of funding sources.
Colors in the last two columns show funding amounts relative to all fifty states, with the highest funding in bright green, the
lowest funding in bright red, and average funding in yellow.
Additional states were considered for further study because of particular features or
funding mechanisms, including several that warranted more extensive web research, such as
Texas and Washington.
Table C-6 shows some staff and park size comparisons between Connecticut and selected
case study states. As discussed in Chapter IV, some states reported number of seasonal staff by
individuals and others by full time equivalent, so comparisons are difficult to interpret absence
definitive knowledge of the way in which states reported.

C-10
Table C-6. Selected Comparisons to Case Study States
Acres Per
Total Staff
(full-time and
seasonal)
Seasonal and
Part Time Staff
Per Full Time
Staff
Visitors Per
Total Staff
(full-time and
seasonal) Acres Per Park
STATE # Ranking # Ranking # Ranking # Ranking
Connecticut 332 12 5.29 6 12,009 26 1497 29
Massachusetts 225 22 2.00 25 19,314 13 1044 34
Minnesota 274 17 2.55 17 7,895 38 159 49
Missouri 310 14 0.21 46 29,299 9 2404 17
New York 216 23 2.53 18 9,326 34 952 36
Pennsylvania 213 24 1.41 32 27,661 10 2475 16
Source: AIX
While particular features of case study states are mentioned throughout the report, Table
C-7 summarizes some key factors of the funding mechanisms in case study states.
Table C-7. Funding Mechanism Comparisons with Case Study States
STATE
Charges Entrance
Fee
Keeps Park-
Generated Revenue
Non-Park Dedicated Revenue Notes
Connecticut Y N N Eliminated EC Fund in 2009
Massachusetts Y Y N
Highest General Fund Reliance of states that use some portion of park-generated
revenue for park operations
Minnesota Y Y Sales Tax Legacy Sales Tax source added in 2008
Missouri N Y Sales Tax Sales tax is Constitutional and up for re-
approval every 10 years
New York Y Y N Recent implementation of performance
measurement
Pennsylvania N Y Energy Lease
Used to retain 25% of revenue for capital expenses in non-lapsing fund, but fund was swept. Now all park revenue is
appropriated for operations.
Source: AIX and PRI Staff Interviews with State Park Personnel

D-1
Appendix D Park Management Unit Expenses
Table D-1. Parks Division Expenditures by Unit* (FY 13)
Mgt Unit TOTAL Payroll
% of
Unit
Expenses Other
% of
Unit
Expenses
% of
Parks
Division
Expenses
Burr Pond $231,939 $204,606 88% $27,333 12% 2%
Cockaponsett $443,706 $346,669 78% $97,037 22% 3%
Dinosaur $344,268 $277,131 80% $67,137 20% 3%
Director $825,645 $608,969 74% $216,676 26% 6%
East Distr HQ $104,925 $97,727 93% $7,198 7% 1%
Ft. Trumbull $422,802 $278,956 66% $143,846 34% 3%
Gillette Castle $530,276 $397,185 75% $133,091 25% 4%
Hammonasset $1,364,605 $941,753 69% $422,852 31% 11%
Harkness $1,327,457 $528,916 40% $798,541 60% 10%
Kellogg,Osborne& Goodwin $461,782 $343,780 74% $118,002 26% 4%
Lake Waramaug $212,264 $160,667 76% $51,597 24% 2%
Macedonia $286,886 $169,096 59% $117,790 41% 2%
Mashamoquet $395,250 $308,015 78% $87,235 22% 3%
Osborndale $432,903 $359,151 83% $73,752 17% 3%
Pauchaug $652,780 $487,748 75% $165,032 25% 5%
Penwood $385,060 $315,203 82% $69,857 18% 3%
Peoples $234,026 $182,052 78% $51,974 22% 2%
Public Outreach $291,213 $278,416 96% $12,797 4% 2%
Putnam $507,280 $413,184 81% $94,096 19% 4%
Rocky Neck $775,647 $606,684 78% $168,963 22% 6%
Salmon River $337,705 $264,617 78% $73,088 22% 3%
Shenipsit $137,346 $96,611 70% $40,735 30% 1%
Sherwood Island $622,808 $453,020 73% $169,788 27% 5%
Sleeping Giant $413,353 $336,856 81% $76,497 19% 3%
Squantz Pond $287,786 $221,471 77% $66,315 23% 2%
Topsmead $521,106 $401,073 77% $120,033 23% 4%
West Distr HQ $258,831 $152,557 59% $106,274 41% 2%
Grand Total $12,809,649 $9,232,113 72% $3,577,536 28% 100%
Source: DEEP
*Includes sub-divisions other than 23 park management units.
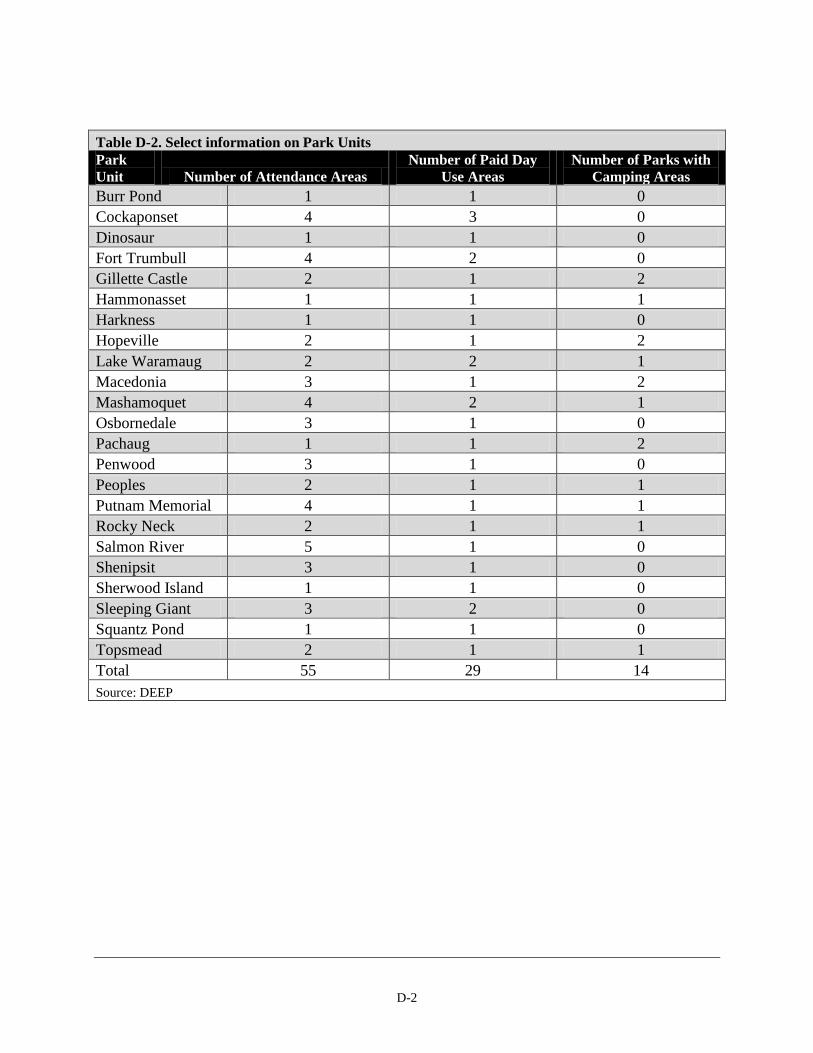
D-2
Table D-2. Select information on Park Units
Park
Unit Number of Attendance Areas
Number of Paid Day
Use Areas
Number of Parks with
Camping Areas
Burr Pond 1 1 0
Cockaponset 4 3 0
Dinosaur 1 1 0
Fort Trumbull 4 2 0
Gillette Castle 2 1 2
Hammonasset 1 1 1
Harkness 1 1 0
Hopeville 2 1 2
Lake Waramaug 2 2 1
Macedonia 3 1 2
Mashamoquet 4 2 1
Osbornedale 3 1 0
Pachaug 1 1 2
Penwood 3 1 0
Peoples 2 1 1
Putnam Memorial 4 1 1
Rocky Neck 2 1 1
Salmon River 5 1 0
Shenipsit 3 1 0
Sherwood Island 1 1 0
Sleeping Giant 3 2 0
Squantz Pond 1 1 0
Topsmead 2 1 1
Total 55 29 14
Source: DEEP

E-1
Appendix E CHA’s Infrastructure Conditions Assessment Prioritization Criteria
The Clough, Harbour and Associate’s Infrastructure Conditions Assessment prioritization
criteria was one part of a project prioritization tool provided to the Parks Division at the
conclusion of the study. The following shows the criteria summary:
Project
Priorities
Column Project Performance Goals
Priority
Value for
Each
Category
A Would alleviate or eliminate a potential or real threat to the health, safety and welfare of
the public/staff.
100
B Would result in more efficient maintenance and / or operation of the park or park
facility.
80
C Project will protect natural resources(s). 90
D Project will protect a historic/archaeological resource 70
E Project enhances park patron’s interaction with the environment. 60
F Project addresses issues of importance not described by other criteria 50
G Preserve or enhance a park activity 40
H
I
Urgency
Identifiers: Description of Urgency Value of
Multiplier
I
(“Urgent!”)
The problems this Project resolves are very serious. This Project needs immediate
attention as soon as possible. 1.5
II
(“In one
year”)
The problems this Project resolves are somewhat serious. This Project needs attention
within one year. 1.2
III
(“In three
years”)
The problems this Project resolves are slightly more serious than others of the same
description in other similar structures in the park system. 1.1