state of wyoming department of workforce services division ... · state; and • the needs of...
TRANSCRIPT

San Diego State University Interwork Institute
State of Wyoming Department of Workforce Services
Division of Vocational Rehabilitation And
The State Rehabilitation Council Comprehensive Statewide Needs Assessment
Report
May 31, 2019
Prepared by: Chaz Compton, Ed.D., CRC
Melissa Kronberger, R.A. Rachel Anderson, MS, CRC
Mark Tucker, Ph.D., CRC

ACKNOWLEDGEMENTS
The Interwork Institute at San Diego State University (SDSU) thanks the following individuals for their assistance in conducting the Comprehensive Statewide Needs Assessment (CSNA) on behalf of the State of Wyoming’s Division of Vocational Rehabilitation and the State Rehabilitation Council. These individuals were instrumental in helping to ensure the research activities associated with this needs assessment were completed successfully:
Jeff White, Deputy Administrator
Brian Hickman, Program Coordinator
In addition, the project team thanks the Division Administrator, Jim McIntosh, and the Director of the Wyoming Department of Workforce Services, Ms. Robin Sessions Cooley, for their support and commitment to the CSNA process. The project team also expresses their appreciation to each individual who took the time to share their thoughts by completing a survey, taking part in an interview, and/or participating in the focus group research.

DVR 2018 CSNA 3
EXECUTIVE SUMMARY
The State of Wyoming, Department of Workforce Services, Division of Vocational Rehabilitation (DVR), the State Rehabilitation Council and the Interwork Institute at San Diego State University jointly conducted an assessment of the vocational rehabilitation needs of individuals with disabilities residing in the State of Wyoming. A triennial needs assessment is required by the Rehabilitation Act of 1973 as amended by Title IV of the Workforce Innovation and Opportunity Act (WIOA) and is intended to help inform the Unified State Plan developed by the core partners in Wyoming’s Workforce Development System. The data was gathered, analyzed and grouped into the sections listed below. A summary of key findings in each section is contained here. The full results are found in the body of the report.
Section One: Overall Performance of DVR
Recurring themes in this area include:
• The staff at DVR was characterized as caring and committed to serving individuals with disabilities. The participants in the CSNA were overwhelmingly positive in their comments about the organization.
• Most of the participants in the CSNA believe that DVR’s emphasis on youth is positive and is the correct path for the agency to follow into the future, but there is some concern about how the emphasis on serving youth will affect services to adults.
• Turnover was mentioned multiple times as a barrier to the effectiveness of DVR and the timely provision of services. Turnover was mentioned as a concern at the agency and provider level.
• The rural nature of Wyoming presents significant challenges to the delivery of rehabilitation services and the ability of individuals with disabilities living in these areas to participate in vocational rehabilitation.
Section Two: The needs of individuals with the most significant disabilities, including their need for supported employment
Recurring themes in this area include:
• Transportation remains the most significant need of consumers served by DVR, and this is especially true in rural areas.
• DVR is serving an increasing number of individuals with mental health impairments and their staff need to receive ongoing training on how to effectively serve this population.
• In addition to transportation, there is a need for increased job skills, education and training for individuals with disabilities, especially those with the most significant disabilities to prepare for, obtain and retain employment in Wyoming.
• The fear of benefit loss adversely affects the return-to-work behavior of Social Security beneficiaries.
• DVR needs to develop their capacity and the capacity of their service providers to deliver customized employment services.

DVR 2018 CSNA 4
• Employer perceptions about the ability of individuals with disabilities to perform the essential functions of jobs is a barrier to employment in Wyoming.
Section Three: The needs of individuals with disabilities from different ethnic groups, including needs of individuals who have been unserved or underserved by the VR program
Recurring themes in this area include:
• Individuals with disabilities living in the rural areas of Wyoming were the most frequently mentioned underserved group. The lack of public transportation and the distance that has to be travelled to get to the DVR offices or to work was the primary reason noted for being underserved.
• The need for work skills, education, training and rehabilitation professionals that speak their language were the most frequently noted needs of individuals from diverse cultures.
• Deaf individuals and blind individuals were characterized as potentially underserved by DVR.
Section Four: The needs of youth and students with individuals with disabilities in transition
Recurring themes in this area include:
• All of the five required pre-employment transition services represent significant rehabilitation needs of students with disabilities in Wyoming, with work-based learning experiences being the most significant and important need.
• Transportation is a major barrier for students and their ability to experience work. • In addition to transportation, the primary rehabilitation needs of youth with disabilities in
Wyoming are work skills, soft skills, education and training
Section Five: The needs of individuals with disabilities served through other components of the statewide Workforce Development System
Recurring themes in this area include:
• The relationship of the Wyoming Workforce Centers with VR goes beyond referral in many instances to include braided funding and shared planning.
• Ongoing consistent cross-training between the core partners is a need so that staff are aware of how each other’s programs function and what limitations in service exist.
• Wyoming Workforce Center staff need to receive ongoing training on how to effectively work with individuals with disabilities, especially those with mental health impairments.
Section Six: The need to establish, develop or improve Community Rehabilitation Programs in Wyoming
Recurring themes in this area include:
• The need to develop service providers is greatest in the rural areas, especially providers for supported and customized employment.
• There is a need for service providers that are skilled in working with individuals with mental health impairments and other most significant disabilities.

DVR 2018 CSNA 5
• There is a need to develop providers that can sign and have experience working with deaf individuals.
Section Seven: The needs of businesses
This category captures the needs of businesses in Wyoming as it relates to recruiting, hiring, retaining and accommodating individuals with disabilities. It includes an analysis of how DVR serves business and tries to meet their needs in each of these areas.
Recurring themes in this area include:
• The most frequent feedback received from participants across all research methods regarding employers was the need to educate them and reduce the biases held about the abilities of individuals with disabilities. Employers were frequently characterized as fearful about hiring individuals with disabilities and about their capacity to perform the essential functions of many jobs.
• In order to improve their effectiveness in serving employers, DVR will need to increase the number of staff responsible for outreach and service to employers.
• DVR needs to strengthen their relationship with the Employment and Training Division’s Employment Specialists to increase outreach to employers and enhance their effectiveness in serving employers in Wyoming.
The project team provides recommendations associated with some of the needs identified in each of the categories. It is understood that many of the recommendations require the collaboration and partnership of multiple agencies over an extended period of time. Some of the recommendations may be much easier to adopt and implement than others. The project team offers the recommendations with this awareness and hopes that DVR, the SRC and other stakeholders will find these recommendations helpful.

DVR 2018 CSNA 6
Table of Contents ACKNOWLEDGEMENTS ...................................................................................................................... 2
EXECUTIVE SUMMARY ...................................................................................................................... 3
IMPETUS FOR NEEDS ASSESSMENT ................................................................................................ 7
PURPOSE OF NEEDS ASSESSMENT AND UTILIZATION OF RESULTS ...................................... 7
FINDINGS .............................................................................................................................................. 13
SECTION ONE: OVERALL AGENCY PERFORMANCE ................................................................ 14
SECTION TWO: NEEDS OF INDIVIDUALS WITH THE MOST SIGNIFICANT DISABILITIES, INCLUDING THEIR NEED FOR SUPPORTED EMPLOYMENT .................................................... 52
SECTION THREE: NEEDS OF INDIVIDUALS WITH DISABILITIES FROM DIFFERENT ETHNIC GROUPS, INCLUDING NEEDS OF INDIVIDUALS WHO MAY HAVE BEEN UNSERVED OR UNDERSERVED BY THE VR PROGRAM ........................................................... 70
SECTION FOUR: NEEDS OF YOUTH WITH DISABILITIES IN TRANSITION ........................... 79
SECTION FIVE: NEEDS OF INDIVIDUALS WITH DISABILITIES SERVED THROUGH OTHER COMPONENTS OF THE STATEWIDE WORKFORCE DEVELOPMENT SYSTEM ..................... 88
SECTION SIX: NEED TO ESTABLISH, DEVELOP OR IMPROVE COMMUNITY REHABILITATION PROGRAMS IN WYOMING ............................................................................. 98
SECTION SEVEN: NEEDS OF BUSINESS AND EFFECTIVENESS IN SERVING EMPLOYERS .............................................................................................................................................................. 112
CONCLUSION ..................................................................................................................................... 120
APPENDICES ...................................................................................................................................... 121

DVR 2018 CSNA 7
IMPETUS FOR NEEDS ASSESSMENT
Title IV of the Workforce Innovation and Opportunity Act (WIOA) contains the Rehabilitation Act of 1973 as amended. Section 412 of the Rehabilitation Act and Title 34 of the Code of Federal Regulations, Section 361.29 requires all state vocational rehabilitation agencies to assess the rehabilitation needs of individuals with disabilities within their respective State and relate the planning of programs and services and the establishment of goals and priorities to their needs. According to Section 102 of WIOA and Section 412 of the Rehabilitation Act, each participating State shall submit a Unified or Combined State Plan every four years, with a biannual modification, as needed. In addition, Title 34 of the Code of Federal Regulations (CFR) Section 361.29 indicates that: The State Plan must include the “results of a comprehensive, statewide assessment, jointly conducted by the designated State unit and the State Rehabilitation Council every three years describing the rehabilitation needs of individuals with disabilities residing within the State.” In response to this mandate, and to ensure that adequate efforts are being made to serve the diverse needs of individuals with disabilities in Wyoming, the Division of Vocational Rehabilitation (DVR), in partnership with the State Rehabilitation Council (SRC), entered into a contract with the Interwork Institute at San Diego State University for the purpose of jointly developing and implementing the Comprehensive Statewide Needs Assessment (CSNA) of the vocational rehabilitation needs of individuals with disabilities residing in Wyoming.
PURPOSE OF NEEDS ASSESSMENT AND UTILIZATION OF RESULTS
The purpose of the CSNA is to identify and describe the rehabilitation needs of individuals with disabilities residing within Wyoming. In particular, the CSNA seeks to provide information on:
• The overall performance of DVR as it relates to meeting the rehabilitation needs of individuals with disabilities in the State;
• The rehabilitation needs of individuals with the most significant disabilities, including their need for supported employment services;
• The rehabilitation needs of individuals with disabilities who are minorities and those who may have been unserved or underserved by the vocational rehabilitation program;
• The rehabilitation needs of youth and students with disabilities in transition, including their need for pre-employment transition services;
• The rehabilitation needs of individuals with disabilities served through other components of the statewide workforce development system;
• The need to establish, develop and/or improve community rehabilitation programs within the State; and
• The needs of businesses in recruiting, hiring, accommodating and retaining individuals with disabilities.
It is expected that data from the needs assessment effort will provide DVR and the SRC with direction when creating the VR portion of the Unified State Plan and when planning for future program development, outreach and resource allocation. This CSNA covers quantitative data for Federal Fiscal Years (FFY) 2015 through 2018, and qualitative data through September 2018.

DVR 2018 CSNA 8
METHODOLOGY
The Comprehensive Statewide Needs Assessment was conducted using qualitative and quantitative methods of inquiry. The specific methods for gathering the data used in this assessment are detailed below.
Analysis of Existing Data Sources
The project team at SDSU reviewed a variety of existing data sources for the purposes of identifying and describing demographic data within Wyoming including the total possible target population and sub-populations potentially served by DVR. Data relevant to the population of Wyoming, the population of individuals with disabilities in Wyoming, ethnicity of individuals, the number of Veterans, income level, educational levels and other relevant population characteristics were utilized in this analysis. Sources analyzed include the following:
• The 2017 American Community Survey: One- and Five-Year Estimates; • US Census Annual Estimates of Resident Population, 2017; • 2018 Social Security Administration SSI/DI Data; • The Wyoming Department of Education; • US and Wyoming Bureau of Labor Statistics; • Wyoming Department of Workforce Services; • Cornell University’s Disabilitystatistics.org; • DVR case service data compiled at the request of the project team; and • The Federal Rehabilitation Services Administration’s RSA 911 data for DVR and data
submitted and entered into RSA’s Management Information System (MIS).
Key Informant and Focus Group Interviews
Instrument. The instruments used for the key informant and focus group interviews (Appendix A) were developed by the researchers at SDSU and reviewed and revised by DVR. The interview protocols act as guides for the interview process and were not limiting in their scope. The project team was able to adapt the questions and focus areas as needed and appropriate.
Interview population. The key informant and focus group population consisted of DVR staff, community partners, individuals with disabilities and business members. A total of 31 people were interviewed for this assessment. The interviews were conducted in Cheyenne and Casper during the month of October 2018. Individuals, DVR staff members, partners and businesses that were interested in participating in an interview or focus group were requested to contact the CSNA Project Coordinator at DVR to schedule an appointment. DVR staff volunteered to participate when the project teams visited the Districts. Tables 1 and 2 identify the total participants by type and group for Cheyenne and Casper, while Table 3 includes the combined totals. The exact dates that the interviews were held are included in the tables below. There were four phone interviews conducted and these are included in the statewide totals in Table 3.

DVR 2018 CSNA 9
Table 1 Cheyenne Interview Totals
Interview Totals by Type and Group for Wyoming DVR - Cheyenne (Oct. 8-10)
Research Method Research Group and Count Consumer Partner Staff Total
Individual Interview 2 2 10 14 Focus Group Participants 0 0 2 2 Total participants 2 2 12 16
Table 2 Casper Interview Totals
Interview Totals by Type and Group for Wyoming DVR - Casper (Oct. 22-23)
Research Method Research Group and Count Consumer Partner Staff Total
Individual Interview 2 0 1 3 Focus Group Participants 0 3 7 10 Total participants 2 3 8 13
Table 3 Statewide Interview Totals
Interview Totals by Type and Group for Wyoming VR - All
Research Method Research Group and Count Consumer Partner Staff Total
Individual Interview 4 4 11 19 Focus Group Participants 0 3 9 12 Total participants 4 7 20 31
Data collection. All of the individual and focus group interviews except four were conducted face-to-face. The general format of the interviews was consistent between participants regardless of their group. First, participants were asked questions to ascertain their personal and professional experience with or knowledge of DVR. Participants were then asked open-ended questions about their perceptions of the needs of individuals with disabilities in Wyoming. Finally, participants were asked to share their perceptions of how DVR could improve their ability to help meet these needs, especially as it relates to helping consumers obtain and retain employment.
The consumer and partner interview totals were lower than expected, possibly as a result of the survey completions being considered sufficient input on the part of respondents. There were no businesses interviewed as part of this CSNA, despite efforts to recruit them to participate by methods other than a survey.
Efforts to ensure respondent anonymity. Names and other identifying characteristics were not shared with anyone by the interviewers. Participants were informed that their responses would be treated as anonymous information, would not be reported with information that could be used to

DVR 2018 CSNA 10
identify them, and would be consolidated with information from other respondents before results were reported.
Data analysis. The interviewers took notes on the discussions as they occurred. The notes were transcribed and analyzed by the researchers at SDSU. Themes or concerns that surfaced with consistency across interviews were identified and are reported as common themes in the report narrative. In order to be identified as a recurring theme, it had to occur at least three different times and it had to occur across groups if it applied to the different populations participating in the study. For instance, in order for transportation to be identified as a rehabilitation need, it would have had to have been identified as a need in at least three individual interviews or focus groups, and would need to have been identified by individuals with disabilities, staff and/or partners.
Surveys
Instruments. The instruments used for the electronic surveys of individuals with disabilities, community partners, DVR staff and businesses were developed by the project team and reviewed and revised by DVR and the State Rehabilitation Council (SRC). These surveys are contained in Appendices B-E.
Survey population. Individuals identified for participation in this survey effort can be described as individuals with disabilities who are potential, current or former clients of DVR. Community partners include representatives of organizations that provide services, coordinate services, or serve an advocacy role for persons with disabilities in Wyoming. DVR staff members include those working for the organization in October 2018, and businesses include employers that DVR had a valid email address for during the survey period.
Data collection. Data was gathered from the different populations through the use of an internet-based survey. DVR and community programs serving individuals with disabilities, broadly dispersed the electronic survey via an e-mail invitation. The individual survey included a random sample mailing of 400 hard copy surveys to current or former consumers in addition to the electronic version. Partners, DVR staff and businesses received only the electronic version. In partnership with the SRC, DVR identified individuals with disabilities, partners, staff and businesses and invited them to participate in the electronic survey effort via e-mail. Once the survey was active, DVR sent an invitation and link to the survey by e-mail. Approximately two weeks after the distribution of the initial invitation, another electronic notice was sent as both a “thank you” to those who had completed the survey and as a reminder to those who had not. Survey responses collected through the electronic survey approach were then analyzed using Qualtrics.
Efforts to ensure respondent anonymity. Respondents to the individual survey were not asked to identify themselves when completing the survey. In addition, responses to the electronic surveys were aggregated by the project team at SDSU prior to reporting results, which served to further obscure the identities of individual survey respondents.

DVR 2018 CSNA 11
Accessibility. The electronic survey was designed using an accessible, internet-based survey application. Respondents were provided with the name and contact information of the Project Director at SDSU in order to place requests for other alternate survey formats.
Data analysis. Data analysis consisted of computing frequencies and descriptive statistics for the survey items with fixed response options. Open-ended survey questions, which yielded narrative responses from individuals, were analyzed by the researchers for themes or concepts that were expressed consistently by respondents.
Number of completed surveys. A total of 276 valid surveys were submitted by the different groups. A survey is considered valid if an individual completed the survey, even if they did not answer all of the questions. If an individual started a survey and did not complete it, it was considered invalid. It is difficult to gauge the return rate of the surveys as many of the e-mail notices and invitations to take the survey could have come from forwarded email invitations. The survey totals for the different groups are detailed below:
Individuals with disabilities or their family members or care providers = 198
Community Partners = 42
DVR staff = 32
Businesses = 4
Table 4 summarizes the totals for all of the different groups are this study.
Table 4 Totals for all Research Methods
Data Collection Totals by Type and Group for 2018-19 Wyoming DVR CSNA
Research Method Research Group and Count Consumer Partner Staff Business Total
Electronic Survey 198 42 32 4 276 Individual Interview 4 4 11 0 19 Focus Group 0 3 9 0 12 Total participants 202 49 52 4 307
There were 307 individuals that participated in this CSNA in some form or another. The project team is confident that the information gathered accurately and thoroughly captures the vocational rehabilitation needs of individuals with disabilities in Wyoming. The project team will have recommendations related to increasing the face-to-face interview numbers for consumers and businesses in future iterations of the CSNA.
Analysis and Triangulation of Data
The data gathered from the national and agency-specific data sets, key informant interviews, surveys and focus groups were analyzed by the researchers on the project team. The common themes that emerged regarding needs of persons with disabilities from each data source were identified and compared to each other to validate the existence of needs, especially as they

DVR 2018 CSNA 12
pertained to the target populations of this assessment. These common themes are identified and discussed in the Findings section.
Dissemination Plans
The CSNA report is delivered to DVR and the SRC. We recommend that DVR publish the report on their website for public access.
Study Limitations
Inherent in any type of research effort are limitations that may constrain the utility of the data that is generated. Therefore, it is important to highlight some of the most significant issues that may limit the ability to generalize the needs assessment findings to larger populations. Inherent in the methods used to collect data is the potential for bias in the selection of participants. The findings that are reported reflect only the responses of those who could be reached and who were willing to participate. The information gathered from respondents may not accurately represent the broader opinions or concerns of all potential constituents and stakeholders. Data gathered from consumers, for example, may reflect only the needs of individuals who are already recipients of services, to the exclusion of those who are not presently served. Although efforts were made to gather information from a variety of stakeholders in the vocational rehabilitation process, it would be imprudent to conclude with certainty that those who contributed to the focus groups and the key informant interviews constitute a fully representative sample of all of the potential stakeholders in the vocational rehabilitation process in Wyoming.

DVR 2018 CSNA 13
FINDINGS Section 1: Overall agency performance
Section 2: Needs of individuals with the most significant disabilities, including their need for supported employment
Section 3: Needs of individuals with disabilities that are minorities, including needs of individuals who have been unserved or underserved by the VR program
Section 4: Needs of youth and students with disabilities in transition
Section 5: Needs of individuals with disabilities served through other components of the statewide workforce development system
Section 6: Need to establish, develop or improve community rehabilitation programs in Wyoming
Section 7: Needs of businesses and effectiveness in serving employers

DVR 2018 CSNA 14
SECTION ONE: OVERALL AGENCY PERFORMANCE
The first section of the CSNA reports on areas of general performance by DVR. General performance refers to how well DVR is fulfilling its mission of assisting individuals with disabilities to increase their independence and employment. The area of general performance also refers to how effectively DVR performs the processes that facilitate case movement through the stages of the rehabilitation process, how well DVR adheres to the timelines for this case movement identified in the Rehabilitation Act of 1973 as amended by WIOA, and DVR’s policies and procedures. Finally, overall performance also refers to how successfully DVR achieves their common performance measures and the quantity and quality of employment outcomes achieved by their consumers.
The structure of this section, as well as the following sections, will include the following:
1. Data that pertains to the section in question, including observations based on the data; 2. Electronic and hard copy survey results pertaining to the section; 3. Recurring/consensual themes that emerged during the individual interviews and focus
groups; and 4. Recommendations to address the findings in each area of the assessment.
The time-period covered by the data in this Comprehensive Statewide Needs Assessment is the three-year period from October 1, 2015 – September 30, 2018. The data on agency performance included in this section comes from the case management system used by DVR and is compared to the available RSA 911 data submitted by DVR where available.
Recurring Themes Across all Data Collection Methods
The following recurring themes emerged in the area of Overall Agency Performance:
• The staff at DVR was characterized as caring and committed to serving individuals with disabilities. The participants in the CSNA were overwhelmingly positive in their comments about the organization.
• Most of the participants in the CSNA believe that DVR’s emphasis on youth is positive and is the correct path for the agency to follow into the future, but there is some concern about how the emphasis on serving youth will affect services to adults.
• Turnover was mentioned multiple times as a barrier to the effectiveness of DVR and the timely provision of services. Turnover was mentioned as a concern at the agency and provider level.

DVR 2018 CSNA 15
NATIONAL, STATE, LOCAL AND AGENCY SPECIFIC DATA RELATED TO OVERALL AGENCY PERFORMANCE
The project team gathered data from national and state data sets to provide information to DVR and to interested parties related to population, disability prevalence, income, poverty, educational attainment, unemployment, and labor force participation in Wyoming. Where available, we have included information specific to the DVR service areas. The project team is hopeful that this information will provide DVR and their partners with data that can guide resource allocation and future planning.
General Trends of the VR Service Area with State and National Comparisons
The State of Wyoming is comprised of 23 counties. The State VR system is divided into four Workforce Areas. The map provided is from the Wyoming Department of Workforce Services. Table 5 is a table of codes for the service Areas with details on the Counties served. Map #1 --- Wyoming Workforce Services Locations
http://wyomingworkforce.org/contact/all/

DVR 2018 CSNA 16
Table 5 Area Offices, Codes, and Counties Served
Area Office Code Counties Served Area 1 A1 Albany, Carbon, Goshen, Laramie, Platte
Area 2 A2 Campbell, Converse, Crook, Johnson, Natrona, Niobrara, Sheridan, Weston
Area 3 A3 Big Horn, Fremont, Hot Springs, Park, Washakie Area 4 A4 Lincoln, Sublette, Sweetwater, Teton, Uinta
Wyoming is located in the mountain region of the Western United States. The western two thirds of the state are covered primarily with mountain ranges and rangelands in the foothills of the Eastern Rocky Mountains. The eastern third of the state is high elevation prairie known as the High Plains. The total square miles for the State are 97,813 (97,093 square miles of land and 720 square miles of water).
The US Census Bureau defines urban areas as “densely developed residential, commercial, and other non‐residential areas” and defines rural areas as “areas not included in urban areas.” In 2012, the US Census Bureau reported that approximately 0.2% of Wyoming’s total land area is classified as urban (approximately 195 square miles) and 99.8% of Wyoming’s land space is comprised of rural areas (approximately 96,899 square miles). The report stated that approximately 64.8% of the Wyoming’s total population resides in urban areas and 35.2% of the population resides in rural areas. In contrast, 80.7% of the Nation’s population reside in urban areas and 19.3% reside in rural areas. Overall, the State is considered to be sparsely populated with an average of the 5.8 people per square mile.
The State contains 2 urbanized areas and 20 urban clusters. Laramie County and Natrona County, which contain the cities of Cheyenne (Laramie), and Casper (Natrona), account for the 2 urbanized areas within the State. The population density of Cheyenne is 2,425.2 people per square mile, making Laramie County the area with the highest overall population density (34.2 people per square mile) of the State. The population density of Casper is 2,056.4 people per square mile. Niobrara County has the lowest average of number of people (0.9) per square mile, with all residents residing in rural areas.
Population
Wyoming makes up approximately .17% of the population in the United States. In December 2017, Wyoming was ranked as the 51st most populous area in the Nation (which includes the District of Columbia), based on July 2017 population projections. Wyoming has the smallest population in the United States, with slightly more than half a million residents and had the highest negative population growth rate in 2017 (-0.97%).
Area 2 has the highest percentage of residents, making up 33.7% of the State’s population, followed by Area 1, which makes up approximately 30 % of the State’s population. Area 3 has

DVR 2018 CSNA 17
the lowest average population (16.2%) of the State. Table 6 details the Area population rates for the State.
Table 6 Local Area Population Rate, December 2017
Area Total Population Percent of WY Pop.
United States 325,719,178 Wyoming 579,315 WY = .17% of US Pop.
A1 173,902 30.0% A2 195,018 33.7% A3 94,037 16.2% A4 116,358 20.1%
Source: Annual Estimates of the Resident Population: April 1, 2010 to July 1, 2017 U.S. Census Bureau, Population Division and worldpopulationreview.com
Income and Poverty
Income:
Table 7 provides statistics for Median Age, Median Household Income and Median Home Value. Median Household Income and Median Home Value averages are calculated by dividing the 2016 One-year US Census data amounts or the 2012 – 2016 Five-year data by number of Counties in the region. The numbers are rounded to nearest dollar amount.
The median age of residents for the Nation is 37.9 and the State median age is 37.2. Three Areas have higher averages in median age than the Nation and State. Area 4 is the only Area that has a lower median age than both the State and the Nation.
The median household income for the Nation and the State are $57,617 and $59,882 respectively. Table 7 provides the lowest to the highest income ranges in addition to the averages. Area 1’s median household income average is lower than the State and National averages by $8,100 to $10,455. Area 2’s median household income range has the largest variation of income with the highest income amount exceeding the National and State averages by greater than $20,940 and the lowest income amount falling more than $16,970 below the National and State averages.
The median home values for Areas 1, 2, and 3 are lower than the State and the Nation. However, the end range values exceed both the National and State averages by greater than $10,000. Area 4 is the only Area with home values that exceed the National and State averages by over $100,000 with the beginning of the range starting approximately $15,000 lower than the National and State averages.

DVR 2018 CSNA 18
Table 7 Median Age/ Median Household Income/Median Home Value
Area
Number of
Counties in Area
Median Age
Household Income
Averages
Household Income Ranges
Home Value 2016
Home Value
Ranges
US* ------- 37.9 $57,617 --- $205,000 --- WY* ------- 37.2 $59,882 --- $209,500 ---
A1** 5 38.3 $49,430 $41,051 - $61,201 $177,500 $153,000 -
$220,900
A2** 8 40.3 $58,705 $40,640 - $80,822 $204,025 $155,200 -
$247,800
A3** 5 43.8 $64,431 $57,349 - $72,810 $174,660 $147,500 -
$231,000
A4** 5 36.6 $67,547 $53,323 - $76,004 $311,840 $190,700 -
$720,000 *Source: U.S. Census Bureau 2016 American Community Survey 1-Year Estimates ** Source: 2012-2016 ACS 5-year Estimates.
Poverty
Poverty rates are calculated for the Civilian Noninstitutionalized Population ages 18 to 64 years by averaging data collected from 2016 US Census or from the 2012-2016 US Census. Table 8 presents the average poverty rate and the range of poverty rates for each Area. Albany County, in A1, has a significantly higher poverty rate than the State and National averages by approximately 17%. Crook County, in A2, has the lowest average poverty rate (5.4%), which is significantly lower than the Nation and the State by 6.7 percentage points.
Table 8 Poverty Rates for the Civilian Noninstitutionalized Population Ages 18 to 64 years
Area Average Poverty Rate Lowest Level Highest Level
US* 13.2% ------- -------- WY* 12.1% Crook 5.4% Albany 29.8%
A1** 16.7% Laramie 10.2% Albany 29.8%
A2** 9.0% Crook 5.4% Niobrara 14.3% A3** 12.3% Park 8.1% Washakie 15.9% A4** 9.9% Sublette 7.9% Uinta 15.4%
*Source: 2016 ACS 1-Year Estimates **2012-2016 ACS 5-Year Estimates
Disability and Poverty:
According to Cornell University Disability Statistics, in the year 2016, an estimated 26.6% of non-institutionalized persons aged 21 to 64 years with a disability in the United States were living below the poverty line. In Wyoming, the rate was 23.4%. Table 9 contains the 2017 Poverty by Disability Type rates for the Nation and State.

DVR 2018 CSNA 19
Table 9 Poverty by Disability Type Disability Type United States Wyoming Any Disability 26.6% 23.4% Visual 27.7% 20.8% Hearing 20.4% 13.4% Ambulatory 29.3% 26.5% Cognitive 32.1% 40.1% Self-care 31.6% 34.2% Independent Living 31.4% 31.1%
Source: http://www.disabilitystatistics.org/reports/acs.cfm?statistic=7
Disabilities Under the Age of 65
Disability Status estimates are calculated for the Total Civilian Noninstitutionalized Population (TCNP) by the US Census. National, State, and Area averages are provided in Table 10. The averages are calculated by dividing the total number of individuals within the Area who report a disability by the total number of civilian noninstitutionalized individuals residing in the Area.
The estimated average for the number of people with disabilities residing in the Nation in 2016 is 12.8%. The State’s percentage is higher than the National average by .8%, averaging at 13.6%. Of the civilian noninstitutionalized population ages 18 to 64 years in Wyoming, 12.4% of the residents in A3 report a disability, which is significantly higher than the National average of 10.6% and the State’s average of 11.2% for the same age group. The average percentage rate for individuals 18 to 64 years reporting a disability in A1 and A4 is recorded at 9.6% and 9.7% respectively, which is lower than both the State and National averages by approximately 1%.
Table 10 Disability Status: Total Civilian Noninstitutionalized Population US & WY Disability Status *US *WY **A1 **A2 **A3 **A4
With a disability 12.8% 13.6% 12.3% 12.7% 14.4% 11.2% Under 18 years with a disability 4.3% 5.0% 4.1% 4.1% 4.8% 4.0%
18 to 64 years with a disability 10.6% 11.2% 9.6% 10.9% 12.4% 9.7% *Source: U.S. Census Bureau, 2016 American Community Survey 1-Year Estimates **Source: 2012-2016 ACS 5-Year Estimates
Disability types are classified into six categories and detailed by age in the US Census data. Table 11 provides specific data for the civilian noninstitutionalized population. The table categories are designated for the population under 18 years and for the population ages 18-64. Disability type percentages are calculated by dividing the total number of individuals reporting the disability type within the Area by the number of noninstitutionalized civilians residing in the Area.

DVR 2018 CSNA 20
Table 11 Disability Types
Disability Type Percent with a Disability US WY A1 A2 A3 A4
With a hearing difficulty 3.6% 5.1% 4.3% 4.8% 5.3% 4.6%
Population under 18 years 0.6% 0.9% 0.6% 0.8% 0.7% 1.0%
Population 18 to 64 years 2.0% 3.3% 2.5% 3.4% 3.4% 3.4%
With a vision difficulty 2.4% 2.5% 2.1% 2.5% 2.7% 2.2%
Population under 18 years 0.8% 0.9% 0.7% 0.7% 1.0% 0.7%
Population 18 to 64 years 2.0% 2.2% 1.8% 2.2% 2.3% 1.8%
With a cognitive difficulty 5.2% 5.0% 4.2% 3.8% 5.0% 4.1%
Population under 18 years 4.2% 4.8% 4.5% 3.0% 4.6% 3.6%
Population 18 to 64 years 4.5% 4.4% 3.8% 3.8% 5.0% 3.7%
With an ambulatory difficulty 7.1% 6.9% 5.9% 6.2% 6.7% 5.1%
Population under 18 years 0.6% 0.8% 0.9% 0.9% 0.5% 0.8%
Population 18 to 64 years 5.1% 4.8% 4.1% 5.2% 5.6% 4.4%
With a self-care difficulty 2.7% 2.4% 1.8% 1.9% 2.1% 1.9%
Population under 18 years 1.0% 0.7% 0.5% 0.4% 0.5% 1.1%
Population 18 to 64 years 1.9% 1.7% 1.3% 1.7% 2.0% 1.4%
With an independent living difficulty 5.9% 5.2% 3.5% 3.4% 3.6% 3.3%
Population 18 to 64 years 3.8% 3.6% 2.6% 3.2% 3.2% 2.8%
Source: U.S. Census Bureau, 2016 ACS 1-Year Estimates and Source: U.S. Census Bureau, 2012-2016 ACS 5-Year Estimates

DVR 2018 CSNA 21
Educational Attainment:
Table 12 provides rates for both high school graduation and education at or above a Bachelor’s degree for the State’s population age 25 years and over. The National and State data reflects the 2016 US Census estimates. Data for the Areas is taken from the US Census 2012 – 2016 Five-year estimates and are calculated by adding the total population data for each County and dividing by population data for each category. Percentages in the last two columns of the table are calculated by averaging the US Census percentage rates. High School Graduation Rates: The National average for the total population over the age of 25 whose highest level of educational attainment is a high school diploma or its equivalent is 27.2% and the State average is 29.3%. Three Areas (A1, A2, & A3) have higher percentage rates for those whose highest educational attainment level is a high school graduate or equivalency over the age of 25 than the Nation and the State by 0.1 to 3.2 percentage points. Education Level at or above Bachelor’s Degree:
The National and State averages for the total population over the age of 25 whose highest level of educational attainment is a Bachelor’s degree is 19.3% and 17.5%, respectively. Area 4’s rate for achieving a Bachelor’s degree exceeds the National rate by .6% and exceeds the State average by 2.5 percentage points. Area 2’s rate is the lowest in the State (15.8%), which is lower than the State’s rate by 1.6% and lower than the National average by 3.5%.
Table 12 Educational Attainment: Population 25 years and over
Area HS
Grad or Equiv.
Some college,
no degree
Assoc. degree
Bachelor's degree
Graduate or professional
degree
Percent HS
graduate or higher
Percent Bachelor's degree or
higher US 27.2% 20.6% 8.4% 19.3% 11.9% 87.5% 31.3% WY 29.3% 25.1% 11.7% 17.4% 9.7% 93.2% 27.1% A1 26.1% 25.7% 11.5% 18.7% 11.2% 92.3% 27.7% A2 29.4% 27.4% 11.6% 15.8% 8.2% 92.2% 22.1% A3 29.5% 26.6% 10.7% 16.4% 8.5% 90.9% 23.4% A4 30.4% 24.9% 9.0% 19.9% 8.1% 92.8% 27.6%
Source: U.S. Census Bureau, 2016 A C S 1-Year Estimates and 2012-2016 A C S 5-Year Estimates
Unemployment Rates At the end of December of 2017, the National non-adjusted unemployment rate was 3.9% and the State non-adjusted unemployment rate was 4.1%. Area 3 had the highest unemployment rate at the end of 2017 and continued to have the highest rate through the First Quarter of 2018. Note that A3 is located in the far northwest portion of the State and accounts for lowest portion (16.2%) of the State’s population. The local area unemployment rates are included in Table 13.

DVR 2018 CSNA 22
Table 13 Local Area Unemployment Rates
Area 17-Dec 18-Jan 18-Feb 18-Mar 18-Apr 18-May 18-Jun US 3.9% 4.5% 4.4% 4.1% 3.7% 3.6% 4.2% WY 4.1% 4.6% 4.3% 4.2% 3.9% 3.8% 4.1% A1 3.2% 3.9% 3.6% 3.6% 3.3% 3.3% 3.9% A2 3.8% 4.3% 4.2% 4.0% 3.6% 3.4% 3.8% A3 4.2% 5.1% 5.0% 4.9% 4.5% 4.1% 4.3% A4 3.9% 4.1% 3.9% 3.9% 4.3% 3.9% 3.7%
https://data.bls.gov/map/MapToolServlet?survey=la&map=county&seasonal=u and https://data.bls.gov/map/MapToolServlet and Wyoming Department of Workforce Services, Research and Planning
Labor Force Participation
The US Department Bureau of Labor and Statistics provides data for the largest occupations within the various states and the Nation. The following charts are the most recent data (May, 2017) results indicating the largest occupations for the Nation and Wyoming.
Chart 1 Occupational Employment Statistics for the US

DVR 2018 CSNA 23
Chart 2 Occupational Employment Statistics for WY
Wyoming’s Labor Market Information, “Wyoming at Work”, provides data on the State’s top growing occupations. Table 14 provides data on the top growing occupations in the State. Table 14 Top Growing Occupations
Top Growing Occupations Salary Retail Salespersons $24,090 Waiters and Waitresses $18,800 Cashiers $21,120 Combined Food Preparation and Serving Workers, Including Fast Food $19,680
Registered Nurses $63,290 Source: Source: Dept of Labor and Occupational Employment Statistics (OES) Program https://www.wyomingatwork.com/ /vosnet/lmi/profiles/profileSummary.aspx?enc=Elzv7W1H4bwmL+k+/LJ5/djcZxSI2vf0zWuESGUQHrY=
In the 2018 Wyoming Workforce Annual Report, key industries in the State are identified. The three top goods producing industries identified are: construction, mining, and manufacturing. The three top service providing industries are: leisure and hospitality, retail trade, and health care and social assistance. Local government is the highest employing industry out of the three categories of government employment (federal, state, local).
Wyoming at Work, Wyoming’s Workforce and Labor Market Information System, provides information on the top industries by employment for each county in the state. Table 14 displays the top five industries with the most employees in each Area. The results are calculated by adding the number of employees for each industry found in each Area for the 2nd Quarter of 2017.

DVR 2018 CSNA 24
Table 14 Local Area Top Industries by Employment (Wyoming at Work 2nd Quarter 2017)
Area Industries WY 1) Educational Services
2) Food Services & Drinking Places 3) Accommodation 4) Hospitals 5) Specialty Trade Contractors
A1 1) Healthcare and Social Assistance 2) Educational Services 3) Public Administration 4) Retail Trade 5) Accommodation and Food Services
A2 1) Healthcare and Social Assistance 2) Retail Trade 3) Mining 4) Accommodation and Food Services 5) Construction
A3 1) Healthcare and Social Assistance 2) Accommodation and Food Services 3) Education Services 4) Retail Trade 5) Public Administration
A4 1) Accommodation and Food Services 2) Retail Trade 3) Mining 4) Healthcare and Social Assistance 5) Education Services
Source: https://www.wyomingatwork.com/vosnet/dashboards/defaultana.aspx?
Disability and Labor Force Participation
Labor Force Participation (LFP) The labor force includes the employed and unemployed, who are actively looking for work. Individuals who are not employed, and who are not looking for work, are not part of the labor force. The labor force participation rate is the percentage of the civilian noninstitutionalized population age 16 and older who are employed, or unemployed, and actively looking for work. The labor force participation rate does not necessarily include all individuals without a job. Figure # 1 contains the 2017 Labor Force Participation data from the Wyoming Department of Workforce Services.

DVR 2018 CSNA 25
Figure 1 Labor Force Participation Rates
The United States Department of Labor provides monthly Disability Employment Statistics. Table 15 contains the statistics for the first six months of 2018. Table 15 US Disability Employment Statistics (DES) Jan-June 2018 ages 16 and over
DES for ages 16 and over
Labor Force Participation Unemployment Rate
Month People with
Disabilities
People Without
Disabilities
People with
Disabilities
People Without
Disabilities Jan-18 20.4% 67.8% 8.8% 4.3% Feb-18 20.7% 68.4% 8.6% 4.3% Mar-18 21.5% 68.4% 8.2% 4.0% Apr-18 20.9% 68.3% 8.0% 3.5% May-18 20.1% 68.6% 7.0% 3.4% Jun-18 20.2% 69.1% 8.3% 4.0%
Sources: https://www.dol.gov/odep/ and https://data.bls.gov/pdq/SurveyOutputServlet
Cornell University provides online disability statistics. The following data is from the online resource: Employment rate: In 2016, an estimated 35.5% of non-institutionalized individuals with a disability, ages 16-64, regardless of ethnicity and education level, in the Nation were employed. In Wyoming, the rate was estimated at 45.2%.

DVR 2018 CSNA 26
Not working but actively looking for work: In 2016, an estimated 7.8 % of non-institutionalized individuals ages 21 to 64 years with a disability in the Nation who were not working, were actively looking for work. In Wyoming, the estimate was 16.7%.
Full-Time / Full-Year Employment: In 2016, an estimated 23% of non-institutionalized individuals ages 21 to 64 years with a disability in the Nation were employed full-time/full-year while the estimate is 27.5% for Wyoming, which is 4.5 percentage points higher than the Nation. http://www.disabilitystatistics.org/reports/acs.cfm?statistic=4
Table 16 provides National and State Labor Force Participation (LFP) data based on disability status and employment for ages 16 and over. Of the total population age 16 years and older residing in the United States who report having a disability, 23.4% are employed and participating in the Labor Force, while approximately 73.5% are not in the Labor Force. The State of Wyoming’s average for those who report a disability and are employed is (30.3%) while 26% of those who report a disability are not engaged in the Labor Force. Table 16 LFP for Total Civilian Noninstitutionalized Population (TCNP) age 16 and over
Status United States Wyoming
TCNP With a Disability
No Disability TCNP With a
Disability No
Disability Population Age 16 and Over 253,058,350 38,127,449 214,930,901 450,367 73,277 377,090
Employed 60.3% 23.4% 66.8% 63.9% 30.3% 70.4% Not in Labor Force 36.0% 73.5% 29.4% 32.4% 65.0% 26.0% Employed Population Age 16 and Over 152,551,876 8,909,020 143,642,856 287,583 22,219 265,364
Source: U.S. Census Bureau, 2016 American Community Survey 1-Year Estimates
Laramie and Natrona Counties are the only Counties in the State with available Labor Force Participation (LFP) rates for the total civilian noninstitutionalized population age 16 years and over. Table 17 provides the available data from the ACS Five-year estimates. Table 17 LFP for Total Civilian Noninstitutionalized Population (TCNP) age 16 and over
Status Laramie County Natrona County
TCNP With a Disability
No Disability TCNP With a
Disability No
Disability Population Age 16 and Over 73,337 10,685 62,652 62,550 10,507 52,043
Employed 63.5% 29.1% 69.4% 66.9% 33.7% 73.7% Not in Labor Force 32.7% 67.6% 26.8% 29.6% 61.0% 23.3% Employed Population Age 16 and Over 46,573 3,104 43,469 41,876 3,539 38,337
Source: U.S. Census Bureau, 2012-2016 ACS 5-Year Estimates
The Annual Disability Statistics Compendium 2017 contains data on employment for people with disabilities ages 18 to 64 years. According to the report, the National employment

DVR 2018 CSNA 27
percentage for individuals ages 18 to 64 living in the community was significantly higher for people without disabilities, (76.8%) versus people with disabilities, (35.9%). The employment gap, which is the difference between the employment percentage for people with disabilities and people without disabilities is 40.9% for the Nation. Wyoming’s employment rate for individuals with disabilities ages 18 to 64 is 47.2%, and 79.5 % for individuals without disabilities, with an employment gap of 32.3%. Wyoming has the 5th lowest disability employment gap in the Nation as four states have lower rates than Wyoming (Arkansas, 28.2%, North Dakota, 30.2%, South Dakota, 30.7%, and Utah, 31.9%). Employment status and disability type is estimated for the population age 18 years to 64 years by the US Census. It is important to note the difference for the Labor Force Participation Rates in Tables 15 and 16 from the calculations in Table 17 as Table 17 begins with a higher age and has a cutoff age. Table 18 includes the National and State averages for LFP by disability status and type. Table 18 Labor Force Participation (Employment Status) by Disability Status and Type
Status US Wyoming Laramie Co. Natrona Co. Total 18 to 64 years: 196,766,286 350,428 57,705 49,663 In the labor force: 76.8% 80.3% 80.3% 82.9% Employed: 94.3% 94.5% 93.0% 94.7%
With a disability 5.2% 6.9% 6.8% 9.3% Hearing difficulty 27.8% 42.4% 39.1% 51.0%
Vision difficulty 22.9% 23.1% 30.7% 27.3% Cognitive difficulty 31.5% 25.9% 22.0% 23.9%
Ambulatory difficulty 33.5% 30.5% 20.8% 38.7% Self-care difficulty 7.6% 8.0% 3.1% 1.3%
Independent Living difficulty 16.9% 16.1% 21.4% 10.5%
No disability 94.8% 93.1% 93.2% 90.7% Unemployed: 5.7% 5.5% 7.0% 5.3%
With a disability 12.7% 17.4% 15.8% 23.0% No disability 87.3% 82.6% 84.2% 77.0%
Not in labor force: 23.2% 19.7% 19.7% 17.1% With a disability 26.8% 26.1% 21.7% 40.7%
No disability 73.2% 73.9% 78.3% 59.3% LFP employed &
unemp. w/ disability 5.7% 7.5% 7.4% 10.1%
LFP employed & unemp. wo disability 94.3% 92.5% 92.6% 89.9%
Total Pop w/ disability 10.6% 11.2% 10.2% 15.3% Total Pop w/o
disability 89.4% 88.8% 89.8% 84.7% Source: U.S. Census Bureau, 2016 ACS 1-Year Estimates and 5-Year Estimates

DVR 2018 CSNA 28
The National averages for individuals with ambulatory disabilities (33.5%) and cognitive disabilities (31.5%) rank the highest for labor force participation. The highest labor force participation rates among those reporting a disability in the State are individuals reporting a hearing difficulty (42.4%) and an ambulatory difficulty (30.5%). Laramie and Natrona Counties are the only Counties with labor force and disability type data available. Hearing difficulty is the disability category with the highest percentage rates reported from those who are employed with a disability in both counties (Laramie, 39.1%, Natrona, 51%). Ambulatory difficulty is the second most frequently reported disability in Natrona County (38.9%) and Vision difficulty is the second most frequently reported disability in Laramie County (30.7%). Self-care difficulty is the least frequently reported disability category among those who are employed and report having a disability. This information, in concert with the agency-specific information presented next, should help inform DVR as it engages in strategic planning for the future.
Agency-Specific Data Related to Overall Performance
The project team requested data related to overall performance and case movement from DVR for this assessment. The data is presented throughout the report in the applicable areas. Table 19 contains general information for all DVR consumers for the period of Federal Fiscal Years 2014-2017.

DVR 2018 CSNA 29
Table 19 General statistics for all consumers
Item ALL CONSUMERS
2015 2016 2017 2018 Applications 1882 1909 1709 1748 Percent of apps found eligible 81.3% 78.4% 79.2% 82.9% Avg. time for eligibility determination 41.7 43.2 45.2 43.2 Significance of Disability
Disabled 241 217 168 157 Percent of total 10.9% 5.1% 8.0% 7.7%
Significant 1255 1055 906 838 Percent of total 56.5% 45.7% 43.3% 41.3%
Most significant 725 1035 1020 1035 Percent of total 32.6% 44.9% 48.7% 51.0%
Percent closed prior to Individualized Plan for Employment (IPE) development
26.4% 22.0% 38.4% 27.1%
Plans developed 1229 1134 1029 1092 Avg. time from eligibility to plan (days) 79.2 65.3 64.4 61.9
Number of cases closed rehabilitated 641 600 590 619 Rehabilitation rate 58.0% 56.4% 57.2% 56.1% Median earnings of those closed as successfully rehabilitated
$11.98/hr $12.10/hr $12.80/hr $13.14/hr
Total number of cases served 4469 4865 5237 5018 Avg. cost of all cases $1,091 $2,910 $1,585 $1,711 Avg. cost of cases closed rehabilitated $5,446 $5,332 $4,899 $4,738 Avg. cost per case closed unsuccessful $3,422 $3,038 $3,680 $2,778 Avg. cost per case closed prior to plan $457 $361 $318 $351
The number of individuals applying for services from DVR increased to a high of 1909 in 2016 and then decreased the following year. In 2018, the number of applications began to rise again. Almost 83% of the individuals that apply for services from DVR are found eligible, and the average time for eligibility determination remained well below the maximum time allowed by law of 60 days throughout the four years off this study. More than 92% of the individuals served by DVR are classified as having at least a significant disability, with more than half classified as most significantly disabled in 2018.
The number of plans written by DVR decreased slightly from 2015-2017, but increased in 2018. The average time to develop the IPE decreased each year of the study, ending well below the

DVR 2018 CSNA 30
maximum time allowed by law of 90 days. The rehabilitation rate for all cases remained fairly constant from 2015-2018 between 56 and 58 percent. The median earnings increased by more than one dollar per hour from 2015 to 2018.
The average cost of cases closed after plan either successfully or unsuccessfully decreased from 2017 to 2018 and remained well within acceptable ranges for all areas and years of the study. DVR has been able to keep costs relatively constant while serving the same or more individuals each year. Although there was a slight decline in those served from 2017-2018, the 2018 total was more than 2015 or 2016.
Case Service Expenditures:
The project team analyzed all expenditures by service category for VR for the life of the study in order to determine where the case service dollars are being spent by the agency. This information is contained in Table 20.

DVR 2018 CSNA 31
Table 20 Case Service Expenditures
Expenditure by Service Category Service Category Amount spent per year
2015 2016 2017 2018 Assessment $242,310 $287,771 $197,806 $130,914 Diagnosis and Treatment of Impairments $447,001 $394,028 $298,769 $336,940
Vocational Rehabilitation Counseling and Guidance $0 $0 $1,321 $0
Graduate College or University Training $350 $789 $8,543 $18,968
Four-Year College or University Training $144,851 $172,671 $180,539 $219,177
Junior or Community College Training $364,861 $528,072 $492,766 $507,771 Occupational or Vocational Training $338,312 $385,047 $243,719 $203,935 On-the-job Training $57,756 $142,097 $127,273 $157,115 Apprenticeship Training $599 $642 $0 $0 Basic Academic and Remedial or Literacy Training $119 $0 $0 $0
Job Readiness Training $4,558 $3,782 $201,992 $207,423 Disability Related Skills Training $843 $0 $1,182 $330 Miscellaneous Training $16,691 $19,199 $28,739 $56,099 Job Search Assistance $6,924 $4,567 $13,608 $32,859 Job Placement Assistance $141,794 $167,528 $427,378 $266,373 On-the-job Supports: Time-limited $98,617 $127,581 $130,011 $147,169
On-the-job Supports: Supported Employment $174,317 $104,962 $138,602 $132,259
Transportation $173,730 $214,077 $192,835 $168,954 Maintenance $109,040 $101,350 $103,758 $56,113 Rehabilitation Technology $420,349 $457,018 $412,475 $518,252 Reader $278 $0 $0 $0 Interpreter $12,819 $10,157 $18,147 $14,659 Personal Attendant $0 $0 $0 $0 Technical Assistance $14,346 $12,702 $14,609 $9,901 Information and Referral $0 $0 $8,369 $21,732 Benefits Counseling $4,535 $1,890 $4,730 $4,574 Customized Training $172,523 $165,248 $360 $0 Other Services $197,654 $235,408 $243,799 $223,105

DVR 2018 CSNA 32
DVR spends a significant amount of their case service dollars on the diagnosis and treatment of impairments, training, employment services and rehabilitation technology. In order to provide a quick reference for ease of viewing and understanding, the project team combined categories of major expenditures and included them in Table 21:
Table 21 Major Expenditures for Wyoming DVR
Expenditure by Service Category Service Category Amount spent per year
2015 2016 2017 2018 Diagnosis and Treatment of Impairments $447,001 $394,028 $298,769 $336,940
Percent of Total Expenses 14.2% 11.1% 8.6% 9.8% Four-Year College or University Training $144,851 $172,671 $180,539 $219,177
Percent of Total Expenses 4.6% 4.9% 5.2% 6.4% Junior or Community College Training $364,861 $528,072 $492,766 $507,771
Percent of Total Expenses 11.6% 14.9% 14.1% 14.8% Occupational or Vocational Training $338,312 $385,047 $243,719 $203,935
Percent of Total Expenses 10.8% 10.9% 7.0% 5.9% Job Placement Assistance $141,794 $167,528 $427,378 $266,373
Percent of Total Expenses 4.5% 4.7% 12.2% 7.8% Transportation $173,730 $214,077 $192,835 $168,954
Percent of Total Expenses 5.5% 6.1% 5.5% 4.9% Rehabilitation Technology $420,349 $457,018 $412,475 $518,252
Percent of Total Expenses 13.4% 12.9% 11.8% 15.1%
The data indicates that more than 26% of DVR case service expenditures consist of postsecondary education of some sort, with community college training comprising the largest percentage each year. This trend indicates positive movement of the organization towards helping consumers achieve their maximum earning capacity, and should positively contribute to DVR making progress in the credential attainment and skill gains performance indicators.
DVR expended just over 15% of their case service dollars on rehabilitation technology in 2018, and almost ten percent on the diagnosis and treatment of impairments. Transportation comprised almost five percent of their case service expenditures in 2018 while job placement accounted for almost eight percent.
Types of Employment Outcomes:
An important measure of the performance of the organization is the type of employment outcomes obtained by the consumers served. The project team utilized RSA-911 data to examine employment outcomes by Standard Occupational Classification (SOC) code for Wyoming DVR compared to all other VR programs combined. Table 22 identifies these outcomes for Federal Fiscal Year 2016 by SOC categories and compares Wyoming DVR (n =

DVR 2018 CSNA 33
612) to all other VR programs combined for the same time period (n = 186,064). Cases included in this analysis were those that (a) exited with an employment outcome, and (b) had a Standard Occupational Classification code recorded in the file.
Table 22 Employment Outcomes by SOC Code for 2016
SOC Code Category Wyoming Frequency
National Frequency Difference
Management Occupations 3.9% 2.6% +1.3% Business and financial operations occupations 1.6% 1.5% +0.1% Computer and Mathematical Operations 1.8% 1.2% +0.6% Architecture and engineering occupations 0.8% 0.7% +0.1% Life, physical and social science occupations 0.3% 0.5% -0.2% Community and social science occupations 3.1% 2.8% +0.3% Legal occupations 0.5% 0.3% +0.2% Education, training and library occupations 3.9% 3.1% +0.8% Art, design, entertainment, sports and media occupations 0.8% 1.1% -0.3% Healthcare practitioners and technical occupations 2.8% 2.6% +0.2% Healthcare support occupations 3.6% 3.7% -0.1% Protective service occupations 1.0% 1.6% -0.6% Food preparation and serving related occupations 9.6% 11.7% -2.1% Building and grounds cleaning and maintenance occupations 9.3% 9.2% +0.1% Personal care and service occupations 5.6% 5.7% -0.1% Sales and related occupations 10.0% 8.3% +1.7% Office and administrative support occupations 17.3% 17.3% 0.0% Farming, fishing and forestry occupations 1.3% 0.5% +0.8% Construction and extraction occupations 4.2% 2.5% +1.7%

DVR 2018 CSNA 34
Installation, maintenance, and repair occupations 3.9% 4.8% -0.9% Production occupations 5.2% 7.9% -2.7% Transportation and material moving occupations 9.2% 8.7% +0.5
Military specific occupations 0.0% 0.1% -0.1%
Homemaker closures 0.0% 1.5% -1.5%
Unpaid family worker 0.0% 0.0% 0.0%
Randolph Sheppard facility clerk 0.0% 0.0% 0.0%
Randolph Sheppard facility operator 0.0% 0.1% -0.1%
The occupational categories where Wyoming DVR differed by more than two percentage points from all other VR programs in the country combined are highlighted. A row highlighted in blue indicates that DVR was at least two percentage points lower in that category than the rest of the VR programs combined. RSA-911 data indicate that Wyoming DVR was largely consistent with the rest of the nation across most of the occupational classifications, but was lower than all other VR programs combined with respect to the proportions of individuals closed in (1) food preparation and serving-related occupations, and (2) production occupations. The largest discrepancy between Wyoming and national proportions occurred with production occupations closures. Wyoming DVR was lower than the national average by 2.7 percentage points. The project team grouped all of the service and low skill category jobs together to offer a snapshot of what all of these types of employment looked like comparatively. Table 23 presents this analysis.

DVR 2018 CSNA 35
Table 23 Lower Skills Employment Categories by SOC Codes for 2016
SOC Code Category Wyoming Frequency
National Frequency Difference
Food preparation and serving related occupations 9.6% 11.7% -2.1% Building and grounds cleaning and maintenance occupations 9.3% 9.2% +0.1% Personal care and service occupations 5.6% 5.7% -0.1% Sales and related occupations 10.0% 8.3% +1.7% Office and administrative support occupations 17.3% 17.3% 0.0% Construction and extraction occupations 4.2% 2.5% +1.7% Installation, maintenance, and repair occupations 3.9% 4.8% -0.9% Production occupations 5.2% 7.9% -2.7% Transportation and material moving occupations 9.2% 8.7% +0.5
Total 74.3% 76.1% -1.8%
RSA-911 data indicate that a substantial majority (74.3%) of consumers that Wyoming DVR closed with an SOC Code during federal fiscal year 2016 were working in what would be classified as lower-skill jobs. On a positive note, this rate is 1.8 percentage points lower than the proportion for all other VR agencies combined. Across the occupational classifications, Wyoming DVR had higher proportions than the national proportions in four of the nine classifications and lower proportions in four of the nine classifications (one classification was equal across the two groups). These results at both the state and national levels suggest that vocational rehabilitation programs in the United States should strive to enhance the quality of employment outcomes that are achieved by the individuals they serve and pursue higher-paying, skilled occupations. The project team gathered SOC code data for the entire United States workforce as a point of comparison for Wyoming DVR. Table 24 below compares the outcomes of Wyoming DVR consumers closed in the job categories listed previously with the entire United States Workforce.

DVR 2018 CSNA 36
Table 24 DVR Consumers Compared to the U.S. Workforce 2016
SOC Code Category Wyoming Frequency
All US Workforce Difference
Food preparation and serving related occupations 9.6% 5.6% +4.0% Building and grounds cleaning and maintenance occupations 9.3% 3.8% +5.5% Personal care and service occupations 5.6% 3.8% +1.8% Sales and related occupations 10.0% 10.5% -0.5% Office and administrative support occupations 17.3% 11.7% +5.6 Construction and extraction occupations 4.2% 5.2% -1.0% Installation, maintenance, and repair occupations 3.9% 3.2% +0.7% Production occupations 5.2% 5.6% -0.4% Transportation and material moving occupations 9.2% 6.1% +3.1%
Total 74.3% 55.5% +18.8%
The lower-skill occupational categories where Wyoming DVR differed by more than two percentage points from the proportions of all individuals in the U.S. workforce in 2016 are highlighted. A row highlighted in yellow indicates that DVR was at least two percentage points higher in that category than the proportions of all individuals in the U.S. workforce.
Relative to the proportions of individuals in the U.S. workforce in 2016, Wyoming DVR clients were closed in the following lower-skill occupational classifications at higher rates (exceeding differences of two percentage points): (1) food preparation and serving-related occupations; (2) building and grounds cleaning and maintenance occupations; (3) office and administrative support occupations; and (4) transportation and material moving occupations. It is important to note that the job classifications of DVR consumers exceeded all other VR programs combined, but were higher than the national average for all jobs in lower skill occupations. These findings reinforce the need, at the state and national level, to enhance the quality of employment outcomes achieved by VR clients.

DVR 2018 CSNA 37
SURVEY RESULTS BY TYPE
INDIVIDUAL SURVEY RESULTS
In the overall performance section of the report, general information about the respondents to the individual survey are presented as well as responses to questions that address consumer perspectives about the overall performance of DVR. Results that are consistent with the other portions of the report will be reported in those sections.
Surveys were distributed electronically via Qualtrics, a web-based survey application, and by hard copy mail. There were 198 valid individual surveys completed by both forms, with varying degrees of completion. In some cases, individual respondents chose not to answer select questions on the survey, but did complete the entire survey and submit it. This accounts for the variance in survey responses in some questions.
The individual survey was distributed electronically and in hard copy format by mail. There were 198 valid surveys returned between both methods, with varying degrees of completion.
Respondent Demographics
Table 25 identifies the age of the respondents to the individual survey.
Table 25 Age of Respondents
Age Range of Respondents Number Percent of
Total
25-64 134 76.1%
Under 25 31 17.6%
65 and over 11 6.3%
Total 176 100%
A total of 176 respondents indicated their age. The majority of respondents were age 25 to 64. The gap between the ages of respondents under the age of 25 and respondents between the ages of 25 to 64 was 58.5%.
Respondents were also asked to identify their county of residence. Data was compiled and is detailed in Table 26.

DVR 2018 CSNA 38
Table 26 County of Residence
County of Residence Number Percent of Total
Laramie 43 24.2%
Natrona 16 9.0%
Fremont 15 8.4%
Sheridan 12 6.7%
Sweetwater 12 6.7%
Uinta 11 6.2%
Park 10 5.6%
Albany 8 4.5%
Teton 7 3.9%
Johnson 6 3.4%
Lincoln 6 3.4%
Washakie 6 3.4%
Carbon 4 2.3%
Hot Springs 4 2.3%
Big Horn 3 1.7%
Campbell 3 1.7%
Converse 3 1.7%
Goshen 3 1.7%
Sublette 2 1.1%
I do not know what County I live in 2 1.1%
Niobrara 1 0.6%
Platte 1 0.6%
Crook 0 0.0%
Weston 0 0.0%
Total 178 100%

DVR 2018 CSNA 39
Slightly less than one-fourth of the 178 respondents to the question indicated that they reside in Laramie County. Individuals that reside in Fremont and Natrona represent 17.4% of the survey respondents that answered the question. Respondents were presented with a checklist and asked to identify their primary disabling condition. Table 26 summarizes the primary disabling conditions reported by the individual survey respondents. Table 26 Primary Disability of Respondents
Primary Condition Number Percent of Total
Mental Health 39 22.0%
Physical 33 18.6%
Other (please describe) 23 13.0%
Developmental Disability (DD) 21 11.9%
Deaf or Hard of Hearing 19 10.7%
Intellectual Disability (ID) 17 9.6%
Mobility 10 5.7%
Blindness or visually impaired 7 4.0%
Communication 3 1.7%
No impairment 3 1.7%
I don't know 2 1.1%
Deaf-Blind 0 0.0%
Total 177 100%
Mental health was the most frequently cited primary condition by survey respondents. Physical conditions and “other” were cited by 31.6% of survey respondents. In the category of “other” the most frequently cited primary condition was traumatic brain injury/brain injury. Other diagnoses written in narrative format by survey respondents were: ADHD, Autism, and learning disabilities. Respondents were also asked to identify their secondary disabling condition, if they had one. Table 27 details the secondary conditions reported by respondents.

DVR 2018 CSNA 40
Table 27 Secondary Disability of Respondents
Secondary Condition Number Percent of Total
No impairment 33 20.9%
Physical 31 19.6%
Mental Health 22 13.9%
Other (please describe) 19 12.0%
Communication 11 7.0%
Intellectual disability (ID) 10 6.3%
Mobility 8 5.1%
Blindness or visually impaired 6 3.8%
Developmental Disability (DD) 6 3.8%
Deaf or Hard of Hearing 6 3.8%
I don't know 6 3.8%
Deaf-Blind 0 0.0%
Total 158 100%
Approximately 21% of respondents reported no secondary disabling condition, while 33.5% of the survey respondents indicated physical or mental health conditions. Respondents who selected “other” were given an opportunity to provide narrative responses. Of the 19 narrative responses, learning disability/dyslexia was cited 4 times. PTSD and diabetes were each cited twice by survey respondents. Association with DVR:
Individuals who responded to the survey were presented with two questions that asked them to identify the statement that best described their association with DVR and their referral source. Their responses to this question appear in Tables 28 and 29 below.

DVR 2018 CSNA 41
Table 28 Respondent Association with DVR
Association with (agency) Number Percent
I am a current client of DVR 97 51.6%
I am a previous client of DVR, my case has been closed 68 36.2%
Other (please describe) 16 8.5%
I have never used the services of DVR 7 3.7%
I am not familiar with DVR 0 0.0%
Total 188 100%
Table 29 Respondent Referral Source
Referral Source Number Percent of Total
I was self-referred 42 24.9%
Other (please describe) 30 17.8%
High School Transition Teacher 21 12.4%
A healthcare professional 19 11.2%
The Wyoming Workforce Center 15 8.9%
A friend 13 7.7%
My family 11 6.5%
A staff member at a college or vocational training program 6 3.6%
A behavioral health program 5 3.0%
The Social Security Administration 4 2.4%
A community rehabilitation program 2 1.2%
My Parole Officer or other court official 1 0.6%
Total 169 100%
The majority of respondents (51.6%) indicated they were current customers of DVR. A gap (15.4%) is noted between current customers of DVR and previous customers. The majority of individuals who selected “other” indicated that they were: either parents or children of current clients, case managers, or caregivers. Although almost one-fourth of respondents indicated that they were self-referred to DVR, 75% of the respondents were referred to DVR by another agency or individual. Referral sources provided in the narrative option of the item “other” included employers, waiver program representatives, providers and current/former DVR employees.

DVR 2018 CSNA 42
Reasons for Seeking DVR Services Respondents were presented with a checklist and asked to identify their reasons for seeking DVR services. Table 30 summarizes the reasons reported by the individual survey respondents. Note that respondents were allowed to select more than one option in response to this question. Table 30 Reasons for Seeking DVR Services
Reasons for Seeking DVR Services Number Percent of Total
I needed help finding a job 94 40.7%
I wanted to go to college or some other kind of postsecondary education 54 23.4%
Other (please describe) 30 13.0%
I was told to by someone 23 10.0%
I needed money 19 8.2%
I was in danger of losing my job 9 3.9%
I don't know 2 0.9%
The response of “I need help finding a job” was selected the most number of times. The gap between the top two reasons for seeking DVR services is a difference of 40 or 17.3%, indicating that needing help finding a job is the primary reason for seeking DVR services by consumers. Although 30 responses were received in the category “other” and the opportunity to for a narrative response was provided, no narrative responses were obtained. A separate question asked respondents to indicate where they usually met with their counselor. Table 31 details the meeting locations reported by respondents. Table 31 Meeting Locations
Meeting Location Number Percent
I go to a DVR office to meet with my counselor 122 74.4%
I don't have a DVR counselor 26 15.9%
I usually meet with my counselor in my community/school 16 9.8%
Total 164 100%
According to the survey, meetings with counselors occur most frequently at the DVR office as compared to 9.8% of respondents reporting they meet with their counselor in the community/school.

DVR 2018 CSNA 43
Comments Related to How DVR Could Change Services: Individual survey respondents were asked a question regarding how DVR can change their services to help them get a job. Ninety-seven narrative responses were received. Thirteen comments were positive in regard to DVR services evidenced by phrases such as “Excellent service” and “DVR has been a great help.” There were 35 comments that did not have any specific recommendations for changing DVR services. Content analysis of remaining responses indicated the following themes:
• Counselor lack of proper assessment, lack of willingness to support and listen, and poor communication
• Slow processes and long wait times for assistance and/or funding • Improving employer outreach and job coach services • Maintain up-to-date provider and employer lists • Support desires for advancement and earning extra income.
COMMUNITY PARTNER SURVEY RESULTS
The partner survey was distributed to representatives of partner organizations that provide services to individuals with disabilities and work with DVR. A total of 42 valid partner surveys were completed. Questions appearing on the partner survey addressed five general areas:
• Services readily available to persons with disabilities • Barriers to achieving employment goals • Barriers to accessing DVR services • Desired changes to community partner programs that can increase their ability to serve
individuals with disabilities • Assessment of Wyoming Workforce Centers effectiveness in serving individuals with
disabilities
The bulk of the partner survey responses are presented in the sections of this report that apply to those questions. The project team included some general information about survey respondents in this section.
Respondent Characteristics:
The first survey question asked respondents to classify their organization. Table 32 identifies the classifications indicated by the survey respondents.

DVR 2018 CSNA 44
Table 32 Organization Type of Partner Survey Respondents
Organization Type Number Percent
Developmental Disability Organization 10 23.8%
Other (please describe) 7 16.7%
Mental Health Provider 5 11.9%
Other Federal, State, or Local Government Entity 5 11.9%
Secondary School 4 9.5%
Individual Service Provider 4 9.5%
Client Advocacy Organization 3 7.1%
Other Public or Private Organization 3 7.1%
Community Rehabilitation Program 1 2.4%
Postsecondary school 0 0.0%
Medical Provider 0 0.0%
Veteran's Agency 0 0.0%
Total 42 100%
Slightly under 24 percent of respondents identified as a developmental disability organization and an additional 23.8 percent identified as working for a government entity or identified as a mental health provider (n=10). None of the respondents indicated working for a Veteran’s Agency, a postsecondary school or were a medical provider. The seven respondents who selected “other, (please describe)” cited disability organizations, case manager, guardian and health education organization.
Respondents were provided with a list and asked to identify the County in which they worked. There were no limitations to the number of Counties that a respondent could choose. Table 33 includes this information.

DVR 2018 CSNA 45
Table 33 Counties Served
County Served Number Percent
Campbell 13 31.7%
Albany 10 24.4%
Natrona 9 22.0%
Sheridan 9 22.0%
Laramie 8 19.5%
Sweetwater 7 17.1%
Crook 6 14.6%
Johnson 5 12.2%
Weston 5 12.2%
Platte 4 9.8%
Carbon 3 7.3%
Converse 3 7.3%
Goshen 3 7.3%
Sublette 3 7.3%
Uinta 3 7.3%
Lincoln 2 4.9%
Big Horn 1 2.4%
Fremont 1 2.4%
Hot Springs 1 2.4%
Niobrara 1 2.4%
Park 1 2.4%
Teton 1 2.4%
Washakie 1 2.4%
Respondents participating in the survey indicated Campbell and Albany Counties most frequently as Counties in which they provided services. All twenty-three Counties were represented at least one time by survey respondents.

DVR 2018 CSNA 46
Respondents were provided with a list and asked to identify which client populations they worked with on a regular basis. There were no limitations to the number of client populations that a respondent could choose. Table 34 includes this information.
Table 34 Client Populations Served Regularly by Respondents
Client Populations Number Percent
Transition-age youth (14-24) 30 73.2%
Individuals from unserved or underserved populations 29 70.7%
Individuals that are deaf 22 53.7%
Individuals that are blind 20 48.8%
Individuals that are racial or ethnic minorities 13 31.7%
Individuals that need supported employment 12 29.3%
Individuals served by Wyoming’s Workforce Centers (formerly referred to as One-Stops or Career Centers) 10 24.4%
Veterans 10 24.4%
Individuals with the most significant disabilities 9 22.0%
Other (please describe) 6 14.6%
More than 73 percent of the partner survey respondents reported working with transition-age youth, and slightly more than 70 percent reported working with individuals that were from unserved or underserved populations. Slightly more than 31 percent of the respondents reported working with individuals that are racial or ethnic minorities. Individuals that are Veterans or individuals with the most significant disabilities were the populations identified least frequently by partner agency respondents. Three of the responses received in the category “other, please describe” served individuals with mental health and substance abuse disorders.
STAFF SURVEY RESULTS
A total of 32 valid staff surveys was completed. Questions appearing on the staff survey addressed six general areas:
• Services readily available to persons with disabilities • Barriers to achieving employment goals • Barriers to accessing DVR services • The effectiveness of the Wyoming Workforce Centers in serving individuals with
disabilities • Desired changes in DVR services that would help the organization more effectively serve
individuals with disabilities

DVR 2018 CSNA 47
Respondent Characteristics:
Staff were asked an open-ended question requesting that they indicate their job title. Twenty- eight responses were received. Table 35 contains the results.
Table 35 Job Title
Job Title Number Percent Vocational Rehabilitation Counselors 14 50.0% Vocational Rehabilitation Assistant 5 17.9% Office Support Specialist / Staff 4 14.3% Manager 2 7.1% Consultant 2 7.1% Analyst 1 3.6%
Total 28 100%
Half of the respondents to the staff survey identified as vocational rehabilitation counselors. Vocational rehabilitation assistants and office support specialist/staff comprise just over 32 percent of the respondent population.
Staff survey respondents were asked to identify how many years that they have held their current job. Table 36 indicates the results.
Table 36 Years in Current Position Years in Current Position Number Percent 1-5 years 12 40.0% Less than one year 6 20.0% 6-10 years 5 16.7% 11-20 years 5 16.7% 21+ years 2 6.7%
Total 30 100%
The largest percentage of staff survey respondents have held their current workplace position for 1-5 years, while 20 percent have held their current position for less than one year. Slightly more than 33 percent of the staff respondents had been in their current position with DVR for six to twenty years.
Services that DVR is Most Effective in Providing:
Related to the overall performance of the organization, survey respondents were provided a list of 15 items and asked to identify the services that DVR are most effective in providing to DVR consumers, directly or through community partners. There was no limitation to the number of items a staff respondent could choose. Table 37 lists the services and the number of times each item was selected, as well as the percent of time the service was selected by respondents.

DVR 2018 CSNA 48
Table 37 Services that Providers are Most Effective in Providing
Services that DVR are Most Effective in Providing Consumers: Direct & Through Partners Number Percent of
time chosen
Other education services 20 87.0% Job development services 18 78.3% Job training services (TWE, Job Coaching, OJT, etc.) 17 73.9% Assistive technology 14 60.9% Mental health treatment 14 60.9% Medical treatment 8 34.8% Other transportation assistance 7 30.4% Substance abuse treatment 7 30.4% Benefit planning assistance 7 30.4% Other (please describe) 5 21.7% Vehicle modification assistance 4 17.4% Personal care attendants 2 8.7% Health insurance 2 8.7% Income assistance 1 4.3% Housing 1 4.3%
Staff survey respondents answered the question similarly to partner respondents. Staff ranked “other education services” in first position while partner respondents ranked it third. “Job training services” ranked third in the staff survey and first in the partner survey. Other items were also ranked in the same position or closely to the same position on both surveys, indicating that staff and partners share similar viewpoints on regarding effective service provision. The open-ended category “other” was selected by five staff survey respondents. The respondents were provided the opportunity to describe additional services that DVR is effective in providing that were not in the list. Vocational counseling and guidance were cited by two of the five respondents. Diagnostic information, personal/consumer empowerment, transition Pre-ETS, and finding comparable benefits were each noted one time.
Changes that will Improve Service Delivery:
Staff were presented with a list of sixteen options and asked to identify the top three changes that would enable them to better assist their DVR consumers. Table 38 details the staff responses to this question.

DVR 2018 CSNA 49
Table 38 Top Three Changes That Would Enable Staff to Better Serve Consumers
Top Three Changes to Help Better Serve DVR Consumers
Times identified as a Barrier
Percent of time chosen
Improved business partnerships 13 56.5% More community-based service providers for specific services 8 34.8%
More effective community-based service providers 7 30.4% Smaller caseload 5 21.7% More streamlined processes 5 21.7% Incentives for high performing service providers 5 21.7% Increased options for technology use to communicate with consumers 5 21.7%
Better assessment tools 4 17.4% More administrative support 4 17.4% Other (please describe) 4 17.4% Better data management tools 3 13.0% Increased outreach to consumers 3 13.0% Increased collaboration with other workforce partners including Workforce Centers 3 13.0%
Additional training (please identify what training areas you have need of) 2 8.7%
More supervisor support 2 8.7% Accountability for poor performance by service providers 2 8.7%
The items most frequently identified items among the top three changes that would enable staff to better serve consumers were improved business partnerships, more community-based service providers for specific services, and more effective community-based service providers. Partner survey respondents had a slightly different selection list. However, items that appeared in the top five of each list include more streamlined processes, improved business partnerships and smaller caseloads indicating that both staff and partners agree on changes that would improve consumer services. More additional training, supervisor support and accountability for poor performance by service providers were the least cited items on the list by staff respondents. The four respondents who selected the category of “other” were provided an opportunity to submit a narrative response. Content analysis revealed that the narrative responses were unique in content. Quotes found in the narrative responses that were not on the list include:
• “A more streamlined process to pay vendors to foster positive relationships with existing and potential vendors”
• “Employee housing partnerships” • “Recognition of staff and better top leadership” • “Retain VR counselors, turnover is horrendous”

DVR 2018 CSNA 50
KEY INFORMANT AND FOCUS GROUP INTERVIEWS
The following themes emerged on a recurring basis from the individual interviews and focus groups conducted for this assessment as it relates to overall program performance for Wyoming DVR:
• It was clear from the assessment that DVR staff care about serving people with disabilities. It was apparent that staff are passionate about the impact they are making in people’s lives.
• Overall, DVR is effectively fulfilling its mission, but there are areas that need improvement in order to increase the positive impact on individuals with disabilities, including timeliness of services.
• Staff and partners indicated that the multiple change initiatives over the past few years related to WIOA implementation appear to be on the right track and many can see light at the end of the ever-changing tunnel.
• Many barriers to accessing and maintaining employment for DVR consumers were noted on a repeated basis. Common barriers include:
o Transportation: The local transportation only runs during the day which limits flexible opportunities for people to work nights, weekends and holidays. There is no transportation in rural areas. DVR struggles with the ability to provide and identify long-term transportation services.
o Disability and DVR awareness in the community. o The lack of industry and of jobs in the rural areas. o Employers still have misconceptions about the ability of individuals with
disabilities to perform meaningful work. • Most interviewed believe the emphasis on youth is positive and is the correct path for
DVR to follow into the future. There is some concern about how the emphasis on serving youth will affect services to adults.
• Turnover was mentioned multiple times as a barrier to the effectiveness of DVR and the timely provision of services. Turnover was mentioned as a concern at the agency and provider level.
• DVR values the person-centered approach which increases the effectiveness in helping participants maximize their potential. This can be adversely affected by inefficient and ineffective practices, fiscal constraints, and the need for increased collaboration among DVR and community partners.
• In-service trainings have improved over the years, however, onboarding training is an area in need of further development.
• The ability to serve rural areas of the State is an essential component of VR in Wyoming as the vast majority of the State is rural. DVR needs to examine ways to expand the use of distance technologies and online platforms to serve individuals in the rural areas.

DVR 2018 CSNA 51
RECOMMENDATIONS
The following recommendations are offered to Wyoming DVR based on the results of the research in the Overall Agency Performance area:
• DVR should consider conducting a training needs analysis of field staff to address competency gaps. DVR should evaluate the timeliness of the delivery of training, as well as follow up and evaluation of the impact of that training. DVR should consider areas where cross-training with partners or providers would be of benefit and they are encouraged to invite staff from the various technical assistance centers to assist with the provision of training and technical assistance.
• Because several staff members and partners interviewed for this assessment were unclear about the reasons for the multiple change initiatives related to WIOA implementation, DVR should increase its strategy for including members of the field in policy and procedure changes, training, and feedback.
• DVR is encouraged to evaluate their evaluation and rewards systems to ensure that they are consistent with the new common performance accountability measures in WIOA. One area of possible change is the staff performance evaluation tool.
• DVR should identify ways to increase distance and online options for consumers to participate in the VR process. Some of the possibilities include:
o Increasing access to and the use of social media for consumers and staff o Allowing individuals with disabilities to apply for services online o Providing cell phones for staff and encouraging text messaging as a mode of
communication with clients • DVR should partner with local communities, employers, and other service agencies to
collaboratively address the transportation limitations in Wyoming. • Consider opportunities for central office and field office staff to collaborate to learn more
about day to day responsibilities and identify and change areas experiencing inefficient and ineffective practices.

DVR 2018 CSNA 52
SECTION TWO: NEEDS OF INDIVIDUALS WITH THE MOST SIGNIFICANT
DISABILITIES, INCLUDING THEIR NEED FOR SUPPORTED EMPLOYMENT
Section 2 includes an assessment of the needs of individuals with the most significant disabilities, including their need for supported employment. This section includes the rehabilitation needs of DVR consumers as expressed by the different groups interviewed and surveyed. All of the general needs of VR consumers were included here, with specific needs identified relating to supported and customized employment.
Recurring Themes Across all Data Collection Methods
The following themes emerged in the area of the needs of individuals with the most significant disabilities including their need for supported employment:
• Transportation remains the most significant need of consumers served by DVR, and this is especially true in rural areas
• DVR is serving an increasing number of individuals with mental health impairments and their staff need to receive ongoing training on how to effectively serve this population
• In addition to transportation, there is a need for increased job skills, education and training for individuals with disabilities, especially those with the most significant disabilities to prepare for, obtain and retain employment in Wyoming
• The fear of benefit loss adversely affects the return-to-work behavior of Social Security beneficiaries
• DVR needs to develop their capacity and the capacity of their service providers to deliver customized employment services
• Employer perceptions about the ability of individuals with disabilities to perform the essential functions of jobs is a barrier to employment in Wyoming
NATIONAL AND/OR AGENCY SPECIFIC DATA RELATED TO THE NEEDS OF INDIVIDUALS WITH THE MOST SIGNIFICANT
DISABILITIES, INCLUDING THEIR NEED FOR SUPPORTED EMPLOYMENT:
The project team examined the number and rate of applicants by disability type for DVR in order to determine the demographic make-up of consumers served by the agency. Table 39 contains the results of this analysis.

DVR 2018 CSNA 53
Table 39 DVR Applicants by Disability Type
Disability Number of Applications by Year 2015 2016 2017 2018
Visual Impairment 46 50 53 43 Percent of all applications 2.5% 2.8% 3.3% 2.6%
Physical Impairments 522 472 418 415 Percent of all applications 28.8% 26.5% 26.3% 24.9%
Communicative Impairments 131 130 120 172 Percent of all applications 7.2% 7.3% 7.6% 10.3%
ID/DD or other Cognitive 408 477 383 375 Percent of all applications 22.5% 26.8% 24.1% 22.5%
Mental Health Impairments 703 651 615 661 Percent of all applications 38.8% 36.6% 38.7% 39.7%
The data indicates that individuals with mental health impairments constitute the largest percentage of applicants for DVR services, followed by individuals with physical impairments and individuals with intellectual or other development disabilities. When applicants with mental health impairments are combined with applicants that have ID/DD, they compose more than 62% of the individuals seeking services from DVR. This percentage has been fairly constant throughout the four years of this study.
The project team examined individuals that were classified as supported employment and that were receiving benefits form SSA. These two populations are individuals that are classified as at least significantly disabled by definition. Table 40 contains this information.
Table 40 DVR Applicants by Program Type
Program or Status Number of Applications by Year 2015 2016 2017 2018
Supported Employment 151 126 72 59 Percent of all applications 8.3% 7.1% 4.5% 3.5%
SSA Beneficiaries 575 390 400 450 Percent of all applications 31.8% 21.9% 25.2% 27.0%
The data indicates that from 2016 to 2018, the rate of applicants for DVR services that were SSA beneficiaries steadily increased. Those identified as needing supported employment declined each year from 2015 – 2018. DVR should investigate why these numbers are declining for SE and determine if the waiting list for Medicaid waiver services is affecting the application rate.

DVR 2018 CSNA 54
SURVEY RESULTS BY TYPE
INDIVIDUAL SURVEY RESULTS
Receipt of Social Security Disability Benefits
Respondents were presented with a checklist and asked to indicate whether they received Social Security disability benefits. Table 41 summarizes the responses to this series of questions. It should be noted that individuals were allowed to select more than one response in the series of items (for example, in the case of an individual who received both SSI and SSDI). Table 41 SSA Benefit Status
Indicate Whether You Receive Social Security Benefits Number Percent of
time chosen
I do not receive Social Security disability benefits 88 46.8%
I receive SSDI (Social Security Disability Insurance. SSDI is provided to individuals that have worked in the past and is based on the amount of money the individual paid into the system through payroll deductions)
51 27.1%
I receive SSI (Supplemental Security Income. SSI is a means-tested benefit generally provided to individuals with little or no work history)
30 16.0%
I receive a check from the Social Security Administration every month, but I do not know which benefit I get
11 5.9%
I don't know if I receive Social Security disability benefits 8 4.3%
The most common response to Social Security benefits was “I do not receive Social Security disability benefits.” Of the 188 responses received regarding this question, slightly more than 27% receive SSDI and less than 17% receive SSI. Individual Survey: Barriers to Obtaining a Job
Respondents were presented with a list of 16 barriers to obtaining employment and asked to indicate whether or not the item had been a barrier that impacted their ability to obtain a job. Table 42 summarizes the barriers and the impact on obtaining employment.

DVR 2018 CSNA 55
Table 42 Individual Survey: Obtaining Employment
Individual Survey: Barriers to Obtaining a Job
Yes, has been a Barrier Not a Barrier Number
of Times Selected Number Percent of
Total Number Percent of Total
Lack of job skills 82 52.6% 74 47.4% 156
Employer concerns about my ability to do the job due to my disability 82 52.9% 73 47.1% 155
Lack of education or training 78 50.7% 76 49.4% 154
Lack of available jobs 75 48.7% 79 51.3% 154
Mental health concerns 62 41.1% 89 58.9% 151
Lack of job search skills 60 41.1% 86 58.9% 146
Lack of reliable transportation 47 31.3% 103 68.7% 150
Concern over loss of Social Security benefits due to working 46 30.3% 106 69.7% 152
Lack of reasonable accommodations at work 43 29.7% 102 70.3% 145
Lack of assistive technology 38 26.4% 106 73.6% 144
Criminal Record 17 11.6% 130 88.4% 147
Lack of attendant care 15 10.4% 129 89.6% 144
Lack of housing 12 8.3% 133 91.7% 145
Substance abuse 9 6.2% 137 93.8% 146
Lack of child care 6 4.2% 138 95.8% 144
Limited English skills 5 3.4% 141 96.6% 146
All items on the list with the exception of the top three items were selected by the individual survey respondents as not barriers to obtaining employment. Lack of job skills was the most frequently selected item by 156 respondents as a barrier to obtaining a job. The margin between lack of job skills as a barrier or not a barrier for obtaining employment is narrow (5.2%). Lack of education or training had the smallest gap of respondents (1.3%) when identifying whether or not the item impacted their achievement of their employment goals, signaling that approximately 50% of respondents believe that the item is a barrier impacting obtaining employment. The narrow gaps between yes/no for items being identified as a barrier or not a barrier to employment indicate that a variety of obstacles to gaining employment exist for consumers. Four choices that

DVR 2018 CSNA 56
received less than an 8.5% response rate as a barrier for obtaining employment include: lack of housing, limited English skills, lack of child care, and substance abuse. Individuals were presented with an open-ended question asking them to identify other barriers that they may have experienced that prevented them from obtaining a job. Seventy narrative responses were received. Sixteen of the responses (22.9% of the 70 responses) received indicated that no other barriers were experienced. Content analysis of the remaining responses that indicated other barriers are:
• The consumer’s specific disability impedes the consumer from obtaining a job (20 responses)
• Not being understood and/or communication Respondents were presented with an open-ended question asking them to identify the most significant barriers that they have faced to getting a job. There were 119 individuals that provided narrative responses to this question. Content analysis of the responses yielded the following three themes:
• Physical and/or mental health status
• Transportation issues
• Lack of education and/or training Barriers to Accessing DVR Services
Respondents were presented with a list describing potential barriers to accessing DVR services and asked to indicate whether the barriers had made it difficult for the respondents to access DVR services. Table 43 summarizes the responses to the questions about barriers to accessing DVR services.

DVR 2018 CSNA 57
Table 43 Individual Survey: Barriers to Accessing DVR Services
Individual Survey: Barriers to Accessing DVR Services
Yes, has been a Barrier Not a Barrier Number
of Times Selected Number Percent of
Total Number Percent of Total
Difficulties scheduling meetings with my counselor 30 19.9% 121 80.1% 151
Lack of information about available services 29 19.1% 123 80.9% 152
Difficulties completing the Individualized Plan for Employment (IPE)
21 14.1% 128 85.9% 149
Lack of disability-related accommodations 20 13.6% 127 86.4% 147
Other difficulties with DVR staff 20 13.4% 129 86.6% 149
Lack of available transportation to the DVR office 16 10.7% 134 89.3% 150
DVR's hours of operation 15 10.1% 134 89.9% 149
I have nobody that can help me access services 13 9.0% 132 91.0% 145
Difficulties completing the DVR application 7 4.8% 140 95.2% 147
Language barriers 4 2.7% 144 97.3% 148
Analysis of the responses to the questions regarding barriers to accessing DVR services indicate a small number of individuals experience barriers while the majority of consumers are able to access DVR services. Overall, more than 80% of respondents indicated that each item on the list were not barriers. However, two items were cited as barriers to accessing DVR services with percentage rates slightly lower than 20%. The two items most frequently cited as barriers were difficulties scheduling meetings with my counselor and lack of information about available services. The least common barriers chosen by respondents, receiving less than a 5% rate were difficulties completing the DVR application and language barriers. Respondents were presented with a yes-no question asking them if there was anything else that were challenges or barriers not already mentioned that made it difficult to access DVR services. Table 44 contains a summary of the responses to the question.

DVR 2018 CSNA 58
Table 44 Additional Barriers to Accessing DVR Services
Individual Survey: Other Challenges or Barriers Not Already Mentioned = Difficult to Access VR Services Number Percent
No 128 81.5%
Yes (please describe) 29 18.5%
Total 157 100%
Of the 29 responses received that indicated yes to the question regarding other challenges or barriers to accessing DVR services, all 29 individuals provided a narrative response. Content analysis of the narrative responses revealed that 19 of the respondents had difficulty with specific communication with DVR that made it difficult to access services. The remaining narrative responses referenced circumstances such as vendors quitting, no follow-up from the job coach, being overeducated, or not knowing what they desired. Anything Else to Add About DVR and Services: Survey respondents were given the opportunity to make a narrative statement regarding DVR and the services DVR provides upon completing the survey. Seventy-nine narrative responses were received. Of the 79 responses received, 28 of the narrative comments reflected appreciation for DVR services in statements such as: “They gave me excellent services” “Thank you for being as helpful and kind as you have been to me” and, “I believe that DVR is a very valuable program and more people need to know about it and its services.” Twenty of the narrative responses cited “No” or N/A” without making additional comments and the remaining narrative responses addressed the challenges such as: difficulties with job coaches, finding a job, counselor responsiveness, and the slow processes.
PARTNER SURVEY RESULTS:
Partner Survey: Barriers to Achieving Employment Goals
Partner survey respondents were given a list of 20 barriers and asked to identify the most common barriers to achieving employment goals for DVR consumers. Table 45 lists the barriers along with the number of times each of the barriers was cited by partner survey respondents.

DVR 2018 CSNA 59
Table 45 Common Barriers to Achieving Employment Goals: General DVR Consumers
Common Barriers to Achieving Employment Goals: General DVR Consumers
Number of Times identified
as a barrier
Percent of time chosen
Employers' perceptions about employing persons with disabilities 22 84.6%
Little or no work experience 19 73.1%
Not having job skills 18 69.2%
Poor social skills 16 61.5%
Not having education or training 15 57.7%
Not having job search skills 14 53.8%
Mental health issues 11 42.3%
Not enough jobs available 10 38.5%
Other transportation issues 10 38.5%
Convictions for criminal offenses 9 34.6%
Perceptions regarding the impact of income on Social Security benefits 9 34.6%
Disability-related transportation issues 8 30.8%
Substance abuse issues 7 26.9%
Not having disability-related accommodations 6 23.1%
Language barriers 5 19.2%
Other health issues 3 11.5%
Childcare issues 3 11.5%
Housing issues 3 11.5%
Partner survey respondents and individual survey respondents answered the question regarding barriers to achieving employment goals similarly. Partner and individual survey respondents selected employers’ perceptions about employing persons with disabilities and not having job skills as part of the top three common barriers to employment for DVR consumers. Childcare issues and housing issues were in the bottom four of each survey’s list as barriers. Transportation ranked below the sixth position on both lists, which represents a significant difference from the interviews conducted for this assessment.

DVR 2018 CSNA 60
Partner Survey: Barriers to Achieving Employment for DVR Consumers with the Most Significant Disabilities
Partner survey respondents were given a list of 20 barriers, including an option for “other”, and were asked to identify the barriers that prevent DVR consumers with the most significant disabilities from achieving their employment goals. Table 46 lists the barriers along with the number of times a barrier was cited by partner survey respondents. There was no limit to the number of barriers that a partner respondent could choose.
Table 46 Barriers to Achieving Employment Goals: Consumers with the Most Significant Disabilities
Barriers to Achieving Employment Goals: Consumers w/ Significant Disabilities
Number of Times identified as a
barrier
Percent of time chosen
Not having job skills 19 76.0%
Employers' perceptions about employing persons with disabilities 17 68.0%
Little or no work experience 16 64.0%
Not having education or training 15 60.0%
Poor social skills 11 44.0%
Disability-related transportation issues 9 36.0%
Not having job search skills 8 32.0%
Perceptions regarding the impact of income on Social Security benefits 8 32.0%
Not having disability-related accommodations 6 24.0%
Language barriers 5 20.0%
Not enough jobs available 5 20.0%
Lack of help with disability-related personal care 5 20.0%
Mental health issues 5 20.0%
Other transportation issues 4 16.0%
Childcare issues 3 12.0%
Convictions for criminal offenses 2 8.0%
Substance abuse issues 2 8.0%
Other health issues 2 8.0%
Housing issues 1 4.0%

DVR 2018 CSNA 61
When community partners were asked to identify the most common barriers to employment for individuals with the most significant disabilities, they indicated that not having job skills and employers’ perceptions about employing persons with disabilities most frequently. The same barriers were in the first three positions on the lists chosen by partners for racial and ethnic minorities and general consumers.
Partner Survey: Difficulties Accessing DVR Services
Respondents were presented with a question that prompted them to indicate the top three reasons that people with disabilities might find it difficult to access DVR services. Twelve response options were provided. Table 47 lists the barriers to DVR access along with the number of times each of the barriers was identified as one of the top three barriers by the partner survey respondents.
Table 47 Top Three Barriers to Accessing DVR Services
Top Three Barriers to Accessing DVR Services Times identified as a barrier
Percent of time chosen
Slow service delivery 10 43.5%
Other (please describe) 8 34.8%
Difficulties completing the application 7 30.4%
Difficulties accessing training or education programs 7 30.4%
Lack of options for the use of technology to communicate with DVR staff such as Skype, text, etc. 6 26.1%
DVR staff do not meet clients in the communities where the clients live 6 26.1%
Limited accessibility of DVR via public transportation 5 21.7%
Inadequate assessment services 5 21.7%
Inadequate disability-related accommodations 3 13.0%
Other challenges related to the physical location of the DVR office 2 8.7%
Difficulties completing the Individualized Plan for Employment (IPE) 2 8.7%
Language barriers 0 0.0%
The community partners chose slow service delivery more than any other barrier related to accessing DVR services for consumers. Difficulties completing the DVR application process and difficulties accessing training or education programs were selected an equal number of times, ranking both items in the third position for the most common barriers.

DVR 2018 CSNA 62
The option of “other” in response to the question on barriers to accessing services was the second most common barrier choice by community partners, selected eight times. The comments that reflected barriers to access for individuals with disabilities are cited here:
• “DVR counselors - most of them move on to better jobs after completing DVR education requirements”
• “I feel that all information needs to be shared with the DVR selected job coach/employment specialist that could impact where a client may wish to work”
• “Job service website is NOT user friendly or easy to use” • “Lack of information about DVR Services” • “Long and cumbersome intake process involving many appointments”
STAFF SURVEY RESULTS
Staff Survey: Barriers to Achieving Employment Goals
Staff survey respondents were given the same list of 20 barriers to employment that the partner survey respondents were given, and asked to identify the most common barriers to achieving employment goals for DVR consumers. Table 48 lists the barriers along with the number of times each of the barriers was identified by staff survey respondents. There was no limit to the number of barriers that a staff respondent could choose.

DVR 2018 CSNA 63
Table 48 Common Barriers to Achieving Employment Goals for DVR Consumers
Common Barriers to Achieving Employment Goals: General DVR Consumers
Times identified as a barrier
Percent of time chosen
Little or no work experience 19 82.6% Mental health issues 19 82.6% Convictions for criminal offenses 17 73.9% Poor social skills 15 65.2% Other transportation issues 15 65.2% Substance abuse issues 15 65.2% Not having job skills 14 60.9% Not having education or training 13 56.5% Not having job search skills 12 52.2% Disability-related transportation issues 11 47.8% Perceptions regarding the impact of income on Social Security benefits 11 47.8%
Employers' perceptions about employing persons with disabilities 10 43.5%
Not enough jobs available 9 39.1% Housing issues 9 39.1% Not having disability-related accommodations 8 34.8% Other health issues 7 30.4% Lack of help with disability-related personal care 5 21.7% Childcare issues 5 21.7% Other (please describe) 5 21.7% Language barriers 1 4.3%
It appears that staff, community partners and consumers have different perspectives on the most common barriers to employment for individuals with disabilities in Wyoming. Staff survey results were different from the community partner and individual surveys when identifying the most common barriers. Staff identified little or no work experience, mental health issues, and convictions for criminal offenses as the most common barriers to employment for the consumers they serve with each cited by over 73% of the respondents. Employer perceptions about employing people with disabilities was not as high on the staff list of barriers as it was on the individual or partners survey results. Staff also indicated that substance abuse and other transportation issues more frequently than partners. In addition, the lack of available jobs was cited less frequently than any other barrier to employment on the list of staff responses even though it was cited by almost half of the individuals with disabilities that responded to the survey. Survey respondents who selected “other” were given the opportunity to provide a narrative response. Client’s family and counselor turnover were each cited by two of the five
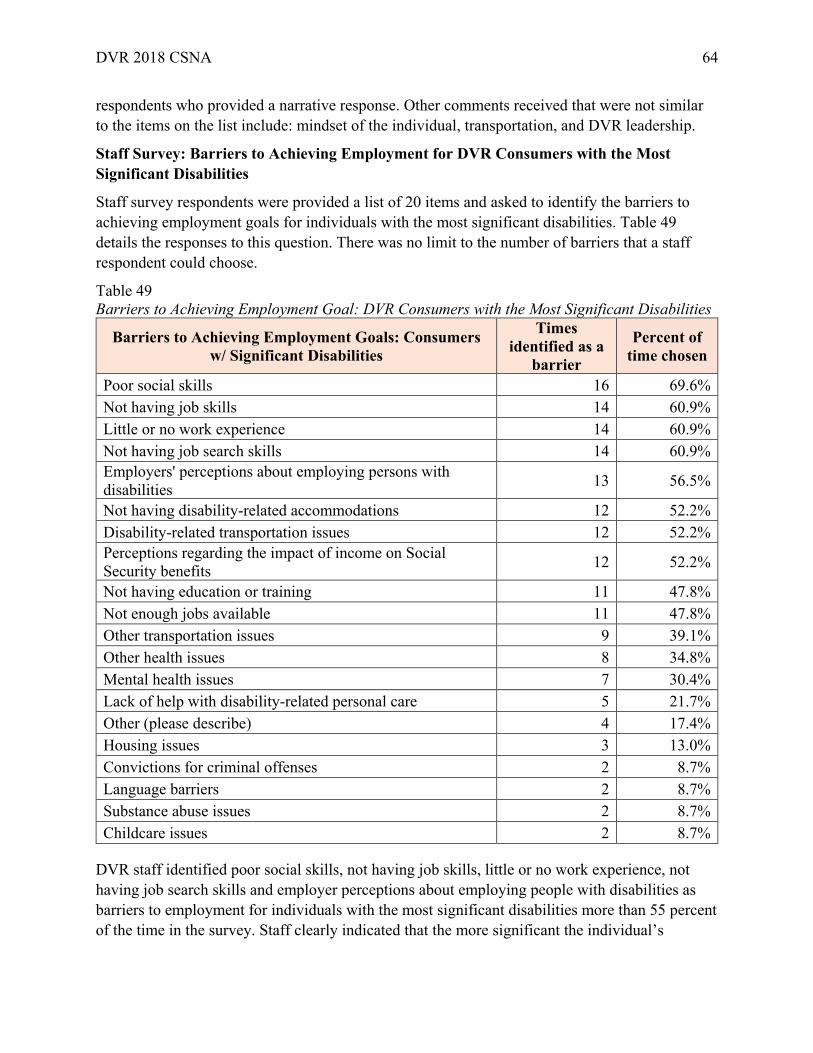
DVR 2018 CSNA 64
respondents who provided a narrative response. Other comments received that were not similar to the items on the list include: mindset of the individual, transportation, and DVR leadership.
Staff Survey: Barriers to Achieving Employment for DVR Consumers with the Most Significant Disabilities
Staff survey respondents were provided a list of 20 items and asked to identify the barriers to achieving employment goals for individuals with the most significant disabilities. Table 49 details the responses to this question. There was no limit to the number of barriers that a staff respondent could choose.
Table 49 Barriers to Achieving Employment Goal: DVR Consumers with the Most Significant Disabilities
Barriers to Achieving Employment Goals: Consumers w/ Significant Disabilities
Times identified as a
barrier
Percent of time chosen
Poor social skills 16 69.6% Not having job skills 14 60.9% Little or no work experience 14 60.9% Not having job search skills 14 60.9% Employers' perceptions about employing persons with disabilities 13 56.5%
Not having disability-related accommodations 12 52.2% Disability-related transportation issues 12 52.2% Perceptions regarding the impact of income on Social Security benefits 12 52.2%
Not having education or training 11 47.8% Not enough jobs available 11 47.8% Other transportation issues 9 39.1% Other health issues 8 34.8% Mental health issues 7 30.4% Lack of help with disability-related personal care 5 21.7% Other (please describe) 4 17.4% Housing issues 3 13.0% Convictions for criminal offenses 2 8.7% Language barriers 2 8.7% Substance abuse issues 2 8.7% Childcare issues 2 8.7%
DVR staff identified poor social skills, not having job skills, little or no work experience, not having job search skills and employer perceptions about employing people with disabilities as barriers to employment for individuals with the most significant disabilities more than 55 percent of the time in the survey. Staff clearly indicated that the more significant the individual’s

DVR 2018 CSNA 65
disability, the more likely employer perceptions about them would be a barrier to employment. Disability-related transportation, not having disability-related accommodations and perception regarding impact of income on Social Security benefits were also cited as barriers to employment for this group over 50 percent of the time.
Respondents who selected the category “other” were provided the opportunity to write a narrative response. Content analysis of the 4 narrative responses indicated the following barriers that occurred more than once along with the number of times they occurred:
• Counselor turnover (2 times) • DVR Leadership (2 times) • Low morale of employees equals poor service delivery (1 time) • Job coaching is not readily available (1 times)
Staff Survey: Difficulties Accessing DVR Services
Staff survey respondents were presented with a question that prompted them to indicate the top three reasons that people with disabilities might find it difficult to access DVR services. A list of 12 response options was provided. Table 50 contains the list of reasons (identified as barriers to DVR access) presented to the respondents along with the number of times each of the barriers was identified as one of the top three barriers to DVR access for consumers, and the percentage of time it was chosen as one of the top three barriers to access.
Table 50 Top Three Barriers to Accessing DVR Services: General DVR Consumers
Top Three Barriers to Accessing DVR Services: General DVR Consumers
Times identified
as a Barrier
Percent of time
chosen
Limited accessibility of DVR via public transportation 12 54.5% Lack of options for the use of technology to communicate with DVR staff such as Skype, text, etc. 9 40.9%
Other (please describe) 8 36.4% Slow service delivery 6 27.3% DVR staff do not meet clients in the communities where the clients live 6 27.2% Inadequate assessment services 4 18.2% Difficulties accessing training or education programs 3 13.6% Difficulties completing the Individualized Plan for Employment (IPE) 2 9.1% Other challenges related to the physical location of the DVR office 1 4.5% Inadequate disability-related accommodations 1 4.5% Language barriers 1 4.5% Difficulties completing the application 1 4.5%
The barriers to accessing DVR services most frequently cited by staff included limited access to DVR via public transportation, lack of options for the use of technology to communicate with

DVR 2018 CSNA 66
DVR staff such as Skype, text, etc., and other (please describe). The top three access barriers are different for all groups that responded to the program evaluation.
There were eight respondents who selected the “other” category, and they were provided an opportunity to submit a narrative response. Content analysis outlines a variety of concerns associated with accessing DVR services. Two items each appeared twice in the written responses. These items are:
• The need for improved leadership • Clients not aware DVR is an option or not aware of services available
KEY INFORMANT AND FOCUS GROUP INTERVIEWS
The following themes emerged on a recurring basis from the individual interviews and focus groups conducted for this assessment regarding the needs of individuals with the most significant disabilities, including their need for supported employment:
• Transportation was the most commonly cited rehabilitation need of individuals with disabilities, especially those with the most significant disabilities. The rural nature of the State limits public transportation options and the inability of people to get to training and work adversely affects employment opportunities. This is true for all populations served or potentially served by DVR.
• Supported Employment (SE) is a necessary service for people with the most significant disabilities and needs, including severe and persistent mental illness. Wyoming has providers who specialize in these services in Casper and Cheyenne.
• Multiple staff and partners indicated that DVR is serving a growing number of individuals with mental health impairments and co-occurring substance abuse disorders. Staff and partners expressed a need to receive ongoing training in how to effectively work with these populations.
• Rural areas have no access to SE services, except in the rare cases where there is an individual service provider that has experience in SE.
• Individualized Placement Services (IPS) and Customized Employment (CE) need capacity building and training to build short and long-term supports for people with the most significant disabilities.
• Although there are a few service providers that have been trained in customized employment, DVR has no separate rate structure for this service, which prevents CE from being provided in its purest form. There are parts of CE that can be provided to consumers, but this occurs as part of supported employment services that are somewhat individualized as opposed to traditional customized employment.
• Collaboration across systems serving individuals with the most significant disabilities was generally characterized as an area that can be improved. DVR, the Wyoming Department of Health’s Behavioral Health Division (the Medicaid Waiver Program), and

DVR 2018 CSNA 67
the Department of Mental Health, need to coordinate services in order to ensure that the gaps in service delivery are adequately addressed. This is especially important when funding cuts, staff turnover, or other impacts on one or more of the agencies affects the ability to meet the needs of individuals with the most significant disabilities.
• Wyoming is an Employment First State, and they have in effect eliminated subminimum wage employment throughout the State. Although there is no legal prohibition against paying subminimum wages, DVR has strongly advocated for competitive integrated employment (CIE), as have other agencies, and this has eliminated subminimum wage employment in the State. The most current data on 14c certificate holders available from the Wage and House Division of the Department of Labor indicates that there is only one valid 14c certificate in Wyoming, and this certificate is listed as “pending” rather than active.
• Multiple staff and partners indicated that a large percentage of individuals that they work with received either Supplemental Security Income (SSI) or Social Security Disability Insurance (SSDI). These beneficiaries often had to go through a very long and arduous process to become eligible for benefits. This process can take more than two years and includes multiple appeals of eligibility denial. Consequently, these individuals are very fearful that working will result in benefit loss, so they seek work at a part-time level to augment benefits, rather than striving for self-sufficiency through work.
• The waiting list for Medicaid waiver services was consistently reported as very long, exceeding two years in many cases. DVR serves a large number of individuals with ID/DD, so the wait list adversely affects extended services for SE for this population.
• The mental health service system in Wyoming was described as impacted in the rural areas of the State, with access to psychiatrists described by multiple DVR staff as non-existent.
RECOMMENDATIONS
The following recommendations are offered to Wyoming DVR based on the results of the research in the Needs of Individuals with the Most Significant Disabilities, including their need for Supported Employment are:
• DVR needs to continue to recruit SE providers to work in the rural areas. This will likely need to include recruitment of individual service providers because of the lack of community rehabilitation programs in the rural areas of the State. DVR may wish to consider a “growing our own” program where consumers that demonstrate a high level of commitment to serving others are trained to become service providers for other consumers once they exit the program.
• In order to ensure that Medicaid waiver services are available for eligible individuals once they stabilize on the job and are ready to transition to extended services, DVR needs

DVR 2018 CSNA 68
to encourage parents and/or care providers to apply for Medicaid waiver services while their child is in high school.
• DVR should recruit Community Rehabilitation Programs (CRPs) that are willing to apply for and become Employment Networks for the Social Security Administration’s Ticket to Work program so that they can utilize these EN’s for extended service provision for individuals that require the SE service model but do not qualify for the Medicaid Waiver program. This recommendation is made specific to the Wyoming Workforce Centers in Section Five of this report.
• Consider implementing a team approach to Supported Employment emphasizing the culture of everyone succeeding together.
• DVR and partners are encouraged to engage in cross-training across systems and providers on SE and specialized supports to increase services and outcomes.
• Provide means for training in IPS and CE to increase DVR’s ability to serve people with the most significant needs.
• DVR should consider funding CE training and development to increase the number of individuals who could benefit in terms of an employment outcome and the number of qualified providers willing to offer customized employment services. In order to try and increase the quality and consistency of CE services, DVR is encouraged to consider using the Essential Elements of Customized Employment for Universal Application developed by the WINTAC in partnership with RSA and the Office of Disability Employment Policy (ODEP). The Essential Elements document acts as a guide to ensure that when CE is provided, the services include consistent elements regardless of the provider. The document can be found here: http://wintac-s3.s3-us-west-2.amazonaws.com/topic-areas/Recommendations-for-Customized-Employment-Practices_FINAL.pdf.
• The rate of consumers served by DVR that have either a primary or co-occurring disability of substance abuse necessitates that DVR staff and partners increase collaboration and partnerships with other State and community organizations that serve youth and adults in recovery. DVR is encouraged to share expertise and resources with recovery programs and provide training to counselors and providers on ways to help consumers address the multiple dimensions of recovery that include:
a. Planning for physical and emotional health; b. Helping the individual identify resources to ensure that they have a safe and
supportive living environment; c. Assist the individual to have hope, often as a result of a sense of purpose which
can frequently be established through the pursuit of meaningful employment; and d. Provide the individual with resources that can help establish a support network
and build a sense of community.
The dimensions of recovery noted above are also applicable to individuals with mental health impairments and are recognized as a standard of effective counseling and treatment by the Substance Abuse and Mental Health Services Administration (SAMHSA) found here: https://www.samhsa.gov/.

DVR 2018 CSNA 69
• A large percentage of VR consumers are SSA beneficiaries whose fear of benefit loss affects their return-to-work behavior. Although DVR does refer consumers for benefits planning for this population, it would be helpful to augment these benefits planning services with training for staff and providers on strategies that contribute to the pursuit of work above the level of SGA, including self-sufficiency. These interventions and strategies include:
o Establishing and reinforcing high expectations for the individual; o Identifying role models, or peer mentors that will model positive behavior and
provide a positive “push” for the individual to achieve their maximum potential (in many instances, the positive push can come from the rehabilitation counselor if there are no family members, friends or mentors available);
o Maximizing the individual’s ability to live and function independently; o Reinforcing the need for tenacity and persistence by the individual by helping
them develop resiliencies, and then providing constant support and positive feedback;
o Benefits planning that is ongoing and plans for overpayments when work occurs. Overpayments are planned for and the individual or the Benefits Planner is aware enough to calculate the effect of wages on benefits by themselves and set aside dollars that will likely occur as a result of overpayments for future payback to SSA;
o Pursuit of higher education at the highest possible level for the individual; and o Work experience, internships or any exposure to work in the beneficiary’s field of
choice.

DVR 2018 CSNA 70
SECTION THREE: NEEDS OF INDIVIDUALS WITH DISABILITIES FROM
DIFFERENT ETHNIC GROUPS, INCLUDING NEEDS OF INDIVIDUALS WHO MAY HAVE BEEN UNSERVED OR
UNDERSERVED BY THE VR PROGRAM
Section 3 includes an identification of the needs of individuals with disabilities from different ethnic groups, including needs of individuals who may have been unserved or underserved by DVR.
Recurring Themes Across all Data Collection Methods
The following themes emerged in the area of the needs of individuals with disabilities from different ethnic groups, including individuals who may have been unserved or underserved by the DVR:
• Individuals with disabilities living in the rural areas of Wyoming were the most frequently mentioned underserved group. The lack of public transportation and the distance that has to be travelled to get to the DVR offices or to work was the primary reason noted for being underserved
• The need for work skills, education, training and rehabilitation professionals that speak their language were the most frequently noted needs of individuals from diverse cultures.
• Deaf individuals and blind individuals were characterized as potentially underserved by DVR
NATIONAL AND/OR AGENCY SPECIFIC DATA RELATED TO THE NEEDS OF INDIVIDUALS WITH DISABILITIES FROM DIFFERENT
ETHNIC GROUPS, INCLUDING NEEDS OF INDIVIDUALS THAT MAY HAVE BEEN UNSERVED OR UNDERSERVED BY DVR
Disability/Race/Age
The prevalence of disability among ethnic categories distinguished by working age (18-64 years) for the State is contained in Table 51 (Note: Data is taken from 5-year US Census estimates as data was not available for all races in 1-year estimates.) DVR data is taken from their case management system.

DVR 2018 CSNA 71
Table 51 Disability Status + Age (18 to 64 years) + Race
Race Number of WAWD in
WY
Percent of Total
Number in DVR
Percent of Total Difference
All 41,294 100.0% NA NA NA White 34,355 83.2% 1624 85.5% 2.3%
Black/African 480 1.2% 49 2.6% 1.4% Hispanic/Latino 3,343 8.1% 164 8.6% 0.5%
Am Indian & Alaskan Native 1,125 2.7% 51 2.7% 0.0% Asian 246 0.6% 6 0.3% -0.3%
Native Haw. Or Pac Islander 16 0.0% 6 0.3% 0.3% Source: U.S. Census Bureau, 2012-2016 American Community Survey 5-Year Estimates
In 2016, the total civilian noninstitutionalized population (TCNP) in Wyoming was 628,790 (including those of Hispanic and Latino descent) and the TCNP with a disability was 77,596 (12.3%). The total population of working age in the State is 389,140 and total population of working age with as disability is 41,294, indicating that 10.6% of individuals ages 18 to 64 report a disability.
The ethnic category with the largest number of working age individuals with a disability in Wyoming is White, (34,355 individuals or 83.2%). Native Hawaiian or Pacific Islanders (16 or 0.0%) is the ethnic category with the least number of working age individuals with a disability. Working age Asians with a disability also account for less than 1% of the State’s total number of working age with a disability.
Hispanic/Latinos ages of working age with a disability (3,343) account for 8.1% of the State’s total number of working age with a disability (the second highest rate in the State). Black/African Americans of working age with a disability (480), account for 1.2% of the State’s total number of working age individuals with a disability while American Indian and Alaskan Natives account for 2.7%.
Individuals identifying as “Some Other Race” and “Two or More Races” account for 0.9% and 3.3% (respectively) of the State’s working age with a disability. “Two or More Races” has a higher rate of working age with a disability than American Indian/Alaskan Natives, Asians, and Native Hawaiian or Other Pacific Islanders.
When the rate of working age adults with a disability is compared by race to the rate of consumers served by DVR by race, the differences are minimal. Whites appear at a slightly higher rate in the DVR population than they do in the general Working Age With Disabilities (WAWD) population, but all other races are within one to one and a half percentage points. This is important information for the organization as there is a belief expressed by most individuals interviewed for this study that Hispanic individuals are underserved by the organization. This does not appear to be supported by the data.

DVR 2018 CSNA 72
Ethnicity and Disability Type Prevalence Rates
Tables 52 and 53 contain information on the State’s disability prevalence rates categorized by ethnicity, age 18 to 64, and disability type for the year 2016 calculated by Cornell University. The base population used by Cornell University for the individual ethnic categories is provided in Table 52.
Table 52 Cornell University Working Age Base Population by Race: WY
Race Base Population Ages 18 to 64
White, non-Hispanic 302,400 Black/African American, non-Hispanic 3,200 American Indian and Alaskan Native, non-Hispanic 7,000
Asian, non-Hispanic 3,300 Native Hawaiian and Other Pacific Islander, non-Hispanic No Data
Some Other Race, non-Hispanic 5,800 Hispanic/Latino 31,800
Source: http://disabilitystatistics.org
Table 53 contains the State’s disability prevalence rates categorized by ethnicity, age 18 to 64, and disability type.
Less than 3% of all ethnic categories with the exception of American Indian and Alaskan Natives reported a visual disability. American Indian and Alaskan Natives have the highest rate of individuals ages 18 to 64 reporting a visual disability (8.9%). Additionally, self-care disability was reported by less than 3% of all ethnic categories.
Greater than 3% of working age Asians (3.5%), White (3.9%), and individuals of Some Other Race (4.9%), reported a hearing disability.
Ambulatory disability was the most frequently reported disability type among White Americans (5.2%) while cognitive disability was the most frequently reported disability type among Black/African Americans (4.4%) and Hispanic/Latinos (5.2%). Ambulatory disability was the second most frequently reported disability type among Black/African Americans while an independent living disability was the second most frequently reported disability type among Hispanic/Latinos.
Individuals who identify as “Some Other Race” reported an independent living disability most frequently (7%), followed by 5.3% reporting a cognitive disability and 4.9% reporting a hearing disability.

DVR 2018 CSNA 73
Table 53 Disability Type and Ethnicity: Ages 18 to 64
Race
Visual Disability
Hearing Disability
Ambulatory Disability
Cognitive Disability
Self-care Disability
Independent Living
Disability
(N) (%) (N) (%) (N) (%) (N) (%) (N) (%) (N) (%)
White, non-Hispanic 6,500 2.2% 11,700 3.9% 15,700 5.2% 15,400 5.1% 5,400 1.8% 12,400 4.1%
Black/African American, non-Hispanic
0 0.0% 0 0.0% 100 2.4% 100 4.4% 0 0.0% 0 0.0%
American Indian and Alaskan Native, non-Hispanic
600 8.9% 100 1.8% 500 6.6% 400 6.1% 200 2.6% 400 5.5%
Asian, non-Hispanic 0 0.0% 100 3.5% 0 0.0% 0 0.0% 0 0.0% 0 0.0%
Native Hawaiian and Other Pacific Islander, non-Hispanic
No Data
No Data No Data No
Data No Data No Data No Data No
Data No
Data No
Data No Data No Data
Some Other Race, non-Hispanic
100 1.6% 300 4.9% 300 4.5% 300 5.3% 0 0.7% 400 7.0%
Hispanic / Latino 800 2.5% 700 2.2% 1,200 3.8% 1,700 5.2% 400 1.2% 1,400 4.5%
Source: http://disabilitystatistics.org
SURVEY RESULTS BY TYPE
INDIVIDUAL SURVEY RESULTS
Individuals were asked to report their primary race or ethnic group. Responses to this question are detailed in Table 54.

DVR 2018 CSNA 74
Table 54 Ethnicity of Respondents Race/Ethnicity Number Percent of Total
Caucasian/White 157 88.2%
Hispanic/Latino 12 6.7%
American Indian or Alaska Native 6 3.4%
Other (please describe) 6 3.4%
African American/Black 2 1.1%
Asian 2 1.1%
Hawaiian or Other Pacific Islander 1 0.6%
I don't know 1 0.6%
Total 178 100%
The majority of respondents to the question regarding ethnicity identified as Caucasian/White, while Hispanic/Latinos and American Indian/Alaskan Native respondents accounted for slightly more than 10% of the total number of responses received. Individuals were asked a question regarding their preferred language for communication. Table 55 summarizes the responses received. Table 55 Preferred Language for Communication
Preferred Language for Communication Number Percent
English 174 98.3%
Other (Please identify) 2 1.1%
American Sign Language 1 0.6%
Spanish 0 0.0%
Hawaiian 0 0.0%
Chinese 0 0.0%
Japanese 0 0.0%
Total 177 100%
The two responses received in the category “other” cited “English and ASL” and “English” as preferred language for communication.

DVR 2018 CSNA 75
PARTNER SURVEY RESULTS:
Partner Survey: Barriers to Employment for Consumers who belong to a Racial or Ethnic Minority
Survey respondents were asked to identify the barriers to achieving employment goals for consumers who were racial or ethnic minorities from a list of 20 barriers. Table 56 lists the barriers along with the number of times each of the barriers was identified. There was no limit to the number of items a respondent could choose.
Table 56 Barriers to Achieving Employment Goals: Racial or Ethnic Minorities
Barriers to Achieving Employment Goals: Ethnic Minorities
Number of Times identified
as a barrier
Percent of time chosen
Not having education or training 13 61.9%
Not having job skills 11 52.4%
Employers' perceptions about employing persons with disabilities 11 52.4%
Language barriers 10 47.6%
Little or no work experience 9 42.9%
Poor social skills 7 33.3%
Other transportation issues 7 33.3%
Not having job search skills 6 28.6%
Not enough jobs available 5 23.8%
Mental health issues 5 23.8%
Perceptions regarding the impact of income on Social Security benefits 4 19.0%
Disability-related transportation issues 3 14.3%
Convictions for criminal offenses 2 9.5%
Substance abuse issues 2 9.5%
Other health issues 2 9.5%
Childcare issues 2 9.5%
Housing issues 2 9.5%
Other (please describe) 1 4.8%
Not having disability-related accommodations 0 0.0%

DVR 2018 CSNA 76
The community partner respondents indicated that not having sufficient education or training, not having job skills, and employers' perceptions about employing persons with disabilities were the most common barriers to employment for racial or ethnic minorities, which is similar to partner choices for those of the general DVR population and those with the most significant disabilities. The comment received from the single response in the category “other” was “Not sure.”
STAFF SURVEY RESULTS
Staff Survey: Barriers to Employment for Consumers Who are Racial or Ethnic Minorities
Staff survey respondents were asked to identify the barriers to achieving employment goals for consumers who are racial or ethnic minorities from a list of 20 barriers. Table 57 lists the barriers along with the number of times each of the barriers was cited. There was no limit to the number of items a respondent could select.
Table 57 Barriers to Achieving Employment Goals: Racial or Ethnic Minorities
Barriers to Achieving Employment Goals: Racial or Ethnic Minorities
Times identified as a
barrier
Percent of time chosen
Not having education or training 13 59.1% Little or no work experience 13 59.1% Not having job search skills 11 50.0% Not having job skills 10 45.5% Poor social skills 10 45.5% Other transportation issues 10 45.5% Language barriers 9 40.9% Employers' perceptions about employing persons with disabilities 9 40.9% Mental health issues 8 36.4% Substance abuse issues 8 36.4% Housing issues 8 36.4% Convictions for criminal offenses 7 31.8% Not enough jobs available 7 31.8% Childcare issues 7 31.8% Other health issues 5 22.7% Other (please describe) 5 22.7% Disability-related transportation issues 4 18.2% Not having disability-related accommodations 2 9.1% Perceptions regarding the impact of income on Social Security benefits 2 9.1%
Lack of help with disability-related personal care 1 4.5%

DVR 2018 CSNA 77
The top three most frequently cited barriers to achieving employment goals for minority consumers chosen by staff respondents were different from the ranking order of the partner responses with the exception of the lack of education or training. The identified need for education, training and job skills should be considered in light of the numbers of minority consumers that receive academic training as VR consumers.
KEY INFORMANT AND FOCUS GROUP INTERVIEWS
The following themes emerged in the needs of individuals with disabilities from different ethnic groups, including individuals who have been potentially unserved or underserved by Wyoming DVR:
• The far rural areas of Wyoming were identified as underserved because individuals with disabilities in these areas do not have access to transportation to get to DVR satellite offices.
• Hispanics were cited most frequently as a potentially underserved population. This was generally associated with a mistrust of government and a tendency to rely on family to take care of individuals with disabilities in the community.
• Youth that are served by Foster Care or that have been involved with Juvenile Justice were described as potentially underserved.
• The last several years has seen an increase in the Somali refugee population in the Cheyenne area, and this group was cited as potentially underserved due to language barriers and undocumented status.
• There are two Native American 121 Tribal Vocational Rehabilitation programs in Wyoming. These programs are the Northern Arapaho and Eastern Shoshone VR programs. Of these two Tribal VR programs, DVR works most closely with the Northern Arapaho program. There is considerable room for growth in the relationship as it relates to co-enrollment of consumers and shared services. This does happen with the Northern Arapaho program, but is non-existent with the Eastern Shoshone.
• Multiple staff and partners indicated that there are low levels of incidents of individuals with blindness or deafness served by DVR. It is not clear if these low levels are a result of there simply not being a need for VR services by these groups, a low level of occurrence in the general population, or some other factors.

DVR 2018 CSNA 78
RECOMMENDATIONS:
The following recommendations are offered to Wyoming DVR based on the results of the research in the Needs of Individuals with Disabilities from Different Ethnic Groups, including needs of Individuals who have been Unserved or Underserved by the DVR Program area:
• DVR should investigate the use of distance technologies and videoconferencing software programs to facilitate access and delivery of services to individuals in the rural areas of the State.
• DVR should outreach to Hispanic community groups and cultivate relationships with them to encourage referrals. DVR staff should consider meeting Hispanic individuals in their communities to conduct intake interviews rather than requiring these individuals to come to the DVR office to apply for services.
• Whenever possible, DVR should recruit and hire bilingual staff. This includes staff that are able to be functional in American Sign Language.
• DVR needs to examine their outreach strategies to individuals that are blind and deaf in Wyoming to see if they can increase the rate of service delivery to these individuals. The data indicates that there are White, Native American and Hispanic populations with visual and hearing loss that may be able to benefit in terms of VR services.
• DVR is encouraged to work collaboratively with the Tribal VR programs to increase the incidence of shared cases between the programs. DVR is encouraged to meet with potential consumers on the reservation when invited by the Tribal VR program to do so.
• DVR should consult with the Youth Technical Assistance Center (Y-TAC) to determine if there are strategies they can employ to increase outreach and service to out-of-school youth with disabilities. The Y-TAC can assist DVR to engage in a process-mapping effort to identify how these youth are moving through the system and how DVR can increase their ability to effectively engage these young people.

DVR 2018 CSNA 79
SECTION FOUR: NEEDS OF YOUTH WITH DISABILITIES IN TRANSITION
The reauthorization of the Rehabilitation Act under WIOA places a greater emphasis on the provision of transition services to youth and students with disabilities, especially their need for pre-employment transition services (Pre-ETS). The Final Rule for 34 CFR 361 indicates that the CSNA must include an assessment of the needs of youth and students with disabilities in the State, including their need for Pre-ETS. This section contains information about the rehabilitation needs of transition-age youth with disabilities (14 to 24) and the needs of students with disabilities (14 to 21) for pre-employment transition services.
Recurring Themes Across all Data Collection Methods
• All of the five required pre-employment transition services represent significant rehabilitation needs of students with disabilities in Wyoming, with work-based learning experiences being the most significant and important need.
• Transportation is a major barrier for students and their ability to experience work. • In addition to transportation, the primary rehabilitation needs of youth with disabilities
in Wyoming are work skills, soft skills, education and training.
NATIONAL AND/OR AGENCY SPECIFIC DATA RELATED TO THE NEEDS OF INDIVIDUALS IN TRANSITION
The project team examined educational attainment rates, unemployment rates and Labor force participation rates for youth in Wyoming. Table 69 contains Educational Attainment rates for ages 18 to 24 years, which includes high school graduation rates and Bachelor’s degree achievement.
Educational Attainment for Youth: Table 58 contains Educational Attainment rates for ages 18 to 24 years.

DVR 2018 CSNA 80
Table 58 Educational Attainment for Ages 18 to 24 Years
Area Less than
High School Graduate
HS Grad (includes
equivalency)
Some college, or Associate’s
degree
Bachelor's degree
*US 13.1% 31.0% 45.1% 10.8% *WY 15.9% 32.4% 45.0% 6.7% **A1 9.6% 27.0% 55.4% 8.0% **A2 16.8% 37.6% 40.8% 4.8% **A3 19.8% 31.8% 45.0% 3.5% **A4 18.0% 35.0% 40.5% 6.5%
*Source: U.S. Census Bureau, 2016 ACS 1-Year Estimates ** Source: U.S. Census Bureau, 2012-2016 ACS 5-Year Estimates
Area 1 has a lower percentage of youth that have not completed high school when compared to the Nation, but a higher percentage of individuals whose highest educational attainment level is a high school diploma.
All Areas have a significantly lower Bachelor’s degree attainment rate than the Nation by 4% and higher. Area 3 has the lowest rate at 3.5%. Area 1 has the highest rate for attaining a Bachelor’s Degree (8%) in the State.
Employment by Disability Type for Youth:
Cornell University provides online disability statistics for youth employment. The following data is from the online resource and contains the employment rates from 2016 for the Nation and the State by disability type. The chart categories are for non-institutionalized youth ages 16 – 20, male and female, from all ethnic backgrounds and includes all education levels.
Table 59 2016 Employment by Disability Type for Non-institutionalized Youth ages 16 - 20
Disability Type US Percent Employed Wyoming Percent Employed
Any Disability 24.8% 27.2% Visual Disability 31.0% No Data Available
Hearing Disability 32.3% No Data Available Ambulatory
Disability 20.5% No Data Available
Cognitive Disability 21.3% 18.5% Self-Care Disability 9.2% No Data Available Independent Living
Disability 11.9% 13.1% Source: http://www.disabilitystatistics.org/
The data indicates that the employment rate for youth with disabilities in Wyoming exceeds the national average by 2.4 percent. Youth with cognitive disabilities are employment slightly

DVR 2018 CSNA 81
below the national average in Wyoming, but youth with independent living disabilities are employment slightly above the national average.
Youth Labor Force Participation:
The United States Bureau of Labor Statistics collects information on youth labor force participation and unemployment. Table 60 provides National data for youth ages 16 -19 and 20-24 with and without disabilities.
Table 60 Labor Force Participation Rates for Youth
Age
18-May 18-Jun
Labor Force Participation Rate Labor Force Participation Rate
Disability No Disability Disability No Disability Age 16 to 19 22.6% 34.5% 25.8% 42.1% Age 20 to 24 40.5% 72.1% 40.6% 75.2%
Unemployment Rate Unemployment Rate Disability No Disability Disability No Disability
Age 16 to 19 28.9% 12.5% 22.9% 14.7% Age 20 to 24 10.7% 6.9% 13.1% 8.0%
* Generated using unpublished data obtained from the U.S. Bureau of Labor Statistics: Table 1. Labor force status of the civilian noninstitutionalized population by sex, race, Hispanic or Latino ethnicity, age, and disability status, May, 2018 and June 2018 (Source: Current Population Survey)
The data indicates that in all indicators of employment nationally, youth with disabilities perform far below their peers without disabilities. This data reinforces the need to provide youth with disabilities every opportunity to participate in work experiences and learn what is required in the world of work. The provision of pre-employment transition services represents an important first opportunity to reach students with disabilities in Wyoming and across the Nation.
PRE-EMPLOYMENT TRANSITION SERVICES
The Rehabilitation Act as amended and reauthorized in WIOA requires VR programs to expend at least 15 percent of their Federal allotment annually on pre-employment transition services. These services must be made available to all eligible and potentially eligible students with disabilities in the State that have need of such services. It is clear from the interviews and the survey results that students with disabilities in Wyoming have a need to receive pre-employment transition services. These services include:
1. Job exploration counseling; 2. Work-based learning experiences; 3. Counseling on opportunities for enrollment in comprehensive transition or postsecondary
educational programs at institutions of higher education;

DVR 2018 CSNA 82
4. Workplace readiness training to develop social skills and independent living (often referred to as soft skills); and
5. Instruction in self-advocacy, which may include peer mentoring
Each of these Pre-ETS services was noted as a need on a recurring basis when discussing the needs of students with disabilities in Wyoming.
The Rehabilitation Act indicates that the following authorized services can be provided if funds remain after the provision of the five required services noted above:
1. Implementing effective strategies to increase the likelihood of independent living and inclusion in communities and competitive integrated workplaces;
2. Developing and improving strategies for individuals with intellectual disabilities and individuals with significant disabilities to live independently, participate in postsecondary education experiences, and obtain and retain competitive integrated employment;
3. Providing instruction to vocational rehabilitation counselors, school transition personnel, and other persons supporting students with disabilities;
4. Disseminating information about innovative, effective, and efficient approaches to achieve the goals of this section;
5. Coordinating activities with transition services provided by local educational agencies under the Individuals with Disabilities Education Act (20 U.S.C. 1400 et seq.);
6. Applying evidence-based findings to improve policy, procedure, practice, and the preparation of personnel, in order to better achieve the goals of this section;
7. Developing model transition demonstration projects; 8. Establishing or supporting multistate or regional partnerships involving States, local
educational agencies, designated State units, developmental disability agencies, private businesses, or other participants to achieve the goals of this section; and
9. Disseminating information and strategies to improve the transition to postsecondary activities of individuals who are members of traditionally unserved populations.
To determine if a VR agency can move from the five required services to the nine authorized services, a fiscal forecasting model must be utilized which identifies the expenditures on the required services and on coordination activities and then forecasts how much of the remaining funds, if any, can be utilized to pay for authorized services. DVR is encouraged to complete this model as developed by RSA and the WINTAC.
The project team was able to examine DVR’s provision of pre-employment transition services to date. The number and type of pre-ETS service provided is contained in Table 61.

DVR 2018 CSNA 83
Table 61 Pre-ETS Services Provided by DVR as of the 2nd Quarter of Program Year 2018
Type of Service Number of Services Provided
Percent of all Pre-ETS Services
Job Exploration Counseling 362 23.7% Counseling and Enrollment Opportunities for PSE 219 14.1%
Work Based Learning Experiences 343 22.5% Instruction in Self-Advocacy 200 13.1% Work Readiness Training 401 26.3%
The data indicates that DVR has provided work readiness training most frequently, followed closely by job exploration and work-based learning experiences. Instruction is self-advocacy was provided the least number of times.
SURVEY RESULTS BY TYPE
PARTNER SURVEY RESULTS:
Partner Survey: Barriers to Employment for Youth in Transition
Partner survey respondents were asked to indicate the barriers to achieving employment goals for youth in transition from a list of 20 barriers. Table 62 lists the barriers along with the number of times a barrier was identified. There was no limit to the number of barriers that a partner respondent could choose.

DVR 2018 CSNA 84
Table 62 Barriers to Achieving Employment Goals: Youth in Transition
Barriers to Achieving Employment Goals: Youth in Transition
Number of Times identified as a
barrier
Percent of time chosen
Not having job skills 19 82.6%
Little or no work experience 18 78.3%
Not having education or training 17 73.9%
Not having job search skills 15 65.2%
Poor social skills 14 60.9%
Employers' perceptions about employing persons with disabilities 13 56.5%
Not enough jobs available 7 30.4%
Other transportation issues 7 30.4%
Substance abuse issues 5 21.7%
Mental health issues 4 17.4%
Perceptions regarding the impact of income on Social Security disability benefits 4 17.4%
Disability-related transportation issues 3 13.0%
Housing issues 3 13.0%
Other (please describe) 3 13.0%
Other health issues 2 8.7%
Convictions for criminal offenses 1 4.3%
Language barriers 1 4.3%
Not having disability-related accommodations 1 4.3%
Childcare issues 1 4.3%
Lack of help with disability-related personal care 0 0.0%
Over 82 percent of the partner respondents who answered the question indicated that not having job skills was a barrier for youth in transition who were seeking employment. Little or no work experience and not having education or training were items selected by over 73% of the respondents as barriers to achieving employment goals for youth in transition. The open-ended category, “other”, was selected 3 times as a barrier. The comments received are provided below:
• “Common sense - don't wear pajamas to work”

DVR 2018 CSNA 85
• “Lack of connections to employers” • “Not willing to perform the job as instructed. Wanting to do things their own way in their
time”
STAFF SURVEY RESULTS
Staff Survey: Barriers to Achieving Employment Goals for Youth in Transition
Staff survey respondents were provided a list of 20 barriers and asked to indicate the barriers to achieving employment goals for youth in transition. Table 63 lists the barriers along with the number of times each of the barriers was identified as a barrier to achieving employment goals for youth in transition. There was no limit to the number of items a staff respondent could choose.
Table 63 Barriers to Achieving Employment Goals: Youth in Transition
Barriers to Achieving Employment Goals: Youth in Transition
Times identified as a barrier (n) Percent
Little or no work experience 18 78.3% Not having job skills 15 65.2% Not having job search skills 15 65.2% Poor social skills 15 65.2% Other transportation issues 12 53.2% Not enough jobs available 10 43.5% Not having education or training 9 39.1% Mental health issues 9 39.1% Employers' perceptions about employing persons with disabilities 5 21.7%
Perceptions regarding the impact of income on Social Security benefits 5 21.7%
Other (please describe) 5 21.7% Substance abuse issues 4 17.4% Disability-related transportation issues 3 13.0% Not having disability-related accommodations 2 8.7% Other health issues 2 8.7% Language barriers 1 0.8% Lack of help with disability-related personal care 1 0.8% Childcare issues 1 0.8% Housing issues 1 0.8% Convictions for criminal offenses 0 0.0%
The staff choices for barriers to employment for youth are very similar to the partner survey choices. Lack of work experience, job skills, job search skills and poor social skills rank in the top five choices for both staff and partner respondents. Employers' perceptions about employing

DVR 2018 CSNA 86
persons with disabilities is significantly lower in rank when compared to individual and partner surveys. Staff who selected the category “other” were provided the opportunity to write a narrative response. Quotes from the 5 narrative responses received are noted below:
• “Balancing school with work schedules AND parents who do not want to allow child to work”
• “Client's insight into disabilities, motivation, & goals aligning with DVR” • “Lack of understanding and direction on how to carry out services and lack of interest of
staff to serve population” • “Transition specialists lack skills to interact effectively” • “Unwillingness of DVR staff to serve or understand”
KEY INFORMANT AND FOCUS GROUP INTERVIEWS
The following recurring themes emerged related to the needs of youth with disabilities in transition:
• DVR’s youth population was noted as increasing all the time as a result of the changes in WIOA and the delivery of pre-employment transition services (pre-ETS) across the State.
• All five of the required pre-employment transition services were identified as a need for youth and students with disabilities throughout Wyoming. DVR initially struggled with implementing pre-ETS services, but has developed contracts to provide the five required pre-employment transition services and does not expect to have to return funds in FFY 2019.
• Although all of the five required pre-employment transition services are needed and beneficial, work-based learning experiences were frequently cited as the most valuable and needed pre-ETS service.
• VR Counselors are striving to build relationships and access students in the schools. Suggestions were made to have designated caseloads for transition rather than all counselors. There is some belief that the focus on youth has taken away time and services from adults, so there is a belief that dedicated caseloads would level the support.
• The need for financial literacy training was noted by several participants for youth and students with disabilities. Staff and partners are concerned that the young people they work with can be taken advantage of by others since they do not know how to manage their money, or in some cases, understand the value of money.
• DVR has difficulty accessing students in 504 plans and who are not identified as having a disability in the school. Many students that could be accessing pre-employment transition services are being missed because there is not reliable data on who and where they are.
• Pre-Employment Transition Services are making a positive impact and people understand the value, however, there is a lot of confusion with DVR and partners on definitions, expectations and allowable services.

DVR 2018 CSNA 87
• The development of soft skills was identified as a major need for youth with disabilities. The youth and students working with DVR staff have difficulty expressing themselves and exhibit behaviors that are unacceptable in the work place.
• Youth in juvenile justice, youth services, and other programs outside of the public school system are often being missed.
• Parent engagement can vary depending on the type of school (public vs alternative) and the poverty or affluent level of the school.
RECOMMENDATIONS
The following recommendations are provided to Wyoming DVR related to the needs of youth with disabilities in transition:
• DVR is encouraged to continue efforts to identify needs and programs for implementing pre-employment transition services.
• DVR should provide additional training for DVR staff and providers on the definitions, parameters and expectations for Pre-ETS to help minimize the confusion about what are allowable an unallowable expenses.
• DVR is encouraged to work with the pre-employment transition services team at the WINTAC to complete a fiscal forecasting model of the ability to move from required to authorized activities.
• DVR is encouraged to add financial literacy training to their menu of purchased services, or to partner with other organizations like the Center for Independent Living to provide this service to young people.
• It would be helpful for DVR to engage field staff on implementation of youth initiatives, prior to roll out and finalization.
• Identify additional ways to access and outreach to students with disabilities in the community, outside of the public school system.
• DVR should consult with the Title I Youth program to determine if there are ways in which the two programs can work together to increase the availability of work experiences for youth with disabilities in Wyoming.
• DVR is encouraged to expand its utilization of apprenticeships and other career pathways for youth with disabilities throughout the State. These strategies contribute to employment in high-demand occupations with good wages for young people. Apprenticeships represent an area where the relationship with the Title I Youth program can be very fruitful for young VR consumers.

DVR 2018 CSNA 88
SECTION FIVE: NEEDS OF INDIVIDUALS WITH DISABILITIES SERVED THROUGH OTHER COMPONENTS OF THE STATEWIDE
WORKFORCE DEVELOPMENT SYSTEM
The following information was gathered during this assessment in the area of the needs of individuals with disabilities served through other components of the statewide Workforce Development System. Throughout this section, the term Wyoming Workforce Center will be used to refer to services provided by DVR’s partners in what used to be termed the One-Stop Career Center, and is now referred to nationally as the American Job Centers (AJCs). The information and comments noted in this Section only refer to DVR’s partners, not DVR unless explicitly stated.
Recurring Themes Across all Data Collection Methods
The following themes emerged in the area of the needs of individuals with disabilities served through other components of the statewide workforce development system:
• The relationship of the Wyoming Workforce Centers with VR goes beyond referral in many instances to include braided funding and shared planning.
• Ongoing consistent cross-training between the core partners is a need so that staff are aware of how each other’s programs function and what limitations in service exist.
• Wyoming Workforce Center staff need to receive ongoing training on how to effectively work with individuals with disabilities, especially those with mental health impairments.
SURVEY RESULT BY TYPE:
INDIVIDUAL SURVEY RESULTS
Wyoming’s Workforce Centers: Individuals with disabilities in Wyoming were asked a series of questions about their use and opinion of Wyoming’s Workforce Centers. Tables 64 and 65 summarizes the responses to several questions in this regard.

DVR 2018 CSNA 89
Table 64 Wyoming’s Workforce Centers Use and Accessibility
Accessibility Questions Yes Percent of Total No Percent of
Total Total Number of Responses
Have you ever tried to use the services of the Wyoming Workforce Centers beyond an online account?
68 40.0% 102 60.0% 170
Did you experience any difficulties with the physical accessibility of the building?
3 4.4% 65 95.6% 68
Did you have any difficulty accessing the programs at the Wyoming Workforce Centers (i.e. no available assistive technology, no interpreters, etc.)?
7 10.6% 59 89.4% 66
Of the total number of respondents who answered the question regarding use of the Wyoming Workforce Centers, 40% of the respondents had tried to utilize the services. Of the respondents that utilized the Workforce Services, accessibility to programs was challenging for slightly more than 10% of the responding consumers. Table 65 details results from using the Workforce Center for seeking training and employment. Table 65 Wyoming’s Workforce Training and Employment Training and Employment Questions Yes Percent of
Total No Percent of Total
Total Number of Responses
Did you go to the Center to get training? 11 15.9% 58 84.1% 69
Did you get the training that you were seeking? 6 54.6% 5 45.5% 11
Did the training result in employment? 3 30.0% 7 70.0% 10
Did you go to the Workforce Center to find a job? 51 76.1% 16 23.9% 67
Did they help you find employment? 17 32.1% 36 67.9% 53
Analysis of responses indicated that the services respondents received at the Workforce Training Centers did not result in desired outcomes for the many. Eleven survey respondents (15.9% of 69 respondents) went to the Workforce Center to get training, and slightly more than half indicated

DVR 2018 CSNA 90
that they received the training they were seeking but only three found work as a result of the training. There were 51 (76.1%) out of 67 individuals that went to the Workforce Center with the purpose of seeking assistance to find a job. Of that total number of 51, only 17 actually found employment as a result of the help provided by the Workforce Center. Table 66 identifies the ratings for the helpfulness and the value of the Workforce Center by individuals with disabilities that responded to the survey. Table 66 Helpfulness and Value of the Workforce Centers
Helpfulness Rating Count Percent of Total
Yes, they were very helpful 37 56.9%
They were somewhat helpful 21 32.3%
No, they were not helpful 7 10.8%
Total 65 100%
Value of Services Rating Count Percent of Total
The services were somewhat valuable 30 47.6%
Yes, the services were very valuable 25 39.7%
No, the services were not valuable 8 12.7%
Total 63 100%
The concepts of helpfulness and value are closely related in this study with respect to Workforce Center services. Almost 90 percent of the respondents found the Workforce Centers to be either somewhat or very helpful and valuable. Table 67 identifies the effectiveness of the Workforce Center by individuals that responded to the survey. Table 67 Effectiveness of the Workforce Centers
Effectiveness Rating Count Percent of Total
Very effective 23 35.4%
Somewhat effective 22 33.9%
No opinion 11 16.9%
Somewhat ineffective 6 9.2%
Very ineffective 3 4.6%
Total 65 100%
A narrow margin is noted between the ratings of very effective and somewhat effective (1.5%) for the Wyoming Workforce Centers. Overall, the ratings of the Wyoming Workforce Centers

DVR 2018 CSNA 91
indicate that consumers find them to have value and to be helpful, but there are mixed reviews on their value.
PARTNER SURVEY RESULTS
Partner survey respondents were asked a series of questions regarding their opinion and use of the Wyoming Workforce Centers. Tables 68-72 below summarize the partner survey results.
Table 68 Frequency of Interaction with Workforce Centers
Frequency of Interaction with the Wyoming Workforce Centers Number Percent Indicating
Available
Somewhat frequently 8 30.8%
Infrequently 7 26.9%
Not at all 7 26.9%
Very frequently 4 15.4%
Total 26 100%
Table 69 Physical Accessibility of the Workforce Centers Physical Accessibility of the Wyoming
Workforce Centers Number Percent Indicating Available
Fully accessible 14 53.9%
Somewhat accessible 6 23.1%
I do not know 4 15.4%
Not accessible 2 7.7%
Total 26 100%
Table 70 Programmatic Accessibility of the Workforce Centers
Programmatic Accessibility of the Wyoming Workforce Centers Number Percent Indicating
Available
Fully accessible 10 38.5%
Somewhat accessible 10 38.5%
I do not know 4 15.4%
Not accessible 2 7.7%
Total 26 100%

DVR 2018 CSNA 92
Table 71 Effectiveness of the Workforce Centers
Effectiveness of WY Workforce Centers to serve PWD Number
Percent Indicating Available
Effectively 12 48.0%
Not effectively 7 28.0%
Very effectively 4 16.0%
They do not serve individuals with disabilities 2 8.0%
Total 25 100%
Table 72 Improving Service of WY Workforce Centers for PWD
How Can the WY Workforce Centers Improve Services to PWD Number Percent
Indicating Available
Train their staff on how to work with individuals with disabilities 11 25.0%
Include individuals with disabilities when purchasing training for their clients 10 22.7%
Partner more effectively with DVR 9 20.5%
Improve programmatic accessibility 8 18.2%
Other (please describe) 4 9.1%
Improve physical accessibility 2 4.6%
Of the 26 responses to the question regarding frequency of interaction with the Wyoming Workforce Centers, 53.8 percent had either infrequent or no interaction with Center. A very small percentage of partners had very frequent interaction with the Wyoming Workforce Centers.
Twenty-six partner survey respondents answered the question regarding the physical accessibility of the Wyoming Workforce Centers. Of the responses received, almost 54 percent indicated that the Wyoming Workforce Centers were fully accessible, while 15.4 percent indicated that they did not know if the Workforce Centers were physically accessible.
Partner survey respondents were asked a question regarding the programmatic accessibility of the Wyoming Workforce Centers. Slightly more than three quarters of the respondents indicated that the Workforce Centers were either fully or somewhat programmatically accessible, while

DVR 2018 CSNA 93
slightly above 15 percent indicated that they did not know about the level of programmatic accessibility to consumers.
In regard to effectiveness, 48 percent of the respondents indicated that the Wyoming Workforce Centers effectively serve people with disabilities while 28 percent of the respondents did not find the Wyoming Workforce Centers to effectively serve people with disabilities. Eight percent indicated that the Workforce Centers do not serve individuals with disabilities.
When asked what the Wyoming Job Center could do to improve service to individuals with disabilities, partner survey respondents were provided a list of six responses which included selecting an open-ended response. Fifty percent of the respondents who answered the question cited “train their staff on how to work with people with disabilities” as a way to improve Workforce Center services. Slightly over 45% of the respondents indicated including individuals with disabilities when they fund training for clients (n=10). The open-ended category “other” was selected by four of the respondents. The comments received are listed below:
• “Educate school aged families” • “Get staff” • “Help individuals find jobs where their transportation costs do not exceed their income” • “Make their job search website easier to use. IT IS DIFFICULT TO USE!”
STAFF SURVEY RESULTS
The project team asked the staff a series of questions regarding their use and opinion of the Wyoming Workforce Centers. Tables 73-77 below summarize the responses from the staff survey.
Table 73 Frequency of Interaction
Frequency of Interaction with the WY Workforce Centers Number Percent Indicating
Available
Somewhat frequently 12 52.2% Very frequently 8 34.8% Infrequently 2 8.7% Not at all 1 4.4%
Total 23 100%

DVR 2018 CSNA 94
Table 74 Physical Accessibility of the Wyoming Workforce Centers
Physical Accessibility of the WY Workforce Centers Number Percent Indicating
Available Fully accessible 15 68.2% Somewhat accessible 5 22.7% Not accessible 1 4.6% I do not know 1 4.6%
Total 22 100%
Table 75 Programmatic Accessibility of the Wyoming Workforce Centers
Programmatic Accessibility of the WY Workforce Centers Number Percent Indicating
Available Somewhat accessible 11 47.8% Fully accessible 10 43.5% I do not know 2 8.7% Not accessible 0 0.0%
Total 23 100%
Table 76 Effectiveness of the WI Job Centers to Serve PWD
Effectiveness of WY Workforce Centers to Serve PWD Number
Percent Indicating Available
Effectively 13 56.5% Not effectively 6 26.1% Very effectively 4 17.4% They do not serve individuals with disabilities 0 0.0%
Total 23 100%

DVR 2018 CSNA 95
Table 77 Improving Ability of the WI Job Centers to Effectively Serve People with Disabilities
Improving Ability of WY Workforce Centers to Effectively PWD Number
Percent Indicating Available
Train their staff on how to work with individuals with disabilities 16 84.2%
Partner more effectively with DVR 13 68.4% Include individuals with disabilities when purchasing training for their clients 9 47.4%
Other (please describe) 5 26.3% Improve programmatic accessibility 4 21.1% Improve physical accessibility 1 5.3%
Of the 23 responses to the question regarding frequency of interaction with the Wyoming Workforce Centers, slightly over 52 percent of DVR staff respondents indicated that they interact somewhat frequently with the Wyoming Workforce Centers, while slightly more than one-third have very frequent interaction. The survey category item “not at all” received the lowest rating by staff survey respondents in response to this question.
Twenty-two staff survey respondents answered the question regarding the physical accessibility of the Wyoming Workforce Centers. Of the responses received, almost 91 percent indicated that the Wyoming Workforce Centers were fully or somewhat physically accessible.
Staff survey respondents were asked a question regarding the programmatic accessibility of the Wyoming Workforce Centers. Of the 23 responses received, more than 90 percent indicated the Job Centers were somewhat or fully programmatically accessible. Less than nine percent did not know if the Job Centers were programmatically accessible.
In regard to effectiveness of the Wyoming Workforce Centers, almost 74 percent of staff indicated they either were very effectively or effectively served individuals with disabilities. Slightly more than 26 percent indicated they were not effective.
When asked what the Wyoming Job Center could do to improve service to individuals with disabilities, staff survey respondents were provided a list of six responses which included selecting an open-ended response. The most common response cited was to train staff on how to work with people with disabilities. Partner more effectively with DVR was the second most commonly cited item selected by staff survey respondents in response to this question. The open-ended category “other” was selected by five of the respondents. Quotes from the comments received are provided:
• “Communicate effectively about office strategy and structure” • “Do not automatically assume that because someone reports a disability, they are
automatically eligible for DVR services. POWER refers every single client to us, and most of those referrals are inappropriate and bog down our system.”
• “Learn more about DVR referral process.”

DVR 2018 CSNA 96
• “Not assume every client with a disability needs VR services, work with the client first to find out if the disability is truly a barrier to employment”
KEY INFORMANT AND FOCUS GROUP INTERVIEWS
The following information was gathered from the individuals interviewed for this assessment in the area of the needs of individuals with disabilities served through other components of the Statewide Workforce Development System:
• The relationship between DVR and the Title I and III programs was described as positively developing and much improved in the last two years. Staff described co-enrollment and braiding of funding as occurring on a regular basis during the time of this study.
• Colocation of DVR and Workforce staff provides a good environment for a “warm hand off” for services from one program to the other. This encourages co-enrollment and joint planning.
• DVR and the other core partners collaborate in putting on job fairs, which benefits the consumers of all of the programs.
• DVR and the other core partners are developing a common intake form that should be completed soon and that will contribute to co-enrollment.
• At the leadership level, quarterly and annual meetings appear to be making a positive impact in WIOA implementation across core partners.
• The relationship between DVR staff and the other core partners was consistently described as positive at the field level, but uneven in depth of partnerships as it relates to shared funding of cases or joint planning. In several areas, the relationship is primarily one of referral, but there were several instance where joint planning and funding was occurring.
RECOMMENDATIONS:
The following recommendations are offered to Wyoming DVR based on the results of the research in the Needs of Individuals with Disabilities served through other Components of the Statewide Workforce Development System area:
• Provide cross-training with DVR and Workforce Center staff to increase understanding of each agency’s role, responsibilities and services for participants (including those for participants with the most significant disabilities). DVR should provide disability awareness and sensitivity training to Workforce Center staff on a regular basis. This will help increase the capacity of the Center’s staff to effectively work with job seekers with

DVR 2018 CSNA 97
disabilities and, if the training is provided regularly, will help address the loss of capacity posed by staff turnover at the Workforce Centers.
• DVR should identify examples of effective partnerships with the Workforce Centers across the State and use these as examples for training and replication in other areas. In addition, both programs should share marketing materials that are available in all offices across the State.
• DVR should pilot the use of Partnership Plus in a few Workforce Centers across the State to help ensure that they are positively addressing the need for extended services for SSA beneficiaries that are served by the Workforce Centers.
• Given the fact that Apprenticeships are a focus of the Workforce Centers, DVR should partner with select Centers to ensure that individuals with disabilities are included in Apprenticeship programs. These programs hold tremendous potential for youth with disabilities, and can be a source for partnership development between DVR and the Title I Youth program across the State.
• DVR and their Workforce partners need to continue to improve their capacity to track co-enrollment of consumers and share that information on a regular basis among programs.

DVR 2018 CSNA 98
SECTION SIX: NEED TO ESTABLISH, DEVELOP OR IMPROVE
COMMUNITY REHABILITATION PROGRAMS IN WYOMING
Section Six identifies the need to establish, develop or improve community rehabilitation programs in Wyoming that serve individuals with disabilities. The rural nature of Wyoming makes the purchase of service through vendors challenging in many parts of the State. The findings and recommendations in this Section must be interpreted with these challenges in mind.
Recurring Themes Across all Data Collection Methods
The following themes emerged in the area of the need to establish, develop or improve community rehabilitation programs serving individuals with disabilities in Wyoming:
• The need to develop service providers is greatest in the rural areas, especially providers for supported and customized employment.
• There is a need for service providers that are skilled in working with individuals with mental health impairments and other most significant disabilities.
• There is a need to develop providers that can sign and have experience working with Deaf individuals.
SURVEY RESULTS BY TYPE
PARTNER SURVEY RESULTS
Partner Survey: Services Readily Available to DVR Consumers
Respondents were provided with a list and asked to identify which of the services listed were readily available to individuals with disabilities who were served by DVR. There was no limit to the number of services that could be chosen by respondents. Table 78 summarizes the results from the partner survey respondents.

DVR 2018 CSNA 99
Table 78 Services Readily Available
Services Immediately Available Number Percent Indicating Available
Job training services (TWE, Job Coaching, OJT, etc.) 30 81.1%
Job development services 29 78.4%
Other education services 20 54.1%
Assistive technology 20 54.1%
Other transportation assistance 16 43.2%
Mental health treatment 13 35.1%
Benefit planning assistance 13 35.1%
Substance abuse treatment 10 27.0%
Vehicle modification assistance 8 21.6%
Medical treatment 8 21.6%
Personal care attendants 7 18.9%
Housing 6 16.2%
Health insurance 4 10.8%
Income assistance 3 8.1%
Other (please describe) 3 8.1%
Slightly more than 81 percent of the partner respondents indicated that job development services were readily available to DVR consumers. Job development services was the second most frequently selected service cited as readily available by respondents to the question. Income assistance, health insurance and housing were chosen the fewest number of times. Respondents who indicated “other” were provided the opportunity to describe the services readily available. The three respondents wrote in the following comments:
• “Case management” • “None are immediate” • “We’ve only seen assistance in the form of secondary education assistance”
Partner survey respondents were also asked to indicate what services were not immediately available or do not exist in the area of the State where the respondent works. There was no limit to the number of services that could be chosen. Table 79 contains the results to this question.

DVR 2018 CSNA 100
Table 79 Services Not Available or Do Not Exist
Services Not Immediately Available or Do Not Exist in Local Area Number Percent Indicating
Available
Health insurance 12 48.0%
Housing 11 44.0%
Income assistance 10 40.0%
Mental health treatment 10 40.0%
Personal care attendants 10 40.0%
Vehicle modification assistance 9 36.0%
Substance abuse treatment 9 36.0%
Benefit planning assistance 9 36.0%
Medical treatment 8 32.0%
Other transportation assistance 7 28.0%
Assistive technology 4 16.0%
Job training services (TWE, Job Coaching, OJT, etc.) 3 12.0%
Other (please describe) 3 12.0%
Job development services 2 8.0%
Other education services 2 8.0%
Health insurance and housing were the top two services identified as not immediately available or do not exist in the areas where the majority of partners survey respondents work. Income assistance, mental health treatment, and personal care attendants rounded out the top five services not readily available. Respondents who indicated “other” were provided the opportunity to describe the services that were not readily available or did not exist in the local area that were not included in the list. The respondents indicated:
• “Access to Healthcare for DD and Epilepsy clients - some must travel out of state for services”
• “Detox and Inpatient Services” • “Not Sure”
It is important to note that this question was not asking about what services DVR did not provide, but what services for individuals with disabilities are not readily available in the area where the partner survey respondents work. The CSNA is intended to identify service needs for individuals with disabilities in the State, even if the VR program does not provide the service.

DVR 2018 CSNA 101
Partner Survey: Service Providers Meeting Consumer Needs Partner survey respondents were asked to identify how frequently service providers in the state of Wyoming were able to meet DVR consumers’ rehabilitation service needs. Table 80 summarizes the results to this question.
Table 80 Frequency of Meeting Needs
Frequency of Service Providers Meeting Needs Number Percent Indicating Available
Some of the time 19 100.0%
All of the time 0 0.0%
None of the time 0 0.0%
Total 19 100%
The 19 partner survey respondents who answered the question unanimously indicated that service providers were able to meet rehabilitation service needs of DVR consumers some the time.
Survey respondents were asked an open-ended question to identify the rehabilitation needs that service providers were unable to meet in their area. Seventeen individuals provided narrative responses detailing gaps in service provision. Transportation was identified by six of the respondents to this question as a need that service providers were unable to meet. Other needs identified as not being, along with the number of times they were mentioned, are included below:
• Job availability, choices for job developers and coaches, more employers (3 times) • Enough time for initial assessments (1 time); • Housing (1 time); • Insurance (1 time); • DD clients learning Proper communication skills (1 time) • Orientation and mobility, skills training (1time) • Limited services due to wait lists, limited staff (workers), no funding, no local benefits
planner or no local SS offices (1 time) • Lack of long-term support for employment (1 time)
Partner Survey: Services that Service Providers are Most Effective in Providing DVR Consumers
Survey respondents were provided a list of 15 items and asked to identify the services that service providers were most effective in providing to DVR consumers. Table 81 lists the services and the number of times each item was selected. There was no limit to the number of services that could be chosen.

DVR 2018 CSNA 102
Table 81 Services that Providers are Most Effective in Providing
Services that Providers are Most Effective in Providing DVR Consumers Number Percent
Job training services (TWE, Job Coaching, OJT, etc.) 20 80.0%
Job development services 18 72.0%
Other education services 11 44.0%
Assistive technology 8 32.0%
Other transportation assistance 7 28.0%
Benefit planning assistance 6 24.0%
Mental health treatment 5 20.0%
Medical treatment 4 16.0%
Personal care attendants 4 16.0%
Housing 3 12.0%
Income assistance 2 8.0%
Other (please describe) 2 8.0%
Vehicle modification assistance 1 4.0%
Substance abuse treatment 1 4.0%
Health insurance 1 4.0%
Survey respondents indicated that the most effective services that service providers are providing are job training services (n=20) and job development services (n=18). Services that were identified by survey respondents five times or less in response to the question were: mental health treatment, medical treatment, personal care attendants, housing, income assistance, vehicle modification assistance, substance abuse treatment, and health insurance. Respondents who indicated “other” were provided the opportunity to describe the services that providers are most effective in providing. Those respondents identified case management for waiver services and supported employment.
Respondents were provided with a list of responses and asked to identify the primary reasons why vocational rehabilitation service providers were unable to meet consumers’ service needs. Table 82 summarizes the responses to this question.

DVR 2018 CSNA 103
Table 82 Reasons Providers are Unable to Meet Consumer Needs. Primary Reasons Providers are Unable to Meet Consumer
Needs Number Percent
Not enough service providers available in area 15 62.5%
Low quality of service provider services 7 29.2%
Consumer barriers prevent successful interactions with service providers 6 25.0%
Low levels of accountability for poor performance by service providers 5 20.8%
Low rates paid for services 4 16.7%
Other (please describe) 4 16.7%
Over 62 percent of the respondents who answered this question selected not enough service providers available in the area as a primary reason providers are unable to meet consumer needs. All other reasons from the list provided were selected by less than 30 percent of the respondents. The four respondents who indicated “other” were asked to describe primary reasons why service providers are unable to meet consumer’s needs. Reasons expressed by the four respondents pertained to the following:
• Cost and liability • Funding • Lack of collaboration between providers • Transportation routes are limited in times they run and areas they serve.
Partner Survey: Top Three Changes to Help Better Serve DVR Consumers
Partner survey respondents were presented with a list of 12 items and were asked to identify the top three changes that would help them better serve DVR consumers. Table 83 below lists the changes along with the number of times each change was identified as one of the top three changes that would help better serve DVR consumers.

DVR 2018 CSNA 104
Table 83 Top Three Changes to Help Better Serve DVR Consumers
Top Three Changes To Help Better Serve DVR Consumers Number Percent
Additional training 13 56.5%
More streamlined processes 9 36.0%
Improved business partnerships 8 32.0%
Higher rates paid by DVR for services 7 28.0%
Smaller caseload 5 20.0%
Improved communication with referring DVR counselor 5 20.0%
Referral of appropriate individuals 5 20.0%
Incentives for high performance paid by DVR 5 20.0%
Increased collaboration with Wyoming Workforce Centers 5 20.0%
Increased options for technology use to communicate with consumers 3 12.0%
Other (please describe) 3 12.0%
Reduced documentation requirements 2 8.0%
Additional training was chosen by 56.5 percent of the partner respondents as the top change that would help them better serve DVR consumers. The second and third ranking items, more streamlined processes and improved business partnerships, were each chosen by over 31percent of the respondents. Reduced documentation was selected only two times by partner survey respondents, indicating that documentation requirements does not appear to be problematic for community partners.
Partner Survey: Most Important Change to Help Better Serve DVR Consumers
Community partners were asked an open-ended question about what was the most important change that service providers could make to support consumer’s achievement of their employment goals. Table 84 contains the content analysis, separating the suggestions into three themes.

DVR 2018 CSNA 105
Table 84 Most Important Change to Help Better Serve DVR Consumers’ Achievement of Employment Goals
Staff Related Changes
Additional training and credentials
Agency cross trainings
Hire more staff to cover geographic region more adequately
Increase staff with higher pay and reduce other duties
Increase availability
Improve understanding of Mental Health and Substance Abuse consumer issues
Improve follow through with commitments to not burn bridges in a small community
Service Related Changes
Assistance with the jobs
Increase education for families and increase choices about who provides the services.
Provide more options for transportation
Promote the employment of people with developmental disabilities
Stay current with employment training needs for people with disabilities
Outreach
Develop more employment partnerships
Form partnerships with the area resources and work together for the benefit of the community and consumer
STAFF SURVEY RESULTS
Staff Survey: Services Immediately Available to Individuals to DVR Consumers
Staff survey respondents were provided with a list and asked to identify which of the services listed were immediately available to individuals who were served by DVR. There was no limit to the number of services that could be chosen. Table 85 summarizes the responses from the staff survey.

DVR 2018 CSNA 106
Table 85 Services Immediately Available
Services Immediately Available Number Percent Indicating Available
Job development services 26 89.7% Job training services (TWE, Job Coaching, OJT, etc.) 24 82.8% Other education services 23 79.3% Assistive technology 23 79.3% Mental health treatment 22 75.9% Other transportation assistance 16 55.2% Medical treatment 16 55.2% Benefit planning assistance 15 51.7% Vehicle modification assistance 14 48.3% Substance abuse treatment 13 44.8% Personal care attendants 8 27.6% Other (please describe) 8 27.6% Income assistance 4 13.8% Health insurance 4 13.8% Housing 4 13.8%
Staff and community partners agree on services that are immediately available as indicated by results that are almost identical. The services most often identified by staff as immediately available to consumers were job development services, job training services, other education services, assistive technology and mental health treatment. Health insurance, housing, income assistance and the category of “other” comprise the least identified immediately available services by staff and partner respondents. Of the eight narrative responses received, counseling and guidance were submitted three times and “none are immediately available” was cited twice. One respondent wrote:
• “All above services available after eligibility is determined.”
Staff survey respondents were provided with a list and asked to identify which of the services listed were not immediately available or do not exist in the area of the State where they work. Table 86 contains the results.

DVR 2018 CSNA 107
Table 86 Services Not Immediately Available or Do Not Exist
Services Not Immediately Available or Do Not Exist in Area Number Percent Indicating
Available
Income assistance 17 65.4% Health insurance 15 57.7% Housing 15 57.7% Personal care attendants 13 50.0% Vehicle modification assistance 11 42.3% Other transportation assistance 9 34.6% Substance abuse treatment 6 23.1% Benefit planning assistance 6 23.1% Medical treatment 5 19.2% Other education services 4 15.4% Job training services (TWE, Job Coaching, OJT, etc.) 3 11.5% Assistive technology 3 11.5% Mental health treatment 3 11.5% Other (please describe) 2 7.7% Job development services 1 3.8%
Housing, health insurance and income assistance were the top three services identified as not immediately available or do not exist in the area where the respondent works. These are consistent with the services identified by partner respondents as not immediately available. The staff survey respondents who indicated “other” were provided the opportunity to describe the services that were not immediately available or did not exist in the local area and that were not included in the list. Analysis revealed that access to mental health services for suicide prevention is limited. The remaining comment indicated by the respondent was “not sure”.
Staff Survey: Service Providers Meeting Consumer Needs
Staff survey respondents were asked to identify how frequently service providers in the state of Wyoming were able to meet DVR consumers’ rehabilitation service needs. Table 87 summarizes the results to this question.

DVR 2018 CSNA 108
Table 87 Frequency of Meeting Needs
Frequency of Service Providers Meeting Needs Number Percent Indicating Available
Most of the time 24 80.0% Some of the time 6 20.0% All of the time 0 0.0% None of the time 0 0.0%
Total 30 100%
More than three-quarters of the respondents indicated that service providers are able to meet the service needs of DVR consumers most of the time. Respondents did not select items “All the time” and “None of the time” indicating that overall, consumer needs are being met more frequently than not being met at all.
Staff survey respondents were asked an open-ended question regarding what rehabilitation needs service providers are unable to meet in their local area. Eighteen respondents provided narrative responses detailing perceived service gaps. Content analysis revealed the following needs:
• Lack of adequate job coaching and job placement services • Lack of skilled customized employment services • Transportation needs • Lack of vocational training programs and apprenticeships • Lack of quality rehabilitation • Lack of workplace accommodations, rehabilitation engineering and vocational
assessments • Lack of medical services, mental health services and substance abuse rehabilitation • Lack of access to health insurance
In addition to responding to the open-ended question, the respondents were provided with a list and asked to identify the primary reasons that vendors were unable to meet DVR consumers’ needs. Table 88 summarizes the responses to this question.
Table 88 Primary Reasons Vendors are Unable to Meet Consumer Needs
Primary Reasons Providers are Unable to Meet Consumer Needs Number Percent
Not enough service providers available in area 17 81.0% Low quality of service provider services 11 52.4% Low levels of accountability for poor performance by service providers 10 47.6%
Consumer barriers prevent successful interactions with service providers 8 38.1%
Other (please describe) 5 23.8% Low rates paid for services 3 14.3%

DVR 2018 CSNA 109
In agreement with partner survey respondents, staff survey respondents selected the same top two primary reasons why vendors are unable to meet the DVR consumers’ vocational rehabilitation service needs: not enough vendors in the area and low quality of vendor services. Staff respondents ranked low levels of accountability for poor performance by vendors/service providers higher than partner respondents. Low rates paid for services was cited 3 times as a primary reason that vendors are unable to meet the consumers’ needs. Respondents who cited “other” were given the opportunity to provide a narrative response. Poor DVR leadership, extremely rural areas, excessive time to get a new vendor approved, no funding to train job coaches, and lack of quality rehabilitation due to high turnover of DVR counselors and professionals were identified by staff survey respondents.
Staff Survey: Most Important Change to Help Better Serve DVR Consumers
Staff survey respondents were asked an open-ended question about what was the most important change that service providers could make to support consumer’s achievement of their employment goals. Table 89 contains the content analysis, separating the suggestions into three themes.
Table 89 Most Important Change to Help Better Serve DVR Consumers’ Achievement of Employment Goals
Staff Related Changes Better collaboration and leadership from DVR More staff for job coaching, recognizing their own limits, being honest Ongoing training for direct line staff Address counselor turnover Take better care of employees, better communication, collaboration, incentives and recognition Understand the actual rehabilitation behind the service provided Additional training & awareness of the impact of poverty on the mindset of consumers and how to better understand and communicate for improved success rates.
Service Related Changes Address transportation needs. Affordability - sliding scale or low income fee schedules Improve billing system for ease of navigation
Service Provider Changes Increase creativity in job development. Maintain updated records with DVR. Improve collaboration with DVR counselor
Staff survey responses reflected partner survey responses as noted in similar statements related to desire for additional training, increasing staff, employee pay rates and recognition, communication, and addressing transportation needs. Staff results in these areas differ from

DVR 2018 CSNA 110
partner respondents, who identified outreach improvements, developing partnerships with employers within the community, and to work more collaboratively with community resources.
KEY INFORMANT AND FOCUS GROUP INTERVIEWS
The following themes were recurring from the individuals interviewed for this assessment in the area of the need to establish, develop or improve community rehabilitation programs serving individuals with disabilities in Wyoming:
• The rate structure for payment of VR services was reported to be negotiated with each service providers rather than being based on an approved cost statement or being set as a flat rate. This results in different levels of payment to different providers for the same service.
• CRPs are difficult to access, and in some cases non-existent in rural Wyoming. This causes difficulty in placement and necessary supports for many in the State that need employment services, including supported employment.
• There appears to be a lack of training or credentialing requirements for providers, which prevents DVR from knowing the level of service that will be provided to clients or the expertise level of the individual providing the service.
• Funding issues and lack of referrals have created limitations in CRPs ability to maintain staff and place clients timely.
• The turnover rate in CRPs results in a lack of continuity in service delivery and inconsistent quality of services. In areas where there are very few providers, turnover can have a detrimental effect on the timeliness of service delivery.
• DVR staff recognize that CRPs need training in various disability types to provide services to a wider range of clients.
• Fiscal processes have made an extreme impact on CRPs. Timelines and expectations for billing are inconsistent, untimely and sometimes unpaid all together. One provider said “I am happy if I get paid in 2 months”, with another still waiting to be paid from 6 months ago. Limitations on the number of hours for services causes additional concern, e.g. 4 hour of job coaching a month is not enough to find quality placements or get to know the client.
• Core Team Meetings are a positive practice, but there is little consistency with counselors providing documentation or assessments to CRPs at time of referral. There are also no payment options for a CRP assessment to get to know the client prior to job searching.
• One client expressed appreciation for their job coach who provided individualized supports, but understands that this is not always the case.

DVR 2018 CSNA 111
RECOMMENDATIONS
The following recommendation is offered to Wyoming DVR based on the results of the research in the Need to Establish, Develop or Improve Community Rehabilitation Programs in Wyoming:
• DVR should establish minimum expectations for service providers experience or certification that will help ensure quality service delivery to consumers receiving employment services or other VR services. The project team recommends that DVR review standards established by other VR programs in the country to help them identify what the minimum standards are that have been set by other agencies. DVR may wish to review the certification guide developed by the California VR program available here: https://www.dor.ca.gov/Home/CommunityRehabilitationPrograms.
• In concert with the first recommendation, DVR is encouraged to consider creating a guidebook for CRPs including rates and fees, processes, training opportunities and expectations, collaboration and definitions for service provisions, etc.
• Whenever possible, DVR should include CRPs and individual service providers in the training that is provided for their staff. In addition, CRP staff should regularly meet and communicate with DVR field staff about their programs and available services to ensure DVR staff is aware of what they do and can help identify and develop services as needed.
• DVR should meet with existing CRPs to determine if there are strategies or incentives to help the CRPs expand services into the rural areas of the State.
• DVR is encouraged to reevaluate their current fee for service structure to align rates across CRPs, possibly integrate a milestone benchmark system, and overcome some of the current disparities in payment for provider services. DVR should investigate milestone payments, flat rates for certain services and/or instituting a statewide cost statement for service delivery that will form the foundation for rate payments.
• DVR should consider adding feedback questions related to CRPs and job coach services to the satisfaction surveys sent by DVR to consumers.
DVR 2018 CSNA 112
SECTION SEVEN: NEEDS OF BUSINESS AND EFFECTIVENESS IN SERVING
EMPLOYERS
The need for the VR program to engage with the business community and effectively provide services to employers is one of the common performance measures for the core partners in WIOA. WIOA has moved the discussion from whether or not VR programs should serve the business community to how well VR programs are serving this community. Consequently, it is important for every VR program to do a self-assessment of how well they are serving employers. The project team is hopeful that this section of the report will be useful to VR as they engage in the evaluation of how effectively they are providing services to employers and develop strategies to increase business engagement.
There were only four employers that participated in this CSNA, and all of those were by survey. The reader is cautioned to interpret any findings with the low participation rates in mind. In future CSNAs, it will be essential for DVR to proactively recruit businesses to engage in the assessment. One of the most effective ways to make this happen is to partner with the Title I and III counterparts responsible for employer relationships. In Wyoming, this occurs through the Employment and Training Division of the Department of Workforce Services. There is a Business Leadership Network in Wyoming, and this may be another avenue to recruit business participation.
Recurring Themes Across all Data Collection Methods
The following themes emerged in the area of the needs of business and effectiveness in serving employers:
• The most frequent feedback received from participants across all research methods regarding employers was the need to educate them and reduce the biases held about the abilities of individuals with disabilities. Employers were frequently characterized as fearful about hiring individuals with disabilities and about their capacity to perform the essential functions of many jobs.
• In order to improve their effectiveness in serving employers, DVR will need to increase the number of staff responsible for outreach and service to employers.
• DVR needs to strengthen their relationship with the Employment and Training Division’s Employment Specialists to increase outreach to employers and enhance their effectiveness in serving employers in Wyoming.

DVR 2018 CSNA 113
SURVEY RESULTS
BUSINESS SURVEY RESPONSES
With respect to the “Disability in the Workplace” section of the survey, business survey respondents were presented with eight questions regarding whether or not their business needed help with a variety of concerns related to disability and employment. The questions were structured in a yes/no response format. Table 90 summarizes the results to the eight questions according to the percentage of respondents who indicated a need for help with respect to the need or needs indicated in the question.
Table 90 Disability in the Workplace: Employer Needs
Does your business need help with … Yes (n) Yes (%) No (%) No (n) Total Helping workers with disabilities to retain employment? 2 50.0% 2 50.0% 4
Identifying job accommodations for workers with disabilities? 1 25.0% 3 75.0% 4
Obtaining training on the different types of disabilities? 1 33.3% 2 66.7% 3
Obtaining training on sensitivity to workers with disabilities? 1 33.3% 2 66.7% 3
Obtaining incentives for employing workers with disabilities? 1 33.3% 2 66.7% 3
Obtaining information on training programs available for workers with disabilities? 1 33.3% 2 66.7% 3
Understanding disability-related legislation such as the Americans with Disabilities Act as amended, the Workforce Innovation and Opportunity Act and the Rehabilitation Act as amended?
0 0.0% 3 100.0% 3
Recruiting job applicants who are people with disabilities? 0 0.0% 3 100.0% 3
The survey items with the highest percentage of respondents indicating that their business would benefit from assistance with that item was helping workers with disabilities to retain employment (50%). The items with the lowest percentage of business survey respondents was understanding disability-related legislation such as the Americans with Disabilities Act and the Rehabilitation Act and recruiting job applicants who are people with disabilities.
Business survey respondents were asked an open-ended question if they would like to further comment on their answers in the previous question or if they had additional comments or needs

DVR 2018 CSNA 114
regarding disability in the workplace. Respondents were given the opportunity to provide a narrative response. No responses were received.
Business Survey: Applicants with Disabilities
Business survey respondents were asked six questions regarding the need for recruitment assistance for applicants with disabilities. Respondents were asked to provide responses to the questions in a yes/no response format. Table 91 summarizes the results of the responses to the six questions according to the percentage of respondents who indicated a need for help with respect to the item indicated in each question.
Table 91 Recruitment: Applicants with Disabilities: Does Your Business Need Help with…
Does your business need help… Yes (%) Yes (n) No (%) No (n) Total Recruiting applicants who meet the job qualifications? 1 33.3% 2 66.7% 3
Recruiting applicants with good work habits? 1 33.3% 2 66.7% 3
Recruiting applicants with good social/interpersonal skills? 1 33.3% 2 66.7% 3
Assessing applicants' skills? 0 0.0% 3 100.0% 3 Discussing reasonable job accommodations with applicants? 1 25.0% 3 75.0% 4
Identifying reasonable job accommodations for applicants? 1 25.0% 3 75.0% 4
Business respondents indicated diverse needs regarding help recruiting applicants with disabilities. No need was selected by more than one respondent. A larger sampling may provide different results. However, the diversity of responses indicates that employers have a variety of service needs.
Business survey respondents had an open-ended question asking if they would like to further comment on their answers in the previous question or if they had additional comments or needs regarding applicants with disabilities. No responses were received in regard to this question.
Business Survey: Employees with Disabilities – Challenges to Job Retention
Business survey respondents were presented with a list of 12 job-related challenges and asked to identify the challenges they have now or have experienced in the past with respect to individuals with disabilities and job retention. Table 92 presents the percentage of business survey respondents who identified each item as a challenge to job retention.

DVR 2018 CSNA 115
Table 92 Challenges Related to Job Retention: Employees with Disabilities
Challenges to Job Retention Number Percent Poor attendance 1 33.3% Other (please describe) 1 33.3% I have no knowledge of any challenges we have had retaining employees with disabilities 1 33.3%
Total 3 100% The three business survey respondents who answered this question cited: poor attendance, no knowledge of any challenges the business has encountered retaining employees with disabilities, and “Other” in response to this question. The challenges identified in the “Other” category were caregivers and physical demands.
Business survey respondents were asked an open-ended question asking if they would like to further comment on their answers in the previous question or if they had additional comments or needs regarding employees with disabilities. Respondents were given the opportunity to provide a narrative response. The following is the quote from the single narrative responses received:
• “Lack of cooperation from parents/caregivers: we are open 24/7 and have flexible scheduling. One of our caregivers refuses to let the employee work weekends or holidays, an issue that would prevent most people from being employed at all. Physical demands: we are being sent applicants for consideration from advocates that do not understand the physical demands of the positions.”
Business Survey: Services Provided by DVR
Businesses survey respondents were asked questions regarding their knowledge of DVR and their utilization of services provided by the agency. Tables 93-96 include the results of those questions.

DVR 2018 CSNA 116
Table 93 Businesses’ Knowledge of DVR and Services
Businesses' Knowledge of DVR and Services Number Percent
Somewhat knowledgeable 3.0 75.0% Very knowledgeable 1.0 25.0% Little or no knowledge 0.0 0.0%
Total 4.0 100%
Table 94 Utilization of DVR Services by Employers
Employer Usage of DVR Services Number Valid (%) Yes 4 100.0% No 0 0.0%
Total 4 100%
Table 95 Services Provided to Employers by DVR
Types of Services Provided to Businesses by DBS Number Valid (%) Recruiting job applicants who are people with disabilities? 2 50.0% Helping workers with disabilities to retain employment? 2 50.0% Assessing applicants' skills? 2 50.0% Assistance identifying job accommodations for workers with disabilities? 1 25.0%
Obtaining training on sensitivity to workers with disabilities? 1 25.0% Obtaining incentives for employing workers with disabilities? 1 25.0% Discussing reasonable job accommodations with applicants? 1 25.0% Identifying reasonable job accommodations for applicants? 1 25.0% Other (please describe) 1 25.0% Training in understanding disability-related legislation such as the Americans with Disabilities Act as amended, the Workforce Innovation and Opportunity Act and the Rehabilitation Act as amended?
0 0.0%
Obtaining training on the different types of disabilities? 0 0.0% Obtaining information on training programs available for workers with disabilities? 0 0.0%
Recruiting applicants who meet the job qualifications? 0 0.0% Recruiting applicants with good work habits? 0 0.0% Recruiting applicants with good social/interpersonal skills? 0 0.0%

DVR 2018 CSNA 117
Table 96 Employer Satisfaction with DVR Services Employer Satisfaction with DVR Services Number Percent Satisfied 4 100.0% Very satisfied 0 0.0% Neither satisfied nor dissatisfied 0 0.0% Dissatisfied 0 0.0% Very dissatisfied 0 0.0%
Total 4
Business survey respondents were asked to rate their knowledge of DVR and the services they provide to businesses. The majority of business survey respondents (75 percent) indicated that they were somewhat knowledgeable regarding DVR and the services that they provide while 25% (n=1) of the four respondents to the question indicated that they were very knowledgeable of DVR and the services they provide.
All four of the business respondents indicated that they utilized DVR services. When asked what services DVR provided to employers, the three answers cited by two respondents out of four who participated were recruiting job applicants who are people with disabilities, helping workers with disabilities to retain employment, and assessing applicants' skills.
Business survey respondents who utilized DVR services were presented with a five-point response scale (with responses ranging from “very satisfied” to “very dissatisfied”) and asked to indicate how satisfied they were with the services they received from DVR. All four respondents provided an answer to the question, and indicated they were satisfied with DVR services.
Business Survey: Applicant or Employee Needs Not Met
Business survey respondents were asked an open-ended question asking if their business has any needs related to applicants or workers with disabilities that are not currently being met and to describe them in a narrative format. No responses to the question were received.
Business Survey: Business Demographics
Business survey respondents described their respective businesses types and the number of employees the business currently employs. Tables 97-98 indicate the various business types and size of the organization based on the number of employees.
Table 97 Type of Business
Business Type Number Percent Other (please describe) 2 50.0% Education 1 25.0% Banking/Finance 1 25.0%
Total 4 100%

DVR 2018 CSNA 118
Table 98 Size of Organization by Employee
Number of Employees Number Percent 1 thru 15 3 75.0% 51 - 250 1 25.0%
Total 4 100% The most commonly reported business type was manufacturing followed by “other.” Of the two responses received in the category “other” for business types, one indicated economic development and one indicated hospitality. The most commonly reported organization size by number of employees was 1-5 (n=3), followed by 51-250 employees (n=1).
KEY INFORMANT AND FOCUS GROUP INTERVIEWS
The following information was gathered from the individuals interviewed for this assessment in the area of Needs of Business and Effectiveness in Serving Employers:
• DVR conducts business outreach primarily through one full-time staff person and local field staff.
• DVR understands the importance of serving business and recognizes the value of the partnership with employers, but has limited resources to devote solely to the serving the needs of businesses.
• Employers in Wyoming were characterized as open to hiring individuals with disabilities in some areas, and very hesitant in other areas. There are still significant concerns by employers regarding the ability of individuals with disabilities to perform the essential functions of jobs. Employers have biases and there is a need for them to be educated about disability.
• The Employment and Training Employment Specialists represent important partnership opportunities for DVR staff as they strive to effectively outreach to employers and educate them on recruiting, hiring and retaining individuals with disabilities.
• Employers need more education and awareness regarding DVR and the supports available to them for hiring and accommodating individuals with disabilities.

DVR 2018 CSNA 119
RECOMMENDATIONS
The following recommendations are offered based on the information gathered in the Needs of Business and Effectiveness in Serving Employers section:
• Although each staff person at DVR understands they have a responsibility to outreach to employers, it would be helpful for DVR to increase the number of individuals that are devoted solely to serving employers.
• DVR is encouraged to strengthen the partnership between the Employment Specialist employed by Employment and Training in the Workforce Centers across the State.
• DVR is encouraged to maximize the use of on-the-job trainings in partnership with the Workforce Centers to increase employment opportunities for individuals with disabilities in high-demand occupations.
• DVR should consider establishing partnerships with Career-Technical Programs at community colleges in the State and employers to develop customized training programs for individuals with disabilities. These programs ensure employment in high-demand occupations for VR consumers that successfully complete the training and are often developed in partnership with the Title I programs in a State. More information can be found here: http://www.wintac.org/topic-areas/apprenticeships-and-customized-training.

DVR 2018 CSNA 120
CONCLUSION
The comprehensive statewide needs assessment for Wyoming’s Division of Vocational Rehabilitation utilized qualitative and quantitative methods to investigate the vocational rehabilitation needs of individuals with disabilities in the State. The combination of surveys and interviews resulted in more than 300 people participating in the assessment. The project team at San Diego State University’s Interwork Institute is confident that data saturation occurred across the multiple areas of investigation in the CSNA (other than perceptions of employers) and is hopeful that the findings and recommendations will be utilized by DVR to inform future planning and resource allocation for the agency.

DVR 2018 CSNA 121
APPENDICES Appendix A
Key Informant Individual Interview Protocol
1. Please identify your name, title, time with DVR or time in your current role. 2. Briefly describe your duties and service areas?
Overall DVR Performance
3. Regarding DVR’s overall performance as an agency, how effectively is the organization fulfilling its mission of helping people with disabilities obtain employment? A. How would you describe the changes, if any, that have occurred in DVR in the last
three years? B. What are the major challenges that DVR consumer’s face in obtaining and retaining
employment? C. What are the major challenges that you face that impact your ability to help
consumers obtain and retain employment?
MSD and SE 4. What are the needs of people with people with the most significant disabilities in
Wyoming and how effectively is DVR meeting those needs? 5. What disability types are the most in need and what are the challenges they face in
obtaining and retaining employment? 6. Do you provide SE services? If so, please describe the model of SE services you use.
A. How long does job coaching typically last? B. Who provides extended services? C. How many providers do you have and how effective are they? D. What populations generally receive SE services?
7. Do you provide customized employment services to individuals with disabilities in Wyoming? Please describe this service.
8. What would you recommend to improve services to individuals with the most significant disabilities?
9. What would you recommend to improve your SE or CE program?
Unserved/Underserved Populations 10. What geographic areas are underserved and why? 11. What racial/ethnic minority groups are underserved and why? 12. What are the rehabilitation needs of the minority populations that you serve? 13. What disability types are underserved and why? 14. How effective is DVR’s outreach to these groups/areas and what can be done to improve
outreach to them? 15. What do you recommend to improve service to these areas or populations? 16. Are there any other groups that are underserved, and if so, why do you think that is and
what can be done to improve services to this group?

DVR 2018 CSNA 122
Transition
17. Please describe how transition services works in Wyoming. Comment on: A. Partnerships with schools B. Outreach and intake/referral/plan processes C. Services provided
18. What are the greatest needs of transition-aged youth and how well are DVR and the schools meeting these needs?
19. Are you involved in pre-employment transition services? If yes, please describe how this works in Wyoming.
20. Do you serve foster care youth or youth involved with the juvenile justice system? 21. What can be done to improve youth and/or transition services in Wyoming?
CRPs
22. How effective are the CRPs in Wyoming? 23. What are the greatest challenges you face as a CRP, or in working with CRPs? 24. What needs to happen to improve or increase CRPs in Wyoming? 25. Is there a need to develop CRPs to serve any specific population or geographic areas? 26. What services do CRPs in the Wyoming need to provide? Where are the current gaps in
service?
Workforce Development System 27. How well is the Workforce Development System in Wyoming meeting the needs of
people with disabilities? What are the strengths and weaknesses of the system? 28. What is the relationship like between DVR and the Workforce Centers? 29. Are there shared-funding of cases between DVR and the Workforce Centers? 30. What has to happen to improve the relationship between the two organizations? Has
there been a noticeable improvement in the relationship over the last three years? 31. Do you work closely with Adult Education and Family Literacy? Please describe. 32. Are there other workforce agencies that serve people with disabilities in Wyoming? If
so, please identify them and the service they provide to your consumers as well as DVR’s relationship with them.
Business Partnerships 33. Please describe the ways that DVR partners with businesses in Wyoming to promote the
employment of people with disabilities. 34. What can DVR do to improve business partnerships and to engage employers in
recruiting and hiring people with disabilities? 35. What would you recommend that DVR do as an organization to maximize its
effectiveness in fulfilling its mission and providing excellent customer service during the next three years?

DVR 2018 CSNA 123
Wyoming DVR, CSNA 2018 Focus Group Protocols
[Introductions/confidentiality/purpose statements] Focus Group Protocol - Individuals with Disabilities: Employment goals
• What barriers do people with disabilities in Wyoming face in getting or keeping a job? Follow up: Transportation, education, not enough jobs, discrimination, attitudes, lack of communications, fear of loss of benefits, lack of knowledge of options, etc.
DVR Overall Performance
• What has your experience with DVR been like? What have been the positives and negatives?
• What services were helpful to you in preparing for, obtaining and retaining employment? • What services did you need that were not available or provided and why weren’t you able
to get these services? • What can DVR do differently to help consumers get and keep good jobs?
Barriers to accessing services
• What barriers do people with disabilities encounter when trying to access rehabilitation services from DVR? (prompts if necessary -- mobility, communication, structural)
Wyoming Workforce Partners
• Has anyone had, used, or tried to use the services of The Wyoming Workforce Centers? Follow-up: What was that experience like for you? What can they do differently to better serve individuals with disabilities?
Transition
• What needs do young people with disabilities in transition from high school have as far as preparing for, obtaining, or retaining employment?
• How well are the high schools in Wyoming preparing young people for the world of postsecondary education or employment? What can the schools do differently to prepare young people to be successful in postsecondary education or employment?
• What can DVR do to improve services to youth in transition?
Needs of underserved groups with disabilities • What groups of individuals would you consider un-served or underserved by the
vocational rehabilitation system? (Prompt if needed for different disability groups, minority status, geographic area and any other characteristics)
(For each identified group): What unmet needs do they have? Need for establishment of CRPs
• Have you received services from a CRP? If so, how was your service? How effective was it? What can be done to improve the future service delivery by CRPs?

DVR 2018 CSNA 124
• What programs or services should be created that focus on enhancing the quality of life for people with disabilities and their families, meeting basic needs and ensuring inclusion and participation? Of these services now in existence, which need to be improved?
• What services need to be offered in new locations in order to meet people's needs? Need for improvement of services or outcomes
• What needs to be done to improve the vocational rehabilitation services that people receive in Wyoming?

DVR 2018 CSNA 125
Focus Group Protocol - Partner Agencies:
Employment Goals • What barriers do people with disabilities in Wyoming face in getting or keeping a job?
Follow up: Education, not enough jobs, discrimination, attitudes, lack of communications, fear of loss of benefits, lack of knowledge of options, etc.
Barriers to accessing services
• What barriers do people with disabilities encounter when trying to access rehabilitation services from DVR?
Impressions of needs of individuals with significant and most significant disabilities
• What are the unmet rehabilitation needs of individuals with significant or most significant disabilities?
• What needs of individuals with significant and most significant disabilities are being met the best/most extensively?
Needs of underserved groups with disabilities
• What groups of individuals would you consider un-served or underserved by the vocational rehabilitation system? (Prompt for different disability groups, minority status, geographic area or other characteristics)
(For each identified group): What unmet needs do they have? Need for supported employment
• Please describe how effective the SE and CE programs are in Wyoming. What populations are receiving SE and CE services?
• What SE or CE needs are not being met? • What do you recommend to meet the needs for SE or CE?
Transition
• What needs do young people with disabilities in transition from high school have as far as preparing for, obtaining, or retaining employment?
• How well are the high schools in Wyoming preparing young people for the world of postsecondary education or employment? What can the schools do differently to prepare young people to be successful in postsecondary education or employment?
• How would you characterize DVR’s relationship/partnership with the secondary school system in Wyoming?
• How well is DVR serving youth in transition in terms of preparing them for postsecondary education or employment?
• What can DVR do to improve services to youth in transition? Needs of individuals served through the Wyoming Workforce Centers or WIOA system
• How effectively does the Workforce Center system in Wyoming serve individuals with disabilities?

DVR 2018 CSNA 126
• Are there any barriers to individuals with disabilities accessing services through the Workforce Centers? If so, what are they and what can be done to change this?
• How effectively is DVR working in partnership with the Workforce Centers? Do you have any recommendations about how to improve this partnership if needed?
• What would you recommend to improve the Workforce Center’s ability to serve individuals with disabilities in Wyoming?
Need for establishment, development or improvement of CRPs
• What community-based rehabilitation programs or services need to be created, expanded or improved?
• What services need to be offered in new locations in order to meet people's needs? • What community-based rehabilitation services are most successful? How are they most
successful or what makes them so? Need for improvement of services or outcomes
• What needs to be done to improve the vocational rehabilitation services that people receive?

DVR 2018 CSNA 127
Focus Group Protocol – Wyoming DVR staff:
Employment Goals
• What barriers do people with disabilities in Wyoming face in getting or keeping a job? Follow up: Education, not enough jobs, discrimination, attitudes, lack of communications, fear of loss of benefits, lack of knowledge of options, etc.
Barriers to accessing services
• What barriers do people with disabilities encounter when trying to access rehabilitation services from DVR?
Impressions of needs of individuals with significant and most significant disabilities
• What are the unmet rehabilitation needs of individuals with significant or most significant disabilities?
• What needs of individuals with significant and most significant disabilities are being met the best/most extensively?
Needs of underserved groups with disabilities
• What groups of individuals would you consider un-served or underserved by the vocational rehabilitation system? (Prompt for different disability groups, minority status, geographic area or any other characteristics).
(For each identified group): What unmet needs do they have? Need for supported employment
• Please describe how effective the SE and CE programs are in Wyoming. What populations are receiving SE and CE services?
• What SE or CE needs are not being met? • What do you recommend to meet the needs for SE or CE?
Transition
• What needs do young people with disabilities in transition from high school have as far as preparing for, obtaining, or retaining employment?
• How well are the high schools in Wyoming preparing young people for the world of postsecondary education or employment? What can the schools do differently to prepare young people to be successful in postsecondary education or employment?
• How would you characterize DVR’s relationship/partnership with the secondary school system in Wyoming?
• How well is DVR serving youth in transition in terms of preparing them for postsecondary education or employment?
• What can DVR do to improve services to youth in transition? Needs of individuals served through the Wyoming Workforce Centers or WIOA system
• How effectively does the Workforce Center system in Wyoming serve individuals with disabilities?

DVR 2018 CSNA 128
• Are there any barriers to individuals with disabilities accessing services through the Workforce Centers? If so, what are they and what can be done to change this?
• How effectively is DVR working in partnership with the Workforces Centers? Do you have any recommendations about how to improve this partnership if needed?
• What would you recommend to improve the Workforce Centers’ ability to serve individuals with disabilities in Wyoming?
Need for establishment, development or improvement of CRPs • What community-based rehabilitation programs or services need to be created, expanded
or improved? • What services need to be offered in new locations in order to meet people's needs? • What community-based rehabilitation services are most successful? How are they most
successful or what makes them so? Need for improvement of services or outcomes
• What needs to be done to improve the vocational rehabilitation services that people receive?

DVR 2018 CSNA 129
Focus Group Protocol – Businesses Please discuss your familiarity with DVR and the services they provide to people with disabilities and to businesses. What needs do you have regarding recruiting people with disabilities for employment?
• Do you do anything specific to attract candidates with disabilities? Please describe. Please discuss how qualified and prepared individuals with disabilities are when they apply for employment with your business. What needs do you have regarding applicants with disabilities?
• Are you aware of the incentives for hiring people with disabilities? Would these incentives influence your decision to hire?
What are the qualities you are looking for in an applicant for a given job and an employee? What needs do you have regarding employees with disabilities?
• Sensitivity training? • Understanding and compliance with applicable laws? • Reasonable accommodations?
What challenges do employees with disabilities face with job retention? What services can DVR provide to you and to other businesses to increase employment opportunities for people with disabilities in Wyoming?

DVR 2018 CSNA 130
Appendix B – Individual Survey
Wyoming DVR 2018 Individual Survey The Wyoming Department of Workforce Services, Division of Vocational Rehabilitation (DVR) is conducting an assessment of the vocational rehabilitation needs of Wyoming residents with disabilities. The results of this needs assessment will be used to help improve programs and services for persons with disabilities in Wyoming. The following survey includes questions that ask you about the unmet, employment-related needs of persons with disabilities. We anticipate that it will take about 20 minutes of your time to complete the survey. If you prefer, you may ask a family member, a personal attendant, or a caregiver to complete the survey for you. If you are a family member, personal attendant or caregiver for a person with a disability and are responding on behalf of an individual with a disability, please answer the survey questions based upon your knowledge of the needs of the person with the disability. This survey is completely confidential and your participation in this needs assessment is voluntary. If you decide to participate, your responses will be anonymous, that is, recorded without any identifying information that is linked to you. You will not be asked for your name anywhere in this survey. If you have any questions regarding this survey or if you would prefer to complete this survey in an alternate format, please contact Dr. Chaz Compton at San Diego State University at the following e-mail address or phone number: [email protected] (619) 594-7935 Thank you very much for your time and input!

DVR 2018 CSNA 131
Q1. Which statement best describes your association with the Wyoming Division of Vocational Rehabilitation (DVR)? (select one response)
o I have never used the services of DVR
o I am a current client of DVR
o I am a previous client of DVR, my case has been closed
o I am not familiar with DVR
o Other (please describe) ________________________________________________ If you chose “I have never used the services of DVR,” or “I am not familiar with DVR,” please skip to question 4
Q2. Who referred you to DVR?
o I was self-referred
o A community rehabilitation program
o The Social Security Administration
o The Wyoming Workforce Center
o My Parole Officer or other court official
o A behavioral health program
o High School Transition Teacher
o My family
o A friend
o A healthcare professional
o A staff member at a college or vocational training program
o Other (please describe) ________________________________________________

DVR 2018 CSNA 132
Q3. Why did you go to DVR for services (check all that apply)?
▢ I needed help finding a job
▢ I was in danger of losing my job
▢ I wanted to go to college or some other kind of postsecondary education
▢ I needed money
▢ I was told to by someone
▢ I don't know
▢ Other (please describe) __________________________________________________________________________________________________________________________________________________
Demographic Information
Q4. What is your age?
o under 25
o 25-64
o 65 and over

DVR 2018 CSNA 133
Q5. What is your primary race or ethnic group (check all that apply)?
▢ African American/Black
▢ American Indian or Alaska Native
▢ Asian
▢ Caucasian/White
▢ Hawaiian or Other Pacific Islander
▢ Hispanic/Latino
▢ Other (please describe) ________________________________________________
▢ I don't know
Q6. What is your language of preference for communication?
o English
o Spanish
o Hawaiian
o Chinese
o Japanese
o American Sign Language
o Other (Please identify) ________________________________________________

DVR 2018 CSNA 134
Q7. What County do you live in?
o Albany
o Big Horn
o Campbell
o Carbon
o Converse
o Crook
o Fremont
o Goshen
o Hot Springs
o Johnson
o Laramie
o Lincoln
o Matrona
o Niobrara
o Park
o Platte
o Sheridan
o Sublette
o Sweetwater
o Teton

DVR 2018 CSNA 135
o Uinta
o Washakie
o Weston
o I do not know what County I live in
Q8. Which of the following would you use to describe your primary disabling condition? (select one)
o Blindness or visually impaired
o Intellectual Disability (ID)
o Developmental Disability (DD)
o Communication
o Deaf or Hard of Hearing
o Deaf-Blind
o Mental Health
o Mobility
o Physical
o Other (please describe) ________________________________________________
o I don't know
o No impairment

DVR 2018 CSNA 136
Q9. If you have a secondary disabling condition, which of the following would you use to describe it? (select one) If you do not have a secondary disabling condition, please select "No impairment" below.
o Blindness or visually impaired
o Intellectual disability (ID)
o Developmental Disability (DD)
o Communication
o Deaf or Hard of Hearing
o Deaf-Blind
o Mental Health
o Mobility
o Physical
o Other (please describe) ________________________________________________
o I don't know
o No impairment

DVR 2018 CSNA 137
Q10. Please indicate whether you receive the following Social Security disability benefits (please check all that apply).
▢ I receive SSI (Supplemental Security Income. SSI is a means-tested benefit generally provided to individuals with little or no work history)
▢ I receive SSDI (Social Security Disability Insurance. SSDI is provided to individuals that have worked in the past and is based on the amount of money the individual paid into the system through payroll deductions)
▢ I receive a check from the Social Security Administration every month, but I do not know which benefit I get
▢ I don't know if I receive Social Security disability benefits
▢ I do not receive Social Security disability benefits
Employment-Related Needs
The next several questions ask you about employment-related needs that you may have.

DVR 2018 CSNA 138
Q11. Please identify which of the following have been barriers to you getting a job

DVR 2018 CSNA 139
Yes, it has been a barrier Not a barrier
Lack of education or training o o Lack of job skills o o
Lack of job search skills o o Criminal Record o o
Limited English skills o o Lack of available jobs o o
Employer concerns about my ability to do the job due to my
disability o o Lack of assistive technology o o
Lack of reasonable accommodations at work o o
Lack of attendant care o o Lack of reliable transportation o o
Mental health concerns o o Substance abuse o o Lack of child care o o Lack of housing o o

DVR 2018 CSNA 140
Concern over loss of Social Security benefits due to working o o
Q12. If you have experienced other barriers to getting a job not mentioned above, please list them here.
________________________________________________________________
________________________________________________________________
Q13. What are the most significant barriers that you have faced to getting a job?
________________________________________________________________
________________________________________________________________
________________________________________________________________
________________________________________________________________
Barriers to Accessing Wyoming Division of Vocational Rehabilitation (DVR) Services
The next several questions ask you about barriers to accessing DVR services.

DVR 2018 CSNA 141
Q14. Please indicate which of the following have been a barrier to you accessing DVR services.
Yes, it has been a barrier Not a barrier
Lack of available transportation to the DVR office o o
DVR's hours of operation o o Lack of information about
available services o o Lack of disability-related
accommodations o o I have nobody that can help me
access services o o Language barriers o o
Difficulties scheduling meetings with my counselor o o
Other difficulties with DVR staff o o Difficulties completing the DVR
application o o Difficulties completing the
Individualized Plan for Employment (IPE) o o

DVR 2018 CSNA 142
Q15. Have you had any other challenges or barriers not already mentioned that have made it difficult for you to access DVR services?
o Yes (please describe) ________________________________________________
o No
Q16. Where do you usually meet with your counselor?
o I usually meet with my counselor in my community/school
o I go to a DVR office to meet with my counselor
o I don't have a DVR counselor
Q17. How can DVR change their services to help you get a job?
________________________________________________________________
________________________________________________________________
________________________________________________________________
________________________________________________________________
________________________________________________________________
Wyoming Workforce Centers The next several questions ask you about experiences you may have had with the Wyoming
Workforce Centers, previously referred to as One-Stops or Career Centers.

DVR 2018 CSNA 143
Q18. Have you ever tried to use the services of the Wyoming Workforce Centers beyond an online account?
o Yes
o No
If you answered “No” to this question, please skip to question 29
Q19. Did you experience any difficulties with the physical accessibility of the building?
o Yes (If yes, please describe the difficulties you experienced) _________________________________________________________________________
o No
Q20. Did you have any difficulty accessing the programs at the Wyoming Workforce Centers (i.e. no available assistive technology, no interpreters, etc.)?
o Yes
o No
Q21. Did you go to the Workforce Center to get training?
o Yes
o No
If you answered “No” to this question, please skip to question 24

DVR 2018 CSNA 144
Q22. Did you get the training that you were seeking?
o Yes
o No
Q23. Did the training result in employment?
o Yes
o No
Q24. Did you go to the Workforce Center to find a job?
o Yes
o No
If you answered “No” to this question, please skip to question 26
Q25. Did they help you find employment?
o Yes
o No

DVR 2018 CSNA 145
Q26. Was the Workforce Center staff helpful?
o Yes, they were very helpful
o They were somewhat helpful
o No, they were not helpful
Q27. Were the services at the Workforce Center valuable?
o Yes, the services were very valuable
o The services were somewhat valuable
o No, the services were not valuable
Q28. Overall, how would you rate the effectiveness of the Workforce Centers in serving individuals with disabilities?
o Very effective
o Somewhat effective
o No opinion
o Somewhat ineffective
o Very ineffective
Q29. Is there anything else you would like to add about DVR or its services?
________________________________________________________________
________________________________________________________________

DVR 2018 CSNA 146
________________________________________________________________
________________________________________________________________
________________________________________________________________
This is the end of the survey! Your information and feedback is valuable to DVR, thank you for completing the survey.
Please return he survey in the self-addressed stamped envelope provided.
DVR is also conducting focus groups as part of this assessment. If you are interested in
participating in a focus group, please contact:
Jeff White at [email protected] or at 307-777-5739

DVR 2018 CSNA 147
Appendix C – Partner Survey
Wyoming 2018 CSNA Partner Survey
Start of Block: Default Question Block
Q1 Wyoming Division of Vocational Rehabilitation Community Partner Survey The Wyoming Division of Vocational Rehabilitation (DVR) is working with the State Rehabilitation Council and staff at the Interwork Institute at San Diego State University in order to conduct a needs assessment of Wyoming residents with disabilities. The results of this needs assessment will inform the development of the DVR Unified State Plan for providing rehabilitation services and will help planners make decisions about programs and services for persons with disabilities.
The following survey includes questions that ask you about the unmet, employment-related needs of persons with disabilities. You will also be asked about the type of work you do and whether you work with specific disability populations. We anticipate that it will take about 20 minutes of your time to complete the survey. Your participation in this needs assessment is voluntary. If you decide to participate, your responses will be anonymous; that is, recorded without any identifying information that is linked to you. You will not be asked for your name anywhere in this survey.
If you have any questions regarding this survey or would like to request the survey in an alternate format, please contact Dr. Chaz Compton at San Diego State University at the following e-mail address or phone:
(619) 594-7935
Thank you for your time and input!

DVR 2018 CSNA 148
Q2 How would you classify your organization?
o Community Rehabilitation Program
o Secondary School
o Postsecondary school
o Mental Health Provider
o Medical Provider
o Developmental Disability Organization
o Veteran's Agency
o Client Advocacy Organization
o Other Federal, State, or Local Government Entity
o Other Public or Private Organization
o Individual Service Provider
o Other (please describe) ________________________________________________

DVR 2018 CSNA 149
Q3 In what County(s) do you provide services (check all that apply)
▢ Albany
▢ Big Horn
▢ Campbell
▢ Carbon
▢ Converse
▢ Crook
▢ Fremont
▢ Goshen
▢ Hot Springs
▢ Johnson
▢ Laramie
▢ Lincoln
▢ Natrona
▢ Niobrara
▢ Park
▢ Platte
▢ Sheridan

DVR 2018 CSNA 150
▢ Sublette
▢ Sweetwater
▢ Teton
▢ Uinta
▢ Washakie
▢ Weston

DVR 2018 CSNA 151
Q4 Please indicate which client populations you work with on a regular basis (please check all that apply)
▢ Individuals with the most significant disabilities
▢ Individuals that are blind
▢ Individuals that are deaf
▢ Individuals that need supported employment
▢ Individuals that are racial or ethnic minorities
▢ Individuals from unserved or underserved populations
▢ Transition-aged youth (14-24)
▢ Individuals served by Wyoming's Workforce Centers (formerly referred to as One-Stops or Career Centers)
▢ Veterans
▢ Other (please describe) ________________________________________________
Q5 Vocational Rehabilitation Services The following series of questions asks about services available to DVR consumers either directly or by service providers

DVR 2018 CSNA 152
Q6 Please indicate which of the following services are immediately available to DVR consumers. (check all that apply).
▢ Job development services
▢ Job training services (TWE, Job Coaching, OJT, etc.)
▢ Other education services
▢ Assistive technology
▢ Vehicle modification assistance
▢ Other transportation assistance
▢ Income assistance
▢ Medical treatment
▢ Mental health treatment
▢ Substance abuse treatment
▢ Personal care attendants
▢ Health insurance
▢ Housing
▢ Benefit planning assistance
▢ Other (please describe) ________________________________________________

DVR 2018 CSNA 153
Q7 Please indicate which of the following service are not immediately available or do not exist in the area of the State where you work (check all that apply).
▢ Job development services
▢ Job training services (TWE, Job Coaching, OJT, etc.)
▢ Other education services
▢ Assistive technology
▢ Vehicle modification assistance
▢ Other transportation assistance
▢ Income assistance
▢ Medical treatment
▢ Mental health treatment
▢ Substance abuse treatment
▢ Personal care attendants
▢ Health insurance
▢ Housing
▢ Benefit planning assistance
▢ Other (please describe) ________________________________________________

DVR 2018 CSNA 154
Q8 In your experience, how frequently are service providers able to meet the rehabilitation service needs of DVR consumers in your area?
o All of the time
o Most of the time
o Some of the time
o None of the time Skip To: Q11 If In your experience, how frequently are service providers able to meet the rehabilitation service... = All of the time
Q9 What rehabilitation needs are service providers unable to meet in your area?
________________________________________________________________
________________________________________________________________
________________________________________________________________
________________________________________________________________
________________________________________________________________

DVR 2018 CSNA 155
Q10 What are the primary reasons that service providers are unable to meet consumers' service needs?
▢ Not enough service providers available in area
▢ Low quality of service provider services
▢ Low rates paid for services
▢ Low levels of accountability for poor performance by service providers
▢ Consumer barriers prevent successful interactions with service providers
▢ Other (please describe) ________________________________________________
Q11 What is the most important change that service providers could make to support consumer's efforts to achieve their employment goals?
________________________________________________________________

DVR 2018 CSNA 156
Q12 What services do you feel service providers are most effective in providing to DVR consumers (check all that apply)?
▢ Job development services
▢ Job training services (TWE, Job Coaching, OJT, etc.)
▢ Other education services
▢ Assistive technology
▢ Vehicle modification assistance
▢ Other transportation assistance
▢ Income assistance
▢ Medical treatment
▢ Mental health treatment
▢ Substance abuse treatment
▢ Personal care attendants
▢ Health insurance
▢ Housing
▢ Benefit planning assistance
▢ Other (please describe) ________________________________________________
Q13 Barriers to Achieving Employment Goals

DVR 2018 CSNA 157
The next series of questions ask about barriers that DVR consumers face in achieving their employment goals

DVR 2018 CSNA 158
Q14 What are the most common barriers to achieving employment goals for DVR consumers (check all that apply)?
▢ Not having education or training
▢ Not having job skills
▢ Little or no work experience
▢ Not having job search skills
▢ Convictions for criminal offenses
▢ Language barriers
▢ Poor social skills
▢ Not enough jobs available
▢ Employers' perceptions about employing persons with disabilities
▢ Not having disability-related accommodations
▢ Lack of help with disability-related personal care
▢ Disability-related transportation issues
▢ Other transportation issues
▢ Mental health issues
▢ Substance abuse issues
▢ Other health issues
▢ Childcare issues

DVR 2018 CSNA 159
▢ Housing issues
▢ Perceptions regarding the impact of income on Social Security benefits
▢ Other (please describe) ________________________________________________

DVR 2018 CSNA 160
Q15 What are the barriers that prevent DVR consumers with the most significant disabilities from achieving their employment goals?
▢ Not having education or training
▢ Not having job skills
▢ Little or no work experience
▢ Not having job search skills
▢ Convictions for criminal offenses
▢ Language barriers
▢ Poor social skills
▢ Not enough jobs available
▢ Employers' perceptions about employing persons with disabilities
▢ Not having disability-related accommodations
▢ Lack of help with disability-related personal care
▢ Disability-related transportation issues
▢ Other transportation issues
▢ Mental health issues
▢ Substance abuse issues
▢ Other health issues
▢ Childcare issues

DVR 2018 CSNA 161
▢ Housing issues
▢ Perceptions regarding the impact of income on Social Security benefits
▢ Other (please describe) ________________________________________________

DVR 2018 CSNA 162
Q16 What are the barriers that prevent DVR consumers who are youth in transition from achieving their employment goals?
▢ Not having education or training
▢ Not having job skills
▢ Little or no work experience
▢ Not having job search skills
▢ Convictions for criminal offenses
▢ Language barriers
▢ Poor social skills
▢ Not enough jobs available
▢ Employers' perceptions about employing persons with disabilities
▢ Not having disability-related accommodations
▢ Lack of help with disability-related personal care
▢ Disability-related transportation issues
▢ Other transportation issues
▢ Mental health issues
▢ Substance abuse issues
▢ Other health issues
▢ Childcare issues

DVR 2018 CSNA 163
▢ Housing issues
▢ Perceptions regarding the impact of income on Social Security disability benefits
▢ Other (please describe) ________________________________________________

DVR 2018 CSNA 164
Q17 What are the barriers that prevent DVR consumers who are racial or ethnic minorities from achieving their employment goals?
▢ Not having education or training
▢ Not having job skills
▢ Little or no work experience
▢ Not having job search skills
▢ Convictions for criminal offenses
▢ Language barriers
▢ Poor social skills
▢ Not enough jobs available
▢ Employers' perceptions about employing persons with disabilities
▢ Not having disability-related accommodations
▢ Lack of help with disability-related personal care
▢ Disability-related transportation issues
▢ Other transportation issues
▢ Mental health issues
▢ Substance abuse issues
▢ Other health issues
▢ Childcare issues

DVR 2018 CSNA 165
▢ Housing issues
▢ Perceptions regarding the impact of income on Social Security benefits
▢ Other (please describe) ________________________________________________
Q18 What are the top three reasons that people with disabilities find it difficult to access DVR services (please select a maximum of three reasons)?
▢ Limited accessibility of DVR via public transportation
▢ Other challenges related to the physical location of the DVR office
▢ Inadequate disability-related accommodations
▢ Language barriers
▢ Difficulties completing the application
▢ Difficulties completing the Individualized Plan for Employment (IPE)
▢ Inadequate assessment services
▢ Slow service delivery
▢ Difficulties accessing training or education programs
▢ Lack of options for the use of technology to communicate with DVR staff such as Skype, text, etc.
▢ DVR staff do not meet clients in the communities where the clients live
▢ Other (please describe) ________________________________________________

DVR 2018 CSNA 166
Q19 What are the top three changes that would help you better serve DVR consumers (please select a maximum of three changes)?
▢ Smaller caseload
▢ More streamlined processes
▢ Reduced documentation requirements
▢ Improved communication with referring DVR counselor
▢ Additional training
▢ Higher rates paid by DVR for services
▢ Referral of appropriate individuals
▢ Improved business partnerships
▢ Incentives for high performance paid by DVR
▢ Increased options for technology use to communicate with consumers
▢ Increased collaboration with Wyoming Workforce Centers
▢ Other (please describe) ________________________________________________
Q20 Wyoming Workforce Centers The following series of questions asks you about the Wyoming Workforce Centers

DVR 2018 CSNA 167
Q21 How frequently do you work with the Wyoming Workforce Centers (formerly referred to as One-Stops or Career Centers)?
o Very frequently
o Somewhat frequently
o Infrequently
o Not at all
Q22 How physically accessible are the Wyoming Workforce Centers for individuals with disabilities?
o Fully accessible
o Somewhat accessible
o Not accessible
o I do not know
Q23 How programmatically accessible are the Wyoming Workforce Centers?
o Fully accessible
o Somewhat accessible
o Not accessible
o I do not know

DVR 2018 CSNA 168
Q24 In your opinion, how effectively do the Wyoming Workforce Centers serve individuals with disabilities?
o Very effectively
o Effectively
o Not effectively
o They do not serve individuals with disabilities
Q25 What can the Wyoming Workforce Centers do to improve services to individuals with disabilities (Check all that apply)?
▢ Improve physical accessibility
▢ Improve programmatic accessibility
▢ Train their staff on how to work with individuals with disabilities
▢ Include individuals with disabilities when purchasing training for their clients
▢ Partner more effectively with DVR
▢ Other (please describe) ________________________________________________
Q26 Your feedback is valuable to us, and we would like to thank you for taking the time to complete the survey! DVR is also conducting individual and focus group interviews as part of this assessment. If you are interested in participating in an interview or a focus group, please contact Jeff White at [email protected] or at 307-777-5739. Please select the "NEXT" button below to submit your responses.

DVR 2018 CSNA 169
Appendix D – Staff Survey
Wyoming 2018 CSNA Staff Survey
Start of Block: Default Question Block
Q1 Wyoming Division of Vocational Rehabilitation Staff Survey The Wyoming Division of Vocational Rehabilitation (DVR) is working with the State Rehabilitation Council and staff at the Interwork Institute at San Diego State University in order to conduct a needs assessment of Wyoming residents with disabilities. The results of this needs assessment will inform the development of the DVR Unified State Plan for providing rehabilitation services and will help planners make decisions about programs and services for persons with disabilities.
The following survey includes questions that ask you about the unmet, employment-related needs of persons with disabilities. You will also be asked about the type of work you do and whether you work with specific disability populations. We anticipate that it will take about 20 minutes of your time to complete the survey.
Your participation in this needs assessment is voluntary. If you decide to participate, your responses will be anonymous; that is, recorded without any identifying information that is linked to you. You will not be asked for your name anywhere in this survey.
If you have any questions regarding this survey or would like to request the survey in an alternate format, please contact Dr. Chaz Compton at San Diego State University at the following e-mail address or phone:
(619) 594-7935
Thank you for your time and input!

DVR 2018 CSNA 170
Q3 What is your job title?
________________________________________________________________
Q4 How long have you worked in the job that you have now?
o Less than one year
o 1-5 years
o 6-10 years
o 11-20 years
o 21+ years
Q5 Vocational Rehabilitation Services The following series of questions asks about services available to DVR consumers either directly or by service providers

DVR 2018 CSNA 171
Q6 Please indicate which of the following services are immediately available to DVR consumers (check all that apply).
▢ Job development services
▢ Job training services (TWE, Job Coaching, OJT, etc.)
▢ Other education services
▢ Assistive technology
▢ Vehicle modification assistance
▢ Other transportation assistance
▢ Income assistance
▢ Medical treatment
▢ Mental health treatment
▢ Substance abuse treatment
▢ Personal care attendants
▢ Health insurance
▢ Housing
▢ Benefit planning assistance
▢ Other (please describe) ________________________________________________

DVR 2018 CSNA 172
Q7 Please indicate which of the following service are not immediately available or do not exist in the area of the State where you work (check all that apply).
▢ Job development services
▢ Job training services (TWE, Job Coaching, OJT, etc.)
▢ Other education services
▢ Assistive technology
▢ Vehicle modification assistance
▢ Other transportation assistance
▢ Income assistance
▢ Medical treatment
▢ Mental health treatment
▢ Substance abuse treatment
▢ Personal care attendants
▢ Health insurance
▢ Housing
▢ Benefit planning assistance
▢ Other (please describe) ________________________________________________

DVR 2018 CSNA 173
Q8 In your experience, how frequently are service providers able to meet the rehabilitation service needs of DVR consumers in your area?
o All of the time
o Most of the time
o Some of the time
o None of the time Skip To: Q11 If In your experience, how frequently are service providers able to meet the rehabilitation service... = All of the time
Q9 What rehabilitation needs are service providers unable to meet in your area?
________________________________________________________________
________________________________________________________________
________________________________________________________________
________________________________________________________________
________________________________________________________________

DVR 2018 CSNA 174
Q10 What are the primary reasons that service providers are unable to meet consumers' service needs?
▢ Not enough service providers available in area
▢ Low quality of service provider services
▢ Low rates paid for services
▢ Low levels of accountability for poor performance by service providers
▢ Consumer barriers prevent successful interactions with service providers
▢ Other (please describe) ________________________________________________
Q11 What is the most important change that service providers could make to support consumer's efforts to achieve their employment goals?
________________________________________________________________

DVR 2018 CSNA 175
Q12 What services do you feel DVR are most effective in providing to its consumers either directly or through community partners (check all that apply).
▢ Job development services
▢ Job training services (TWE, Job Coaching, OJT, etc.)
▢ Other education services
▢ Assistive technology
▢ Vehicle modification assistance
▢ Other transportation assistance
▢ Income assistance
▢ Medical treatment
▢ Mental health treatment
▢ Substance abuse treatment
▢ Personal care attendants
▢ Health insurance
▢ Housing
▢ Benefit planning assistance
▢ Other (please describe) ________________________________________________
Q13 Barriers to Achieving Employment Goals

DVR 2018 CSNA 176
The next series of questions ask about barriers that DVR consumers face in achieving their employment goals

DVR 2018 CSNA 177
Q14 What are the most common barriers to achieving employment goals for DVR consumers (check all that apply)?
▢ Not having education or training
▢ Not having job skills
▢ Little or no work experience
▢ Not having job search skills
▢ Convictions for criminal offenses
▢ Language barriers
▢ Poor social skills
▢ Not enough jobs available
▢ Employers' perceptions about employing persons with disabilities
▢ Not having disability-related accommodations
▢ Lack of help with disability-related personal care
▢ Disability-related transportation issues
▢ Other transportation issues
▢ Mental health issues
▢ Substance abuse issues
▢ Other health issues
▢ Childcare issues

DVR 2018 CSNA 178
▢ Housing issues
▢ Perceptions regarding the impact of income on Social Security benefits
▢ Other (please describe) ________________________________________________

DVR 2018 CSNA 179
Q15 What are the barriers that prevent DVR consumers with the most significant disabilities from achieving their employment goals?
▢ Not having education or training
▢ Not having job skills
▢ Little or no work experience
▢ Not having job search skills
▢ Convictions for criminal offenses
▢ Language barriers
▢ Poor social skills
▢ Not enough jobs available
▢ Employers' perceptions about employing persons with disabilities
▢ Not having disability-related accommodations
▢ Lack of help with disability-related personal care
▢ Disability-related transportation issues
▢ Other transportation issues
▢ Mental health issues
▢ Substance abuse issues
▢ Other health issues
▢ Childcare issues

DVR 2018 CSNA 180
▢ Housing issues
▢ Perceptions regarding the impact of income on Social Security benefits
▢ Other (please describe) ________________________________________________

DVR 2018 CSNA 181
Q16 What are the barriers that prevent DVR consumers who are youth in transition from achieving their employment goals?
▢ Not having education or training
▢ Not having job skills
▢ Little or no work experience
▢ Not having job search skills
▢ Convictions for criminal offenses
▢ Language barriers
▢ Poor social skills
▢ Not enough jobs available
▢ Employers' perceptions about employing persons with disabilities
▢ Not having disability-related accommodations
▢ Lack of help with disability-related personal care
▢ Disability-related transportation issues
▢ Other transportation issues
▢ Mental health issues
▢ Substance abuse issues
▢ Other health issues
▢ Childcare issues

DVR 2018 CSNA 182
▢ Housing issues
▢ Perceptions regarding the impact of income on Social Security benefits
▢ Other (please describe) ________________________________________________

DVR 2018 CSNA 183
Q17 What are the barriers that prevent DVR consumers who are racial or ethnic minorities from achieving their employment goals?
▢ Not having education or training
▢ Not having job skills
▢ Little or no work experience
▢ Not having job search skills
▢ Convictions for criminal offenses
▢ Language barriers
▢ Poor social skills
▢ Not enough jobs available
▢ Employers' perceptions about employing persons with disabilities
▢ Not having disability-related accommodations
▢ Lack of help with disability-related personal care
▢ Disability-related transportation issues
▢ Other transportation issues
▢ Mental health issues
▢ Substance abuse issues
▢ Other health issues
▢ Childcare issues

DVR 2018 CSNA 184
▢ Housing issues
▢ Perceptions regarding the impact of income on Social Security benefits
▢ Other (please describe) ________________________________________________
Q18 What are the top three reasons that people with disabilities find it difficult to access DVR services (please select a maximum of three reasons)?
▢ Limited accessibility of DVR via public transportation
▢ Other challenges related to the physical location of the DVR office
▢ Inadequate disability-related accommodations
▢ Language barriers
▢ Difficulties completing the application
▢ Difficulties completing the Individualized Plan for Employment (IPE)
▢ Inadequate assessment services
▢ Slow service delivery
▢ Difficulties accessing training or education programs
▢ Lack of options for the use of technology to communicate with DVR staff such as Skype, text, etc.
▢ DVR staff do not meet clients in the communities where the clients live
▢ Other (please describe) ________________________________________________

DVR 2018 CSNA 185
Q19 What are the top three changes that would help you better serve DVR consumers (please select a maximum of three changes)?
▢ Smaller caseload
▢ More streamlined processes
▢ Better data management tools
▢ Better assessment tools
▢ Additional training
▢ More administrative support
▢ More supervisor support
▢ Improved business partnerships
▢ More community-based service providers for specific services
▢ More effective community-based service providers
▢ Accountability for poor performance by service providers
▢ Incentives for high performing service providers
▢ Increased outreach to consumers
▢ Increased options for technology use to communicate with consumers
▢ Increased collaboration with other workforce partners including Workforce Centers
▢ Other (please describe) ________________________________________________

DVR 2018 CSNA 186
Q20 Wyoming Workforce Centers The following series of questions asks you about the Wyoming Workforce Centers
Q21 How frequently do you work with the Wyoming Workforce Centers (formerly referred to as One-Stops or Career Centers)?
o Very frequently
o Somewhat frequently
o Infrequently
o Not at all
Q22 How physically accessible are the Wyoming Workforce Centers for individuals with disabilities?
o Fully accessible
o Somewhat accessible
o Not accessible
o I do not know

DVR 2018 CSNA 187
Q23 How programmatically accessible are the Wyoming Workforce Centers?
o Fully accessible
o Somewhat accessible
o Not accessible
o I do not know
Q24 In your opinion, how effectively do the Wyoming Workforce Centers serve individuals with disabilities?
o Very effectively
o Effectively
o Not effectively
o They do not serve individuals with disabilities

DVR 2018 CSNA 188
Q25 What can the Wyoming Workforce Centers do to improve services to individuals with disabilities (Check all that apply)?
▢ Improve physical accessibility
▢ Improve programmatic accessibility
▢ Train their staff on how to work with individuals with disabilities
▢ Include individuals with disabilities when purchasing training for their clients
▢ Partner more effectively with DVR
▢ Other (please describe) ________________________________________________
Q26 Your feedback is valuable to us, and we would like to thank you for taking the time to complete the survey! DVR is also conducting focus groups as part of this assessment. If you are interested in participating in a focus group, please contact Jeff White at [email protected] or at 307-777-5739. Please select the "NEXT" button below to submit your responses.
End of Block: Default Question Block

DVR 2018 CSNA 189
Appendix E – Business Survey
Wyoming 2018 CSNA Business Survey
Start of Block: Default Question Block
Q1 Wyoming Division of Vocational Rehabilitation Business Survey
The Wyoming Division of Vocational Rehabilitation (DVR) is a State agency that helps Wyoming residents with disabilities to prepare for, obtain and retain employment. DVR is conducting an assessment to learn more about the needs of businesses and employers with respect to partnering with the DVR and employing and accommodating workers with disabilities. The information that you provide will help DVR to more effectively respond to the needs of businesses and will influence the planning and delivery of vocational services to persons with disabilities. For the purposes of our survey, an individual with a disability is a person who has an impairment that substantially limits one or more major life activities, or has a record of such an impairment, or is regarded as having such an impairment. This survey will take approximately five minutes to complete. Your responses will be kept confidential and you will not be asked for your name or the name of your organization anywhere in the survey. If you have any questions regarding this survey or if you would prefer to complete this survey in an alternate format, please contact Dr. Chaz Compton at San Diego State University at the following e-mail address or phone number: [email protected] (619) 594-7935 Thank you very much for your time and input!

DVR 2018 CSNA 190
Q2 Which of the following best describes your type of business? (select one response)
o Service (1)
o Retail (2)
o Manufacturing (3)
o Agriculture/Forestry/Fishing (4)
o Construction (5)
o Government (6)
o Education (7)
o Health care (8)
o Banking/Finance (9)
o Gambling/Casino (11)
o Other (please describe) (10) ________________________________________________
Q3 How many people are employed at your business? (select one response)
o 1 - 15 (1)
o 16 - 50 (2)
o 51 - 250 (3)
o 251 - 999 (4)
o 1,000 or more (5)

DVR 2018 CSNA 191
Q4 Disability in the Workplace: Does your business need help... (select one response for each)
Yes (1) No (2)
Understanding disability-related legislation such as the
Americans with Disabilities Act as amended, the Workforce
Innovation and Opportunity Act and the Rehabilitation Act as
amended? (1)
o o
Identifying job accommodations for workers with disabilities? (2) o o
Recruiting job applicants who are people with disabilities? (9) o o Helping workers with disabilities
to retain employment? (3) o o Obtaining training on the
different types of disabilities? (4) o o
Obtaining training on sensitivity to workers with disabilities? (5) o o
Obtaining incentives for employing workers with
disabilities? (6) o o Obtaining information on
training programs available for workers with disabilities? (8) o o
Q5 If you would like to comment further on any of your answers above, or if you have additional comments or needs regarding disability in the workplace, please describe them in the space

DVR 2018 CSNA 192
below.
________________________________________________________________
________________________________________________________________
________________________________________________________________
________________________________________________________________
________________________________________________________________
Q6 Applicants with disabilities: With respect to applicants with disabilities, does your business need help... (select one response for each)
Yes (1) No (2)
Recruiting applicants who meet the job qualifications? (1) o o
Recruiting applicants with good work habits? (2) o o
Recruiting applicants with good social/interpersonal skills? (3) o o Assessing applicants' skills? (4) o o
Discussing reasonable job accommodations with
applicants? (5) o o Identifying reasonable job
accommodations for applicants? (6) o o

DVR 2018 CSNA 193
Q7 If you would like to comment further on any of your answers above, or if you have additional comments or needs regarding applicants with disabilities, please describe them in the space below.
________________________________________________________________
________________________________________________________________
________________________________________________________________
________________________________________________________________
________________________________________________________________

DVR 2018 CSNA 194
Q8 Employees with disabilities: With respect to employees with disabilities you have now or have had in the past, what are the challenges you have experienced with them regarding job retention?
▢ Poor attendance (1)
▢ Difficulty learning job skills (2)
▢ Slow work speed (3)
▢ Poor work stamina (7)
▢ Poor social skills (8)
▢ Physical health problems (9)
▢ Mental health concerns (10)
▢ Language barriers (11)
▢ Identifying effective accommodations (12)
▢ Lack of transportation (14)
▢ Other (please describe) (13) ________________________________________________
▢ I have no knowledge of any challenges we have had retaining employees with disabilities (16)
Q9 If you would like to comment further on any of your answers above, or if you have additional comments or needs regarding employees with disabilities, please describe them in the space below.
________________________________________________________________
________________________________________________________________

DVR 2018 CSNA 195
________________________________________________________________
________________________________________________________________
________________________________________________________________
Q10 How would you rate your knowledge of DVR and the services they can provide to businesses?
o Very knowledgeable (1)
o Somewhat knowledgeable (2)
o Little or no knowledge (3)
Q11 Has your business utilized any of the services that DVR provides?
o Yes (1)
o No (2)
o I don't know (3) Skip To: Q2 If Has your business utilized any of the services that DVR provides? = No

DVR 2018 CSNA 196
Q12 Which of the following services did DVR provide to your business (please select all that apply)?
▢ Training in understanding disability-related legislation such as the Americans with Disabilities Act as amended, the Workforce Innovation and Opportunity Act and the Rehabilitation Act as amended? (1)
▢ Assistance identifying job accommodations for workers with disabilities? (2)
▢ Recruiting job applicants who are people with disabilities? (6)
▢ Helping workers with disabilities to retain employment? (4)
▢ Obtaining training on the different types of disabilities? (5)
▢ Obtaining training on sensitivity to workers with disabilities? (7)
▢ Obtaining incentives for employing workers with disabilities? (8)
▢ Obtaining information on training programs available for workers with disabilities? (9)
▢ Recruiting applicants who meet the job qualifications? (10)
▢ Recruiting applicants with good work habits? (11)
▢ Recruiting applicants with good social/interpersonal skills? (12)
▢ Assessing applicants' skills? (13)
▢ Discussing reasonable job accommodations with applicants? (14)
▢ Identifying reasonable job accommodations for applicants? (15)
▢ Other (please describe) (3) ________________________________________________

DVR 2018 CSNA 197
Q13 How satisfied were you with the services you received from DVR?
o Very satisfied (1)
o Satisfied (2)
o Neither satisfied nor dissatisfied (3)
o Dissatisfied (4)
o Very dissatisfied (5)
Q14 If your business has any needs related to applicants or workers with disabilities that are not currently being met please describe them here:
________________________________________________________________
________________________________________________________________
________________________________________________________________
________________________________________________________________
________________________________________________________________
Q15 Your feedback is valuable to us, and we would like to thank you for taking the time to complete the survey! DVR is also conducting individual and focus group interviews as part of this assessment. If you are interested in participating in an interview or a focus group, please contact Jeff White at [email protected] or at 307-777-5739. Please select the "NEXT" button below to submit your responses.
End of Block: Default Question Block