state of the u.s. office market -...
TRANSCRIPT

page 1
State of the U.S. Office Market 2016 Q4 Review and Forecast

page 2
• Overview
• Economy
• Fundamentals
• Capital Markets
• Danger Zone
• Most And Least
Agenda
page 3
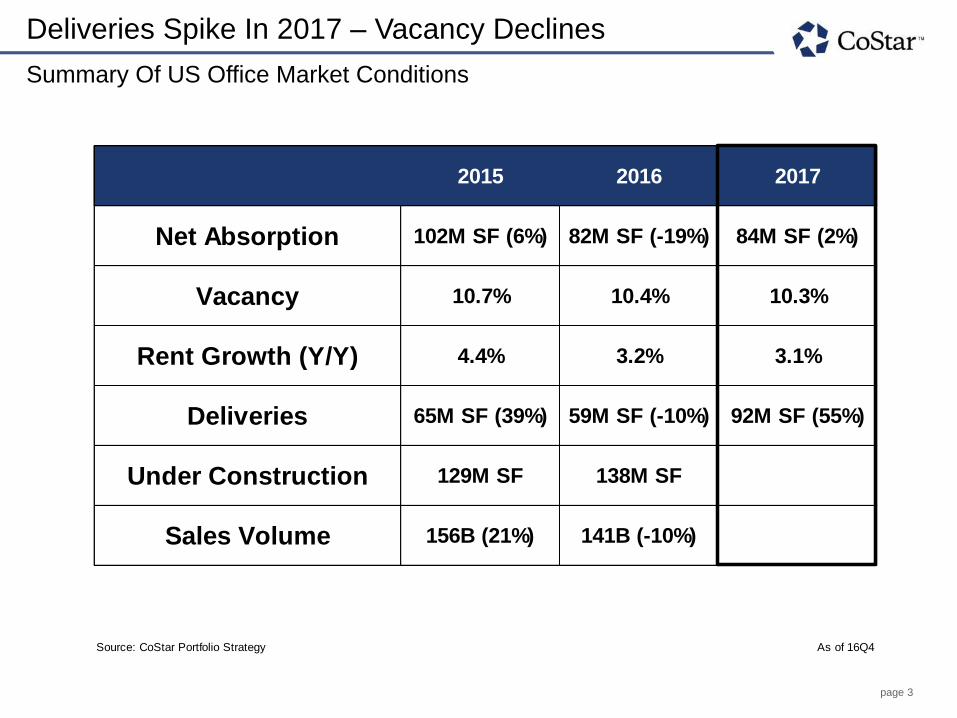
Deliveries Spike In 2017 – Vacancy Declines
Summary Of US Office Market Conditions
Source: CoStar Portfolio Strategy As of 16Q4
Sales Volume 156B (21%) 141B (-10%)
Deliveries 65M SF (39%) 59M SF (-10%) 92M SF (55%)
Under Construction 129M SF 138M SF
Vacancy 10.7% 10.4% 10.3%
Rent Growth (Y/Y) 4.4% 3.2% 3.1%
2015 2016 2017
Net Absorption 102M SF (6%) 82M SF (-19%) 84M SF (2%)

page 4
Economy

page 5
Demographic Headwinds Will Limit Trump-Era Growth
GDP Growth By Presidency
Sources: BEA; Moody's Analytics; CoStar Portfolio Strategy As of 16Q4
2.8%
5.3%5.1%
2.7%
2.9%
3.2%
3.6%
2.2%
3.8%
1.8%1.8%
2.2%
0%
1%
2%
3%
4%
5%
6%
52 56 60 64 68 72 76 80 84 88 92 96 00 04 08 12 16 20 24
Avg. GDP Growth
EisenhowerTrump
Ford
Carter
Reagan
Bush
Clinton Obama
BushNixon
Johnson
Kennedy
Republican
Democrat

page 6
Demographic Headwinds Will Limit Trump-Era Growth
GDP Growth By Presidency & Working-Age Population Growth*
Sources: BEA; Moody's Analytics; CoStar Portfolio Strategy As of 16Q4
*Ages 20-64
2.8%
5.3%5.1%
2.7%
2.9%
3.2%
3.6%
2.2%
3.8%
1.8%1.8%
2.2%
-0.5%
0.0%
0.5%
1.0%
1.5%
2.0%
2.5%
0%
1%
2%
3%
4%
5%
6%
52 56 60 64 68 72 76 80 84 88 92 96 00 04 08 12 16 20 24
Avg. GDP Growth
EisenhowerTrump
Ford
Carter
Reagan
Bush
Clinton Obama
BushNixon
Johnson
Kennedy
Republican
Democrat
Y/Y Change Working Age Population
Y/Y Change Working Age Population
Avg. Ann. GDP Growth Of President's Tenure

page 7
GDP Trending Up
Contributions To GDP Growth
Updated Date:Frequency:
Sources: Moody's Analytics; BEA; CoStar Portfolio Strategy As of 16Q3
(10%)
(8%)
(6%)
(4%)
(2%)
0%
2%
4%
6%
8%
07 08 09 10 11 12 13 14 15 16
Goods (Manufacturing) Services Structures (Construction) GDP
Contribution to GDP Growth

page 8
Sales & Profits Still Positive
Corporate Profit, Sales, Employment Trends
Sources: Moody's Analytics; BEA; Barron's; CoStar Portfolio Strategy As of 16Q4
Q4 S&P 500 Profit Growth Estimate, 4.4%
4%
5%
6%
7%
8%
9%
10%
11%
12%
13%
14%
(40%)
(30%)
(20%)
(10%)
0%
10%
20%
30%
40%
50%
60%
02 03 04 05 06 07 08 09 10 11 12 13 14 15 16
Financial Profit Non Financial Profit Foreign Profit Profit Margin as % of GDP
Corporate Profit Growth (Y/Y) Profits As % Of GDP

page 9
Office-Using Employment Remains Strong
Total And Office-Using Employment Growth (Y/Y)
Sources: Moody's Analytics; BLS; CoStar Portfolio Strategy As of 16Q4
(8%)
(6%)
(4%)
(2%)
0%
2%
4%
01 02 03 04 05 06 07 08 09 10 11 12 13 14 15 16 17 18
Total Employment Office-Using Employment Net Office Absorption
Employment Growth (Y/Y)
Y/Y 15Q4 16Q4 17Q4Total Jobs 2.0% 1.6% 1.4%Office Jobs 2.7% 2.4% 1.9%Net Absorption 1.4% 1.1% 1.1%

page 10
Job Growth Slowed In 2016 In Most Markets
Employment Growth By Metro
123456789
101112131415161718192021
Source: Moody's Analytics; CoStar Group As of 16Q4
0%
1%
2%
3%
4%
5%
6%S
ea
ttle
De
nver
San
Jose
Da
llas-
FW
Las V
egas
East
Bay
San
Fra
ncis
co
Na
shvill
e
Austin
Port
land O
R
Ora
ng
e C
ounty
Atlan
ta
Washin
gto
n…
San
Die
go
Bosto
n
Phila
delp
hia
Los A
ngele
s
Ne
w Y
ork
Ch
icago
Pitts
burg
h
Ho
usto
n
Avg Annual Employment Growth
East Midwest South West 2015
(2.1%)(2.5%)

page 11
Generally The Job Picture Is Moderating
Office-Using Employment Y/Y Change By Metro
As of 16Q4 Source: CoStar Portfolio Strategy

page 12
Rig Count Bottomed--Houston Economy May Turn In 2017
Global Oil Production And Rig Count
U.S.
Rest of World
Rig Count
Sources: IEA, EIA, Baker Hughes, CoStar Portfolio Strategy As of 16Q4
0
500
1000
1500
2000
2500
3000
3500
4000
0
20
40
60
80
100
120
94 95 96 97 98 99 00 01 02 03 04 05 06 07 08 09 10 11 12 13 14 15 16
U.S. Rest of World Rig Count
Oil Production(Million Barrels Per Day)
International Oil Rig Counts
62% Decline in Active Rigs
14% Increase

page 13
Fundamentals
page 14
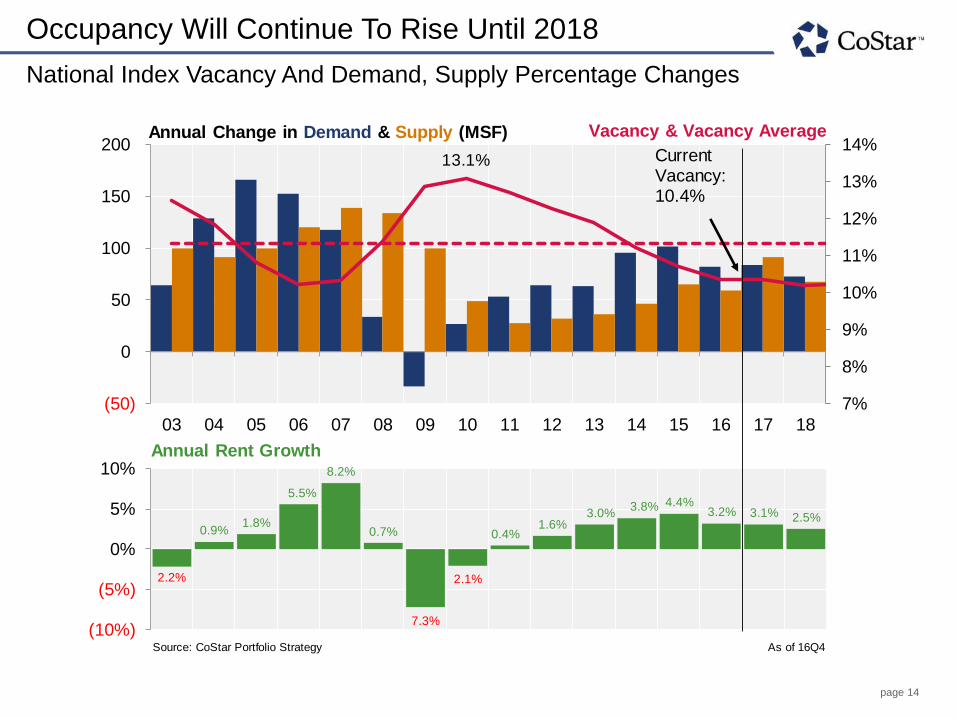
Occupancy Will Continue To Rise Until 2018
National Index Vacancy And Demand, Supply Percentage Changes
Current Vacancy:End of ForecastForecast MinHistorical Avg.Recession Max
Source: CoStar Portfolio Strategy As of 16Q4
7%
8%
9%
10%
11%
12%
13%
14%
(50)
0
50
100
150
200
03 04 05 06 07 08 09 10 11 12 13 14 15 16 17 18
Current Vacancy: 10.4%
2.2%
0.9%1.8%
5.5%
8.2%
0.7%
7.3%
2.1%
0.4%1.6%
3.0%3.8% 4.4%
3.2% 3.1% 2.5%
(10%)
(5%)
0%
5%
10%
Annual Change in Demand & Supply (MSF) Vacancy & Vacancy Average
Annual Rent Growth
13.1%

page 15
Top Quality Assets Capturing Most Demand
Net Office Absorption By Building Star
12/31/19993/31/20006/30/20009/30/2000
12/31/20003/31/20016/30/20019/30/2001
12/31/20013/31/20026/30/20029/30/2002
12/31/20023/31/20036/30/20039/30/2003
12/31/20033/31/20046/30/20049/30/2004
12/31/20043/31/20056/30/20059/30/2005
12/31/20053/31/20066/30/20069/30/2006
12/31/20063/31/20076/30/2007
Source: CoStar Portfolio Strategy As of 16Q4
1.8%
0.8%
1.0%
(2.0%)
(1.0%)
0.0%
1.0%
2.0%
3.0%
4.0%
02 03 04 05 06 07 08 09 10 11 12 13 14 15 16
4 & 5 Star 3 Star 1 & 2 Star
Annualized Demand Growth (Two-Quarter Moving Average)
Huge Decline In Demand For Lower Quality Assets

page 16
Huge Drop-Off For New York, Houston, And Chicago
2016 Net Absorption & Y/Y Change
Source: CoStar Portfolio Strategy As of 16Q4
Cumulative Net Absorption (Millions SF)
-5
-4
-3
-2
-1
0
1
2
3
4
5
Washin
gto
n, D
.C.
Los A
ngele
s
San
Die
go
Pho
enix
Mia
mi
San
Fra
ncis
co
Sea
ttle
Bosto
n
De
nver
Ne
w Y
ork
Da
llas -
FW
Ho
usto
n
Austin
Atlan
ta
Ch
icago
San
Jose
Y/Y Change In Net Absorption 2016 Net Absorption
Tech Markets Energy Markets Housing Bust Markets Other

page 17
Suburban Office Market Demand Shows Strength
Year Over Year Net Absorption
3
CBD
19
18
17
14
13
11
10
9
7
6
5
3
2
1
Source: CoStar Portfolio Strategy As of 16Q4
CBDs include metros with greater than 100,000 SF or less than 100,000 SF of net absorption
Suburban include metros with greater than 400,000 SF
-0.8 MSF
-0.3 MSF
-0.2 MSF
0.6 MSF
0.4 MSF
0.6 MSF
1 MSF
1.3 MSF
0.2 MSF
0.1 MSF
0.3 MSF
0.3 MSF
2.4 MSF
1 MSF
(3%) (1%) 2% 5% 7% 10%
Dallas - FW
Denver
Houston
Washington, D.C.
Philadelphia
Atlanta
Boston
San Francisco
Ft. Lauderdale
Las Vegas
San Jose
San Diego
Seattle
Nashville
-1.2 MSF
0.4 MSF
1 MSF
1.4 MSF
1 MSF
1.3 MSF
4.9 MSF
1.3 MSF
1.2 MSF
2 MSF
1.4 MSF
1 MSF
1.8 MSF
3.8 MSF
(3%) (1%) 2% 5% 7% 10%
Chicago
New York
East Bay
Denver
Austin
San Diego
Dallas - FW
Portland
San Francisco
San Jose
Nashville
Orange County
Charlotte
Phoenix
CBD Suburban
West South East Midwest

page 18
Construction Trending Up, Except in Texas
Under Construction RBA By Region
3/31/20076/30/20079/30/2007
12/31/20073/31/20086/30/20089/30/2008
12/31/20083/31/20096/30/20099/30/2009
12/31/20093/31/20106/30/20109/30/2010
12/31/20103/31/20116/30/20119/30/2011
12/31/20113/31/20126/30/20129/30/2012
12/31/20123/31/20136/30/2013
Source: CoStar Portfolio Strategy As of 16Q4
Texas Includes Austin, Dallas, Houston, and San Antonio; Southern California Includes Los Angeles, Orange
County, and San Diego; California Bay Area Includes East Bay, San Francisco, and San Jose
0
20
40
60
80
100
120
140
160
180
20007Q
307Q
408Q
108Q
208Q
308Q
409Q
109Q
209Q
309Q
410Q
110Q
210Q
310Q
411Q
111Q
211Q
311Q
412Q
112Q
212Q
312Q
413Q
113Q
213Q
313Q
414Q
114Q
214Q
314Q
415Q
115Q
215Q
315Q
416Q
116Q
216Q
316Q
4
Texas California Bay Area All Other Markets Southern California New York
RBA Under Construction (Millions SF)

page 19
New Construction Activity
Select Office Starts - 16Q4
2050 M St NW CBD
Metro: Washington, D.C.
SF: 364,000
Submarket Vacancy: 8.2%
Leased: 40%
Owner: Tishman Speyer
Delivery Date: December 2019
Source: CoStar Portfolio Strategy As of 16Q4
771 Spring St Midtown/Pershing Point
Metro: Atlanta
SF: 760,000
Submarket Vacancy: 10.4%
Leased: 60%
Owner: Portman Holdings, LLC
Delivery Date: January 2019
5050 S Syracuse St Denver Tech Center
Metro: Denver
SF: 185,000
Submarket Vacancy: 16.8%
Leased: 0%
Owner: Corum Real Estate
Group Inc.
Delivery Date: June 2018
6002 Stoneridge Mall Rd Pleasanton-North
Metro: East Bay
SF: 409,998
Submarket Vacancy:
4.8%
Leased: 100%
Owner: BRIDGE Housing
Corporation
Delivery Date: June 2018

page 20
Most Metros Have Above Average Construction
Office Construction Vs. Historical Norms
3
Rank123456789
10111213141516171819202122
Source: CoStar Portfolio Strategy As of 16Q4
0%
1%
2%
3%
4%
5%
6%
7%
8%
9%
10%T
am
pa
Min
ne
ap
olis
Orla
nd
o
Ea
st
Ba
y
Ph
oe
nix
Ho
usto
n
Ch
arl
ott
e
Lo
s A
ng
ele
s
Ch
ica
go
Bo
sto
n
Atla
nta
Mia
mi
Wa
sh
ing
ton
D.C
.
Ne
w Y
ork
Na
sh
ville
Ra
leig
h
Au
stin
Da
lla
s F
W
De
nve
r
Sa
n F
ran
cis
co
Se
att
le
Sa
n J
ose
Current Construction Average Annual Office Supply Growth
SF As % Of Market RBA
Limited Development/ Supply Cooling Down
Supply Ramping Up
19
10
9
11 5
10
6

page 21
Newest Generation Tight In San Francisco, Not So In DC
Vacancy Rates For Buildings 0-10 Years Old
1
2
3
4
5
6
7
8
9
10
11
12
13
14
15
16
17
18
19
20
21
22
23
24
25
26
Source: CoStar Portfolio Strategy As of 16Q4
0%
5%
10%
15%
20%
25%S
an
Fra
ncis
co
Bosto
n
Min
nea
polis
Na
shvill
e
East
Bay
Tam
pa
Orlando
Fort
Laud
erd
ale
Port
land,
OR
Ch
arlotte
Sea
ttle
Ora
ng
e C
ounty
San
Die
go
Palm
Be
ach C
ounty
De
nver
Phila
delp
hia
Da
llas -
Fort
Wort
h
Austin
Mia
mi
Ne
w Y
ork
Los A
ngele
s
Ch
icago
Atlan
ta
San
Jose
Pho
enix
Washin
gto
n, D
.C.
2006 Or Newer Vacancy
2006-Newer Vacancy

page 22
Newest Generation Tight In San Francisco, Not So In DC
Vacancy Rates For Buildings 0-10 Years Old
1
2
3
4
5
6
7
8
9
10
11
12
13
14
15
16
17
18
19
20
21
22
23
24
25
26
Source: CoStar Portfolio Strategy As of 16Q4
0%
5%
10%
15%
20%
25%S
an
Fra
ncis
co
Bosto
n
Min
nea
polis
Na
shvill
e
East
Bay
Tam
pa
Orlando
Fort
Laud
erd
ale
Port
land,
OR
Ch
arlotte
Sea
ttle
Ora
ng
e C
ounty
San
Die
go
Palm
Be
ach C
ounty
De
nver
Phila
delp
hia
Da
llas -
Fort
Wort
h
Austin
Mia
mi
Ne
w Y
ork
Los A
ngele
s
Ch
icago
Atlan
ta
San
Jose
Pho
enix
Washin
gto
n, D
.C.
2006 Or Newer Vacancy Including Available Under Construction
2006-Newer Vacancy

page 23
Occupancy Gains Are Broadly Based
Market And Submarket Relative Vacancies
60%
65%
12/31/2003
3/31/2004
6/30/2004
9/30/2004
12/31/2004
3/31/2005
6/30/2005
9/30/2005
12/31/2005
3/31/2006
6/30/2006
9/30/2006
12/31/2006
3/31/2007
6/30/2007
9/30/2007
Source: CoStar Portfolio Strategy As of 16Q4
0%
10%
20%
30%
40%
50%
60%
70%
80%
08 09 10 11 12 13 14 15 16
Submarkets With Declining Vacancies
Markets With Vacancies Lower Than 2006-07 Peak
Percentage of Markets/Submarkets
60%
65%

page 24
Markets Like New Buildings
Vacancy By Building Age
Current Quarter
12/31/2016
0-5
6-10
11-20
20+
12/31/2009
3/31/2010
6/30/2010
9/30/2010
12/31/2010
3/31/2011
6/30/2011
9/30/2011
12/31/2011
3/31/2012
6/30/2012
9/30/2012
12/31/2012
3/31/2013
6/30/2013
9/30/2013
Source: CoStar Portfolio Strategy As of 16Q4
5%
10%
15%
20%
25%
08 09 10 11 12 13 14 15 16
0-5 Years 6-10 Years 11-20 Years 20+
Vacancy
14.8%
11.1%
7.4%
8.6%
New Supply Matching
New Demand Since 2013
Stabilized New Buildings Doing Well

page 25
Sublease Availability May Have Peaked In Houston
Sublet Available SF As A Percent Of Inventory
3/31/20046/30/20049/30/2004
12/31/20043/31/20056/30/20059/30/2005
12/31/20053/31/20066/30/20069/30/2006
12/31/20063/31/20076/30/20079/30/2007
12/31/20073/31/20086/30/20089/30/2008
12/31/20083/31/20096/30/20099/30/2009
12/31/20093/31/20106/30/20109/30/2010
Source: CoStar Portfolio Strategy As of 16Q4
0.5%
1.0%
1.5%
2.0%
2.5%
3.0%
3.5%
4.0%
4.5%
05 06 07 08 09 10 11 12 13 14 15 16
Seattle Houston San Francisco New York National San Jose
Sublet Available As A % Of Inventory
Houston
San Francisco
Seattle
New York
National
San Jose

page 26
Vacancies Continue To Increase In Houston
Vacancy Rates For Metros, Current Vs. Last Year
Rank
1
2
3
4
5
6
7
8
9
10
11
12
13
14
15
16
17
18
19
Source: CoStar Portfolio Strategy As of 16Q4
4%
6%
8%
10%
12%
14%
16%
18%
Ho
usto
n
Da
llas-
FW
Ch
icago
De
troit
Atlan
ta
De
nver
Los A
ngele
s
San
Die
go
Phila
delp
hia
Mia
mi
Ne
w Y
ork
Ora
ng
e C
ounty
Washin
gto
n D
.C.
Bosto
n
Min
nea
polis
San
Jose
Port
land O
R
Sea
ttle
San
Fra
ncis
co
West South East Midwest 15Q4 Vacancy
16Q4 Vacancy Rate

page 27
Many Office Markets Have Sub 9% Vacancy!
Office Vacancy Rates By Metro
As of 16Q4 Source: CoStar Portfolio Strategy

page 28
Rent Growth In Most Suburbs Has Picked Up
Rent Growth For 2016
3
SCROLL RIGHT FOR UPDATE INSTRUCTIONS
CBD
11
10
9
8
7
6
5
4
3
2
1
Source: CoStar Portfolio Strategy As of 16Q4
1.1%
1.3%
1.9%
3.4%
3.7%
5.8%
6.6%
6.6%
6.8%
8.2%
21.8%
0% 5% 10% 15% 20%
Denver
Dallas - FW
New York
San Francisco
Wash D.C.
Seattle
Boston
Los Angeles
Miami
Atlanta
East Bay
0.2%
1.3%
1.9%
2.4%
3.3%
3.6%
3.8%
3.8%
4.2%
6.3%
11.8%
0% 5% 10% 15% 20%
New York
Wash D.C.
Seattle
Los Angeles
Miami
Denver
Dallas - FW
Boston
Atlanta
East Bay
San Francisco
CBD Prime Suburban
West South East Midwest

page 29
Rent Growth In Most Suburbs Has Picked Up
Rent Growth For 2016 & 2015
3
SCROLL RIGHT FOR UPDATE INSTRUCTIONS
CBD
11
10
9
8
7
6
5
4
3
2
1
Source: CoStar Portfolio Strategy As of 16Q4
1.1%
1.3%
1.9%
3.4%
3.7%
5.8%
6.6%
6.6%
6.8%
8.2%
21.8%
0% 5% 10% 15% 20%
Denver
Dallas - FW
New York
San Francisco
Wash D.C.
Seattle
Boston
Los Angeles
Miami
Atlanta
East Bay
0.2%
1.3%
1.9%
2.4%
3.3%
3.6%
3.8%
3.8%
4.2%
6.3%
11.8%
0% 5% 10% 15% 20%
New York
Wash D.C.
Seattle
Los Angeles
Miami
Denver
Dallas - FW
Boston
Atlanta
East Bay
San Francisco
2015 Rent Growth
CBD Prime Suburban
West South East Midwest
-1.1%

page 30
CBD/Suburban Rent Growth Gap Closing
National Index District Rent Growth Y/Y
Select Market:
ZPPR54
National Index District Rent Growth Y/Y
Select Variable:
Rent
Spread
4%
3%
1%
-1%
-3%
-5%
-5%
-5%
-3%
-2%
-1%
0%
1%
2%
2%
3%
3%
3%
3%
Sources: CoStar Portfolio Strategy As of 16Q4
(3%)
(2%)
(1%)
0%
1%
2%
3%
4%
5%
6%
7%
11 12 13 14 15 16
Spread CBD/Secondary Business District/Urban Prime Suburban/Suburban
Rent Growth Y/Y

page 31
Construction Concentrated In CBDs
CBD Construction As A Percentage Of Total Metro Construction
123456789
10111213
Source: CoStar Portfolio Strategy As of 16Q4
37% 14%
27%(3%)
27% 25%
23% 18%
10% 6% (7%)
(3%)
(7%)
0%
10%
20%
30%
40%
50%
60%
70%
80%
Ch
icago
Ne
w Y
ork
Sea
ttle
San
Fra
ncis
co
De
nver
Washin
gto
n D
.C.
Los A
ngele
s
Phila
delp
hia
Ho
usto
n
Mia
mi
Bosto
n
Atlan
ta
Da
llas F
W
CBD Share of Metro Construction CBD Share Of Metro Office Stock
Percent of Metro Total Construction and Stock
Difference Between Stock& Construction Share

page 32
Rent Growth Trends By Metro
CBD Rent Growth Minus Suburban Rent Growth
Sources: CoStar Portfolio Strategy As of 16Q4
(6%)
(4%)
(2%)
0%
2%
4%
6%
8%
11 12 13 14 15 16
National Index Washington, DC
Rent Growth Spread (4Q-Avg)
National
Washington, DC

page 33
Rent Growth Trends By Metro
CBD Rent Growth Minus Suburban Rent Growth
Sources: CoStar Portfolio Strategy As of 16Q4
(6%)
(4%)
(2%)
0%
2%
4%
6%
8%
11 12 13 14 15 16
National Index New York San Francisco
Rent Growth Spread (4Q-Avg)
New York
National
San Francisco

page 34
Rent Growth Trends By Metro
CBD Rent Growth Minus Suburban Rent Growth
Sources: CoStar Portfolio Strategy As of 16Q4
(6%)
(4%)
(2%)
0%
2%
4%
6%
8%
11 12 13 14 15 16
National Index Boston Los Angeles
Rent Growth Spread (4Q-Avg)
Boston
Los Angeles
National

page 35
Capital Markets
page 36
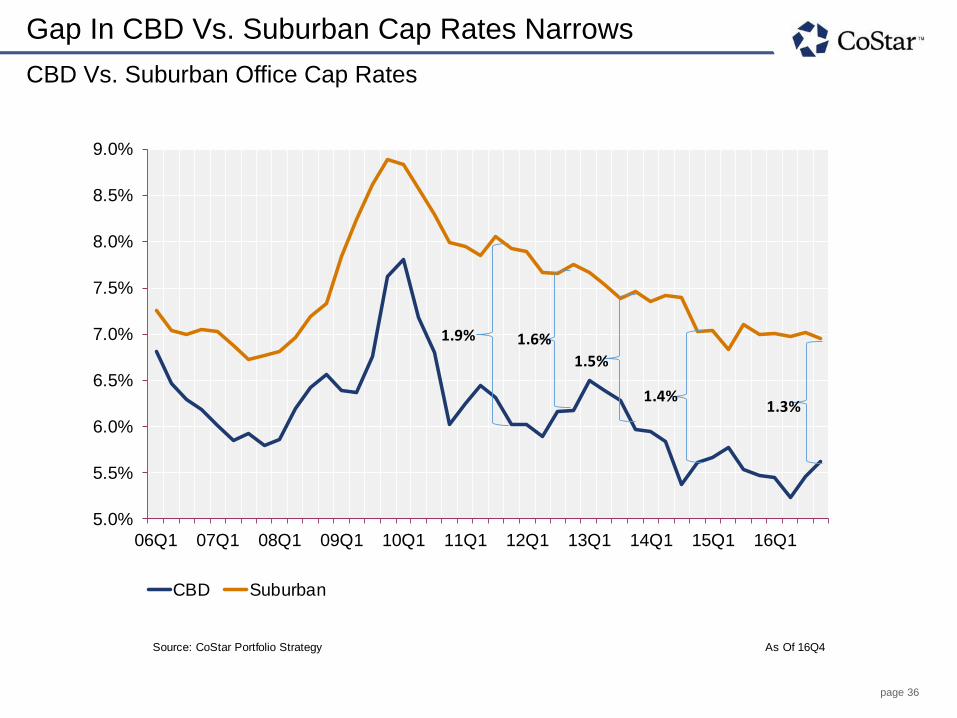
Gap In CBD Vs. Suburban Cap Rates Narrows
CBD Vs. Suburban Office Cap Rates
Cap Rate
06Q12006 2q06Q32006 4q07Q107Q22007 3q07Q408Q108Q22008 3q08Q409Q109Q22009 3q09Q410Q110Q210Q310Q411Q111Q211Q311Q412Q112Q212Q312Q413Q1
Source: CoStar Portfolio Strategy As Of 16Q4
5.0%
5.5%
6.0%
6.5%
7.0%
7.5%
8.0%
8.5%
9.0%
06Q1 07Q1 08Q1 09Q1 10Q1 11Q1 12Q1 13Q1 14Q1 15Q1 16Q1
CBD Suburban
1.3%1.4%
1.5%
1.6%1.9%

page 37
Suburbs See More Value Growth Than CBDs
Price Per Square Foot Index
3/31/20066/30/20069/30/2006
12/31/20063/31/20076/30/20079/30/2007
12/31/20073/31/20086/30/20089/30/2008
12/31/20083/31/20096/30/2009
09Q410Q110Q210Q310Q411Q111Q211Q311Q412Q112Q212Q312Q413Q113Q2
Source: CoStar Portfolio Strategy As of 16Q4
118
124
100
105
110
115
120
125
13Q4 14Q2 14Q4 15Q2 15Q4 16Q2 16Q4
CBD Suburban
Price/SF, Rolling 4-Quarter Average, 2013Q4=100
5% More Value Growth In Subrubs Than CBD
Since 13Q4

page 38
Sales Volume Slowing & Likely Slow More In 2017
Annual Sales Volume By Property Type
Date200520062007200820092010201120122013201420152016
Source: CoStar Portfolio Strategy As of 16Q4
0
50
100
150
200
2005 2006 2007 2008 2009 2010 2011 2012 2013 2014 2015 2016
Office Industrial Multi-Family Retail
Annual Sales Volume $B
YoY Change:
Multi-Family: -5%
Office: -10%
Retail: -14%
Industrial: -23%

page 39
Share Of Foreign Investment In Office Steadily Increasing
% Of Foreign Investment In Office Over Time
04
05
06
07
08
09
10
11
12
13
14
15
16
Source: CoStar Portfolio Strategy As of 16Q4
$0
$5
$10
$15
$20
$25
4%
6%
8%
10%
12%
14%
16%
05 06 07 08 09 10 11 12 13 14 15 16
Foreign % Of Total Volume (2-Year Avg.) Foreign Investment ($B)

page 40
Sales Volume Declining In A Majority Of Markets
Annual Change In Office Sales Volume For Major Metros
Los AngelesMiamiPhiladelphiaDallas - FWSan FranciscoNew YorkSeattleAtlantaBostonWashington D.C.Orange CountySan DiegoMinneapolis
Source: CoStar Portfolio Strategy As of 16Q4
(60%)
(40%)
(20%)
0%
20%
40%
60%
$0
$5
$10
$15
$20
$25
$30
$35
Los A
ngele
s
Mia
mi
Phila
delp
hia
Da
llas -
FW
San
Fra
ncis
co
Ne
w Y
ork
Sea
ttle
Atlan
ta
Bosto
n
Washin
gto
n D
.C.
Ora
ng
e C
ounty
San
Die
go
Min
nea
polis
Pho
enix
De
nver
Austin
Ch
icago
Ho
usto
n
San
Jose
2015 2016 Percent Change Y/Y
Sales Volume ($ Billions) Percent Change Y/Y

page 41
Private Equity Investors Most Active Recently
U.S. Net Office Acquisitions By Investor Type - 16Q4
31425
12345
Source: CoStar Portfolio Strategy As of 16Q4
2.3
0.9 0.7
(0.3)
(1.2)
(1.5)
(1.0)
(0.5)
0.0
0.5
1.0
1.5
2.0
2.5
Private Equity Private Institutional User REIT/Public
Net Acquisitions ($ Billions)

page 42
Big Apple Home To The Big Trades
Top Office Deals of 2016
Property Name Market Bldg SF Sale Price (M) Price Per SF Cap Rate Buyer Company
Equitable Building New York City 1,706,007 1,950$ 1,143$ 4.1% CalPERS
UBS New York City 1,800,000 1,650$ 917$ 4.7% RXR Realty
Sony Building New York City 852,830 1,400$ 1,642$ Olayan America
Shearson Lehman Plaza New York City 1,869,756 1,255$ 671$ Citigroup Inc.
Salesforce Tower New York City 1,484,325 1,153$ 1,995$ 4.1% Hong Kong Monetary Authority
Metropolitan Life Insurance Plaza New York City 2,285,043 1,040$ 1,138$ 4.0% PGIM Real Estate
Rockefeller Center New York City 2,652,712 1,030$ 863$ Invesco Ltd.
10 Hudson Yards New York City 1,800,000 946$ 1,194$ 3.7% Allianz Real Estate America
Rockefeller Center New York City 2,014,062 858$ 869$ Invesco Ltd.
One New York Plaza New York City 2,545,000 678$ 543$ 4.3% China Investment Corporation (CIC)
1250 Broadway New York City 770,000 565$ 734$ 2.9% 1250 Broadway Associates LLC
Southeast Financial Center South Florida 1,194,832 517$ 432$ 5.7% Ponte Gadea USA, Inc.
390 Greenwich St New York City 764,918 513$ 671$ Citigroup Inc.
One Front St (Multi-Property Sale) San Francisco 651,000 490$ 753$ One Front Street EAT, LLC
Source: CoStar Portfolio Strategy As of 16Q4

page 43
Selected Top Office Deals – 2016Q4
CitiGroup Center
Los Angeles, CA
Hines sold the 891,056 SF Office
property to Coretrust Capital
Partners, LLC for $336 Million
($377.08/SF).
4.6% Cap Rate
Southeast Financial Center
Miami, FL
JP Morgan Chase & Co. sold the
1.195 Million SF Office property to
Ponte Gadea USA, Inc. for $516.6
Million ($432.36/SF).
5.7% Cap Rate
Foundry Square III
San Francisco, CA
A JV of Tishman Speyer and JP
Morgan Asset Management sold
the 291,032 SF Office property
to American Realty Advisors for
$332,030,500 ($1140.87/SF).
4.8% Cap Rate
Hines REIT West Coast Portfolio
Hines REIT, Inc. sold the 3.239
Million SF portfolio to The Blackstone
Group, LP for $1.162 Billion
($358.73/SF).
5% Cap Rate

page 44
Danger Zone

page 45
Interest Rates Are Moving Up
Futures Market For The 10 Year Treasury At Different Points
Sources: Bloomberg; CoStar Portfolio Strategy As of 1/19/17
1.5%
2.0%
2.5%
3.0%
3.5%
2016 2017 2018 2020 2026
10 Year Bond Yield
Post-Election Pre- Election Jan-17
+18 BP
+52 BP

page 46
Could Spike In Interest Rates Cause Values To Fall?
Sensitivity Of Office Prices To A Rise In Cap Rates
Q
Q
Q
Q
Q
Q
Q
Q
Q
Q
Q
Q
Q
Q
Q
Q
Q
Q
Q
Q
Q
Q
Q
Q
Q
Q
Q
Q
Q
Q
Q
Sources: Bloomberg; CoStar Portfolio Strategy As Of January 19, 2017
1.4%
1.6%
1.8%
2.0%
2.2%
2.4%
2.6%
5.2%
5.4%
5.6%
5.8%
6.0%
6.2%
6.4%
14Q1 14Q3 15Q1 15Q3 16Q1 16Q3 Jan-17
Office Cap Rate 10 Year Treasury
Office Cap Rate 10 Year Treasury
0%-2%
-3%
-5%
-7%
-8%
-10%
-11%
-12%
-14%
-15%(16%)
(14%)
(12%)
(10%)
(8%)
(6%)
(4%)
(2%)
0%
0 10 20 30 40 50 60 70 80 90 100
% Change In Value
Cap Rate Increase In Basis Points
Likely Cap
Rate Change Recession Fear
Future ?

page 47
Most And Least
page 48
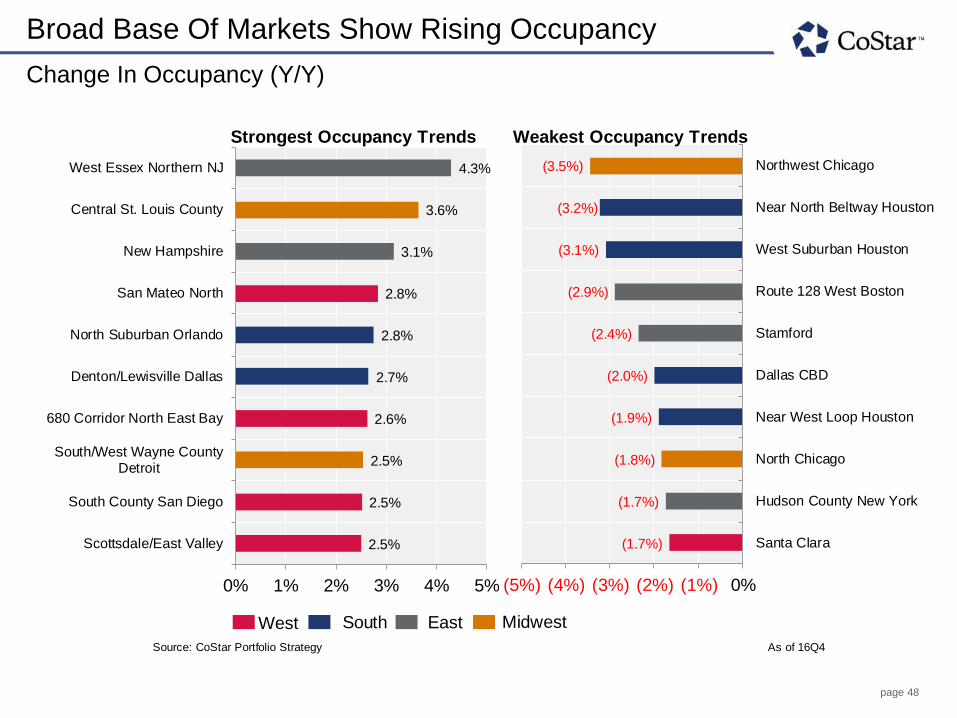
Broad Base Of Markets Show Rising Occupancy
Change In Occupancy (Y/Y)
10987654321
Metro CodeAKROALBAALBUALLEANCHANNAAPPLASHEATLAATLCAUGUAUSTBAKE
Source: CoStar Portfolio Strategy As of 16Q4
2.5%
2.5%
2.5%
2.6%
2.7%
2.8%
2.8%
3.1%
3.6%
4.3%
0% 1% 2% 3% 4% 5%
Scottsdale/East Valley
South County San Diego
South/West Wayne CountyDetroit
680 Corridor North East Bay
Denton/Lewisville Dallas
North Suburban Orlando
San Mateo North
New Hampshire
Central St. Louis County
West Essex Northern NJ
Strongest Occupancy Trends
(1.7%)
(1.7%)
(1.8%)
(1.9%)
(2.0%)
(2.4%)
(2.9%)
(3.1%)
(3.2%)
(3.5%)
(5%) (4%) (3%) (2%) (1%) 0%
Santa Clara
Hudson County New York
North Chicago
Near West Loop Houston
Dallas CBD
Stamford
Route 128 West Boston
West Suburban Houston
Near North Beltway Houston
Northwest Chicago
Weakest Occupancy Trends
West South East Midwest

page 49
Demand Growth Dominates
Net Absorption (Y/Y)
Get Data from Rob
AKROALBAALBUALLEANCHANNAAPPLASHEATLAATLCAUGUAUSTBAKEBALTBATOBATT
Source: CoStar Portfolio Strategy As of 16Q4
0.5 MSF
0.8 MSF
1.2 MSF
1.0 MSF
1.5 MSF
0.9 MSF
0.6 MSF
2.5 MSF
1.3 MSF
1.6 MSF
0% 2% 4% 6% 8%
Denton/Lewisville Dallas
Baltimore City
Nashville CBD
Outlying Charlotte
South/East Suburban KansasCity
West Essex Northern NJ
Bronx
Scottsdale/East Valley
East Valley Salt Lake City
Sunnyvale/Cupertino
Strongest Net Absorption
(0.4) MSF
(0.3) MSF
(0.2) MSF
(0.5) MSF
(0.2) MSF
(0.5) MSF
(0.6) MSF
(0.6) MSF
(1.5) MSF
(0.5) MSF
(4%) (3%) (2%) (1%) 0%
Metro West Boston
South End Seattle
Ft Worth CBD
NoVA Inner Beltway D.C.
North & West Las Vegas
Hudson County
Dallas CBD
Near North Beltway Houston
Northwest Chicago
Stamford
Weakest Net Absorption
West South East Midwest

page 50
Rent Growth - Winners And Losers
Rent Growth (Y/Y)
10987654321
AKROALBAALBUALLEANCHANNAAPPLASHEATLAATLCAUGUAUSTBAKEBALTBATOBATT
Source: CoStar Portfolio Strategy As of 16Q4
7.92%
7.97%
8.03%
9.05%
9.40%
9.59%
10.03%
11.63%
13.43%
23.85%
0% 5% 10% 15% 20% 25%
Santa Clara
San Mateo South
Portland CBD
Miami Downtown
Mid-Wilshire Los Angeles
South/West SuburbanNashville
San Jose CBD
I-80/Hwy 4 Corridors EastBay
Memphis CBD
Oakland
Strongest Rent Trends
(0.9%)
(1.1%)
(1.1%)
(1.2%)
(1.8%)
(1.8%)
(1.9%)
(2.3%)
(3.8%)
(4.8%)
(5%) (4%) (3%) (2%) (1%) 0%
South/West Suburban Cleveland
Richmond CBD
West Suburban Houston
Upper Fairfield County Stamford
Stamford
West Valley Salt Lake City
Milwaukee County
South & East Las Vegas
Ft Worth CBD
North & West Las Vegas
Weakest Rent Trends
West South East Midwest

page 51
© Copyright 2017 CoStar Group, Inc. All Rights Reserved. Although CoStar makes efforts to ensure the accuracy and reliability of the information contained herein, the following information includes projections that are
based on various assumptions by CoStar concerning future events and circumstances, as well as historical and current data maintained in CoStar’s database. Actual results may vary from the projections presented.
The information in this presentation is provided ‘as is’ and CoStar expressly disclaims any guarantees, representations or warranties of any kind, including those of merchantability and fitness for a particular purpose.
Features shown in this presentation may require additional subscriptions.
Thank You!