state of the states and local governments
TRANSCRIPT

State of the StateS and LocaL GovernmentS
the fiscal condition of state governments continues to improve nearly five years after the onset of the financial crisis. While challenges remain in the current environment of slow economic growth, states have taken the necessary actions to balance budgets and to ensure full and timely payment on debt obligations. In fact, the vast majority of states were successful in balancing their fiscal year (fY) 2013 budgets on or ahead of the July 1, 2012, start.
this report reviews the progress states have made in balancing budgets in this post-Great recession environment. Since our last report in november of 2011, states have continued to benefit from modest revenue growth and more manageable (i.e., more easily closed) budget gaps. Public sector job reductions continue, but the rate of cuts has diminished. the onset of federal austerity mentioned in our last report is arguably the biggest threat to state financial health, although, as then, we believe most states will make the necessary fiscal adjustments. While this report focuses primarily on state governments, federal and state policy decisions influence financial outcomes at the local level as well. While federal and state spending cuts often result in similar retrenchment by local governments, legal and regulatory frameworks within states, as well as intergovernmental transfer payments, have rendered municipal bankruptcies and defaults very rare. Indeed, the lack of bankruptcies and debt defaults among local governments more than four years after the greatest economic crisis since the Great depression is reassuring and, in fact, consistent with our expectations. the few financially stressed local governments and US territories are unique situations and do not reflect the relative fiscal strengths of US states. the main points of this report are summarized below.
State fiscal prospects have improved modestly, evidenced in slight revenue growth, spending constraint and reduced budget gaps.
federal fiscal austerity will constrain state governments, but financial flexibility remains.
Local government defaults and bankruptcies have been and should continue to be rare, due in large part to state intervention. rising property taxes spurred by an emerging rebound in housing prices also bodes well for local governments. US territories, which have inherently weaker credit profiles than state governments, remain under stress but will likely continue to pay full and timely general obligation (Go) debt service.
States will continue to balance their budgets by cutting spending and offloading costs to local governments. federal spending cuts, particularly in the defense sector, may have larger negative employment and tax consequences for local governments.
Pension and other Post-employment Benefits (oPeB) liabilities are major concerns for state and local governments given declining asset values and funding pressures. Significant reforms are under way and should eventually reduce liabilities, although new accounting rules will result in lower funded ratios.
Peter J. Hayes managing director and head of the municipal Bonds Group
Joseph R. Pangallozzi managing director and co-head of tax-Backed municipal credit research
Jack Erbeck managing director and co-head of tax-Backed municipal credit research
Municipal Bond Market Report

[ 2 ] s tat E o f t H E s tat E s a n d l o c a l g o v E R n M E n t s
state fiscal Picture Brightens; challenges Remainthe fiscal condition of states continues to improve, bolstered primarily by sustained progress in revenue collections. the rockefeller Institute recently reported that overall state tax receipts increased 2.1% year-over-year in the third quarter of 2012, marking the 11th-consecutive quarter of tax revenue growth and the first time since the onset of the recession that state tax revenue has surpassed fY 2008 levels. however, when adjusting for inflation, revenues remain approximately 5% below pre-recession highs. Performance of specific revenues has been mixed, with personal income taxes, the major state revenue source, rising 4.5% in the third quarter compared with a 0.5% fall in corporate income taxes (see figure 1 below). In contrast, property tax revenues, the primary
figuRE 1. REvEnuEs gEnERally iMPRoving
TAX
RE
CE
IPTS
($ B
ILLI
ON
S)
PITSalesProperty
0
100
200
300
400
500
$600
2012201020082006200420022000
OtherFuel/VLF CIT
Source: US Census.
figuRE 2. cuts MadE aftER BudgEt aPPRoval
0
10
20
30
40
$50
0
10
20
30
40
50
AM
OU
NT
OF
RE
DU
CTI
ON
($ B
ILLI
ON
S)
NU
MB
ER
OF S
TATES
Amount of ReductionNumber of States ■
1990
2012
2002
2004
2006
2008
2010
1992
1994
1996
1998
2000
Source: National Governors Association. Years represented are fiscal years.
figuRE 3. statE BudgEt sHoRtfalls dEclinE
-250
-200
-150
-100
-50
$0
-40
-75 -80
-45
-110
-191
-130
-107
-55*
2002 2003 2004 2005 2009 2010 2011 2012 2013
BU
DG
ET
SH
OR
TFA
LLS
($ B
ILLI
ON
S)
LAST RECESSION
Source: Center on Budget and Policy Priorities. Years represented are fiscal years. * Reported to date.
revenue source for local governments, increased 8.7% year-over-year with $90 billion in collections. Property tax receipts have been aided by a recovering housing market. the case-Shiller national Index for home prices registered a 3.6% increase year-over-year in the third quarter of 2012, marking the second consecutive increase after seven quarters of declines, as limited inventory and low mortgage rates continue to bolster the industry. Local governments should benefit from sustained home price increases that give positive support to assessed valuations and property tax receipts. as the slow recovery continues, budget cycles have been less painful for states and there have been fewer delays in passing budgets. for fY 2013, only two states, massachusetts and South carolina, failed to pass a budget before the start of the fiscal year. In addition, mid-year cuts are less common, as shown in figure 2.
despite the improvement in revenue collections, the pace of growth has decelerated notably since last year, when receipts grew at over 6%, and is below the level of growth that many state and local officials expected. as a result, revenues are not strong enough to meet increased spending demands in many states, forcing a continued focus on maintaining budget balance, primarily through spending cuts or reductions in program growth rates. the center on Budget and Policy Priorities (cBPP) reports that states have been forced to collectively close $593 billion in budget gaps from fY 2009 through fY 2013 (see figure 3).
the largest gap closures were aided by huge tax and fee hikes, enacted primarily by california, connecticut, Illinois and massachusetts and netting $23.9 billion in fY 2010. this was followed by lesser amounts of $6.2 billion in fY 2011 and $6.9 billion in fY 2013. however, austerity has been the most prominent tool throughout most of the recession for enacting balanced budgets in the majority of states. Unprecedented spending declines of 3.8% and 6.3% in fYs 2009 and 2010, respectively, were instrumental in closing state budget gaps.

[ 3 ]
figuRE 4. MEdicaid lEads statE sPEndingfy 2013 Projected spending
$ B
ILLI
ON
S
Medicaid* ■
-10
-5
0
5
10
15
20
$25
K-12 Education ■ Transportation ■Corrections ■ Public Assistance ■ Higher Education ■
* Projected Medicaid spending includes a $4.7 billion supplemental appropriation in Texas. Sources: National Governors Association and National Association of State Budget Officers.
figuRE 5. BudgEting foR lowER sPEndingannual Percent change in general fund Expenditures
% Y
OY
CH
AN
GE
-8
-6
-4
-2
0
2
4
6
8
10
12%
2005 2006 2007 2008 2009 2010 2011 2012 2013
6.5
8.7 9.4
4.9
-3.8
-5.7
3.5 3.42.2
Sources: National Governors Association and National Association of State Budget Officers. Years represented are fiscal years. FY 2012 numbers are preliminary. FY 2013 numbers are approximate.
With revenues only slightly above fY 2008 levels, rapidly rising obligations for medicaid and pensions, and no additional federal aid on the horizon, states will likely continue to reduce certain services and programs, offload additional costs to local governments, and only slowly restore selective funding, such as school aid. figure 4 shows how medicaid has taken the lion’s share of state spending, squeezing out other programs. even now, with revenues increasing, the national association of State Budget officers fall 2012 fiscal Survey of States reports that states are budgeting for only a 2.2% increase in general fund expenditures in fY 2013 following only a 3.4% rise in fY 2012, both modest by historical standards (see figure 5).
changing Political landscape could affect future Budget decisionsStates’ reactions to the economic recovery have shifted in recent months due in no small part to the political polarization that has occurred nationally since 2008. the number of states with one-party control of the legislature and governorship has risen dramatically to 39, its highest level since 1952. republicans have made the largest gains, now controlling 24 states, up from nine in fY 2008 (see figure 6). While exact proposals will vary, states primarily controlled by democratic legislatures and governors, like those in the northeast and on the West coast, are more likely to restore funding to programs that were cut during the recession. In contrast, republican-controlled state governments in the South and midwest are more likely to pursue tax cuts rather than expansion of social services. for fY 2014, proposals to eliminate or cut income taxes have already surfaced in arkansas, Indiana, Iowa, Kansas, Louisiana, nebraska, north carolina, ohio, oklahoma and Wisconsin. While these policies are politically popular and may bolster long-term economic growth by attracting more business, they will do little to provide immediate budget relief and could exacerbate budget deficits. Such was the case in Kansas following an income tax cut approved last year. voters, for their part, turned in mixed results on proposed revenue increases included on state ballots in november 2012, a marked change from 2010 when voters rejected every proposed revenue increase. In the most notable case, california voters approved Proposition 30, which temporarily raises sales and personal income tax rates to provide additional funding for public education.
regardless of political affiliation, an increased focus on fiscal stability remains a prominent theme. many states, for example, are rebuilding reserves that were depleted during the economic downturn. Balances in state rainy day funds have increased 50%
figuRE 6. singlE-PaRty statEs doMinatE
Republican Controlled Democratic Controlled
Split Controlled
Source: BlackRock. Nebraska is the only state in the US that has a unicameral legislature, which is non-partisan. In New York, the Senate has a majority of elected Democrats, but a small group of Senate Democrats established a power-sharing deal with Senate Republicans.

[ 4 ] s tat E o f t H E s tat E s a n d l o c a l g o v E R n M E n t s
figuRE 8. PuBlic cuts uniquE to tHis REcEssion8%
6
4
2
0
-2
-4
0-12 -6 606 12 18 24 30 36 42 48 54
200720011990
% C
HA
NG
E IN
PAY
RO
LLS
figuRE 7. Rainy day funds on tHE RisE%
OF
SP
EN
DIN
G
Rest of Balance ■ Rainy Day Funds ■
0
2
4
6
8
10
12%
4.0
5.6
3.1
3.7 1.8
0.9
1.8
1.1
2.6
2.0
3.4
4.4
5.3
5.4
4.9
3.9
3.2
3.6
1.4
2.2
2.0
1.6
3.3
1.5
1.9
2.2
1.9
2.4
2000 2002 2004 2006 2008 2010 2012
Source: Center on Budget and Policy Priorities. Excludes AK and TX, which would skew figures upward. Years are fiscal years. 2012 is preliminary; 2013 is estimated.
figuRE 9. locals sHEd MoRE JoBs
-8
-7
-6
-5
-4
-3
-2
-1
0
1
2%
2008 2009 2010 2011 2012 2013Private PayrollsState PayrollsLocal Payrolls
% C
HA
NG
E (C
UM
ULA
TIV
E)
Source: Bureau of Labor Statistics. Data through January 2013.
figuRE 10. PRivatE vs. PuBlic PayRolls
-7
-6
-5
-4
-3
-2
-1
0
1
2
3%
2008 2009 2010 2011 2012 2013Private PayrollsState PayrollsLocal Payrolls
% C
HA
NG
E (Y
OY
)
Source: Bureau of Labor Statistics. Data through January 2013.
Source: Center on Budget and Policy Priorities.
in august 2008. In comparison, private payrolls, which make up a much larger subset of the US labor force, have declined by over 3.5 million jobs, or 3.1%, since peak employment in January 2008. We calculate that the loss of state and local jobs has added roughly 0.5% to the unemployment rate since the beginning of the downturn. We also note that, although the decline in state and local jobs appears to be marginal compared to the private sector, the length and depth of the decline is unprecedented. In fact, state and local government employment actually increased during each of the past two recessions (see figure 8). In contrast to the private sector, where payrolls have now rebounded from their lows and continue to grow, growth in state and local government jobs has yet to fully materialize (see figures 9 and 10). Job losses at the state level (3.2% below august 2008 peak) and the local level (4.0% below July 2008 peak) also demonstrate significant divergence. We expect this trend
since reaching a low in fY 2010 (see figure 7) and some states have strengthened constitutional provisions on reserves by reducing barriers to use or raising maximum levels. Still, we do not expect fund balances will return to pre-recession levels in the near term due to the effect of tax cuts or spending increases, both of which will take political priority. While one-party control may resolve budget issues more efficiently, it raises questions about the longer-term viability of balanced budgets that rely almost exclusively on tax increases or spending cuts. Perhaps a true bipartisan (albeit more contentious) process that eventually addressed both revenue-raising and spending constraint would lead to more flexible options and, as such, more sustained budget-balancing in successive years.
state and local Payrolls still Pinchedas of January 2013, state and local governments have shed 728,000 total jobs, or 3.7%, since reaching peak levels
[ 5 ]
to continue and perhaps even worsen going forward. States, as we discussed above, are experiencing improvement in revenues and are facing less fiscal pressure to cut expenditures than in prior years. In fact, over the past several months, state employment growth has turned slightly positive, up 4,000 jobs since July 2012. on the other hand, local governments continue to face budget pressure as state aid remains muted and property tax revenues continue to recover from prior annual declines. as a result, although the decline in local payrolls has clearly moderated in recent months, they have yet to post any signs of tangible improvement. Since July 2012, local governments have lost an additional 17,000 employees. Local jobs make up 75% of total state and local payrolls. as such, we expect further pressure on local payrolls to continue to drive overall weakness in the sector’s job growth outlook.
federal austerity Remains a challengefiscal issues also dominate at the federal level, and this means austerity measures that are certain to trickle down to states and locals. While the January 1 deal to avert the worst of the fiscal cliff was largely perceived as a near-term positive, the compromise merely pushed back the cliff-related spending cuts by two months. With the sequestration taking effect on march 1, the federal government is forced to cut roughly $85 billion during the course of the year. roughly half of these cuts come from defense and half from domestic discretionary spending and medicare, especially provider payments. exacerbating matters is the imminent debt ceiling debate, which was recently deferred from february to later in the spring.
regardless of whether legislators keep the sequester in place, opt for other shorter-term fixes or develop a grand bargain, the US government has a budget problem that must be addressed. any compromise as part of a larger budget deal may entail both spending cuts and tax increases. a comprehensive, long-term solution eludes federal lawmakers, who have repeatedly pushed more difficult, substantive proposals back by several months at a time. clearly this “kick-the-can” philosophy has implications for the long-term health of the broader economy. as the long-term solutions are pushed further down the road, there is the possibility that programs directly affecting state and local governments and not currently targeted for cuts could eventually be included in any deficit-reduction deal. according to the center on Budget and Policy Priorities, state and local aid (which includes medicaid, grants and mandated federal programs) currently accounts for 41% of the federal budget outside of Social Security, medicare, defense and interest payments. as such, any “grand bargain” that makes significant cuts to federal spending will necessarily affect the fiscal condition of state and local governments.
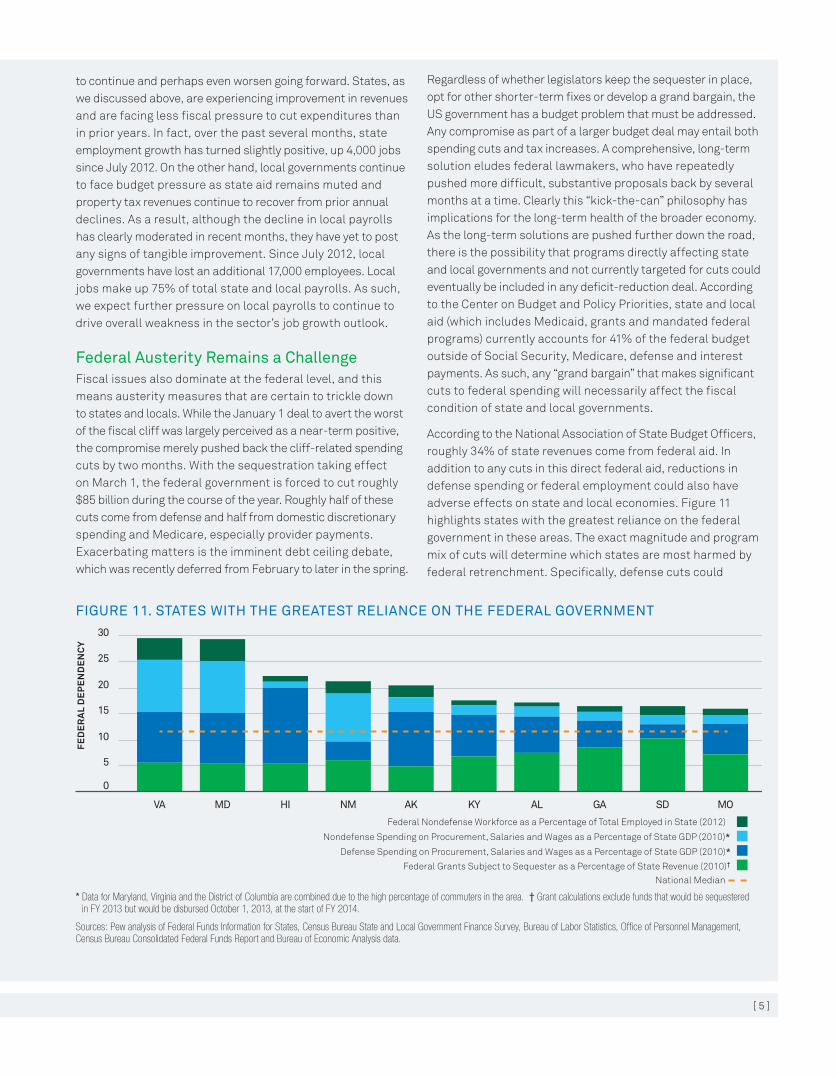
according to the national association of State Budget officers, roughly 34% of state revenues come from federal aid. In addition to any cuts in this direct federal aid, reductions in defense spending or federal employment could also have adverse effects on state and local economies. figure 11 highlights states with the greatest reliance on the federal government in these areas. the exact magnitude and program mix of cuts will determine which states are most harmed by federal retrenchment. Specifically, defense cuts could
figuRE 11. statEs witH tHE gREatEst REliancE on tHE fEdERal govERnMEnt
0
30
25
20
15
10
5
FED
ER
AL
DE
PE
ND
EN
CY
■ ■ ■ ■
VA MD HI NM AK KY AL GA SD MO
National Median
Federal Nondefense Workforce as a Percentage of Total Employed in State (2012)
Nondefense Spending on Procurement, Salaries and Wages as a Percentage of State GDP (2010)*
Defense Spending on Procurement, Salaries and Wages as a Percentage of State GDP (2010)*
Federal Grants Subject to Sequester as a Percentage of State Revenue (2010)†
* Data for Maryland, Virginia and the District of Columbia are combined due to the high percentage of commuters in the area. † Grant calculations exclude funds that would be sequestered in FY 2013 but would be disbursed October 1, 2013, at the start of FY 2014.
Sources: Pew analysis of Federal Funds Information for States, Census Bureau State and Local Government Finance Survey, Bureau of Labor Statistics, Office of Personnel Management, Census Bureau Consolidated Federal Funds Report and Bureau of Economic Analysis data.

[ 6 ] s tat E o f t H E s tat E s a n d l o c a l g o v E R n M E n t s
figuRE 12. locals Most affEctEd By dEfEnsE cuts
Sources: US Census; Federal Procurement Data System.
negatively impact weapons manufacturers or military bases and, consequently, erode state or local tax bases. While many publications focus on the impact on state employment or taxes, these defense cuts will have the most devastating impact on local governments, as their economies are more dependent on individual defense contractors or military bases for jobs and tax revenue. figure 12 lists the local areas most dependent on defense contracts. States that are home to these contractors or bases will also suffer, but they have larger economies that can more easily absorb any job or tax revenue losses.
the future of Municipal Bond tax Exemptionfederal austerity entails not only decreasing expenditures (including cuts in aid), but also the need to raise tax revenues. one option to that end is the elimination or reduction of tax deductions and exemptions. the obama administration in the past had proposed capping the value of exemptions, including municipal bond interest, at 28%. the main impact of the cap (or elimination) would be increased borrowing costs to state and local governments. the President’s office of management and Budget estimated tax exemption was worth $230 billion from 2012 to 2016. Under one estimate, state and local issuers could end up paying about $10 billion in additional interest costs over the life of their bonds.* coupled with federal spending cuts, these increased interest costs would further pressure state and local government finances. While states could offset these costs by collecting (previously exempt) income taxes on municipal bonds, local governments would not directly recapture the income taxes, unless states distributed a portion to them.
all of that said, we believe the full elimination of municipal bond tax exemption is highly unlikely. even a cap has a very
low probability of passing, especially given the bipartisan rift that exists as well as opposition from market participants and government officials, especially local finance officers and mayors. It is possible that restrictions on tax exemption may be imposed on certain revenue bonds, such as those issued for corporate purposes.
overall, the municipal bond market offers significant opportunity, particularly relative to other fixed income assets, and we
* Source: Lynn Hume and Patrick Temple-West, “Obama Proposal Stuns Market,” The Bond Buyer, September 14, 2011.
case in Point: How federal austerity can impact statesone of the major programs the federal government funds is medicaid, which accounts for about 25% of total state spending (the largest component of state spending) and represented 20% of general fund expenditures in fY 2012. We can get a general idea of the effect that a cut to federal medicaid funding (or any other major program) may have on states by simply looking over the past two years. Between october 2008 and June 2011, the american recovery and reinvestment act (arra) provided medicaid relief of approximately $100 billion to states (a relatively small amount in the context of the total federal budget).
following the expiration of arra, however, states were required to fill this funding gap and state medicaid expenditures increased substantially—by 20.3% in fY 2011 and 16.2% in fY 2012 . Importantly, during these two years, total medicaid spending growth increased by only 9.7% and 2.0%, respectively. While the affordable health care act uses the medicaid program to extend insurance coverage to the uninsured, any reduction in federal support without relaxed federal mandates in this area may force states to cut other spending programs, including local aid, or raise taxes and fees to compensate for any future federal cuts.
fy 2011 federal Procurement by city
city stateProcurement
Per capita
Bath me $533,104
fort Belvoir va $434,238
Groton ct $423,561
andover ma $307,710
chesterbrook Pa $297,316
falls church va $255,162
hampton ar $221,822
owego nY $205,451
ridley Park Pa $187,550
Liverpool nY $178,229
el Segundo ca $138,432
Pascagoula mS $130,370
dakota dunes Sd $101,734
Bethpage nY $99,981
mcLean va $84,854

[ 7 ]
Sources: Public Fund Survey, Center for Retirement Research at Boston College. Years represented are fiscal years.
figuRE 13. PEnsion funding lags EvEn as stock MaRkEt REBounds
0
85
80
75
70
65
60
55
90%
400
600
800
1800
1600
1400
1200
1000
FUN
DE
D R
ATIO
(%)
S&
P 500 LE
VE
L
S&P 500Pension Funded Ratio ■
20122011201020092008200720062005
figuRE 14. PEnsion funding BuRdEn gRows
% A
RC
PA
ID
ARC as % of Payroll% ARC Paid
2005 2006 2007 2008 2009 2010 2011
70
75
80
85
90
95% 17%
16
15
14
13
12
11
10
9
8
AR
C A
S %
OF PAY
RO
LL
Source: Center for Retirement Research at Boston College. Years represented are fiscal years.
would expect a tax cap (unlikely as it may be) to do little to change that. munis’ after-tax appeal is even more attractive after the January 1 fiscal cliff deal raised the highest marginal tax rate to 39.6% (plus the 3.8% medicaid tax on capital gains established under the affordable health care law).
Pension-induced Pressure, But Reforms continuethe proverbial “elephant in the room” for all state and local governments has continued to center on the funding of public pensions and retiree health benefit plans (also known as other post-employment benefits, or oPeBs). estimates on total retirement liabilities have ranged from $1 trillion to $3 trillion depending on the discount rates applied, while many local government bankruptcies and state rating downgrades have cited rising pension costs among the myriad of culprits. the State of Illinois was recently downgraded by S&P, which criticized the state’s lack of legislative action and inability to fully fund rising required contributions. average state pension funding ratios continue to languish at around 75%, even as equity and bond markets have continued to rally. figure 13 shows the notable divergence between equity market performance and average state pension funding ratios. While these effects are partially attributable to the 3- to 5-year asset value smoothing policies, the tepid ratios are also the result of the underfunding of required pension contributions during recessionary years just as most asset classes were in full recovery, as illustrated in figure 14. the total burden of the annual required contribution (arc) and the failure to fully fund it will continue to serve as the barometer for the operating constraints of states and local governments.
according to the center for retirement research (crr) at Boston college, only three states—alaska, Illinois and new York—have constitutional limits against reducing benefits for their current employees. In most states, the legal framework
for protecting pension benefits relies on a contract-based approach, either created by statute or implied by facts and circumstances, which could allow for possible benefit changes for current workers, especially related to yet-to-be-accrued future benefits. Under contract clause theory, states are prohibited from passing laws that substantially impair existing contracts. however, in search of flexibility, some states are looking to courts to interpret contract law and legislative intent to allow amendments—meeting a two-tiered “reasonable” and ”necessary” threshold—that serve a greater public purpose. Some more aggressive legal challenges have also targeted pension benefits accrued or vested. Importantly, the legal constraints on amending pension benefits appear more open to interpretation than commonly considered. Policymakers will need this flexibility to spread the burden of pension reform to include current workers and to make progress with underfunding.

[ 8 ] s tat E o f t H E s tat E s a n d l o c a l g o v E R n M E n t s
State pension reforms have been ubiquitous since the start of the recession, and there are many high-profile court cases pending that should help provide better direction on the future path of pension reform. even though 45 states have approved some version of pension reform since 2009 (see figure 15), cuts have primarily focused on the benefits of future workers hired, leaving the enormously larger savings opportunities tied to current workers and retirees for another day. according to researchers at the crr, new pension laws have trimmed only about $100 billion from a gap estimated at close to $1 trillion. more recently, however, policymakers have turned their rationing attention to current workers and retirees and, in doing so, have begun testing their state’s legal pension benefit frameworks. the most effective reform tool of choice has been the revision of cost of living adjustments (coLas). these annual automatic percentage increases in retiree benefits, when compounded, have a dramatic effect on future liability. Secondarily, smaller combined actions that raise taxes, cut spending and reduce benefits in meaningful capacities while increasing employee contributions can have positive impacts on long-term liabilities and overall credit strength.
during 2012, four out of the nine states that enacted pension reforms instituted some change to coLas. the State of ohio has been the most recent and notable example, tying coLas to inflation while increasing employee contributions, a move that received a somewhat surprising level of union support. even though court challenges are still likely to surface to protect the status quo, this type of labor market cooperation provides a favorable political tailwind and a model for other state unions to emulate. State supreme courts in rhode Island and new Jersey will decide on the legality of dramatic reforms affecting current workers, including efforts to
reduce coLas. this follows favorable 2011 decisions in colorado and minnesota. Similar cases are being heard in lower courts in Louisiana, michigan, new hampshire and elsewhere on fights to overturn changes to coLas, increased employee contributions and higher retirement ages. In January 2013, the florida Supreme court ruled in favor of a legislative measure that required employees to contribute 3% of their pay and eliminated coLas for employees retiring after the law took effect. the final contested vote of 4-3 was a major win for the state budget and will save an estimated $1 billion in future costs.
among local governments, voters in the california cities of San Jose and San diego overwhelmingly passed pension benefit cuts that included current workers as well as future hires. these cases have added some local momentum to pension reform, but implementation is pending court appeals. also in california, the well-known San Bernardino chapter 9 case could provide a landmark precedent with the city unable and/or unwilling to make its required pension contributions to the california Public employees’ retirement System (calPerS). Under the assumption that a bankruptcy filing passes the “necessary” test under contract theory, then at least some measure of retirement benefit contract impairment seems like a fair restructuring strategy to help the city return to its core mission of providing government services. calPerS is aggressively battling to force San Bernardino’s pension contribution obligations as having administrative priority status ahead of all creditors in bankruptcy. If calPerS loses this battle, a new legal model could potentially influence more productive sponsor-labor negotiations that, in turn, would help set the trajectory of retirement benefits on a more sustainable path. another argument, posited by some observers, is that a calPerS loss could incentivize more local bankruptcies as a means to solve high pension cost burdens. It is noteworthy to mention that in distressed scenarios to date, Go debt has continued to receive priority over pensions. In rhode Island, specific legislation was passed giving bondholders the first lien on property taxes and general fund revenues. furthermore, the rhode Island city of central falls recently emerged from bankruptcy without any bond defaults, while rising and burdensome pension costs were cut.
oPeB liabilities, while severely underfunded in the majority of states and local governments, do not present the overwhelming danger that most headlines would imply. While the Pew center on the States quoted the liabilities at a daunting $627 billion, we note that these benefits have far less legal protection, and many states have had tremendous and easily obtained success in reducing this burden. for example, the State of connecticut trimmed its oPeB liability
figuRE 15. PEnsion REfoRM sincE 2009
* Measures include changes to either age, benefits or contribution requirements for new and/or existing employees.
Sources: PEW Center, National Conference of State Legislators (NCSL). Data as of December 2012.
No changes madePension reform measures taken*

[ 9 ]
figuRE 16. PRo foRMa dEclinE in fundEd Ratios
Current ■ GASB Proposal ■
0
20
40
60
80
100%
79%
49%
76%
57%
2009 2010
FUN
DE
D R
ATIO
(%)
Source: Center for Retirement Research at Boston College. Years represented are fiscal years.
from $31.2 billion to $17.9 billion by raising its interest rate assumption from 4.5% to 5% and altering plan designs, including reduced income eligibility, higher length of service requirements and increased contributions from employees. additionally, Governor deval Patrick of massachusetts recently suggested legislation to double the age eligibility requirements of all state and local employees in an effort to reduce the oPeB liability. In summary, states have generally had an easier time addressing oPeB burdens in ways that diminish their overall effects on short and intermediate credit concerns.
the accounting perspective for pensions and oPeBs is also poised to change by the end of fY 2014 as a result of new regulations from the Governmental accounting Standards Board (GaSB) Statements 67 and 68. While there are many alterations to reporting requirements of these long-term liabilities, the change in discount rate and amortization periods will have the most dramatic effect on funded ratios. While state and local governments were previously able to discount all liabilities by their assumed rate of return, new GaSB rules will require all unfunded portions to be discounted by a “tax-exempt high-quality bond,” which is a far lower expected return than that of the assets in which pension funds typically invest their money. the implementation of this rule will have a bifurcated effect on issuers: Well-funded pensions will experience modest ratio declines while those with the worst (lowest) funded ratios will deteriorate much more precipitously. Simultaneously, net liabilities will be amortized over each employee’s period of remaining service, which is likely to be lower on average than the typical 20- to 30-year amortization period most plans utilize. this will also contribute to higher net pension liabilities and, ultimately, increased annual contributions. the average ratio decline was estimated by the crr, shown in figure 16.
finally, we emphasize that the GaSB rules are accounting and not funding requirements. Unfortunately, the new GaSB rules have a backdoor provision that allows states and local jurisdictions with statutorily determined contribution rates to omit calculations for the arc, limiting comparability of funding practices. overall, new GaSB accounting rules will have a negative effect on net pension liabilities and, by proxy, funded ratios. the majority of states should be able to handle any increased expenses with little difficulty. however, a number of states and local governments will be under pressure to meet the higher actuarially determined contributions (adc replaces arc under new GaSB rules) to bolster funded ratios reduced by the new accounting rules.
Major credit Problems isolated; states not threateneddespite challenges in areas such as pension liabilities, credit strength is notable among states, allowing them to avoid the type of major fiscal stress occasionally exhibited elsewhere in the municipal space. Below we look at two examples of credit distress (one US territory and one city), contrast how these entities differ from states and discuss the potential implications for the broader municipal market.
US Territories—Puerto RicoUS territories tend to be lower-rated credits that lack the economic depth and breadth of US states. Puerto rico, in particular, has garnered media and investor attention due to a declining credit profile that is much weaker than that of US states. Puerto rico debt is tax-exempt in all states and, for that reason, it is widely held in municipal bond portfolios. as such, credit deterioration in the commonwealth could have significant ripple effects throughout the municipal market. among the main credit categories—debt, finances and the economy—Puerto rico clearly underperforms its mainland counterparts. Puerto rico compares poorly with even the worst-scoring states in a variety of key credit ratios. for example, its net tax-supported debt is 89% of personal income, compared with hawaii’s 9.6%, the highest among the 50 states, according to moody’s. Its combined pension funds had an 11% funded ratio at June 30, 2011 (latest available), significantly lower than Illinois’ 43% ratio on the same date (Illinois having the lowest funded ratio among the states). Puerto rico’s per capita income of $15,995 is 50% of mississippi’s $32,176 level, the poorest among all states. Puerto rico’s economy had been in a recession from the second quarter of 2006 through 2011 (growth of less than 1% in 2012 is projected), while the US economic recovery has been in force since the third quarter of 2009, albeit at a slow rate. While the US unemployment rate was 7.8% in december 2012 with a labor force participation rate of 64%, Puerto rico’s unemployment rate was 14.0% in december with a labor force
[ 1 0 ] s tat E o f t H E s tat E s a n d l o c a l g o v E R n M E n t s
participation rate of 40%. Puerto rico’s fY 2013 budget gap had been pegged at roughly $1 billion, or only 10% of revenues, due in significant part to successful spending reductions. (It’s been reported that the gap may be a substantially higher $2.25 billion, making potential remedies much less apparent.) Puerto rico’s gap-closing revenue and spending options are much more limited than for states.
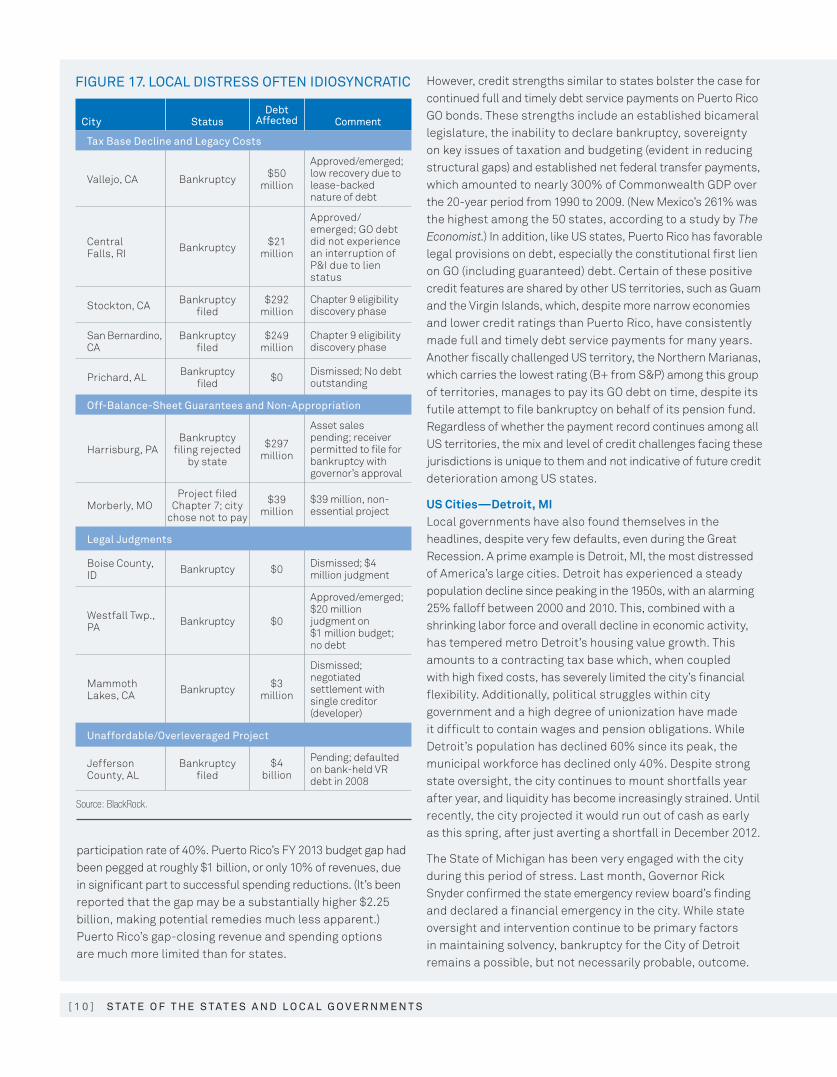
figuRE 17. local distREss oftEn idiosyncRatic
Source: BlackRock.
city
status
debt affected
comment
tax Base decline and legacy costs
vallejo, ca Bankruptcy $50 million
approved/emerged; low recovery due to lease-backed nature of debt
central falls, rI Bankruptcy $21
million
approved/emerged; Go debt did not experience an interruption of P&I due to lien status
Stockton, ca Bankruptcy filed
$292 million
chapter 9 eligibility discovery phase
San Bernardino, ca
Bankruptcy filed
$249 million
chapter 9 eligibility discovery phase
Prichard, aL Bankruptcy filed $0 dismissed; no debt
outstanding
off-Balance-sheet guarantees and non-appropriation
harrisburg, PaBankruptcy
filing rejected by state
$297 million
asset sales pending; receiver permitted to file for bankruptcy with governor’s approval
morberly, moProject filed
chapter 7; city chose not to pay
$39 million
$39 million, non-essential project
legal Judgments
Boise county, Id Bankruptcy $0 dismissed; $4
million judgment
Westfall twp., Pa Bankruptcy $0
approved/emerged; $20 million judgment on $1 million budget; no debt
mammoth Lakes, ca Bankruptcy $3
million
dismissed; negotiated settlement with single creditor (developer)
unaffordable/overleveraged Project
Jefferson county, aL
Bankruptcy filed
$4 billion
Pending; defaulted on bank-held vr debt in 2008
however, credit strengths similar to states bolster the case for continued full and timely debt service payments on Puerto rico Go bonds. these strengths include an established bicameral legislature, the inability to declare bankruptcy, sovereignty on key issues of taxation and budgeting (evident in reducing structural gaps) and established net federal transfer payments, which amounted to nearly 300% of commonwealth GdP over the 20-year period from 1990 to 2009. (new mexico’s 261% was the highest among the 50 states, according to a study by The Economist.) In addition, like US states, Puerto rico has favorable legal provisions on debt, especially the constitutional first lien on Go (including guaranteed) debt. certain of these positive credit features are shared by other US territories, such as Guam and the virgin Islands, which, despite more narrow economies and lower credit ratings than Puerto rico, have consistently made full and timely debt service payments for many years. another fiscally challenged US territory, the northern marianas, which carries the lowest rating (B+ from S&P) among this group of territories, manages to pay its Go debt on time, despite its futile attempt to file bankruptcy on behalf of its pension fund. regardless of whether the payment record continues among all US territories, the mix and level of credit challenges facing these jurisdictions is unique to them and not indicative of future credit deterioration among US states.
US Cities—Detroit, MILocal governments have also found themselves in the headlines, despite very few defaults, even during the Great recession. a prime example is detroit, mI, the most distressed of america’s large cities. detroit has experienced a steady population decline since peaking in the 1950s, with an alarming 25% falloff between 2000 and 2010. this, combined with a shrinking labor force and overall decline in economic activity, has tempered metro detroit’s housing value growth. this amounts to a contracting tax base which, when coupled with high fixed costs, has severely limited the city’s financial flexibility. additionally, political struggles within city government and a high degree of unionization have made it difficult to contain wages and pension obligations. While detroit’s population has declined 60% since its peak, the municipal workforce has declined only 40%. despite strong state oversight, the city continues to mount shortfalls year after year, and liquidity has become increasingly strained. Until recently, the city projected it would run out of cash as early as this spring, after just averting a shortfall in december 2012.
the State of michigan has been very engaged with the city during this period of stress. Last month, Governor rick Snyder confirmed the state emergency review board’s finding and declared a financial emergency in the city. While state oversight and intervention continue to be primary factors in maintaining solvency, bankruptcy for the city of detroit remains a possible, but not necessarily probable, outcome.

[ 1 1 ]
a chapter 9 filing by detroit would be the largest ever in the municipal market, but would not pose significant market risk. Unlike Puerto rico, outstanding detroit Go bonds are not widely held among municipal bond funds.
While detroit’s predicament has been in the making for decades, many cases of local government distress are largely idiosyncratic, spurred by an oversized, ill-advised project or an unanticipated lawsuit. figure 17 on page 10 includes a representative sample, but by no means an exhaustive list, of smaller issuers (the obvious exception being Jefferson county, aL) bucketed into four main causes of stress that are largely event-driven, or the product of legacy costs or mismanagement. Jefferson county’s bankruptcy filing in november 2011, the largest ever in the municipal market, was unique for many reasons. Key factors included a risky capital structure ($3 billion sewer program financed entirely with variable-rate municipal bonds and offsetting interest rate swaps); mismanagement involving federal charges of corruption, bribery and fraud; and a non-monopolistic sewer system wherein connection to the system was not mandatory. despite the size of this bankruptcy, it resulted in no long-lasting implications for the municipal market. another reason for low default rates in the local government space is state regulation. State oversight promotes critical access to capital markets and favorable borrowing costs. many states, such as new York, new Jersey and north carolina, have strong provisions for intervention or takeover of local governments during times of fiscal stress.
2013 outlook for us statesamid a still-modest US economic growth forecast, states should continue to balance budgets primarily through a combination of revenue increases and spending cuts. the size of the budget gaps that must be addressed annually will likely continue to decline. however, while budget surpluses may be built from low recessionary levels, cost drivers will dampen a quick recovery in reserve levels. medicaid will continue to compete with other social welfare programs and local aid for constrained state resources. efforts by states to rein in pension costs and increase annual pension contributions will continue to weigh on state budgets and long-term liabilities. however, states’ sovereignty and the related monopolies on certain taxes and services give them tremendous flexibility in right-sizing budgets through revenue or fee hikes and spending cuts or reallocations. In our view, doomsayers underestimated the strength of these mechanisms. that said, certain states will continue to face downgrade pressure from the rating agencies for actions deemed incomplete or ineffective in achieving budget balance or in addressing long-term pension liabilities.
Ironically, the greatest threats to state fiscal integrity are not primarily endemic fiscal matters or economic conditions, but rather, the effects of federal policies. first, capping tax exemption is a potential problem for the entire municipal asset class, although offsetting factors would certainly alleviate the impact. for states, as well as local governments, a tax cap could mean higher borrowing costs. Still, as has been the case recently, increased borrowing costs would likely translate into program reductions or cost-shifting to local governments. as stated earlier, we believe passage of the cap will be difficult in the current political environment and is unlikely in 2013.
the second threat is the possibility of any new deficit-reduction law that further reduces both direct aid to and federal procurement in the states beyond the current sequestration. defense and domestic spending cuts in the march sequestration will likely result in job reductions and reduced tax collection in many states. furthermore, although medicaid remains untouched in the current sequestration, the program could face federal cuts in future negotiations. assuming funding mandates for medicaid remain, states would bear additional budget pressure from reduced federal dollars, forcing possible tax hikes, increased fees, spending cuts to programs and local governments, delayed pension funding, and use of reserves. again, it would be difficult to achieve agreement on significant medicaid cuts in 2013, but the potential remains for other cuts in domestic discretionary spending, such as transportation or education grants to states. the major point is that state fiscal flexibility will be tested throughout this year and beyond given the environment of federal austerity.
In addition to any sudden retrenchment in federal spending, the key risks to our view of continued, but slow, fiscal improvement among US states are various externalities, such as political shocks in the middle east or a worsening european situation that could upend the delicate national economy and propel the US into a recession. even in this scenario, we would expect states to react with necessary, albeit painful, spending cuts and revenue-raising actions. In such a circumstance, overly rosy revenue forecasts would have to be adjusted mid-year and budget negotiations for the following fiscal year would likely be more contentious and take a longer time to resolve. nevertheless, barring an economic dip similar to the Great recession, we would expect states to exhibit continued flexibility in re-establishing budgetary balance.

The two main risks related to fixed income investing are interest rate risk and credit risk. Typically, when interest rates rise, there is a corresponding decline in the market value of bonds. Credit risk refers to the possibility that the issuer of the bond will not be able to make principal and interest payments. A portion of the income from tax-exempt bonds may be taxable and may be subject to Alternative Minimum Tax (AMT). Capital gains, if any, are taxable.
This material is not intended to be relied upon as a forecast, research or investment advice, and is not a recommendation, offer or solicitation to buy or sell any securities or to adopt any investment strategy. The opinions expressed are those of the investment professional profiled as of March 2013, and may change as subsequent conditions vary. Individual portfolio managers for BlackRock may have opinions and/or make investment decisions that, in certain respects, may not be consistent with the information contained in this report. The information and opinions contained in this material are derived from proprietary and nonproprietary sources deemed by BlackRock to be reliable, are not necessarily all-inclusive and are not guaranteed as to accuracy. Past performance is no guarantee of future results. There is no guarantee that any forecasts made will come to pass. Reliance upon information in this material is at the sole discretion of the reader. Investment involves risks.
FOR MORE INFORMATION: www.blackrock.com
©2013 BlackRock, Inc. All Rights Reserved. BLACKROCK, BLACKROCK SOLUTIONS and iSHARES are registered trademarks of BlackRock, Inc. or its subsidiaries in the United States and elsewhere. All other trademarks are those of their respective owners.
Prepared by Blackrock Investments, LLc, member fInra.
Lit. No. SPEC-RPT-MBM-0313R AC6511-0313 / USR-1713
Not FDIC Insured • May Lose Value • No Bank Guarantee
conclusion: credit Research still keyState and local government finances continue to improve. despite long-term challenges (e.g., pension liabilities) and additional operating pressure in the face of federal austerity, the margin of safety between credit deterioration and potential insolvency is substantial for states. While that margin is slimmer for localities, direct state aid and/or state legal and regulatory mechanisms are available to enhance distressed local government credits, which we would argue are relatively few.
Blackrock is keenly aware of state and local issues affecting credit fundamentals in all municipal sectors. consequently, we are able to react quickly to opportunities that the market
may present. Just as individual credits are diverse, so are issuers, sectors and regions. Generalizations are difficult in the municipal marketplace. no two states, for example, have the same socioeconomic profile or regulatory environment. State constitutions and priority-of-payment models vary. at Blackrock, we believe analyzing this type of information is as important as understanding the financials. careful credit research and security selection are critical to achieving the best value in today’s municipal market. Blackrock has a dedicated team of more than 51 municipal investment professionals, one-third of who are focused on municipal credit research. our rigorous credit analysis is second to none and has a long history of translating into investment opportunities on behalf of our clients.