state of the automotive finance market - experian...market share of total financing (new/used units...
TRANSCRIPT

1©2016 Experian Information Solutions, Inc. All rights reserved.
Experian Public.
© 2016 Experian Information Solutions, Inc. All rights reserved. Experian and the marks used herein are service marks or registered trademarks of Experian Information Solutions, Inc. Other product and company
names mentioned herein are the trademarks of their respective owners. No part of this copyrighted work may be reproduced, modified, or distributed in any form or manner without the prior written permission of Experian.
Experian Public.
www.experian.com/automotive
State of the Automotive Finance Market A look at loans and leases in Q2 2016
Presented by: Melinda Zabritski | Sr. Director, Financial Solutions

© 2016 Experian Information Solutions, Inc. All rights reserved. Experian Public. 2
Market Overview
Outstanding balances
Total risk distributions
Delinquency
Originations
New and Used financing
Lender and transaction types
Loan & lease characteristics
Session overview

© 2016 Experian Information Solutions, Inc. All rights reserved. Experian Public. 3© 2016 Experian Information Solutions, Inc. All rights reserved. Experian Public. 3
A look balances and delinquencies on all open automotive loans & leases
Overall Automotive Finance Market

© 2016 Experian Information Solutions, Inc. All rights reserved. Experian Public. 4
Loan balances break record highs while Credit Unions experience largest YOY growth (loans regardless of origination period)
Source: Experian-Oliver Wyman Market Intelligence Reports

© 2016 Experian Information Solutions, Inc. All rights reserved. Experian Public. 5
11.86%
8.03% 8.10%
7.05%
8.42%
Deepsubprime
Subprime Nonprime Prime Super prime
Year-over-year volume change
Unit distribution remains stable with growth occurring across all risk segments (loans and leases regardless of origination period)
Source: Experian-Oliver Wyman Market Intelligence Reports
3.27% 3.28% 3.40%
15.43% 15.44% 15.44%
17.81% 17.77% 17.78%
28.00% 27.62% 27.37%
35.49% 35.89% 36.02%
2014 Q2 2015 Q2 2016 Q2
Risk distribution of open loans & leases
Deep Subprime Subprime Nonprime Prime Super Prime
© 2016 Experian Information Solutions, Inc. All rights reserved. Experian Public. 6
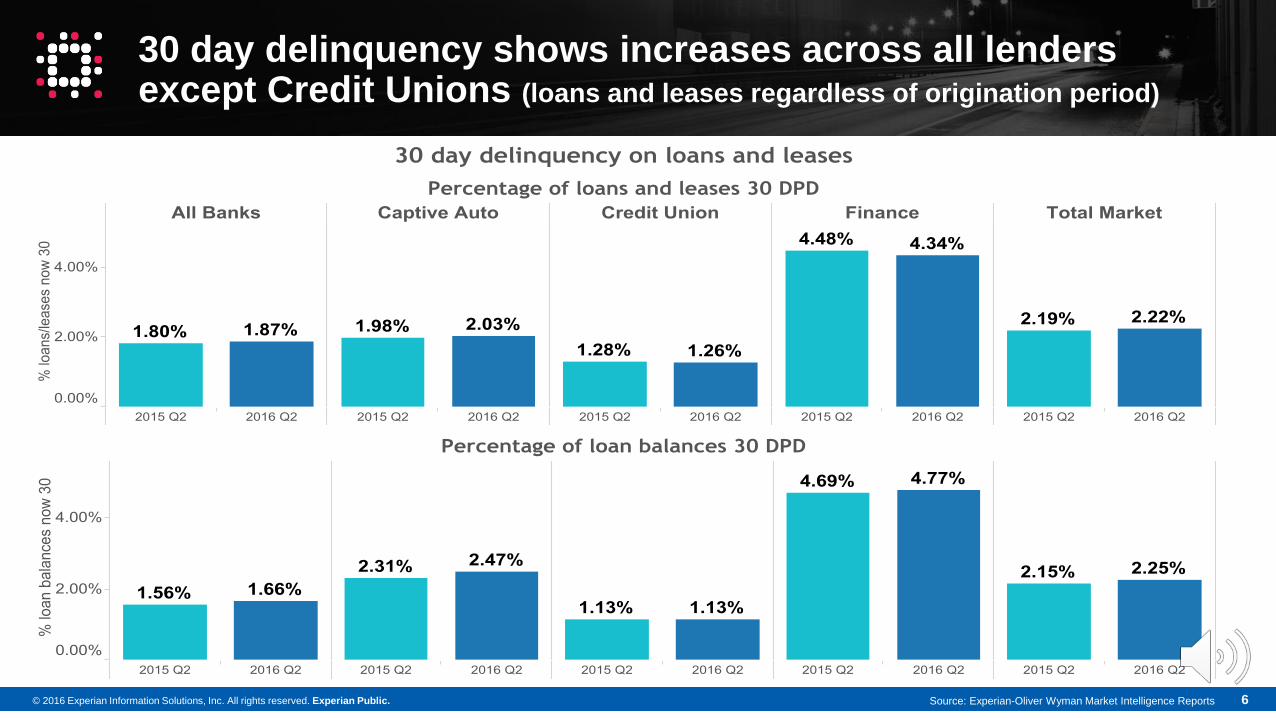
30 day delinquency shows increases across all lenders except Credit Unions (loans and leases regardless of origination period)
Source: Experian-Oliver Wyman Market Intelligence Reports

© 2016 Experian Information Solutions, Inc. All rights reserved. Experian Public. 7
30-day delinquency balances by state(loans and leases regardless of origination period)
Source: Experian-Oliver Wyman Market Intelligence Reports
HI = 1.88%
1.44%

© 2016 Experian Information Solutions, Inc. All rights reserved. Experian Public. 8
60 day delinquency growth across all lender types(loans and leases regardless of origination period)
Source: Experian-Oliver Wyman Market Intelligence Reports

© 2016 Experian Information Solutions, Inc. All rights reserved. Experian Public. 9
60-day delinquency balances by state(loans and leases regardless of origination period)
Source: Experian-Oliver Wyman Market Intelligence Reports
HI = 0.48%
0.32%

© 2016 Experian Information Solutions, Inc. All rights reserved. Experian Public. 10© 2016 Experian Information Solutions, Inc. All rights reserved. Experian Public. 10
Trends in automotive loans and leases
Originations in Q2 2016

© 2016 Experian Information Solutions, Inc. All rights reserved. Experian Public. 11
Automotive financing: snapshot of how and what consumers are financing
3.26% 3.71%
Q2 2015 Q2 2016
Used % of lease market
45.70% 44.39%
54.30% 55.61%
Q2 2015 Q2 2016
Finance Market: new v used units
New Used
85.8% 86.5%
55.5% 55.9%
Q2 2015 Q2 2016
Percentage of vehicles with financing
New Used
26.92%31.44%
Q2 2015 Q2 2016
% of all new vehicles that are leased
Source: Experian Automotive

© 2016 Experian Information Solutions, Inc. All rights reserved. Experian Public. 12
Credit Unions pick up market share across the board while Finance companies show decreases (loan and lease units combined)
34
.7%
7.4
%
27
.3%
17
.2%
13
.4%
34
.8%
7.1
%
27
.7%
18
.7%
11
.6%
Bank BHPH Captive CreditUnion
FinanceCo
Market Share of Total Financing(new/used units & loan/lease)
Q2 2015 Q2 2016
34
.0%
0.2
%
50
.0%
10
.3%
5.5
%
31
.7%
0.2
%
52
.2%
11.4
%
4.6
%
Bank BHPH Captive Credit Union Finance Co
Market Share of New Financing
Q2 2015 Q2 2016
35
.3%
13
.6%
7.7
% 23
.3%
20
.2%
37
.3%
13
.0%
7.4
%
24
.9%
17
.5%
Bank BHPH Captive Credit Union Finance Co
Market Share of Used Financing
Q2 2015 Q2 2016
Source: Experian Automotive

© 2016 Experian Information Solutions, Inc. All rights reserved. Experian Public. 13
39.34%
0.70%
10.14%
21.75%
8.61%
19.46%
12.19%
19.02%
0.35%
12.45%15.94%
40.05%
BANK BUY HERE/PAYHERE
CAPTIVE CREDIT UNION FINANCE NO LENDERLISTED
Financing by dealer type
Franchise Independent
Independent used Dealers experience higher cash penetration caused by more subprime and older MY vehicles
Source: Experian Automotive

© 2016 Experian Information Solutions, Inc. All rights reserved. Experian Public. 14
724
720
712711
710
722
717
711709
708
732
724
717716 716
Q2 2012 Q2 2013 Q2 2014 Q2 2015 Q2 2016
Average new credit scores
All New New Loan New Lease
Credit scores stabilize for new while used scores increase
647 645 644 645 648
674 673 672 671 674
602 601 600 603608
Q2 2012 Q2 2013 Q2 2014 Q2 2015 Q2 2016
Average used credit scores
All Used Franchise Used
Independent Used
Source: Experian Automotive

© 2016 Experian Information Solutions, Inc. All rights reserved. Experian Public. 15
Score range refresh
Note: ranges above are those used by Experian Automotive for automotive finance market analysis and trending purposes. Other industries and lenders may use other ranges based on unique scores, portfolio and industry trends.

© 2016 Experian Information Solutions, Inc. All rights reserved. Experian Public. 16
Total finance market (loan & lease) becomes increasingly more prime across all, new and used financing
9.97% 9.76%17.86% 17.86%
44.69% 44.97%
26.79% 26.72%
Q2 2015 Q2 2016
New risk distribution
6.00% 5.83%28.19% 26.95%
22.03% 22.22%
33.24% 34.20%
10.56% 10.80%
Q2 2015 Q2 2016
Used risk distribution
3.54% 3.54%
19.76% 19.28%
20.10% 20.28%
38.54% 39.01%
18.07% 17.90%
Q2 2015 Q2 2016
Total (new & used units) risk distribution
Deep Subprime Subprime Nonprime Prime Super Prime
Source: Experian Automotive

© 2016 Experian Information Solutions, Inc. All rights reserved. Experian Public. 17
7.24% 7.41%
17.50% 17.17%
48.48% 48.10%
26.36% 26.82%
Q2 2015 Q2 2016
New lease risk distribution
Deep Subprime Subprime Nonprime Prime Super Prime21.9%
29.8%
31.9%
26.5%
33.6%
36.5%
Deep &Sub
Nonprime
Prime +
%of new borrowers choosing leasing
Q2 2016
Q2 2015
Leasing remains very prime as more consumers across all risk tiers choose to lease (loans not included)
Source: Experian Automotive

© 2016 Experian Information Solutions, Inc. All rights reserved. Experian Public. 18
Loan market appears more subprime as prime consumers defect to leasing
11.17% 11.02%18.02% 18.24%
43.04% 43.29%
26.98% 26.67%
Q2 2015 Q2 2016
New loan risk distribution
5.93% 5.79%28.17% 26.98%
22.08% 22.28%
33.27% 34.20%
10.54% 10.75%
Q2 2015 Q2 2016
Used loan risk distribution
4.00% 4.06%
21.78% 21.46%
20.55% 20.88%
36.95% 37.34%
16.73% 16.26%
Q2 2015 Q2 2016
Total (new & used units) loan risk distribution
Deep Subprime Subprime Nonprime Prime Super Prime
Source: Experian Automotive

© 2016 Experian Information Solutions, Inc. All rights reserved. Experian Public. 19
Prime and Super Prime borrowers choose used vehicles at an increasing rate resulting in shifts among all dealer types
Source: Experian Automotive
19.92% 18.71%
23.72% 23.78%
40.68% 41.63%
13.59% 13.92%
Q2 2015 Q2 2016
Used Franchise loan risk distribution
Deep Subprime Subprime Nonprime Prime Super Prime
92.5
7%
80.7
1%
67.0
1%
56.1
8%
39.3
2%
93.2
5%
82
.24%
69.7
9%
59.9
0%
43.2
6%
DeepSubprime
Subprime Nonprime Prime SuperPrime
Percentage of consumers by risk tier choosing used loans
Q2 2015 Q2 2016
11.78% 11.18%
41.24% 39.00%
20.26% 20.78%
21.59% 23.48%5.12% 5.57%
Q2 2015 Q2 2016
Used Independent loan risk distribution
Deep Subprime Subprime Nonprime Prime Super Prime

© 2016 Experian Information Solutions, Inc. All rights reserved. Experian Public. 20
$28,5
24
$18,6
71
$20,4
26
$16,1
08
$29,8
80
$19,1
01
$20,9
40
$16,4
56
Avg new loanamount
Avg used loanamount
Avg Franchiseused loanamount
AvgIndependent
used loanamount
Average loan amount
Q2 2015 Q2 2016
Average used loan amount reaches record high while new drops below $30k
$24,849
$14,356
$16,359
$13,402
$27,841
$16,227
$18,376
$14,451
$31,222
$19,112
$20,998
$16,498
$31,406
$20,804
$22,115
$18,570
$27,454
$20,281
$21,185
$18,705
Avg New
All Used
Franchise used
Independent used
Average loan amount by tier
Super Prime Prime Nonprime Subprime Deep Subprime
Source: Experian Automotive

© 2016 Experian Information Solutions, Inc. All rights reserved. Experian Public. 21
67
36
68
36
New loan New lease
Average new term
Q2 2015 Q2 2016
71.94
36.82
72.25
37.15
72.23
36.85
69.33
36.26
61.98
35.37
New loan
New lease
Avg new term by risk tier
Super Prime Prime Nonprime Subprime Deep Subprime
New loan term at 68 months with higher terms on the small high risk, lower loan amounts in sub and deep subprime
Source: Experian Automotive

© 2016 Experian Information Solutions, Inc. All rights reserved. Experian Public. 22
65
58
62
66
59
63
Franchise used Independent used All used
Average used term
Q2 2015 Q2 2016
Used terms rise as more prime consumers, who have longer terms, choose used vehicles
Source: Experian Automotive
65.79
53.69
57.91
67.18
56.43
61.47
67.97
60.27
64.86
67.06
62.60
65.48
62.44
60.08
61.58
Franchise used
Independentused
All used
Average term by risk tier
Super Prime Prime Nonprime Subprime Deep Subprime

© 2016 Experian Information Solutions, Inc. All rights reserved. Experian Public. 23
772751
695677
770753
695679
37 - 48 49 - 60 61 - 72 73 - 84
Average new score by loan term
Q2 2015 Q2 2016
Average scores by term stabilize and increaselease is not included
646
680
656 662648
680
656668
37 - 48 49 - 60 61 - 72 73 - 84
Average used score by loan term
Q2 2015 Q2 2016
Source: Experian Automotive

© 2016 Experian Information Solutions, Inc. All rights reserved. Experian Public. 24
$483
$394
$499
$404
New loan New lease
Average new payment
Q2 2015 Q2 2016
Payments rise on new vehicles while leasing becomes more attractive
Source: Experian Automotive
$494
$422
$512
$424
$516
$411
$503
$404
$477
$397
New loan
New lease
Avg new payment by risk tier
Super Prime Prime Nonprime Subprime Deep Subprime

© 2016 Experian Information Solutions, Inc. All rights reserved. Experian Public. 25
$375
$351
$361
$378
$352
$364
Franchise used Independent used All used
Average used payment
Q2 2015 Q2 2016
Average used payment reaches record high of $364
Source: Experian Automotive
$384
$377
$376
$390
$371
$376
$384
$347
$366
$372
$335
$357
$370
$336
$358
Franchise used
Independent used
All used
Average payment by risk tier
Super Prime Prime Nonprime Subprime Deep Subprime

© 2016 Experian Information Solutions, Inc. All rights reserved. Experian Public. 26
4.8
1%
9.1
3%
7.9
5%
12.0
7%
4.8
2%
8.9
7%
7.6
8%
11.6
9%
Avg new rate Avg used rate Franchiseused rate
Independentused rate
Average rates
Q2 2015 Q2 2016
Average new rate rises while prime shift to used results in lower rates in the used market
13.37%
19.29%
18.01%
20.17%
10.59%
16.10%
14.57%
17.82%
6.49%
9.78%
8.96%
11.57%
3.70%
5.23%
4.98%
5.94%
2.64%
3.41%
3.36%
3.46%
Avg New
All Used
Franchise used
Independentused
Average rates by tier
Super Prime Prime Nonprime Subprime Deep Subprime
Source: Experian Automotive

© 2016 Experian Information Solutions, Inc. All rights reserved. Experian Public. 27
Portfolio balances reach record levels as loan amounts grow toall-time highs
Increases in both 30 & 60-day delinquency rates rise as the percentage of loans in the subprime portion of open portfolios grow
Leasing continues to surpass 30% of all new consumer vehicle sales as consumers across all risk tiers increasingly choose to lease
Prime consumers also increasing choosing used vehicles resulting in score increases, greater percentages of used financing in the prime risk tier and lower average used rates
Loan amounts and payments reach all-time highs for new loans while terms continue to extend
Summary

28©2016 Experian Information Solutions, Inc. All rights reserved.
Experian Public.
© 2016 Experian Information Solutions, Inc. All rights reserved. Experian and the marks used herein are service marks or registered trademarks of Experian Information Solutions, Inc. Other product and company
names mentioned herein are the trademarks of their respective owners. No part of this copyrighted work may be reproduced, modified, or distributed in any form or manner without the prior written permission of Experian.
Experian Public.
www.experian.com/automotive
Insights about the market, the vehicles
and the people who buy them