state of the art formatted -...
TRANSCRIPT

COST Action TU0904 Integrated Fire Engineering and Response
13
WG1 Fire SafetyFire SafetyFire SafetyFire Safety
Chairman: Jesus de la Quintana, Spain, [email protected]
COST Action TU0904 Integrated Fire Engineering and Response
14
Jesus de la Quintana, [email protected]
FIRE BEHAVIOUR AND FIRE SAFETY
Overview
Performance-based fire engineering design is being adopted around the world as a rational means of providing efficient and effective fire safety in buildings.
Much activity is taking place today regarding fire-safe building design. The general trust is directed toward quantification procedures and identification of a rational design methodology to parallel or supplement the traditional “go or no go” specifications approach. Knowledge in the field of fire protection is undergoing development and reorganization that will enable buildings to be designed for fire safety more rationally and efficiently.
The acceptable levels of safety and the focus of the fire safety analysis and design process objectives are concentrates in the following five areas:
1. Life Safety
2. Property Protection
3. Continuity of operations
4. Environmental protection
5. Heritage conservation
Factors influencing the performance required from a specific fire engineering design include:
- building geometry and intended use;
- location of properties;
- probability of a fire occurring;
- fuel load and distribution;
- number and abilities of occupants;
- available water supply and
- fire protection systems: smoke control installation, sprinkler system,…
Fire scenarios
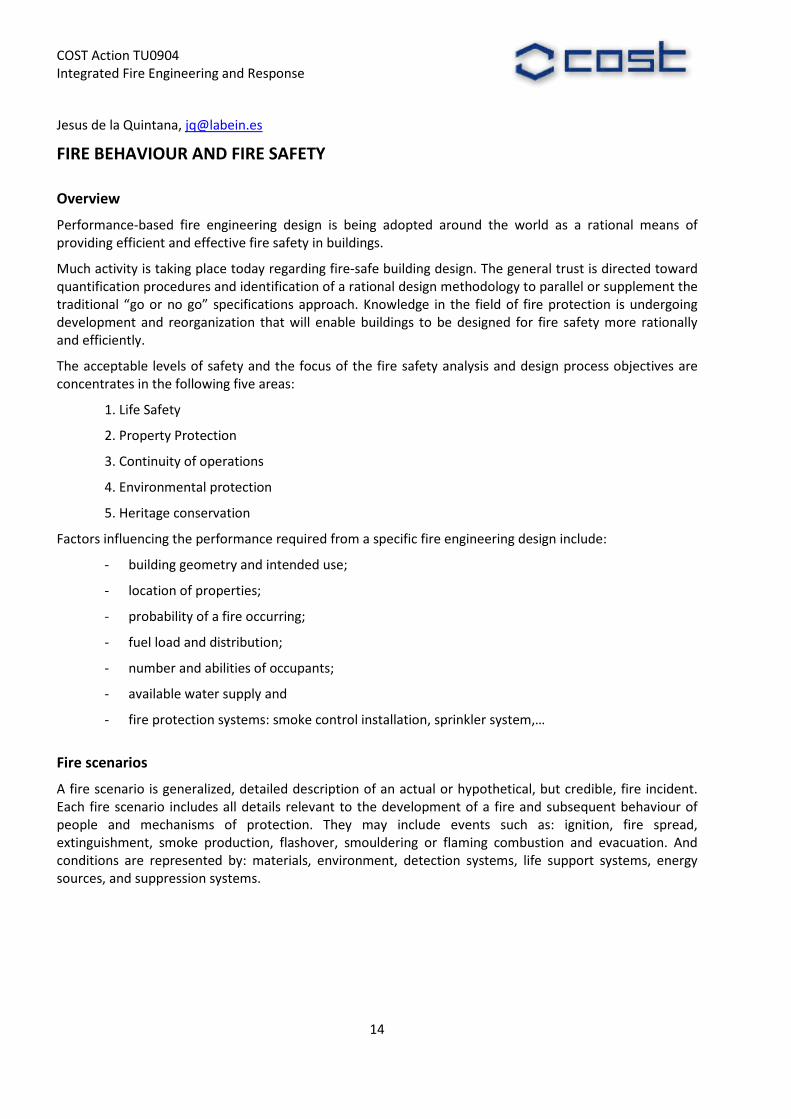
A fire scenario is generalized, detailed description of an actual or hypothetical, but credible, fire incident. Each fire scenario includes all details relevant to the development of a fire and subsequent behaviour of people and mechanisms of protection. They may include events such as: ignition, fire spread, extinguishment, smoke production, flashover, smouldering or flaming combustion and evacuation. And conditions are represented by: materials, environment, detection systems, life support systems, energy sources, and suppression systems.
COST Action TU0904 Integrated Fire Engineering and Response
15
Development of fire scenarios requires a constructive use of imagination. Judgment and extrapolation are very important because only limited data are available.
References:
“Valorisation project-Natural fire safety concept” – European Commission
RFCS project: “Natural fire safety concept” – European Commission
Design Fires
Many assumptions are made in the modelling process. One of the most important is the design fire, which is required as input for nearly all fire growth computer programs.
Most fire growth models require the user to input a design fire as a specified heat release rate varying with time. The design fire is the heat release rate for the fuel assuming that it is free burning in the open air.
Liquid fuels burning in the open, as pool fires, tend to burn at a constant rate once steady state conditions have been reached.
Any item of fuel may be assumed to have an increasing heat output according to a simple quadratic dependence on time. This is referred to as t2 fire. Scaling by a growth constant can account for a wide range of fire growth rates, from very slow to very fast. The particular choice of growth constant depends on the type and arrangement of the fuel.
The fire can be considered to grow according to the t2 curve until either the fuel is consumed, or until the heat release rate reaches a peak value expected for that particular object, in which case the duration of constant burning at that rate can be calculated.
References:
“Fire engineering design guide” – CAE University of Canterbury.
“Valorisation project-Natural fire safety concept” – European Commission
COST Action TU0904 Integrated Fire Engineering and Response
16
Fire evolution, propagation, suppression (active measures)
The fire load defines the available energy but the gas temperature in a fire depends on the rate of heat released. The same fire load burning very quickly or smouldering can lead to completely different gas temperature curves.
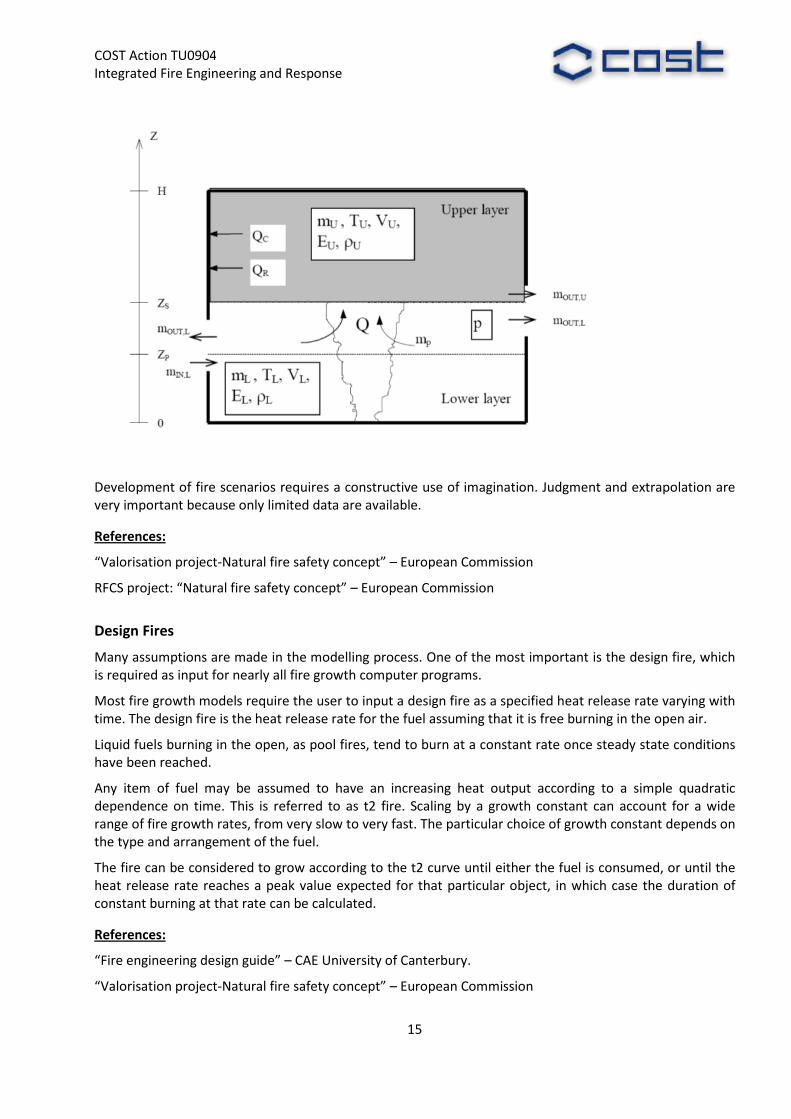
The RHR is the source of the gas temperature rise, and the driving force behind the spreading of gas and smoke. A typical fire starts small and goes through a growth phase. Two things can then happen depending if during the growth process there is always enough oxygen to sustain combustion. Either, when the fire size reaches the maximum value without limitation of oxygen, the RHR is limited by the available fire load (fuel controlled fire). Or if the size of openings in the compartment enclosure is too small to allow enough air to enter the compartment, the available oxygen limits the RHR and the fire is said to be ventilation controlled. Both ventilation and fuel controlled fires can go through flashover.
This important phenomenon, flashover, marks the transition from a localised fire to a fire involving all the exposed combustible surfaces in the compartment.
After the growing phase, the RHR curve follows a horizontal plateau with a maximum value of RHR corresponding to fuel bed or ventilation controlled conditions.
Finally, the decay phase is assumed to show a linear decrease of the RHR. Based on test results, the decay phase can be estimated to start when approximately 70% of the total fire load has been consumed.
On the other hand, in case of installation of fire suppression system, the decay phase can be considered to start when the first sprinkler starts to pour water and the reduction of RHR can be considered as exponential.
References:
“Valorisation project-Natural fire safety concept” – European Commission
NFPA 13: Standard for installing sprinkler system”.
Compartment energy balance
The heat release has long been recognised as the major reaction to fire parameter because it defines fire size and this defines many other reactions to fire quantities e.g. smoke and toxic gas production.
COST Action TU0904 Integrated Fire Engineering and Response
17
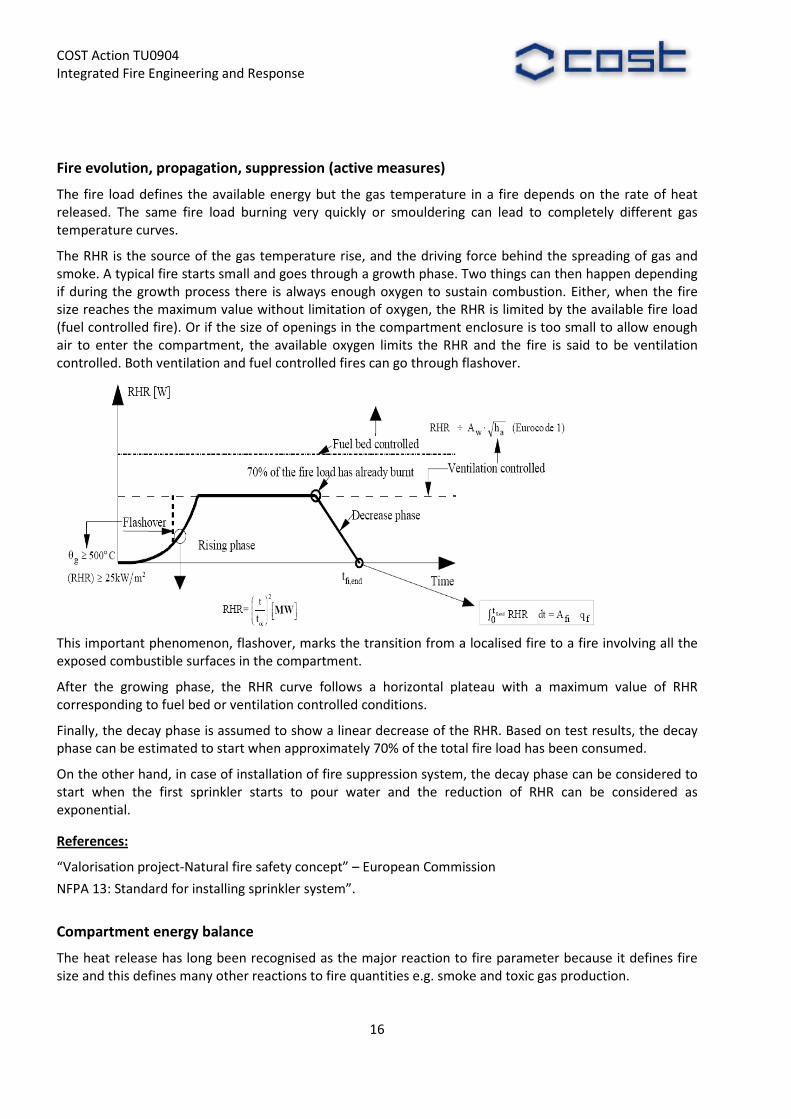
The rate and amount of heat transferred influence the rate of spread and the intensity of a fire. Combustion can not be sustained unless heat continues to be transferred. Heat transfer occurs by three means: convection, because of air and smoke motion; radiation as emission or absorption of electromagnetic waves; and conduction.
References:
“Fire engineering design guide” – CAE University of Canterbury.
“Risk-based fire resistance requirements” – ECSC Steel RTD programme.
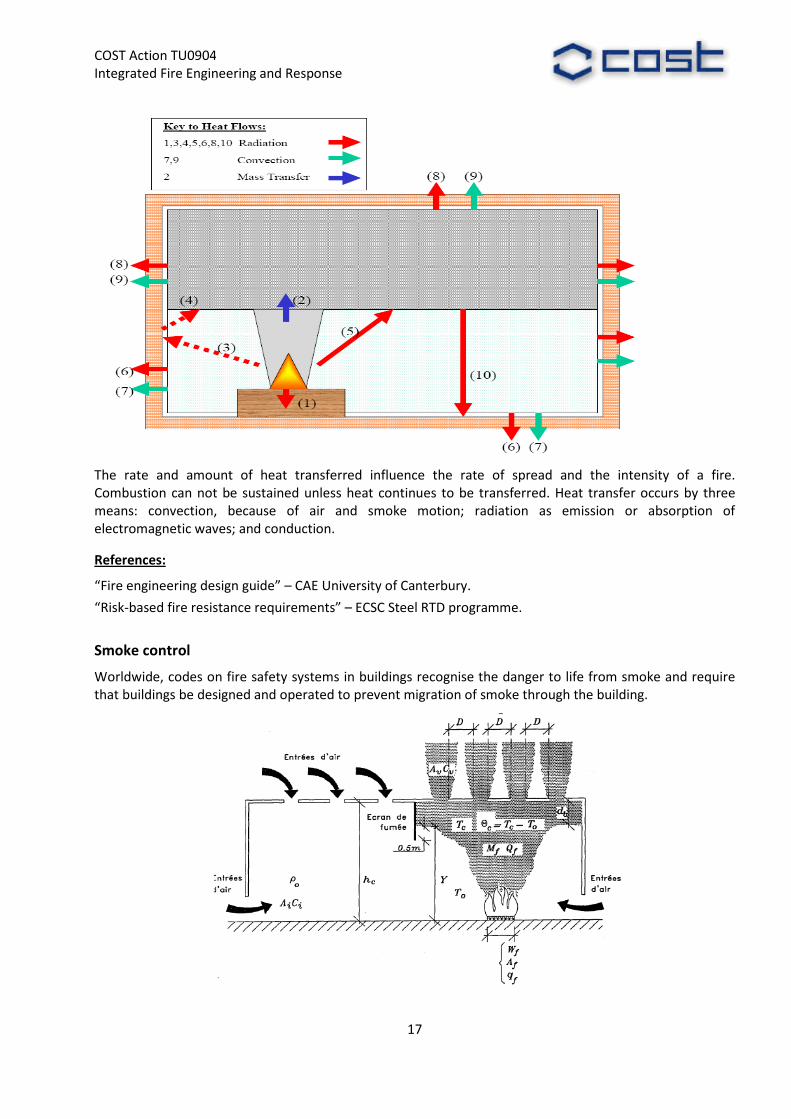
Smoke control
Worldwide, codes on fire safety systems in buildings recognise the danger to life from smoke and require that buildings be designed and operated to prevent migration of smoke through the building.
COST Action TU0904 Integrated Fire Engineering and Response
18
Occupant safety can be greatly improved by providing efficient smoke control and extraction systems. Moreover, such systems can limit property damage by limiting the spread of smoke and by providing better visibility and thus easier access to the seat of the fire for fire fighters.
There are three basic different purposes of a smoke control system:
- Life safety: the system is to be designed to maintain tenable conditions on escape routes.
- Fire fighting access/property protection: the system is designed to increase visibility, and reduce heat exposure.
- Smoke purging: the system is to be designed to enable smoke to be cleared from a building after the fire has been brought under control.
It is necessary to decide which of these, or combination of the three objectives is to be achieved before starting a design of smoke control system.
References:
NFPA 204: “guide for smoke and heat venting”.
NFPA 92B: “Guide for smoke management systems in malls, atria and large areas”.
NBN S-21-208-1:”Protection incendie dans les bâtiments-conception et calcul des installations dé evacuation de fumées et de chaleur.
Tenability conditions
Where zone-based fire growth models are used to predict smoke filing in compartments, the following tenability limits are recommended to identify when life threatening conditions may occur.
Convective heat – the temperature of the relevant gas layer should not exceed 65ºC (time to incapacitation for 30 minutes exposure (Pulser 1988))
Smoke obscuration – the visibility in the relevant layer should not fall to less than 2 m (optical density not greater than 0.5 m-1) (Tewarson 1988)
Toxicity – the following species concentrations lead to incapacitation in approximately 30 minutes (Purser 1988)
- CO: not >1400 ppm (small children incapacitated in half the time)
- HCN: not>80ppm
- O2: not<12%
- CO2: not >5%
The above limits for convective heat, smoke obscuration and toxicity apply to the lower layer if the height of the smoke layer interface above floor level is greater than 1.5 m (the approximate nose height of a standing adult), otherwise the limits apply to the upper layer.
Radiative heat – the radiant flux from the upper layer should not exceed 2.5 KW/m2 at head height (this corresponds to an upper gas layer temperature of approximately 200ºC). Above this, the tolerance time is less than 20 seconds (Purser 1988).
References:
“Fire Protection Handbook” 19th edition - NFPA International.

COST Action TU0904 Integrated Fire Engineering and Response
19
People evacuation
For all spaces in a building, the time taken to evacuate the space must be less than the time for the environment in that space to become life threatening, with a safety factor, so that:
��� . �� � ��
where tev is the calculated evacuation time measured from the ignition
tlt is the time for conditions to become life threatening, again measured from ignition
SF is a safety factor.
The safety factor is required to provide a safety margin between the calculated evacuation time and the time by which occupants must have escaped.
A safety factor of 2 is suggested for able-bodied people to allow for uncertainties in calculating the likely times, difficulties in finding the way and other unforeseen circumstances.
However, today there is computer tools which use lots of information, to calculate more accurate evacuation time, that is why the safety factor can be reduced.
References:
“Occupant behaviour and evacuation” – National Research council Canada.
“Engineering guide to human behaviour in fire” – SFPE.
“Fire Protection Handbook” 19th edition - NFPA International.
Rescue and intervention
Fire departments use personnel with specialized skills who are organized into various operational and staff units who are fully qualified and capable of efficiently performing the wide range of services necessary to protect life and property.
Whatever the circumstances surrounding an incident, perhaps the most important consideration is the preservation and safety of the rescue personnel. An appropriate motto for rescue personnel should be “do not become a victim”. Response organizations should establish a systems safety approach to all rescue operations in order to limit the risk to rescuers, while maintaining a viable and effective response and operational capability
References:
“Fire Protection Handbook” 19th edition - NFPA International.
COST Action TU0904 Integrated Fire Engineering and Response
20
Jose Torero
OBJECTIVES OF FIRE SAFETY
Because fire represents a threat to life, property and the environment, there is a need to control its impact in such a way that life is fully protected, and damage to property and the environment are minimized. Fire Safety is the means by which infrastructure is designed in a manner such that these goals are achieved [1].
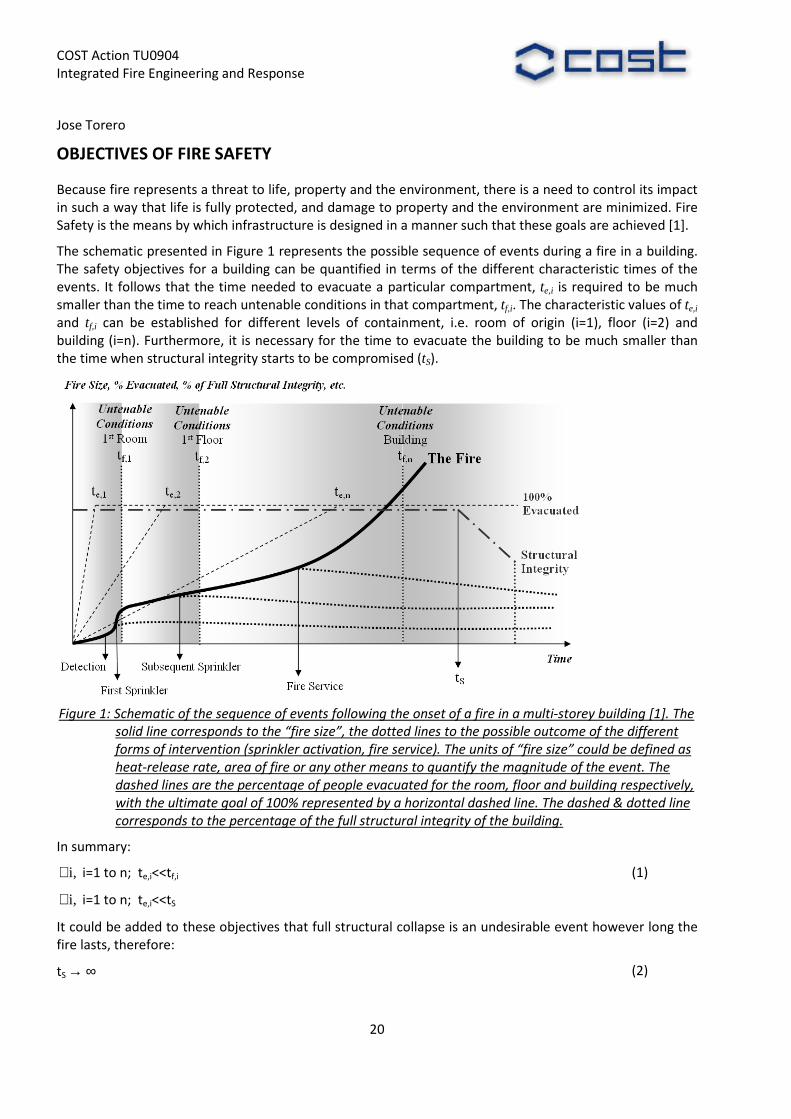
The schematic presented in Figure 1 represents the possible sequence of events during a fire in a building. The safety objectives for a building can be quantified in terms of the different characteristic times of the events. It follows that the time needed to evacuate a particular compartment, te,i is required to be much smaller than the time to reach untenable conditions in that compartment, tf,i. The characteristic values of te,i and tf,i can be established for different levels of containment, i.e. room of origin (i=1), floor (i=2) and building (i=n). Furthermore, it is necessary for the time to evacuate the building to be much smaller than the time when structural integrity starts to be compromised (tS).
Figure 1: Schematic of the sequence of events following the onset of a fire in a multi-storey building [1]. The
solid line corresponds to the “fire size”, the dotted lines to the possible outcome of the different
forms of intervention (sprinkler activation, fire service). The units of “fire size” could be defined as
heat-release rate, area of fire or any other means to quantify the magnitude of the event. The
dashed lines are the percentage of people evacuated for the room, floor and building respectively,
with the ultimate goal of 100% represented by a horizontal dashed line. The dashed & dotted line
corresponds to the percentage of the full structural integrity of the building.
In summary:
,i∀ i=1 to n; te,i<<tf,i (1)
,i∀ i=1 to n; te,i<<tS
It could be added to these objectives that full structural collapse is an undesirable event however long the fire lasts, therefore:
tS → ∞ (2)
COST Action TU0904 Integrated Fire Engineering and Response
21
Although these generalized criteria for safety times are a simplified statement, they describe well the main objectives of a fire safety strategy (Torero 2009).
When designing for fire safety, a number of strategies are put in place aiming at achieving these objectives. These include those factors which are intended to increase tS and tf,i, such as active (e.g. sprinklers, or the intervention of the fire service) and passive systems (eg. fire proofing or compartmentation). As shown by Figure 1 (the dotted lines branching off below the Fire curve) success of these strategies can result in control or suppression of the fire. Passive protection such as thermal insulation of structural elements becomes part of the design, with the purpose of increasing tS. Finally, but most importantly, evacuation protocols and routes are designed to reduce te,i at all stages of the building evacuation. It is important to note that the safe operation of the fire service within these times needs also to be included in the design.
Figure 1 makes clear that Fire Safety is the superposition of three different types of events occurring simultaneously. Two of these events, egress and structural behaviour, are reactive events while the rate of fire growth is the driving process. The structure will be designed and it will respond to the fire. Some passive fire protection systems (detection, alarm) are designed and implemented to warn of the fire, and others are designed to affect the rate of growth (suppression). People within a building are located according to the general use of he premises but will change their behaviour in response to the fire. Occupants will have mostly a passive role, while fire fighters will have an active role attempting to control the growth of the fire.
Building design and fire fighter intervention procedures are defined on the basis of one or more fire growth scenarios. In the case of prescriptive design (codes and standards) the fire growth scenarios are implicit, while in the case of performance-based design (engineering based methods) they are explicitly defined and are referred to as “design fires”. Prescriptive design rules use knowledge on fire dynamics and empirical data to bound the fire growth for the specific conditions of the implied scenarios. Fire safety systems are designed to operate within these bounds and are deemed adequate for a range of building. But given that there are unavoidable and significant differences between buildings, there is a risk of extrapolating codes and standards outside its range of applicability. Therefore, to know the extend of the extrapolation of prescriptive solutions requires understanding the parameters that govern and bound the fire growth scenario. In the case of performance-based design, knowledge on fire dynamics is used to predict fire growth under the particular conditions of the building. Thus the link between fire safety objective and understanding of the physical parameters controlling fire growth is important and explicit.
Basic Definition of Fire Growth
While Figure 1 implies that there is a single variable to quantify fire growth, the reality is that there are many different variables. The variable or variables of interest depend on the objective of the system under design.
At the core of a fire there is a flame or a reaction front that is effectively a combustion process, and thus is governed by the mechanisms and variables controlling combustion. The interaction between the fire and the environment determines the behaviour of the flame and nature of the combustion processes. This is commonly referred to as Fire Dynamics. An extensive introduction to the topic is provided by Drysdale (1998).
As indicated by Drysdale, Fire Dynamics involves a compendium of different sub-processes that start with the initiation of a fire and end with its extinction. The onset of the combustion process, i.e. ignition, in a fire is a complex process that implies not only the initiation of an exothermic reaction but also a degradation process that provides the fuel feeding the fire. In a fire it is common to have different materials involved and given the nature of the fire growth many could be involved simultaneously but others sequentially. The sequence of ignitions of items in an enclosure will affect the nature of the combustion processes. Thus,

COST Action TU0904 Integrated Fire Engineering and Response
22
ignition mechanisms set the dynamics of the fire and also are affected by the fire itself, creating a feedback loop.
Once a material is ignited, the flame propagates over the condensed fuels by transferring sufficient heat to the fuel until a subsequent ignition occurs. This process is commonly referred to as flame spread and is described in detail by Fernandez-Pello and covered in section 5 of this chapter. Flame spread defines the surface area of flammable material that is delivering gaseous fuel to the combustion process. The quantity of fuel produced per unit area is the mass burning rate. The mass burning rate multiplied by the surface area determines the total amount of fuel produced. If the total amount of fuel produced is multiplied by the effective heat of combustion (energy produced by combustion per unit mass of fuel burnt), it yields the heat release rate. The heat release rate is generally considered the single most important variable to describe fire growth (Babrauskas 1992). Given the nature of the environment, the oxygen supply might not be enough to consume all the fuel, thus in many cases combustion is incomplete and therefore the heat of combustion is not a material property but a function of the interactions between the environment and the fire. In these cases it is usually deemed appropriate to calculate the heat release rate as the energy produced per unit mass of oxygen consumed multiplied by the available oxygen supply.
A fire can end when it is extinguished or when oxygen or fuel supplies are depleted (oxygen starvation and burnout respectably). In all cases, extinction of the combustion process is brought by interactions of fuel and oxygen supply and the energy balance that permits the combustion reaction to remain self-sustained. Suppression agents affect a fire by reducing fuel and oxygen supply or by removing heat (ie. disturbing the fire triangle). At each stages of fire growth, it is more or less feasible to affect these three variables. Thus the effectiveness of a suppression system is dictated by its capability to affect the targeted variables at the moment of deployment.
The overview by Torero describes all the above processes in more detail extracting at each stage the main material properties and physical parameters that affect fire growth and how they relate to the fire safety.
References:
JL Torero and G Rein, Physical Parameters Affecting Fire Growth, Chapter 3 in: Fire Retardancy of Polymeric Materials, 2nd Ed, Editors CA Wilkie and AB Morgan, CRC Press, Taylor & Francis, 2009. ISBN 978-1-4200-8399-6.
Williams, F.A., Combustion Theory, Second Edition, The Benjamin/Cummings Publishing Company, Inc., 1985.
Drysdale, D. “An Introduction to Fire Dynamics,” John Wiley and Sons, 2nd Edition, 1998.
G. Cox (Editor), “Combustion Fundamentals of Fire,” Academic press, 1995.
Babrauskas, V. and Grayson, S.J. (Editors), “Heat Release in Fires,”, Elsevier Applied Science, 1992.
COST Action TU0904 Integrated Fire Engineering and Response
23
Markku Heinisuo, [email protected]
REVIEW OF DESIGN FIRES IN BUILDINGS
The definition of fires of assumed characteristics, design fires, is one of the most important steps when considering the fire safety of buildings. Design events are those fires that are expected to occur over the life of the building for which the building is expected to meet its design safety objectives. Design fires are determined as fires that are reasonably expected and which represent the maximum threats that should be mitigated. Fire characterisations have been based on the survey (inventory or web-based questionnaire) of existing buildings, fire tests, mathematical fire modelling or combinations of all these. Normal, lognormal, 3-parameter gamma and Gumbel distributions have been used for the statistics of the data and mean and fractile values from 80 % to 95 % are used to give the design fires. In the most novel European standards the fire load densities (MJ/m2) are given as 80 % fractile values supposing Gumbel distribution. Maximum rates of heat releases are given for different occupancies in the standard, too. In the literature for some cases 95 % fractiles are recommended to be used. In special cases very severe design fires are proposed. In some cases fixed (building’s structures) and movable (building’s combustible contents) fire loads are given separately, in some cases not.
Fire load survey of commercial premises in Finland
Thirty commercial premises were surveyed using the inventory method in the city of Seinäjoki, Finland, during spring 2010. The total floor area was about 28000 m2, the smallest shop was 54 m2 and the largest 4550 m2 + store 800 m2. Fixed fire loads (MJ/m2) were studied separately for floors and for walls/ceilings as well movable fire loads were considered. The movable fire loads were distributed in wood, paper, textiles, plastics and others following similar distributions in the literature. The fire loads varied between 115-1787 MJ/m2. The largest value (1787 MJ/m2) did not include any fixed fire load, only movable loads. The sample
was fitted to lognormal and Gumbel distributions. The χ2 test showed that the lognormal distribution describes the sample little bit better than Gumbel. The 80 % fractile value was 635 MJ/m2 using the lognormal distribution and 623 MJ/m2 using Gumbel. Based on this study and recent French study for similar samples the Eurocode value is proposed to be proper to be used in commercial premises. The fire loads for storages should be calculated based on the stored materials.
References:
Björkman J., Autio V., Grönberg P., Heinisuo M., A paper will be proposed to Prague Fire Conference, April, 2011.
Design fires for fire safety engineering
The report describes an approach to fire characterisation that is based on the concept of fire load entities. Entity means a fundamental ‘unit’ that is describing the initial fire, not only MJ/m2 but also heat release versus time. The initial fires are quantified using heat release rates which are dependent on the usage of the building. Assessment of fire growth and spread is based on the capability of the FDS to make conservative estimations how rapidly and how large a fire may grow within a given space. The report summarises the basics of performance criteria, fire safety engineering process and procedure for estimation of initial fires and fire development. Design fires for different occupancies are described in detail: sports and multipurpose halls, dwellings, warehouses and shops. Key issues concerning timber structures under design fire exposures are described. Comprehensive list of references is included.

COST Action TU0904 Integrated Fire Engineering and Response
24
References:
Hietaniemi J., Mikkola E., Design Fires for Fire Safety Engineering, VTT Working Papers 139, VTT, 2010, 101 pages. ISBN 978-951-38-7479-7 (URL:http://www.vtt.fi/publications/index.jsp), ISSN 1459-7683 (URL:http://www.vtt.fi/publications/index.jsp)
Fire load distributions in the program to prevent fatal events in fire
Preliminary survey of fire loads in residential houses in Finland was done during 2003-2005. Totally 67 houses were surveyed by the students of the Fire Safety College of Finland. Data was collected for three types of buildings (single family houses, bungalow typed houses, block of flats) and for the different use of the rooms. Data was collected for movable and fixed fire loads (MJ/m2), and the fixed loads are given separately for floors, walls and ceilings. Lognormal distribution was used when evaluating the data. A combination of fixed and movable fire load lognormal distributions is proposed. No proposal is given for the design values. This preliminary study is planned to be continued in the near future.
References:
Keski-Rahkonen O., Karhula T., Hostikka S., Palokuormien jakaumat palokuoleman ehkäisykeinojen arviointiohjelmassa, Palotutkimuksen Päivät, 2009, pp. 108-114 (in Finnish).
Fire load survey and statistical analysis
Statistical results based on a survey in 475 rooms including hotel, hospital, shopping centers, offices and industrial buildings are presented. 336 rooms were in Switzerland and in Lichtenstein and 139 rooms in France. Fixed and movable fire loads were observed. Sets of parameters (e.g. based on use of the building) were found using last squares method and a chi-square test. The lognormal was found to give always satisfactory results while Gumbel law can be used if the coefficient of the variation is less than 1.0. Wood was found to be in shopping areas, hotels, offices and hospitals very often the main material for the composition of the fire load. In Swiss production areas 95 % of the fire load densities are lower than 2500 MJ/m2. The mean value is 1080 MJ/m2 and the standard deviation 1920 MJ/m2. For storage areas the same numbers are: 35000 MJ/m2, 11874 MJ/m2 and 32774 MJ/m2. The sample includes one silo with 433710 MJ/m2. Without this the mean is 9806 MJ/m2 and the standard deviation 14055 MJ/m2, twice smaller than before. In French study 26 stores were surveyed, 90 % of fire load densities are in the range 0 – 910 MJ/m2 with the mean and the standard deviation 571 MJ/m2 and 372 MJ/m2. The results are compared to the Eurocode values.
References:
Thauvoye C., Zhao B., Klein J., Fontana M., Fire Loa Survey and Statistical Analysis, Fire Safety Science – Proceedings of the Ninth International Symposium, 2008, pp. 991-1002.
Fire load survey of historic buildings: A case study
The results of a fire load density survey carried out in Ouro Preto, Brazil, are presented. The survey covered 43 historic baroque buildings, some of which were built in the latter part of the 17th century. The buildings were divided in a variety of occupancies, with residences and commercial stores being most frequent. The inventory method was used with all buildings, which were researched for their fixed and movable combustible contents. The average fire load density was 2989 MJ/m2 with the standard deviation 2833 MJ/m2. In a drugstore a single maximum density of 14,560 MJ/m2 was found. Wood contributes a substantial portion of fire load, being 35 % of movable load and 37 % of fixed fire load. The measured values could exceed Brazilian standard NBR 14432 values by up to a factor of 10. In the paper is listed four main reasons why these kinds of buildings are particularly vulnerable to fires.
COST Action TU0904 Integrated Fire Engineering and Response
25
References:
Claret A., Andrade A., Fire Load Survey of Historic Buildings: A Case Study, Journal of Fire Protection Engineering, Vol. 17-May 2007, pp- 103-112. (http://jfe.sagepub.com/gci/content/abstract/17/2/103)
Determining design fires for design-level and extreme events
Difference between design level and extreme events is clearly stated in the paper. As an example design winds for buildings do not cover hurricane winds. Tornados are considered extreme events against which buildings are not expected to perform. History of fire load surveys starting at Ingberg 1928 is briefly referred. Fire load (MJ/m2) representations using 90 % or 95 % fractile values are recommended. Problems to define the design fire loads are outlined based on: spread of fire, ventilation of the building, the existence of active and passive fire protection features and finally: fire is a stochastic event that is highly dependent on the conditional probabilities on mitigating factors, planned or unplanned. Finally: It is
possible to conduct extreme events analysis in a way that meets the growing need for risk informed
regulation.
References:
Burkowski R., Determining Design Fires for Design-level and Extreme Events, SFPE 6th International Conference on Performance-Based Codes and Fire Safety Methods, June 14-16, 2006, Tokyo, 11 pages.
Medium-scale fire experiments of commercial premises
The report presents and discusses the results of a fire load survey and a set of medium-scale fire experiments to determine the burning characteristics of combustibles in commercial premises. The inventory method was used in 2003 in the Canadian cities of Ottawa and Gatineau for 168 commercial premises. The results simulate the fuel loads found in the different shops. Fuel packages consisting of high plastic, rubber and edible-oil content attained high peak heat release rates (1,300 to 1,950 kW) an exhibited fast fire growth and significant smoke production (0.96 to 2.74 OD/m). The paper also presents the test of the fuel packages simulating a fast food shop. The results show that the fire reached a peak heat release rate of about 1562 kW at 6.5 minutes from inginition, and a peak gas temperature of 735 oC in the hot layer. The fire load densities of all 168 stores surveyed have lognormal distribution with a mean of 747 MJ/m2 and a standard deviation 833 MJ/m2, indicating significant spread, as can be expected. 95 % fractile value is 2,050 MJ/m2 for all cases. For shoe stores (3 samples) and for general stores (43 samples) 95 % fractile values 4,612 and 4,289 MJ/m2 are given, respectively. The measured total HR values for clothing storage and fast food tests show excellent agreement with the results of the survey.
References:
Zalok E., Bwalya A., Hadjisopocleous G., Medium-scale fire experiments of commercial premises, NRCC-45397, A version of this document is published in: 2005 Fire and Material Conference, San Francisco, Jan. 31-Feb.2, 2005, pp. 1-12. (http://irc.nrc-cnrc.gc.ca/ircpubs)
A pilot survey of fire loads in Canadian homes
The report presents the results of a pilot survey of movable loads in residential living rooms located on the main floor and basement levels. The survey was conducted using a web-based questionnaire. The survey attracted 74 respondents. The efficacy of the survey methodology is discussed, and the main combustible furniture is identified. The main floor furniture was found to be similar but basements contained a greater variety of furniture. The values of fire load densities calculated using estimated weights of furniture were
COST Action TU0904 Integrated Fire Engineering and Response
26
within the range of values found in the literature. The results are given as mean values (in 74 homes) for main floor and basement living rooms (500-600 MJ/m2) and they are compared to US (200 and 70 rooms) and Japanese (214 rooms) survey results and to building code values in New Zealand (400-1200 MJ/m2) and Sweden (600 MJ/m2).
References:
Bwalya A., Sultan M., Benichou N., A Pilot Survey of Fire Loads in Canadian Homes, IRC-RR-159, NRC, March 9, 2004, 24 pages.
Literature review on design fires
The main parameters affecting fire development in small rooms are identified, together with the methods for characterizing design fires for pre-flashover and post-flashover stages. Numerous combustion data, from the fire tests involving real and mock-up furniture, from various laboratories around the world, was found. Large variations in furniture designs and materials as well in fire loads published during last two decades were found. The most important observation was an absence of fire load data for residential and commercial occupancies in Canada.
References:
Bwalya A., Benichou N., Sultan M., Literature Review on Design Fires, IRC-RR-137, NRC Publications Archive (NRArC), June 25, 2003, 31 pages. (http://nparc.cisti-icist.nrc-cnrc.gc.ca/npsi/ctrl?lang=en)
Fire loads in office buildings
Fire load survey of 100 offices is given. More than 1500 office rooms are considered. The distribution of fire load density found as a main result of the study. The mean of fire load per floor area seemed to be approximatively the same as in some other studies, 1000 MJ/m2. The maximum rates of heat releases in different types of rooms were calculated as well as the worst realistic fire situations in some open plan offices and atria. Extreme value distribution was the best estimation to the distributions of fire load density, maximum rate of heat release, the amount of paper and the amount of machinery in fire load. This work has given a representative view of fire loads in Finnish offices, and allows a reliable foundation to performance-based fire safety design.
References:
Korpela K., Fire loads in office buildings, Master’s Thesis, Department of Civil and Environmental Engineering, Helsinki University of Technology, Espoo, 1999, 84 + 115 pages (in Finnish).
Fire load in residential buildings
The results of a fire load survey carried out in Kanpur, India are presented. Thirty-five residential buildings with a total floor area of 4256.6 m2 were surveyed. The inventory method was used. The results show that the maximum and mean fire loads decrease with increase in floor area up to 16 m2, but thereafter it shows no variation with further increase in floor area. The results show no relationship between load magnitude and building height (up to three floors). The mean loads varied from 278 MJ/m2 to 852 MJ/m2 with an overall average of 487 MJ/m2. The standard deviation of fire load ranged from 87 MJ/m2 to 621 MJ/m2 with an average of 255 MJ/m2. A single maximum fire load of 2174 MJ/m2 was encountered in a storeroom. The storeroom and kitchen were found to be most heavily loaded. The fire loads contributed by the fixed load and the movable load are 52.66 and 47.34 %, respectively. The reduction in use of timber in structural and non-structural members may reduce the fire loading considerably, is given as a summary.
COST Action TU0904 Integrated Fire Engineering and Response
27
References:
Kumar S., Rao C., Fire Loads in Residential Buildings, Building and Environment, Vol 30, No 2, 1995, pp. 299-305.
Fire loads in apartments of block of flats
Survey of fire loads in 62 apartments in Finnish block of flats built during 1966 is reported. No differencies in fire loads were found between apartment types. The movable fire load parts were in entire apartments 60 %, in living rooms 85 %, in bed rooms 64 % and in kitchens 13 %. The data of this research has been recalculated (VTT, Tutkimusselostus NRO RTE1461/05) and Gumbel distribution is used for the data. After raising the results about 30 % the result was that the mean of the fire load for the entire apartment is 509 MJ/m2 and 80 % fractile 575 MJ/m2. The values for the movable fire loads are 321 and 390 MJ/m2, respectively. The results are compared to the values of Eurocode for the entire apartment (780, 948 MJ/m2) and to US studies (Cambell J., Confinement of Fire in Buildings. Fire Protection Handbook. NFPA Handbook, USA, 1981, 320, 425 MJ/m2) and to a Canadian study for living rooms (Bwalya A., An extended survey of combustible contents in danadian residential living rooms. Ottawa, Canada: National research Council Canada. Research Report No. 176, 2004, 445, 565 MJ/m2).
References:
Holm C., Oksanen P., Palokuorman määrä kerrostalojen asuinhuoneistoissa. Palontorjuntatekniikka. Nro 2, 1970. pp. 1-4 (in Finnish).
COST Action TU0904 Integrated Fire Engineering and Response
28
Florian Block, [email protected]
DESIGN FIRES: PERFORMANCE-BASED DESIGN IN FIRE AND STRUCTURES
Fires can occur in almost any location of a building and of any severity through out the life-span of a building. It is therefore impossible to consider every fire, which may occur, during the design stage of a project. This makes choosing the worst case realistic design fire scenarios probably the largest challenge in a performance-based fire design. No definite answers but only guidance can be given to the design engineers as every building will have its unique features and usages, which need to be considered. Therefore the below shall help the designers but cannot replace experiences and thorough engineering judgment and sensitivity analyses in selecting the appropriate design fire scenarios.
Once the design fire scenarios are selected the characteristics of the design fires have to be determined. The design fires can be based on simple equations, parametric fires, zone models, Computational Fluid Dynamics simulations or experimental fire data.
Finally, the heat transfer from the fire to the structural members is an important and often overlooked step in structural fire engineering. The heat transfer becomes particularly important in the cases of localised fires rather than fully developed compartment fires.
Design Fire Scenarios
Design fire scenarios should be chosen in a way that each aspect of fire safety is tested thoroughly. The design fire scenarios should include different locations and types of fire to create a worst case, but still realistic, condition for whatever part of fire safety is assessed.
The International Fire Engineering Guidelines suggests in Chapter 1.2.11 a two stage approach for the selection of the design fire scenarios. The first step is to determine the potential fire scenarios, which will take into account factors such as:
- The nature, quantity, arrangement and burning behaviour of combustibles in each enclosure.
- Enclosure geometry
- Number of enclosures and their relationship
- Connection between enclosures
- The fire protection measures in the building and their effect on the fire.
The second step is then to select the worst case realistic design fire scenarios, which will be analysed, from the list of possible fire scenarios. “Usually, a number of severe scenarios which have a reasonable
probability of occurrence and significant potential for loss (life, property, etc.) are selected for analysis. Care
and judgement should be used to avoid unnecessarily analysing events with a very low probability of
occurrence, but where the scenario may have vey high adverse consequences, due consideration should be
given if not in the primary analysis at least in the sensitivity studies.”
NFPA 5000-09 Section 5.5 gives a good overview of the selection of design fire scenarios and provides a number of “required” design fire scenarios designed to test and challenge the fire safety of a building. It is the opinion of the author that not all of the “required” design fire scenarios given in NFPA 5000 have to be analysed in detail but that by using a Qualitative Risk Assessment the relevant scenarios for the building in hand can be selected.
BS7974 and PD7974 Part 0 also give a good introduction to the process of determining the appropriate design fire scenarios.

COST Action TU0904 Integrated Fire Engineering and Response
29
The different scenarios should also consider that individual parts of the fire safety systems are not working in during a fire (i.e. sprinkler systems not activating, smoke extract not activating). Which and how many of the systems are assumed to not activating is a function of the reliability of the system and the consequences caused by the system failure.
References:
Australian Government, State and Territories of Australia, 2005, International Fire Engineering Guidelines - Edition 2005, ISBN 1 74161 456 2.
National Fire Protection Association, 2008, NFPA 5000- Building Construction and Safety Code – Edition 2009.
British Standards Institution, 2001, Application of fire safety engineering principles to the design of buildings – Code of Practice, ISBN 0 58038 447 0.
British Standards Institution, 2002, Application of fire safety engineering principles to the design of buildings – Part 0: Guide to design framework and fire safety engineering procedures, ISBN 0 580 40 169 3.
Design Fires
After the design fire scenarios have been decided the next challenge is to determine the appropriate design fires. A design fire is a simplified but still representative description of the complex physical and chemical processes occurring in a fire. Design fires can either be constant over time, called steady-state fires, or changing with time, called transient fires. Design fires can be split into two different types namely compartment fires and localised fires. A third relatively newly described type of design fire is a so called travelling fire. Design fires are normally described as either the heat release rate versus time (localised fires) or the gas temperature versus time (compartment fires).
For compartment fires in normal buildings EN1991-1-2 gives the Standard Fire Curve, t2-fires and the parametric fire curves, which consider the fire load density, the ventilation conditions and the thermal properties of the compartment boundaries. The parametric fire curves also include the cooling phase of a fire. Recently, alterative parametric fire curves have been published in Germany and will be implemented into the German National Annex as replacement of the parametric fire curves in Annex A EN1991-1-2.
For a more complex description of compartment fires, multi-zone fires can be used to calculate the gas temperatures. A number of zone models have been programmed and are available via the internet. The most commonly used ones are CFAST and OZONE. However, when zone models are used for the design of structural elements the effects of the radiation from the fire to the structure should be considered additionally to the results of the zone models, which normally only give the gas temperature of the smoke layer.
The most complex way of fire modelling is the use of computational fluids dynamics with a combustion model. However, due to the complexity of this type of analysis it is not discussed further in this contribution. Nevertheless, the author would like to note that that CFD analysis should be used very carefully, when used in fire safety design and sufficient sensitivity studies should be undertaken to ensure a robust solution. A recent Round-Robin study on the Dalmarnock fire test demonstrated the large scatter and the unreliability of CFD in the prediction of a compartment fire. However, CFD modelling is frequently used to determine the spread of smoke in large spaces and atria.
For all design fires representing a compartment fire it is important that different ventilation conditions are taken into account to consider the effects of windows breaking during the fire.
The second group of fires considered here are localised fires. They range from sprinkler controlled fires over fires in large open spaces to external fires and are also called pre-flashover fires if they occur in an
COST Action TU0904 Integrated Fire Engineering and Response
30
enclosure. If the conditions are right flashover could occur and a localised fire could develop into a compartment fire.
Localised fires have been subject to significant amounts of research and design equations have been developed. Localised fires are typically described by a heat release rate (HRR), a fire base area, a perimeter or shape of fire base, a flame height, a flame temperature, which is changing along the length of the flame and a radiative fraction. Some of the parameters of a localised fire need to be selected based on what is expected to burn and other can be calculated. The relevant equations can be found amongst other places in PD7974 Part 1, the SFPE Handbook 3rd Edition Chapter 02-01 and 02-02 or in An Introduction to Fire
Dynamics by Dougal Drysdale.
As input data for the calculation of a localised fire it is possible to use experimental fire data of a similar fire scenario possible in the building of consideration. Experimental fire data should always be used in combination with a safety factor. There is a considerable amount of fire test data available for individual items tested in cone calorificmeters as well as whole room assemblies and cars. Some of this data can be found in the on the NIST webpage on fire, the BRE Design fire database or the SFPE Handbook 3rd Edition Chapter 03-01. Furthermore, BRE368 gives design fires for smoke control systems.
In a building fitted with an automatic sprinkler system the most common fire will be a sprinkler controlled fire due to the high reliability of sprinklers. In most cases a fire would be suppressed or even extinguished by a sprinkler system. However, a conservative assumption is that the sprinklers would only control the fire spread beyond the item of fire origin. The heat release rate versus time curve for such a sprinkler controlled design fire can be represented based on a t2-fire, the fire load density, the heat release rate per unit area, the assumption that if 70% of the fire are consumed the decay phase of a fire starts and finally a tool to predict the activation and response time of the sprinkler system. The data is all available from EN1991-1-2 and as a sprinkler activation tool the FPE-tool developed by NIST can be used, which gives the maximum HRR of the sprinkler controlled fire. When the sprinkler activation time is calculated it should be based on the activation of the 5th sprinkler head.
The last type of design fires is a travelling fire. This type of fire could occur in a large compartment commonly used in open plane office environments. The compartment is too large for a codition right for a flashover to develop and so the fire remains a localised fire which is moving throughout the entire compartment with different speeds and areas engulfed at the same time depending on how much fire load is available and how fast the fire load is consumed. Such a fire could be a critical design case for the structure as the heating and cooling of the structures occurs at the same time relatively close to each other.
A good summary of design fires and a lot of other very useful information for structural fire engineering can be found on the One-Stop-Shop webpage developed by the University of Manchester.
References:
European Committee for Standardisation, EN1991-1-2: 2002. Eurocode 1: Actions on structures: Part 1-2: General Actions - Actions on structures exposed to fire.
Zehfuss, J.; Hosser, D. A parametric natural fire model for the structural fire design of multi-storey buildings, Fire Safety Journal 42 (2007) 115 – 126.
Zehfuss, J.; Hosser, D. Vereinfachtes Naturbrandmodell für die Brandschutzbemessung von Bauteilen und Tragwerken. Bauphysik 27 (2005), Heft 2, S. 79-86.
http://cfast.nist.gov/
http://www.argenco.ulg.ac.be/logiciel_EN.php
G. Rein, J.L. Torero, W. Jahn, et al., Round-Robin Study of a priori Modelling Predictions of The Dalmarnock Fire Test One, Fire Safety Journal 44 (4), pp. 590-602.

COST Action TU0904 Integrated Fire Engineering and Response
31
British Standards Institution, 2003, Application of fire safety engineering principles to the design of buildings – Part 1: Initiation and development of fire within the enclosure origin (Sub-system 1), ISBN 0 58041 195 8.
The SFPE Handbook of Fire Protection Engineering, Third Edition, NFPA, 2002, ISBN 0 87765 451 4.
Drysdale, D., An introduction to Fire dynamics, 2nd edition, John Wiley & Sons Ltd. 1998, ISBN 0 47197 290 8.
http://www.fire.nist.gov/fire/
http://projects.bre.co.uk/frsdiv/designfires/
BR 368, Design Methodologies for Smoke and Heat Exhaust Ventilation’, Building Research Establishment, 1999.
http://www.bfrl.nist.gov/866/fmabbs.html
http://www.mace.manchester.ac.uk/project/research/structures/strucfire/Design/performance/freModelling/default.htm
Jamie Stern-Gottfried, J., Law, A., Rein, G., Gillie, M. and Torero, J.L., 2010, A Performance-based
Methodology Using Travelling Fires for Structural Analysis, Proceedings from the 8th Conference on Performance-Based Codes and Fire Safety Design Methods
Heat transfer from fire to structure
The transfer of heat from a fire, a plume or a smoke layer to an object is dominated by radiation and convection. A list of useful references on this topic is given below:
References:
SFPE Handbook 3rd Edition Chapter 01-03 and 01-04
Sparrow, E.M., & Cess, R.D., Radiation Heat Transfer, 1978.
A CATALOG OF RADIATION HEAT TRANSFER CONFIGURATION FACTORS (http://www.me.utexas.edu/~howell/tablecon.html#C2)
TNO Methods for the calculation of physical effects – due to releases of hazardous materials (liquids and gases) 3rd Edition – Chapter 6
SFPE Standard on Calculating Fire Exposures to Structures (http://www.sfpe.org/Technical/Committees/FireExposures.aspx)
COST Action TU0904 Integrated Fire Engineering and Response
32
Jochen Zehfuss, HHPberlin fire safety engineers, Hamburg, Germany, [email protected]
PROCEDURAL METHOD OF APPLICATION OF ENGINEERING METHODS IN GERMANY
Introduction
Germany is a federal state with 16 federal states, called “Bundesländer”. As the building law is regulated by the federal states there are 16 different building codes in Germany.
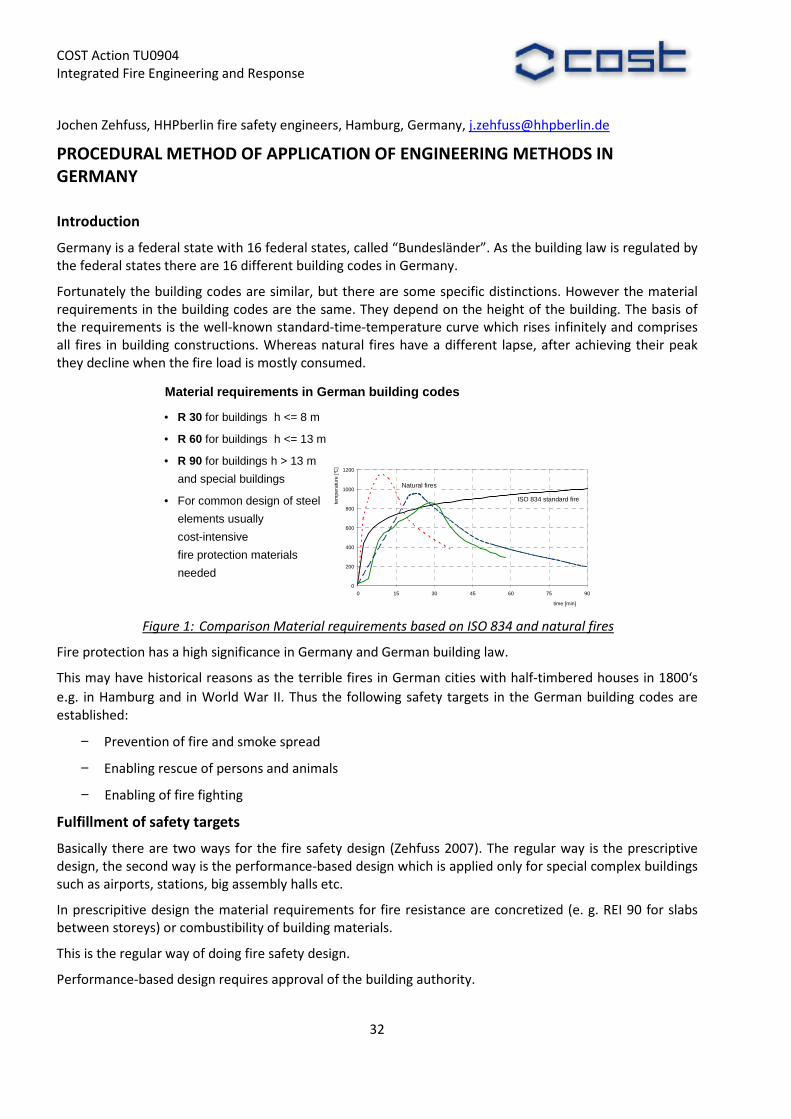
Fortunately the building codes are similar, but there are some specific distinctions. However the material requirements in the building codes are the same. They depend on the height of the building. The basis of the requirements is the well-known standard-time-temperature curve which rises infinitely and comprises all fires in building constructions. Whereas natural fires have a different lapse, after achieving their peak they decline when the fire load is mostly consumed.
Figure 1: Comparison Material requirements based on ISO 834 and natural fires
Fire protection has a high significance in Germany and German building law.
This may have historical reasons as the terrible fires in German cities with half-timbered houses in 1800‘s
e.g. in Hamburg and in World War II. Thus the following safety targets in the German building codes are established:
− Prevention of fire and smoke spread
− Enabling rescue of persons and animals
− Enabling of fire fighting
Fulfillment of safety targets
Basically there are two ways for the fire safety design (Zehfuss 2007). The regular way is the prescriptive design, the second way is the performance-based design which is applied only for special complex buildings such as airports, stations, big assembly halls etc.
In prescripitive design the material requirements for fire resistance are concretized (e. g. REI 90 for slabs between storeys) or combustibility of building materials.
This is the regular way of doing fire safety design.
Performance-based design requires approval of the building authority.
• R 30 for buildings h <= 8 m
• R 60 for buildings h <= 13 m
• R 90 for buildings h > 13 m
and special buildings
• For common design of steel
elements usually
cost-intensive
fire protection materials
needed
Material requirements in German building codes
0
200
400
600
800
1000
1200
0 15 30 45 60 75 90
time [min]
tem
pera
ture
[°C
]
ISO 834 standard fire
Natural fires
COST Action TU0904 Integrated Fire Engineering and Response
33
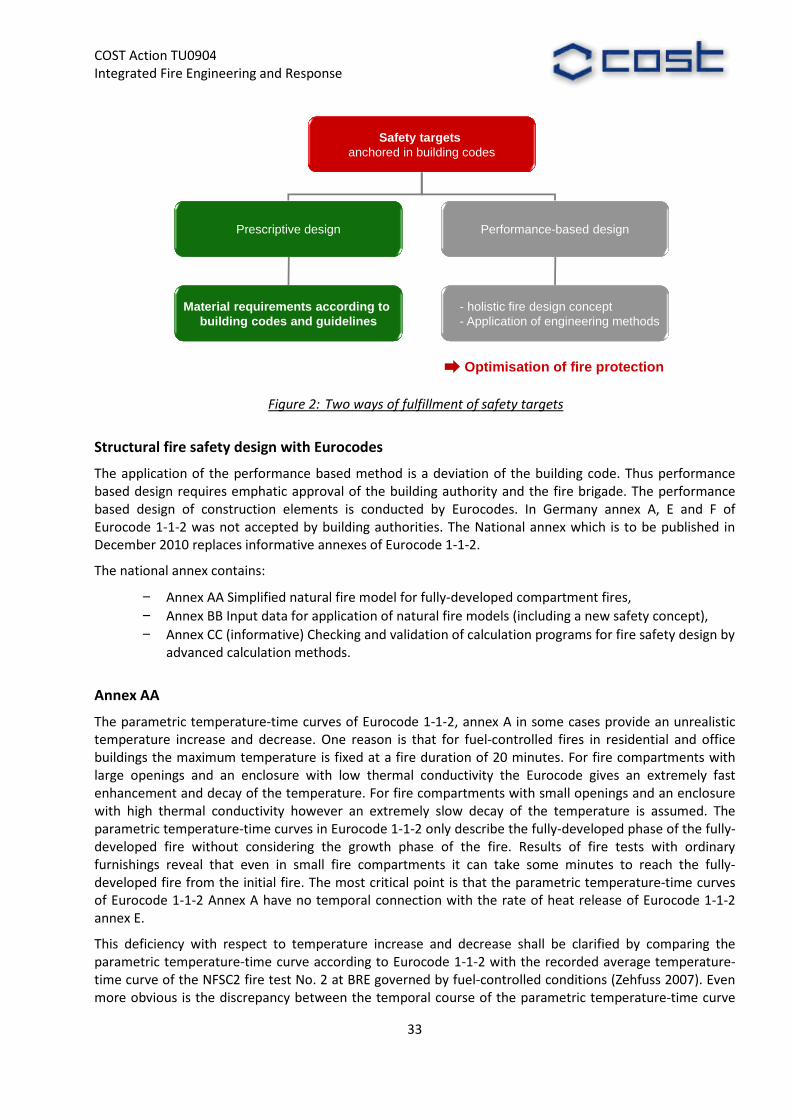
Figure 2: Two ways of fulfillment of safety targets
Structural fire safety design with Eurocodes
The application of the performance based method is a deviation of the building code. Thus performance based design requires emphatic approval of the building authority and the fire brigade. The performance based design of construction elements is conducted by Eurocodes. In Germany annex A, E and F of Eurocode 1-1-2 was not accepted by building authorities. The National annex which is to be published in December 2010 replaces informative annexes of Eurocode 1-1-2.
The national annex contains:
− Annex AA Simplified natural fire model for fully-developed compartment fires,
− Annex BB Input data for application of natural fire models (including a new safety concept),
− Annex CC (informative) Checking and validation of calculation programs for fire safety design by advanced calculation methods.
Annex AA
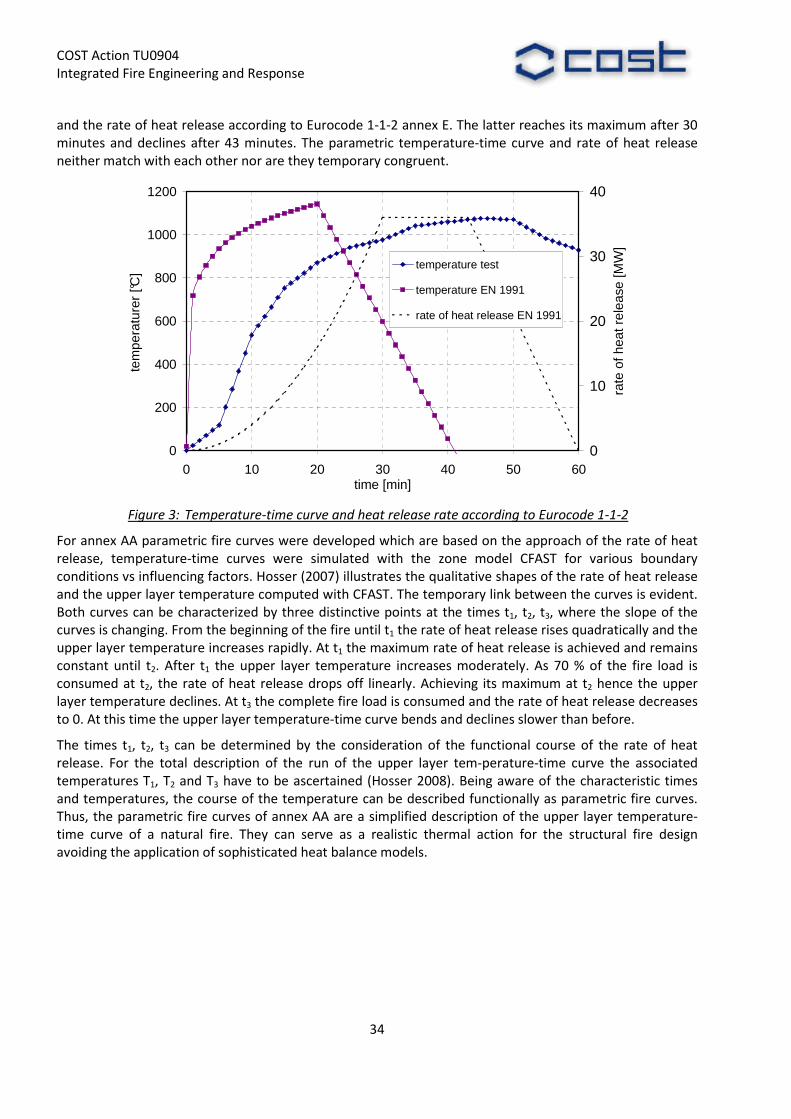
The parametric temperature-time curves of Eurocode 1-1-2, annex A in some cases provide an unrealistic temperature increase and decrease. One reason is that for fuel-controlled fires in residential and office buildings the maximum temperature is fixed at a fire duration of 20 minutes. For fire compartments with large openings and an enclosure with low thermal conductivity the Eurocode gives an extremely fast enhancement and decay of the temperature. For fire compartments with small openings and an enclosure with high thermal conductivity however an extremely slow decay of the temperature is assumed. The parametric temperature-time curves in Eurocode 1-1-2 only describe the fully-developed phase of the fully-developed fire without considering the growth phase of the fire. Results of fire tests with ordinary furnishings reveal that even in small fire compartments it can take some minutes to reach the fully-developed fire from the initial fire. The most critical point is that the parametric temperature-time curves of Eurocode 1-1-2 Annex A have no temporal connection with the rate of heat release of Eurocode 1-1-2 annex E.
This deficiency with respect to temperature increase and decrease shall be clarified by comparing the parametric temperature-time curve according to Eurocode 1-1-2 with the recorded average temperature-time curve of the NFSC2 fire test No. 2 at BRE governed by fuel-controlled conditions (Zehfuss 2007). Even more obvious is the discrepancy between the temporal course of the parametric temperature-time curve
Safety targetsanchored in building codes
Prescriptive design Performance-based design
Material requirements according tobuilding codes and guidelines
- holistic fire design concept- Application of engineering methods
Optimisation of fire protection
COST Action TU0904 Integrated Fire Engineering and Response
34
and the rate of heat release according to Eurocode 1-1-2 annex E. The latter reaches its maximum after 30 minutes and declines after 43 minutes. The parametric temperature-time curve and rate of heat release neither match with each other nor are they temporary congruent.
Figure 3: Temperature-time curve and heat release rate according to Eurocode 1-1-2
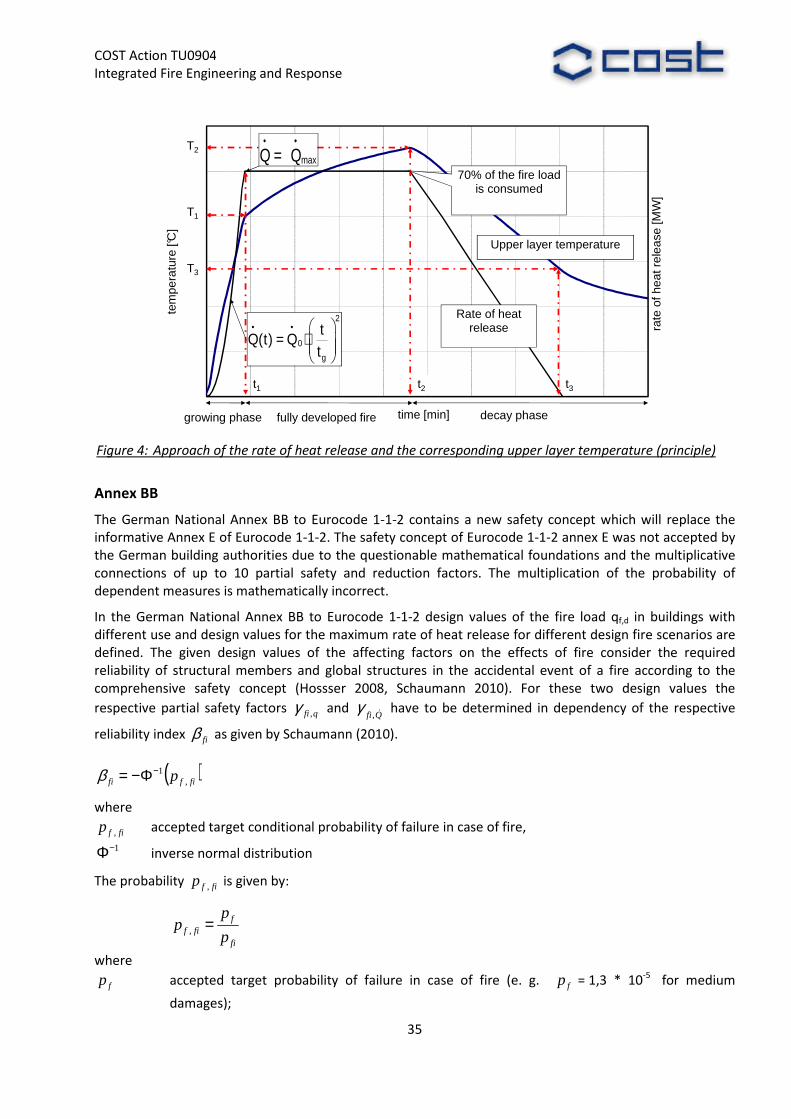
For annex AA parametric fire curves were developed which are based on the approach of the rate of heat release, temperature-time curves were simulated with the zone model CFAST for various boundary conditions vs influencing factors. Hosser (2007) illustrates the qualitative shapes of the rate of heat release and the upper layer temperature computed with CFAST. The temporary link between the curves is evident. Both curves can be characterized by three distinctive points at the times t1, t2, t3, where the slope of the curves is changing. From the beginning of the fire until t1 the rate of heat release rises quadratically and the upper layer temperature increases rapidly. At t1 the maximum rate of heat release is achieved and remains constant until t2. After t1 the upper layer temperature increases moderately. As 70 % of the fire load is consumed at t2, the rate of heat release drops off linearly. Achieving its maximum at t2 hence the upper layer temperature declines. At t3 the complete fire load is consumed and the rate of heat release decreases to 0. At this time the upper layer temperature-time curve bends and declines slower than before.
The times t1, t2, t3 can be determined by the consideration of the functional course of the rate of heat release. For the total description of the run of the upper layer tem-perature-time curve the associated temperatures T1, T2 and T3 have to be ascertained (Hosser 2008). Being aware of the characteristic times and temperatures, the course of the temperature can be described functionally as parametric fire curves. Thus, the parametric fire curves of annex AA are a simplified description of the upper layer temperature-time curve of a natural fire. They can serve as a realistic thermal action for the structural fire design avoiding the application of sophisticated heat balance models.
0
200
400
600
800
1000
1200
0 10 20 30 40 50 60time [min]
tem
pera
ture
r [°C
]
0
10
20
30
40
rate
of h
eat r
elea
se [M
W]
temperature test
temperature EN 1991
rate of heat release EN 1991
COST Action TU0904 Integrated Fire Engineering and Response
35
Figure 4: Approach of the rate of heat release and the corresponding upper layer temperature (principle)
Annex BB
The German National Annex BB to Eurocode 1-1-2 contains a new safety concept which will replace the informative Annex E of Eurocode 1-1-2. The safety concept of Eurocode 1-1-2 annex E was not accepted by the German building authorities due to the questionable mathematical foundations and the multiplicative connections of up to 10 partial safety and reduction factors. The multiplication of the probability of dependent measures is mathematically incorrect.
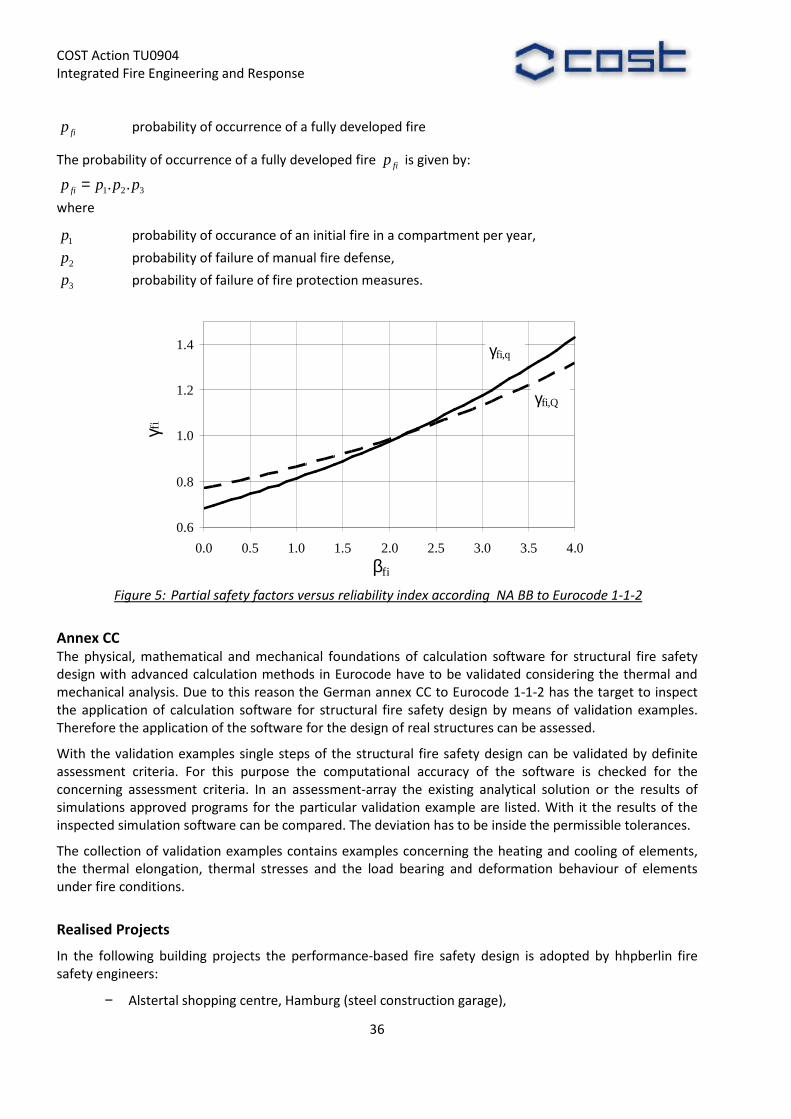
In the German National Annex BB to Eurocode 1-1-2 design values of the fire load qf,d in buildings with different use and design values for the maximum rate of heat release for different design fire scenarios are defined. The given design values of the affecting factors on the effects of fire consider the required reliability of structural members and global structures in the accidental event of a fire according to the comprehensive safety concept (Hossser 2008, Schaumann 2010). For these two design values the
respective partial safety factors qfi ,γ and Qfi &,
γ have to be determined in dependency of the respective
reliability index fiβ as given by Schaumann (2010).
( )fiffi p ,1−Φ−=β
where
fifp , accepted target conditional probability of failure in case of fire,
1−Φ inverse normal distribution
The probability fifp , is given by:
fi
ffif p
pp =,
where
fp accepted target probability of failure in case of fire (e. g. fp = 1,3 * 10-5 for medium
damages);
rate
of h
eat r
elea
se [M
W]
tem
pera
ture
[°C
]
time [min]
t2
T2
70% of the fire load is consumed
Upper layer temperature
Rate of heat release• •
= ⋅
2
0
g
tQ(t) Q
t
• •= maxQ Q
t3t1
T1
T3
growing phase fully developed fire decay phase
COST Action TU0904 Integrated Fire Engineering and Response
36
fip probability of occurrence of a fully developed fire
The probability of occurrence of a fully developed fire fip is given by:
321 .. pppp fi =
where
1p probability of occurance of an initial fire in a compartment per year,
2p probability of failure of manual fire defense,
3p probability of failure of fire protection measures.
Figure 5: Partial safety factors versus reliability index according NA BB to Eurocode 1-1-2
Annex CC The physical, mathematical and mechanical foundations of calculation software for structural fire safety design with advanced calculation methods in Eurocode have to be validated considering the thermal and mechanical analysis. Due to this reason the German annex CC to Eurocode 1-1-2 has the target to inspect the application of calculation software for structural fire safety design by means of validation examples. Therefore the application of the software for the design of real structures can be assessed.
With the validation examples single steps of the structural fire safety design can be validated by definite assessment criteria. For this purpose the computational accuracy of the software is checked for the concerning assessment criteria. In an assessment-array the existing analytical solution or the results of simulations approved programs for the particular validation example are listed. With it the results of the inspected simulation software can be compared. The deviation has to be inside the permissible tolerances.
The collection of validation examples contains examples concerning the heating and cooling of elements, the thermal elongation, thermal stresses and the load bearing and deformation behaviour of elements under fire conditions.
Realised Projects
In the following building projects the performance-based fire safety design is adopted by hhpberlin fire safety engineers:
− Alstertal shopping centre, Hamburg (steel construction garage),
0.6
0.8
1.0
1.2
1.4
0.0 0.5 1.0 1.5 2.0 2.5 3.0 3.5 4.0
βfi
γfi
γfi,q
γfi,Q
COST Action TU0904 Integrated Fire Engineering and Response
37
− Berlin Central station (steel construction)
− Eurobahnhof, Saarbrücken (existing reinforced concrete slabs),
− National Convention Centre, Hanoi (steel construction),
− Willy Brandt International Airport Berlin (steel construction),
− Frankfurt/M International Airport (prestressed concrete beams),
− Volksbank Arena, Hamburg (steel construction),
− Balastas Dambs Property high rise tower Riga (facade construction),
− Headquarter adidas, Herzogenaurach (steel construction),
− Ostkreuz station, Berlin (steel construction).
Summary
In this contribution the fire design practice in Germany for performance-based structural fire safety design is described which is conducted by the Eurocodes and the national annexis. In the German national annex to Eurocode 1-1-2 a new simplified natural fire model (parametric fire curves), a new safety concept and validation examples for simulation software are published with which structural fire safety design on an adequate safety level can be achieved.
References:
Zehfuss, J.; Hosser, D.: A parametric natural fire model for the structural fire design of multi-storey buildings. Fire Safety Journal 42 (2007) 115-126.
Zehfuss, J.; Hosser, D.: Vereinfachtes Naturbrandmodell für die Brandschutzbemessung von Bauteilen und Tragwerken. Bauphysik 27 (2005), Heft 2, S. 79-86 (in German)
Hosser, D., Weilert, A., Klinzmann, C., Schnetgöke, R.: Development of a safety concept for fire safety design applying engineering methods acc. to Eurocode 1 Part 1-2 (Erarbeitung eines Sicherheitskonzeptes für die brandschutztechnische Bemessung unter Anwendung von Ingenieurmethoden gemäß Eurocode 1 Teil 1-2). Final report DIBt-research project ZP 52-5-4.168-1239/07. iBMB, TU Braunschweig, June 2008 (in German)
Schaumann, P.; Sothmann, J.; Albrecht, C: Safety concept for structural fire design – application and validation in steel and composite construction. Proceedings of the 11th International Symposium on Fire Protection at Leipzig. vfdb (Verein zur Förderung des Deutschen Brandschutzes e.V., German Fire Protection Association), 2010.

COST Action TU0904 Integrated Fire Engineering and Response
38
Guillermo Rein and Jamie Stern-Gottfried, [email protected]
TRAVELLING FIRES IN LARGE COMPARTMENTS
Close Inspection of real fires in large, open compartments reveals that they do not burn simultaneously throughout the whole compartment. Instead, these fires tend to move as flames spread, partitions or false ceilings break, and ventilation changes through glazing failure. These fires have been labelled ‘travelling fires’ and represent a new understanding of fire behaviour in modern building layouts.
Despite these observations, fire scenarios currently used for the structural fire design of modern buildings are based on traditional methods that come from the extrapolation of existing fire test data. Most of this data stems from tests performed in small compartments that are almost cubic in nature. This test geometry allows for good mixing of the fire gases and thus for a uniform temperature distribution throughout the compartment [4].
While this behaviour is different from that observed in real fires, it has generally been deemed a conservative, and therefore appropriate, approach for structural fire design, in the absence of better and more relevant data. However, although this approach might be considered acceptable for most design cases, the need for better optimisation of structural behaviour in fire will eventually require a more realistic definition of the fire.
Computational methods for determining structural behaviour have matured over the last decade and have enabled analysis of more complex structural systems. This has led to an understanding that many modern structures do not behave in the same manner as simpler, more traditional frame based systems. In order to address these differences, and continue to enable innovation in structural design, a more sophisticated characterisation of fire scenarios is required.
This article describes a new methodology to produce detailed fire scenarios accounting for travelling fires that are consistent with the requirements of analysis of modern structural systems and contemporary architectural features.
It is important to understand the context of the current design methods to establish this new methodology. Traditionally, structural fire analysis has been based on one of two methods for characterising the fire environment:
the standard temperature-time curve (as specified by various standards, such as BS 476: Fire tests on building materials and structures, ISO 834: Fire resistance tests – Elements of building construction, and ASTM E119: Standard test methods for fire tests of building construction and materials)
parametric temperature-time curves (such as that specified in EN 1991-1-2: 2002: Eurocode 1. Actions on
structures. Actions on structures exposed to fire)
While both of these methods have great merits and represented breakthroughs in the discipline at their times of adoption, it is recognised that they have limitations.
The standard temperature-time curve, which is used as the basis for the fire rating system in most building codes and standards worldwide, was first published in 1917. The curve came from collating various fire tests into one idealised curve. The tests that fed into the development of the standard fire were intended to represent worst-case fires in enclosures, so that the structure could withstand burnout. However, these tests were conducted, and the standard fire created, prior to much scientific understanding of fire dynamics. Thus, the standard fire, unlike a real fire, has a relatively slow growth period; never reduces in temperature due to fire decay; and is independent of building characteristics such as geometry, ventilation and fuel load.
COST Action TU0904 Integrated Fire Engineering and Response
39
The next major landmark for structural fire analysis, in terms of design, was a guidance document produced in Sweden in 1976. This work incorporated the current understanding of compartment fire dynamics based on tests conducted in small-scale enclosures. The guide presented the key factors of compartment fire temperatures as the fuel load, ventilation and the thermal properties of the wall linings. It gave design recommendations and a series of temperature-time curves for a wide range of critical parameters, accounting for the cooling period of the fire.
The Eurocode parametric temperature-time curve is based on the same fire science as the Swedish design guide. The Eurocode temperature-time curve was developed to collapse all of the curves given in the Swedish guidance document into a simplified mathematical form.
Eurocode 1 states that the design equations for the parametric temperature-time curve specified are only valid for compartments with floor areas up to 500m2 and heights up to 4m. In addition, the enclosure must have no openings through the ceiling and the thermal properties of the compartment linings must be within a limited range. As a result, common features in modern construction, such as large enclosures, high ceilings, atria, large open spaces, multiple floors connected by voids, and glass façades, are excluded from its range of applicability. These limitations, which are largely associated with the physical size and geometric features of the experimental compartments on which the methods are based, ought to be carefully considered when the method is applied to an engineering design beyond the recommended ranges of applicability. This is particularly relevant given the large floor plates and complicated architecture of modern buildings.
It is noted that PD 6688-1-2:2007: Background paper to the UK National Annex to BS EN 1991-1-2 suggests that designers can ignore the Eurocode 1 limitations on floor area and compartment height, and can expand the range of the compartment lining values. However, while this allows engineers to use the equations on more practical applications, it does not appear to address the observed travelling nature of real fires in large compartments.
A travelling fire is when only a portion of a floor plate is fully involved in flames that then move to other areas of the floor as burnout occurs in locations of earlier burning. The fire travels as flames spread to unburned fuel, partitions or false ceilings break, and ventilation changes through glazing failure.
Over the last decade, there have been several real, large fires where fires were observed to travel across floor plates and between floors. These fires include those in the World Trade Center Towers 1, 2 and 7 in New York in September 2001; the Windsor Tower in Madrid, Spain in February 2005; and the Faculty of Architecture building at TU Delft in the Netherlands in May 2008. All of these fires led to some form of structural failure.
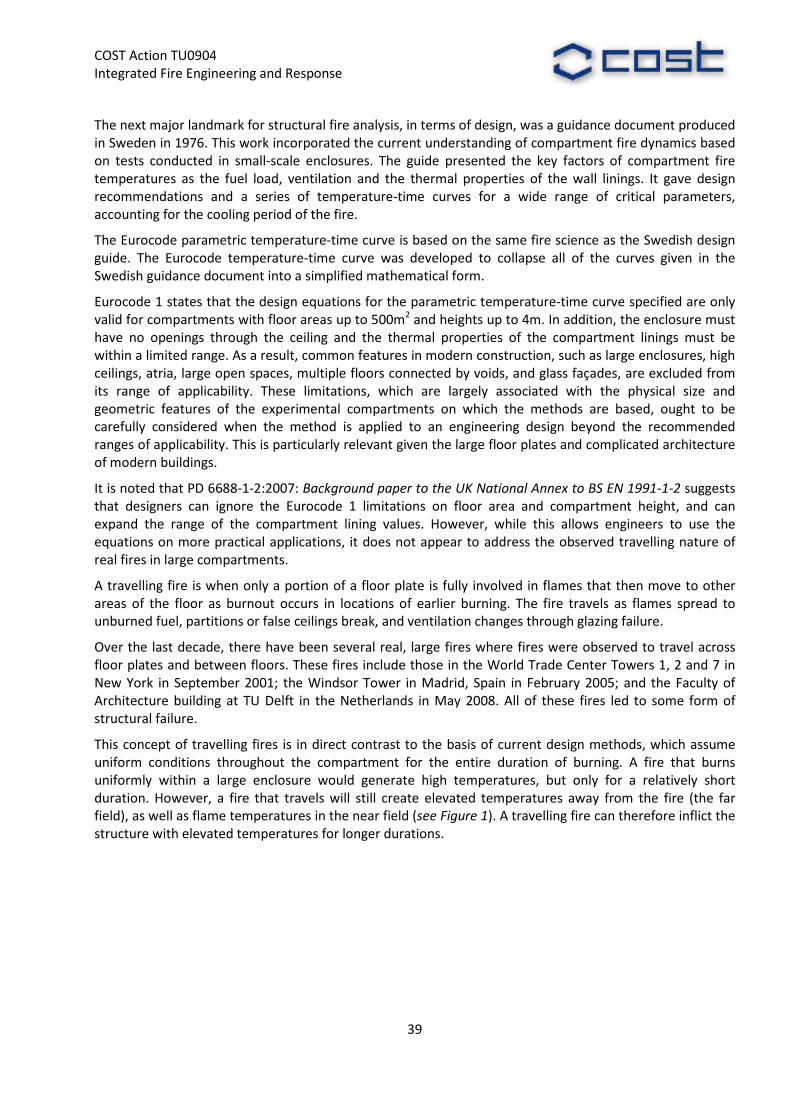
This concept of travelling fires is in direct contrast to the basis of current design methods, which assume uniform conditions throughout the compartment for the entire duration of burning. A fire that burns uniformly within a large enclosure would generate high temperatures, but only for a relatively short duration. However, a fire that travels will still create elevated temperatures away from the fire (the far field), as well as flame temperatures in the near field (see Figure 1). A travelling fire can therefore inflict the structure with elevated temperatures for longer durations.

COST Action TU0904 Integrated Fire Engineering and Response
40
Figure 1: Illustration of the near and far fields in a large compartment fire.
Due to the discrepancy between fire behaviour in actual incidents and the assumed fire behaviour in traditional design methods, it is possible that current practices for structural design do not consider a potentially worst-case fire scenario. Non-uniform heating across a compartment floor could cause a failure mechanism in the structure, which may not occur if uniform temperatures were applied to the structure. For example, a cool, unheated bay in a multi-bay structure could produce high axial restraint forces, and that could result in failure of a heated element.
In most situations, however, traditional design methods may be overly conservative, compared to the impact of a real fire. Therefore, it is beneficial to have a methodology that can incorporate the actual dynamics of a travelling fire into structural analysis, to better enable structural and architectural design innovation.
There is currently no approved guidance to assist structural fire engineers in quantifying travelling fire behaviour for structural analyses.
A new methodology is currently being developed at the University of Edinburgh [3, 4] that allows for a wide range of possible fires, including both uniform burning and travelling fires, by considering the fire dynamics within a given building. This methodology has two unique characteristics when compared to the traditional methods:
- more than one fire is considered – that is, a full ‘family’ of fires is investigated, with each fire having a different area of burning
- the methodology divides the effect of a fire on structural elements into the near field and the far field
By considering a range of fires, instead of just one, and splitting the effect of a fire into the near and far field, instead of just one uniform field, this methodology allows the full range of possible fires to be considered. This is important because the exact nature of a fire that may challenge a structure cannot be known during the design phase of a building.
The family of fires can be selected by taking a range of fire sizes, expressed in terms of percentage of floor area burning. For example, a small fire might be 1% of the total floor area and the largest possible fire is 100% of the floor area. Because the burning rate of such large fires tends to be nearly uniform, the burning time for a fire in a given area is the same, regardless of the size of the area. This burning time is typically around 15-20 minutes for typical office fuel loads [3, 4]. For example, assuming a fuel load of 600MJ/m2, a 1MW fire burning over 2m2 would take 20 minutes to burn out. A 20MW fire burning over 40m2 would also take 20 minutes to burn out. These burn out times are consistent with observations of the World Trade Center fires.
Due to this uniform burning, a fire that simultaneously covers 100% of the floor area would burn out in about 20 minutes, as it is area independent. A fire that involves 1% of the floor area would burn out locally
COST Action TU0904 Integrated Fire Engineering and Response
41
in about 20 min, but then continue to burn as it travels throughout the compartment. Thus, this small fire would last more than 30 hours in a 2,000m2 floor plate. Clearly, these are extreme values, but the various fire sizes between the two cover the full range of total fire durations physically possible.
Once the full range of fire sizes has been identified, the characteristics of the near field and the far field of each fire can be determined. The near field is simply the floor area of the fire, and the far field is the remainder of the floor. The near field temperature is that of the flames, usually around 1,200°C. The far field temperature varies with distance from the fire and can be affected by specific building geometry, such as atria. The far field temperature distribution can be determined from various fire engineering tools, such as hand calculations computational fluid dynamics models.
Passing on the full temperature variation of the far field to a structural model could be prohibitively cumbersome. Therefore a single, averaged fire temperature is used in this methodology.
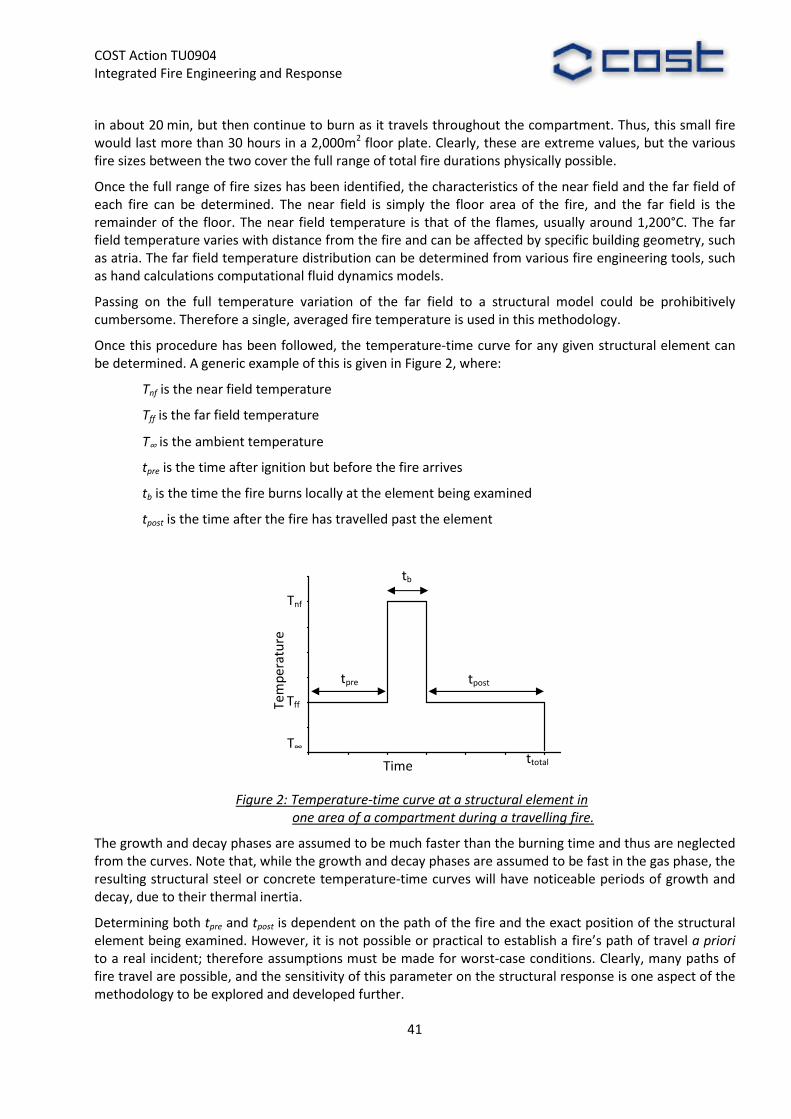
Once this procedure has been followed, the temperature-time curve for any given structural element can be determined. A generic example of this is given in Figure 2, where:
Tnf is the near field temperature
Tff is the far field temperature
T∞ is the ambient temperature
tpre is the time after ignition but before the fire arrives
tb is the time the fire burns locally at the element being examined
tpost is the time after the fire has travelled past the element
Figure 2: Temperature-time curve at a structural element in
one area of a compartment during a travelling fire.
The growth and decay phases are assumed to be much faster than the burning time and thus are neglected from the curves. Note that, while the growth and decay phases are assumed to be fast in the gas phase, the resulting structural steel or concrete temperature-time curves will have noticeable periods of growth and decay, due to their thermal inertia.
Determining both tpre and tpost is dependent on the path of the fire and the exact position of the structural element being examined. However, it is not possible or practical to establish a fire’s path of travel a priori to a real incident; therefore assumptions must be made for worst-case conditions. Clearly, many paths of fire travel are possible, and the sensitivity of this parameter on the structural response is one aspect of the methodology to be explored and developed further.
ttotal
Tff
Tnf
T∞
tpre tpost
tb
Tem
per
atu
re
Time
COST Action TU0904 Integrated Fire Engineering and Response
42
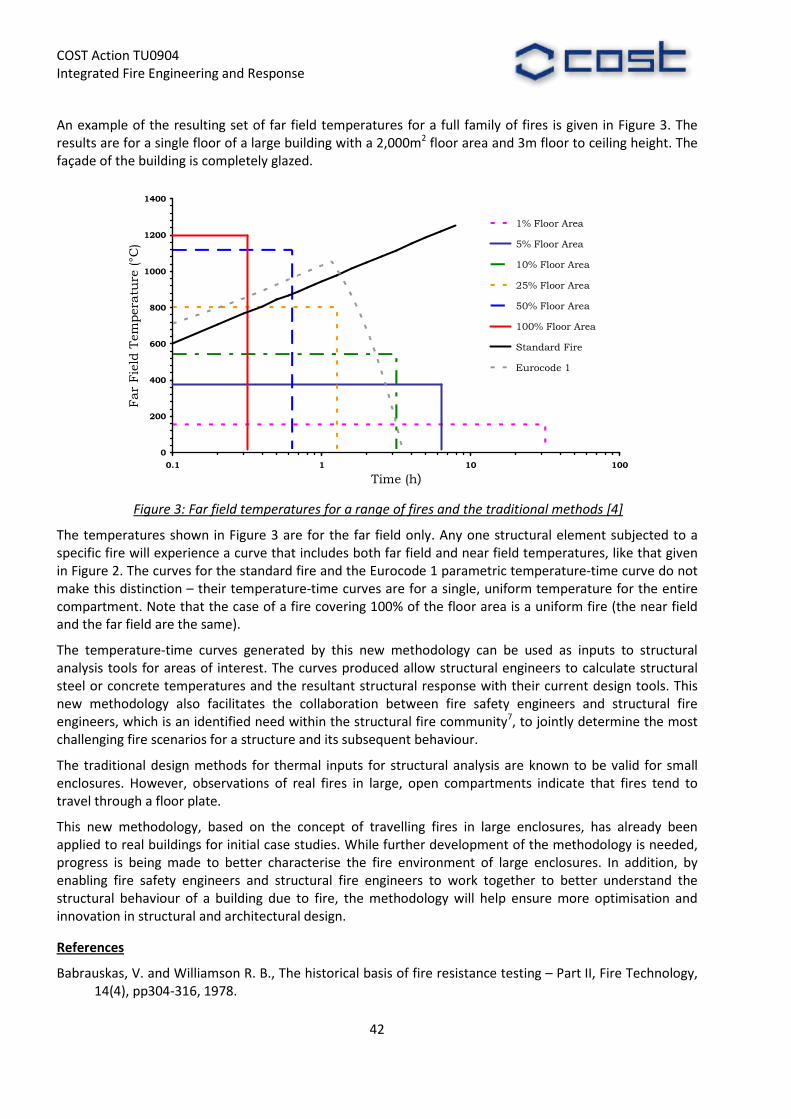
An example of the resulting set of far field temperatures for a full family of fires is given in Figure 3. The results are for a single floor of a large building with a 2,000m2 floor area and 3m floor to ceiling height. The façade of the building is completely glazed.
Figure 3: Far field temperatures for a range of fires and the traditional methods [4]
The temperatures shown in Figure 3 are for the far field only. Any one structural element subjected to a specific fire will experience a curve that includes both far field and near field temperatures, like that given in Figure 2. The curves for the standard fire and the Eurocode 1 parametric temperature-time curve do not make this distinction – their temperature-time curves are for a single, uniform temperature for the entire compartment. Note that the case of a fire covering 100% of the floor area is a uniform fire (the near field and the far field are the same).
The temperature-time curves generated by this new methodology can be used as inputs to structural analysis tools for areas of interest. The curves produced allow structural engineers to calculate structural steel or concrete temperatures and the resultant structural response with their current design tools. This new methodology also facilitates the collaboration between fire safety engineers and structural fire engineers, which is an identified need within the structural fire community7, to jointly determine the most challenging fire scenarios for a structure and its subsequent behaviour.
The traditional design methods for thermal inputs for structural analysis are known to be valid for small enclosures. However, observations of real fires in large, open compartments indicate that fires tend to travel through a floor plate.
This new methodology, based on the concept of travelling fires in large enclosures, has already been applied to real buildings for initial case studies. While further development of the methodology is needed, progress is being made to better characterise the fire environment of large enclosures. In addition, by enabling fire safety engineers and structural fire engineers to work together to better understand the structural behaviour of a building due to fire, the methodology will help ensure more optimisation and innovation in structural and architectural design.
References
Babrauskas, V. and Williamson R. B., The historical basis of fire resistance testing – Part II, Fire Technology, 14(4), pp304-316, 1978.
0
200
400
600
800
1000
1200
1400
0.1 1 10 100
Time (h)
Far Field Temperature (°C)
1% Floor Area
5% Floor Area
10% Floor Area
25% Floor Area
50% Floor Area
100% Floor Area
Standard Fire
Eurocode 1
COST Action TU0904 Integrated Fire Engineering and Response
43
Pettersson, O., Magnusson, S-E. and Thor, J., Fire Engineering Design of Steel Structures, Publication 50, Swedish Institute of Steel Construction, 1976.
Rein, G., Zhang, X., Williams, P., Hume, B., Heise, A., Jowsey, A., Lane, B. and Torero, J., Multi-story fire analysis for high-rise buildings, Proceedings of the 11th International Interflam Conference, 2007, http://www.era.lib.ed.ac.uk/handle/1842/1980.
J Stern-Gottfried, G Rein, JL Torero, Travel Guide, Fire Risk Management, Nov 2009, pp. 12-16 http://www.era.lib.ed.ac.uk/handle/1842/3184
Gann, R.G. et al, Reconstruction of the fires in the World Trade Center Towers, NIST NCSTAR 1-5, 2005.
McAllister, T.P. et al, Structural fire response and probability collapse sequence of the World Trade Center Building 7, NIST NCSTAR 1-9, 2008.
Buchanan, A., The challenges of predicting structural performance in fires, the 9th International Symposium on Fire Safety Science, Germany, 2008.
J Stern-Gottfried, A Law, G Rein, M Gillie, JL Torero, A Performance-based Methodology Using Travelling Fires for Structural Analysis, 8th International Conference on Performance-Based Codes and Fire Safety Design Methods, Lund University, Sweden, June 2010. http://www.see.ed.ac.uk/~grein/rein_papers/Stern-Gottfried_SPFE2010.pdf
COST Action TU0904 Integrated Fire Engineering and Response
44
Mariusz Maślak and Zenon Drabowicz
DESIGN FIRES: PROBABILISTIC APPROACH
Overview
Evaluation of the fire load separately for each considered fire compartment is very ardous and not always effective. For this reason its nominal value is usually estimated only in relation to each specific type of compartment utility, based on the attainable statistical data. In professional literature one can find a large number of specialistic reports and articles in which the results of fire load measurements are collected and discussed for various kinds of fire compartment. Furthermore, the influence of the arrangement of potential fuel as well as of compartment geometry on the energy and intensity of resulted fire is there widely studied.
Recommended literature:
Yii H. W., Effect of surface area and thickness on fire loads, Fire Engineering Research Report, 2000/13, March 2000, University of Canterbury, New Zealand, ISSN 1173-5996.
Statistical distribution of fire load
Statistical data collected for given, considered type of fire compartment are treated as the random variables, decribed by means of Gumbel probability distribution. This type of distribution has been chosen as the best approximation of the real data distribution resulting from the histogram, because of the significant skewness coefficient. The modal value of the fire load is then specified as well as the Gumbel standard deviation, connected with this value, is also computed. As a result of such mathematical modelling the design value of the fire load is defined as the upper fractile of Gumbel probability distribution when the acceptable probability of its upcrossing is fixed as 20% (the levels 10% and 5% are also recommended in some papers). Furthermore, the differentiated level of the probability of fire occurrence and various range of fire protection measures applied in considered compartment can be taken into account in the analysis owing to the multiplication of the value of design fire load by additional partial safety factors evaluating failure consequence and/or untypical conditions of the exploitation of structural members.
Recommended literature:
Schleich J. -B., The design fire load density qfd function of active fire safety measures, the probabilistic background, JCSS Workshop “Reliability based code calibration”, Zurich, Switzerland, 2002,
Schleich J. -B., Performance-based design for the fire situation, theory and practice, Nordic Steel Construction Conference, Malmoe, Sweden, 2009.
Fire loads
Probabilistic model applied for the specification of design value of the fire load, proposed by J.-B. Schleich, is verified by many authors. Exemplarily the fire load is studied in detail in France for the compartments localised in shoping centers, hotels and hospitals. On the other hand, this load is precisely analysed for many industrial and commercial buildings in Switzerland. There is also a large number of results of fire load measurements originating from Canada. In this case the fire load characterising compartments enclosed within commercial establishments such as restaurants, bookstores and shoe stores was examined in detail. Consequently, the lognormal probability distribution has been proposed to fire load description as the better alternative in relation to the application of Gumbel probability distribution.
COST Action TU0904 Integrated Fire Engineering and Response
45
Recommended literature:
Thauvoye Ch., Zhao Bin, Klein J., Fontana M., Fire load survey and statistical analysis, Proceedings of 9th IAFSS Symposium, Karlsruhe, Germany, 2008,
Hadjisophocleous G., Zalok E., Development of design fires for performance-based fire safety designs, Proceedings of 9th IAFSS Symposium, Karlsruhe, Germany, 2008.
Design fire
The design fire is defined, for which not only the characteristic of potential fire is looked for, according to the fire load density as well as the compartment geometry and ventillation possibility, but also the real safety level is taken into consideration by means of the application of reliably calibrated partial safety factors. These factors are most frequently connected with fire protection measures which are possible to use in particular case of fire, with the opportunity to improve the professional firefighting action, with accesibility of the building for fire brigade, with the number and technical condition of escape routes etc. Many of such factors are calibrated only based on the experience and statistical estimation, without more complex probabilistic analysis. Some of them are recommended to use by the standard EN 1991-1-2.
Recommended literature:
Schleich J.-B., Performance-based design for the fire situation, theory and practice, Nordic Steel Construction Conference, Malmoe, Sweden, 2009,
Hietaniemi J., Mikkola E., Design fires for fire safety engineering, VTT Working Papers 139, Finland, 2010.
Risk of ignition
The probability of fire occurrence may be calculated in more reliable way by means of the application of the model of Poisson process. The quantification of the risk of fire ignition, interpreted as the parameter of process intensity, should be formally adopted. This approach gives the opportunity to estimate such probability even if the attainable data are incomplete.
Recommended literature:
Lin Yuan-Shang, Estimations of the probability of fire occurences in building, Fire Safety Journal, 40, 2005,
Ryden J., Rychlik I., A note of estimation of intensities of fire ignitions with incomplete data, Fire Safety Journal, 41, 2006.
Mathematical models
There are many mathematical models helpful in the estimation of the risk of fire expansion from one fire compartment to another. In general they are based on the analysis of the specific networks with suitable logical gates types “OR” and/or “AND”. The technique adopted from the study of classical Bayesian networks seems to be the best approach to reliably assess the probability which is looked for.
Recommended literature:
Fitzgerald R. W., Building Fire Performance Analysis, John Wiley & Sons Ltd., Chichester, England, 2004,
Holicky M., Schleich J.-B., Modelling of a structure under permanent and fire design situation, Proceedings of the International Conference “Safety, Risk, Reliability – Trends in Engineering”, Malta, 2001,
Cheng Hao, Hadjisophocleous G., The modelling of fire spread in buildings by Bayesian network, Fire Safety Journal, 44,2009.
COST Action TU0904 Integrated Fire Engineering and Response
46
Safety levels
In general the safety level evaluated for the case of fire is the result of many factors which are connected between each other in a complex and intercorrelated network. Analysis of such network has to take into consideration its internal hierarchy and structure. Furthermore, the importance of particular factors is not known in advance. For this reason multicriterial analysis is necessary to obtain the reliable value of failure probability. The modern techniques of the study, originating from the classical decision theory, are proposed to be used in this field.
Recommended literature:
Zhao C. M., Lo S. M., Lu J. A., Fang Z., A simulation approach for ranking of fire safety attributes of existing buildings, Fire Safety Journal, 39, 2004,
Ginda G., Maślak M., Assessment of factors influencing the fire safety for building users, Proceedings of IABSE Symposium “Responding to Tommorow’s Challenges to Structural Engineering, Budapest, 2006, IABSE Report, Vol. 92.
COST Action TU0904 Integrated Fire Engineering and Response
47
Guillermo Rein, [email protected]
SOME LIMITS TO COMPUTATIONAL MODELLING OF ENCLOSURE FIRE DYNAMICS
Modelling is among the fastest developing areas in fire safety science. The validation of fire models is an essential task for the advancement of fire safety engineering. The large majority of the studies that have compared simulations to experiments have found them in reasonable agreement. However, most of these simulations were conducted after the tests took place and with good access to the recorded experimental data (this is known as a posteriori modelling). Thus, the comparisons are not blind and the modelling may include some bias due to prior knowledge of the evolution of the event.
In blind simulations, also called a priori, the modeller is provided only the description of the initial scenario and is responsible for developing the appropriate input from this description. The modeller has no access to the experimental measurements of the event and thus is providing a true forecast. Most fire model validations are open simulations, also called a posteriori, where the modeller is also provided with the results from the experiment. Only a priori simulations are free of the bias that could be introduced by prior knowledge of the development of the event.
This paper is a summary of the more detailed work by Rein et al. 2009 and Rein et al. 2007. The objective of the study is to compare the modelling results produced a priori by different teams of modellers of a realistic fire scenario, the Dalmarnock Fire Test One. Test One is part of the Dalmarnock Fire Tests series of fire experiments (Abecassis Empis et al. 2007, Rein et al. 2007), conducted in 2006 in a real high-rise building. The results are compared to the experimental measurements to allow evaluation of the accuracy and reliability of the a priori process as a whole.
The present round-robin study involves a pool of participants composed of independent international teams, all working in the field of fire engineering and using fire modelling as part of their professional practice. There are representatives from most branches of fire modelling, from fundamental and applied research to final engineering design.
The Dalmarnock Fire Tests
The large-scale Dalmarnock Fire Tests consist of tests conducted in a 23-storey reinforced concrete building in Glasgow (UK), July 2006. The two tests of main interest here (henceforth referred to as Test One and Test Two) were those conducted in two identical flats. The Dalmarnock Tests were set up to recreate a realistic fire scenario involving multiple fuel packages arranged in an ordinary fashion, consistent with real dwellings. Arrangements of this type invariably result in fire growth that is not readily obvious and thus prediction of fire development can be a challenge.
Test One was held in a two-bedroom single family flat, with the living room set up as the main experimental compartment. Test Two was conducted in an identical flat but two floors below Test One. An identical fuel arrangement was used in both tests. Both fires grew to flashover conditions but only Test One was allowed to continue burning during post flashover. A detailed description of the compartments, the fuel layout and the measurements has been given by Abecassis-Empis et al. (2008) and Rein et al. (2007, Chp 2), but an overview is included here for quick reference.
The flat comprised a main corridor off which were two bedrooms, a bathroom and a living room, with a small kitchen. The main experimental compartment was the 3.50 m by 4.75 m, 2.45 m high living room, with a 2.35 m by 1.18 m set of windows on the west-facing wall. It was furnished as a regular living room/office. The general layout was such that most of the fuel was concentrated towards the back corner (NE) of the compartment, away from the window and the doors, with a fairly even fuel loading throughout the rest of the compartment (see Figure 1) and no further loading elsewhere in the flat.

COST Action TU0904 Integrated Fire Engineering and Response
48
While the main source of fuel was a two-seat sofa stuffed with retardant flexible polyurethane foam, the compartments also contained two office desks with a computer and a padded chair each, as well as three tall wooden bookcases, a short plastic cabinet, three small wooden coffee tables, a range of paper items and two tall, plastic lamps. Figure 2a) shows a photograph, taken before the test. The fuel load density was estimated to be 32 kg/m2 of wood equivalent, whereas a typical value for office buildings is around 25 kg/m2. The ignition source was a plastic wastepaper basket filled with crumpled newspaper and approximately 500 ml of heptane. It was placed in-between the sofa and a bookcase. During Test One all the doors in the flat were left open. Windows of all compartments, excluding the kitchen and one bedroom, were left closed.
Figure 1: Furniture layout in the main compartment [Abecassis-Empis et al. (2008) and Rein et al. (2007)]
Figure 2: View of the ignition source, the sofa and nearby items in the main compartment: a) before the
fire; and b) after the fire [Abecassis-Empis et al. (2008) and Rein et al. (2007)].
A large number of sensors were installed throughout the flat in order to obtain detailed measurements of the fire development. More than 270 thermocouples were distributed throughout the main compartment to provide gas temperature data at high spatial resolution suitable for comparison with computational fluid dynamics (CFD) simulations. Smoke obscuration was measured using 8 pairs of laser-receiver sensors. Gas velocity was measured at the ventilation openings of the main compartment using 14 bi-directional velocity probes. Additionally, more than 15 video cameras, spread throughout the flat, provided visual recordings. Other measurements include temperatures within and heat fluxes to the east wall and the ceiling of the main compartment, a dozen smoke detectors in different rooms, and strain and deflection gauges used to monitor the deformation of structural elements.
Test Two had an identical flat geometry and fuel configuration. The only two significant variations were a smaller amount of heptane used for the ignition and a drastically altered ventilation conditions. Despite these drastic differences, the Test Two fire was seen to spread following the same pattern as Test One.

COST Action TU0904 Integrated Fire Engineering and Response
49
Both tests show an almost identical time to flashover (only 10 s difference). Although both tests did not produce identical fires the differences are relatively small, and it shows that the Dalmarnock compartment test configuration provided a robust and reasonably repeatable fire scenario for benchmarking.
Round-Robin Study
The aim of the study was the forecast of fire dynamics for the set scenario. The teams were asked to forecast the test results as accurately as possible, and to avoid an engineering analysis with conservative assumptions or safety factors, as is common for use in fire safety design. All teams were given access to a common pool of information about the test experimental setup and initial conditions. This included: the geometry and dimensions of the flat; a detailed and measured layout of the room furniture; 50 photographs of the whole compartment final set-up, windows, fuel packages and instrumentation; and individual descriptions, material, dimensions and photographs of each furniture item. A replica of the sofa and the wastepaper basket were tested separately, under laboratory conditions, and the initial heat release rate of the ensemble was measured in the furniture calorimeter. In total, ten simulations were submitted: eight CFD simulations using FDS4, and two simulations using zone model CFAST. More information and detailed descriptions of each input file are provided in Rein et al. 2009 and Rein et al. 2007.
Comparison and analysis of the results
The global heat release rate (HRR) is given in Figure 3. The same legend is used for the results in all the subsequent figures. Three distinct stages are observed: initial growth, first post flashover stage until compartment window breakage, and subsequent second post-flashover stage. The heat release rate inside the main compartment was calculated during the test using the principle of oxygen depletion. The HRR measurements convey an approximately steady 3 MW fire between the onset of flashover (at 300 s) and the compartment window breakage at 800 s. Thereafter the HRR is around 5 MW until forced extinction.
Figure 3: Evolution of the global heat release rate within the compartment.
0 200 400 600 800 1000 12000
2000
4000
6000
8000
10000
time [s]
HR
R [k
W]
A2D1E2BF1A1E1F2D2CEXP
D2E1
A2
D1
B
E2
CA1
E2
F2
F1
D1
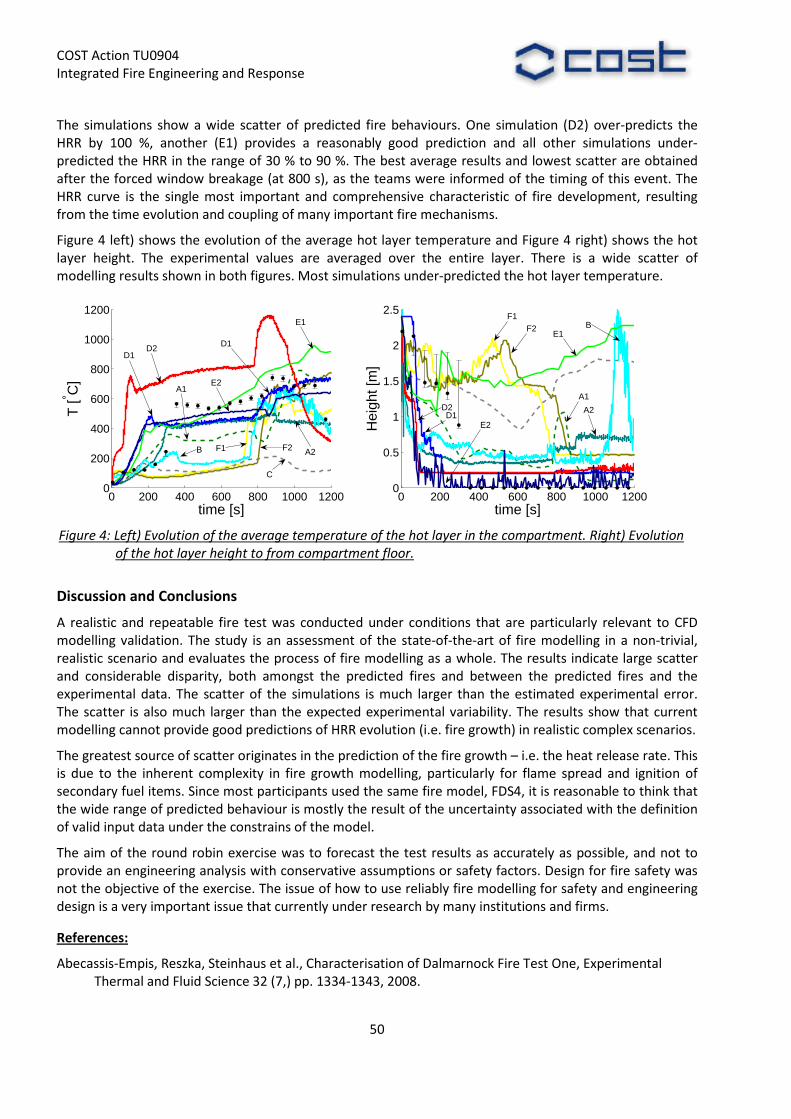
COST Action TU0904 Integrated Fire Engineering and Response
50
The simulations show a wide scatter of predicted fire behaviours. One simulation (D2) over-predicts the HRR by 100 %, another (E1) provides a reasonably good prediction and all other simulations under-predicted the HRR in the range of 30 % to 90 %. The best average results and lowest scatter are obtained after the forced window breakage (at 800 s), as the teams were informed of the timing of this event. The HRR curve is the single most important and comprehensive characteristic of fire development, resulting from the time evolution and coupling of many important fire mechanisms.
Figure 4 left) shows the evolution of the average hot layer temperature and Figure 4 right) shows the hot layer height. The experimental values are averaged over the entire layer. There is a wide scatter of modelling results shown in both figures. Most simulations under-predicted the hot layer temperature.
Figure 4: Left) Evolution of the average temperature of the hot layer in the compartment. Right) Evolution
of the hot layer height to from compartment floor.
Discussion and Conclusions
A realistic and repeatable fire test was conducted under conditions that are particularly relevant to CFD modelling validation. The study is an assessment of the state-of-the-art of fire modelling in a non-trivial, realistic scenario and evaluates the process of fire modelling as a whole. The results indicate large scatter and considerable disparity, both amongst the predicted fires and between the predicted fires and the experimental data. The scatter of the simulations is much larger than the estimated experimental error. The scatter is also much larger than the expected experimental variability. The results show that current modelling cannot provide good predictions of HRR evolution (i.e. fire growth) in realistic complex scenarios.
The greatest source of scatter originates in the prediction of the fire growth – i.e. the heat release rate. This is due to the inherent complexity in fire growth modelling, particularly for flame spread and ignition of secondary fuel items. Since most participants used the same fire model, FDS4, it is reasonable to think that the wide range of predicted behaviour is mostly the result of the uncertainty associated with the definition of valid input data under the constrains of the model.
The aim of the round robin exercise was to forecast the test results as accurately as possible, and not to provide an engineering analysis with conservative assumptions or safety factors. Design for fire safety was not the objective of the exercise. The issue of how to use reliably fire modelling for safety and engineering design is a very important issue that currently under research by many institutions and firms.
References:
Abecassis-Empis, Reszka, Steinhaus et al., Characterisation of Dalmarnock Fire Test One, Experimental Thermal and Fluid Science 32 (7,) pp. 1334-1343, 2008.
0 200 400 600 800 1000 12000
200
400
600
800
1000
1200
time [s]
T [° C
]
D2
E1
A1
F1B F2 A2
C
E2
D1D1
0 200 400 600 800 1000 12000
0.5
1
1.5
2
2.5
time [s]
Hei
ght [
m]
F1F2
E1B
A1
A2
E2
D2D1

COST Action TU0904 Integrated Fire Engineering and Response
51
Rein, Abecassis-Empis, Carvel (Eds), The Dalmarnock Fire Tests: Experiments and Modelling, The University of Edinburgh, ISBN 978-0-9557497-0-4, November 2007. Accessible at
http://www.era.lib.ed.ac.uk/handle/1842/2037
Rein, Torero, Jahn, et al. Round-Robin Study of a priori Modelling Predictions of The Dalmarnock Fire Test One, Fire Safety Journal 44 (4), pp. 590-602, 2009. doi:10.1016/j.firesaf.2008.12.008. Copy available at http://hdl.handle.net/1842/2704

COST Action TU0904 Integrated Fire Engineering and Response
52
Kamila Horova, [email protected]
NOTE ON DESIGN FIRES IN STRUCTURES, COMPARMENTS AND TUNNELS
Heat Release Rate (HRR) is commonly accepted as the most important parameter in characterizing fires. The HRR can be calculated according to European standard EN 1991-1-2; however, it is often difficult to quantify the HRR. In some countries it is not possible to use Annex E where HRR is defined due to the size of the compartment and the type of occupancy. In cases where relevant data is not available, it is nowadays possible to use modelling and fire simulation to assess the heat release rate. Accurate prediction of fire growth and spread on the bases of the physical properties of the fire room and the combustibles is beyond the capability of any present fire-simulation software. It is possible to make conservative assessment how large fire may propagate within the given space.
Heat release rate in EN 1991-1-2
EN 1991-1-2 describes the thermal and mechanical actions for the structural design of buildings exposed to fire. Fire load densities and heat release rate are in Annex E.
The definition of the possible fires that can occur as well as concept of potential hazard and fire severity are expressed by the aid of fire load which is based on the amount of energy that would be available if all the fuel were to be consumed. In Annex E the amount in mean of heat released by a fire per unit of time (HRR) is based on different occupancies. Important points of HRR curve are described. The maximum of heat release rate is the first important point. The decay phase starts when 70% of the total fire load has been consumed and completed when the fire load has been completely burnt. In case of ventilation controlled fire the curve has to be extended.
References:
EN 1991-1-2. 2002 Eurocode 1: Actions on structures- Part 1-2:General actions- Actions on structures exposed to fire. CEN: Brussels
Heat release rate and fuel packages
The simplified approach of design fire characterisation that is based on the concept of fuel packages is described. This concept utilises the fact that our empirically based knowledge on initial fires is sufficient for the time evolution of the initial fire and, that the advanced fire simulation programs such as the FDS can extrapolate the fire spread from the initial fire to secondary igniting objects.
The fuel packages are a source of heat and their rate at which they release heat is based on heat release rate (HRR) experimental data (in this approach heat release rates depend on the usage of the building). This approach guarantees a safe side assessment in full analogy the live load design values. Assessment of fire growth and spread is based on the capability of the FDS fire simulator to make conservative estimations how rapidly and how large a fire may grow.
References:
Hietaniemi J.: Fuel Packages for Structural Fire Safety Design, Natural Fire Design, VTT Technical Research Centre of Finland, 2007
Hietaniemi J., Mikkola E.: Design Fires for Fire Safety Engineering, VTT Technical Research Centre of Finland, 2010, ISBN 978-951-38-7479-7
COST Action TU0904 Integrated Fire Engineering and Response
53
Heat release rate in road tunnel fires
The use of computer simulation models for the fire safety design of tunnels has been increasing over the past few years. This increase has been attributed to many factors including the complexity of tunnel networks, the need for a better understanding of fire behaviour in tunnels because heat and toxic combustion products cannot be dissipated out of the tunnel as compared to an open environment. While using computer modelling in fire safety design enables designers to build a computational model that represents the system for analysis of fire dynamics, smoke movement and to test performance of their design, most of these models require the input of HRR by the user. Two methodologies to estimate the HRR in a tunnel considering tunnel geometry and ventilation conditions were compared: a statistical approach, which is a simple and quick calculation method, and a numerical approach using Fire Dynamics Simulator 4.0.7 (FDS4). The discussion in this work evolves around estimating the HRR involving a single light goods vehicle (LGV) fire carrying wooden pallets and factors that could possibly affect the analysis.
References:
Cheong M. K., Spearpoint M. J., Fleischmann C. M.: A Comparison of a Statistical and Computational Fluid Dynamics Approach to Estimate Heat Release Rate in Road Tunnel Fires, Fire Technology, 46, 531–549, 2010, DOI: 10.1007/s10694-009-0105-9, The United States, 2009
Ingason H.: Design fire curves for tunnels, Fire Safety Journal 44 (2009) 259-265, Elsevier Ltd. 2008
COST Action TU0904 Integrated Fire Engineering and Response
54
J-F. Cadorin, [email protected]; Jesus de la Quintana, [email protected]
SMOKE CONTROL
It is of primary importance to understand the phenomena of smoke production and propagation in buildings and to develop smoke management systems or strategies because smoke is the first cause of death in case of fire.
- The objectives and basic principles of smoke management systems are explained.
- The fire plume phenomenon is briefly exposed and fire plume models are cited.
- The most important design tools for smoke management systems are finally detailed.
Smoke hazard
Smoke is the first cause of death in case of building fires. Life safety hazards from smoke include mainly:
- Toxic gases.
- Reduced visibility.
- High temperatures.
- Reduction of oxygen concentration.
Smoke is also an important cause of damage to buildings and in particular to building finishing.
It is therefore of primary importance to understand the phenomena of smoke production and propagation in buildings and to develop smoke management systems or strategies.
References:
G.D. Lougheed, Basic Principles of Smoke Management for Atriums - Construction Technology Update No. 47, Dec. 2000.
Smoke management system: objective and principles
The main objective of a smoke management system is to maintain a tenable environment within exit access and area of refuge access paths for the time necessary to allow occupants to reach an exit or area of refuge.
The smoke management systems are various and can be based on one or several of the following principles:
- Natural smoke filling of an unoccupied volume or smoke reservoir
- Mechanical smoke exhaust capacity to remove smoke from a space
- Gravity smoke venting
- Maintaining pressure differences across smoke zone boundaries
References:
NFPA 92B, Guide for smoke management systems in malls, atria, and large areas. National Fire Protection Association, Quincy, MA, 2009.

COST Action TU0904 Integrated Fire Engineering and Response
Fire plumes
When a mass of hot gases is surrounded by colder gadue to the density difference, or buoyancy. This phenomenon happens above a burning fuel source. The buoyant flow is referred to as a fire plume, see Figure 1. Cold air is entrained by the rising hot gacausing a layer of hot gases to be formed below the ceiling.
Different analytical expressions of the properties of fire plume have been proposed by several authors. Four of them (Drysdale, 1999; Karlsson and Quintiere, 2000) are :
- Heskestad plume mode
- Zukoski plume model;
- McCaffrey plume model;
- Thomas plume model.
Figure
The plume models are used to estimate the quantity of smoke produced by a localised fire and can be used in hand calculation or two-zone models (see next section).
References:
Drysdale, D., An introduction to fire dynamics. New York: Wiley, 1999. ISBNKarlsson, B., Quintiere, J. G., Enclosure Fire Dynamics, CRC Press 2000. ISBN: 0849313007
Design tools
- There are several possibilities to model the smoke movement within a building. Some of the most widely used models are:
- pre-flashover analytical fire models (see previous section
- numerical models:
- two-zone models;
- computational fluid dynamic models.
Zone models
The main hypothesis in zone models is that the compartment is divided into zones where each zone has a uniform properties (temperature, species concentrations...) distribution at any time. In twothere is a hot gas layer which is close to the ceiling and a cold gas layer which is close to the floor.
Flame height
Integrated Fire Engineering and Response
55
When a mass of hot gases is surrounded by colder gases, the hotter and less dense, mass will rise upward due to the density difference, or buoyancy. This phenomenon happens above a burning fuel source. The buoyant flow is referred to as a fire plume, see Figure 1. Cold air is entrained by the rising hot gacausing a layer of hot gases to be formed below the ceiling.
Different analytical expressions of the properties of fire plume have been proposed by several authors. Karlsson and Quintiere, 2000) are :
Heskestad plume model;
Zukoski plume model;
McCaffrey plume model;
Thomas plume model.
Figure 2: Fire plume and associated schematic model
The plume models are used to estimate the quantity of smoke produced by a localised fire and can be used zone models (see next section).
Drysdale, D., An introduction to fire dynamics. New York: Wiley, 1999. ISBN-10: 0471972916 Karlsson, B., Quintiere, J. G., Enclosure Fire Dynamics, CRC Press 2000. ISBN: 0849313007
There are several possibilities to model the smoke movement within a building. Some of the most widely used models are:
flashover analytical fire models (see previous section – plume models) ;
fluid dynamic models.
The main hypothesis in zone models is that the compartment is divided into zones where each zone has a uniform properties (temperature, species concentrations...) distribution at any time. In two
t gas layer which is close to the ceiling and a cold gas layer which is close to the floor.
Flame height
ses, the hotter and less dense, mass will rise upward due to the density difference, or buoyancy. This phenomenon happens above a burning fuel source. The buoyant flow is referred to as a fire plume, see Figure 1. Cold air is entrained by the rising hot gases,
Different analytical expressions of the properties of fire plume have been proposed by several authors.
Fire plume and associated schematic model
The plume models are used to estimate the quantity of smoke produced by a localised fire and can be used
10: 0471972916 Karlsson, B., Quintiere, J. G., Enclosure Fire Dynamics, CRC Press 2000. ISBN: 0849313007
There are several possibilities to model the smoke movement within a building. Some of the
plume models) ;
The main hypothesis in zone models is that the compartment is divided into zones where each zone has a uniform properties (temperature, species concentrations...) distribution at any time. In two-zone models,
t gas layer which is close to the ceiling and a cold gas layer which is close to the floor.

COST Action TU0904 Integrated Fire Engineering and Response
H
ZS
ZP
0
mOUT,L
mIN,L
Z
Figure
These models have been developed specifically to design smoke control syste
Computational fluid dynamics (CFD) models
This type of model is used in many engineering disciplines and is based on a time dependent and threedimensional solution of the fundamental conservation laws. The partial differential equations of the thermodynamic and aerodynamic variables (Navierpoints in the compartment. These equations are usually solved by finite volume method.
These models are used to solve many types of problems involving fluid mand more used to design smoke control systems.
a. b.
Figure 4: CFD modelling of a compartment fire a. Isometric view of the surface mesh on the symmetry
plane and floor. b. temperature on the syme
References:
Cadorin, J-F., Compartment fire models for structural engineering, ULg, 2003, ISSN 0075Validation of CFX-5 against a Steckler fire experiment,CFX
Integrated Fire Engineering and Response
56
RHR mfi
mp
Lower layer
Upper layer
mOUT,U
mOUT,L
QC
QR
mU , TU, VU, EU, ρU
mL , TL, VL, EL, ρL
p
Figure 3: Two-zone model principles
These models have been developed specifically to design smoke control systems.
(CFD) models
This type of model is used in many engineering disciplines and is based on a time dependent and threedimensional solution of the fundamental conservation laws. The partial differential equations of the
odynamic and aerodynamic variables (Navier-Stokes equations) are solved in a very large number of points in the compartment. These equations are usually solved by finite volume method.
These models are used to solve many types of problems involving fluid movements. There are now more and more used to design smoke control systems.
CFD modelling of a compartment fire a. Isometric view of the surface mesh on the symmetry
plane and floor. b. temperature on the symetry plane (Sinai 2003)
F., Compartment fire models for structural engineering, ULg, 2003, ISSN 00755 against a Steckler fire experiment,CFX-VAL15/0103, AEA Technology, 2003.
This type of model is used in many engineering disciplines and is based on a time dependent and three-dimensional solution of the fundamental conservation laws. The partial differential equations of the
Stokes equations) are solved in a very large number of points in the compartment. These equations are usually solved by finite volume method.
ovements. There are now more
CFD modelling of a compartment fire a. Isometric view of the surface mesh on the symmetry
F., Compartment fire models for structural engineering, ULg, 2003, ISSN 0075-9333. Sinai, Y., VAL15/0103, AEA Technology, 2003.
COST Action TU0904 Integrated Fire Engineering and Response
57
Tsatsoulas Dimitrios, [email protected]
TENABILITY CONDITIONS
Toxic species in fire gas effluents
Toxicity is measured as the dose of a gas that will lead to death or incapacitation (often known as untenable conditions). About 75% to 80% of fire victims are not touched by flame but die as result of exposure to smoke, exposure to toxic gases or oxygen depletion. These life-threatening conditions can result from burning contents, such as furnishings, as well as from the materials involved.Most of the modern applications for polymeric materials (both natural and synthetic) contain carbon and hydrogen, in addition some contain nitrogen, sulphur and halogens. Carbon containing materials release CO and CO2 in various concentrations depending on the amount of air available to the combustion process. CO2 has a synergistic effect on CO in terms of toxic uptake as concentrations above 5% cause hyperventilation. Furthermore those materials containing nitrogen, sulphur and halogens produce hydrogen cyanide (HCN), nitrogen oxides (NOx), sulphur dioxide (SO2), ammonia (NH3) and halogen acids (HCI, HBr and HF) respectively.
Assessment of toxic hazards.
It is impossible to determine exact concentrations that will cause death or incapacitation, but table below gives some typical values (in parts per million, ppm) for these events and which are often used as the basis for tenability levels in fire safety codes.The early experiments established lethal toxic potency,LC50 (orLD50), as the concentration of combustion products required to cause immediate death in 50% of the rats exposed to smoke over a specific period of time(30 minutes) in a small scale laboratory tests . However, this 'definitive' measurement has a number of flaws, in particular it's failure to take into account other manifestations of toxicity poisoning effecting response behaviour prior to death. The COSHH (COntrol of Substances Hazardous to Health regulations) procedure allows the maximum exposure for people to escape from a fire alive to be predicted rather than the present procedures of predicting the exposure levels in fires that will cause death.15 minutes is a typical exposure time to toxic gases in large fires and this is considered a realistic basis for fire toxicity to be assessed in terms of safe evacuation. COSHH is part of statutory law in the EU.
Toxic Gas 15 Min Exposure limit COSHH (ppm)
Toxic Gas 15 Min Exposure limit COSHH (ppm)
Carbon Monoxide CO 200 Formaldehyde CH2O 2
Nitric Oxide NO 35 SO2 SO2 5
Nitrogen Dioxide NO2 5 HCl HCl 5
Hydrogen Cyanide HCN 10 Ammonia NH3 35
Table : Main Toxic Gas Concentration Limits ppm (COSHH)
References: EH 40/2005 workplace exposure limits ‘containing the list of workplace exposure limits for use with the Control of Substances Hazardous to Health Regulations 2002(as amended)’, HSE Books, UK Health and Safety Executive.
Toxic Gases in simulated aircraft interior fires using FTIR analysis
An aircraft interior fire is a closed room fire scenario with a fixed ventilation rate of 20-30 air changes per hour. Experimental fires were undertaken in a closed room fire test facility for 22 air changes per hour.
COST Action TU0904 Integrated Fire Engineering and Response
58
Three fire loads were investigated: modacrylic blankets, head rest cushions and a lifejacket, together with some other items provided by the aircraft operators to passengers. A Temet heated FTIR was used to determine the toxic emissions for 60 species every 5s in the fires. The analysis included acidic gases such as acrolein, acetic and formic acids as well as HCl and HCN, where extremely high levels were measured in the first two fires. The source of HCl was concluded to be pyrolysis of the halogenated fire protection material on the blankets. In all cases levels of formaldehyde were very high. The source of HCN was the acrylic material in the blankets and this also gave very high fuel NOx formation together with significant ammonia. Without the blankets present the lifejacket fire was much lower in HCl and HCN and formaldehyde and SO2 were the main toxic problems. In terms of the overall toxicity CO was not the main problem. These results indicate significant problems of toxic gases in the early stages of fires in aircraft.
References:
Andrews et al, ‘Toxic Gases in simulated aircraft interior fires using FTIR analysis’. Proc. 5th International Colloquia on Explosions in Reactive Systems, Edinburgh, April, 2007.
FTIR Investigations of Toxic Gases in Air Starved Enclosed Fires
Toxic gases in air starved fires in small rooms with modern fire doors and heat insulation, where the ventilation flow areas are very small, were simulated in a 1.57 m3 fire enclosure with 2.7 air changes an hour. Three fires were investigated: kerosene and diesel pool fires and a pine wood crib fire and all had a similar total heat release. The results showed that air starved fires developed slowly with low fire temperatures and overall lean mixtures. CO levels were relatively low and FTIR analysis of 21 toxic gases showed that aldehydes, acrolein, acetic acid, SO2, NO2 and some toxic hydrocarbons had a combined toxicity that was greater than that due to CO. The wood fire had particularly high acrolein, aldehydes and acetic acid levels. The toxicity of the complex mixture of fire toxic gases was assessed using the COSHH 15 min. exposure limit as the reference limiting toxic concentration.
References:
Andrews et al., ‘FTIR investigations of toxic gases in air starved enclosed fires’ in: 8th International Symposium Proceedings 18-23 September, 2005, Beijing, China18-23 September, 2005, Beijing, China, pp.1035-1046. 2005.
Toxic Gas Measurements Using FTIR for Combustion of COH Materials in Air Starved Enclosed Fires
Pine wood cribs and folded cotton towel fires were investigated for 1 - 40 air changes per hour. The results show that very low ventilation cotton fires generated toxic gases at higher levels than those for wood, but for higher ventilation the wood fires were more toxic. Both fires exhibited a slow smouldering combustion phase at low ventilation rates and toxic gases were high throughout this period. The COSHH 15 minutes toxicity assessment method gave that Acrolein, formaldehyde and CO were the major toxic gases in all the fires.
References:
Andrews et al., ‘Toxic Gas Measurements using FTIR for Combustion of COH Materials in Air Straved Enclosed Fires’ in: European Combustion Meeting, Crete, 2007.
Thermal behaviour and toxic emissions of flame retarded timber in Fire enclosure tests
Timber in different forms contributes as first and secondary ignited material to the initiation and spreading of fires in industrial buildings. The aim of this work was to investigate experimentally the fire behavior of
COST Action TU0904 Integrated Fire Engineering and Response
59
wooden surfaces treated or not with flame retardants in a 1.57 m3 fire enclosure linked to the FTIR analyzer in well ventilated conditions (75kg/h) that are usually encountered in industrial activities when large metal doors, ramps, ventilation opening etc are open in order to serve the process of production. Seven (7) wooden crib fires were investigated using untreated pine wooden cribs or treated at different percentage (%) of the total surface area with a water – based, flame retardant intumescent, suitable for internal surfaces. In most fully-treated (100%F.R.) cases, even in a half-treated (50% F.R.) case, lower or almost equal to unity emissions were measured compared with the bare samples. This can be explained, in such cases, due to the fact that during the intumescent action, there was either ‘no ignition’ of the samples (100% F.R. -treated cases), or a considerable ignition delay occured (50% F.R. -treated case). Excessive HCN and NOx occurred in 60% untreated cases due to the considerable involvement of the flame retardant paint in flaming combustion, since it contains N in its chemical composition.
References:
D.Tsatsoulas, “Thermal behaviour and toxic emissions of flame retarded timber in Fire Enclosure tests”,Seventh International Conference on ‘Risk Analysis 2010’, pp 295-306, 13-15 September, Algarve, Portugal.
Thermal behaviour and toxic emissions of various timbers in Cone Calorimeter tests
Eight species of wood typically employed in floors, ceilings, shelves, pallets, packing cases, scaffolding, furniture etc., were selected for experimental investigation. The samples were subjected to constant incident heat fluxes of 35, 50, 65 and 80 kWm-2 in a Cone Calorimeter linked to a FTIR analyzer. “Significant” acrolein peak values are measured for all samples. Samples with a facing layer (melamine in particular), which are known to have a chemical flame retardation reached higher peak values of CO, HCN and NH3 during combustion.
References:
D.Tsatsoulas, H.N.Phylaktou and G.Andrews. ‘Thermal behaviour and toxic emissions of various timbers in Cone Calorimeter tests’. In the proceedings of ‘First International Conference on Disaster Management and Human Health Risk ’, pp181-194, 23 -25 September 2009, New Forest, UK.
Thermal behaviour and toxic emissions of flame retarded timbers in Cone Calorimeter tests
Eight (8) species of wood treated or not with three (3) typical intumescent flame retardants were subjected to constant incident heat fluxes of 35, 50, 65 and 80 kWm-2 in a Cone Calorimeter linked to the FTIR analyzer. In the cases of flame retarded samples, where there was ‘no ignition’ or a considerable ignition delay of the samples (35 and 50 kWm-2) there were similar or less toxic emissions compared to the bare samples. NH3 was an exception, since both flame retardants contained ammonium in their chemical composition, which was released during the intumescent action of the samples. As irradiance increases, increasing values of toxic emissions by volume are seen during flaming combustion. Excessive toxic emissions by mass are also seen as irradiance increases.
References:
D.Tsatsoulas, ‘Thermal behaviour and toxic emissions of flame retarded timber in Cone Calorimeter tests’. International Journal of Safety and Security engineering. Accepted paper at 10 of Jule 2010.
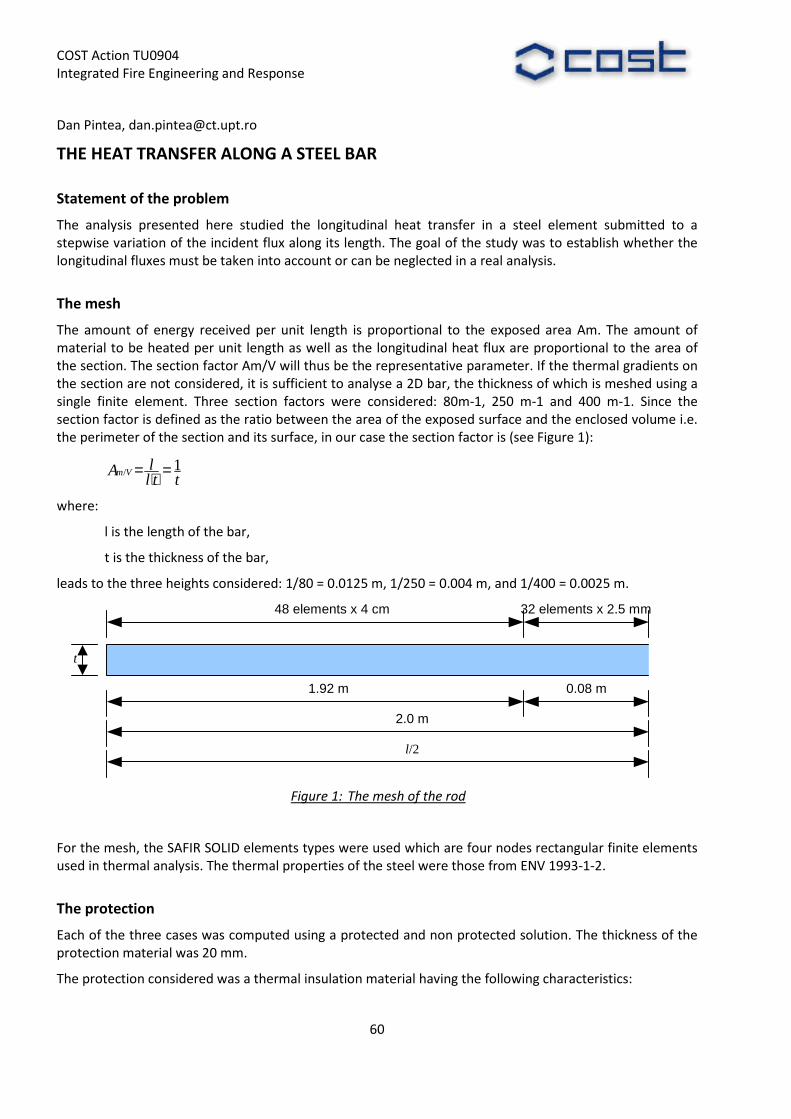
COST Action TU0904 Integrated Fire Engineering and Response
60
Dan Pintea, [email protected]
THE HEAT TRANSFER ALONG A STEEL BAR
Statement of the problem
The analysis presented here studied the longitudinal heat transfer in a steel element submitted to a stepwise variation of the incident flux along its length. The goal of the study was to establish whether the longitudinal fluxes must be taken into account or can be neglected in a real analysis.
The mesh
The amount of energy received per unit length is proportional to the exposed area Am. The amount of material to be heated per unit length as well as the longitudinal heat flux are proportional to the area of the section. The section factor Am/V will thus be the representative parameter. If the thermal gradients on the section are not considered, it is sufficient to analyse a 2D bar, the thickness of which is meshed using a single finite element. Three section factors were considered: 80m-1, 250 m-1 and 400 m-1. Since the section factor is defined as the ratio between the area of the exposed surface and the enclosed volume i.e. the perimeter of the section and its surface, in our case the section factor is (see Figure 1):
ttllA Vm 1/ =⋅=
where:
l is the length of the bar,
t is the thickness of the bar,
leads to the three heights considered: 1/80 = 0.0125 m, 1/250 = 0.004 m, and 1/400 = 0.0025 m.
1.92 m 0.08 m
48 elements x 4 cm 32 elements x 2.5 mm
2.0 m
l/2
t
Figure 1: The mesh of the rod
For the mesh, the SAFIR SOLID elements types were used which are four nodes rectangular finite elements used in thermal analysis. The thermal properties of the steel were those from ENV 1993-1-2.
The protection
Each of the three cases was computed using a protected and non protected solution. The thickness of the protection material was 20 mm.
The protection considered was a thermal insulation material having the following characteristics:
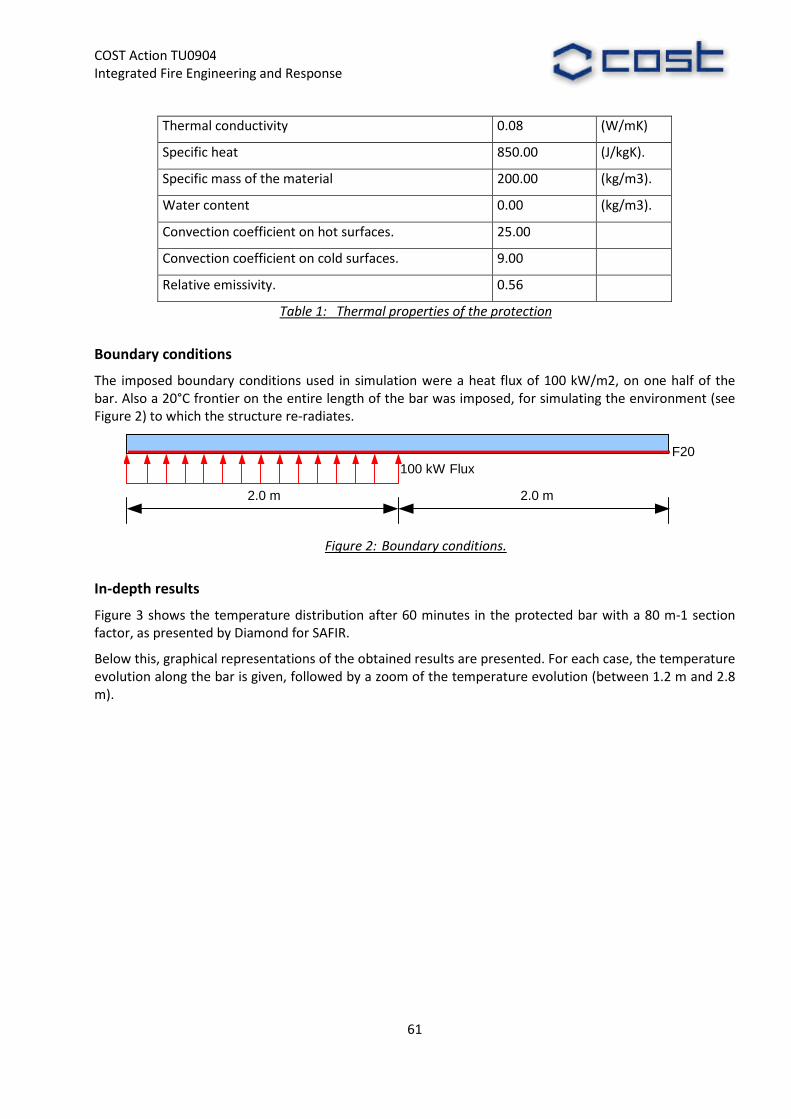
COST Action TU0904 Integrated Fire Engineering and Response
61
Thermal conductivity 0.08 (W/mK)
Specific heat 850.00 (J/kgK).
Specific mass of the material 200.00 (kg/m3).
Water content 0.00 (kg/m3).
Convection coefficient on hot surfaces. 25.00
Convection coefficient on cold surfaces. 9.00
Relative emissivity. 0.56
Table 1: Thermal properties of the protection
Boundary conditions
The imposed boundary conditions used in simulation were a heat flux of 100 kW/m2, on one half of the bar. Also a 20°C frontier on the entire length of the bar was imposed, for simulating the environment (see Figure 2) to which the structure re-radiates.
2.0 m 2.0 m
F20 100 kW Flux
Figure 2: Boundary conditions.
In-depth results
Figure 3 shows the temperature distribution after 60 minutes in the protected bar with a 80 m-1 section factor, as presented by Diamond for SAFIR.
Below this, graphical representations of the obtained results are presented. For each case, the temperature evolution along the bar is given, followed by a zoom of the temperature evolution (between 1.2 m and 2.8 m).
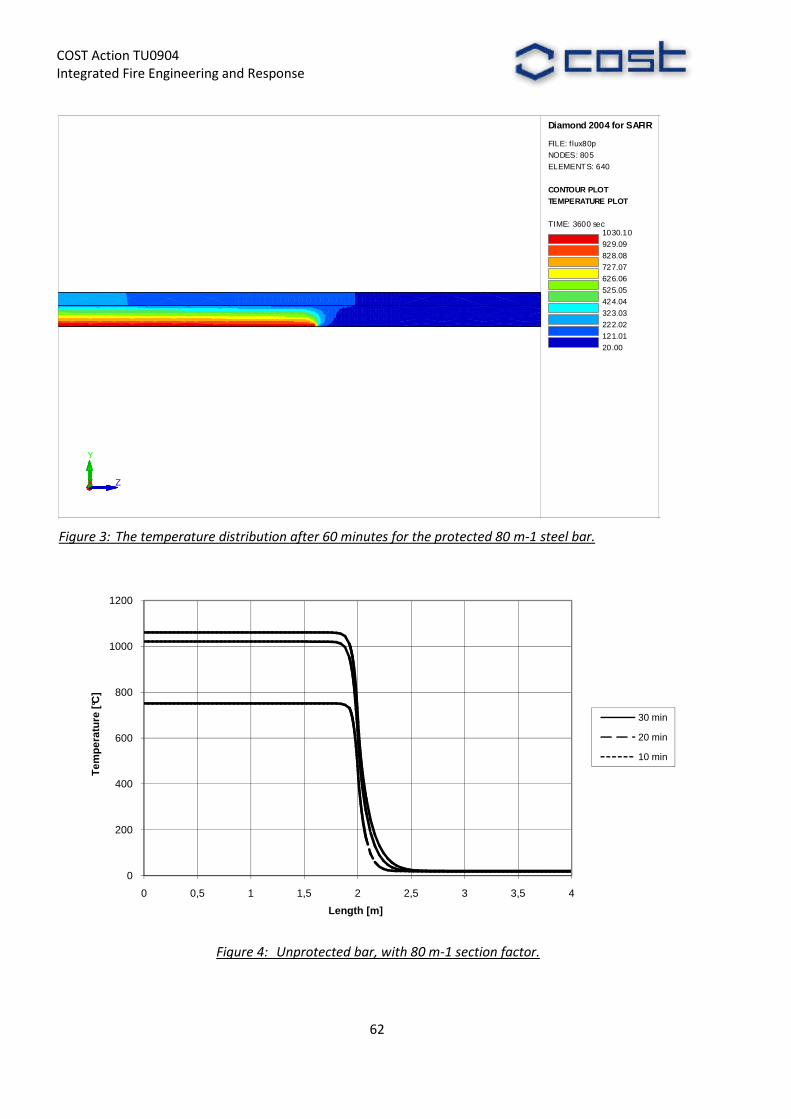
COST Action TU0904 Integrated Fire Engineering and Response
62
Figure 3: The temperature distribution after 60 minutes for the protected 80 m-1 steel bar.
Figure 4: Unprotected bar, with 80 m-1 section factor.
X
Y
Z
Diamond 2004 for SAFIR
FILE: f lux80p
NODES: 805
ELEMENTS: 640
CONTOUR PLOTTEMPERATURE PLOT
TIME: 3600 sec1030.10
929.09
828.08
727.07
626.06
525.05
424.04
323.03
222.02
121.01
20.00
0
200
400
600
800
1000
1200
0 0,5 1 1,5 2 2,5 3 3,5 4
Tem
pera
ture
[°C
]
Length [m]
30 min
20 min
10 min
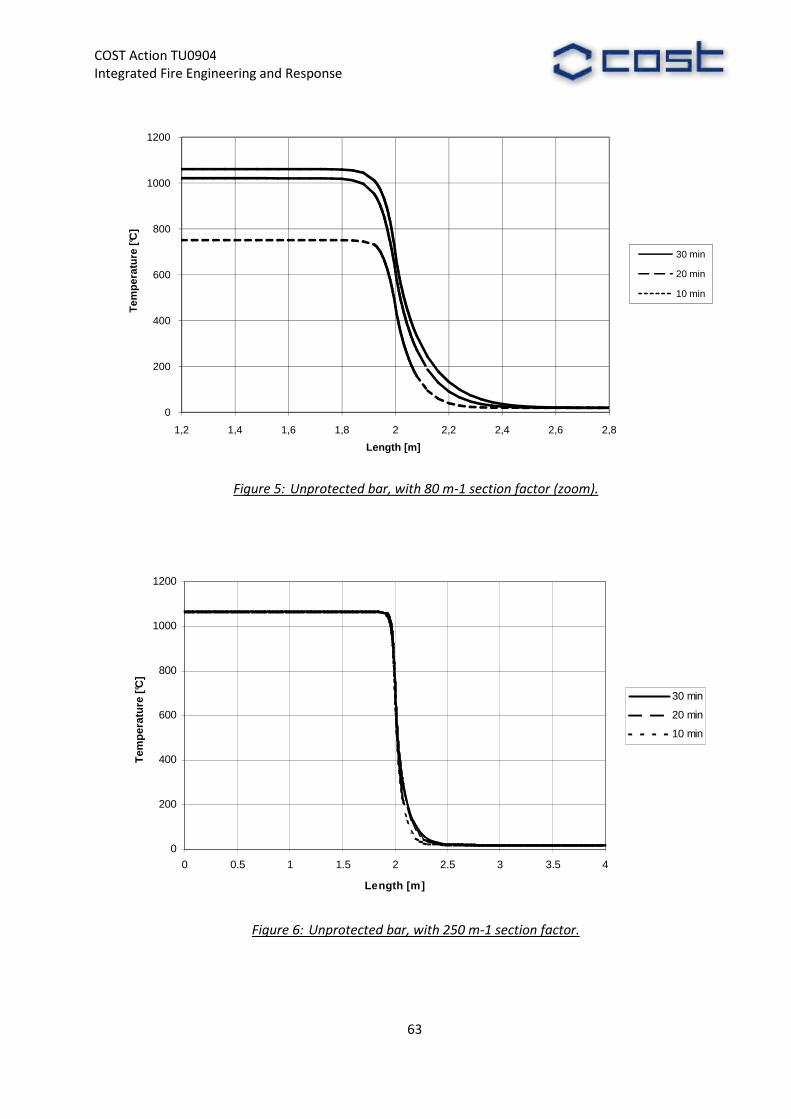
COST Action TU0904 Integrated Fire Engineering and Response
63
Figure 5: Unprotected bar, with 80 m-1 section factor (zoom).
Figure 6: Unprotected bar, with 250 m-1 section factor.
0
200
400
600
800
1000
1200
1,2 1,4 1,6 1,8 2 2,2 2,4 2,6 2,8
Tem
pera
ture
[°C
]
Length [m]
30 min
20 min
10 min
0
200
400
600
800
1000
1200
0 0.5 1 1.5 2 2.5 3 3.5 4
Length [m]
Tem
pera
ture
[°C
]
30 min
20 min
10 min

COST Action TU0904 Integrated Fire Engineering and Response
64
Figure 7: Unprotected bar, with 250 m-1 section factor (zoom).
Figure 8: Unprotected bar, with 400 m-1 section factor.
0
200
400
600
800
1000
1200
1,2 1,4 1,6 1,8 2 2,2 2,4 2,6 2,8
Tem
pera
ture
[°C
]
Length [m]
30 min
20 min
10 min
0
200
400
600
800
1000
1200
0 0,5 1 1,5 2 2,5 3 3,5 4
Tem
pera
ture
[°C
]
Length [m]
30 min
20 min
10 min
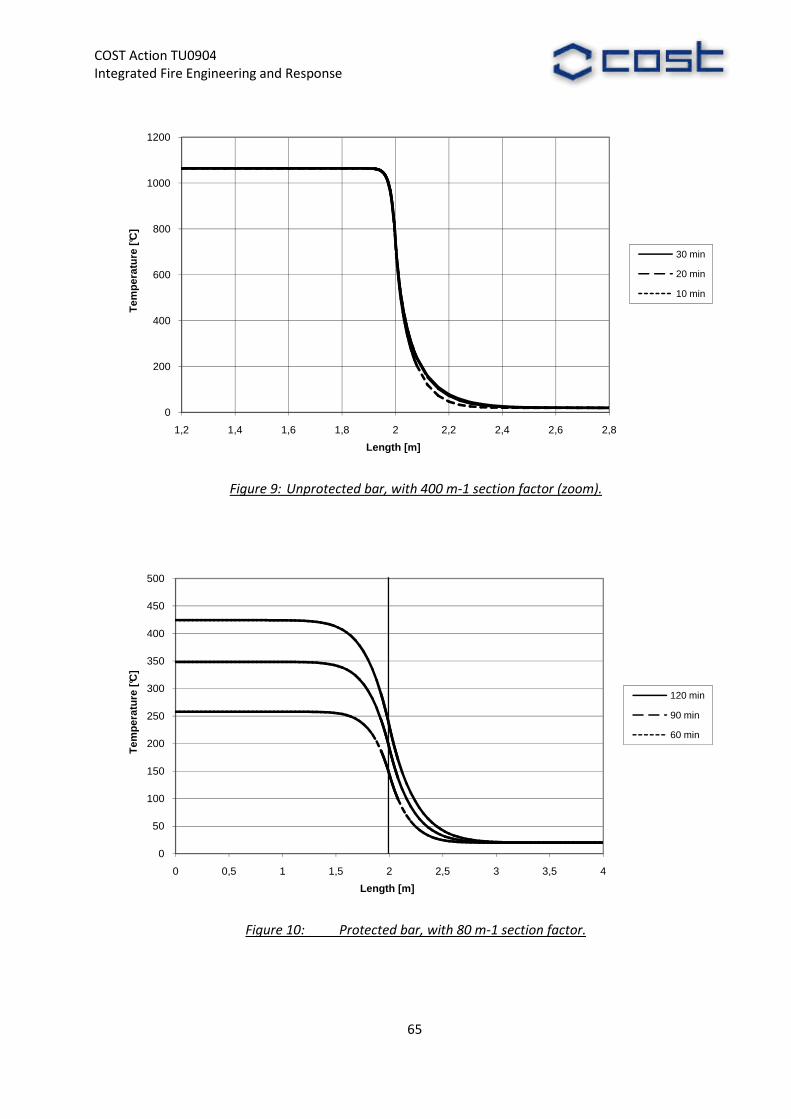
COST Action TU0904 Integrated Fire Engineering and Response
65
Figure 9: Unprotected bar, with 400 m-1 section factor (zoom).
Figure 10: Protected bar, with 80 m-1 section factor.
0
200
400
600
800
1000
1200
1,2 1,4 1,6 1,8 2 2,2 2,4 2,6 2,8
Tem
pera
ture
[°C
]
Length [m]
30 min
20 min
10 min
0
50
100
150
200
250
300
350
400
450
500
0 0,5 1 1,5 2 2,5 3 3,5 4
Tem
pera
ture
[°C
]
Length [m]
120 min
90 min
60 min
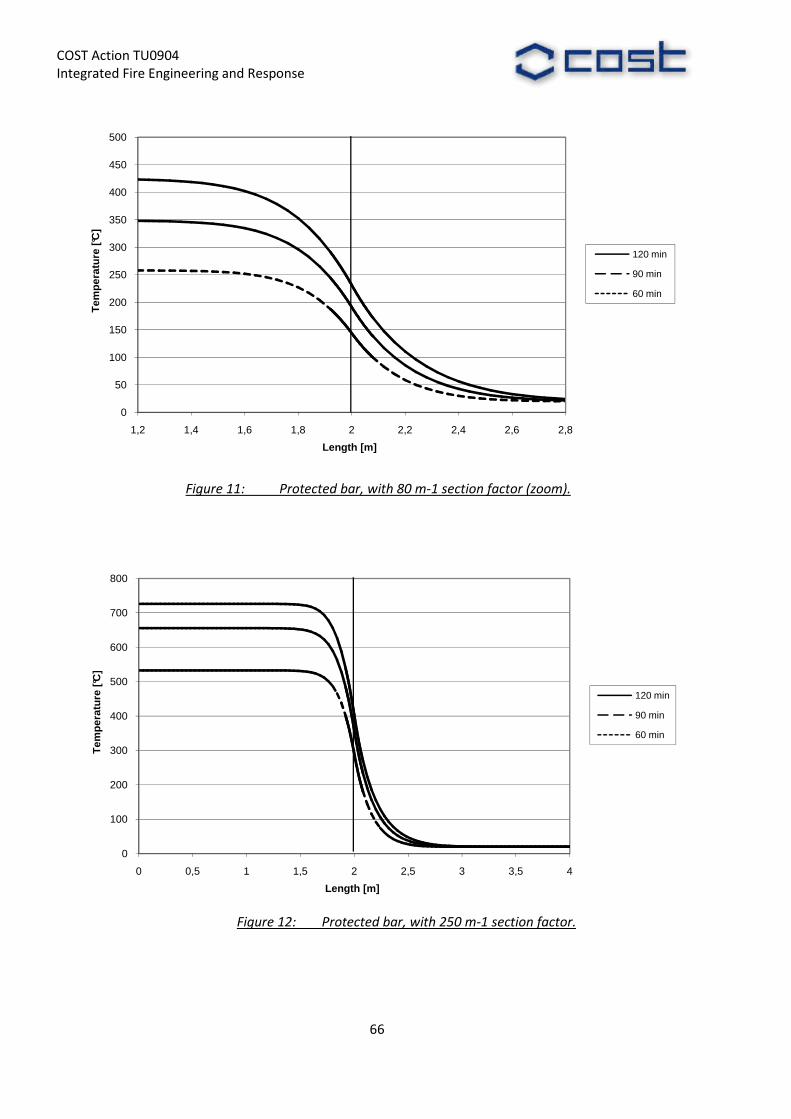
COST Action TU0904 Integrated Fire Engineering and Response
66
Figure 11: Protected bar, with 80 m-1 section factor (zoom).
Figure 12: Protected bar, with 250 m-1 section factor.
0
50
100
150
200
250
300
350
400
450
500
1,2 1,4 1,6 1,8 2 2,2 2,4 2,6 2,8
Tem
pera
ture
[°C
]
Length [m]
120 min
90 min
60 min
0
100
200
300
400
500
600
700
800
0 0,5 1 1,5 2 2,5 3 3,5 4
Tem
pera
ture
[°C
]
Length [m]
120 min
90 min
60 min

COST Action TU0904 Integrated Fire Engineering and Response
67
Figure 13: Protected bar, with 250 m-1 section factor (zoom).
Figure 14: Protected bar, with 400 m-1 section factor.
0
100
200
300
400
500
600
700
800
1,2 1,4 1,6 1,8 2 2,2 2,4 2,6 2,8
Tem
pera
ture
[°C
]
Length [m]
120 min
90 min
60 min
0
100
200
300
400
500
600
700
800
900
0 0,5 1 1,5 2 2,5 3 3,5 4
Tem
pera
ture
[°C
]
Length [m]
120 min
90 min
60 min

COST Action TU0904 Integrated Fire Engineering and Response
68
Figure 15: Protected bar, with 400 m-1 section factor (zoom).
The table that follows gives the interface length. The length of the interface represents the distance from midpoint to the point along the bar where the temperature changes more than 5°C to the left (Hot zone) and to the right (Cold Zone) compared to the values at the end of the bar.
Section factor (m-1) Protection Time Hot Zone Cold Zone
80 Unprotected 10 min 12 24
80 Unprotected 20 min 16 40
80 Unprotected 30 min 16 48
250 Unprotected 10 min 8 28
250 Unprotected 20 min 8 40
250 Unprotected 30 min 8 44
400 Unprotected 10 min 6.8 28
400 Unprotected 20 min 6.5 36
400 Unprotected 30 min 6.5 40
80 Protected 60 min 40 48
80 Protected 90 min 52 64
80 Protected 120 min 60 76
250 Protected 60 min 40 52
250 Protected 90 min 44 68
250 Protected 120 min 44 76
400 Protected 60 min 36 52
400 Protected 90 min 28 64
400 Protected 120 min 44 72
Table 2: Length of the interface [cm].
0
100
200
300
400
500
600
700
800
900
1,2 1,4 1,6 1,8 2 2,2 2,4 2,6 2,8
Tem
pera
ture
[°C
]
Length [m]
120 min
90 min
60 min
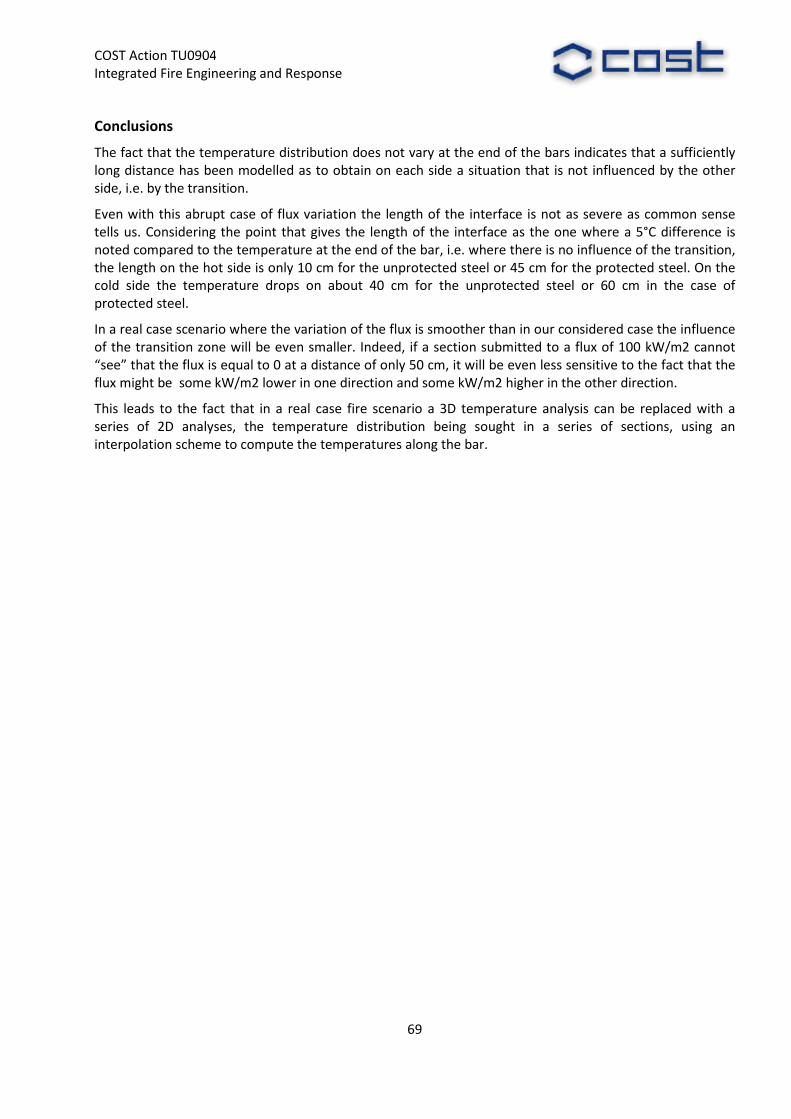
COST Action TU0904 Integrated Fire Engineering and Response
69
Conclusions
The fact that the temperature distribution does not vary at the end of the bars indicates that a sufficiently long distance has been modelled as to obtain on each side a situation that is not influenced by the other side, i.e. by the transition.
Even with this abrupt case of flux variation the length of the interface is not as severe as common sense tells us. Considering the point that gives the length of the interface as the one where a 5°C difference is noted compared to the temperature at the end of the bar, i.e. where there is no influence of the transition, the length on the hot side is only 10 cm for the unprotected steel or 45 cm for the protected steel. On the cold side the temperature drops on about 40 cm for the unprotected steel or 60 cm in the case of protected steel.
In a real case scenario where the variation of the flux is smoother than in our considered case the influence of the transition zone will be even smaller. Indeed, if a section submitted to a flux of 100 kW/m2 cannot “see” that the flux is equal to 0 at a distance of only 50 cm, it will be even less sensitive to the fact that the flux might be some kW/m2 lower in one direction and some kW/m2 higher in the other direction.
This leads to the fact that in a real case fire scenario a 3D temperature analysis can be replaced with a series of 2D analyses, the temperature distribution being sought in a series of sections, using an interpolation scheme to compute the temperatures along the bar.

COST Action TU0904 Integrated Fire Engineering and Response
70
Ana M. Lacasta , Universitat Politècnica de Catalunya, Spain, [email protected]
FIRE RESEARCH AT UNIVERSITAT POLITÈCNICA DE CATALUNYA - EPSEB
The Fire Laboratory of the Technical University of Catalonia, located at the School of Building Construction of Barcelona (EPSEB), conducts basic and applied research in problems related with fire propagation and the behavior of materials at high temperatures. On the one hand, the use of products which undergo endothermic decomposition for fire protection purposes is studied both theoretically and experimentally. On the other hand, studies of fire propagations based on CFD models are performed, in particular applied to the vertical propagation along the building façades and to the evolution inside railway vehicles.
Passive protection under fire
Substances undergoing endothermic reactions are of wide interest in the development of materials oriented to passive fire protection. Specifically, we have focused on obtaining mortars formulated with low-grade magnesium by-products, which undergo endothermic decompositions in a range between 300ºC and 800ºC. A detailed experimental work in order to characterize such a products and analyze their and viability was performed. From a theoretical point of view, the underlying non-isothermal kinetics of such reacting materials is not clearly understood, despite the large amount of research that has been devoted in this topic. Results for the heating rate dependence on the kinetic parameters, obtained with small-scale thermogravimetric techniques, have been incorporated into the modeling and numerical simulations of spatially extended systems.
References:
J.Formosa, L.Haurie, J.M.Chimenos, A.M. Lacasta, J.R.Rosell, “Comparative study of Magnesium by-products and vermiculite formulations to obtain fire resistant mortars”, Materials Science Forum Vols. 587-588, pp 898-902 (2008).
J.Formosa, J.M.Chimenos, A.M.Lacasta, L.Haurie, J.R.Rosell, “New fire-proof mortars formulated with magnesium by-products”, to appear in Cement and Concrete Research (2010).
A.Ciudad, A.M. Lacasta, L.Haurie, J.Formosa, J.M. Chimenos, "Theoretical and experimental analysis of the heat absorbing profile in passive fire protection materials", submitted to the International Journal of Heat and Mass Transfer, 2010.
Building-façade geometry and its impact on fire propagation
When there is a fire in a building, the façade can be one of the quickest spreading pathways. Among other countries, Spain has incorporated into its regulations measures to control vertical spreading along the façade. A critical study has been performed in order to evaluate whether these measures can be sufficient or not to build safer external walls. Several geometrical configurations, including protections in the form of both vertical elements (spandrels) and horizontal-projection elements, have been considered. A numerical study was conducted using FDS (Fire Dynamics Simulator), to analyze some aspects of the propagation path called “leap frog”, which is the upward spread fire through window openings.
References:
M.P.Giraldo, J.Avellaneda, A.M.Lacasta, A.Ciudad, “Computer-simulation research on building-façade geometry and its impact on fire propagation”, International Congress Combustion and Fire Dynamics, pp.493-506, ISBN 978-84-86116-23-1, Santander (Spain), 21-22 October 2010.
COST Action TU0904 Integrated Fire Engineering and Response
71
RAILCEN project: Evolution of fire in a railway vehicle
This project, funded by the Spanish Ministry of Science, is focused on the adaptation and classification of different materials to the new railway standard CEN/TS 45545-2. The research team is composed of four bodies : the Technical University of Catalonia (UPC), the Technological Center CIDEMCO-Tecnalia, and two leading companies in the railway field, Fainsa and Talgo. Extensive small-scale tests have been performed with the cone calorimeter, which is the technique used for classification according this new Standard. Complementary characterization techniques, like thermogravimetric analysis, differential scanning calorimetry, or thermal conductivity measurements, have been used in order to obtain other properties of the material necessary for the simulations with the Fire Dynamics Simulator (FDS). The final goal is to verify whether the small-scale characterization is adequate to reproduce the behaviour in larger fire scenarios. Simulation results have been compared with medium-scale tests on seat pairs in a specific cabin, and a large-scale test on a complete carriage is going to be performed.

COST Action TU0904 Integrated Fire Engineering and Response
72
Petr Kučera, VSB – Technical University of Ostrava, Czech Republic, [email protected]
FIRE RESEARCH AT THE TECHNICAL UNIVERSITY OF OSTRAVA
Tools on risk assessment methods for fire safety engineering
The situation in field of fire safety and building industry heads toward development of standards, which alter safety level better than conventional norms aimed at solving individual problems. These changes are motivated by the need of more flexible ways of building designing and by the necessity to facilitate less expensive solutions, especially in the case of large structures, without reducing the safety level. From this originates the space for elaborating the different method of fire safety, which accuracy depends not only on chosen calculation method but also on technical opinion based on experiences and logical thinking of designer using all available information. For instance in the Czech Republic there is for this the recommended content of different procedure for fulfilment of fire safety technical conditions within project standards ČSN 73 0802 and ČSN 73 0804.
During fire safety engineering assessing tools on risk assessment methods for fire safety engineering bring to the designer necessary design parameters to subsequently consider fire risks and determine strategy system for maintenance of acceptable risk. During identification of the fire risk and its possible consequences could be helpful also available statistic data, which nevertheless determine just framework in which it is possible to move around. In the factual objects and situations it must be decided according to experiences or on the basis of collective dealing with other experts.
References:
Kaiser R., Kučera, P., Pavlík T., Pokorný J. Fire Engineering on Czech Republic. In Proceeding Fire engineering
2010, 5-6 October 2010. Slovakia: Zvolen. ISBN 978-80-89241-38-5.
Kučera-P; Válek-D: Utilization of Fire Safety Engineering. Safety Engineering 2008, 2008, s. 85-94. ISBN 978-80-248-1848-1.
Verification of fire safety in road tunnels
Even though the probability of fire, or other extraordinary incident, in the tunnels is usually lower than in other structures, these situations are attended by often tragic consequences regarding the number of injured and casualties. Also property damages and frequently long-term consequential actions after the incident cause considerable financial losses.
At present, minimum safety requirements for the operation of road tunnels are determined by regulations of European Union with a view to achieve the standardization of the requirements for ensuring the safety of especially long tunnels. A result is to be the attainment of a uniform, permanent and high level of safety of all citizens of Europe using road tunnels in the Trans-European Road Network. To this goal, harmonized requirements of individual countries of European Community must be subordinated. Ones of the basic European regulations concerning the safety requirements for tunnels are the White Paper – European Transport Policy for 2010 – time to decide, and Directive 2004/54/EC of the European Parliament and of the Council on minimum safety requirements for tunnels in the Trans-European Road Network. On the mentioned documents, regulations of individual European countries are based on keeping at least the same minimum level of safety.
In addition the tunnel structures are equipped with a number of technical devices, which serve to ensure their safety (e.g. traffic system, control system, electrical power supply, ventilation system). It is obvious that equipment of the tunnels with safety devices and its correct operation in the case of an extraordinary incident implicates largely the effective intervention of rescue units. The importance of installed technical

COST Action TU0904 Integrated Fire Engineering and Response
73
devices with safety function leads among others to the requirement on rigorous verifications of their efficiency before putting tunnels into operation.
References:
Bradáčová-I; Dudáček-A; Kučera-P: Utilization of Mathematical Model in Fire Safety Design for the Komořany Tunnel. In Proceeding 11TH International Conference Underground Construction Prague
2010 TRANSPORT AND CITY TUNNELS, 2010, s. 828-832. ISBN 978-80-254-7054-1.

COST Action TU0904 Integrated Fire Engineering and Response
74
Appendix
Dan Pintea, [email protected]
OVERVIEW OF THE PRINCIPLES OF HEAT TRANSFER
The transfer of heat is normally from a high temperature object to a lower temperature object. Heat transfer changes the internal energy of both systems involved according to the First Law of Thermodynamics.
The Heat Transfer can be done by:
- Conduction
- Convection
- Radiation
- Vaporization
- Some definitions
Heat
Heat may be defined as energy in transit from a high temperature object to a lower temperature object. An object does not possess "heat"; the appropriate term for the microscopic energy in an object is internal energy. The internal energy may be increased by transferring energy to the object from a higher temperature (hotter) object - this is properly called heating.
Q
Heat
Causes temperature changes affected by
Is related to changes in internal energy through
In mechanisms for
First Law of Thermodynamics
U Q W∆ = −
Heat Transfer
Q Tk A
t d
∆= ⋅ ⋅
Specific Heat
Q c m T= ⋅ ⋅∆
Specific Heat
The specific heat is the amount of heat per unit mass required to raise the temperature by one degree Celsius. The relationship between heat and temperature change is usually expressed in the form shown below where c is the specific heat. The relationship does not apply if a phase change is encountered, because the heat added or removed during a phase change does not change the temperature.
Q c m T= ⋅ ⋅ ∆
where:
Q = the heat added
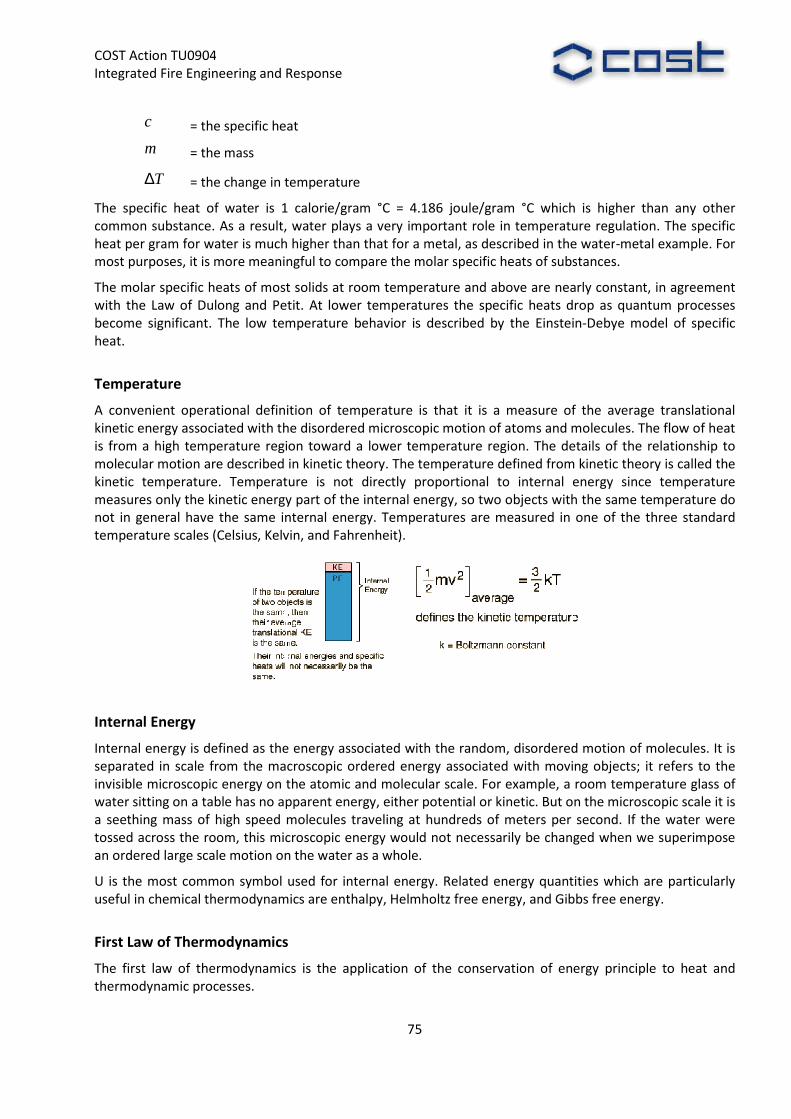
COST Action TU0904 Integrated Fire Engineering and Response
c = the specific heat
m = the mass
T∆ = the change in temperature
The specific heat of water is 1 calorie/gram °C = 4.186 jcommon substance. As a result, water plays a very important role in temperature regulation. The specific heat per gram for water is much higher than that for a metal, as described in the watermost purposes, it is more meaningful to compare the molar specific heats of substances.
The molar specific heats of most solids at room temperature and above are nearly constant, in agreement with the Law of Dulong and Petit. At lower temperatures the specbecome significant. The low temperature behavior is described by the Einsteinheat.
Temperature
A convenient operational definition of temperature is that it is a measure of the average translakinetic energy associated with the disordered microscopic motion of atoms and molecules. The flow of heat is from a high temperature region toward a lower temperature region. The details of the relationship to molecular motion are described in kinetkinetic temperature. Temperature is not directly proportional to internal energy since temperature measures only the kinetic energy part of the internal energy, so two objects with the sanot in general have the same internal energy. Temperatures are measured in one of the three standard temperature scales (Celsius, Kelvin, and Fahrenheit).
Internal Energy
Internal energy is defined as the energy associated with the raseparated in scale from the macroscopic ordered energy associated with moving objects; it refers to the invisible microscopic energy on the atomic and molecular scale. For example, a room temperature glass of water sitting on a table has no apparent energy, either potential or kinetic. But on the microscopic scale it is a seething mass of high speed molecules traveling at hundreds of meters per second. If the water were tossed across the room, this microscopic enean ordered large scale motion on the water as a whole.
U is the most common symbol used for internal energy. Related energy quantities which are particularly useful in chemical thermodynamics are ent
First Law of Thermodynamics
The first law of thermodynamics is the application of the conservation of energy principle to hethermodynamic processes.
Integrated Fire Engineering and Response
75
= the specific heat
= the change in temperature
The specific heat of water is 1 calorie/gram °C = 4.186 joule/gram °C which is higher than any other common substance. As a result, water plays a very important role in temperature regulation. The specific heat per gram for water is much higher than that for a metal, as described in the watermost purposes, it is more meaningful to compare the molar specific heats of substances.
The molar specific heats of most solids at room temperature and above are nearly constant, in agreement with the Law of Dulong and Petit. At lower temperatures the specific heats drop as quantum processes become significant. The low temperature behavior is described by the Einstein
A convenient operational definition of temperature is that it is a measure of the average translakinetic energy associated with the disordered microscopic motion of atoms and molecules. The flow of heat is from a high temperature region toward a lower temperature region. The details of the relationship to molecular motion are described in kinetic theory. The temperature defined from kinetic theory is called the kinetic temperature. Temperature is not directly proportional to internal energy since temperature measures only the kinetic energy part of the internal energy, so two objects with the sanot in general have the same internal energy. Temperatures are measured in one of the three standard temperature scales (Celsius, Kelvin, and Fahrenheit).
Internal energy is defined as the energy associated with the random, disordered motion of molecules. It is separated in scale from the macroscopic ordered energy associated with moving objects; it refers to the invisible microscopic energy on the atomic and molecular scale. For example, a room temperature glass of
er sitting on a table has no apparent energy, either potential or kinetic. But on the microscopic scale it is a seething mass of high speed molecules traveling at hundreds of meters per second. If the water were tossed across the room, this microscopic energy would not necessarily be changed when we superimpose an ordered large scale motion on the water as a whole.
U is the most common symbol used for internal energy. Related energy quantities which are particularly useful in chemical thermodynamics are enthalpy, Helmholtz free energy, and Gibbs free energy.
First Law of Thermodynamics
The first law of thermodynamics is the application of the conservation of energy principle to he
oule/gram °C which is higher than any other common substance. As a result, water plays a very important role in temperature regulation. The specific heat per gram for water is much higher than that for a metal, as described in the water-metal example. For most purposes, it is more meaningful to compare the molar specific heats of substances.
The molar specific heats of most solids at room temperature and above are nearly constant, in agreement ific heats drop as quantum processes
become significant. The low temperature behavior is described by the Einstein-Debye model of specific
A convenient operational definition of temperature is that it is a measure of the average translational kinetic energy associated with the disordered microscopic motion of atoms and molecules. The flow of heat is from a high temperature region toward a lower temperature region. The details of the relationship to
ic theory. The temperature defined from kinetic theory is called the kinetic temperature. Temperature is not directly proportional to internal energy since temperature measures only the kinetic energy part of the internal energy, so two objects with the same temperature do not in general have the same internal energy. Temperatures are measured in one of the three standard
ndom, disordered motion of molecules. It is separated in scale from the macroscopic ordered energy associated with moving objects; it refers to the invisible microscopic energy on the atomic and molecular scale. For example, a room temperature glass of
er sitting on a table has no apparent energy, either potential or kinetic. But on the microscopic scale it is a seething mass of high speed molecules traveling at hundreds of meters per second. If the water were
rgy would not necessarily be changed when we superimpose
U is the most common symbol used for internal energy. Related energy quantities which are particularly halpy, Helmholtz free energy, and Gibbs free energy.
The first law of thermodynamics is the application of the conservation of energy principle to heat and
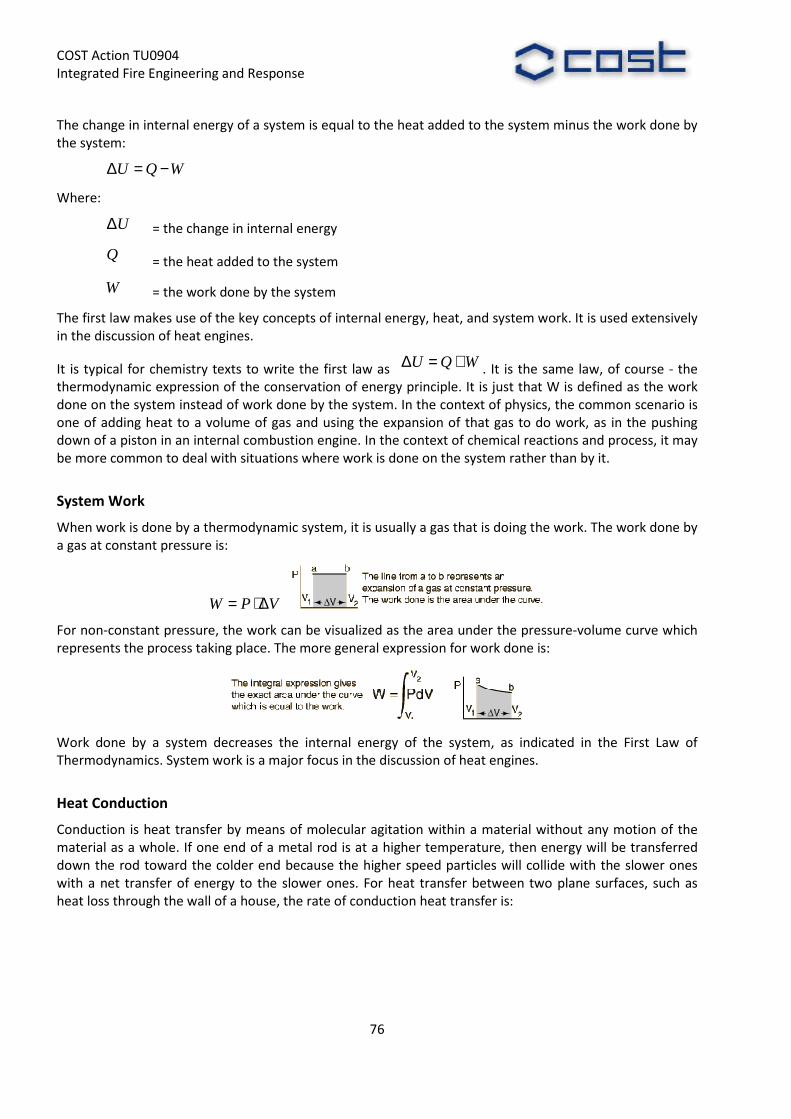
COST Action TU0904 Integrated Fire Engineering and Response
The change in internal energy of a system is ethe system:
U Q W∆ = −
Where:
U∆ = the change in internal energy
Q = the heat added to the system
W = the work done by the system
The first law makes use of the key concepts of internal energy, heat, and system work. It is used extensively in the discussion of heat engines.
It is typical for chemistry texts to write the first law asthermodynamic expression of the conservation of energy principle. It is just that W is defined as the work done on the system instead of work done by the system. In the context of physics, the common scenario is one of adding heat to a volume of gas and using the expansion of that gas to do work, as in the pushing down of a piston in an internal combustion engine. In the context of chemical reactions and process, it may be more common to deal with situations where work
System Work
When work is done by a thermodynamic system, it is usually a gas that is doing the work. The work done by a gas at constant pressure is:
W P V= ⋅ ∆
For non-constant pressure, the work can be visualized as the area under the pressurerepresents the process taking place. The more general expression for work done is:
Work done by a system decreases the internal energy of the system, as indicated in the First Law of Thermodynamics. System work is a major focus in the discussion of heat engines.
Heat Conduction
Conduction is heat transfer by means of molecular agitation within a material without any motion of the material as a whole. If one end of a metal rod is at a hdown the rod toward the colder end because the higher speed particles will collide with the slower ones with a net transfer of energy to the slower ones. For heat transfer between two plane surfaces, such heat loss through the wall of a house, the rate of conduction heat transfer is:
Integrated Fire Engineering and Response
76
The change in internal energy of a system is equal to the heat added to the system minus the work done by
= the change in internal energy
= the heat added to the system
work done by the system
The first law makes use of the key concepts of internal energy, heat, and system work. It is used extensively
It is typical for chemistry texts to write the first law as U Q W∆ = + . It is the same law, of course thermodynamic expression of the conservation of energy principle. It is just that W is defined as the work done on the system instead of work done by the system. In the context of physics, the common scenario is
adding heat to a volume of gas and using the expansion of that gas to do work, as in the pushing down of a piston in an internal combustion engine. In the context of chemical reactions and process, it may be more common to deal with situations where work is done on the system rather than by it.
When work is done by a thermodynamic system, it is usually a gas that is doing the work. The work done by
can be visualized as the area under the pressurerepresents the process taking place. The more general expression for work done is:
Work done by a system decreases the internal energy of the system, as indicated in the First Law of ermodynamics. System work is a major focus in the discussion of heat engines.
Conduction is heat transfer by means of molecular agitation within a material without any motion of the material as a whole. If one end of a metal rod is at a higher temperature, then energy will be transferred down the rod toward the colder end because the higher speed particles will collide with the slower ones with a net transfer of energy to the slower ones. For heat transfer between two plane surfaces, such heat loss through the wall of a house, the rate of conduction heat transfer is:
qual to the heat added to the system minus the work done by
The first law makes use of the key concepts of internal energy, heat, and system work. It is used extensively
. It is the same law, of course - the thermodynamic expression of the conservation of energy principle. It is just that W is defined as the work done on the system instead of work done by the system. In the context of physics, the common scenario is
adding heat to a volume of gas and using the expansion of that gas to do work, as in the pushing down of a piston in an internal combustion engine. In the context of chemical reactions and process, it may
is done on the system rather than by it.
When work is done by a thermodynamic system, it is usually a gas that is doing the work. The work done by
can be visualized as the area under the pressure-volume curve which
Work done by a system decreases the internal energy of the system, as indicated in the First Law of
Conduction is heat transfer by means of molecular agitation within a material without any motion of the igher temperature, then energy will be transferred
down the rod toward the colder end because the higher speed particles will collide with the slower ones with a net transfer of energy to the slower ones. For heat transfer between two plane surfaces, such as

COST Action TU0904 Integrated Fire Engineering and Response
( )A T TQ hot coldt d
κ −=
Where
Q = heat transferred in time t
κ = thermal conductivity of the
A = area
T = temperature
d = thickness of barrier
Heat Convection
Convection is heat transfer by mass motion of a fluid such as air or water when the heated fluid is causemove away from the source of heat, carrying energy with it. Convection above a hot surface occurs because hot air expands, becomes less dense, and rises (see Ideal Gas Law). Hot water is likewise less dense than cold water and rises, causing convectio
Integrated Fire Engineering and Response
77
Q/t
Thot Tcold
)hot cold
= heat transferred in time t
= thermal conductivity of the barrier
= thickness of barrier
Convection is heat transfer by mass motion of a fluid such as air or water when the heated fluid is causemove away from the source of heat, carrying energy with it. Convection above a hot surface occurs because hot air expands, becomes less dense, and rises (see Ideal Gas Law). Hot water is likewise less dense than cold water and rises, causing convection currents which transport energy.
Convection can also lead to circulation in a liquid, as in the heating of a pot of water over a flame. Heated water expands and becomes more buoyant. Cooler, more dense water near the surface descends and patterns of circulation can be formed, though they will not be as regular as suggested in the drawing.
Convection is heat transfer by mass motion of a fluid such as air or water when the heated fluid is caused to move away from the source of heat, carrying energy with it. Convection above a hot surface occurs because hot air expands, becomes less dense, and rises (see Ideal Gas Law). Hot water is likewise less dense than
Convection can also lead to circulation in a liquid, as in the heating of a pot of water over a flame. Heated water expands and becomes more buoyant. Cooler, more dense water near the surface descends and
circulation can be formed, though they will not be as regular
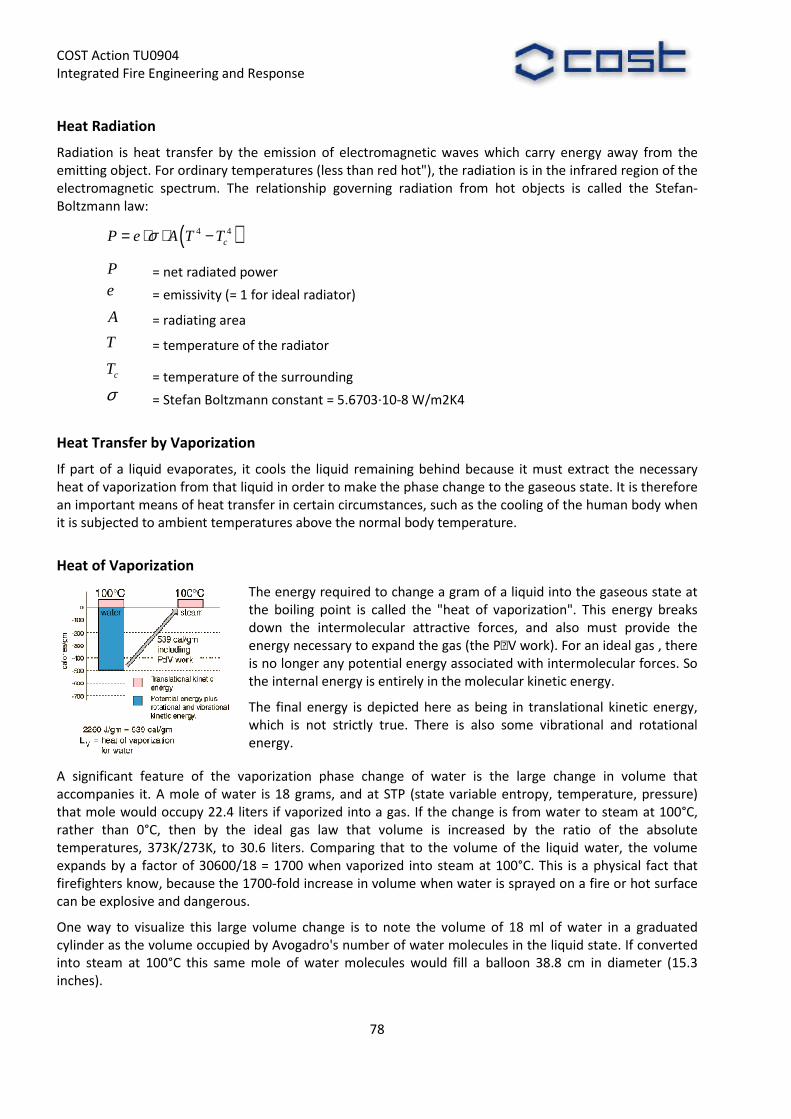
COST Action TU0904 Integrated Fire Engineering and Response
Heat Radiation
Radiation is heat transfer by the emission of electromagnetic waves which carry energy away from the emitting object. For ordinary temperatures (lelectromagnetic spectrum. The relationship governing radiation from hot objects is called the StefanBoltzmann law:
( )4 4cP e A T Tσ= ⋅ ⋅ −
P = net radiated power
e = emissivity (= 1 for ideal radiator)
A = radiating area
T = temperature of the radiator
cT = temperature of the surrounding
σ = Stefan Boltzmann constant = 5.6703
Heat Transfer by Vaporization
If part of a liquid evaporates, it cools the liquid remaining behind because it must extract the necessary heat of vaporization from that liquid in order to make the phase chanan important means of heat transfer in certain circumstances, such as the cooling of the human body when it is subjected to ambient temperatures above the normal body temperature.
Heat of Vaporization
The energy the boiling point is called the "heat of vadown the intermolecular attractive forces, and also must provide the energy necessary to expand the gas (the Pis no longer any potential energy associated with intermolecular forces. So the internal energy is entirely in the molecular kinetic energy.
The final energy is depicted here as being in translational kinetic energy, which is not strictly true. There is also some vibrational and rotational energy.
A significant feature of the vaporization phase change of water is the large change in volume that accompanies it. A mole of water is 18 grams, and at STP (state variable entropy, temperature, pressure) that mole would occupy 22.4 liters if vaporized into a gas. If the change is from water rather than 0°C, then by the ideal gas law that volume is increased by the ratio of the absolute temperatures, 373K/273K, to 30.6 liters. Comparing that to the volume of the liquid water, the volume expands by a factor of 30600/18 = 1700firefighters know, because the 1700-fold increase in volume when water is sprayed on a fire or hot surface can be explosive and dangerous.
One way to visualize this large volume change is tcylinder as the volume occupied by Avogadro's number of water molecules in the liquid state. If converted into steam at 100°C this same mole of water molecules would fill a balloon 38.8 cm in diameter (15.inches).
Integrated Fire Engineering and Response
78
Radiation is heat transfer by the emission of electromagnetic waves which carry energy away from the emitting object. For ordinary temperatures (less than red hot"), the radiation is in the infrared region of the electromagnetic spectrum. The relationship governing radiation from hot objects is called the Stefan
= emissivity (= 1 for ideal radiator)
= temperature of the radiator
= temperature of the surrounding
= Stefan Boltzmann constant = 5.6703∙10-8 W/m2K4
If part of a liquid evaporates, it cools the liquid remaining behind because it must extract the necessary heat of vaporization from that liquid in order to make the phase change to the gaseous state. It is therefore an important means of heat transfer in certain circumstances, such as the cooling of the human body when it is subjected to ambient temperatures above the normal body temperature.
The energy required to change a gram of a liquid into the gaseous state at the boiling point is called the "heat of vaporization". This energy breaks down the intermolecular attractive forces, and also must provide the energy necessary to expand the gas (the PV work). For an ideal gas , there is no longer any potential energy associated with intermolecular forces. So
internal energy is entirely in the molecular kinetic energy.
The final energy is depicted here as being in translational kinetic energy, which is not strictly true. There is also some vibrational and rotational energy.
zation phase change of water is the large change in volume that accompanies it. A mole of water is 18 grams, and at STP (state variable entropy, temperature, pressure) that mole would occupy 22.4 liters if vaporized into a gas. If the change is from water rather than 0°C, then by the ideal gas law that volume is increased by the ratio of the absolute temperatures, 373K/273K, to 30.6 liters. Comparing that to the volume of the liquid water, the volume expands by a factor of 30600/18 = 1700 when vaporized into steam at 100°C. This is a physical fact that
fold increase in volume when water is sprayed on a fire or hot surface
One way to visualize this large volume change is to note the volume of 18 ml of water in a graduated cylinder as the volume occupied by Avogadro's number of water molecules in the liquid state. If converted into steam at 100°C this same mole of water molecules would fill a balloon 38.8 cm in diameter (15.
Radiation is heat transfer by the emission of electromagnetic waves which carry energy away from the ess than red hot"), the radiation is in the infrared region of the
electromagnetic spectrum. The relationship governing radiation from hot objects is called the Stefan-
If part of a liquid evaporates, it cools the liquid remaining behind because it must extract the necessary ge to the gaseous state. It is therefore
an important means of heat transfer in certain circumstances, such as the cooling of the human body when
required to change a gram of a liquid into the gaseous state at porization". This energy breaks
down the intermolecular attractive forces, and also must provide the V work). For an ideal gas , there
is no longer any potential energy associated with intermolecular forces. So internal energy is entirely in the molecular kinetic energy.
The final energy is depicted here as being in translational kinetic energy, which is not strictly true. There is also some vibrational and rotational
zation phase change of water is the large change in volume that accompanies it. A mole of water is 18 grams, and at STP (state variable entropy, temperature, pressure) that mole would occupy 22.4 liters if vaporized into a gas. If the change is from water to steam at 100°C, rather than 0°C, then by the ideal gas law that volume is increased by the ratio of the absolute temperatures, 373K/273K, to 30.6 liters. Comparing that to the volume of the liquid water, the volume
when vaporized into steam at 100°C. This is a physical fact that fold increase in volume when water is sprayed on a fire or hot surface
o note the volume of 18 ml of water in a graduated cylinder as the volume occupied by Avogadro's number of water molecules in the liquid state. If converted into steam at 100°C this same mole of water molecules would fill a balloon 38.8 cm in diameter (15.3