state-of-the-art approaches to bicycle and pedestrian counters
TRANSCRIPT

State-of-the-Art Approaches to Bicycle
and Pedestrian Counters
NCDOT Project 2020-39
FHWA/NC/2020-39
March 2021
Erol Ozan
East Carolina University
Sarah Searcy
Blythe Carter Geiger
Chris Vaughan
Chris Carnes
Craig Baird
Institute for Transportation Research and Education (ITRE)
North Carolina State University
Aaron Hipp
Department of Parks, Recreation, and Tourism Management
North Carolina State University

Technical Report Documentation Page
1. Report No. FHWA/NC/2020-39
2. Government Accession No.
3. Recipient’s Catalog No.
4. Title and Subtitle
State-of-the-Art Approaches to Bicycle and Pedestrian Counters
5. Report Date March 2021
6. Performing Organization Code
7. Author(s) Erol Ozan, Sarah Searcy, Blythe Carter Geiger, Chris Vaughan, Chris Carnes, Craig Baird, Aaron Hipp
8. Performing Organization Report No.
9. Performing Organization Name and Address East Carolina University College of Engineering and Technology, Department of Technology Systems Science and Technology Building Greenville, North Carolina 27858
Institute for Transportation Research and Education North Carolina State University Centennial Campus Box 8601 Raleigh, North Carolina 27695
10. Work Unit No. (TRAIS)
11. Contract or Grant No.
12. Sponsoring Agency Name and Address North Carolina Department of Transportation Research and Development Unit 1020 Birch Ridge Drive, Building B Raleigh, North Carolina 27619
13. Type of Report and Period Covered
Final Report August 1, 2019 to March 31, 2021
14. Sponsoring Agency Code 2020-39
Supplementary Notes:
16. Abstract This project determined the state of practice for bicycle and pedestrian counting technologies to inform the enhancement and future growth of the North Carolina Non-Motorized Volume Data Program (NC NMVDP). This objective was accomplished by interviewing governmental agencies, private non-motorized technology vendors, and private traffic counting providers; evaluating the performance of the currently deployed Eco-Counter technology; researching recent advancements in bicycle and pedestrian counting; identifying the costs, benefits, limitations, and operational requirements for varying technology types; and determining options for managing cost and data integration across varying data collection platforms and with other state agencies and local governments. The research results provide a menu of counting technologies with an accompanying cost analysis and data integration plan that NCDOT can draw on to enhance the NC NMVDP by matching technology types to non-motorized volume data needs at the local-, regional-, and state-level. This project provides guidance on alternatives to supplement the current systems with newer, more cost-effective, and more efficient data collection components or systems.
17. Key Words Pedestrians, Bicyclists, Non-Motorized, Counting, Technologies, North Carolina
18. Distribution Statement
19. Security Classif. (of this report) Unclassified
20. Security Classif. (of this page) Unclassified
21. No. of Pages 84
22. Price
Form DOT F 1700.7 (8-72) Reproduction of completed page authorized

1
March 2021
State-of-the-Art Approaches to Bicycle and Pedestrian Counters
NCDOT Research Project No. RP 2020-39 Submitted to: North Carolina Department of Transportation Integrated Mobility Division Submitted by: East Carolina University – Department of Technology Systems North Carolina State University – Institute for Transportation Research and Education & Department of Parks, Recreation, and Tourism Management Report Authors: Erol Ozan, Sarah Searcy, Blythe Carter Geiger, Chris Vaughan, Chris Carnes, Craig Baird, and Aaron Hipp

2
Disclaimer
The contents of this report reflect the views of the authors and not necessarily the views of East Carolina University, the Institute for Transportation Research and Education, or North Carolina State University. The authors are responsible for the facts and the accuracy of the data presented herein. The contents do not necessarily reflect the official views or policies of the North Carolina Department of Transportation or the Federal Highway Administration at the time of publication. This report does not constitute a standard, specification, or regulation.

3
Table of Contents
Table of Contents .................................................................................................................................................... 3 List of Figures .......................................................................................................................................................... 5 List of Tables ............................................................................................................................................................ 6 Introduction ............................................................................................................................................................ 7 Research Objectives ................................................................................................................................................ 8 Literature Review .................................................................................................................................................... 8
Bicycle and Pedestrian Technology Assessments ............................................................................................... 8 Federal and National Resources ................................................................................................................... 9 Other Agency Resources ............................................................................................................................. 12
Bicycle and Pedestrian Counting Guidance ...................................................................................................... 13 Bicycle and Pedestrian Counting Technology Overview ................................................................................... 18
State of the Practice Interview Summary ............................................................................................................. 28 Background ...................................................................................................................................................... 28 Public Non-Motorized Traffic Counting Programs (Government Agencies)..................................................... 29
Data Types ................................................................................................................................................... 29 QA/QC Practices .......................................................................................................................................... 29 Data Reporting ............................................................................................................................................ 30 Community Challenges ............................................................................................................................... 30 Technologies Employed by Governmental Agencies .................................................................................. 30
Non-Motorized Counting Technology Vendors ................................................................................................ 33 Private Traffic Counting Providers ................................................................................................................... 33
Eco-Counter Performance Evaluation ................................................................................................................... 33 Background ...................................................................................................................................................... 33
Bicycle and Pedestrian Technology Testing .......................................................................................................... 39 Background ...................................................................................................................................................... 39 Testing Plan ...................................................................................................................................................... 40 Site Selection .................................................................................................................................................... 41 Data Collection Schedule .................................................................................................................................. 42 Data Processing ................................................................................................................................................ 42 Interrater Reliability ......................................................................................................................................... 44 Data Summary ................................................................................................................................................. 45 Data Analysis .................................................................................................................................................... 46
Analysis by Technology Type ................................................................................................................................. 47 Overall .............................................................................................................................................................. 47 Passive Infrared ................................................................................................................................................ 47
Qualitative Experience ................................................................................................................................ 47 Accuracy and Consistency ........................................................................................................................... 48 Accuracy and Consistency – Rain Condition ............................................................................................... 49
Inductive Loops ................................................................................................................................................. 49 Qualitative Experience ................................................................................................................................ 49 Accuracy and Consistency ........................................................................................................................... 50 Accuracy and Consistency – Rain Condition ............................................................................................... 51
Piezoelectric Strips ........................................................................................................................................... 51 Qualitative Experience ................................................................................................................................ 51 Accuracy and Consistency ........................................................................................................................... 52 Accuracy and Consistency – Rain Condition ............................................................................................... 53
Pneumatic Tubes .............................................................................................................................................. 53 Qualitative Experience ................................................................................................................................ 53

4
Accuracy and Consistency ........................................................................................................................... 54 Accuracy and Consistency – Rain Condition ............................................................................................... 55
Standard Video with Algorithm Processing ...................................................................................................... 55 Qualitative Experience ................................................................................................................................ 55 Accuracy and Consistency ........................................................................................................................... 56 Accuracy and Consistency – Rain Condition ............................................................................................... 57 Accuracy and Consistency – Night Condition .............................................................................................. 58
Depth Camera .................................................................................................................................................. 59 Qualitative Experience ................................................................................................................................ 59 Accuracy and Consistency ........................................................................................................................... 60 Accuracy and Consistency – Rain Condition ............................................................................................... 61 Accuracy and Consistency – Night Condition .............................................................................................. 62
Cost Benefit/Performance Analysis and Management Plan ................................................................................. 63 Performance Analysis ....................................................................................................................................... 63 Cost-Benefit Analysis and Its Implications on the Future Deployment and Management Plans ..................... 65 Data Integration and Certain Considerations for System Management ......................................................... 66
Discussion and Conclusions ................................................................................................................................... 67 Diversity, Equity, and Inclusion ........................................................................................................................ 68 Future Research ............................................................................................................................................... 69
References ............................................................................................................................................................. 71 Appendix A. Equipment Attribute Scoring Form ................................................................................................... 76 Appendix B. Cost Summary for Tested Technologies ........................................................................................... 78 Appendix C. Video Reduction Protocol and Site Diagrams ................................................................................... 79 Appendix D. Equipment Installation and Software Use Questionnaires and Summary ....................................... 81

5
List of Figures
Figure 1. Validation Video Camera Installation at a Testing Location on a Shared Use Path ............................... 41 Figure 2. Eco-Counter MULTI with Passive Infrared PYRO in a Wooden Post (left) and TRAFx Trail Counter (right) ............................................................................................................................................................................... 48 Figure 3. Passive Infrared Accuracy Plots .............................................................................................................. 48 Figure 4. Eco-Counter MULTI with (a) Passive Infrared PYRO in a Wooden Post and (b) Inductive Loop ZELT ... 50 Figure 5. Inductive Loops Accuracy Plot................................................................................................................ 50 Figure 6. Initial Installation (left), Applying Additional Resin (center), and Final Pressure Pad Height (right) ..... 52 Figure 7. Piezoelectric Strips Accuracy Plots ......................................................................................................... 52 Figure 8. Tube Ends with Cable Ties (left) and Tubes Taped Down to Pavement Surface (right)......................... 54 Figure 9. Pneumatic Tubes Accuracy Plot ............................................................................................................. 54 Figure 10. Miovision Scout Installation on a Parking Sign .................................................................................... 56 Figure 11. Standard Video with Algorithm Processing Accuracy Plots ................................................................. 57 Figure 12. CITIX 3D Installation on the Horizontal Mast Arm of a Traffic Signal................................................... 60 Figure 13. Depth Camera Accuracy Plots .............................................................................................................. 61 Figure 14. Validation Video Example – Reedy Creek Greenway to the west of the I-440 pedestrian bridge (Raleigh, NC) .......................................................................................................................................................... 79 Figure 15. Validation Video Example – Hargett Street at Person Street (Raleigh, NC) ......................................... 79 Figure 16. Validation Video Example – Centennial Parkway at Oval Drive (Raleigh, NC) ..................................... 80

6
List of Tables
Table 1. Summary of Counting Guidance by Locality – Adapted from the NC NMVDP Phase 2 Final Report ...... 15 Table 2. Description of Counting Technologies with Typical Application and Site Type ...................................... 19 Table 3. Counting Technologies with Strengths and Weaknesses ........................................................................ 21 Table 4. Counting Technologies with Accuracy and Cost ...................................................................................... 23 Table 5. Counting Technologies with Typical Maintenance and Ease of Installation Information ....................... 26 Table 6. List of Agencies Interviewed .................................................................................................................... 28 Table 7. Proportion of Agencies that Collect Data Types ...................................................................................... 29 Table 8. Quality Assurance Practices .................................................................................................................... 29 Table 9. Data Publishing Information .................................................................................................................... 30 Table 10. Non-Motorized Counting Program Community Issues ......................................................................... 30 Table 11. Technologies Deployed by Governmental Agencies ............................................................................. 31 Table 12. Technology Rating System ..................................................................................................................... 32 Table 13. Technology Reviews by Governmental Agencies .................................................................................. 32 Table 14. Data Available for Each Technology Product ........................................................................................ 33 Table 15. Cost Associated with the Deployment of Eco-Counters in the NC NMVDP .......................................... 35 Table 16. Historic Missing Count Data in the NC NMVDP from 2015 through 2020 ............................................ 36 Table 17. Evaluation of Eco-Counter MULTI Systems Included in the NC NMVDP – Installation and Maintenance ............................................................................................................................................................................... 37 Table 18. Evaluation of Eco-Counter MULTI Systems Included in the NC NMVDP – Data Transmission, Accuracy, Storage, and Access ............................................................................................................................................... 38 Table 19. Average Scores of Each Equipment Attribute ....................................................................................... 39 Table 20. Technologies Considered for Testing and Final Scores ......................................................................... 40 Table 21. Final Testing Sites with Associated Technologies and Installation Dates ............................................. 43 Table 22. Validation Video Summary .................................................................................................................... 44 Table 23. Interrater Reliability Results .................................................................................................................. 44 Table 24. Summary of Data Included in Analyses ................................................................................................. 45 Table 25. Accuracy and Consistency Measures Used in Analyses ........................................................................ 46 Table 26. Accuracy and Consistency Values for Passive Infrared Sensors ............................................................ 49 Table 27. Accuracy and Consistency Values for Passive Infrared Sensors – Rain Condition ................................ 49 Table 28. Accuracy and Consistency Values for Inductive Loops .......................................................................... 51 Table 29. Accuracy and Consistency Values for Inductive Loops – Rain Condition .............................................. 51 Table 30. Accuracy and Consistency Values for Piezoelectric Strips ..................................................................... 53 Table 31. Accuracy and Consistency Values for Piezoelectric Strips – Rain Condition ......................................... 53 Table 32. Accuracy and Consistency Values for Pneumatic Tubes ....................................................................... 55 Table 33. Accuracy and Consistency Values for Pneumatic Tubes – Rain Condition ............................................ 55 Table 34. Accuracy and Consistency Values for Standard Video with Algorithm Processing ............................... 57 Table 35. Accuracy and Consistency Values for Standard Video with Algorithm Processing – Rain Condition ... 58 Table 36. Accuracy and Consistency Values for Standard Video with Algorithm Processing – Night Condition .. 59 Table 37. Accuracy and Consistency Values for Depth Camera ............................................................................ 61 Table 38. Accuracy and Consistency Values for Depth Camera – Rain Condition ................................................ 62 Table 39. Accuracy and Consistency Values for Depth Camera – Night Condition .............................................. 63 Table 40. Mapping of MPE, MAPE, and WMPE into a Rating Scheme of 1 to 5 ................................................... 64 Table 41. Mapping of r into a Rating Scheme of 1 to 5 ......................................................................................... 64 Table 42. Comparative Analysis of the Accuracies of the Tested Technologies ................................................... 64 Table 43. Qualitative Cost-Benefit Analysis of the Technologies Tested .............................................................. 66 Table 44. Cost Summary for Tested Technologies ................................................................................................ 78 Table 45. Equipment Installation Questionnaires and Summary ......................................................................... 81 Table 46. Software Use Questionnaires and Summary......................................................................................... 82

7
Introduction
Since 2013, the Institute for Transportation Research and Education (ITRE) has developed and managed North Carolina’s Non-Motorized Volume Monitoring Program (NMVDP) under contract to the North Carolina Department of Transportation (NCDOT). The primary purpose of this program is to establish a common, consistent system for quantifiably measuring non-motorized traffic volumes based on sound methods. The program models the concepts for collecting motor vehicle traffic counts and estimating annual average daily traffic (AADT), a process based on years of research and experience, for bicycle and pedestrian traffic monitoring. Bicycle and pedestrian traffic monitoring is a relatively new field of study comprised mostly of projects in the pilot phase of implementation. The bicycle and pedestrian count data collected in the program can be used to evaluate facility usage over time, inform the project prioritization process, provide quantifiable evidence to support multi-modal Complete Streets policies, and improve municipal and regional active transportation planning. The data can further be used in planning tools to measure existing patterns and model future trends at the site, corridor, and regional levels.
Since the inception of the program, ITRE and NCDOT have worked with Eco-Counter to procure bicycle and pedestrian counting equipment, manage count data transmission and storage, and develop strategies for analyzing and reporting the count data. Based in Lannion, France, Eco-Counter specializes in bicycle and pedestrian counting solutions. Based on purchases and deployments under Phase 1 and 2 of the program, the NC NMVDP currently includes 72 individual Eco-Counter loggers across several regions of the state. NCDOT seeks to evaluate the performance of the deployed technology; to review recent advancements in bicycle and pedestrian counting technologies (including alternatives to the infrared and electro-magnetic loop systems currently used); to identify the costs, benefits, limitations, and operational requirements for varying technology types; and to determine options for managing the cost and data integration across varying data collection platforms and with other state agencies and local governments.
NCDOT seeks to determine if alternative technologies and equipment have the potential to improve the effectiveness and efficiency of the current pedestrian and bicycle data collection approach. Researchers anticipate that state-of-the-art technological solutions are likely to augment the quality of the data collection process through faster data collection methods, more efficient data sharing, and better data integration with existing traffic engineering and planning initiatives. The selected method(s) should be cost-effective and should facilitate reliable, manageable, and accountable operation with a reasonable equipment life. The performance of the selected technical approach should provide adequate justification for the recommended system by giving an extensive account of comparative cost-benefit and relevant performance metrics. The recommended technical solution may involve a single integrative set of equipment or it may be a combination of multiple sensor technologies. The technical recommendation may further divide current challenges into subcomponent solutions, such as data communication unit, sensor unit, and data processing unit, as well as recommend appropriate technologies for each subcomponent. The most cost-effective, accurate, and implementable technical recommendations are provided based on the findings of this research.

8
Research Objectives
The objective of this project is to determine the state of practice for bicycle and pedestrian counting technologies to inform the enhancement and future growth of the NC NMVDP. This objective was accomplished by interviewing governmental agencies that manage non-motorized traffic counting programs, private traffic counting companies, and private non-motorized technology manufacturers to gather information on the state of the practice for counting pedestrians and bicycles; evaluating the performance of the currently deployed Eco-Counter technology; researching recent advancements in bicycle and pedestrian counting technologies (including alternatives to the infrared and electro-magnetic loop systems currently used); identifying the costs, benefits, limitations, and operational requirements for varying technology types, including sources of error that must be accounted for to produce valid and quality data; and determining options for managing the cost and data integration across varying data collection platforms and with other state agencies and local governments.
The ultimate outcome of this research is a menu of counting technologies with an accompanying cost analysis and data integration plan that NCDOT can draw on to improve efficiencies in and enhance the NC NMVDP by matching technology types to non-motorized volume data needs at the local-, regional-, and state-level. This project provides guidance on alternatives to supplement the current systems with newer, more cost-effective, and more efficient data collection components or systems.
Literature Review
This literature review was conducted to determine the state of the practice related to advances in bicycle and pedestrian counting technologies with a focus on new technology types that have been developed since the North Carolina’s Non-Motorized Volume Data Program (NC NMVDP) launched in 2013. This review identifies and summarizes national guidance, resources developed by other state DOTs, peer-reviewed articles, and other documentation related to the testing, evaluation, and valid use of bicycle and pedestrian counting devices. The information gathered supports subsequent state of the practice interviews not only with equipment vendors to compile detailed technical descriptions of various counting technologies to determine their applicability and validity for pedestrian and bicycle counting, but also with state DOTs and international agencies to learn about their experiences and best practices for counting bicycles and pedestrians.
A total of 57 reports, publications, and studies were considered in this review. The review specifically targeted research that evaluated bicycle and pedestrian technologies and any bicycle and pedestrian counting guidance developed by municipalities, states, and at the national level. These studies and their findings are summarized below. This document concludes with a summary table describing currently available bicycle and pedestrian counting technologies based on the reviewed literature.
Bicycle and Pedestrian Technology Assessments
Our review compiled and examined bicycle and pedestrian technology assessments available from federal and state governments and other sources. The three sections below summarize the current research and guidance relative to the appropriateness and accuracy of different technology types for counting bicycles and pedestrians. The first section provides an overview of the federal and national

9
resources while the second one focuses on those of other agencies. The third section gives an account of the bicycle and pedestrian counting guidance provided by municipalities and state DOTs.
Federal and National Resources
The first nationwide effort to standardized bicycle and pedestrian data collection and to provide ongoing data to practitioners began in 2004 as the National Bicycle and Pedestrian Documentation Project (NBPDP), which focused on manually collected, short-duration counts. The United States Department of Transportation (USDOT)’s Federal Highway Administration (FHWA) updated its Traffic Monitoring Guide (TMG) in 2013 with a new chapter devoted to nonmotorized traffic monitoring practices. This update was informed by an extensive research project to assess the state of the practice of bicycle and pedestrian data collection based on a review of current literature and practitioner input through webinars and interviews. Since this effort, multiple federally funded studies have been completed to assess various technologies for use in counting bicycles and pedestrians across different contexts and time durations, as well as to determine best practices for selecting counting locations, installing equipment, ensuring data quality, and storing and sharing data. Other agencies developed guidance at the state and local levels based on the latest federal recommendations.
National Bicycle and Pedestrian Documentation Project (NBPDP) (2004)
The National Bicycle and Pedestrian Documentation Project (NBPDP) was created in 2004, co-sponsored by Alta Planning and Design and the Institute of Transportation Engineers (ITE) Pedestrian and Bicycle Council as the first nationwide effort to create a standardized data collection protocol and format for bicycle and pedestrian counts and to provide ongoing data for use by planners, governments, and bicycle and pedestrian professionals. The project’s website provides forms, instructions, and additional information for agencies interested in conducting short-duration non-motorized counts.
FHWA Bicycle and Pedestrian Data Collection (2011)
This research assesses the state of the practice of bicycle and pedestrian data collection in the United States based on a review of current literature and practitioner input through webinars and interviews to inform an update to the Traffic Monitoring Guide (TMG). This research shows that limited literature existed at the time to provide guidance for data collection, standardization, storage, and reporting for bicycle and pedestrian counting and that no one consistent approach was being implemented at local, state, and national levels.
Transportation Research Circular: Monitoring Bicyclist and Pedestrian Travel and Behavior (E-C183, March 2014)
This research circular provides an overview of national baselines for non-motorized travel in the United States and a summary of the state of the practice on bicycle and pedestrian travel monitoring at the time of publication. The circular states that data collected using the methods from the National Bicycle and Pedestrian Documentation Project (NBPDP) possesses limited value for systematic comparisons and that adjustment factors are not sufficient to derive a reliable nationwide model. One of the newer data collection techniques detailed in the circular is technology-assisted manual counting through an app called BikeCount, which takes advantage of smartphone technology in an

10
attempt to obtain large numbers of short-term counts, including through crowdsourcing. However, this data collection technique suffers from bias, since it only captures data from those with a smartphone and the BikeCount app. Portable counters provide the flexibility to move counting devices to different locations as needed. Equipment adjustment factors can be used to correct equipment error, such as the systematic undercounting that can occur with portable counters. Permanent counters are useful to create local adjustment factors that can then be applied to short-duration counts, including factors to account for local weather and seasonal variability. The circular further discusses communication strategies that permanent sites can provide such as “bike barometers” that give real-time information to the public, and it highlights the importance of a strategy for quality assurance of count data collected by automated counters.
The circular also discusses the lack of national data standards for bicycling and walking. While the Federal Highway Administration’s Travel Monitoring Analysis System (TMAS) promised to enable online data submittal by state departments of transportation, it did not include bicycle and pedestrian data at the time that the circular was published.
FHWA Bicycle-Pedestrian Count Technology Pilot Project (2016)
This report summarizes the FHWA’s one-year pilot project to increase the organizational and technical capacity of Metropolitan Planning Organizations (MPOs) not only to establish and operate effective bicycle and pedestrian count programs, but also to provide lessons learned for peer agencies across the country. Ten MPOs from across the country were selected to participate in the pilot. The report summarizes the experiences of the MPOs with identifying count locations, selecting and installing count equipment, and collecting and using the data. When selecting counting technologies and vendors, MPOs evaluated several factors, including local conditions at count locations, cost, ease of installation and portability, quality of technical support from manufacturer, method of data collection, and recommendations from State DOTs and other government agencies. Four types of automated counters were used in the pilot project: passive infrared (IR) devices, pneumatic tubes, radar sensors, and video detection.
Exploring Pedestrian Counting Procedures: A Review and Compilation of Existing Procedures, Good Practices, and Recommendations (2016)
This report provides guidance and best practices for measuring pedestrian travel. The report outlines the available technologies for counting pedestrians along with their typical applications, strengths, and weakness as referenced from the FHWA Traffic Monitoring Guide and NCHRP Report 797: Guidebook on Pedestrian and Bicycle Volume Data Collection. The report suggests that the most used pedestrian counting technologies include manual counts (both in-field and from video), automated video counts, passive and active infrared devices, and radio beams. Thermal cameras, laser scanners, and pressure or acoustic pads are used less frequently. Other technologies that can capture surrogate measures of pedestrian traffic volumes include Bluetooth or Wi-Fi technology, or traffic signals that record pedestrian pushbutton actuations.
FHWA Traffic Monitoring Guide (2013, 2016)
The FHWA Traffic Monitoring Guide (TMG) includes a chapter (Chapter 4) on non-motorized volume monitoring with guidance on selecting the appropriate counting equipment type. A simplified flowchart for selecting non-motorized count equipment is included to help inform decision-making

11
based on user type to be counted (pedestrians only, bicyclists only, pedestrians and bicyclists combined, or pedestrians and bicyclists separately) and estimated cost.
NCHRP Report 797: Guidebook on Pedestrian and Bicycle Volume Data Collection (2014)
This guidebook describes methods and technologies for counting pedestrians and bicyclists, offers guidance on developing a non-motorized count program, and provides recommendations on selecting appropriate counting methods and technologies. Twelve different types of automating counting equipment were tested, providing comparisons among the different technologies’ accuracy, precision, installation considerations, relative level of effort and cost, and typical applications. Two types of manual counting methods (manual in-field counting and manual counts from video) are also evaluated.
NCHRP Web-Only Document 205: Methods and Technologies for Pedestrian and Bicycle Volume Data Collection (2014)
This report describes the research approach behind the development of NCHRP Report 797: Guidebook on Pedestrian and Bicycle Volume Data Collection. This project assessed existing, new, and innovative bicycle and pedestrian data collection technologies in an effort to provide guidance for transportation practitioners on the ways in which to best collect non-motorized volume data. Test locations were selected to achieve a range of weather conditions, mix of facility types, and mix of road users. Selected hours from two weeks of video were manually counted to ground truth the data. In addition to accuracy, the counting technologies were evaluated based on ease of implementation, labor requirements, security, maintenance, software, cost, and ease of data transmission. Product-specific accuracy varied significantly although the consistencies of the counted volumes were generally similar, meaning that a correction factor could be applied to the tested products.
The report recommends, with emphasis, that local correction factors (location- or device-specific) should be developed for automated counts. It states that a minimum of 30 time periods worth of ground truth data (e.g., approximately 8 hours of counts when 15-minute interval data are collected or 30 hours of counts when 60-minute data are collected) are necessary to develop correction factors. Time periods should include a range of volumes, including peak period volumes. Significant site-specific factors influenced the accuracy of the counts stressing the importance of site selection to mitigate potential bypass error, proper installation, and calibration, as well as the recommendation to validate counts by site rather than by the type of sensor technology used. The research reports no clear impact of temperature, snow, or rain on the accuracy of any of the assessed counting equipment.
NCHRP Web-Only Document 229: Methods and Technologies for Pedestrian and Bicycle Volume Data Collection – Phase 2 (2016)
This report summarizes follow-on research to the studies described in NCHRP Web-Only Document 205: Methods and Technologies for Pedestrian and Bicycle Volume Data Collection. This research evaluated additional automated bicycle and pedestrian counting technologies that were not on the market at the time of the previous studies to determine their respective reliability in different settings. The report documents the accuracy and consistency found for the different automated count technologies. In addition, the report provides a complete account of the process used to select technologies for testing, identify test sites, and evaluate the effectiveness of the technologies.

12
Other Agency Resources
Several agencies across the United States have completed studies to assess different technologies for use in counting bicycles and pedestrians based on local contexts with an emphasis on determining the accuracy of the devices. In addition, some research is available on emerging technologies such as the use of webcams, trail cams, and crowdsourcing for collecting observations of bicycles and pedestrians across different time durations and environmental conditions.
Traditional Technologies
Automated Bicycle Counts: Lessons from Boulder, Colorado (2010)
This study tested the accuracy of inductive loop technology for counting bicyclists through field testing on sidewalks in Boulder, Colorado. The results indicated that inductive loop sensors can provide accurate measurements of bicycles on a pathway, but only when the sensors are properly calibrated, the software is properly set, and external factors do not interfere. The sensors included in the study had received little or no maintenance in the past ten years. Generally, they tended to undercount cyclists. On average, the loop detectors counted 4% fewer bicycles than manual observers at the same locations. The average absolute percent difference was 19%. Approximately 68% of the sensor channels with enough counts to judge accuracy were deemed accurate. However, because some of the sensors were chosen for study specifically because they were suspected to be inaccurate, these findings may overrepresent the percentage of inaccurate sensor channels.
Using Inductive Loops to Count Bicycles in Mixed Traffic (2011)
This study tested the accuracy of an off-the-shelf inductive loop technology designed to count bicycles in mixed traffic conditions and then compared its accuracy to similar inductive loop technology used for detection on separated bicycle facilities. The technologies were deployed in Boulder, Colorado on a separated path, in bicycle lanes, on a travel lane shared with motor vehicles, and on a bicycle contraflow lane with one-way bicycle traffic. The inductive loop on the separated path undercounted by 3%, while the inductive loop on the shared roadway overcounted by 4%. The inductive loops in the bicycle lanes undercounted by 27%.
Accuracy of Bicycle Counting with Pneumatic Tubes in Oregon (2016)
This study tested the accuracy of multiple types of pneumatic tube counters for counting bicycles: two bicycle-specific counters, three varieties of motor vehicle classification counters, and one volume-only motor vehicle counter. The counters were deployed on Oregon DOT’s Traffic Systems Services Unit parking lot in Salem, Oregon for controlled testing and on a two-lane section with 4- to 5-foot shoulders on the Historic Columbia River Highway for naturalistic testing. The counters in both test scenarios showed strong evidence of undercounting. The controlled environment test resulted in greater accuracy than the naturalistic, mixed-traffic test that showed more extreme undercounting.
Collecting Network-wide Bicycle and Pedestrian Data: A Guidebook for When and Where to Count (2017)
This report provides a guide for collecting network-wide bicycle and pedestrian count data specific to the Washington State Bicycle and Pedestrian Documentation Project. This guide includes a review of

13
automated and manual counting methods, including those evaluated in NCHRP Report 797: Guidebook on Pedestrian and Bicycle Volume Data Collection.
Emerging Technologies
Emerging Technologies: Webcams and Crowd-sourcing to Identify Active Transportation (2013)
A publicly available webcam in Washington, D.C. was used to count pedestrians and cyclists before and after the addition of a cycle track. One image was captured from the webcam every 29 minutes. Images during one week prior to cycle track installation and during one week post-installation (June 2009 versus June 2010) were annotated for the presence of pedestrians and cyclists.
Webcams, Crowd-sourcing, and Enhanced Crosswalks: Developing a Novel Method to Analyze Active Transportation (2016)
Two publicly available roadway-intersection webcams in Washington, D.C. were used to understand variation in pedestrian and cyclist traffic across a full year, including daily and weekly variation and weather variation (e.g., precipitation versus none). This research used over 14,000 images and crowdsource annotation (Amazon Mechanical Turk).
Learning from Outdoor Webcams: Surveillance of Physical Activity across Environments (2017)
This research presents a variety of public webcams available for the annotation of pedestrian and cyclist behavior. Over 1,900 international cameras were keyword coded for the ability to count and locate pedestrians and/or cyclists. Data includes keywords (e.g., sidewalk, bike lane, bike racks) and reliability data for analyses.
Coupling Visitor and Wildlife Monitoring in Protected Areas Using Camera Traps (2017)
The research used trail cameras (static cameras and/or cameras triggered by movement) to count pedestrian and bicycle behavior on trails. The study includes information on proper camera set-up, such as ideal angle and height of camera.
Unique Views on Obesity-Related Behaviors and Environments: Research Using Still and Video Images (2018)
This article summarizes the use of cameras and video in obesity-related research, including applications that use images, video, and photo-voice related to pedestrian and cycling behavior. Most use has involved annotating and auditing environment, not behavior.
Visualization of Pedestrian Density Dynamics Using Data Extracted from Public Webcams (2019)
This research used publicly available webcams to visualize time and place of pedestrian activity in international plazas.
Bicycle and Pedestrian Counting Guidance
Our review also included bicycle and pedestrian counting guidance developed by municipalities and states, as well as the most current state of the practice syntheses. Highlights are provided below with additional sources summarized in Table 1. The table is adapted from the literature review provided in the NC NMVDP Phase 2 Final Report (2020).

14
Innovative Ways to Count Pedestrians and Bicyclists (2015)
This summary report by the New Jersey Bicycle and Pedestrian Resource Center describes efforts by the New Jersey Department of Transportation to evaluate technologies for counting pedestrians and bicycles. The technologies considered include infrared beams, infrared counters, piezoelectric pads, laser scanners, pneumatic tubes, inductive loops, and computer vision.
Innovation in Bicycle and Pedestrian Counts: A Review of Emerging Technology (2016)
Alta Planning + Design published a white paper that reviews emerging technology and innovations in bicycle and pedestrian counts. This paper provides a summary of counter types from existing literature and practice by technology type, manufacturer, user type to be counted, count duration, and count purpose. The paper also reviews crowd-sourced data collection applications that rely on mobile devices such as smartphones, video detection systems, and low-cost counting hardware.
Bicycle and Pedestrian Count Programs: Summary of Practice and Key Resources (2018)
This research brief by the Pedestrian and Bicycle Information Center (PBIC) provides a summary of current practice and key resources for implementing, expanding, or maintaining bicycle and pedestrian count programs. The document focuses on key aspects of count programs, including site selection, equipment, and data management.
Bicycle and Pedestrian Count Programs: Scan of U.S. Practice (2019)
This study identifies ways to plan and implement a non-motorized count program in Virginia. Its scope includes reviewing existing U.S. national-level guidance and examples from other state departments of transportation (DOTs) to determine the most effective ways of implementing such a program. Through a state of the practice review and interviews with public agency staff and researchers involved in three statewide non-motorized count programs, the study concluded that the practice of non-motorized travel monitoring has evolved and expanded in recent years; that many commercially available counting technologies exist and have been evaluated; that the practice of non-motorized travel monitoring, as with motorized travel monitoring, has several aspects beyond the purchase and installation of automatic count equipment; and that several states are developing non-motorized count programs and have begun using their data. These findings provide a foundational resource for state DOTs that are considering developing state-level counting programs.

15
Table 1. Summary of Counting Guidance by Locality – Adapted from the NC NMVDP Phase 2 Final Report
Locality Bicycle and Pedestrian Counting Guidance Document Authors Year
National Bicycle and Pedestrian Count Programs: Scan of U.S. Practice
Ohlms, P.; Dougald, L; MacKnight, H. 2019
National Biking and Walking Quality Counts: Using “Bike-Ped Portal” Counts to Develop Data Quality Checks McNeil, N.; Tufte, K.; Lee, T.; Nordback, K. 2019
National Bicycle and Pedestrian Count Programs: Summary of Practice and Key Resources
Nordback, K.; O'Brien, S.; Blank, K. 2018
National Bike-Ped Portal: Development of an Online Nonmotorized Traffic Count Archive Nordback, K.; Tufte, K.; McNeil, N.; Harvey, M.; Watkins, M. 2017
National Innovation in Bicycle and Pedestrian Counts: A Review of Emerging Technology
O'Toole, K.; Piper, S. 2016
National Traffic Monitoring Guide (TMG) Federal Highway Administration (FHWA) 2016
National Innovative Ways to Count Pedestrians and Bicyclists Bonanno, J. 2015
Arizona Bicyclist and Pedestrian Count Strategy Plan Kimley-Horn; Lee Engineering; Texas A&M Transportation Institute; Traffic Research & Analysis, Inc.
2018
Colorado
Colorado DOT Pedestrian and Bicycle Volume Data Collection Toolkit
Colorado DOT; Toole Design Group 2016
Colorado DOT Non-Motorized Monitoring Program Evaluation and Implementation Plan
Colorado DOT; Toole Design Group 2016
Delaware Delaware Department of Transportation Bicycle and Pedestrian Count Program Guide
Delaware DOT 2016
Florida FDOT Statewide Non-Motorized Traffic Monitoring Program Florida DOT; Marlin Engineering 2019
Idaho Toolbox for Bicyclists and Pedestrian Counts Idaho DOT; RBCI; Idaho Smart Growth 2013
Louisiana
Pedestrian and Bicycle Count Data Collection and Use: A Guide for Louisiana Tolford, T.; Izadi, M.; Ash, C.; Codjoe, J. 2019
Pedestrians and Bicyclists Count: Developing a Statewide Multimodal Count Program Tolford, T.; Izadi, M.; Ash, C.; Codjoe, J. 2019
Michigan Non-Motorized Data Collection and Monitoring: Program Guide and Implementation Plan
Michigan DOT; Toole Design Group; UNC Highway Safety Research Center
2019
Minnesota
The Minnesota Bicycle and Pedestrian Counting Initiative: Methodologies for Non-Motorized Traffic Monitoring
Lindsey, G.; Hankey, S.; Wang, X.; Chen, J. 2014
Minnesota DOT Bicycle and Pedestrian Data Collection Manual
Minge, E.; Falero, C.; Lindsey, G.; Petesch, M.; Vorvick, T. 2017
North Carolina Non-Motorized Site Selection Methods for Continuous and Short-Duration Volume Counting Jackson, K.; Stolz, E.; Cunningham, C. 2015

16
Locality Bicycle and Pedestrian Counting Guidance Document Authors Year
North Carolina Quality Assurance and Quality Control Processes for a Large-Scale Bicycle and Pedestrian Volume Data Program Jackson, K.; Worth O’Brien, S.; Searcy, S.; Warchol, S. 2017
New Hampshire New Hampshire Bicycle and Pedestrian Transportation Advisory Committee: Counting Program Master Plan Tufts, C.; Waitkins, M.; Hlasny, A.; Mellen, L.; Lemieux, D. 2015
Oregon
Bicycle and Pedestrian Counts at Signalized Intersections Using Existing Infrastructure
Kothuri, S.; Nordback, K.; Schrope, A.; Phillips, T.; Figliozzi, M.
2017
Accuracy of Bicycle Counting with Pneumatic Tubes in Oregon
Nordback, K.; Kothuri, S.; Phillips, T.; Gorecki, C.; Figliozzi, M.
2016
Texas Improving the Amount and Availability of Pedestrian and Bicyclist Count Data in Texas
Turner, S.; Benz, R.; Hudson, J.; Griffin, G.; Lasley, P.; Dadashova, B.; Das, S.
2019
Utah Developing a Rubric and Best Practices for Conducting Counts of Non-Motorized Transportation Users
Burbidge, S. 2016
Vermont Vermont Bicycle and Pedestrian Counting Program Sentoff, K.; Sullivan, J. 2017
Virginia
Assessing the Feasibility of a Pedestrian and Bicycle Count Program in Virginia
Ohlms, P.; Dougald, L; MacKnight, H. 2018
Automated Validation and Interpolation of Long-Duration Bicycle Counting Data Bietel, D.; McNee, S.; McLaughlin, F.; Miranda-Moreno, L. 2018
Designing a Bicycle and Pedestrian Traffic Monitoring Program to Estimate Annual Average Daily Traffic in a Small Rural College Town
Lu, T.; Buehler, R.; Mondschein, A.; Hankey, S. 2017
Washington
Optimizing Short Duration Bicycle and Pedestrian Counting in Washington State
Nordback, K.; Johnston, D.; Kothuri, S. 2018
Collecting Network-wide Bicycle and Pedestrian Data: A Guidebook for When and Where to Count
Johnstone, D.; Nordback, K.; Lowry, M. 2017
Bicycle and Pedestrian Count Portal Washington DOT 2017
Arlington County Bike Arlington: About Arlington's Automatic Counters Bike Arlington 2019
Bike Arlington: Counter Dashboard Disclaimer Bike Arlington 2019
Los Angeles County; Southern California Association for Governments (SCAG)
2015 Los Angeles Bike and Pedestrian Count Los Angeles County Bicycle Coalition 2015
Delaware Valley Regional Planning Commission (DVRPC)
DVRPC Travel Monitoring: Pedestrian and Bicycle Counts DVPRC 2019
San Diego Association of Governments (SANDAG)
San Diego Regional Bike and Pedestrian Counters
SANDAG; San Diego State University; County of San Diego Health and Human Services Agency
2013
Designing and Implementing a Regional Active Transportation Monitoring Program through a County-MPO-University Collaboration
Ryan, S.; Saitowitz, S. 2013

17
Locality Bicycle and Pedestrian Counting Guidance Document Authors Year
City of Los Angeles Conducting Bicycle and Pedestrian Counts: A Manual for Los Angeles County and Beyond
Kittelson & Associates, Inc.; Ryan Snyder Associates; Los Angeles Bicycle Coalition
2013
City of Orlando
MetroPlan Orlando: Pedestrian & Bicyclist Counts MetroPlan Orlando 2016
City of Orlando: Bicycle and Pedestrian Count Program Annual Report
City of Orlando 2016
City of Portland Portland Bicycle Count Report: 2013-2014 Portland Bureau of Transportation 2014

18
Bicycle and Pedestrian Counting Technology Overview
Based on the studies and documentation assessed in the literature review, Table 2 was created to summarize currently available technologies for counting bicycles and pedestrians, including typical applications, strengths, weaknesses, accuracy, cost, maintenance, and ease of installation.
Included in Table 2 are the technologies currently employed by the NC NMVDP. The NC NMVDP currently employs Eco-Counter systems for counting bicycles and pedestrians. Two fundamental technologies are used in these systems to detect non-motorized traffic: passive infrared sensors (“PYROs”) and induction loops (“ZELTs”). PYROs detect people based on their heat signature and cannot distinguish between pedestrians, bicyclists, horseback riders, or persons on/in other types of mobility devices. ZELTs detect the electromagnetic signature of bicycle wheels. The ZELT system employs an algorithm that allows a range of bicycle types to be captured and counted, including carbon fiber bicycles, if equipped with aluminum alloy wheels or other aluminum components. Standard ZELTs can be installed on any type of hard-surface bicycle facility, such as a travel lane or bicycle lane on a roadway, an asphalt or concrete shared use path, or a sidewalk. Eco-Counter also offers a pre-formed loop version of the ZELT that can be installed on unpaved paths, such as crushed stone paths or single-track dirt paths. The pre-formed loop is installed at an in-ground depth of two inches, and the wiring of the loop is protected by an outer sheath that also helps maintain its diamond shape, which is important for capturing direction of travel.
The data produced by Eco-Counter PYRO and ZELT systems are easy to monitor and analyze with Eco-Counter’s proprietary data monitoring software and API. The sensors utilized are subject to low average aggregate error on non-motorized facilities, as demonstrated by previous performance evaluation studies. However, ZELT systems installed on shared roadway facilities often produce much higher ranges of error than facilities that are designed specifically for non-motorized travel. The standard PYRO system configuration (sensor installed parallel to the detection zone at a height of about three feet) also produces higher ranges of error on high volume facilities due to higher rates of pedestrian occlusion. Additionally, the systems installed as part of the NC NMVDP have been subject to manufacturing errors and hardware damage caused by environmental factors (e.g., moisture infiltration from humidity and flooding, insect infestation, vandalism) that have led to multiple system breakdowns whose rectification was labor intensive.
Several traffic monitoring technologies have been refined since the publication of NCHRP 797: Guidebook on Pedestrian and Bicycle Volume Data Collection, including camera set-ups utilizing visible light, thermal, or infrared images in combination with automated machine learning object identification and classification algorithms that can detect and differentiate non-motorized and motorized users on various roadway facilities. These technologies are also included in Tables 2 through 5. Formal evaluation of these technologies in transportation settings is limited. Current evidence demonstrates that performance of these systems varies depending on facility conditions, time of day, camera angle, and the object detection algorithm implemented. All systems tested require site-specific calibration and retraining to identify and classify bicyclists and pedestrians with acceptable accuracy.

19
Table 2. Description of Counting Technologies with Typical Application and Site Type
Technology Brief Description Typical Application
Site Type
Shared Use Path
Sidewalks
On Street Bike
Lanes
On Street Shared Lanes
Light/Optical
Active Infrared Detects users breaking an infrared light beam from transmitter to receiver.
Short-term or permanent counts; bicyclists and pedestrians combined.
X X
Passive Infrared Detects infrared radiation given off by pedestrians and bicyclists passing the sensor.
Short-term or permanent counts; bicyclists and pedestrians combined.
X X
Laser Scanning Emits laser pulses towards multiple directions and analyzes the reflections of the pulses to determine the characteristics of the device’s surroundings, including the presence of pedestrians or bicyclists.
Short-term or permanent counts; bicyclists and pedestrians combined; object classification.
X X X X
Radio/Radar
Radar Sensors Detect users based on reflected electromagnetic pulses.
Short-term or permanent counts; bicyclists and pedestrians combined.
X
Radio Beams (single or multiple frequency)
Detect users breaking a radio beam from emitter to receivers.
Short-term or permanent counts; bicyclists and pedestrians combined.
X X
Microwave Radar Classifies using a built-in microwave radar sensor to measure traffic at a one- or two-lane (opposite direction) road layout.
Short-term or permanent counts; bicyclists only.
X X X X
Electromagnetic Detection
Inductive Loops Electric current running through a loop embedded in the pavement or placed on top of the pavement produces a magnetic field that detects magnetic objects, including bicycles.
Permanent counts; bicyclists only.
X X X X
Magnetometers Measure magnetism of magnetic objects, including bicycles.
Permanent counts; bicyclists only.
X X X
Pressure/Seismic Sensing
Piezoelectric Strips Emit electrical signals when strip is deformed as bicycle wheels pass over the surface.
Permanent counts; typically focused on bicyclists, but technology also available for counting pedestrians.
X X
Pneumatic Tubes Detect pulses of air generated when tires pass over the tubes; includes standard pneumatic tubes and bicycle-specific versions.
Short-term counts; bicyclists only.
X X X

20
Technology Brief Description Typical Application
Site Type
Shared Use Path
Sidewalks
On Street Bike
Lanes
On Street Shared Lanes
Pressure/Seismic Sensing
Fiber Optic Sensors Suitable for high traffic volumes; not suitable for mixed traffic; detect pressure changes through detecting light changes passing through a cable.
Permanent counts; bicyclists only.
X X X
Pressure Sensors/Mats
Count pressure signatures (changes in force) that pass over the device which is typically buried.
Permanent counts; typically used on unpaved trails or paths; bicyclists and pedestrians combined.
X
Seismic Sensors (also called acoustic sensors)
Detect the passage of energy waves through the ground.
Short-term counts on unpaved trails; bicyclists and pedestrians combined.
X
Mobile Device Signal Detection
Passive Mobile Device Signal Sensing (Cellphone, Wi-Fi, or Bluetooth)
Detectors record unique identifiers of enabled devices passing by.
Short-term or permanent counts; bicyclists and pedestrians combined.
X X X X
GPS Enabled Mobile App-Based Route Trackers
Uses Global Positioning System (GPS) and apps to track a mobile device's movements and to determine its location.
Short-term or permanent counts; bicyclists and pedestrians combined.
X X X X
Sonic Sensors
Ultrasonic Sensors Transmit an ultrasound wave of a set duration and use the echo to measure distance.
Short-term counts; bicyclists and pedestrians combined.
X
Video/Image Processing
Video Imaging (machine learning-based or classical image processing algorithms)
Employs machine learning algorithms such as neural networks to detect and classify users from video frames.
Short-term or permanent counts; bicyclists and pedestrians separately.
X X X X
Thermal Imaging Combination of overhead passive infrared detection and automated imaging technology.
Short-term or permanent counts; bicyclists and pedestrians separately.
X X X X
Depth Cameras Dot matrix of infrared or visible light captured by a receptor to create a 3-D image of a scene.
Short-term or permanent counts; bicyclists and pedestrians separately.
X X X X
Hybrid Technology
Passive Infrared + Inductive Loop
Uses a combination of infrared and inductive loops to distinguish bicycles and pedestrians in mixed mode traffic scenarios.
Permanent counts; bicyclists and pedestrians separately.
X X
Multipurpose Sensor Networks
Synergistic use of citywide multi-sensor installations. Example: Array of Things project in Chicago.
Permanent counts; bicyclists and pedestrians combined.
X X X X

21
Technology Brief Description Typical Application
Site Type
Shared Use Path
Sidewalks
On Street Bike
Lanes
On Street Shared Lanes
Human Observer/Counter
Manual Entry (paper-based)
Humans equipped with clipboards and paper record counts.
Short-term counts; bicyclists and pedestrians separately.
X X X X
Manual Entry (mechanical)
Humans equipped with mechanical clickers record counts.
Short-term counts; bicyclists and pedestrians separately.
X X X X
Manual Entry (device-based)
Humans equipped with a device (e.g., tablet or smartphone with application) record counts.
Short-term counts; bicyclists and pedestrians separately.
X X X X
Manual Counts (based on pre-recorded video)
Humans reducing video recordings into counts.
Short-term counts; bicyclists and pedestrians separately.
X X X X
Crowdsourcing (via mobile apps)
Passive or active data collection using smartphones or other mobile devices.
Short term/to be used in parallel to other counting platforms; bicyclists and pedestrians separately.
X X X X
Table 3. Counting Technologies with Strengths and Weaknesses
Technology Strengths Weaknesses
Light/Optical
Active Infrared Relatively portable; low-profile, unobtrusive appearance; not affected by rain.
Cannot distinguish between bicyclists and pedestrians unless combined with another bicycle detection technology; very difficult to use for bike lanes and shared lanes; may have higher error with groups; requires mounting sender and receiver on opposite ends of travel way.
Passive Infrared Very portable with easy setup; low-profile, unobtrusive appearance.
Cannot distinguish between bicyclists and pedestrians unless combined with another bicycle detector; difficult to use for bike lanes and shared lanes; requires careful site selection and configuration; may have higher error when ambient air temperature approaches body temperature range; may have higher error with groups; direct sunlight on sensor may create false counts.
Laser Scanning Large areas can be monitored; measurement ability over a long distance and a wide-angle detection; ability to monitor multiple lanes.
Requires electricity grid for power, which limits its applicability; it is possible to conduct short-term counts using a battery.
Radio/Radar
Radar Sensors Capable of counting bicyclists in dedicated bike lanes or bikeways.
Commercially available, off-the-shelf products for counting are limited.
Radio Beams (single or multiple frequency)
Easy installation. Requires mounting sender and receiver on opposite sides of travel way; subject to false positives with any object breaking the beam.
Microwave Radar Low-power operation; devices can be fed by solar cells; non-intrusive; lightweight; self-calibrating.
Commercially available, off-the-shelf products for counting are limited; expensive.

22
Technology Strengths Weaknesses
Electromagnetic Detection
Inductive Loops Accurate when properly installed and configured; use traditional motor vehicle counting technology.
Capable of counting bicyclists only; require saw cuts in existing pavement or pre-formed loops in new pavement construction; may have higher error with groups.
Magnetometers May be possible to use existing motor vehicle sensors; units are usually small, and they can be buried at the roadside, no road cuts or special tools are required; counter’s detection range is user-programmable and can be adjusted for single-lane or two-lane counting.
Commercially available, off-the-shelf products for counting bicyclists are limited; may have higher error with groups.
Pressure/Seismic Sensing
Piezoelectric Strips Not affected by precipitation. Not widely used; product availability may be limited.
Pneumatic Tubes Relatively portable, low-cost; may be possible to use existing motor vehicle counting technology and equipment.
Capable of counting bicyclists only; tubes may pose hazard to trail users; greater risk of vandalism; may be prone to avoidance where tubes are installed conspicuously.
Fiber Optic Sensors Used in "bicycle barometer" applications in Europe. Capable of counting bicyclists only.
Pressure Sensors/Mats Some equipment may be able to distinguish bicyclists and pedestrians.
Expensive/disruptive for installation under asphalt or concrete pavement.
Seismic Sensors (also called acoustic sensors)
Equipment is hidden from view. Commercially available, off-the-shelf products for counting are limited.
Mobile Device Signal Detection
Passive Mobile Device Signal Sensing (Cellphone, Wi-Fi, or Bluetooth)
Not affected by weather conditions; may be suitable for crowded scenes.
Assumes that the devices represent the objects being counted in the scene; low levels of accuracy (undercounting); equity issues with digital divide.
GPS Enabled Mobile App-Based Route Trackers
Not affected by weather conditions; may be suitable for crowded scenes.
Assumes that the devices represent the objects being counted in the scene; if the system relies on users to download an app, it can cause undercounts; equity issues with digital divide.
Sonic Sensors
Ultrasonic Sensors Suitable for both indoor and outdoor applications. Appropriate for wide sidewalks without walls, a condition that is a limitation for ultrasound-based systems; very high-energy consumption with a battery life of only a few days.
Video/Image Processing
Video Imaging (machine learning-based or classical image processing algorithms)
Potential accuracy advantages in dense, high-traffic areas; open-source object identification algorithms publicly available.
Typically more expensive for exclusive installations; algorithm development still maturing; typically more appropriate for short-term counts (1 to 7 days); use of open-source software requires a high level of technical expertise.
Thermal Imaging Potential to operate in adverse weather situations (fog, rain, snow).
Typically more appropriate for short-term counts (1 to 7 days).
Depth Cameras Large areas can be monitored. Typically more appropriate for short-term counts (1 to 7 days).
Hybrid Technology
Passive Infrared + Inductive Loop
Theoretically, the synergistic use of multiple sensors can result in better performance.
Multi-sensor platform may complicate the installation process.
Multipurpose Sensor Networks
Experimental programs involving citywide multi-sensor data collection platform.
Involves a citywide or large area deployment; requires a considerable amount of investment and commitment from local government.

23
Technology Strengths Weaknesses
Human Observer/Counter
Manual Entry (paper-based)
Very portable; can be used for automated equipment validation.
Expensive and possibly inaccurate for longer duration counts; requires specific protocols and training for count staff/volunteers; typically more appropriate for short-term counts (2 to 12 hours); impacted by weather.
Manual Entry (mechanical)
Very portable; can be used for automated equipment validation.
Typically more appropriate for short-term counts (2 to 12 hours); impacted by weather.
Manual Entry (device-based)
Very portable; can be used for automated equipment validation.
Typically more appropriate for short-term counts (2 to 12 hours); impacted by weather.
Manual Counts (based on pre-recorded video)
Can cost less when existing video cameras are used. Limited to short-term use; manual video reduction is labor-intensive.
Crowdsourcing (via mobile apps)
Low-cost data collection method. Relies on the willingness of bicyclists and pedestrians to participate in data collection.
Table 4. Counting Technologies with Accuracy and Cost
Technology Accuracy Estimated Cost per Unit
Light/Optical
Active Infrared One study reports an undercount rate of 7.6%; another report indicates error rates ranging from 12% to 48%.
Varies between $200 - $7,000; low-cost devices exist, e.g., $210 per unit (TrailMaster 1050 and 1550).
Passive Infrared According to one study, undercount rates vary between 1.6% to 27%; another report indicates error rates ranging from 1% to 36%; satisfactory results in pedestrian-only environments when volumes are low and the counter is properly located and installed; undercounts substantially at high-volume sites; not affected by rain or snow; raw data calibration recommended; proper sensitivity setting calibration can improve accuracy.
$2,000 - $3,000 (Jamar); $3,995 - $4,550 depending on range, ability to capture direction, and housing (Eco-Counter); $230 - $290 (TrailMaster 550); $490 - $540 per unit or $2,215 for system package (TRAFx).
Laser Scanning One report indicates an average error rate of 5% or more for crowded scenes.
$8,000 (Velodyne).
Radio/Radar
Radar Sensors One study reports an overcount rate of 14.2%; relatively moderate error; does not count during rain.
Unknown.
Radio Beams (single or multiple frequency)
One study reports an undercount rate of 12.1%; relatively high error.
$3,000+.
Microwave Radar Vendor claims 95% accuracy. $5,000.

24
Technology Accuracy Estimated Cost per Unit
Electromagnetic Detection
Inductive Loops One study reports average miscount rates ranging between 3.1% and 4.8%; another report indicates error rates 4% or less for long-term data collection; relatively low error; loops at intersection approaches in mixed traffic not recommended; occlusion becomes an issue when bike volume exceeds 200 per hour or 50 per 15-minute interval; must install away from electrical interference; installation, settings, and maintenance are important.
$2,500 - $4,300 (Eco-Counter).
Magnetometers Unknown. $490 - $540 per unit or $2,215 for system package (TRAFx).
Pressure/Seismic Sensing
Piezoelectric Strips Varying error. Some studies report high accuracy; one study reports undercount rates of 3.4% and 5.8%.
$4,400 (MetroCount).
Pressure/Seismic Sensing
Pneumatic Tubes One study employs 3 different products and reports undercount rates between 9.4% and 59.6%; accurate bicycle counting technology for mixed traffic conditions; high undercount errors when bicyclists ride side-by-side or in groups; accuracy decreases as bicycle and auto traffic increases; proper installation is important.
$2,200 - $2,800 (Eco-Counter).
Fiber Optic Sensors Sensitivity of the sensors can be adjusted to the desired levels of weight that need to be detected.
Unknown.
Pressure Sensors/Mats Unknown. $6,045 - $8,225 (Eco-Counter); one study reports an average cost ranging from $2,000 - $3,000.
Seismic Sensors (also called acoustic sensors)
Ranges from poor to average. $319 - $420.
Mobile Device Signal Detection
Passive Mobile Device Signal Sensing (Cellphone, Wi-Fi, or Bluetooth)
Theoretically, high accuracy rates can be achieved; however, detection is only possible when the device signals are not deactivated by users and only captures those carrying devices.
Unknown.
GPS Enabled Mobile App-Based Route Trackers
May be more suitable for identifying traffic trends and patterns rather than obtaining accurate counts.
About $0.55 per app user per year (Strava).
Sonic Sensors
Ultrasonic Sensors One study reports a 3% close-range and 45% long-range no-detection rate; another study reports error rates of 0.9% and 24.7%; accuracy for counting people found to be inadequate.
Unknown.

25
Technology Accuracy Estimated Cost per Unit
Video/Image Processing
Video Imaging (machine learning-based or classical image processing algorithms)
One report indicates 2% to 14% error rate; feasible and accurate for multiple direction counts, especially with more separation of users; complex intersection movements could reduce accuracy.
$1,200 - $8,000 on average; in some cases, the cost depends on the features requested; processing fee for 6 hours of video footage is $198 (Miovision).
Thermal Imaging One study reports an overcount rate of 2.7%; not recommended for counting purposes at intersection approaches in mixed traffic; not affected by rain or snow.
$4,800 (camera and board; FLIR).
Depth Cameras Acceptable counting performance in low to moderate volumes, including in low-light conditions where computer vision cannot be used; occlusion is an issue.
$12,330 (GridSmart); $9,900 (Eco-Counter).
Hybrid Technology
Passive Infrared + Inductive Loop
Accuracy rates benefit from the use of multiple sensors. $5,545 - $6,530 for trails; $6,100 - $7,320 for shared lane/bike lane (Eco-Counter).
Multipurpose Sensor Networks
Accuracy is not clear since the technology is still under development.
Unknown; technology is in the experimental phase.
Human Observer/Counter
Manual Entry (paper-based)
Prone to systematic undercounting of pedestrians; error rates tend to be greater at the beginning of a data collection period as compared to the end; video recordings should be used instead if count accuracy is important.
Varies with manual labor costs.
Manual Entry (mechanical)
Prone to systematic undercounting of pedestrians; error rates tend to be greater at the beginning of a data collection period as compared to the end; video recordings should be used instead if count accuracy is important.
Varies with manual labor costs.
Manual Entry (device-based)
Prone to systematic undercounting of pedestrians; error rates tend to be greater at the beginning of a data collection period as compared to the end; video recordings should be used instead if count accuracy is important.
Varies with manual labor costs.
Manual Counts (based on pre-recorded video)
High accuracy is expected; accuracy may be affected by the video quality; error rates are related with the performance of the human analyst.
Varies with manual labor costs.
Crowdsourcing (via mobile apps)
Correlated with the rate of participation in crowdsourcing; active counting methods depend on volunteer participants' ability to count accurately.
Mostly relies on voluntary data collection of participants and, therefore, results in low data collection costs.

26
Table 5. Counting Technologies with Typical Maintenance and Ease of Installation Information
Technology Maintenance Ease of Installation
Light/Optical
Active Infrared 8 months to 1 year of battery life. Easy to set up.
Passive Infrared Long battery life (up to 10 years). Difficult (requires vendor installation).
Laser Scanning If powered by a battery, frequent battery changes may be needed; some laser scanners may provide self-calibration features.
Moderate to difficult since the initial deployment may require calibration of the equipment.
Radio/Radar
Radar Sensors 10-year battery life; no calibration needed. Easy to set up.
Radio Beams (single or multiple frequency)
Self-calibrating; 1 year battery life. Easy to set up.
Microwave Radar Self-calibrating; long battery life. Easy to set up.
Electromagnetic Detection
Inductive Loops 2 years of battery life. Difficult to install.
Magnetometers 8 to 20 months of battery life. Easy to set up; they can be buried in the ground.
Pressure/Seismic Sensing
Piezoelectric Strips 2 to 3 years of continuous use or 5 years as a backup. Difficult to install.
Pneumatic Tubes Longer term installations require monitoring for damage from motor vehicles or vandalism.
Easy to set up.
Fiber Optic Sensors Unknown. Unknown.
Pressure Sensors/Mats Unknown. Expensive/disruptive installation under asphalt or concrete.
Seismic Sensors (also called acoustic sensors)
Unknown. Unknown.
Mobile Device Signal Detection
Passive Mobile Device Signal Sensing (Cellphone, Wi-Fi, or Bluetooth)
Unknown; unsure when/who is changing settings on phones; unsure when OS may update or change policy.
Easy to set up.
GPS Enabled Mobile App-Based Route Trackers
Software updates for mobile apps may be needed. Easy to set up; proprietary data may be closed.
Sonic Sensors
Ultrasonic Sensors Frequent battery changes may be needed due to short battery life.
Installation process can be complicated by initial calibration requirements.
Video/Image Processing
Video Imaging (machine learning-based or classical image processing algorithms)
Regular sensor cleaning may be needed. Easy to moderate difficulty depending on whether WiFi or image/video on SD card is used.
Thermal Imaging Thermal cameras may require annual calibration; regular sensor cleaning may be needed.
Easy to moderate difficulty.
Depth Cameras Regular sensor cleaning may be needed. Easy to moderate difficulty.
Hybrid Technology
Passive Infrared + Inductive Loop
2 or more years of battery life. Difficult to install.
Multipurpose Sensor Networks
Unknown since the technology is still under development.
Unknown since the technology is still under development.

27
Technology Maintenance Ease of Installation
Human Observer/Counter
Manual Entry (paper-based)
Not Applicable. Varies based on effort needed for the recruitment and training of data collectors, design and consistent implementation of a counting protocol, appropriate safety measures, and funding considerations.
Manual Entry (mechanical)
Not Applicable. Varies based on effort needed for the recruitment and training of data collectors, design and consistent implementation of a counting protocol, appropriate safety measures, and funding considerations.
Manual Entry (device-based)
Not Applicable. Varies based on effort needed for the recruitment and training of data collectors, design and consistent implementation of a counting protocol, appropriate safety measures, and funding considerations.
Manual Counts (based on pre-recorded video)
Not Applicable. Not Applicable.
Crowdsourcing (via mobile apps)
May require software updates for the mobile apps. Requires participants to install mobile apps on their devices.

28
State of the Practice Interview Summary
Background
The research team conducted interviews with governmental agencies that manage non-motorized traffic counting programs, private traffic counting companies, and private non-motorized technology manufacturers. The purpose was to determine the availability of various non-motorized counting technologies, where specific technologies are deployed, and the level of customer satisfaction with each piece of technology. Table 6 outlines the organizations that were interviewed to collect information about their non-motorized counting programs and services.
Table 6. List of Agencies Interviewed
Organization Type
City of Amsterdam Afdeling Kennis en Kaders Governmental Agency
City of Los Angeles DOT Governmental Agency
County of Arlington DOT Governmental Agency
Delaware Valley Regional Planning Commission (DVRPC) Governmental Agency
MetroPlan Orlando Governmental Agency
San Diego Regional Planning Agency (SANDAG) Governmental Agency
State of Colorado DOT Governmental Agency
State of Florida DOT Governmental Agency
State of Michigan DOT Governmental Agency
State of Minnesota DOT Governmental Agency
State of North Carolina DOT Governmental Agency
State of Ohio DOT Governmental Agency
State of Washington DOT Governmental Agency
Counterpoint Counting Technology Manufacturer
DataFromSky Counting Technology Manufacturer
Eco-Counter Counting Technology Manufacturer
Miovision Counting Technology Manufacturer
Numina Counting Technology Manufacturer
Q-Free Counting Technology Manufacturer
Roadsys Counting Technology Manufacturer
Sensys Networks Counting Technology Manufacturer
Wavetronix Counting Technology Manufacturer
Waycount Counting Technology Manufacturer
Marr Technology Private Traffic Counting Services Company
National Data & Surveying Private Traffic Counting Services Company
Quality Counts Private Traffic Counting Services Company

29
Public Non-Motorized Traffic Counting Programs (Government Agencies)
Data Types
The purpose of data collection efforts differed across agencies. Common incentives for collecting non-motorized volume data included general non-motorized traffic monitoring, grant development, safety studies, change-tracking of the use of new facilities over time, the approval of traffic control devices, the development of AADBT and AADPT figures, and the development of schedules for construction projects. Table 7 outlines the data types that are collected and stored by agencies. Most agencies prioritize bicycle and pedestrian counting on trails, roadways, and sidewalks. Additional data collection practices, such as equipment lending programs or the collection and storage of non-motorized trajectory or turning movement data, were implemented by a small number of agencies.
Table 7. Proportion of Agencies that Collect Data Types
Bicycle Pedestrian Micromobility (E-Scooters)
100% 92% 8%
Permanent Counts Temporary Counts Manual Counts
84% 93% 38%
Trails* Roadways Sidewalks*
75% 100% 92%
Trajectory Data Equipment Lending Turning Movement
8% 15% 15%
n=13; * indicates n=12 due to a lack of response from one agency
QA/QC Practices
Industry-wide best practices for non-motorized volume data quality assurance and quality control (QA/QC) are still in development. Most interviewed agencies implemented some type of data QA/QC protocol (Table 8). The most popular QA/QC practice was using engineering judgement to remove invalid days of data. Some agencies performed additional validation studies to either confirm the functionality of the counting systems and/or develop calibration factors to adjust raw data.
Table 8. Quality Assurance Practices
QA/QC Practice Proportion of Agencies That Follow Practice*
No QA/QC Practices 23%
Validate Equipment 31%
Apply Calibration Factors 31%
Remove Invalid Days of Data 62%
Engineering Judgement Only 46%
Engineering Judgement and Statistical Methods 31%
Data Imputation 15%
* n=13

30
Data Reporting
Less than half of the agencies interviewed made data reports available to the public. Data reporting frequency ranged from real-time to biannually (Table 9). No major data reporting trends were determined. Fifty percent of agencies reported that they published all or some count data so that it is readily available to the public.
Table 9. Data Publishing Information
Data Publishing Frequency Agencies (n)
Unknown or Not Applicable 8
Biannually 1
Annually 1
Seasonally 1
Real-Time 2
Data Reporting Proportion of Agencies Providing Data Reports
Publicly Available Data Reports 50%
Community Challenges
Many agencies encountered vandalism of counting devices or public concern regarding their counting programs (e.g., related to privacy). Agencies reported the following types of community-related challenges and concerns in regards to non-motorized counting equipment: community interest (members of the community inquiring about the purpose of the devices when staff are working in the field), vandalism (purposeful destruction of counting devices), privacy concerns (members of the community expressing fears of potential privacy violations caused by the monitoring of streets, trails, and sidewalks), and damage due to other projects (nearby construction of businesses and municipal street resurfacing, sidewalk maintenance, or trail maintenance damaging counting equipment installations) (Table 10). No agencies reported receiving complaints from the public regarding the aesthetics of the devices.
Table 10. Non-Motorized Counting Program Community Issues
Community Challenge Proportion of Agencies that Encounter Challenge*
Community Interest 30%
Vandalism 53%
Privacy Concerns 15%
Damage Due to Other Projects 15%
Aesthetic Concerns 0%
* n=12
Technologies Employed by Governmental Agencies
A diverse set of counting equipment vendors and technology types are used by the governmental agencies interviewed for the study (Table 11). Popular vendors include Eco-Counter, Miovision, and MetroCount. Eco-Counter is a major producer of infrared, inductive loop, and mobile pneumatic tubes specifically designed to count pedestrians and bicyclists. Miovision is a major producer of traffic cameras that use a combination of machine learning or object identification algorithms and manual

31
reviewers to determine non-motorized counts and other non-motorized behavior data as well as motorized counts and turning movements. MetroCount is a major producer of piezoelectric strip products that count bicyclists, and it is currently developing piezoelectric pedestrian counters. The City of Los Angeles retrofits their motor vehicle counters, which are developed in-house, to detect bicyclists. The City of Amsterdam stated that most of their studies involved temporary counts, though they did install some permanent counting devices. They employed counting hoses and counting cameras to count moving bicycles, and people to manually count parked bicycles.
Table 11. Technologies Deployed by Governmental Agencies
Manufacturer Product Technology Type Installation Type* Agencies
Chamber
Electronics RBBP7 Radiobeam Temporary Minnesota DOT
CountingCars COUNTCam2 Camera Permanent Los Angeles DOT
Diamond Traffic Omega Pneumatic Tube Temporary Michigan DOT
Eco-Counter CITIX IR Camera and Machine
Algorithm Permanent Minnesota DOT
Eco-Counter MULTI (Nature or
Urban)
Passive Infrared and
Inductive Loop Permanent
Arlington County DOT,
Colorado DOT, DVRPC, North
Carolina DOT, SANDAG
Eco-Counter PYRO-Box Infrared Temporary
MetroPlan Orlando,
Minnesota DOT, North
Carolina DOT
Eco-Counter TUBES Pneumatic Tubes Temporary
MetroPlan Orlando,
Minnesota DOT, North
Carolina DOT
Eco-Counter ZELT Inductive Loop Permanent
Minnesota DOT, North
Carolina DOT, SANDAG,
Washington DOT
JAMAR Apollyon II Plus Pneumatic Tubes Temporary DVRPC
JAMAR TDC-Ultra Manual Input Temporary Los Angeles DOT
MetroCount MC5600 Tubes Temporary Minnesota DOT
MetroCount RidePod BP Piezoelectric Permanent Arlington County DOT
MetroCount RidePod BT Tubes Temporary Florida DOT
Miovision Scout Camera and Machine
Algorithm Temporary
MetroPlan Orlando,
Michigan DOT, Ohio DOT
Miovision TrafficLink Camera and Machine
Algorithm Permanent Ohio DOT
Q-Free
Cycle &
Pedestrian
Monitoring
Piezoelectric and Passive
Infrared Unspecified
Florida DOT, Washington
DOT
Time Mark Unspecified Pneumatic Tubes Temporary Minnesota DOT
TRAFx Trail Counter Passive Infrared Temporary Florida DOT, Ohio DOT
Trail Master TM 1550 Passive Infrared Temporary Minnesota DOT
*Permanent installations involve invasive modifications of infrastructure, such as asphalt cuts, concrete slabs, or complex power installation into the existing grid. Temporary installations are non-invasive and, therefore, easier to move than a permanent installation, even if the technology is capable of installation for multiple months or years at one location.

32
Agencies were asked a series of questions regarding the accuracy of data collected by each system, the hardware’s durability and ease of installation, and the software’s functionality and ease of use. Qualitative responses were converted into numeric values using the rating system outlined in Table 12.
Table 12. Technology Rating System
Value Rating Description
1 Does not meet expectations Agency is not satisfied with the performance of the system and would not
recommend to other agencies.
2
Sometimes meets
expectations, sometimes
does not meet expectations
Agency finds the system useful but encounters more challenges than anticipated
which may impact program performance.
3 Meets expectations
Agency is generally satisfied with hardware durability, software ease of use, and
the accuracy of the data collected by the machines. Minor challenges with any
aspect of the system may exist but are relatively easy to address.
Table 13 summarizes the average rating received by each technology product. More popular devices, such as Eco-Counter and Miovision, received mixed reviews from some agencies and mostly positive reviews from others. This is likely due to the greater number of agencies deploying these technologies, which leads to a greater likelihood of mixed experiences with equipment functionality. The interview findings indicate that one agency characterized its experience with the use of TrailMaster technology as unsatisfactory. It must be noted that the results should not be interpreted as definitive performance judgements on specific product types due to the limited sample size obtained through the interviews.
Table 13. Technology Reviews by Governmental Agencies
Manufacturer Product Technology Type Accuracy Hardware Software n
Chamber Electronics RBBP7 Radiobeam Unknown 2.0 2.0 1
CountingCars COUNTCam2 Camera 3.0 2.0 3.0 1
Diamond Traffic Omega Pneumatic Tube 2.0 2.0 3.0 1
Eco-Counter CITIX IR Camera and Machine Algorithm Unknown 2.0 2.0 1
Eco-Counter MULTI Passive Infrared and Inductive Loop 3.0 2.2 2.7 6
Eco-Counter PYRO-Box Infrared 3.0 2.5 2.0 2
Eco-Counter TUBES Pneumatic Tubes 2.0 2.0 2.5 2
Eco-Counter ZELT Inductive Loop 3.0 2.7 2.7 3
JAMAR Apollyon II Plus Pneumatic Tubes 3.0 3.0 3.0 1
JAMAR TDC-Ultra Manual Input 3.0 3.0 3.0 1
MetroCount MC 5600 Pneumatic Tubes Unknown Unknown 3.0 1
MetroCount RidePod BP Piezoelectric 3.0 3.0 3.0 1
Miovision Scout Camera and Machine Algorithm 3.0 3.0 2.5 2
Miovision TrafficLink Camera and Machine Algorithm 3.0 3.0 2.0 1
Q-Free CMU Piezoelectric and Passive Infrared Unknown 2.0 3.0 1
Time Mark Unspecified Pneumatic Tubes Unknown 3.0 3.0 1
TRAFx Trail Counter Passive Infrared 2.0 3.0 2.0 1
TrailMaster Unspecified Passive Infrared 1.0 1.0 1.0 1

33
Non-Motorized Counting Technology Vendors
Technology vendors were interviewed to document the capabilities of their respective systems. Table 14 summarizes the data recorded by each company. All products documented are available for purchase in the United States.
Table 14. Data Available for Each Technology Product
Technology Company
Product Technology Type Bicycle Pedestrian Micromobility Motor Vehicles
CounterPoint Mobile App Mobile App Yes Yes Yes Yes
DataFromSky TrafficCamera Camera Sensor Yes Yes No Yes
Eco-Counter CITIX 3D Camera Sensor Yes Yes No Yes
Miovision Scout Camera Sensor Yes Yes Yes Yes
Numina Camera Sensor Camera Sensor Yes Yes No Yes
Q-free Cycle & Pedestrian Monitoring
Piezoelectric and Infrared
Yes Yes No No
Roadsys CMU Piezoelectric and Infrared
Yes Yes Yes Yes
Sensys Networks FlexRadar Microwave Detectors
Yes Yes No No
Wavetronix Traffic Sensor Radar Yes No Yes Yes
WayCount Connected Traffic Counting
Piezoelectric Sensors
Yes No No Yes
Private Traffic Counting Providers
Private traffic counting providers are private consulting firms that traditionally collect data involving motorized vehicles, such as volumes and turning movements. Many of these firms also provide information regarding bicycle and pedestrian volumes. All three firms interviewed used proprietary cameras to observe facilities for temporary installation. Videos are reviewed manually to determine counts and other data, like turning movements or other modes such as micromobility (e-scooters). Vendors employ proprietary quality checks to determine whether the manual review of data is up to standard or needs to be re-performed. One firm used drones, in addition to their proprietary cameras, to collect data.
Eco-Counter Performance Evaluation
Background
Starting in November 2013, the North Carolina Department of Transportation (NCDOT) invested in the development of a statewide non-motorized counting program by selecting locations for the continuous monitoring of bicyclists and pedestrians and installing permanent counting systems. The North Carolina Non-Motorized Volume Data Program (NC NMVDP) began as a research project to test a bicycle and pedestrian count protocol for replication across the state. Currently, the program not only includes one of the most extensive statewide networks of continuous bicycle and pedestrian counting sensors, but also provides data management and reporting support for multiple local agency

34
partners. The counting systems are installed on sidewalks, roadways, and shared use paths across the state.
The NC NMVDP currently relies on Eco-Counter MULTI systems that use passive infrared and inductive loop sensors to continuously detect pedestrians and/or bicyclists. The research team reflected on and critically evaluated the deployment of these Eco-Counter MULTI systems by identifying their costs, benefits, and limitations, from procurement and installation to ongoing maintenance.
The following were considered related to the use of Eco-Counter MULTI systems in the NC NMVDP:
• Equipment Procurement, Inventory, Installation, Validation, and Maintenance
• Data Management (including Monitoring, Quality Assurance/Quality Control, Correction, Reporting, and Storage)
The accuracy of an Eco-Counter MULTI system was assessed in comparison to the accuracy of depth camera, standard video with algorithm-based processing, pneumatic tube, passive IR, and piezoelectric technologies. These results are summarized in the Technology Testing section.
The information presented in this section is summarized not only from outcomes from a formal program evaluation of the NC NMVDP, but also the results shared in the program’s Phase 2 Final Report published in November 2020.
Key data on the costs associated with the Eco-Counters is summarized in Table 15, including those associated with the initial hardware purchase, recurring software and data transmission fees, and replacement batteries, as well as the time/labor costs associated with site selection, installation, maintenance, validation, and data management for the counter within the programmatic context of the NC NMVDP. Values associated with hardware costs reflect prices for systems purchased in 2016 under Phase 2 of the NC NMVDP, adjusted for inflation to 2020 dollars. Values for time/labor cost estimates are rounded to the nearest ten dollars.
A summary of the total valid data collected and reported in the NC NMVDP from 2015 through 2020 is provided in Table 16. The percent missing data on an annual basis is directly correlated with sensor malfunction and subsequent maintenance demands across the Eco-Counter fleet included in North Carolina’s statewide counting program.
An evaluation of Eco-Counter MULTI systems in the NC NMVDP across multiple domains is provided in Table 17 and Table 18.

35
Table 15. Cost Associated with the Deployment of Eco-Counters in the NC NMVDP
Cost Type Cost
Frequency
Per Screenline Counting Location (values reported in 2020 USD)
Assumptions Trail (Bikes & Peds)1
Sidewalk (Peds) / Bike Lane
(Bikes) - 2 loop2
Sidewalk (Peds) / Bike Lane
(Bikes) - 4 loop3
Sidewalk (Peds) Only4
Equipment (Hardware) One-Time $7,093 $15,704 $19,499 $10,571 Intern Wage/Hour (Fully Loaded) $13
Software and Data Transmission
Annual $420 $840 $840 $840 Staff Wage/Hour (Fully Loaded) -
Maintenance Technician $51
Replacement Batteries Biennial $125 $450 $9005 $250 Staff Wage/Hour (Fully Loaded) - Data
Technician $60
Site Selection One-Time $500 $500 $500 $500 Staff Wage/Hour (Fully Loaded) -
Planner/Researcher $70
Installation One-Time $1,350 $1,350 $1,350 $1,350 Mileage/Trip (Per Mile Cost) $0.59
Maintenance and Validation6 Annual $1,140 $1,140 $1,140 $1,140 Average Roundtrip Mileage from ITRE 228
Data Management Annual $1,420 $1,420 $1,420 $1,420
Total (One-Time/Initial Hardware, Site Selection, and Installation)
$8,943 $17,554 $21,349 $12,421
Total (Recurring Annual Software and Data Transmission, Maintenance and Validation,
and Data Management) $2,980 $3,400 $3,400 $3,400
Total (Recurring Biennial Replacement Batteries)
$125 $450 $900 $250
Grand Total (First Year - One-Time/Initial Hardware, Site Selection, and Installation;
Annual Software and Data Transmission, Maintenance and Validation, and Data
Management)
$11,923 $20,954 $24,749 $15,821
1 Costs assume (1) Eco MULTI system with passive infrared sensor and 2 inductive loops; original purchase price = $6,580 in 2016 USD 2 Costs assume (2) Urban MULTI systems with 15-minute interval data recording with PYRO (passive infrared) sensor and 2 ZELT (inductive) loops – (1) system on each side of the roadway to capture the combined screenline across two sidewalks and two bike lanes; original purchase price = $14,568 in 2016 USD 3 Costs assume (2) Urban MULTI systems with 15-minute interval data recording with PYRO (passive infrared) sensor and 4 ZELT (inductive) loops – (1) system on each side of the roadway to capture the combined screenline across two sidewalks and two bike lanes; original purchase price = $18,088 in 2016 USD 4 Costs assume (2) Wooden Posts with PYRO (passive infrared) sensors and 15-minute interval data recording – (1) system on each side of the roadway to capture the combined screenline across two sidewalks; original purchase price = $9,806 in 2016 USD 5 4 loop systems require the battery to be replaced each year 6 Costs assume (2) field visits per year per screenline counting location to conduct maintenance and validation

36
Table 16. Historic Missing Count Data in the NC NMVDP from 2015 through 2020
NC NMVDP - Historic Missing Count Data
Total Possible Days of Data in
One Year
Total Possible Hours of Data in One Year Year
Number of Screenline Counting
Locations by Mode
Total Possible Days of Data
Missing Days of Data
Total Possible Hours of Data
Missing Hours of Data
Percent Missing
2015 24 8,760 131 210,240 3,144 1.5% 365 8,760
2016 28 10,248 490 245,952 11,762 4.8% 366 8,784
2017 48 17,520 3,571 420,480 85,704 20.4%
2018 58 21,170 4,853 508,080 204,456 40.2%
2019 106 38,690 8,219 928,560 337,920 36.4%
2020 106 38,796 16,418 931,104 394,032 42.3%

37
Table 17. Evaluation of Eco-Counter MULTI Systems Included in the NC NMVDP – Installation and Maintenance
Product User Type Ease of Installation Routine
Maintenance Requirements
Non-Routine Maintenance Requirements
Availability of Technical/Field Support
Success of Equipment in Different Facility Contexts
Eco-Counter MULTI
Bicyclists and Pedestrians (separately)
Difficult - requires saw cuts in paved surfaces for the inductive loops, digging a hole for placing the post that houses the passive infrared sensor, and vendor assistance to properly specify and calibrate the system
Medium - dependent on environmental context
High - common causes of malfunction include: insect infestation in wooden post housing, rot in wooden post housing, water infiltration into system components, cigarette burns on pedestrian sensor lenses, inductive loops cut by road or lawncare crews, graffiti or flyers on posts housing pedestrian sensors (see the NC NMVDP Phase 2 Final Report for additional information); vendor recalls, high humidity, and flooding impacts to in-ground housing are possible factors contributing to maintenance demands; re-validation via a field study is required if the system or a system component that contributes to the counting function is replaced
High - technical staff are available through email or toll-free phone number
Systems are installed on shared use path, sidewalk, bike lane, and shared lane corridors; not appropriate for detection at intersections

38
Table 18. Evaluation of Eco-Counter MULTI Systems Included in the NC NMVDP – Data Transmission, Accuracy, Storage, and Access
Product User Type Ease of Data
Transmission (from device to users)
Estimated Data Accuracy
Additional Fee Requirements for
Data Transmission, Storage, and Access
Ease of Data Access and Software Use
Data Storage Services
Ability to Collect Behavioral Data (e.g., risky traffic incidents,
travel/movement patterns, collisions)
Eco-Counter MULTI
Bicyclists and Pedestrians (separately)
Easy - automatic data transmission enables the data to be sent daily via cellular networks to cloud storage
High - bicyclists detected through inductive loops in bike lanes, on sidewalks, or on shared use paths; bypass error and false positives due to electrical interference have been observed Medium - pedestrians detected through passive infrared on sidewalks or shared use paths; occlusion error has been observed
Yes - $420 per counter per year for automatic data transmission and software subscription to access the data
Easy - automatically transmitted data are accessed through Eco-Visio software which provides counter management and analysis functionality; Eco-Counter provides free software training and user guides; data can be viewed in tabular format or through visualizations such as time series, comparison, and distribution
Data are stored locally on the counter and automatically transmitted to the cloud
No

39
Bicycle and Pedestrian Technology Testing
Background
Based on the results of the literature review, the state of the practice interviews, and discussion with Steering and Implementation Committee (St&IC) members, the research team inventoried important equipment attributes for ranking different bicycle and pedestrian counting devices to inform the selection of equipment for field testing. To score each bicycle and pedestrian counting technology, St&IC members were asked to provide their opinion on the relative importance of the equipment attributes on a scale from 0 to 10. A relative weight of zero indicates that the attribute is not relevant and should not be considered in selecting the equipment. A relative weight of 10 indicates the highest level of relative significance, while a relative weight of 1 indicates the lowest level of significance. It was possible to assign the same weight to multiple attributes to indicate that they have equal importance. The form used to gather scores from each St&IC member is provided in Appendix A. The averaged ratings provided by the St&IC members were used as attribute weights to adjust the relative scores on each category assigned by the research team based on the literature review findings and analysis of the state of the practice interviews (Table 19). The final score for each device was the sum of the weighted attributes. The five products with the highest final scores were identified as candidates for testing (Table 20). It must be noted that the scores displayed in Table 19 and Table 20 reflect the specific priorities and data collection needs of NCDOT and, therefore, are not meant to provide generalizable rankings for equipment attributes or specific products.
Table 19. Average Scores of Each Equipment Attribute
Equipment Attribute Average
Score (n = 5)
Estimated data accuracy 9
Access to and availability of data 8.6
Ability to collect multiple vs. single modes 8
Success of equipment in different facility contexts (intersection or corridor; shared use path, sidewalk, bike lane, or shared lane/mixed traffic)
7.8
Proven track record 7.6
Ease of data transmission/transport (from device to users) 7.6
Durability and placement 7.2
Software and data interpretability 7.2
Ability to collect behavioral data (e.g., risky traffic incidents, travel/movement patterns, collisions) 7
Flexibility to aggregate data from multiple technology types, and vendors, especially if deployed at the same counting location
7
Cost (per unit) 6.6
Featuring novel technology/approach 6.6
Routine maintenance requirements (calibration, battery change, sensor cleaning) 6.4
Ease of installation 5.8
Non-routine maintenance requirements (frequency of malfunction, vandalism, physical damage) 5.4
Additional fee requirements for data storage/transport/transmission 5.4
Weather conditions (humidity/snow/ice/rain/heat) 5.2
Availability of technical/field support 5
Geographic context/environment impacts 5
Data storage services 4.4

40
While radar technology was initially selected for testing based on the final scores, it was ultimately replaced by a pneumatic tube device for testing based on discussions with the vendor. The vendor did not recommend the micro-radar unit as an appropriate solution for standard bicycle and pedestrian monitoring (counting) on shared use paths. While the vendor suggested testing the system in a dedicated bicycle facility, such as a bike lane, the system is optimized for detection (e.g., for detecting a cyclist in a traffic signal control area to trigger a bicycle signal) rather than for counting.
Table 20. Technologies Considered for Testing and Final Scores
Technology Type/Vendor Final Score (Sum of Weighted Attributes)
Video/Image Processing
Eco-Counter CITIX 3D 542.2
Miovision Scout 525.2
DataFromSky 524.8
Numina 518.8
Open-source software 495.8
Radar Sensys Networks MicroRadar 488.8
Passive IR TRAFx Infrared Trail Counter 475.2
TrailMaster 413.8
Piezoelectric MetroCount RidePod BP 534.4
Qfree Hi-Trac CMU 482.4
Pneumatic Tube MetroCount RidePod BT Not scored; replaced Sensys Networks MicroRadar
Testing Plan
Technology testing involved evaluating the accuracy of the counting technologies by comparing data generated by the devices with ground truth pedestrian or bicycle manual counts reduced from video recordings. The use of video recording to derive a manual count 1) enables the data technicians to play back the videos at an appropriate speed to ensure that all pedestrians or bicyclists are captured and classified within the proper time period, 2) allows for the recordings to be played back to confirm that no pedestrian or bicyclist was missed, and 3) allows a large amount of data to be collected for subgroup analyses, such as time periods with certain environmental conditions (e.g., rain, low light, or changes in temperature).
Standard video cameras (battery-powered “bullet” style) were set up at each testing site to record activity (Figure 1). Before entering the field, aerial images were reviewed on Google Earth to determine the exact placement of each validation camera. The cameras are mounted to poles, signs, or trees so that the viewing angle is wide enough to capture the entire counting location, but not so far away as to problematize the visual confirmation of pedestrians and bicycles. Validation cameras are mounted via a plastic mounting bracket that is attached using two standard hose clamps. The camera installation process takes approximately thirty minutes to an hour. Additional considerations were given to address conditions that obstructed an acceptable field of view, such as passing or parked vehicles, or sun angle changes throughout the day.
A minimum of two weeks of video footage was reduced to obtain sufficient manual counts to assess the accuracy of the counting technologies. The data reduction protocol used for programmatic counting equipment validation in the NC NMVDP was adapted for use in this effort, including training materials, data coding methods, and data storage tools. Interrater reliability was evaluated by instructing data technicians to conduct manual counts on a set of 15-minute video recordings. These

41
counts were evaluated against one another using the Concordance Correlation Coefficient (CCC) to determine the level of agreement between data technicians.
Figure 1. Validation Video Camera Installation at a Testing Location on a Shared Use Path
Site Selection
Testing sites were selected based on an evaluation of site characteristics by the research team, feedback from the St&IC, and input from the NCDOT and municipal staff responsible for the candidate locations. The Eco-Counter CITIX 3D and Miovision Scout were installed at intersection locations that were 1) appropriate for the field of view limitations of the two systems, 2) convenient to the research team based on distance/travel time, and 3) experience a sufficient mix of pedestrian and bicyclist traffic. A downtown Raleigh intersection was selected for testing the Miovision Scout, and an intersection located at the entrance to NC State University’s Centennial Campus was selected for testing the Eco-Counter CITIX 3D.
The TRAFx Infrared Trail Counter, MetroCount Ridepod BP, and MetroCount Ridepod BT were co-located at a site where a permanent Eco-Counter MULTI system (passive infrared and inductive loop) was already installed as a part of the NC NMVDP. The counting location for the installation and testing of these technologies was selected from a shortlist of sidewalks, bike lanes, and shared use paths within 30 minutes travel time of the research team’s office and represented a mix of pedestrian and bicyclist volumes. The location chosen was a shared use path that connects urban neighborhoods to the North Carolina Museum of Art via a pedestrian overpass across Interstate 440.
The research team purchased the TRAFx Infrared Trail Counter and MetroCount RidePod BP systems for testing, along with the necessary tools and materials for their installation. The Miovision Scout was provided to the research team at no cost to test for a period of two weeks, the Eco-Counter CITIX 3D was provided at no cost to test for a period of one month, and the MetroCount RidePod BT system was provided at no cost to test for a period of one month. The overall costs for the equipment and software purchases are summarized in Appendix B.

42
Data Collection Schedule
The final testing sites, as well as their associated technologies and data collection periods, are provided in Table 21. This table also includes the corresponding dates for the validation video cameras.
The testing period included environmental conditions that are hypothesized to impact data accuracy and consistent functioning of the counting devices such as variation in ambient air temperature, weather, and lighting characteristics.
Data Processing
A sample of video data collected at each testing site was reviewed and reduced into manual counts by trained data technicians using a standardized protocol and workbook (Table 22). Video data were reduced to bin the manual counts into four 15-minute intervals across each hour of the day. A summary of the protocol, including diagrams for each site, is provided in Appendix C.
The automated count data collected by each of the tested technologies were retrieved and associated with the manual counts to conduct the accuracy analyses. The tested technologies exported data in different file types, data formats, and count aggregation levels. The automated and manual counts were converted to one-hour time intervals from 15-minute bins whenever necessary for consistency of analysis.

43
Table 21. Final Testing Sites with Associated Technologies and Installation Dates
Technology Type/Vendor Testing Location Location Type Latitude Longitude Installation Period(s)
Video/Image Processing
Eco-Counter CITIX 3D (depth camera)
Centennial Parkway at Oval Drive (Raleigh, NC)
Urban Roadway Intersection
35.77606 -78.67088 9/9/2020 - 12/15/2020
Miovision Scout (standard video with algorithm processing)
Hargett Street at Person Street (Raleigh, NC)
Urban Roadway Intersection
35.77814 -78.63493
7/28/2020 - 7/31/2020; 8/3/2020 - 8/6/2020;
8/7/2020 - 8/10/2020; 8/14/2020 - 8/17/2020
Passive IR TRAFx Infrared Trail Counter Reedy Creek Greenway to the west of the I-440 pedestrian bridge (Raleigh, NC)
Urban Shared Use Path Segment
35.80555 -78.69486 8/24/2020 - 10/20/2020
Piezoelectric MetroCount RidePod BP Reedy Creek Greenway to the west of the I-440 pedestrian bridge (Raleigh, NC)
Urban Shared Use Path Segment
35.80555 -78.69486 9/15/2020 (permanent
installation)
Pneumatic Tube MetroCount RidePod BT Reedy Creek Greenway to the west of the I-440 pedestrian bridge (Raleigh, NC)
Urban Shared Use Path Segment
35.80555 -78.69486 8/27/2020 - 10/20/2020
Inductive Loop with Passive IR
Eco-Counter MULTI Reedy Creek Greenway to the west of the I-440 pedestrian bridge (Raleigh, NC)
Urban Shared Use Path Segment
35.80555 -78.69486 Installed in April 2017
(permanent installation)
Validation Camera (1) Reedy Creek Greenway to the west of the I-440 pedestrian bridge (Raleigh, NC)
Urban Shared Use Path Segment
35.80555 -78.69486 8/27/2020 - 10/23/2020
Validation Camera (2) Centennial Parkway at Oval Drive (Raleigh, NC)
Urban Roadway Intersection
35.77814 -78.63493 9/16/2020 - 10/28/2020

44
Table 22. Validation Video Summary
Validation Cameras
Testing Location Location Type Latitude Longitude Validation
Period
Hours of Video
Reduced to Manual
Count
Validation Time
Interval
Validation Camera (1)
Reedy Creek Greenway to the west of the I-440 pedestrian bridge (Raleigh, NC)
Urban Shared Use Path Segment
35.80555 -78.69486 8/27/2020 -10/23/2020
142 15 minute
Validation Camera (2)
Centennial Parkway at Oval Drive (Raleigh, NC)
Urban Roadway Intersection
35.77814 -78.63493 9/16/2020 - 10/28/2020
219 15 minute
Miovision Scout
Hargett Street at Person Street (Raleigh, NC)
Urban Roadway Intersection
35.77814 -78.63493
Same as technology installation
period
72 15 minute
Interrater Reliability
Interrater reliability testing was performed by having data technicians produce manual counts on a set of 15-minute video recordings and then evaluating these counts against each other using Lin’s Concordance Correlation Coefficient (CCC) (Lin, 1989) to determine the level of agreement between data technicians. All pairwise comparisons used manual counts reduced from a set of 320 15-minute video recordings, except for those with Data Technician 5, which used a set of 128 15-minute video recordings. Table 23 provides the CCC calculated for each pair of data technicians in the study. The CCC is a measure of agreement between two variables, which considers both accuracy and consistency, unlike Pearson’s r, which only considers consistency. A CCC value of 1 indicates perfect agreement, and a value of 0 indicates no agreement. All pairs of data technicians had CCC values greater than 0.9 for the interrater reliability testing, which indicates a high strength of agreement. Accordingly, the research team is confident in the reliability of the data technicians’ abilities to accurately determine ground truth counts when reviewing video footage.
Table 23. Interrater Reliability Results
Data Technician
1 2 3 4 5
Dat
a Te
chn
icia
n 1 1.000 0.989 0.993 0.994 0.994
2 ---- 1.000 0.993 0.989 0.988
3 ---- ---- 1.000 0.992 0.988
4 ---- ---- ---- 1.000 0.991
5 ---- ---- ---- ---- 1.000

45
Data Summary
Specific hourly intervals were selected for reduction from the total amount of video collected as summarized in Table 24. Videos were selected to include different environmental conditions that were hypothesized to affect the performance of the counters, such as air temperature, rain, wind, and variability in user volumes. The hours of data included in the analyses are described in Table 20. Fields that indicate mean/SD provide the average value and standard deviation for the field across all hours of video used for analysis for a given counting technology. Historic climate data—including daily precipitation, average daily temperature, minimum daily temperature, and maximum daily temperature—were obtained from the National Oceanic and Atmospheric Administration (NOAA) National Centers for Environmental Information (NCEI) Global Historical Climatology Network (GHCN). This database is a composite of climate records from numerous sources that have been merged and quality assured. Data were collected from the nearest GHCN station with complete data for the observation periods and associated with the automated and manual counts.
Table 24. Summary of Data Included in Analyses
Condition Eco-Counter
CITIX 3D Miovision
Scout
TRAFx Infrared
Trail Counter
MetroCount RidePod BP
MetroCount RidePod BT
Eco-Counter MULTI
Technology Type Depth
Camera
Standard Video with Algorithm Processing
Passive Infrared
Piezoelectric Pneumatic
Tube Passive Infrared; Inductive Loop
Total Hours of Data 219 72 113 115 86 142
Mean Average Daily Temperature (degrees F)
64 79 67 65 64 67
Mean Maximum Daily Temperature (degrees F)
75 87 77 76 74 78
Mean Minimum Daily Temperature (degrees F)
55 71 59 57 55 59
Hourly pedestrian volume (mean/SD)
3 / 3 31 / 25 - 60 / 51 - 60 / 48
Hourly bicyclist volume (mean/SD)
4 / 6 6 / 6 - 19 / 17 19 / 19 21 / 18
Hourly total user volume (mean/SD)
6 / 8 37 / 30 82 / 69 79 / 65 - 80 / 64
Nighttime (sunset to sunrise) hours
75 33 0 0 0 0
Number of dates with rain
5 out of 16 3 out of 4 [Tropical
Storm Isaias] 3 out of 10 3 out of 10 3 out of 8 3 out of 12
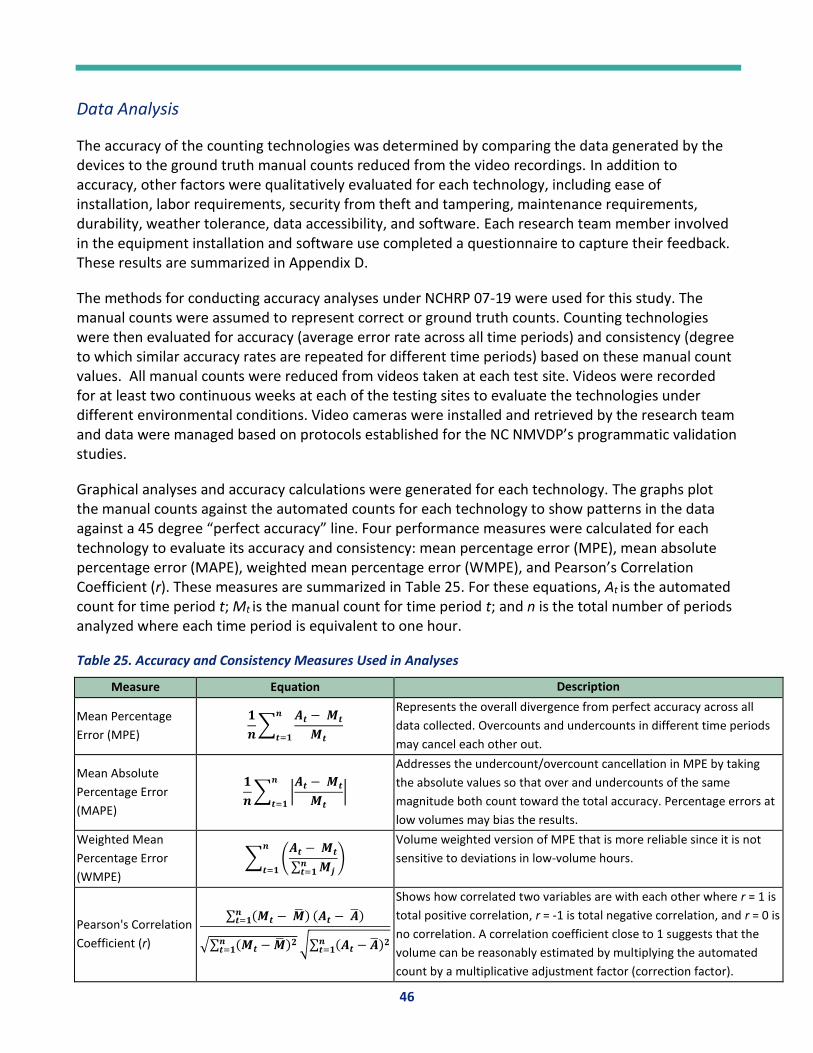
46
Data Analysis
The accuracy of the counting technologies was determined by comparing the data generated by the devices to the ground truth manual counts reduced from the video recordings. In addition to accuracy, other factors were qualitatively evaluated for each technology, including ease of installation, labor requirements, security from theft and tampering, maintenance requirements, durability, weather tolerance, data accessibility, and software. Each research team member involved in the equipment installation and software use completed a questionnaire to capture their feedback. These results are summarized in Appendix D.
The methods for conducting accuracy analyses under NCHRP 07-19 were used for this study. The manual counts were assumed to represent correct or ground truth counts. Counting technologies were then evaluated for accuracy (average error rate across all time periods) and consistency (degree to which similar accuracy rates are repeated for different time periods) based on these manual count values. All manual counts were reduced from videos taken at each test site. Videos were recorded for at least two continuous weeks at each of the testing sites to evaluate the technologies under different environmental conditions. Video cameras were installed and retrieved by the research team and data were managed based on protocols established for the NC NMVDP’s programmatic validation studies.
Graphical analyses and accuracy calculations were generated for each technology. The graphs plot the manual counts against the automated counts for each technology to show patterns in the data against a 45 degree “perfect accuracy” line. Four performance measures were calculated for each technology to evaluate its accuracy and consistency: mean percentage error (MPE), mean absolute percentage error (MAPE), weighted mean percentage error (WMPE), and Pearson’s Correlation Coefficient (r). These measures are summarized in Table 25. For these equations, At is the automated count for time period t; Mt is the manual count for time period t; and n is the total number of periods analyzed where each time period is equivalent to one hour.
Table 25. Accuracy and Consistency Measures Used in Analyses
Measure Equation Description
Mean Percentage
Error (MPE)
𝟏
𝒏∑
𝑨𝒕 − 𝑴𝒕
𝑴𝒕
𝒏
𝒕=𝟏
Represents the overall divergence from perfect accuracy across all
data collected. Overcounts and undercounts in different time periods
may cancel each other out.
Mean Absolute
Percentage Error
(MAPE)
𝟏
𝒏∑ |
𝑨𝒕 − 𝑴𝒕
𝑴𝒕
|𝒏
𝒕=𝟏
Addresses the undercount/overcount cancellation in MPE by taking
the absolute values so that over and undercounts of the same
magnitude both count toward the total accuracy. Percentage errors at
low volumes may bias the results.
Weighted Mean
Percentage Error
(WMPE)
∑ (𝑨𝒕 − 𝑴𝒕
∑ 𝑴𝒋𝒏𝒕=𝟏
)𝒏
𝒕=𝟏
Volume weighted version of MPE that is more reliable since it is not
sensitive to deviations in low-volume hours.
Pearson's Correlation
Coefficient (r)
∑ (𝑴𝒕 − �̅�)𝒏𝒕=𝟏 (𝑨𝒕 − �̅�)
√∑ (𝑴𝒕 − �̅�)𝟐𝒏𝒕=𝟏 √∑ (𝑨𝒕 − �̅�)𝟐𝒏
𝒕=𝟏
Shows how correlated two variables are with each other where r = 1 is
total positive correlation, r = -1 is total negative correlation, and r = 0 is
no correlation. A correlation coefficient close to 1 suggests that the
volume can be reasonably estimated by multiplying the automated
count by a multiplicative adjustment factor (correction factor).

47
Analysis by Technology Type
Overall
The findings from the field testing showed that the counting technologies performed with the accuracy summarized below. The reported values are the WMPE and r between automated and manual counts.
• Passive Infrared – Two products were tested with undercount rates of 31% and 44% and linear correlation rates of 0.94 and 0.96.
• Inductive Loops – One product was tested with an undercount rate of 8% and a correlation value of 0.99.
• Piezoelectric Strips – One product was tested with an undercount rate of 23% and a correlation value of 0.90 for pedestrians and with an undercount rate of 14% and a correlation value of 0.98 for bicyclists.
• Pneumatic Tubes – One product was tested with an overcount rate of 3% and a correlation value of 0.99.
• Standard Video with Algorithm Processing – One product was tested with an overcount rate of 6% and a correlation value of 0.99 for pedestrians and with an overcount rate of 7% and a correlation value of 0.94 for bicyclists.
• Depth Camera – One product was tested with an overcount rate of 325% and a correlation value of 0.50 for pedestrians and with an undercount rate of 27% and a correlation value of 0.53 for bicyclists.
Passive Infrared
Qualitative Experience
Two passive infrared counters were included in this study: 1) a counter that is part of a combination counter that uses electromagnetic detection alongside passive infrared detection to generate separate estimates of pedestrian and bicyclist volumes (Eco-Counter MULTI), and 2) a counter that is a standalone device intended to capture aggregate user volumes at a location and does not differentiate between pedestrians and bicyclists (TRAFx Trail Counter). The combination counter was a pre-existing installation while the standalone device was temporarily installed by the research team for the purpose of testing. Both devices were tested on a paved shared use path.
The standalone device was housed in a small metal electrical disconnect box and mounted using two metal hose clamps affixed to a signpost on the path shoulder. This installation was the least time-consuming and intensive of those encountered during the testing. Total installation time was approximately 20 minutes.

48
Figure 2. Eco-Counter MULTI with Passive Infrared PYRO in a Wooden Post (left) and TRAFx Trail Counter (right)
Accuracy and Consistency
Both passive infrared sensors included in the testing demonstrated undercounting. Passive infrared sensors are known to underperform at higher volumes due to occlusion error. Both devices produced consistent counts across different volumes, which indicates that the application of a correction factor can reasonably adjust the counts towards more accurate volume estimates. Accuracy plots are provided in Figure 3. Device specific accuracy and consistency metrics are provided in Table 26.
Figure 3. Passive Infrared Accuracy Plots

49
Table 26. Accuracy and Consistency Values for Passive Infrared Sensors
Product Technology Mode MPE MAPE WMPE r n Average Hourly
Volume
Eco-Counter MULTI System
Passive Infrared Pedestrian -32 33 -31 0.94 142 60
TRAFx Trail Counter
Passive Infrared All Modes Combined
-44 44 -44 0.96 113 82
Notes: MPE = mean percentage error; MAPE = mean absolute percentage error; WMPE = weighted mean percentage error; r = Pearson’s Correlation Coefficient; n = number of hourly intervals; average hourly volume = hourly average pedestrian, bicyclist, or combined count based on video observation.
Accuracy and Consistency – Rain Condition
Both passive infrared sensors performed better during time periods with rain, as compared to time periods with no rain (Table 27). This is likely due to the overall reduction in pedestrian volumes during the rainy time periods, a condition that mitigates occlusion error.
Table 27. Accuracy and Consistency Values for Passive Infrared Sensors – Rain Condition
Condition Product Technology Mode MPE MAPE WMPE r n Average Hourly
Volume
Rain
Eco-Counter MULTI System
Passive Infrared
Pedestrian -40 40 -35 0.98 37 28
TRAFx Trail Counter
Passive Infrared
All Modes Combined
-48 48 -49 0.99 37 35
No Rain
Eco-Counter MULTI System
Passive Infrared
Pedestrian -29 30 -30 0.93 105 71
TRAFx Trail Counter
Passive Infrared
All Modes Combined
-42 43 -44 0.94 76 105
Notes: MPE = mean percentage error; MAPE = mean absolute percentage error; WMPE = weighted mean percentage error; r = Pearson’s Correlation Coefficient; n = number of hourly intervals; average hourly volume = hourly average pedestrian, bicyclist, or combined count based on video observation.
Inductive Loops
Qualitative Experience
One inductive loop counter was included in this study. It is part of a combination counter that uses electromagnetic detection alongside passive infrared detection to generate separate estimates of pedestrian and bicyclist volumes (Figure 4). The device was tested on a paved shared use path.

50
Figure 4. Eco-Counter MULTI with (a) Passive Infrared PYRO in a Wooden Post and (b) Inductive Loop ZELT
Accuracy and Consistency
Bypass error is a known issue with inductive loops. This error occurs when bicyclists ride around the sensor rather than across the detection zone. The inductive loops included in testing are located on a paved shared use path with sloped, natural shoulders that limit the likelihood of bicyclist movements occurring off the pathway. Bypass error was not identified in the video data review.
The inductive loops were found to be both accurate and consistent across the bicyclist volumes experienced at the testing site. An accuracy plot is provided in Figure 5. Device specific accuracy and consistency metrics are provided in Table 28.
Figure 5. Inductive Loops Accuracy Plot
a)
b)

51
Table 28. Accuracy and Consistency Values for Inductive Loops
Product Technology Mode MPE MAPE WMPE r n Average Hourly
Volume
Eco-Counter MULTI System
Inductive Loop Bicycle -6 13 -8 0.99 142 21
Notes: MPE = mean percentage error; MAPE = mean absolute percentage error; WMPE = weighted mean percentage error; r = Pearson’s Correlation Coefficient; n = number of hourly intervals; average hourly volume = hourly average pedestrian, bicyclist, or combined count based on video observation.
Accuracy and Consistency – Rain Condition
The performance of the inductive loops did not appear to be different during time periods with rain, as compared to time periods with no rain (Table 29).
Table 29. Accuracy and Consistency Values for Inductive Loops – Rain Condition
Condition Product Technology Mode MPE MAPE WMPE r n Average Hourly
Volume
Rain Eco-Counter MULTI System
Inductive Loop
Bicycle -3 21 -8 0.99 37 7
No Rain Eco-Counter MULTI System
Inductive Loop
Bicycle -6 10 -8 0.99 105 25
Notes: MPE = mean percentage error; MAPE = mean absolute percentage error; WMPE = weighted mean percentage error; r = Pearson’s Correlation Coefficient; n = number of hourly intervals; average hourly volume = hourly average pedestrian, bicyclist, or combined count based on video observation.
Piezoelectric Strips
Qualitative Experience
One permanent piezoelectric strip sensor was tested in this study. The counter is designed to detect pedestrians and bicyclists separately. The counter was installed by the research team for the purpose of testing. The device was tested on a paved shared use path.
Of those included in the testing, this counter was the most time-intensive and challenging to install (Figure 6). The installation required specialized equipment and supplies, including a concrete saw for cutting slots in the pavement to house the piezoelectric sensor strips; a leaf blower for clearing the slots of debris; resin for encapsulating the sensor strips to form the pressure pads necessary for detection; and a drill, attachments, and hand tools for mixing and pouring the resin. The research team did not feel prepared for the level of precision required for the installation based on the instructions included in the equipment shipment and those provided by the vendor through email and phone correspondence. The research team was provided the incorrect quantity of resin based on the width of the shared use path, so two visits were required to finish the initial installation. A representative from the vendor arranged a field visit and determined that additional resin was needed to ensure the pressure pads encapsulating the piezoelectric sensor strips were correctly

52
formed. The representative assisted with correcting the installation and verifying that the system was functioning properly prior to testing.
Figure 6. Initial Installation (left), Applying Additional Resin (center), and Final Pressure Pad Height (right)
Accuracy and Consistency
The piezoelectric strips were both accurate and consistent across the bicyclist volumes experienced at the testing site. The piezoelectric strips were more accurate and consistent for pedestrians at lower volumes and showed increased undercounting at higher hourly pedestrian volumes. Accuracy plots are provided in Figure 7. Device specific accuracy and consistency metrics are provided in Table 30.
Figure 7. Piezoelectric Strips Accuracy Plots

53
Table 30. Accuracy and Consistency Values for Piezoelectric Strips
Product Technology Mode MPE MAPE WMPE r n Average Hourly
Volume
MetroCount RidePod BP
Piezoelectric Pedestrian -12 29 -23 0.90 115 60
MetroCount RidePod BP
Piezoelectric Bicycle -9 20 -14 0.98 115 19
Notes: MPE = mean percentage error; MAPE = mean absolute percentage error; WMPE = weighted mean percentage error; r = Pearson’s Correlation Coefficient; n = number of hourly intervals; average hourly volume = hourly average pedestrian, bicyclist, or combined count based on video observation.
Accuracy and Consistency – Rain Condition
The accuracy and consistency of the piezoelectric strip sensor was marginally higher for pedestrians and marginally lower for bicyclists during time periods with rain, as compared to time periods with no rain (Table 31). The slightly improved performance for pedestrians is likely due to the overall reduction in pedestrian volumes during these periods, which mitigates occlusion error.
Table 31. Accuracy and Consistency Values for Piezoelectric Strips – Rain Condition
Condition Product Technology Mode MPE MAPE WMPE r n Average Hourly
Volume
Rain
MetroCount RidePod BP
Piezoelectric Pedestrian -5 33 -12 0.93 37 28
MetroCount RidePod BP
Piezoelectric Bicycle -8 29 -19 0.97 37 7
No Rain
MetroCount RidePod BP
Piezoelectric Pedestrian -15 27 -25 0.87 78 75
MetroCount RidePod BP
Piezoelectric Bicycle -10 16 -13 0.98 78 24
Notes: MPE = mean percentage error; MAPE = mean absolute percentage error; WMPE = weighted mean percentage error; r = Pearson’s Correlation Coefficient; n = number of hourly intervals; average hourly volume = hourly average pedestrian, bicyclist, or combined count based on video observation.
Pneumatic Tubes
Qualitative Experience
One portable pneumatic tube counter was tested in this study. The counter is designed to detect bicyclists only by using bicycle-specific tubes (not traditional motor vehicle tubes). The counter was installed by the research team for the purpose of testing. The device was tested on a paved shared use path. The device was a demo unit that was provided at no cost by the vendor for the testing period.
The pneumatic tubes were installed by affixing the ends down at the path’s outer edges using a mallet and pavement nails and then taping the tubes down to the pavement surface using 3” strips of Gorilla tape (Figure 8). The counting system was housed in a metal security box that was chained and locked to a signpost on the path shoulder. Total installation time was approximately 45 minutes.

54
Figure 8. Tube Ends with Cable Ties (left) and Tubes Taped Down to Pavement Surface (right)
Accuracy and Consistency
Like inductive loops, bypass error is a known issue with pneumatic tube counters. The pneumatic tubes included in testing were installed on a paved shared use path with sloped, natural shoulders that limit the likelihood that bicyclist movements will occur off the pathway. Bypass error was not identified in the video data review.
The pneumatic tubes were found to be both accurate and consistent across the bicyclist volumes experienced at the testing site. An accuracy plot is provided in Figure 9. Device specific accuracy and consistency metrics are provided in Table 32.
Figure 9. Pneumatic Tubes Accuracy Plot

55
Table 32. Accuracy and Consistency Values for Pneumatic Tubes
Product Technology Mode MPE MAPE WMPE r n Average Hourly
Volume
MetroCount RidePod BT
Pneumatic Tube Bicycle 1 15 3 0.99 86 19
Notes: MPE = mean percentage error; MAPE = mean absolute percentage error; WMPE = weighted mean percentage error; r = Pearson’s Correlation Coefficient; n = number of hourly intervals; average hourly volume = hourly average pedestrian, bicyclist, or combined count based on video observation.
Accuracy and Consistency – Rain Condition
The performance of the pneumatic tubes did not differ during time periods with rain, as compared to time periods with no rain (Table 33).
Table 33. Accuracy and Consistency Values for Pneumatic Tubes – Rain Condition
Condition Product Technology Mode MPE MAPE WMPE r n Average Hourly
Volume
Rain MetroCount RidePod BT
Pneumatic Tube
Bicycle -1 20 2 0.99 37 7
No Rain MetroCount RidePod BT
Pneumatic Tube
Bicycle 3 11 4 0.98 49 27
Notes: MPE = mean percentage error; MAPE = mean absolute percentage error; WMPE = weighted mean percentage error; r = Pearson’s Correlation Coefficient; n = number of hourly intervals; average hourly volume = hourly average pedestrian, bicyclist, or combined count based on video observation.
Standard Video with Algorithm Processing
Qualitative Experience
One standard video camera system with algorithm processing was tested in this study. The standard video camera system is typically installed at intersection locations to record all traffic for up to a 72-hr period. The videos are recorded to an SD card, and the user is required to upload the videos using vendor-provided software. The vendor then processes the data using a classification algorithm to produce counts by intersection leg and mode. The counter was temporarily installed by the research team for the purpose of testing. The device was tested at a downtown urban intersection to collect bicycle counts in the travel lanes and on the sidewalks and to collect pedestrian counts on the sidewalks. The device was a demo unit that was provided at no cost by the vendor for the testing period.
The video camera system consists of a telescoping aluminum mast arm and pole mount with a video camera affixed to the top (Figure 10). The video camera is connected to a control box that houses the battery and computer. The video camera system was installed by securing the pole mount to a parking sign using two metal hose clamps and a security cable and padlock. While the total installation time was relatively short (approximately one hour), special attention needed to be paid to accurately positioning the mast arm to ensure the correct camera angle and field of view.

56
Figure 10. Miovision Scout Installation on a Parking Sign
Accuracy and Consistency
The standard video with algorithm processing was found to be both accurate and consistent across the bicyclist and pedestrian volumes experienced at the testing site. Accuracy plots are provided in Figure 11. Device specific accuracy and consistency metrics are provided in Table 34.

57
Figure 11. Standard Video with Algorithm Processing Accuracy Plots
Table 34. Accuracy and Consistency Values for Standard Video with Algorithm Processing
Product Technology Mode MPE MAPE WMPE r n Average Hourly
Volume
Miovision Scout
Standard Video with Algorithm Processing
Bicycle (Road)
7 23 7 0.96 72 4
Miovision Scout
Standard Video with Algorithm Processing
Bicycle (Sidewalk)
15 51 6 0.79 72 2
Miovision Scout
Standard Video with Algorithm Processing
Bicycle (Combined)
5 27 7 0.94 72 6
Miovision Scout
Standard Video with Algorithm Processing
Pedestrian (Sidewalk)
11 17 6 0.99 72 31
Notes: MPE = mean percentage error; MAPE = mean absolute percentage error; WMPE = weighted mean percentage error; r = Pearson’s Correlation Coefficient; n = number of hourly intervals; average hourly volume = hourly average pedestrian, bicyclist, or combined count based on video observation.
Accuracy and Consistency – Rain Condition
The accuracy and consistency of the standard video with algorithm processing did not appear to differ during time periods with rain, as compared to time periods with no rain (Table 35).

58
Table 35. Accuracy and Consistency Values for Standard Video with Algorithm Processing – Rain Condition
Condition Product Technology Mode MPE MAPE WMPE r n Average Hourly
Volume
Rain
Miovision Scout
Standard Video with Algorithm Processing
Bicycle (Road)
2 24 6 0.96 48 4
Miovision Scout
Standard Video with Algorithm Processing
Bicycle (Sidewalk)
-4 37 2 0.79 48 2
Miovision Scout
Standard Video with Algorithm Processing
Bicycle (Combined)
-4 26 5 0.95 48 6
Miovision Scout
Standard Video with Algorithm Processing
Pedestrian (Sidewalk)
12 19 7 0.99 48 30
No Rain
Miovision Scout
Standard Video with Algorithm Processing
Bicycle (Road)
16 22 9 0.95 24 4
Miovision Scout
Standard Video with Algorithm Processing
Bicycle (Sidewalk)
61 84 15 0.79 24 2
Miovision Scout
Standard Video with Algorithm Processing
Bicycle (Combined)
24 30 11 0.92 24 6
Miovision Scout
Standard Video with Algorithm Processing
Pedestrian (Sidewalk)
10 15 4 0.99 24 34
Notes: MPE = mean percentage error; MAPE = mean absolute percentage error; WMPE = weighted mean percentage error; r = Pearson’s Correlation Coefficient; n = number of hourly intervals; average hourly volume = hourly average pedestrian, bicyclist, or combined count based on video observation.
Accuracy and Consistency – Night Condition
The accuracy and consistency of the standard video with algorithm processing did not appear to differ between night periods and day periods for detecting bicyclists in the roadway and pedestrians on the sidewalk (Table 36). For detecting bicyclists on the sidewalk, the technology performed better during day periods than it did during night periods.

59
Table 36. Accuracy and Consistency Values for Standard Video with Algorithm Processing – Night Condition
Condition Product Technology Mode MPE MAPE WMPE r n Average Hourly
Volume
Night
Miovision Scout
Standard Video with Algorithm Processing
Bicycle (Road)
-8 17 -11 0.98 33 2
Miovision Scout
Standard Video with Algorithm Processing
Bicycle (Sidewalk)
-8 47 -18 0.67 33 1
Miovision Scout
Standard Video with Algorithm Processing
Bicycle (Combined)
-12 28 -12 0.92 33 3
Miovision Scout
Standard Video with Algorithm Processing
Pedestrian (Sidewalk)
17 29 12 0.99 33 11
Day
Miovision Scout
Standard Video with Algorithm Processing
Bicycle (Road)
17 27 11 0.95 39 6
Miovision Scout
Standard Video with Algorithm Processing
Bicycle (Sidewalk)
29 53 14 0.81 39 3
Miovision Scout
Standard Video with Algorithm Processing
Bicycle (Combined)
18 27 13 0.93 39 8
Miovision Scout
Standard Video with Algorithm Processing
Pedestrian (Sidewalk)
6 8 5 0.97 39 49
Notes: MPE = mean percentage error; MAPE = mean absolute percentage error; WMPE = weighted mean percentage error; r = Pearson’s Correlation Coefficient; n = number of hourly intervals; average hourly volume = hourly average pedestrian, bicyclist, or combined count based on video observation.
Depth Camera
Qualitative Experience
One depth camera system was tested in this study. The depth camera system is typically installed at dense urban intersections. The video data are processed using edge computing and the resulting counts are transmitted through automatic daily GSM transmission to a cloud-based database. Count data are accessed using vendor-provided software. The counter was temporarily installed by the research team for the purpose of testing. The device was tested at an urban intersection at the entrance to NC State University’s Centennial Campus to collect bicycle counts in the travel lanes, on the sidewalk, and in the crosswalks and to collect pedestrian counts on the sidewalk and in the

60
crosswalks. The device was a demo unit that was provided at no cost by the vendor for the testing period.
The installation of the depth camera required the assistance of NCDOT Division staff and the use of a commercial bucket truck and signal mounting bracket to attach the camera to the horizontal mast arm of the traffic signal at the intersection (Figure 12). NCDOT Division staff hardwired the camera into an adjacent electrical cabinet to power the system. After the depth camera was mounted, technical support staff from the vendor assisted the research team with calibrating the system. The research team connected to the system using a laptop computer and portable Wi-Fi hot spot and were remotely guided by the technical support staff through the process of establishing the detection zone and counting lines. Total installation time was approximately five hours.
Figure 12. CITIX 3D Installation on the Horizontal Mast Arm of a Traffic Signal
Accuracy and Consistency
The depth camera was found to have low accuracy and low consistency across the bicyclist and pedestrian volumes experienced at the testing site. At higher volumes, pedestrians were severely overcounted, while bicyclists were undercounted. Accuracy plots are provided in Figure 13. Device specific accuracy and consistency metrics are provided in Table 37.

61
Figure 13. Depth Camera Accuracy Plots
Table 37. Accuracy and Consistency Values for Depth Camera
Product Technology Mode MPE MAPE WMPE r n Average Hourly
Volume
Eco-Counter CITIX 3D
Depth Camera Pedestrian 548 550 325 0.50 219 3
Eco-Counter CITIX 3D
Depth Camera
Bicycle (Road and Sidewalk - Centennial Parkway)
59 95 8 0.49 220 2
Eco-Counter CITIX 3D
Depth Camera Bicycle (Road - Oval Drive)
-88 91 -90 0.37 220 2
Eco-Counter CITIX 3D
Depth Camera Bicycle (Combined)
19 96 -27 0.53 220 4
Notes: MPE = mean percentage error; MAPE = mean absolute percentage error; WMPE = weighted mean percentage error; r = Pearson’s Correlation Coefficient; n = number of hourly intervals; average hourly volume = hourly average pedestrian, bicyclist, or combined count based on video observation.
Accuracy and Consistency – Rain Condition
The depth camera performed better during time periods with no rain, as compared to time periods with rain. However, the accuracy and consistency for pedestrians and bicyclists was low overall, as compared to other technologies included in the testing (Table 38).

62
Table 38. Accuracy and Consistency Values for Depth Camera – Rain Condition
Condition Product Technology Mode MPE MAPE WMPE r n Average Hourly
Volume
Rain
Eco-Counter CITIX 3D
Depth Camera
Pedestrian 865 870 458 0.25 69 2
Eco-Counter CITIX 3D
Depth Camera
Bicycle (Road and Sidewalk - Centennial Parkway)
34 66 5 0.27 69 1
Eco-Counter CITIX 3D
Depth Camera
Bicycle (Road - Oval Drive)
-93 93 -92 0.26 69 1
Eco-Counter CITIX 3D
Depth Camera
Bicycle (Combined)
6 98 -29 0.26 69 2
No Rain
Eco-Counter CITIX 3D
Depth Camera
Pedestrian 427 428 287 0.66 150 3
Eco-Counter CITIX 3D
Depth Camera
Bicycle (Road and Sidewalk - Centennial Parkway)
66 103 8 0.48 151 3
Eco-Counter CITIX 3D
Depth Camera
Bicycle (Road - Oval Drive)
-86 91 -89 0.38 151 2
Eco-Counter CITIX 3D
Depth Camera
Bicycle (Combined)
24 96 -27 0.54 151 5
Notes: MPE = mean percentage error; MAPE = mean absolute percentage error; WMPE = weighted mean percentage error; r = Pearson’s Correlation Coefficient; n = number of hourly intervals; average hourly volume = hourly average pedestrian, bicyclist, or combined count based on video observation.
Accuracy and Consistency – Night Condition
The depth camera performed better during night periods for pedestrians and for bicycles that were traveling in the roadway on Oval Drive. The depth camera performed better during day periods for bicyclists that were traveling in the roadway and on the sidewalk of Centennial Parkway (Table 39).

63
Table 39. Accuracy and Consistency Values for Depth Camera – Night Condition
Condition Product Technology Mode MPE MAPE WMPE r n Average Hourly
Volume
Night
Eco-Counter CITIX 3D
Depth Camera
Pedestrian 564 569 320 0.70 72 2
Eco-Counter CITIX 3D
Depth Camera
Bicycle (Road and Sidewalk - Centennial Parkway)
258 269 157 0.17 72 1
Eco-Counter CITIX 3D
Depth Camera
Bicycle (Road - Oval Drive)
-65 76 -80 0.45 72 2
Eco-Counter CITIX 3D
Depth Camera
Bicycle (Combined)
217 248 31 0.45 72 3
Day
Eco-Counter CITIX 3D
Depth Camera
Pedestrian 542 543 327 0.38 147 3
Eco-Counter CITIX 3D
Depth Camera
Bicycle (Road and Sidewalk - Centennial Parkway)
-1 42 -17 0.83 148 3
Eco-Counter CITIX 3D
Depth Camera
Bicycle (Road - Oval Drive)
-93 95 -94 0.21 148 2
Eco-Counter CITIX 3D
Depth Camera
Bicycle (Combined)
-38 52 -43 0.80 148 4
Notes: MPE = mean percentage error; MAPE = mean absolute percentage error; WMPE = weighted mean percentage error; r = Pearson’s Correlation Coefficient; n = number of hourly intervals; average hourly volume = hourly average pedestrian, bicyclist, or combined count based on video observation.
Cost Benefit/Performance Analysis and Management Plan
Performance Analysis
This section provides a comparative performance analysis of the technologies tested. The accuracy metrics provided in previous chapters were mapped into a scale of 1 to 5 using the scheme outlined in Tables 40 and 41. Table 42 shows the resulting ratings. The last column provides the overall combined rating given by calculating the weighted average of the four metrics. To calculate the weighted average, the average of MPE, MAPE, and WMPE was determined. Next, the sum of the result and r was divided by 2. The rationale here is based on the notion that the metrics focusing on the accuracy of the counts and the metric measuring the consistency of the counts (r) are equally significant to evaluate the performance of a device. Therefore, they should be equally weighted in producing a combined assessment.

64
Table 40. Mapping of MPE, MAPE, and WMPE into a Rating Scheme of 1 to 5
MPE, MAPE, or WMPE
Rating Description
0 to 15 5 Very Good
16 to 25 4 Good
26 to 40 3 Acceptable
41 to 65 2 Poor
66 or greater 1 Unacceptable
Table 41. Mapping of r into a Rating Scheme of 1 to 5
r Rating Description
0.9 to 1 5 Very Good
0.8 to 0.89 4 Good
0.7 to 0.79 3 Acceptable
0.6 to 0.69 2 Poor
0 to 0.59 1 Unacceptable
Table 42. Comparative Analysis of the Accuracies of the Tested Technologies
Product Technology Mode MPE MAPE WMPE r Combined Accuracy
Score [(MPE+MAPE+WAMPE)/3 + r]/2
Eco-Counter MULTI System
Passive Infrared Pedestrian 3 3 3 5 4.0
TRAFx Trail Counter
Passive Infrared All Modes Combined
2 2 2 5 3.5
Eco-Counter MULTI System
Inductive Loop Bicycle 5 5 5 5 5.0
MetroCount RidePod BP
Piezoelectric Pedestrian 5 3 4 5 4.8
MetroCount RidePod BP
Piezoelectric Bicycle 5 4 5 5 4.8
MetroCount RidePod BT
Pneumatic Tube Bicycle 5 5 5 5 5.0
Miovision Scout Standard Video with Algorithm Processing
Bicycle (Road) 5 4 5 5 4.8
Miovision Scout Standard Video with Algorithm Processing
Bicycle (Sidewalk) 5 2 5 3 3.5
Miovision Scout Standard Video with Algorithm Processing
Bicycle (Combined) 5 3 5 5 4.6
Miovision Scout Standard Video with Algorithm Processing
Pedestrian (Sidewalk)
5 4 5
5
4.8
Eco-Counter CITIX 3D
Depth Camera Pedestrian 1 1 1 1 1.0
Eco-Counter CITIX 3D
Depth Camera Bicycle (Road and Sidewalk - Centennial Parkway)
2 1 5 1 1.8
Eco-Counter CITIX 3D
Depth Camera Bicycle (Road - Oval Drive)
1 1 1 1 1.0
Eco-Counter CITIX 3D
Depth Camera Bicycle (Combined) 4 1 3 1 1.8

65
Among all the technologies tested, only the Eco-Counter CITIX 3D technology received poor or unacceptable results. All other technologies demonstrated acceptable levels of performance in terms of measured accuracy. The MetroCount RidePod BT pneumatic tubes and Eco-Counter MULTI system featuring inductive loops to count bicycles both scored a rating of 5, indicating an excellent level of accuracy. The Miovision Scout measurements were highly accurate, except for the counts of bicycles on the sidewalk, where the accuracy was found to be medium. Two passive infrared technologies produced comparable results, rated as 4 and 3.5 for Eco-Counter and TRAFx devices, respectively. Overall measurement accuracies were within the acceptable levels for all technologies, except for the Eco-Counter CITIX 3D.
Cost-Benefit Analysis and Its Implications on the Future Deployment and Management Plans
This section focuses on the qualitative analysis of the cost-benefit characteristics of the technologies tested in the project. Although many cost-benefit analyses center around the estimation of the dollar values of benefits and costs associated with the action that is under consideration, our focus is to compare the technology alternatives in terms of the key factors observed and/or measured during the technology tests in this project. Two key benefit factors were identified: 1) measurement accuracy and 2) the quality of the software tools provided by the vendor. For the costs, installation difficulty and the cost of the technology were used. Table 43 provides the qualitative evaluations for each of those factors per each technology. A benefit-cost ratio (BCR) that combines the four factors into a single qualitative assessment is provided for each technology. BCR provides a measure of the relationship between the relative costs and benefits of the technology. The calculation of BCR is conducted in qualitative terms. Higher BCR assessments indicate the cases in which the technology’s benefits outweigh its costs. In the case that a technology has low BCR value, it indicates that the benefits do not justify the costs. BCR values in Table 43 were driven by the data and observations accumulated during the technology tests. The results indicate that the MetroCount RidePod BT pneumatic tubes provide the highest BCR ratio, followed by the TRAFx Trail Counter. The Eco-Counter MULTI system, MetroCount RidePod BP piezoelectric system, and Miovision Scout were all found to be acceptable in terms of their benefit-cost metrics. The Eco-Counter CITIX 3D received a BCR value of very low.

66
Table 43. Qualitative Cost-Benefit Analysis of the Technologies Tested
Product Technology Mode
Benefits Costs
Benefit-Cost Ratio (BCR) Accuracy
Quality of Software
Tools
Installation Difficulty
Equipment or
Service Cost
Eco-Counter MULTI System
Passive Infrared Pedestrian High High Acceptable High Acceptable
Eco-Counter MULTI System
Inductive Loop Bicycle High High Acceptable High Acceptable
TRAFx Trail Counter
Passive Infrared All Modes Combined
Acceptable High Very Low Low High
MetroCount RidePod BP
Piezoelectric Pedestrian Very High Low Very High Low Acceptable
MetroCount RidePod BP
Piezoelectric Bicycle Very High Low Very High Low Acceptable
MetroCount RidePod BT
Pneumatic Tube Bicycle Very High Low Low Low Very High
Miovision Scout
Standard Video with Algorithm Processing
Pedestrian High High Low Very High Acceptable
Miovision Scout
Standard Video with Algorithm Processing
Bicycle High High Low Very High Acceptable
Eco-Counter CITIX 3D
Depth Camera Pedestrian Very Low Acceptable Very High Very High Very Low
Eco-Counter CITIX 3D
Depth Camera Bicycle Very Low Acceptable Very High Very High Very Low
The findings of the cost-benefit analysis presented here can be used to support the decision-making processes involving the deployments of new counting equipment and the associated management plans. It is generally advisable to select products that provide higher benefit-cost ratios. However, the BCR values should be used in consideration with other significant decision factors such as specific constraints, requirements, and priorities that may be involved in a particular project or program. One such decision criteria can be driven by the technology’s suitability for long- versus short-term data collection. Tables 2 and 3 cover detailed comparisons of various technologies in terms of their important technical attributes, providing guidance for decision-makers in optimizing their equipment selection.
Data Integration and Certain Considerations for System Management
Dissemination of the collected data constitutes a key element in any data collection system. The natural inclination is to make as much data available as frequently as possible. However, data and information dissemination often constitute an optimization problem: the output volume, data quality, and the reporting frequency should be maximized while the costs are minimized, as the system operates within the constraints.

67
The data reporting frequency is one of the main attributes involved in data dissemination decisions. Among the agencies that were interviewed by the research team, the frequency of data reporting varied greatly. The reported frequencies range from biannually to real-time. Half of the agencies indicated that they generate publicly available data reports. To determine the optimal frequency, agencies should first identify the objectives associated with each type of data report that will be generated. At that stage, identification of main use cases for the reported data can be helpful. For example, one use may involve decisions related with facility planning, while other use cases may involve the economic growth forecast models that ingest the reported data.
Data quality assurance is a critical task in bicycle and pedestrian counting programs. It is crucial to have well documented processes describing the quality assurance processes employed in data collection activities. This is an area for which NCDOT can provide guidance and leadership to support local organizations and municipalities in their data collection projects through a centralized capability. Another such centralized service can focus on building an efficient equipment lending program where local organizations and municipalities are provided access to a shared pool of devices to conduct their respective short-term data collection projects. In the interviews conducted by the research team, several states indicated that they have such centralized state-based efforts to support various local entities in their short-term counting activities. This can prevent redundancies within the state and decrease the cost of the local data collection efforts. This also means that the devices may need to be relatively easy to install, remove, and transport.
Discussion and Conclusions
The following summarizes the recommended technologies and their key aspects:
• MetroCount RidePod BT (pneumatic tubes) received the highest BCR. The technology was found to be easy to install, relatively low cost, and highly accurate for counting bicycles. Pneumatic tubes are suitable for short-term data collection on shared use paths, in bikes lanes, and in shared lanes with motor vehicles.
• TRAFx Trail Counter (passive infrared) received a high BCR. The technology was found to be a cost-effective and feasible solution for counting mixed mode traffic on either a short- or long-term basis. Its ease of installation, relatively low cost, and acceptable accuracy indicate that it is a reasonable option for counting mixed mode traffic (pedestrians and bicycles combined) on shared use paths and sidewalks. Its long battery life and self-contained design reduces maintenance requirements.
• Eco-Counter MULTI System (passive infrared and inductive loop) received an acceptable BCR. While the technology was found to be highly accurate for counting pedestrians and bicycles separately, it has a relatively high cost. This cost may be justified for many permanent long-term applications. The combination system is typically used for long-term data collection on shared use paths or sidewalks. While the system is designed to count pedestrians and bicycles separately, its passive infrared sensors and inductive loops can be used independently for the long-term monitoring of pedestrians/mixed mode traffic or bicycles separately.
• MetroCount RidePod BP (piezoelectric) received an acceptable BCR. The technology was found to be highly accurate for counting pedestrians and bicycles separately, relatively low

68
cost, but very difficult to install. The technology is a feasible option for counting pedestrians and bicycles separately on shared use paths or in bike lanes on a permanent, long-term basis if the installation difficulty and challenges with the software tools can be overcome.
• Miovision Scout (standard video with algorithm processing) received an acceptable BCR. The technology was found to be easy to install, highly accurate for counting pedestrians and bicycles separately on the roadway and on the sidewalk, but very high cost. The technology has its own unique application cases, as compared to the other technologies included in the testing. It is particularly useful for analyzing complex traffic and behavioral patterns such as travel direction, speed, and vehicle classification at corridors or intersections. This technology is typically used for counting motor vehicles, pedestrians, and bicycles on a short-term basis at urban intersections.
The Eco-Counter CITIX 3D (depth camera) was excluded from the list of recommended technologies above since it received a very low BCR. The technology was found to be difficult to install and very high cost with very low accuracy for counting pedestrians and bicycles separately on the roadway and sidewalk. The technology is designed for counting pedestrians, bicycles, and motor vehicles separately on a short- or long-term basis at high-traffic urban corridors or intersections.
Data Integration
All the technologies tested in this study featured a software tool for data analysis and reporting. Although the quality of the user experience with these tools varies, it is feasible to integrate the output of each data collection system to achieve efficient data integration across various users and platforms. The data integration assessment provided in this study is geared towards intermittent data reporting tasks that provide adequate time for post processing of the data. Real-time, continuous data integration capabilities were not considered.
Study Limitations
The approach of this study was to test a variety of technologies within the constraints of a limited time and budget. Therefore, the research team was not able to test many of the other products on the market that can potentially provide reasonable alternatives. The list of recommended technologies above should not be interpreted as an exhaustive list of all viable products in the marketplace. The objective of this study was to select a group of products that cover a range of sensor technologies and the most relevant features for NCDOT and then evaluate their performance in the field. Recent developments in edge computing and machine learning are likely to bring a new generation of low-cost and low-power counting devices to the marketplace in the near future. Therefore, to optimize the selection of the best counters for a particular application, agencies should monitor recent developments in the field.
Diversity, Equity, and Inclusion
This project focused on testing technologies for counting pedestrians and bicyclists across the state of North Carolina. The test sites included in this study were all in Wake County and do not fully represent the state in terms of topography, weather, and its walking, running, and cycling

69
populations. The sites selected in Wake County along a greenway corridor, in downtown Raleigh, and leading into NC State’s campus are also not fully representative of the state’s walking, running, and cycling populations.
There are two important considerations related to the representativeness of this study. First, the research team only counted the presence of pedestrians and bicyclists for the purpose of determining the detection accuracy of each tested counting technology. The research team did not consider the demographics of pedestrians and bicyclists such as age, gender, or race/ethnicity. There is inherent challenge and potential bias in collecting data on demographics through observation, whether in-person, through video, or using machine learning/artificial intelligence. There are known and documented biases in observational counts and in machine learning algorithms that annotate people using public spaces. For example, black and female faces were found to be systematically misidentified when machine learning algorithms were applied in the face detection systems used in law enforcement since the algorithms’ training datasets contained predominately white and male faces (Clare et al., 2012). However, if demographics are not captured in any way, no information are available to effectively measure the diversity, equity, and inclusion of pedestrian and bicycle infrastructure across the state of North Carolina. Future efforts can address this gap in information by including demographic data, ideally observations supported by self-reported measures such as surveys and interviews. The work presented here acknowledges this bias, and the research team encourages NCDOT to consider this bias when contracting with future vendors.
Second, for NCDOT and its Integrated Mobility Division to be truly integrated, the organization should ensure that its counting initiatives incorporate infrastructure and streets in low-income neighborhoods, as well as in neighborhoods with majority residents of color. This is essential since low-income communities and communities of color face higher injury and death rates from pedestrian and cyclist collisions (Smart Growth America, 2021; League of American Bicyclists, 2014). In the end, no data or project can be inclusive of all North Carolinians cycling and walking if all North Carolinians are not represented in the methods and data collected.*
Future Research
Collecting accurate volume data that represents pedestrians and bicyclists in all North Carolina communities and facilitates investment in a more connected and equitable transportation system is an imperative for NCDOT. While this research helps to determine the most appropriate technology for capturing count data, improvements in data collection implementation and data integration for equitable project prioritization requires further research. FHWA outlines guidance for more equitable planning and the evaluation of potential environmental justice issues in transportation projects (Sandt et al., 2016; FHWA, 2015). However, limited research currently exists that focuses on community-based interventions for addressing race, ethnic, and socioeconomic status-specific barriers to walking and bicycling (Dilley et al., 2019). Future research should analyze improvements to current pedestrian and bicycle data collection efforts to best capture the non-motorized travel
*See Agyeman, 2021 for additional discussion.

70
priorities and behaviors of low-income communities, communities of color, rural communities, and limited-English proficiency communities. Future research may include:
• Review of current site selection practices to evaluate the spatial distribution of permanent, continuous (long-term) counting locations in target communities.
• Investigation of national and international policies for pedestrian and bicycle data collection, including methodologies that capture communities underrepresented in current data collection efforts.
• Evaluation of potential biases in existing or proposed data-driven project prioritization processes.
• Synthesis of best practices in leveraging pedestrian and bicycle volume data to support non-motorized access to essential services, such as housing, employment, healthcare, and education.

71
References
1. National Bicycle and Pedestrian Documentation Project. Alta Planning and Design, Institute for Transportation Engineers, Pedestrian and Bicycle Council. http://bikepeddocumentation.org/. Accessed Jan. 21, 2020.
2. Pedestrian and Bicycle Data Collection. U.S. Department of Transportation, Federal Highway Administration. https://www.fhwa.dot.gov/policyinformation/travel_monitoring/pubs/pedbikedata_appa.cfm. Accessed Jan. 21, 2020.
3. Griffin, G., Nordback, K., Götschi, T., Stolz, E., & Kothuri, S. (2014). Monitoring Bicyclist and Pedestrian Travel and Behavior: Current Research and Practice. http://onlinepubs.trb.org/onlinepubs/circulars/ec183.pdf.
4. Baas, J., Galton, R., & Biton, A. FHWA Bicycle-Pedestrian Count Technology Pilot Project – Summary Report. Publication FHWA-HEP-17-012. FWHA, U.S. Department of Transportation, 2016.
5. Nordback, K., Kothuri, S., Petritsch, T., McLeod, P., Rose, E., & Twaddell, H. Exploring Pedestrian Counting Procedures. Publication FHWA-HPL-16-026. FWHA, U.S. Department of Transportation, 2016.
6. Traffic Monitoring Guide. FHWA-PL-17-003. FHWA U.S. Department of Transportation. https://www.fhwa.dot.gov/policyinformation/tmguide/tmg_fhwa_pl_17_003.pdf. Accessed Jan. 21, 2020.
7. Ryus, P., Ferguson E., Lausten, K.M., Schneider, R.J., Proulx, F.R., Hull T., & Miranda-Moreno, L. NCHRP Report 797: Guidebook on Pedestrian and Bicycle Volume Data Collection. Transportation Research Board of the National Academies, Washington, D.C., 2014. https://doi.org/10.17226/23429.
8. Ryus, P., Ferguson E., Lausten, K.M., Schneider, R.J., Proulx, F.R., Hull T., & Miranda-Moreno, L. Methods and Technologies for Pedestrian and Bicycle Volume Data Collection. NCHRP Web-Only Document 205. Transportation Research Board of the National Academies, Washington, D.C., 2014. https://doi.org/10.17226/23429.
9. Ryus, P., Butsick, A., Proulx, F.R., Schneider, R.J., & Hull T. Methods and Technologies for Pedestrian and Bicycle Volume Data Collection: Phase 2. NCHRP Web-Only Document 229. Transportation Research Board of the National Academies, Washington, D.C., 2016. https://doi.org/10.17226/24732.
10. Nordback, K., & Janson, B N. (2010). Automated Bicycle Counts: Lessons from Boulder, Colorado. Transportation Research Record. 2190(1):11-18. https://doi.org/10.3141/2190-02
11. Nordback, K., Piatkowski, D., Janson, B., Marshall, W.E., Krizek, K. & Main, D. (2011). Using inductive loops to count bicycles in mixed traffic. Journal of Transportation of the Institute of Transportation Engineers. 2. 39-56.
12. Nordback, K., Kothuri, S., Phillips, T., Gorecki, C., & Figliozzi, M. (2016). Accuracy of Bicycle Counting with Pneumatic Tubes in Oregon. Transportation Research Record. 2593(1):8-17.
13. Johnstone, D., Nordback, K., & Lowry, M. Collecting Network-wide Bicycle and Pedestrian Data: A Guidebook for When and Where to Count. Publication WA-RD 875.1. Washington State Department of Transportation, 2017.

72
14. Hipp, J.A., Adlakha, D., Eyler, A.A., Chang, B. & Pless, R. 2013. Emerging Technologies: Webcams and Crowd-Sourcing to Identify Active Transportation. American Journal of Preventive Medicine, 44: 96-97. https://www.ncbi.nlm.nih.gov/pubmed/23253658
15. Hipp, J.A., Manteiga, A., Burgess, A., Stylianou, A., & Pless, R. 2015. Cameras and crowds in transportation tracking. In Proceedings of the Conference on Wireless Health, 1-8. Bethesda, Maryland: ACM. https://www.semanticscholar.org/paper/Cameras-and-crowds-in-transportation-tracking-Hipp-Manteiga/2345c0f34de241a6df708964e46ffa63c805c7b3
16. Hipp, J.A., Adlakha, D., Eyler, Gernes, R., Kargol, A., Stylianou, A., & Pless, R. 2017. Learning from Outdoor Webcams: Surveillance of Physical Activity Across Environments. In Piyushimita Thakuriah, Nebiyou Tilahun and Moira Zellner (eds.), Seeing Cities Through Big Data: Research, Methods and Applications in Urban Informatics (Springer International Publishing: Cham). https://link.springer.com/chapter/10.1007/978-3-319-40902-3_26
17. Miller, A.B., Leung, Y.F. & Kays, R. 2017. Coupling visitor and wildlife monitoring in protected areas using camera traps. Journal of Outdoor Recreation and Tourism, 17: 44-53. https://www.sciencedirect.com/science/article/pii/S2213078016300512
18. Carlson, J.A., Hipp, J.A., Kerr, J., Horowitz, T.S., & Berrigan, D. 2018. Unique Views on Obesity-Related Behaviors and Environments: Research Using Still and Video Images. Journal for the Measurement of Physical Behaviour, 1: 143-54. https://www.ncbi.nlm.nih.gov/pubmed/31263802
19. Petrasova, A., Hipp, J.A., & Mitasova, H. 2019. Visualization of Pedestrian Density Dynamics Using Data Extracted from Public Webcams. ISPRS International Journal of Geo-Information, 8: 559. https://www.mdpi.com/2220-9964/8/12/559
20. Bonanno, J. Innovative Ways to Count Pedestrians and Bicyclists. New Jersey Bicycle and Pedestrian Resource Center. http://njbikeped.org/innovative-ways-count-pedestrians-bicyclists/. Accessed Jan. 21, 2020.
21. Louch, H., David, B., Voros, K., O’Toole, K., & Piper, S. Innovation in Bicycle and Pedestrian Counts: A Review of Emerging Technology. Alta Planning and Design. https://altaplanning.com/wp-content/uploads/Innovative-Ped-and-Bike-Counts-White-Paper-Alta.pdf. Accessed Jan. 21, 2020.
22. Nordback, K., O’Brien, S., & Blank, K. (October 2018). Bicycle and Pedestrian Count Programs: Summary of Practice and Key Resources. Pedestrian and Bicycle Information Center. Chapel Hill, NC.
23. Ohlms, P.B., Dougald, L.E., & MacKnight, H.E. (2019). Bicycle and Pedestrian Count Programs: Scan of Current U.S. Practice. Transportation Research Record. 2673(3):74-85. https://doi.org/10.1177/0361198119834924
24. Bicyclist and Pedestrian Count Strategy Plan. Arizona Department of Transportation. http://www.azbikeped.org/downloads/Bicyclist-and-Pedestrian-Count-Strategy-Plan.pdf. Accessed Oct. 11, 2020.
25. Appendix B: Pedestrian and Bicycle Volume Data Collection Toolkit. Colorado Department of Transportation. https://www.codot.gov/programs/bikeped/documents/nmm_toolkit.pdf. Accessed Jan. 21, 2020.
26. Non-Motorized Monitoring Program Evaluation and Implementation Plan. Colorado Department of Transportation. https://www.codot.gov/programs/bikeped/documents/2016-10-21-cdot-nonmotorized-monitoring-plan_low-res.pdf. Accessed Jan. 21, 2020.

73
27. Bicycle and Pedestrian Count Program Guide. Delaware Department of Transportation. https://deldot.gov/Publications/plans/bikeandped/pdfs/DelDOT_Count_Program_Guide.pdf. Accessed Jan. 21, 2020.
28. Statewide Non-Motorized Traffic Monitoring Program. Florida Department of Transportation, Marlin Engineering. https://www.fdot.gov/statistics/trafficdata/florida-non-motorized-traffic-monitoring. Accessed Jan. 21, 2020.
29. Toolbox for Bicyclists and Pedestrian Counts. Idaho Department of Transportation. https://itd.idaho.gov/wp-content/Bike/FINALContentBikePedToolbox.pdf. Accessed Oct. 11, 2020.
30. Pedestrian and Bicycle Count Data Collection and Use: A Guide for Louisiana. LTRC Project 16-4Sa: Pedestrians and Bicyclists Count: Developing a Statewide Multimodal Count Program. Louisiana Department of Transportation & Development, 2019. https://www.ltrc.lsu.edu/pdf/2019/Appendix%20D.pdf. Accessed Oct. 11, 2020.
31. Pedestrians and Bicyclist Count: Developing a Statewide Multimodal Count Program. Final Report 599. LTRC Project 16-4Sa: Pedestrians and Bicyclists Count: Developing a Statewide Multimodal Count Program. Louisiana Department of Transportation & Development, 2019. https://www.ltrc.lsu.edu/pdf/2019/FR_599.pdf. Accessed Oct. 11, 2020.
32. Non-Motorized Data Collection and Monitoring: Program Guide and Implementation Plan. Michigan Department of Transportation. https://www.michigan.gov/documents/mdot/Non_Motorized_Data_Collection_and_Monitoring_Report_681956_7.pdf. Accessed Oct. 11, 2020.
33. Lindsey, G., Hankey, S., Wang, X., & Chen, J. The Minnesota Bicycle and Pedestrian Counting Initiative: Methodologies for Non-motorized Traffic Monitoring. Publication MN/RC 2013-24. Minnesota Department of Transportation, 2013.
34. Minge, E., Falero, C., Lindsey, G., Petesch, M., & Vorvick, T. Bicycle and Pedestrian Data Collection Manual. Publication MN/RC 2017-03. Minnesota Department of Transportation, 2017.
35. Jackson, K.N., Stolz, E., & Cunningham, C. (2015). Nonmotorized Site Selection Methods for Continuous and Short-Duration Volume Counting. Transportation Research Record. 2527(1):49-57.
36. Jackson, K.N., O’Brien, S.W., Searcy, S.E., Warchol, S.E. (2017). Quality Assurance and Quality Control Processes for a Large-Scale Bicycle and Pedestrian Volume Data Program. Transportation Research Record. 2644(1):19-29.
37. Counting Program Master Plan. New Hampshire Bicycle and Pedestrian Transportation Advisory Committee. https://www.nh.gov/dot/programs/bikeped/documents/BPTAC_CountingMasterPlan_FINAL_NOSTRAVA.pdf. Accessed Oct. 11, 2020.
38. Kothuri, S., Nordback, K., Schrope, A., Phillips, T., Figliozzi, M. (2017). Bicycle and Pedestrian Counts at Signalized Intersections Using Existing Infrastructure: Opportunities and Challenges. Transportation Research Record. 2644(1):11-18.
39. Turner, S., Benz, R., Hudson, J., Griffin, G., Lasley, P., Dadashova, B., & Das, S. Improving the Amount and Availability of Pedestrian and Bicyclist Count Data in Texas. Technical Report 0-6927-R1. Texas A&M Transportation Institute, 2019.
40. Burbridge, S. Developing A Rubric and Best Practices for Conducting Counts of Non-Motorized Transportation Users. Publication UT-16.02. Utah Department of Transportation Research Division, 2016.

74
41. Sentoff, K. & Sullivan, J. Vermont Bicycle and Pedestrian Counting Program. TRC Report 17-006. University of Vermont Transportation Research Center, 2017.
42. Ohlms, P., Dougald, L.E., & MacKnight, H.E. Assessing the Feasibility of a Pedestrian and Bicycle Count Program in Virginia. Publication FHWA/VRTC 19-R4. Virginia Department of Transportation, 2018.
43. Beitel, D., McNee, S., McLaughlin, F., & Miranda-Moreno, L.F. (2018). Automated Validation and Interpolation of Long-Duration Bicycle Counting Data. Transportation Research Record. 2672(43):75-86.
44. Lu, T., Buehler, R., Mondschein, A., & Hankey, S. (2017). Designing a bicycle and pedestrian traffic monitoring program to estimate annual average daily traffic in a small rural college town. Transportation Research Part D: Transport and Environment. 53:193-204.
45. Nordback, K., Johnstone, D., & Kothuri, S. Optimizing Short Duration Bicycle and Pedestrian Counting in Washington State. Publication WA-RD 875.2. Washington State Department of Transportation, 2017.
46. Bicycle and Pedestrian Count Portal. Washington State Department of Transportation. https://www.wsdot.wa.gov/data/tools/bikepedcounts/. Accessed Jan. 21, 2020.
47. About Arlington’s Automatic Counters. Bike Arlington. http://counters.bikearlington.com/about-arlington-s-automatic-counters/. Accessed Jan. 21, 2020.
48. Counter Dashboard Disclaimer. Bike Arlington. http://counters.bikearlington.com/counter-dashboard-disclaimer/. Accessed Jan. 21, 2020.
49. 2015 Los Angeles Bike and Pedestrian Count. Los Angeles County Bicycle Coalition. https://drive.google.com/file/d/0B_tLDDuD3nn-YW1md0taWHZWTVU/view. Accessed Jan. 21, 2020.
50. DVRPC Travel Monitoring Pedestrian and Bicycle Counts. Delaware Valley Regional Planning Commission. https://www.dvrpc.org/webmaps/pedbikecounts/. Accessed Jan. 21, 2020.
51. San Diego Regional Bike and Pedestrian Counters. SANDAG, San Diego State University, County of San Diego Health and Human Services Agency. https://www.sandag.org/index.asp?classid=34&projectid=496&fuseaction=projects.detail. Accessed Jan. 21, 2020.
52. Ryan, S. & Saitowitz, S. Designing and Implementing a Regional Active Transportation Monitoring Program through a County- MPO-University Collaboration. Presented at the 2013 Active Living Research Annual Conference.
53. Conducting Bicycle and Pedestrian Counts A Manual for Jurisdictions in Los Angeles County and Beyond. Kittelson & Associates, Inc., Ryan Snyder Associates, Los Angeles County Bicycle Coalition. https://www.pdx.edu/ibpi/sites/www.pdx.edu.ibpi/files/BikeCountTrainingManual.pdf. Accessed Jan. 21, 2020.
54. Bicycle and Pedestrian Counts. Metroplan Orlando. https://metroplanorlando.org/wp-content/uploads/metroplan-ped-bike-count-report-2016.pdf. Accessed Jan. 21, 2020.
55. Bicycle and Pedestrian Count Program 2016 Annual Report. City of Orlando Transportation Planning. http://www.cityoforlando.net/greenworks/wp-content/uploads/sites/30/2017/03/BikeandPed2016_AnnualReport_WEB.pdf. Accessed Jan. 21, 2020.
56. Portland Bicycle Count Report 2013-2014. Portland Bureau of Transportation. https://www.portlandoregon.gov/transportation/article/545858. Accessed Jan. 21, 2020.

75
57. Seattle Bicycle Master Plan: 2019-2024 Implementation Plan. Seattle Department of Transportation. https://www.seattle.gov/Documents/Departments/SDOT/About/DocumentLibrary/BicycleMasterPlan/190613_BMP_Imp_Plan_FINAL.pdf. Accessed Jan. 21, 2020.
58. Lawrence, I.L. (1989). A Concordance Correlation Coefficient to Evaluate Reproducibility. Biometrics, 45(1), 255-268.
59. Klare, B., Burge, M., Klontz, J., Vorder Bruegge, R., & Jain, A. (2012). Face recognition performance: Role of demographic information. IEEE Transactions on Information Forensics and Security, 7(6):1789–1801.
60. Dangerous by Design 2021. Smart Growth America. https://smartgrowthamerica.org/wp-content/uploads/2021/03/Dangerous-By-Design-2021.pdf. Accessed Mar. 22, 2021.
61. The New Majority: Pedaling Towards Equity. League of American Bicyclists. https://bikeleague.org/sites/default/files/equity_report.pdf. Accessed Mar. 22, 2021.
62. Agyeman, J. Poor and black ‘invisible cyclists’ need to be part of the post-pandemic transport planning too. (2021). The Conversation (online). https://theconversation.com/poor-and-black-invisible-cyclists-need-to-be-part-of-post-pandemic-transport-planning-too-139145. Accessed Mar. 8, 2021.
63. Sandt, L., Combs, T., & Cohn, J. (2016). Pursuing Equity in Pedestrian and Bicycle Planning. 64. Environmental Justice Reference Guide. Federal Highway Administration Office of Planning,
Environment, and Realty. (2015). 65. Dilley, J.R., Moore, J.B., Summers, P., Price, A.A., Burczyk, M., Byrd, L., & Bertoni, A.G. (2019). A
citizen science approach to determine physical activity patterns and demographics of greenway users in Winston-Salem, North Carolina. International Journal of Environmental Research and Public Health, 16(17), 3150.

76
Appendix A. Equipment Attribute Scoring Form
NCDOT RP 2020-39: State-of-the-Art Approaches to Bicycle and Pedestrian Counters
April 21, 2020 The purpose of this form is to obtain your opinion on the relative importance of various attributes of candidate technologies/equipment that we consider for the field tests of pedestrian and bicycle counting devices. Your input will help us optimize the list of equipment that will be used in the field tests. Please rate the relative importance of each equipment attribute by providing a number between 0 to 10 in the table below. A relative weight of zero indicates that the attribute is not relevant and should not be considered in selecting the equipment. A relative weight of 10 indicates the highest level of relative significance, while a relative weight of 1 indicates the lowest level of significance. It is possible to assign the same weight to multiple attributes, which would indicate that they have equal importance. Please enter your input in the column identified as “relative weight” (yellow column). Thank you.
Equipment Attribute Relative
Weight
(0 to 10)
Rating for each attribute (1 to 5)
1 representing the least favorable attribute
5 representing the most favorable attribute
Enter
your
input
below
1 2 3 4 5
Cost (per unit) …. Over $6,000 $3,500 -
$6,000
$2,000 -
$3,500
$800 - $2,000 Less than
$800
Ease of installation …. Requires vendor
installation
Requires
remote
involvement
of the vendor
Average
difficulty
Easy Very easy
Featuring novel
technology/approach
…. Dated technology Technology
likely to
become
obsolete in 5
years
Average
technology
level
Potential for
significant
improvement
Potential for
significant
transformation
Proven track record …. Track record indicating
possible issues
No track
record found
Used by
other
agencies
with
reviews
Used by other
agencies with
neutral
reviews
Used by other
agencies with good
reviews
Routine Maintenance
requirements (calibration,
battery change, sensor cleaning)
…. More than 5 times per
year
3 - 5 times
per year
Twice per
year
Annual site
visits
involving
minor work
No site visits or
once every 2 or
more years
Non-routine maintenance
requirements (frequency of
malfunction, vandalism,
physical damage)
…. More than 5 times per
year
3 - 5 times
per year
Twice per
year
Annual site
visits
involving
minor work
No site visits or
once every 2 or
more years

77
Availability of technical/field
support
…. Not available Available
Ease of data
transmission/transport (from
device to users)
…. Onsite wired data
extraction
On-site
wireless
data
extraction
Data transmission
over the Internet
Estimated data accuracy …. Accuracy unpredictable Acceptable Extremely accurate
Additional fee requirements for
data
storage/transport/transmission
…. More than $120 per
month
$60 - $120
per month
$20 - $60
per month
$20 or less per
month
Free
Ability to collect behavioral data
(e.g., risky traffic incidents,
travel/movement patterns,
collisions)
…. Count data without
object
differentiation/filtering
Count data
for single
category
Count and
collect
category
data
Count, speed,
direction,
category data
Rich data set
including behavioral
Success of equipment in
different facility contexts
(intersection or corridor; shared
use path, sidewalk, bike lane; or
shared lane/mixed traffic)
…. Not supported Different contexts
supported
Geographic context/environment
impacts
…. Somewhat vulnerable Not vulnerable
Weather conditions
(humidity/snow/ice/rain/heat)
…. Unpredictable
operability under
variable weather
Ability to
withstand
normal
variations
in weather
Ability to operate
under extreme
weather
Durability and placement …. Unpredictable durability Average
durability
Extremely durable
Ability to collect multiple vs.
single modes
…. Single mode supported Multiple modes
supported
Software and data
interpretability
…. Not supported Average High
interoperability
Access and availability of data …. Not accessible or
available
Available
Data storage services …. Not provided Provided
Flexibility to aggregate data
from multiple technology types
and vendors especially if
deployed at the same counting
location
…. Not supported Supported
Your name and organization: Please provide your comments and/or questions below:

78
Appendix B. Cost Summary for Tested Technologies
Table 44. Cost Summary for Tested Technologies
Technology Type/Vendor Item Price
Video/Image Processing
Eco-Counter CITIX 3D (depth camera)
CITIX 3D Sensor - Large Width - User Classification - With Direction
$0 [demo unit; list price $9,900]
Power Supply Cable for CITIX 3D - Price Per Meter $0 [demo unit; list price $7]
RJ45 Ethernet Cable for CITIX 3D - Price Per Meter $0 [demo unit; list price $6]
Eco-Visio Professional Account, Automatic Data Transmission, & Eco-Alert Service (1 year)
$0 [demo unit; list price $420]
Miovision Scout (standard video with algorithm processing)
Miovision Scout Demo Unit with Datalink Subscription
$0 [demo unit; list price $5,000]
Crosswalk Data (1 hour) - Video Data Processing $2.00 x 71.98 hours =
$143.96
Intersection Count 24+ Hour Study with Premium Class (1 hour) - Video Data Processing
$18.00 x 71.99 hours = $1,295.82
Passive IR TRAFx Infrared Trail Counter
TRAFx System Package with DataNet Plan (includes one counter, dock with field case, software, cables, manuals, and 5-year premium tech support)
$1,077
Security Box Supplies (electrical disconnect box, wire mesh, and hose clamp)
$20
Piezoelectric MetroCount RidePod BP
MetroCount RidePod BP 5920 $1,545
MetroCount Cabinet $950
MetroCount FieldPos RAS Access with MCRAM $648
MSI BL Sensor x 2 $1,090
PU200 Piezo Resin x 2 $188
Pneumatic Tube MetroCount RidePod BT
RidePod BT 5926 Demo Unit $0 [demo unit; list price
$1,345]
RidePod BT Field Kit (Tube Install Kit) $195
Electromagnetic Loop with Passive IR
Eco-Counter MULTI
Eco MULTI $0 [existing installation; list
price $6,580]
Wooden Post $0 [existing installation; list
price $198]
15-Min Interval Data Recording $0 [existing installation; list
price $220]
Rainbird $0 [existing installation; list
price $88]
Eco-Visio Professional Account, Automatic Data Transmission, & Eco-Alert Service (1 year)
$0 [existing installation; list price $420]

79
Appendix C. Video Reduction Protocol and Site Diagrams
Figure 14. Validation Video Example – Reedy Creek Greenway to the west of the I-440 pedestrian bridge (Raleigh, NC)
Figure 15. Validation Video Example – Hargett Street at Person Street (Raleigh, NC)
E

80
Figure 16. Validation Video Example – Centennial Parkway at Oval Drive (Raleigh, NC)
Bicycles Pedestrians

81
Appendix D. Equipment Installation and Software Use Questionnaires and Summary
Table 45. Equipment Installation Questionnaires and Summary
Product Technical
Skills Installation
Time Additional Equipment Documentation
Alteration of Existing Infrastructure
Personal Safety Notable Challenges
Miovision Scout
Low 1 hour
→ Cordless Drill
→ Cable Lock & Padlock
→ Screwdriver
Sufficient None No Safety Impacts
Minor challenge correctly positioning camera.
TRAFx Infrared Trail Counter
Average 3 hours
→ Eaton Electrical Disconnect Box; Part #: DPF222RP
→ ¼” Wire Mesh
→ Cable Lock & Padlock
→ ½” Plywood Spacer
→ 2 Part Epoxy Adhesive
→ Metal Hose Clamps
→ Metal T Post (optional)
→ Hand Tools (hammer, drill, metal screws, cable ties)
Highly Sufficient
None No Safety Impacts
The counting system was mounted inside the electrical disconnect box prior to visiting site; majority of installation time was fabricating the counter housing from the electrical disconnect box and fastening the counter system inside the box prior to the field visit.
MetroCount RidePod BP 5920 – Piezoelectric Sensor
High 3 days
→ Gas Powered Concrete Saw
→ Gas Powered Leaf Blower
→ Cordless Drill and Mixing Attachment
→ Shovels
→ Hand Tools (putty knife, heavy duty tape, PVC pipe)
Insufficient
→ Asphalt cuts
→ Holes dug for box containing pedestrian sensor
→ Slight bump in asphalt caused by sealant
Minor Safety Impacts
→ Saw safety
→ Traffic at the site
Major challenges due to the high degree of precision required in installation; recommended saw not available in the United States; sealant cured very quickly; specified amount of sealant was insufficient to complete installation.
Eco-Counter CITIX 3D
High 5 hours
→ Commercial Bucket Truck
→ Signal/Camera Mounting Bracket
→ Laptop
Sufficient
→ Wiring into suitable power source
→ Mounting to signal structure
Medium Safety Impacts
→ Commercial bucket truck safety
Site selection for the installation dependent on the location of an available power source and count specifications; technical support from the vendor during installation was excellent for addressing challenges.

82
Table 46. Software Use Questionnaires and Summary
Software Product
Technical Skills
Training Recommended
Documentation User Friendly On-the-Fly Analyses
Capabilities
Analyses Available in Software
Additional Comments
Miovision DataLink
Low No None Yes No
→ Traffic Counts by Class
→ Traffic Counts by Movement
→ Intersection Volumes
→ Peak Hour Factor
Succinctly displays detailed multimodal traffic volumes and turning movements; additional analyses performed by user in Microsoft Excel.
TRAFx Datanet Low No Sufficient Yes No
→ Daily/Weekly/Monthly/All Counts
→ Hourly, Day of Week, Week of Year Average Volumes
→ ADT
Very simple and user-friendly with useful additional capabilities; ability to “exclude" blocks of data from analyses; additional analyses performed by user in Microsoft Excel.
MetroCount Executive
High Yes Insufficient No Yes
→ Traffic Counts by Class
→ Traffic Counts by Speed
→ Speed Statistics
→ Rolling Day Totals
→ Custom List Reports
Difficult to use; outdated user interface; very detailed timestamped data are available.
Eco-Counter Eco-Visio
Low Yes Sufficient Yes Yes
→ Time Series
→ Comparison
→ Average, Median, and Peak Daily Volume
→ Weather
→ Hourly, Day of Week, Week of Year Average Volumes
→ Distribution
Detailed trace data and trajectory data collected by CITIX 3D is not available; only bidirectional binned volume data are available; most extensive on-the-fly analyses and visualizations of available software.