state of oklahoma incentive evaluation commissioniec.ok.gov/sites/g/files/gmc216/f/capital gains...
TRANSCRIPT

State of Oklahoma Incentive Evaluation Commission Capital Gains Deduction September 29, 2017
PFM Group Consulting LLC BNY Mellon Center 1735 Market Street 43rd Floor Philadelphia, PA 19103

Capital Gains Deduction 2
Contents Executive Summary ......................................................................................................................... 3
Key Findings and Recommendations .................................................................................................. 6
Introduction....................................................................................................................................10
Administration and Use of the Incentive..............................................................................................13
Fiscal and Economic Impact .............................................................................................................16
Incentive Benchmarking...................................................................................................................21
Appendices....................................................................................................................................24

Capital Gains Deduction 3
Executive Summary

Capital Gains Deduction 4
Overview Oklahoma’s capital gain deduction became effective January 1, 2005 for personal income and January 1, 2006 for corporate income. It allows certain gains from the sale of Oklahoma capital to be fully deductible from state taxable income. The sale of Oklahoma-based real or tangible property, or stock or ownership interest in an Oklahoma-based business entity is eligible to be deducted from State income tax. Real or tangible property must be owned for at least five years prior to the sale. Stock or ownership interest must be in a business entity that has had a primary headquarters in Oklahoma for at least three years prior to the sale and must be owned for at least three years prior to the sale. The deduction may be interpreted as encouraging capital investment in the State. The argument would be that eliminating the tax on qualified capital gains makes investments more profitable, and this higher reward leads to greater capital investment. As a result, with more capital investment, there is a greater likelihood of additional job creation and innovation. The incentive overall cannot, with the data available, be credibly shown to have significant economic impact or a positive return on investment for the State. Recommendation: Repeal Key Findings The program has been a significant net cost to the State. From 2010 to 2014, the program is
estimated to have reduced State tax revenue by $474 million, while creating an estimated $9 million in additional tax revenue. This results in a net cost to the State of $465 million.
Figure 1: Estimated Net Fiscal Impact, 2010 to 2014
After an initial spike in the second year, deduction claims have decreased. After the first year of the program, the number of returns claiming the deduction showed a sharp increase from 10,828 in 2005 to 18,379 in 2006, which remains the highest annual number of claims in the deduction’s history. Throughout the life of the program, total deduction amounts have varied widely with no consistent growth trend.
-$76 -$69
-$147
-$74-$100
-$465-$500
-$450
-$400
-$350
-$300
-$250
-$200
-$150
-$100
-$50
$0
2010 2011 2012 2013 2014 Total
Mill
ions

Capital Gains Deduction 5
Individuals reporting $200,000 or more in income account for the majority of deductions. A review of the distribution of total deductions by income level shows individuals reporting income of $200,000 or more benefit most from the program. Over the life of the program, an average of 85.8 percent of the total deduction amount was made by individuals with income equal to or more than $200,000.
Recommended Changes If the program does remain in place, the project team recommends the following improvements to enhance the program and its future evaluations: Recommendation 1: Target the incentive to a specific industry. Six of the states chosen for
benchmarking have similar incentives with a specific focus. For example, Virginia’s deduction is for small technology firms based in the State. Virginia’s deduction is an example of an incentive with a clear, narrowly focused goal. This makes determining the success of the program easier, and reduces the cost of the program.
Recommendation 2: Require gains to be re-invested in Oklahoma. The deduction does not currently impose any requirements as to how the gains exempted from tax are used. There is no guarantee that the extra income taxpayers receive as a result of the deduction is re-invested or spent within the State. However, a comparable state program offers a solution to this. Utah’s deduction requires that at least 70 percent or more of the proceeds of the capital gain transaction be used to purchase qualifying stock in Utah small business corporations. Adding a similar requirement that aligns with a development goal of the State may be a good option to ensure better return to the State and improve the focus on the incentive.
Recommendation 3: Improve data aggregation. The Oklahoma Tax Commission (OTC) already
collects useful information on Form 561, but this information needs to be easily aggregated for future evaluation. Data that would improve future evaluation include the type of capital (real property or stock/ownership interest), the industry associated with any corporate claims, and the holding period of the capital.

Capital Gains Deduction 6
Key Findings and Recommendations

Capital Gains Deduction 7
Recommendation: Repeal The goal of the capital gains tax deduction is likely to stimulate capital investment in the State in an effort to create economic growth and job creation. Unfortunately, there is little evidence to show that the incentive has met this goal. Instead, it appears the incentive has been a net cost to the State. Due to the lack of data to support the effectiveness of the incentive, the project team recommends repealing the incentive. Given the size of the deduction (foregone revenue of over $100 million a year on average), it is concerning that so little hard data can be gathered and analyzed to determine the value of the deduction in terms of economic activity in the State. Given the amount of time and effort required to qualify for other large dollar incentives (such as the Quality Jobs Program), there should be a correspondingly high bar set for this deduction, considering the amount of foregone state revenue involved. It is also notable that there are a large number of deductions that are most likely relatively small sales of qualified stocks or other assets where it is hard to make a compelling case that the deduction spurs capital investment or other economic activity in the State. Key Findings The program has been a significant net cost to the State. From 2010 to 2014, the program is
estimated to have cost the State $474 million in foregone tax revenue, while creating only an estimated $9 million in additional tax revenue. This results in a net cost to the State of $465 million. While it is likely that some economic activity is not captured in these estimates, the data is not sufficient to further develop this estimate.
After an initial spike in the second year, deduction claims have decreased. After the first year of
the program, the number of returns claiming the deduction showed a sharp increase from 10,828 in 2005 to 18,379 in 2006, which remains the highest annual number of claims in the deduction’s history. Throughout the life of the program, total deduction amounts have varied widely with no consistent growth trend.
Figure 2: Deduction Claims, 2005 to 2014
Source: Oklahoma Tax Commission While the legislation creating the deduction is silent, a logical goal of the program would be to increase investment in Oklahoma capital. Viewing claims for the Oklahoma deduction as a percent of overall tax returns by Oklahoma residents reporting capital gains may be helpful in determining whether the program has
18,37917,274
$0.0
$0.5
$1.0
$1.5
$2.0
$2.5
$3.0
$3.5
2005 2006 2007 2008 2009 2010 2011 2012 2013 2014
Bill
ions
Total Deduction Number of Claims

Capital Gains Deduction 8
done this. The following chart shows the number of deduction claims as a percentage of Oklahoma income tax returns reporting capital gains:
Figure 3: Deduction Claims as a Percent of Total Oklahoma IRS Income Tax Returns Reporting Capital Gain, 2005 to 2014
Source: Internal Revenue Service Sources of Income Data and Oklahoma Tax Commission
The proportion of capital gain returns claiming the Oklahoma deduction has shown little change since the second year of the program. In general, the program appears to have had little impact on the percentage of Oklahoma residents claiming capital gains as income. As the following chart shows, the percentage of IRS Oklahoma income tax returns reporting capital gains has, in fact, decreased since the program was introduced in 2005.
Figure 4: Percentage of Oklahoma Federal Income Tax Returns Reporting Capital Gains, 1997 to 2014
Source: Internal Revenue Service Sources of Income Data Individuals reporting $200,000 or more in income account for the majority of deductions. A
review of the distribution of total deductions by income level shows individuals reporting income of $200,000 or more benefit most from the program. Over the life of the program, an average of 83.7 percent of the total deduction amount was made by individuals with income of equal to or more than $200,000.
7.9% 8.1%
0.00%1.00%2.00%3.00%4.00%5.00%6.00%7.00%8.00%9.00%
10.00%
2005 2006 2007 2008 2009 2010 2011 2012 2013 2014
17%
13%
0%
5%
10%
15%
1997 1998 1999 2000 2001 2002 2003 2004 2005 2006 2007 2008 2009 2010 2011 2012 2013 2014

Capital Gains Deduction 9
Figure 5: Average Distribution of Total Deduction Amount by Income, 2005 to 2014
Source: Oklahoma Tax Commission
Recommended Changes If the program does remain in place, the project team recommends the following improvements to enhance the program and its future evaluations: Recommendation 1: Target the incentive to a specific industry. Six of the States chosen for
benchmarking have similar incentives that have a specific focus. For example, Virginia’s deduction is for small technology firms based in the state. Virginia’s deduction is an example of an incentive with a clear, narrowly focused goal. This makes determining the success of the program easier, and puts the state at less risk in terms of cost.
Recommendation 2: Require gains to be re-invested in Oklahoma. The deduction does not currently impose any requirements as to how the gains exempted from tax are used. There is no guarantee that the extra income taxpayers receive as a result of the deduction is re-invested or spent within the State. However, a comparable state program offers a solution to this. Utah’s program requires that at least 70 percent or more of the proceeds of the capital gain transaction be used to purchase qualifying stock in a Utah small business corporations. Adding a similar requirement that aligns with a development goal of the State may be a good option to ensure better return to the State and improve the focus on the incentive.
Recommendation 3: Improve data aggregation. The Oklahoma Tax Commission (OTC) already
collects useful information on Form 561, but this information needs to be easily aggregated for future evaluation. Data that would improve future evaluation include the type of capital (real property or stock/ownership interest), the industry associated with any corporate claims, and the holding period of the capital.
Less than $200,000
16.3%
$200,000 or more83.7%

Capital Gains Deduction 10
Introduction

Capital Gains Deduction 11
Overview In 2015, HB2182 established the Oklahoma Incentive Evaluation Commission (the Commission). It requires the Commission to conduct evaluations of all qualified state incentives over a four-year timeframe. The law also provides that criteria specific to each incentive be used for the evaluation. The first set of 11 evaluations was conducted in 2016. The Capital Gains Deduction is one of 12 incentives scheduled for review by the Commission in 2017. Based on this evaluation and their collective judgement, the Commission will make recommendations to the Governor and the State Legislature related to this incentive Background Oklahoma state income tax applies to income derived from the sale of capital. 1 At the federal level, there is a separate tax rate for this type of income. However, at the State of Oklahoma level, capital gains are treated as ordinary income. In Oklahoma, the tax rate that applies to capital gains is the general income tax rate. The highest marginal Oklahoma income tax rate is 5 percent. The tax treatment of capital gains is a regular topic of discussion and debate among policymakers and taxation subject matter experts. There are supporters for federal proposals to lower or raise the capital gains tax rate at the federal level. The debate hinges on whether or not the tax rate on capital gains has a significant impact on economic activity and capital investment. Proponents of lower rates and tax breaks argue that a lower tax rate stimulates investment and economic activity by reducing the cost of realizing gains on capital investment. Conversely, those who call for maintaining or raising the capital gains tax rate argue there is no significant link between the tax rate and economic growth. Over time, federal and state governments have frequently adjusted the rate of taxation on capital gains in an effort to either stimulate economic growth or raise revenue. Incentive Characteristics Oklahoma’s capital gain deduction became effective January 1 2005 for personal income January 1, 2006 for corporate income. It allows certain gains from the sale of Oklahoma capital to be fully deductible from state taxable income. The sale of Oklahoma-based real or tangible property, or stock or ownership interest in an Oklahoma-based business entity is eligible to be deducted from income subject to State tax. Real or tangible property must be owned for at least five years prior to the sale. Stock or ownership interest must be in a business entity that has had a primary headquarters in Oklahoma for at least three years prior to the sale and must be owned for at least three years prior to the sale. The deduction may be interpreted as encouraging capital investment in the State. The argument would be that eliminating the tax on capital gains makes investments more profitable, and this higher reward leads to greater capital investment. As a result, with more capital investment, there is a greater likelihood of additional job creation and innovation. Evaluation Criteria A key factor in evaluating the effectiveness of incentive programs is to determine whether they are meeting the stated goals as established in state statute or legislation. In this case, no specific legislative intent or goals are established in the statute. However, to assist in a determination of program effectiveness, the Incentive Evaluation Commission has adopted the following criteria: Number of qualified realized capital gains;
1 Capital includes real or tangible property and stock or ownership interest in business entities

Capital Gains Deduction 12
Employment/capital/payroll associated with these realized capital gains deductions; Change in the realized capital gains before/after the deduction; Return on investment – economic activity versus financial net cost.
Capital Gains Deduction 13
Administration and Use of the Incentive

Capital Gains Deduction 14
Program Administration The OTC administers the deduction. Taxpayers claiming the deduction submit a form along with other income tax forms. The following summarizes the essential components of this process:
1. Eligibility. The sale of Oklahoma-based real or tangible property, or stock or ownership interest in an Oklahoma-based business entity is eligible to be deducted from State income tax. Real or tangible property must be owned for at least five years prior to the sale. Stock or ownership interest must be in a business entity that has had a primary headquarters in Oklahoma for at least three years prior to the sale and must be owned for at least three years prior to the sale.
2. Deduction Claims. Taxpayers may claim the deduction by completing Tax Form 561. Taxpayers
report qualifying gains by location or address for tangible property or Federal ID number for stock or ownership interests. Information asked for on the form includes acquisition date, sale date, and associated gain.
3. Reporting. Estimates of the cost of the capital gain deduction are reported in the Tax Expenditure report published bi-annually by the OTC. Due to difficulties in aggregating the data associated with corporate tax deductions, estimates are only made for the sum of personal income tax deductions. The OTC does not aggregate information collected on Form 561 such as the holding period of capital, the industry that corporations benefiting from the deduction operate in, or data identifying deduction amounts for real property versus stock or ownership interests.
Use of the Incentive Capital gains are not commonly claimed as individual income by Oklahoma taxpayers. An analysis of IRS income tax return data found that an annual average of 14.1 percent of tax returns from Oklahoma reported capital gains as income from 1997 to 2014. The following chart shows this percentage decline from its high point of 17 percent in 2000 to 13 percent in 2014. Over the same period, an average of 75 percent of the annual gains reported were on returns with total income of $200,000 or more.
Figure 6: Percentage of Oklahoma Federal Income Tax Returns Reporting Capital Gains, 1997 to 2014
Source: Internal Revenue Service Sources of Income Data While there has been significant fluctuation, use of the deduction has been significant since its inception, along with foregone tax revenue associated with its use:
17%
13%
0%
5%
10%
15%
1997 1998 1999 2000 2001 2002 2003 2004 2005 2006 2007 2008 2009 2010 2011 2012 2013 2014
Capital Gains Deduction 15
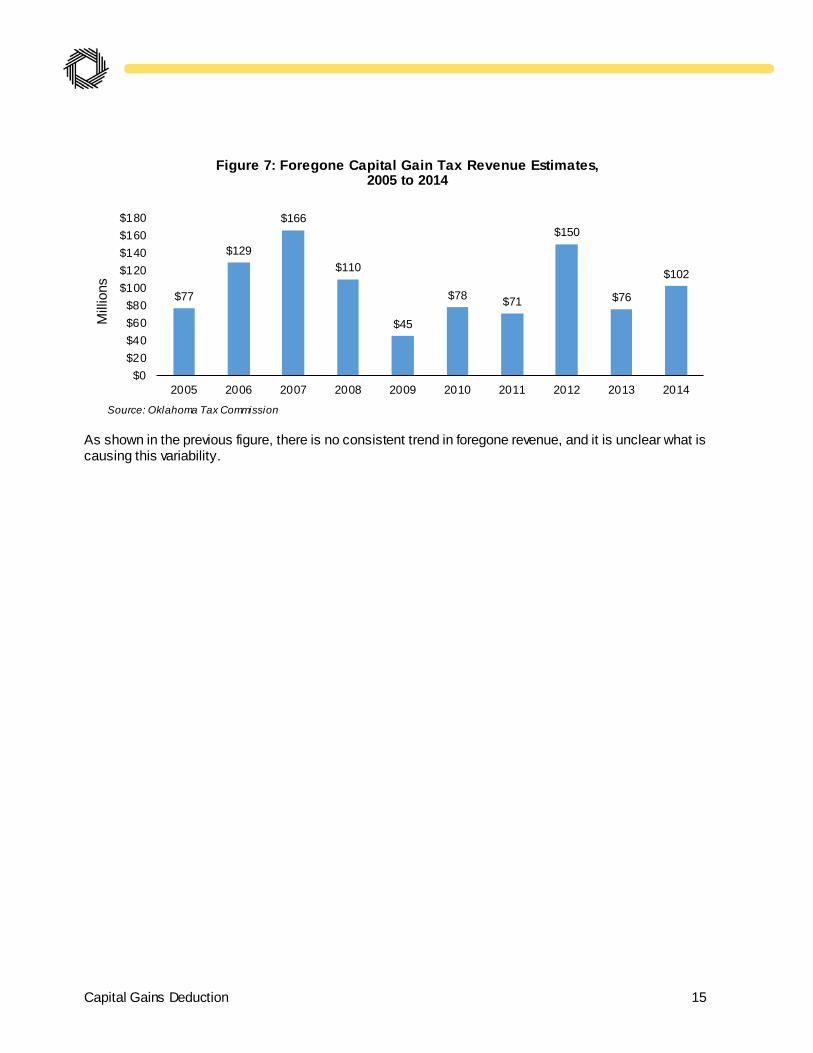
Figure 7: Foregone Capital Gain Tax Revenue Estimates, 2005 to 2014
Source: Oklahoma Tax Commission As shown in the previous figure, there is no consistent trend in foregone revenue, and it is unclear what is causing this variability.
$77
$129
$166
$110
$45
$78 $71
$150
$76
$102
$0$20$40$60$80
$100$120$140$160$180
2005 2006 2007 2008 2009 2010 2011 2012 2013 2014
Mill
ions

Capital Gains Deduction 16
Fiscal and Economic Impact

Capital Gains Deduction 17
Economic Impact Methodology Economists use a number of statistics to describe regional economic activity. Four common measures are Output, which describes total economic activity and is generally equivalent to a firm’s gross sales; Value Added, which equals gross output of an industry or a sector less its intermediate inputs; Labor Income, which corresponds to wages and benefits; and Employment, which refers to jobs that have been created in the local economy. In an input-output analysis of new economic activity, it is useful to distinguish three types of effects: direct, indirect, and induced. Direct effects are production changes associated with the immediate effects or final demand changes. The payment made by an out-of-town visitor to a hotel operator or the taxi fare paid for transportation while in town are examples of direct effects. Indirect effects are production changes in backward-linked industries caused by the changing input needs of directly affected industries – typically, additional purchases to produce additional output. Satisfying the demand for an overnight stay will require the hotel operator to purchase additional cleaning supplies and services. The taxi driver will have to replace the gasoline consumed during the trip from the airport. These downstream purchases affect the economic output of other local merchants. Induced effects are the changes in regional household spending patterns caused by changes in household income generated from the direct and indirect effects. Both the hotel operator and taxi driver experience increased income from the visitor’s stay, as do the cleaning supplies outlet and the gas station proprietor. Induced effects capture the way in which increased income is spent in the local economy. A multiplier reflects the interaction between different sectors of the economy. An output multiplier of 1.4, for example, means that for every $1,000 injected into the economy, all other sectors produce an additional $400 in output. The larger the multiplier, the greater the impact will be in the regional economy.
For this analysis, the project team used the IMPLAN online economic impact model with the dataset for the State of Oklahoma (2014 Model). State of Oklahoma Tax Revenue Estimate Methodology To provide an “order of magnitude” estimate for state tax revenue attributable to the incentive being evaluated, the project team focused on the ratio of state government tax collections to Oklahoma Gross Domestic Product (GDP).2 Two datasets were used to derive the ratio: 1) US Department of Commerce Bureau of Economic
Direct Indirect Induced Total Impact
Figure 8: The Flow of Economic Impacts

Capital Gains Deduction 18
Analysis GDP estimates by state;3 and 2) the Oklahoma Tax Commission’s Annual Report of the Oklahoma Tax Commission reports.4 Over the past 10 years, the state tax revenue as a percent of state GDP was 5.4 percent.
Table 1: State of Oklahoma Tax Revenue as a Percent of State GDP
Year Oklahoma Tax Revenue 5 Oklahoma GDP Ratio
2006-07 $8,685,842,682 $144,171,000,000 6.0% 2007-08 $9,008,981,280 $155,015,000,000 5.8% 2008-09 $8,783,165,581 $143,380,000,000 6.1% 2009-10 $7,774,910,000 $151,318,000,000 5.1% 2010-11 $8,367,871,162 $165,278,000,000 5.1% 2011-12 $8,998,362,975 $173,911,000,000 5.2% 2012-13 $9,175,334,979 $182,447,000,000 5.0% 2013-14 $9,550,183,790 $190,171,000,000 5.0% 2014-15 $9,778,654,182 $180,425,000,000 5.4% 2015-16 $8,963,894,053 $182,937,000,000 4.9% Average $8,908,720,068 $166,905,300,000 5.4%
Source: US Department of Commerce Bureau of Economic Analysis and Oklahoma Tax Commission The value added of an industry, also referred to as gross domestic product (GDP)-by-industry, is the contribution of a private industry or government sector to overall GDP. The components of value added consist of compensation of employees, taxes on production and imports less subsidies, and gross operating surplus. Changes in value added components such as employee compensation have a direct impact on taxes such as income and sales tax. Other tax revenues such as alcoholic beverage and cigarette taxes are also positively correlated to changes in income. Because of the highly correlated relationship between changes in the GDP by industry and most taxes collected by the state, the ratio of government tax collections to Oklahoma GDP forms the evaluation basis of the fiscal implications of different incentive programs offered by the State. The broader the basis of taxation (i.e., income and sales taxes) the stronger the correlation; with certain taxes on specific activity, such as the gross production (severance) tax, there may be some variation in the ratio year-to-year, although these fluctuations tend to smooth out over a period of several years. This ratio approach is somewhat standard practice, and is consistent with what IMPLAN and other economic modeling software programs use to estimate changes in tax revenue. To estimate State of Oklahoma tax revenue generate in a given year, the project team multiplied the total value added figure produced by the IMPLAN model by the corresponding annual ratio (about 5.4 percent). For example, if the total value added was $1,000,000, then the estimated State of Oklahoma tax revenue was $54,000 ($1,000,000 x 5.4 percent).
2 Gross State Product (GSP) is the state counterpart of Gross Domestic Product (GDP) for the nation. To assist the reader, the project team has decided to use GDP throughout this section of the report instead of mixing the two terms. This decision was made because more people are familiar with the term GDP. 3 http://www.bea.gov/regional/ 4 https://www.ok.gov/tax/Forms_&_Publications/Publications/Annual_Reports/index.html 5 Gross collections from state-levied taxes, l icenses and fees, exclusive of city/county sales and use taxes and county lodging taxes.

Capital Gains Deduction 19
Economic Impact There are two primary ways to evaluate the economic and tax revenue impact of this program. One method is to examine in detail the type of investments linked to the capital gains deduction, determine the new economic activity, if any, associated with the investment, and use an economic impact model to determine the statewide impact. However, that analysis is not possible. First, the data collected by the OTC does not allow for this type of analysis, because the tax forms do not require detailed information on the capital gain investment. Second, the capital gains deduction does not necessarily create new jobs. An investment, for example, could be made in an asset such as real estate that has no direct employees yet increases in value. Third, there is insufficient evidence to determine if the possibility of 5 percent capital gains deduction used 5, 10, or 20 years after the initial investment changes any behaviors. Finally, there is no requirement that the tax deduction be reinvested in Oklahoma. The other approach to calculate the economic and tax impact of the capital gains deduction is to assume these gains are treated like ordinary income by the recipient. For example, some of the tax savings an individual claims might be spent in the local economy, while other monies might be reinvested in stocks, bonds, real estate, etc. If the capital gains deduction was eliminated, there should be less money spent each year in the Oklahoma economy. Even though the incentive is not directly related to job creation, ending the program might result in jobs loss. Assuming Oklahoma residents spend a portion of the taxes saved through the capital gains deduction, this generates additional economic activity that has a positive impact on the State. These total expenditures (also referred to as “economic activity”) are not the same as the tax deduction. It is common, but not accurate, in economic impact studies to compare economic activity against the incentives offered. This comparison does not provide any insights into if the public sector is making a net profit or loss on the incentive program. The appropriate IMPLAN Institutional Households Incomes Sectors were used to model the economic impact. The model takes in to account “leakages” in the economy as well as savings. Therefore, the amount saved by residents and businesses from the tax credit is not equal to the direct economic activity used in the econometric model. The following tables depict the statewide annual impact of how spending based on the tax credit ripples through the economy.
Table 2: Economic Impact
Year Output Value Added Labor Income Employment
Estimated Oklahoma Tax
Revenue 2010 Direct Effect $30,017,387 $17,385,072 $9,188,047 244 Indirect Effect $11,675,719 $6,091,627 $3,645,690 79 Induced Effect $9,850,238 $5,398,424 $3,054,247 74 Total Effect $51,543,345 $28,875,122 $15,887,984 396 $1,501,506 2011 Direct Effect $27,641,954 $15,988,525 $8,468,762 224 Indirect Effect $10,768,077 $5,615,921 $3,361,243 72 Induced Effect $9,079,840 $4,976,207 $2,815,370 68 Total Effect $47,489,871 $26,580,653 $14,645,376 364 $1,329,033 2012 Direct Effect $56,970,110 $33,061,865 $17,413,202 464 Indirect Effect $22,106,925 $11,540,884 $6,906,135 149 Induced Effect $18,665,772 $10,229,777 $5,787,666 139 Total Effect $97,742,807 $54,832,526 $30,107,003 752 $2,757,550

Capital Gains Deduction 20
Year Output Value Added Labor Income Employment
Estimated Oklahoma Tax
Revenue 2013 Direct Effect $29,302,754 $16,957,677 $8,976,820 238 Indirect Effect $11,407,469 $5,950,398 $3,561,387 77 Induced Effect $9,623,427 $5,274,118 $2,983,919 72 Total Effect $50,333,650 $28,182,193 $15,522,127 386 $1,521,838 2014 Direct Effect $39,001,144 $22,603,919 $11,938,084 317 Indirect Effect $15,155,479 $7,909,098 $4,733,351 102 Induced Effect $12,795,832 $7,012,753 $3,967,582 96 Total Effect $66,952,455 $37,525,770 $20,639,017 515 $1,838,763
Table 3: Estimated Net Impact
Year Deduction
During Current Tax Year
Estimated State of OK Tax Revenue Net Impact
2010 $77,472,487 $1,501,506 ($75,970,981) 2011 $70,596,404 $1,329,033 ($69,267,372) 2012 $149,438,066 $2,757,550 ($146,680,516) 2013 $75,248,888 $1,521,838 ($73,727,049) 2014 $101,488,168 $1,838,763 ($99,649,405) Total $474,244,014 $8,948,690 ($465,295,323)
As depicted in the tables above, the Capital Gains Deduction does likely result in increased statewide household spending. The level of economic activity varies each year and is directly linked to the amount of the deduction and the IMPLAN model’s assumptions about the savings rate by income levels. Multiplying the total value added figure produced by the IMPLAN model by the corresponding annual tax ratio, provides an estimate for total annual State of Oklahoma tax revenue. Over the past 5 years, the Capital Gains Deduction program (direct + indirect + induced economic effects) has generated approximately $8.9 million in state tax revenue. Over this same period, the state has provided $474.2 million amount in rebates. The ‘But for’ Test for the Value of the Incentive There was insufficient evidence to determine the level of direct new economic activity and job creation associated with the Capital Gains Deduction. It was also not possible to evaluate if a 5 percent capital gains deduction used 5, 10, or 20 years after the initial investment changes any behaviors. While a tax deduction does increase household income, household spending does not have the same long-term economic impact as investing in a new company, hiring employees, or increasing factory output. Based on the economic and fiscal impact analysis, it appears the annual incentives offered under this program exceed the tax revenue generated. The return on investment for this program is negative.

Capital Gains Deduction 21
Incentive Benchmarking

Capital Gains Deduction 22
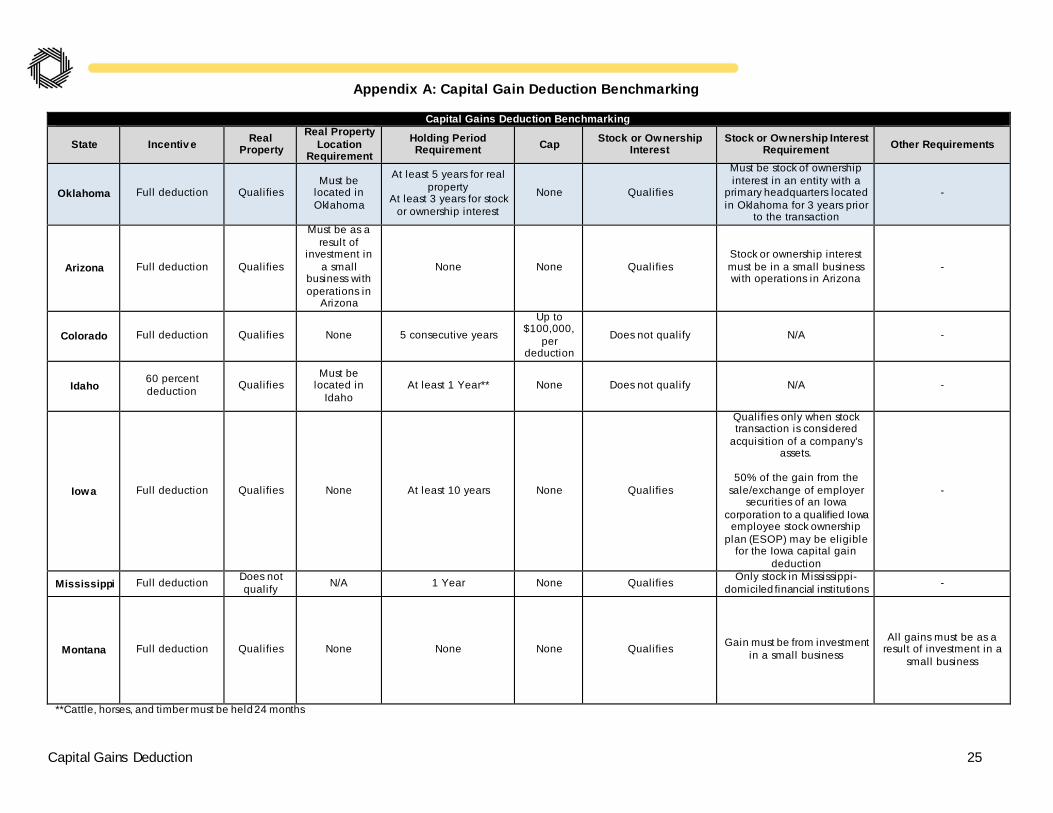
Benchmarking A detailed description of comparable state programs can be found in Appendix A. For evaluation purposes, benchmarking provides information related to how peer states use and evaluate similar incentives. At the outset, it should be understood that no states are ‘perfect peers’ – there will be multiple differences in economic, demographic and political factors that will have to be considered in any analysis; likewise, it is rare for any two state incentive programs to be exactly the same.6 These benchmarking realities must be taken into consideration when making comparisons – and, for the sake of brevity, the report will not continually re-make this point throughout the discussion. Ten states were found to have capital gains treatment that are comparable to Oklahoma’s. Two characteristics are particularly important in distinguishing the different programs: qualification requirements and targets.
Qualification Requirements: Real property qualifies for deduction in six of ten comparison states. Of the five states where real property does qualify for deduction, only one, Idaho, also requires that the property be located in-state. Oklahoma’s holding period requirement is longer than most comparison states. Three of the ten comparison states have a one year requirement, and four have no minimum holding period requirement. Targets: While Oklahoma’s program has the broad target of stimulating capital investment across the State, six of the ten comparison states that allow stock or ownership interest to qualify for deduction have more narrowly-targeted programs.
Arizona allow a deduction only for investment in small businesses with operations in the state. Iowa is only for employee stock ownership plans for Iowa corporations or when stock is acquired as
part of a company’s assets. Mississippi is only for stock in Mississippi-domiciled financial institutions. Nebraska is only for gains from stock acquired by being employed by a corporation doing business in
the state. Utah is specifically for small businesses in the state. Virginia is only for investments in small technology firms based in-state.
Benchmarking Program Evaluations The project team could not find examples of evaluations of capital gains deductions at the state level. Most research on the topic of capital gains taxation is focused on federal policy. While there are notable differences between state and federal taxation of capital gains, the same fundamental incentives and effects are seen at each level. The federal capital gains tax rate has changed several times throughout history, so there is useful empirical evidence regarding its economic impact.
6 The primary instances of exactly alike state incentive programs occur when states choose to ‘piggyback’ onto federal programs.
Figure 9: States offering similar incentives
Capital Gains Deduction 23
The driving force for many proposals to reduce or eliminate the tax on capital gains is that lower taxation of capital gains will stimulate more investment, and that investment will grow the economy. A 2010 Congressional Research Service report suggested economic growth is difficult to accomplish by reducing a tax that is paid largely by high income individuals.7 Economic theory generally concludes that high income individuals are likely to save a greater percentage of any tax break provided, so the tax reduction may not be enough to stimulate higher aggregate demand needed for economic growth. A 2014 report by the Brookings Institution furthers this argument by showing changes in the capital gains rate at the federal level are not associated with increases or decreases in GDP.8 Central to the debate surrounding capital gains taxation is the concept that a higher tax rate discourages realization of capital gains. The reluctance of investors to sell assets and realize gains causes them to hold them for longer periods. This is known as the “lock-in” effect. Proponents of lower capital gains tax rates argue that a lower rate reduces the lock-in effect. As a result, more gains are realized, which creates the potential for more revenue to be collected. A 2010 report by the Congressional Research Service noted that reduction in the capital gains rate is associated with large increases in revenue collection.9 However, this appears to be a short-term effect, and collections have returned to normal levels each time this has happened. A 1993 analysis by the National Bureau of Economic Research across all 50 states found an inverse relationship between the capital gains tax rate and state tax revenue but doubted that the relationship was strong enough to be self-financing.10 Another major area of research on capital gains taxation is who benefits from a reduction in the tax. The vast majority of those reporting capital gains income are high income individuals. At the federal level, capital gains are taxed at a lower rate than ordinary income. Income from investments that produce capital gains account for a higher percentage of income at higher levels of income, meaning that more income for high income individuals is taxed at a lower rate than ordinary income. This commonly leads to questions of whether it is fair to tax investments at a lower rate than income from wages. This debate was recently popularized by investor Warren Buffett, who publicly stated in 2011 that because most of his income is derived from capital gains, he pays a lower tax rate than his secretary. Another key concept in the capital gains tax discussion, venture capital activity, is discussed in a 1998 report published by the Brookings Institution.11 It found that increases in the capital gains tax at both the state and federal level weaken venture capital activity. Venture capital and entrepreneurship are seen as important factors in economic growth. This idea is expanded in a 2011 report published by the American Action Forum.12 It notes that private employment has grown more rapidly from 1990 to 2010 in the nine states providing preferential treatment of capital gains than the rest of the country. It also details a statistical analysis of state tax and employment to suggest private employment would increase by 40,000 if the state were to eliminate its capital gains tax. A review of literature on the topic suggests there are theoretical arguments to be made on each side of the debate. Based on data at the federal level, reductions in capital gains tax appear to have short-term impact, but it is less clear whether a capital gains reduction has a significant impact on long-term growth.
7 Congressional Research Service, “The Economic Effects of Capital Gains Taxation” June 18, 2010 8 Brookings Institution, “Effects of Income Tax Changes on Economic Growth” September 2014 9 Congressional Research Service, “The Economic Effects of Capital Gains Taxation” June 18, 2010 10 National Bureau of Economic Research, “Capital Gains Taxes and Realizations: Evidence From Interstate Comparisons” January 1993 11 Brookings Institution, “What Drives Venture Capital Fundraising?” 1998 12 American Action Forum, “Employment Effect of Reducing Capital Gains Tax Rates in Ohio” June 2011

Capital Gains Deduction 24
Appendices
Capital Gains Deduction 25
Appendix A: Capital Gain Deduction Benchmarking
Capital Gains Deduction Benchmarking
State Incentiv e Real Property
Real Property Location
Requirement Holding Period Requirement Cap Stock or Ownership
Interest Stock or Ownership Interest
Requirement Other Requirements
Oklahoma Full deduction Qualifies Must be
located in Oklahoma
At least 5 years for real property
At least 3 years for stock or ownership interest
None Qualifies
Must be stock of ownership interest in an entity with a
primary headquarters located in Oklahoma for 3 years prior
to the transaction
-
Arizona Full deduction Qualifies
Must be as a result of
investment in a small
business with operations in
Arizona
None None Qualifies Stock or ownership interest must be in a small business with operations in Arizona
-
Colorado Full deduction Qualifies None 5 consecutive years Up to
$100,000, per
deduction Does not qualify N/A -
Idaho 60 percent deduction Qualifies
Must be located in
Idaho At least 1 Year** None Does not qualify N/A -
Iowa Full deduction Qualifies None At least 10 years None Qualifies
Qualifies only when stock transaction is considered
acquisition of a company's assets.
50% of the gain from the
sale/exchange of employer securities of an Iowa
corporation to a qualified Iowa employee stock ownership
plan (ESOP) may be eligible for the Iowa capital gain
deduction
-
Mississippi Full deduction Does not qualify N/A 1 Year None Qualifies Only stock in Mississippi-
domiciled financial institutions -
Montana Full deduction Qualifies None None None Qualifies Gain must be from investment in a small business
All gains must be as a result of investment in a
small business
**Cattle, horses, and timber must be held 24 months

Capital Gains Deduction 26
Capital Gains Deduction Benchmarking
State Incentiv e Real Property
Real Property Location
Requirement
Holding Period Requirement Cap Stock or Ownership
Interest Stock or Ownership Interest Requirement Other Requirements
Nebraska Full deduction Does not qualify N/A None None Qualifies
Must be stock in a corporation acquired by the individual on account of
employment by the corporation or while employed by such
corporation.
The corporation has to have been doing business in Nebraska for at least 3
years
Individuals are only permitted to use the
deduction once.
Utah Tax Credit equal
to 5 percent of qualified gain
Qualifies None None None Qualifies Must be issued by a Utah
Small Business Corporation*
70 percent or more of the proceeds of the capital
gain transaction must be expended to purchase
qualifying stock in a Utah small business
corporation within a 12 month period after the
transaction
Virginia Full deduction Does not qualify N/A At least 1 Year None Qualifies
Must be investment in a technology firm primarily
enganged and substantially producing in Virginia
The qualifying company's annual gross revenues
cannot exceed $3 million and the amount of more
than $3 mill ion in aggregate cash proceeds
from the issuance of equity and debt
Wisconsin Full deduction Does not qualify N/A 5 Years None Qualifies
Must be stock in a Wisconsin registered
business -
*According to Section 1244(c)(3), Internal Revenue Code: In general a corporation shall be treated as a small business corporation if the aggregate amount of money and other property received by the corporation for stock, as a contribution to capital, and as paid-in surplus, does not exceed $1,000,000. The determination under the preceding sentence shall be made as of the time of the issuance of the stock in question but shall include amounts received for such stock and for all stock theretofore issued.