state of north dakota · state of north dakota evaluation of classified employee compensation...
TRANSCRIPT

State of North DakotaEvaluation of Classified Employee Compensation SystemFinal Report
OCTOBER, 2010
APPENDIX D

2© 2010 Hay Group. All rights reserved State of ND Eval of Comp System Final Report Oct 2010.pptx
Prepared by:
Neville KenningVice PresidentPublic Sector Consulting
Brenda DanenhauerConsultant
and
Malinda RileyConsultant

3© 2010 Hay Group. All rights reserved State of ND Eval of Comp System Final Report Oct 2010.pptx
Table of Contents
IntroductionProject ObjectivesExecutive SummarySteps UndertakenKey Interview FindingsComponent AnalysisSummary of AnalysesRecommendationsAppendices

4© 2010 Hay Group. All rights reserved State of ND Eval of Comp System Final Report Oct 2010.pptx
Introduction
In February 2010, the Government Services Committee (GSC) of the Legislature of the State of North Dakota contracted with Hay Group to conduct an audit of 10 components of the Classified Employee Compensation planIn August 2010, Hay Group presented to the GSC a report setting out the project steps, analysis and findings from an evaluation of the 10 componentsIn September 2010, Hay Group presented to the GSC recommendations as a result of this evaluation, guidance on how to implement the recommendations and the benefits to be achieved by actioning the recommendationsIn accordance with the contract between the State and Hay Group, the purpose of this report is to provide a final report on the project that has been undertaken

5© 2010 Hay Group. All rights reserved State of ND Eval of Comp System Final Report Oct 2010.pptx
Project Objectives
The primary objective of this project was to evaluate the following 10 specific areas of the Classified Employee compensation system:
A State compensation philosophy statement
Methods of classification
Salary inequities
Methods used to set pay grade minimums, maximums, and midpoints
Appropriate market comparisons
Fringe benefits
Methods of developing and sustaining a consistent long-term salary increase administration policy for state government
Recruitment and retention tools

6© 2010 Hay Group. All rights reserved State of ND Eval of Comp System Final Report Oct 2010.pptx
Project Objectives (cont’d)
The primary objective of this project was to evaluate the following 10 specific areas of the Classified Employee compensation system (cont’d):
The budget appropriation process for providing funds to agencies to administer the State's salary increase policy
The appropriate use of funding available within agency budgets from accumulated savings resulting from vacant positions and employee turnover. Focus is only on Salary Savings during the year

7© 2010 Hay Group. All rights reserved State of ND Eval of Comp System Final Report Oct 2010.pptx
Executive Summary
This report provides a detailed analysis of the 10 components, and a summary of the analysis and recommendations for actions to be taken to enhance the existing Classified Employee Compensation planThe analysis shows that, in the opinion of Hay Group, the plan is not broken and the recommendations for enhancement can be done within the current planThe current plan has an appropriate mix of centralized policy setting by HRMS and decentralized implementation within the Agencies A summary of the analysis is set out on pages 59-65 of this report. The key aspects of this summary include:− The State does not have a clear statement of a Compensation Philosophy which, if it
existed, would bring more definition and clarity to issues such as definition of the market
− While the classification methods, processes and forms are sound, there are opportunities for changes which will simplify and speed up the classification process
− Internal equity issues exist due to compression created by the allocation of classifications to a limited number of grades. Some positions that are perceived to be different in content are placed in the same grade

8© 2010 Hay Group. All rights reserved State of ND Eval of Comp System Final Report Oct 2010.pptx
Executive Summary (cont’d)
− The State utilizes a modified version of the proprietary Hay Group method of job evaluation. While there has been consistent application of this methodology, it is the opinion of Hay Group that training in and use of the Hay Group method of job evaluation would result in a different grade allocation for classifications and this would ease compression
− There current market used for setting of salary ranges is loosely defined and the subject of debate each year. Current range midpoints are set at a level which is sometimes stated as 95% of the market average and also as 5% below the market average. However, Hay Group analysis shows that salary range midpoints vary from 10% below the market to 3% above the market
− The current overall compa-ratio across all grades (actual pay as compared to range midpoint) is 93% which, when combined with the positioning of the salary range midpoints as stated above, means that actual pay lags the market
− The State offers a sound, comprehensive and cost-effective benefits program. The focus of changes as an outcome of this review should be on the classification and compensation components
− The use of recruitment bonuses has helped the State in its recruitment process. However, this should not be seen as a substitute for addressing the issue of having competitive salary ranges

9© 2010 Hay Group. All rights reserved State of ND Eval of Comp System Final Report Oct 2010.pptx
Executive Summary (cont’d)
− The OMB has a sound and well documented compensation planning process and schedule and once budgets and appropriations have been approved by the Legislature, funding is appropriated on a “bulk funding” basis. This is a commendable process
− The State has in place sound pay delivery mechanisms, based on equity and performance. However, there have been contradictory statements of intent in recent years, such as in HB1015, which placed some emphasis on time in position. There are opportunities for strengthening the linkage between pay and equity in future funding decisions
− Vacancy savings are used for a number of purposes such as paying off leave balances, employee contractor pay, funding recruitment and retention bonuses, equity adjustments and some operational costs. Payment of leave balances is required and hence should be funded

10© 2010 Hay Group. All rights reserved State of ND Eval of Comp System Final Report Oct 2010.pptx
Executive Summary (cont’d)
Set out on pages 67-74 of this report is a list of actions that Hay Group recommends be taken to enhance the current Classified Employee compensation system. These recommendations have been set out in a manner that the State will not only be able to see what should be done but the outcomes and value it will get from taking these actions. The key recommendations and actions that need to be taken, as they form the basis for the actioning and implementation of other recommendations include:− The development and adoption of a State Compensation Philosophy. This will
provide the direction to and parameters within which all future compensation decisions should be made. Compensation policies should be prepared and plans administered consistent with this Compensation Philosophy
− Adoption of the Hay Guide-Chart Profile Method of Job Evaluation, training of HRMS job evaluators and, if appropriate, Agency HR classifiers in that methodology and the evaluation of all classifications using this methodology. This will lead to the appropriate grade allocation for all classifications, decrease the number of classification requests and ease classification and pay compression. It will also provide the basis for the development of the appropriate levels in a job family and hence, career progression

11© 2010 Hay Group. All rights reserved State of ND Eval of Comp System Final Report Oct 2010.pptx
Executive Summary (cont’d)
− The conduct of a customized salary survey based on the definition of the market as an outcome of the adoption of the Compensation Philosophy. This will provide credible and defensible data as a basis for determining how many pay structures should exist, the setting of appropriate range midpoints and the construct of salary ranges.
− Funding for salary changes should continue to be based on performance and equity. However, Hay Group recommends that the Legislature fund pay movement through “one pot of money” rather than separate allocations for performance and equity. This will allow a greater linkage between market and performance. In addition, we recommend that the appropriations be expressed in dollar amounts rather than as percentages.
Hay Group has provided to the Legislative Management Council a proposal for actioningall the recommendations contained on pages 67-74 in this report. The proposal shows that all the recommendations made can be actioned and implemented by the start of then next biennium on July 1, 2011

12© 2010 Hay Group. All rights reserved State of ND Eval of Comp System Final Report Oct 2010.pptx
Executive Summary (cont’d)
Hay Group places on record our recognition of the support and cooperation that we have received from Legislative Council staff and the staff of HRMS. Such support has enabled Hay Group to conduct and complete this project within the timetable set by the GSC

13© 2010 Hay Group. All rights reserved State of ND Eval of Comp System Final Report Oct 2010.pptx
Steps Undertaken
The following steps have been undertaken since the project commenced in March 2010:
Meeting with the GSC for definition and clarification of what was to be studied in the 10 areas identified by the GSC
Meeting with Legislative Council Staff for project planning
Meeting with HRMS staff for identification of data needed and for gaining understanding of the current Classified Employee compensation plan
Interviews with a cross section of Agency leadership for purposes of gaining an understanding of “what’s working; what’s not” in the design, implementation and administration of the Classified Employee compensation plan
Extensive analysis in each of the 10 areas identified

14© 2010 Hay Group. All rights reserved State of ND Eval of Comp System Final Report Oct 2010.pptx
Steps Undertaken (cont’d)
The following steps have been undertaken since the project commenced in March 2010 (cont’d):
Preparation of a preliminary report
Present analysis and preliminary findings to the GSC in August 2010
Development of the recommended changes/enhancements to the system and the outcomes that should be expected from these changes
Presentation to the GSC in September 2010
Preparation of this Final Report

15© 2010 Hay Group. All rights reserved State of ND Eval of Comp System Final Report Oct 2010.pptx
Key Interview Findings
At the meeting of the GSC held on April 22, 2010, Hay Group provided a copy of the Interview Guide. The focus of the interviews was to gain an understanding of each of the 10 components of the plan from a “user” perspective
A summary of the key strengths/issues/challenges from the interviews held with Agency leadership is as follows:
The areas identified by the legislative committee to be reviewed were validated in our interviews as key focus areas for the compensation program
The decentralization of compensation provides significant flexibility to agency leaders…when funds are available to allow for equity adjustments, respond to market pressures, and recognize performance
The reclassification process, in general, is perceived to be long, rigid, and too literal
It appears that the primary market used to set the salary ranges is not the market from which most of the agencies attract from and lose employees. A number of agencies attract from and lose to local private industries and public entities

16© 2010 Hay Group. All rights reserved State of ND Eval of Comp System Final Report Oct 2010.pptx
Key Interview Findings (cont’d)
The benefits package is perceived to be the primary recruitment and retention tool. The benefit package is seen to be competitive with any market (state/local/government/ private). The retirement program, in particular, is viewed as a strong benefit
While benefits are used for recruitment and retention, the general consensus is that employees don’t understand all the benefits available to them and don’t understand the value of those benefits
There is general concern that if any changes are made to the benefits package, the State will have even more of a difficult time attracting and retaining employees
Currently, most agencies strive to recruit the best and most qualified – however due to the salary levels, recruiting and retaining the most qualified is difficult. If Agencies are able to recruit qualified employees, they are trained and a lot is invested in their abilities only then to lose them later for better pay
Agencies seem to be focused on internal equity by recognizing employee performance and distributing dollars accordingly

17© 2010 Hay Group. All rights reserved State of ND Eval of Comp System Final Report Oct 2010.pptx
Key Interview Findings (cont’d)
Equity pools are a key mechanism for moving employees through the ranges or at least maintain their same compa-ratio as the ranges move – this is also an issue, salary increases have not kept pace with market movement
Agencies use the salary increase budget to recognize and distinguish performance among employees, however, the equity pools look at compa-ratio resulting in an “un-doing” of the work performed to distinguish performance
Monies for salary increases is highly unpredictable – “riding the wave of the economy,” making it difficult for agency leadership to attract, motivate, and retain employees
Agencies with federal/special funds are perceived to be in a better position to complete against general fund agencies for talent. This is seen as causing inequity across the agencies, with varying pay for the same level of work
The ranges appear to be irrelevant as most of the employees are below the midpoint (perception by agencies). 95% of the average of the market is one issue but the bigger issue is being able to pay employees for the work being performed (only half of the range is being utilized – however, midpoint is supposed to represent the going rate for competent work)

18© 2010 Hay Group. All rights reserved State of ND Eval of Comp System Final Report Oct 2010.pptx
Key Interview Findings (cont’d)
From a first glance perspective there appears to be significant compression of jobs with a relatively small number of grades being utilized for the majority of positions, though this requires further analysis. If this is true it is likely that differences in jobs are not being recognized and there is limited career progression. Most agencies felt strongly that positions in the same grade are not similar in the level of knowledge and complexity

19© 2010 Hay Group. All rights reserved State of ND Eval of Comp System Final Report Oct 2010.pptx
Component AnalysisWhat are they?
This section of the report sets out detailed analysis of the 10 components of Classified Employee Compensation plan covered by the scope of the project. It is set out as follows:
Description of the ComponentWhat Was AnalyzedWhat Was Found

20© 2010 Hay Group. All rights reserved State of ND Eval of Comp System Final Report Oct 2010.pptx
Component AnalysisCompensation Philosophy
Description of Component A compensation philosophy statement is intended to provide a foundation for the design and administration of compensation plans
It defines what you pay for and whyWritten in general terms in order to provide a lasting basis for future compensation design and administration decisions
What Was AnalyzedReview of current compensation philosophy documentationThe extent to which a compensation philosophy exists and if one does, the extent to which it contains component statements typically found in a compensation philosophy

21© 2010 Hay Group. All rights reserved State of ND Eval of Comp System Final Report Oct 2010.pptx
Component AnalysisCompensation Philosophy
What Was Found
Chapter 54-44.3 of North Dakota Code is the law that sets out the purpose of HRMS and its roles and responsibilitiesWithin that, 54-44-3.01.1 makes a statement about compensation relationships – PolicyChapter 54 also sets out the roles and responsibilities of the State Employee Compensation CommissionHowever, Hay Group did not find a section of Code that clearly sets out a Compensation PhilosophyA Compensation Philosophy should provide the basis upon which all decisions regarding compensation should be made
Put simply, the analysis of the areas that are covered by the scope of this project should have been reviewed within the context of a Compensation Philosophy statement

22© 2010 Hay Group. All rights reserved State of ND Eval of Comp System Final Report Oct 2010.pptx
Component AnalysisCompensation Philosophy
The key components of a Compensation Philosophy statement typically include:An umbrella statement that links the compensation to the State’s Mission, Vision, Values and its human resources objectivesDefinition of the marketDefinition of compensationDefinition of how pay ranges will be establishedDefinition of how pay will moveDefinition of roles and accountabilitiesDefinition of what will be stated in code, policy, procedure, etc

23© 2010 Hay Group. All rights reserved State of ND Eval of Comp System Final Report Oct 2010.pptx
Component AnalysisMethods of Classification
Description of Component Methods used to develop and determine classifications
Extent to which current job documentation accurately and succinctly describes current job contentMethods and processes by which position classifications decisions are madeExtent to which employees are appropriately classified
What Was AnalyzedOverall Classification ProcessProcess DurationProcess Participant Constituency and Delineation of ResponsibilitiesPosition Information QuestionnaireClassification SpecificationsLeveling DecisionsClassification Schema

24© 2010 Hay Group. All rights reserved State of ND Eval of Comp System Final Report Oct 2010.pptx
Component AnalysisMethods of Classification
What Was FoundHay Group created a flow chart of the State’s classification/reclassification process as set out on page 77 in the Appendices. The following observations can be made:
There are some potential “extra” steps in the flow of the process that could be modified or eliminatedThe “type” of forms used to collect job content information are typical and consistent with sound practice
However, the forms themselves require improvementSome of the methods used to assess job content and make classification/ reclassifications decisions are consistent with best practice while other methods (that are more heavily utilized) are not consistent with sound practice
There are improvements that can be made to the classification/reclassification steps and decision points in the process
However, while improvements can be made, HRMS must also begin to understand and dispel negative perceptions associated with the classification process

25© 2010 Hay Group. All rights reserved State of ND Eval of Comp System Final Report Oct 2010.pptx
Component AnalysisMethods of Classification
Key Perception: Process Is Too LongBased on the guidelines: the total time for an employee from when they submit a request to the time they receive a decision is up to 120 days (60 days from the time HRMS received the request). The total time for reconsideration of a classification allocation is up to 60 days and the total time for a final appeal decision will varyThe table below displays the results of actual timeframes (analysis is based on approximately 2,783 requests; 77 reconsiderations; and 25 appeals that were received from July 1, 2007 to March 3, 2010)
HRMS is, for the most part, following the guidelines it has set for requests but not for reconsiderations. This suggests that the reconsideration process is an area for improvement
Request Reconsideration Appeal10 Days or Less 49% 0% 0%Add'l 20 Days 17% 0% 64%Add'l 30 Days 21% 9% 0%Add'l 30 Days 7% 13% 8%Add'l 30 Days 3% 9% 28%121 Days or More 3% 69% 0%
# of Days From HRMS Receipt to Decision
% of Decisions Achieved

26© 2010 Hay Group. All rights reserved State of ND Eval of Comp System Final Report Oct 2010.pptx
Component AnalysisMethods of Classification
Key Perception: Classification/Reclassification Decisions Are Rigid and Suspect Hay Group conducted a small sample review of classification requests and found that overall, despite the perception, the classification decisions were appropriateHay Group also found that the following practices may be contributing to the perception:
Internal comparisons are made to other positions within the same work area and to similar positions across state agencies to support a classification decision. While internal comparisons is a best practice, comparing individual positions within a classification opens up the door to more subjectivity and goes against the concept of a “classification”It appears that both through the sample review and the agency interviews, HRMS utilizes whole job comparisons as the primary basis for a classification decision rather than the job evaluation methodology. Whole classification comparisons tend to lead to perceptions that the system is flawed and is based on subjectivity
Providing explanations based on job content differences using the concepts from the job evaluation methodology brings the focus back to the position under review rather than “my job is bigger than that job”

27© 2010 Hay Group. All rights reserved State of ND Eval of Comp System Final Report Oct 2010.pptx
Component AnalysisMethods of Classification
Key Perception: Ranking of Classifications Is Not AppropriateTrend analysis of the number of classification requests, reconsiderations, and appeals suggests that there is significant pressure placed on the classification system
When there is significant pressure, it is difficult to maintain the integrity of the process resulting in internal equity issues (i.e., classifications with significant differences in job content are leveled similarly and therefore placed in the same grade)
A Classification Schema and an Employee Per Grade Chart as set out on page 78 in the Appendices were created to test our assumptions from the trends:
Out of a 20 Grade Structure, only 14 grades are primarily in useSome of the more heavily populated job families tend to have the majority of their positions within a cluster of 4-5 gradesThe more heavily populated grades consist of entry to mid level professional positions (Grades 10-12)There appears to be compression moving from individual contributor jobs to management jobs

28© 2010 Hay Group. All rights reserved State of ND Eval of Comp System Final Report Oct 2010.pptx
Component AnalysisSalary Inequities
Description of Component Methods to minimize salary inequities both within an agency and within state government
Extent to which there is an objective, fair, and defensible means by which to measure and differentiate job contentExtent to which pay is aligned internally as based on the job evaluation methodologyThe amount of horizontal and/or vertical dispersion from an appropriate internal alignment of positions that exists within agencies and between agencies
What Was AnalyzedCurrent Leveling MethodJob Evaluation and Job RankingInternal Equity

29© 2010 Hay Group. All rights reserved State of ND Eval of Comp System Final Report Oct 2010.pptx
Component AnalysisSalary Inequities
What Was FoundCurrent Leveling Method
This State utilizes a point factor method to evaluate and level classifications. This method focuses on three main factors: Knowledge & Skill, Complexity, and Accountability
According to the ND Class Evaluation System Manual, this method was developed by the HRMS Division in 1982. However, after review, Hay Group has determined that this system is actually a modified copy of the Hay Group Guide Chart-Profile Method of Job Evaluation in which Hay Group reserves all rights
Despite the “unauthorized” use of the Hay Group Profile Method, the use of this methodology is a strength of the State’s classification process
Hay Group Profile Method is still the most rigorous and time-tested methodology available for the purpose of understanding, comparing and sizing job content and it is the most utilized and universally applicable job evaluation tool available

30© 2010 Hay Group. All rights reserved State of ND Eval of Comp System Final Report Oct 2010.pptx
Component Analysis Salary Inequities - Ranking of Positions
Hay Group conducted a sample review/quality check of existing job evaluations. This review consisted of 160 classifications across the majority of grade levels and job families within the State. The following observation was made:
Out of the 160 classifications evaluated, over a third resulted in a significant difference in weighting from the current HRMS evaluations
HRMS job evaluators understand the current leveling system in use by the State. As previously mentioned, the current system is a modified copy of the Hay Group Profile Method of Job Evaluation. Hay Group’s critique is related more to the current system, as the concepts are ill-defined and therefore the application of such concepts may be inappropriate, rather than the capability of the HRMS job evaluatorsWhile a third of the jobs reviewed resulted in a different weighting, it does not necessarily mean they would be assigned to a different grade. The range of jobs that would be assigned to a grade under the current grade structure is too broad. Jobs of a different size and complexity could be assigned to the same grade. This is a primary reason for the inequities that exist in the ranking of positions

31© 2010 Hay Group. All rights reserved State of ND Eval of Comp System Final Report Oct 2010.pptx
Internal Equity is an analysis of how positions and employees are paid relative to each other based on a comparison of job content
Statewide Internal EquitySet out on page 79 in the Appendices is a chart showing the overall internal equity. Internal equity is positive, meaning, as job size increases (greater contribution to the State) so does the pay. However, there are pockets of internal equity issues that need to be addressedThere is a wide range of pay for classifications of similar job size (i.e., similar value contribution to the State as measured through job evaluation)Pay for approximately 5% of total classified employees fall below the current salary range minimumsThe table on page 80 in the Appendices shows the current compa-ratio by pay grade. The overall compa-ratio (where pay falls within a salary range) is 93%, which is on the low end of acceptable “distance” to the midpoint. However, within some grades the pay is low in the range relative to the midpoint (midpoint represents the going market rate for competent performance). The compa-ratio needs to be considered relative to target market position
Component AnalysisSalary Inequities

32© 2010 Hay Group. All rights reserved State of ND Eval of Comp System Final Report Oct 2010.pptx
Occupational Group/Job Family Internal EquityAlthough the State has one salary structure that fits all classifications, actual pay analysis reveals that the State does recognize pay differences for some of the occupational groups/job families. This is shown in the chart on pages 81 and 82 in the Appendices. For example, larger IT and Engineering classifications tend to be paid higher than Medical or Social Services classificationsThere is a wide range of pay within approximately half of the occupational groups/job families for positions of the same job size. This indicates potential job evaluation/grade assignment or pay administration issuesThe groups that tended to have similar pay for positions of the same job size include: Engineering, Planning, and Allied; Medical and Public Health (excluding Pharmacy, Nursing, Dental, and Physician Assistant); Custodial, Food Service, and Laundry; Labor, Labor Supervision, Equipment Operators & Trades
Component AnalysisSalary Inequities

33© 2010 Hay Group. All rights reserved State of ND Eval of Comp System Final Report Oct 2010.pptx
Agency Internal Equity (DOT & Human Services were used as examples)DOT has positive internal equity and pay is similar for classifications of the same job sizeHuman Services has positive internal equity, however, there is a wide range of pay for classifications of the same job size. The dispersion of pay becomes a greater concern when county positions are added to the analysisThis is shown in the charts on pages 83 and 84 in the Appendices.
Component AnalysisSalary Inequities

34© 2010 Hay Group. All rights reserved State of ND Eval of Comp System Final Report Oct 2010.pptx
Same Classification Across the State Internal Equity7 classifications were analyzed across the State:
Administrative Assistant I pay has a 65% spread (High: $36,384 to Low: $22,020)Office Assistant III pay has a 52% spread (High: $33,464 to Low: $22,017)Account Technician II pay has a 59% spread (High: $40,030 to Low: $25,200)Programmer Analyst III pay has a 33% spread (High: $67,104 to Low: $50,412)Maintenance Supv II pay has a 49% spread (High: $47,279 to Low: $31,656)Registered Nurse II pay has a 24% spread (High: $52,045 to Low: $42,012)Correctional Officer II pay has a 33% spread (High: $43,104 to Low: $32,452)
This is shown in the tables on pages 85 and 86 in the AppendicesThe more common the classification (i.e., located in a greater number of agencies) the greater the range of pay
Component AnalysisSalary Inequities

35© 2010 Hay Group. All rights reserved State of ND Eval of Comp System Final Report Oct 2010.pptx
Component AnalysisMarket Definition and Pay Ranges
Description of Component Methods used to set pay grade minimums, maximums, and midpointsAppropriate market comparisons
Definition of the marketExtent to which the State’s pay policy sets pay at the appropriate level of the relative market and the pay structure is aligned with the State’s pay policy
What Was AnalyzedMarket DefinitionMarket Target LevelMatches to Survey PositionsIncorporation of Market DataSalary StructureProcess ParticipationCompetitive ComparisonRemote Location/Market Pressures

36© 2010 Hay Group. All rights reserved State of ND Eval of Comp System Final Report Oct 2010.pptx
What Was FoundMarket Definition
Current market definition (which is loosely defined) does not align with the competitive needs of the StateThe debate that exists on the relevancy of which States define the market is the wrong focus for a debate. The focus needs to be driven by answering key questions such as “what markets do agencies compete and lose talent”?
Based on our interview findings, most of the State’s agencies compete for talent within the State and against other private and public employers
Some State agencies have different needs and compete for talent against distinct private and public entities. For example, the Veterans’ Home competes against the local medical market while the Highway Patrol competes against the other city/county police departments and federal agencies
These two markets have very different pay practices and trends
Component AnalysisMarket Definition and Pay Ranges

37© 2010 Hay Group. All rights reserved State of ND Eval of Comp System Final Report Oct 2010.pptx
Survey Data UsedCurrent Survey data used to analyze the market
Grades 1-10: Job Service ND Labor Market Information (In State Employers)Grades 11-20: 10*State Governments of CO, IA, KS, MN, MO, MT, NE, OK, SD, WY and, most recently, Job Service ND Labor Market Information (In State Employers)
While the source used for comparison with other States, being the Central States Compensation Association survey is appropriate, as set out on page 87 in the Appendices, Hay Group has concerns about the use of the Job Service ND Labor Market survey
These concerns center around the reliability of the data due to challenges in getting like- kind job content matches. This is due to the fact that this survey is done for labor reporting purposes and it aims to include as many employers as possible; employers that would not necessarily be part of the States’ definition of its market
Due to the importance of local market data for specific job families, there is a greater need to obtain direct, relevant market data in order to more effectively compete for and retain talent
This means some job families may require a different market definition from the “general” pay positions
* Section 19 of House Bill No. 1015 stated a comparison with only 3 of these States, being MT, SD and WY
Component AnalysisMarket Definition and Pay Ranges

38© 2010 Hay Group. All rights reserved State of ND Eval of Comp System Final Report Oct 2010.pptx
Position Relative to MarketSalary ranges are currently set at 5% below the average of the market (at least this is what is communicated)
Based on 2009 salary range development analysis, the informal market target of 5% below the average of the market is an inaccurate statement. The midpoint for the salary ranges are anywhere from 10% below to 3% above the market
The current market target is not consistent with best practice and sends the wrong message to employees of the State
It also gives employees a false sense of competitiveness. For example if an employee’s salary is $32,000 and the midpoint of their salary range is $32,000 then you could say they are paid at the average of the market, when in reality they are paid 5% below the going rate in the market
Without a clear compensation philosophy and market target statement, more emphasis is placed on an internal perspective in the creation of the salary ranges rather than what is going on in the market (in terms of what actually gets approved). Best practice is to have a balance between internal pay practices and market competitiveness
Component AnalysisMarket Definition and Pay Ranges

39© 2010 Hay Group. All rights reserved State of ND Eval of Comp System Final Report Oct 2010.pptx
External market comparison revealed different pay practices exist between the various job families (e.g., engineering, legal, medical, labor, etc.) − In particular, the local market (as defined by the Job Service Survey) has more
market variation among the job families than the central state market. This is shown on page 88 in the Appendices
− The State’s pay practices are more in line with the central state market than the Job Service market, and slightly more in line with the 3 state comparison
− However, based on our interviews with the agencies, the majority of the agencies compete against and lose to the local market
As set out in the tables on pages 89-90 in the Appendices, over 45 classifications are more than 15% behind the job service market and 23 classifications are more than 15% behind the central state marketPage 91 in the Appendices shows the current pay grade exceptions. The majority of the State’s current Pay Grade Exceptions are consistent with market practicesPage 92 in the Appendices shows those positions experience in a market premium compared to other jobs of similar size that are not currently included in the State’s list of Pay Grade exceptions
Component AnalysisMarket Definition and Pay Ranges

40© 2010 Hay Group. All rights reserved State of ND Eval of Comp System Final Report Oct 2010.pptx
Salary StructureThe State is comprised of many, diverse professions. There is no other employer similar to a State in this respect, therefore, it is unreasonable to have a salary structure that is a “one size fits all”
The healthcare market is a different market than the law enforcement market than the legal market than the general market, etcA “one size fits all” structure with only 14 out of 20 grades primarily utilized significantly limits the State’s ability to respond to market pressures
The State utilizes a salary range that has a 66% spreadIt will take employees longer to reach midpoint (the going rate for work being performed by a competent employee). As such, these structures tend to be more affordable than the standard structuresHowever, the wider the ranges, the greater the need for strong processes to move competent employees through the ranges so that they can reach a competitive salary for the work performedFrom a recruitment standpoint, wider ranges means the minimums of the ranges are that much further from the market, making recruitment more challenging due to the entry rates offered as compared to other public agencies or private companies
Component AnalysisMarket Definition and Pay Ranges

41© 2010 Hay Group. All rights reserved State of ND Eval of Comp System Final Report Oct 2010.pptx
Component AnalysisFringe Benefits
Description of Component Non-cash benefits provided to employees of the State
What Was AnalyzedBenefits programs offered to the States employees to determine the level of competitiveness against public sector organizations (10 Central US States) and general market companies (650 general market organizations)
Hay Group’s review is based on benefits program information provided by the State in July of 2010 for its current FY benefit programs

42© 2010 Hay Group. All rights reserved State of ND Eval of Comp System Final Report Oct 2010.pptx
Market Comparison Summary
Set out on the following page is a competitive position summary of the State’s benefits program as compared to the marketThe State provides a comprehensive and cost effective benefits program with a competitive health care and retirement program. However, the State’s life and disability programs are less competitiveSet out on pages 99 – 111 in the Appendices is a more comprehensive review of the benefits programA detailed Prevalence of Practice report has been provided separately to the State
Component AnalysisFringe Benefits

43© 2010 Hay Group. All rights reserved State of ND Eval of Comp System Final Report Oct 2010.pptx
Market Comparison Summary
Component AnalysisFringe Benefits
Benefit Area Market Comparison
Key Findings
Total Benefits At Market Market position of health care, retirement and time-off weigh heavily in overall benefit program competitiveness.
Death Below Market The State’s low flat dollar benefit of $1,300 is well below both market comparator groups. Employee paid supplemental offering does provide employee with higher coverage, but does not enhance value significantly.
Disability Below Market Accrual of 12 days per year with no maximum is consistent with other Central US States; however LTD benefit through defined benefit plan is less competitive and less common than stand alone LTD plan.
Health Care At Market No employee contributions and low out of pocket maximums offset other plan design features to put the State’s program at market.
Retirement At Market High benefit accrual in defined benefit plan offsets lack of employer match in the defined contribution plan.
Time-Off At Market The number of paid holidays and vacation schedule is at market for both Central US States and the general market.
Other Below Market Limited offering of flexible spending accounts and no employer paid benefits is below both Central US States and general market.

44© 2010 Hay Group. All rights reserved State of ND Eval of Comp System Final Report Oct 2010.pptx
Component AnalysisRecruitment and Retention Tools
Description of Component Recruitment and retention tools
What Was AnalyzedReview of Current ToolsOther Methods/ToolsTime to Fill TrendsTurnover TrendsCurrent Focus on Performance

45© 2010 Hay Group. All rights reserved State of ND Eval of Comp System Final Report Oct 2010.pptx
Hay Group reviewed the current usage of the retention bonus. The following observations were made:
In 2008, 170 employees received a retention bonus that ranged from $50 to $22,299The higher amount bonuses tended to be offered to petroleum related positions
In 2009, 132 employees received a retention bonus that ranged from $1,200 to $19,686
Those positions that tended to receive bonuses include: Petroleum related positions, Transportation Technicians, Transportation Services Supervisors, Auditors, and Geologists
The top of the ranges, $22,299 in 2008 and $19,686 in 2009, were provided to positions located within the Department of Human Services. Between 2008 and 2009, only 4 retention bonus were provided in the amounts of $11,000 and aboveHowever, the statement that “higher” amount bonuses tended to be offered to petroleum related positions is still accurate given that majority of bonuses provided to other positions were $3,000 and belowTransportation related positions and Auditors were provided bonuses that were below $3,000
Component Analysis Recruitment and Retention Tools - Retention Bonus

46© 2010 Hay Group. All rights reserved State of ND Eval of Comp System Final Report Oct 2010.pptx
Component AnalysisRecruitment and Retention Tools
Performance BonusA performance based bonus is the most common tool of monetary retention in the marketplace. In the private sector, these bonuses have more structure around performance goals and are in the form of Short-Term Incentives or Long-Term Incentives. The State’s definition and use of these bonuses is common in the public and non-profit sectorsBecause administration of performance bonuses is not centralized, there is a recognized need for HRMS to provide limitations and criteria. However, a $1,000 bonus for professional positions and higher is not motivational and does not contribute to greater employee engagement or discretionary effortThe State and the Agencies must be clear about the “type” of performance being rewarded. Typically, monetary increases that move employees through the salary ranges are associated with performance of the core job responsibilities and are a measure of skill/capability acquisition and proficiency. Performance Bonuses are typically focused on achievement of specific goals or areas of desired discretionary effort

47© 2010 Hay Group. All rights reserved State of ND Eval of Comp System Final Report Oct 2010.pptx
Component AnalysisRecruitment and Retention Tools
Focus on PerformanceHay Group recently conducted a research study on “The Changing Face of Reward” to better understand the factors driving changes in reward strategy, design and implementation, and how organizations are responding to those changes to meet the challenges of the new business environment. The research revealed that the focus on pay for performance has never been greater
Public sector organizations have tended to value loyalty and ‘fit’ rather than a performance-focused culture. However, the pressures of the market have prompted the public sector to introduce a greater focus on performance. Variable pay (e.g., performance bonuses), differentiated rewards, and performance metrics are going to play a vital role in reward/compensation programs going forwardThe first step in a greater focus on performance is ensuring employees understand what performance looks like

48© 2010 Hay Group. All rights reserved State of ND Eval of Comp System Final Report Oct 2010.pptx
Component AnalysisRecruitment and Retention Tools
Focus on PerformanceTo assess the performance metrics being utilized by the State, Hay Group reviewed a sample of evaluation forms from the following agencies: Corrections and Rehabilitation; Department of Health; Human Services; Information Technology Department; Insurance Department; Parks & Recreation; State Auditor; Tax Department; and Workforce Safety & Insurance
The metrics used by most of the agencies sampled, were impressive based on what is typically seen utilized by the public sectorThe stronger performance metrics currently being utilized focus on the key job duties required for the upcoming year or key job duties that have been “leveled” and behavioral related competencies that are important for successful performance in a position
A common theme across the agency interviews was a real interest in, dedication to, and pride in employee and agency performance. However, because of limited or no available funding, agencies feel they are limited in what they can do to recognize and reward performance

49© 2010 Hay Group. All rights reserved State of ND Eval of Comp System Final Report Oct 2010.pptx
Component AnalysisBudget Appropriation Process
Description of Component A budget appropriation process for providing funds to agencies to administer the State's salary increase policy
What Was AnalyzedReview of How Funds are Appropriated, Being Applied, & Executive Branch Process to the Legislative Committee

50© 2010 Hay Group. All rights reserved State of ND Eval of Comp System Final Report Oct 2010.pptx
What Was Found
The OMB has a sound and well documented compensation planning process and schedule. It takes into consideration the “current” situation and the “projected” to the end of a biennium. The guiding principle is referred to as “hold even”Budgeting is done on both filled positions and vacanciesHowever, there is a rigorous process that is in place for any new FTE’s, known an the optional package, which has to be approved by the Hiring Council The salary budget package takes into consideration various analyses referenced in other sections of this document such as internal equity, relativity to market, market movement, etcThere is no budgeting for the payment of “leaving costs” such as the payout for annual and sick leave
Component AnalysisBudget Appropriation Process

51© 2010 Hay Group. All rights reserved State of ND Eval of Comp System Final Report Oct 2010.pptx
Salary recommendations are developed by the State Employee Compensation Commission and then made to the Governor in accordance with Code 54-06-25These recommendations are then either adopted or modified by the Governor in preparing the Governors budget recommendations to the Legislature Once budgets and appropriations have been approved by the Legislature, funding is appropriated on what Hay Group refers to as a “bulk funding” basis. Hay Group commends this approach as it reinforces the accountability of Agency leadership to manage all their resources
Component AnalysisBudget Appropriation Process

52© 2010 Hay Group. All rights reserved State of ND Eval of Comp System Final Report Oct 2010.pptx
Component AnalysisLong-Term Salary Increase
Description of Component Methods of developing and sustaining a consistent long-term salary increase administration policy for state government
Including, cost-of-living increases, across the board increases, merit increases, equity increases, and performance increases
What Was AnalyzedCurrent Process vs. Best PracticeSalary Funding and Pay Movement Mechanisms

53© 2010 Hay Group. All rights reserved State of ND Eval of Comp System Final Report Oct 2010.pptx
Component AnalysisLong-Term Salary Increase
What Was FoundThe previous section set out commentary on the salary budgeting process. The analysis in this section focused on how salary dollars are appropriated and appliedHouse Bill No, 1015 gives a recent example of such a processThere are features of the language in that bill that are commendable. These include:
Section 11 Compensation adjustments are to be based on documented performance and equity and are not necessarily to be the same increase for all employeesA performance threshold has to be reached for an employee to be eligible for an increase Section 19An equity pool to address market and internal equity issues
However, there are some inherent “contradictions” in the wording in Section 19. Statements that are potentially contradictory in terms of their application are:
Priority is to be given to market considerations and internal and external inequitiesPay comparisons to ND employers and employers in MT, WY and SDPriority to those employees who have been employed greatest length of time and furthest below midpoint

54© 2010 Hay Group. All rights reserved State of ND Eval of Comp System Final Report Oct 2010.pptx
Component AnalysisLong-Term Salary Increase
Legislative General Increase is the primary mechanism by which employees move through the ranges, with a focus on performance being the primary form of distribution within an agency
As the primary mechanism for movement, a lot of internal press and focus is placed on the allocated % increase each biennium. Therefore, how this funding is determined, communicated, and distributed is critical to the success of the compensation system
The second most common mechanism for employee salary movement is through the Market/Equity Fund
This funding is not provided on a consistent basisWhile addressing equity is important (one half of the employee movement equation), a significant emphasis on equity adjustments in the absence of performance pay/reward does not create a performance based culture. In other words, employee discretionary effort and value added contribution is not rewarded on a consistent basis. If performance/contribution is not recognized on a consistent basis, employees will only perform what is required to get through the day

55© 2010 Hay Group. All rights reserved State of ND Eval of Comp System Final Report Oct 2010.pptx
Component AnalysisLong-Term Salary Increase
As set out on the previous pages, the two key components of pay movement are performance and equity and the State is to be commended for having these two key componentsHowever, there are numerous other ways in which pay moves. The tables on pages 93-98 in the Appendices show the basis for pay movement in the period 2003-2010. This is shown on a Statewide, Agency and Job basisIt is the opinion of Hay Group that the State has in place sound fundamentals for future pay delivery mechanismsThere is potential for enhancing the linkage between performance, internal equity and market in the application of the equity pool

56© 2010 Hay Group. All rights reserved State of ND Eval of Comp System Final Report Oct 2010.pptx
Component AnalysisVacancy Savings
Description of Component The appropriate use of funding available within agency budgets from accumulated savings resulting from vacant positions and employee turnover. Focus is only on Salary Savings during the year
What Was AnalyzedReview of Current Process and RulesReview of Current Practice and Trends

57© 2010 Hay Group. All rights reserved State of ND Eval of Comp System Final Report Oct 2010.pptx
Component AnalysisVacancy Savings
What Was FoundThe primary use of vacancy savings is for the purpose of paying off leave balances (annual/sick leave) for employees who leave and/or retireIt is also used for:
Operational Costs such as vehicles, employee contractor pay, overtimeFund recruiting, retention, and performance bonusesMake market equity adjustments
While there is a cap on annual leave accumulation, there is no cap on sick leave accumulationThe use of vacancy savings has been a common practice in the Public Sector for many years. The key issue to be addressed is not so much whether vacancy savings should be used or “returned” but the extent to which a vacancy is a genuine vacancy It is the opinion of Hay Group that vacancy savings that occur in the period between one employee leaving a position and another employee filling that position are genuine vacancy savings and the Agency should have the flexibility to utilize those salary dollars

58© 2010 Hay Group. All rights reserved State of ND Eval of Comp System Final Report Oct 2010.pptx
Component AnalysisVacancy Savings
What Was FoundThe issue that needs to be addressed in State Governments is the determination of the basis of the funding vacant positions that, in some cases, have been vacant for several years. Hay Group does not have data from this project to make specific comments on whether this is the case in the State. However, the current economic and budgetary challenges are causing an increased focus on this issue in both the Legislative and Executive Branches
This should minimize the focus on whether vacancy savings should be “retained or returned,” which is an “after the fact” consideration and put the focus on the funding of the appropriate number of positions, which is a “front end” consideration

59© 2010 Hay Group. All rights reserved State of ND Eval of Comp System Final Report Oct 2010.pptx
Summary of Analyses
A summary of that analysis on pages 19-58 in the previous section of this report is as follows:
1. Compensation Philosophy
− While Chapter 54 of the North Dakota Code has some statements about compensation policies, roles and relationships, there is no clear statement of a Compensation Philosophy
2. Methods of Classification and Job Evaluation
− While the methods, processes and forms used are sound, there are opportunities for enhancements which will simplify the process and hence, speed up the process
− Compression in allocation of classifications to grades exists due to the fact that while there are 20 grades, only 14 are primarily used. This also creates internal equity issues as classifications which are perceived to be different in job content are placed in similar grades
60© 2010 Hay Group. All rights reserved State of ND Eval of Comp System Final Report Oct 2010.pptx
Summary of Analyses
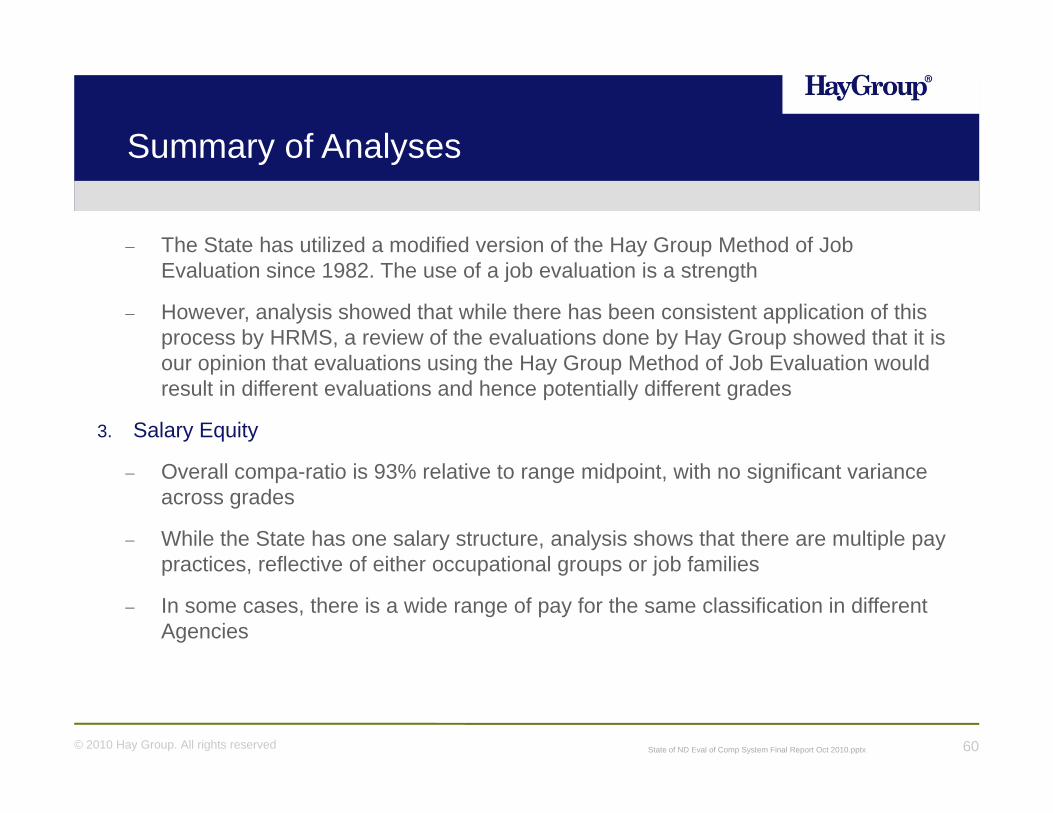
− The State has utilized a modified version of the Hay Group Method of Job Evaluation since 1982. The use of a job evaluation is a strength
− However, analysis showed that while there has been consistent application of this process by HRMS, a review of the evaluations done by Hay Group showed that it is our opinion that evaluations using the Hay Group Method of Job Evaluation would result in different evaluations and hence potentially different grades
3. Salary Equity
− Overall compa-ratio is 93% relative to range midpoint, with no significant variance across grades
− While the State has one salary structure, analysis shows that there are multiple pay practices, reflective of either occupational groups or job families
− In some cases, there is a wide range of pay for the same classification in different Agencies

61© 2010 Hay Group. All rights reserved State of ND Eval of Comp System Final Report Oct 2010.pptx
Summary of Analyses (cont’d)
4. Market Definition and Pay Ranges
− The current market definition is loosely defined, has been the focus of debate in recent years and is not aligned with the competitive talent needs of the State
− The definition of the market needs to be driven by the State’s compensation philosophy, not by just geography considerations
− The current salary ranges are stated as being set at 5% below the average of the market. However, Hay Group analysis shows that midpoints range from 10% below the market to 3% above the market
− Levels of competitiveness must be viewed in conjunction with compa-ratio analysis
− There are a number of classifications where the State’s average pay lags the market by more than 15%
− The State utilizes wide pay ranges. This, coupled with the midpoint being set at 95% of the currently defined market, places a significant need to have strong processes for moving employees through their salary ranges

62© 2010 Hay Group. All rights reserved State of ND Eval of Comp System Final Report Oct 2010.pptx
Summary of Analyses (cont’d)
5. Fringe Benefits
− The State offers a sound, comprehensive and cost-effective benefits program with the healthcare and retirement programs being its strength and the Life and Disability programs being less competitive
− It is the opinion of Hay Group that this program does not need significant changes and the focus of changes as an outcome of this review should be on the classification and compensation components
6. Recruitment and Retention Tools
− The use of recruitment bonuses is a positive feature of the State’s program and has helped the State in its recruitment process
− Similar to the recruitment bonus, the retention bonus is a positive feature
− The performance management process of the State is sound and Hay Group was impressed with the strength of the performance metrics being used. Agencies show a real commitment to agency and employee performance

63© 2010 Hay Group. All rights reserved State of ND Eval of Comp System Final Report Oct 2010.pptx
Summary of Analyses (cont’d)
7. Budget Appropriation Process
− The OMB has a sound and well documented compensation planning process and schedule
− The salary budgeting process takes into consideration various analyses such as internal equity, relativity to market, market movement, etc
− Once budgets and appropriations have been approved by the Legislature, funding is appropriated on what Hay Group refers to as a “bulk funding” basis. Hay Group commends this approach as it reinforces the accountability of Agency leadership to manage all their resources
− The focus of attention in the future should be on determining whether funding should be based on current employee costs vs. midpoint budgeting and the extent to which vacancies are included in the budgeting process
64© 2010 Hay Group. All rights reserved State of ND Eval of Comp System Final Report Oct 2010.pptx
Summary of Analyses (cont’d)
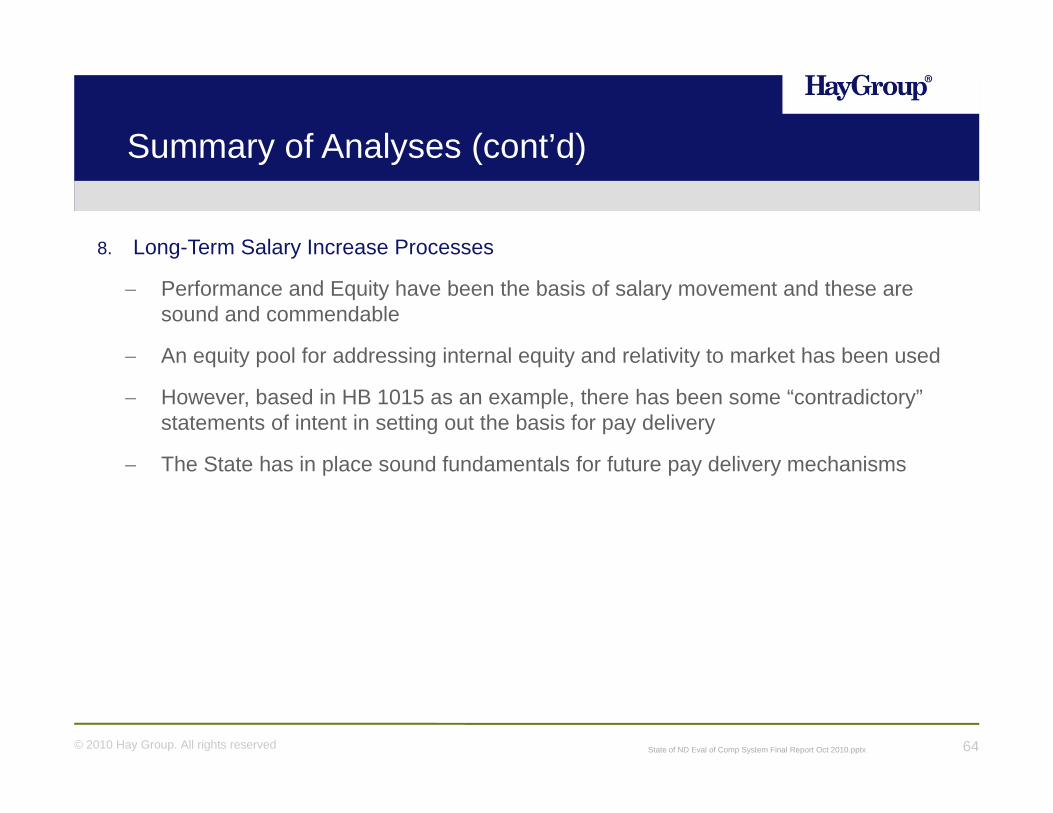
8. Long-Term Salary Increase Processes
− Performance and Equity have been the basis of salary movement and these are sound and commendable
− An equity pool for addressing internal equity and relativity to market has been used
− However, based in HB 1015 as an example, there has been some “contradictory” statements of intent in setting out the basis for pay delivery
− The State has in place sound fundamentals for future pay delivery mechanisms

65© 2010 Hay Group. All rights reserved State of ND Eval of Comp System Final Report Oct 2010.pptx
Summary of Analyses (cont’d)
9. Vacancy Savings
− The primary use of vacancy savings is for the purpose of paying off leave balances (annual/sick leave) for employees who leave and/or retire
− It is also used for operational costs such as vehicles, employee contractor pay, overtime; funding recruiting, retention, and performance bonuses; and market equity adjustments
− The issue that needs to be addressed in State Governments is the determination of the basis of the funding vacant positions that, in some cases, have been vacant for several years. Hay Group does not have data from this project to make specific comments on whether this is the case in the State. However, the current economic and budgetary challenges are causing an increased focus on this issue in both the Legislative and Executive Branches. This should minimize the focus on whether vacancy savings should be “retained or returned,” which is an “after the fact” consideration and put the focus on the funding of the appropriate number of positions, which is a “front end” consideration

66© 2010 Hay Group. All rights reserved State of ND Eval of Comp System Final Report Oct 2010.pptx
Recommendations
Set out in this Section is a list of actions that Hay Group recommends be taken to enhance the current Classified Employee compensation system. The following has been taken into consideration in preparing these actions:
It is the opinion of Hay Group that the current system is not broken and the recommendations made can be done within the current system
One exception to the above is the need to develop a Statement of Compensation Philosophy. The content and adoption of such a statement may have an impact on the recommended actions as what needs to be addressed within the 10 components reviewed must be done within the context of the Statement of Compensation Philosophy
Hay Group wants the value of taking actions to be known, rather than just a series of recommendations. Accordingly, the expected outcomes of taking actions is shown for each action. This will also enable Legislative and Executive Branch leadership to be able to measure the degree of success of the implementation of the recommended actions
Hay Group welcomes the opportunity to partner with the State in developing a game plan and then implementing that game plan

67© 2010 Hay Group. All rights reserved State of ND Eval of Comp System Final Report Oct 2010.pptx
Recommendations (cont’d)
Project Component Work to Be Done Outcomes PriorityA State compensation philosophy statement
Develop a Compensation Philosophy that serves as an umbrella statement, linking compensation to the State’s Mission, Vision, Values and its human resources objectives
The Compensation Philosophy statement should include:
• Definition of the market
• Definition of compensation
• Definition of how pay ranges will be established
• Definition of how pay will move
• Definition of roles and accountabilities
• Definition of what will be stated in code, policy, procedure, etc.
Involve key leadership from the Legislative and Executive Branches in the development of the Compensation Philosophy
• Sets the Legislative intent for the State’s compensation system and program
• Increased consistency across the State, as all compensation decisions will be made according to the philosophy statement
• Creation of a more balanced approach to compensation by ensuring budgeting and pay administration decisions take into consideration both an external (market) and internal (internal equity and performance) factors
• Establishes the appropriate balance between centralization and decentralization of compensation plan administration
• Creates a framework within which to consider total reward
• Clearly states the roles and accountabilities of the Legislative and Executive Branches of government
Must Do

68© 2010 Hay Group. All rights reserved State of ND Eval of Comp System Final Report Oct 2010.pptx
Recommendations (cont’d)
Project Component Work to Be Done Outcomes PriorityMethods used to develop and determine classifications
Simplify/Modify the overall Classification/ Reclassification Process (e.g., how decisions are made, constituency of decision-makers, accountability and responsibility of the State Personnel Board)
• Creation of a classification/reclassification committee that includes agency and HRMS staff. Agency representatives would be comprised of both HR and non-HR staff
• Less complicated
• Quicker decisions
• Increased fairness
• Enhanced partnership between agencies and HRMS
• Classification/Reclassification decisions will have a stronger link the job evaluation methodology (i.e., sound decision making) rather than subjective whole job comparisons
Should Do
Revise/Modify Classification/Reclassification Forms • Streamlined forms depending on the “type” of review request
• Stronger link to the information required for a decision
• Greater input from the employee versus the supervisor
Should Do
Revise Classification Specifications:
• Duties/responsibilities should increase in complexity within a series. “Duties Performed At All Levels” is at times inaccurate as some of these duties are performed at higher levels
• Review minimum qualifications for appropriateness
• Remove “Class Evaluation” section
• Greater clarity of the duties/responsibilities performed at the first level within a series
• Stronger link between minimum qualifications and actual responsibilities performed
• Employees or Agency Authorities can no longer misinterpret or use the “Class Evaluation” to influence a reclassification decision
Should Do
Communication/education on the new process Positive perceptions of the process – perceived as sound and fair Should Do

69© 2010 Hay Group. All rights reserved State of ND Eval of Comp System Final Report Oct 2010.pptx
Recommendations (cont’d)
Project Component Work to Be Done Outcomes PriorityMethods to minimize salary inequities both within an agency and within State government
Job Evaluation training for HRMS job evaluators and classification/reclassification committee members
• Authorized users of the Hay Guide Chart-Profile Method of Job Evaluation
• Consistency and calibration of methodology and application
Must Do
Benchmark job evaluation review and refinement • Defined benchmark framework of classified positions to serve as internal equity comparisons for non-benchmark jobs
Must Do
Review of non-benchmark classifications & develop a revised classification schema
• All classifications are appropriately evaluated and leveled to ensure internal equity across the State
• Decrease in the number of classification requests
• Classification schema is used to support or assist in classification/reclassification decisions and to ensure integrity of the system is maintained overtime
Must Do
Identify “catch all” classifications to assess appropriateness
• Broad classifications represent a similar level of work performed
• Truly different jobs are reclassified to ensure levels of complexity are recognized in the classification system
Should Do
Identify jobs that are unique to an agency (a core part of the service they provide) to assess appropriateness of state-wide classifications
• Core service jobs for an agency are appropriately classified
• Increased Agency capability to recruit and retain key agency jobs
Should Do

70© 2010 Hay Group. All rights reserved State of ND Eval of Comp System Final Report Oct 2010.pptx
Recommendations (cont’d)
Project Component Work to Be Done Outcomes PriorityMethods used to set pay grade minimums, maximums, and midpoints
AND
Appropriate market comparisons
Grade structure redesign & grade re-assignment of benchmark and non-benchmark classifications
• Reduce compression and create more “distance” between levels of work (analogy: the current compressed, accordion-like structure will be expanded)
• Enhanced internal equity (jobs that require the same level of knowledge, complexity, and accountability are in the same grade)
• Grade structure in which all the grades are available for use
Must Do
Custom salary survey & market analyses for the “local” market
• Discontinue or limit use of the Job Service ND Labor Market Survey
• Appropriate “local” comparator market to establish the foundation (in addition to other state comparisons) for the pay strategies
• Increased number and/or quality of job matches to salary survey data
Must Do
Identify Job Family/Occupational groups that require different pay strategies from “general” pay classifications
• Discontinued use of a “one size fits all” salary structure to one that recognizes different pay markets for certain Job Family/Occupational groups
• Increased ability to identify and address internal equity issues
Must Do
Develop salary ranges for the “general” pay structure and the Job Family/Occupational group structure(s)
• Enhanced recruitment and retention efforts
• Increased market competitiveness Must Do
Decrease width of the salary ranges and perform cost-to-implement analyses
• Enhanced recruitment efforts
• Enable competent employees to reach market target within a reasonable timeframe
• Inform the budgeting process
Must Do
Perform an State-wide, Agency, and Job Family/Occupational group internal equity analyses against the new pay strategies to develop a more detailed implementation plan
Enable HRMS staff to provide direct advice and guidance to the agencies on ways to address implementation and internal equity issues Should Do

71© 2010 Hay Group. All rights reserved State of ND Eval of Comp System Final Report Oct 2010.pptx
Recommendations (cont’d)
Project Component Work to Be Done Outcomes Priority
Fringe benefits
Increase basic life insurance benefit from current level of $1,300 to 1 times pay (or a flat dollar benefit of at least $25,000)
More competitive benefit will provide adequate coverage for basic expenses.
Must Do
Consider implementing a separate long term disability benefit outside the pension plan.
If defined benefit plan is modified in the future, a separate LTD program will be easier to administer and communicate to employees. Should Do
Consider introducing premium contributions toward health care
Rather than using plan design elements (copayments, deductibles, etc.) exclusively to increase employee cost share, a balanced approach of using plan design and premiums provides more flexibility to the State and is more in line with market practice. Should Do

72© 2010 Hay Group. All rights reserved State of ND Eval of Comp System Final Report Oct 2010.pptx
Recommendations (cont’d)
Project Component Work to Be Done Outcomes Priority
Recruitment and retention tools
Develop more detailed guidelines and amounts for the Recruitment and Retention Bonuses
Consistent application of the use of recruitment and retention bonuses across Agencies Should do
Define the “type” of performance (e.g., performance of core job responsibilities or achievement of specific goals or areas of desired discretionary effort) to be recognized and rewarded through a Performance Bonus
The same “type” of performance is being recognized and rewarded across the State
Should Do
Review the dollar cap for the Performance Bonus and consider performance amounts that are commensurate with the job level (classifications with higher requirements for knowledge, complexity and accountability might receive a larger amount than those with lower requirements)
• To help create a performance based culture there needs to be performance goals that are aligned with the level of contribution a job provides to State, Department, etc objectives. The achievement of these goals also need to be rewarded according to the level of contribution
• Support internal equity. A smaller job with lower level contribution receives a different payout than a larger job with a higher level of contribution. Currently, every job could receives the same amount
Should Do
HRMS to continue to consult with agencies on the utilization of non-monetary rewards for retention efforts
Increase retentionShould Do
Develop a targeted retention program for those employees that have between 3-5 years of service
Increase retention and lower costs associated with recruiting, hiring and training new employees Nice To Do

73© 2010 Hay Group. All rights reserved State of ND Eval of Comp System Final Report Oct 2010.pptx
Recommendations (cont’d)
Project Component Work to Be Done Outcomes PriorityMethods of developing and sustaining a consistent long-term salary increase administration policy for state government, including cost-of-living increases, across-the-board increases, merit increases, equity increases, and performance increases
Continue to utilize two key components: performance and equity for movement of pay. However, going forward, fund pay movement through one pot of money rather than two separate allocations of funds. This will allow a greater linkage between relativity to market and performance, it is recommended that the following principles be applied:
• for positions which are below market target, both a market adjustment and a performance payment be made;
• for positions where the incumbent is above market target, a performance payment be made; and
• for positions which are high in their salary range, the performance payment may be made with a mix of base salary and lump sum payment
This concept is illustrated on page 75
Agencies will be better able to administer pay in a way that recognizes both equity and performance
The Legislature will know that the salary dollars appropriated are being distributed in accordance with its philosophy and within the fiscal parameters it has established
Must Do

74© 2010 Hay Group. All rights reserved State of ND Eval of Comp System Final Report Oct 2010.pptx
Recommendations (cont’d)
Project Component Work to Be Done Outcomes PriorityA budget and appropriation process for providing funds to agencies to administer the state's salary increase policy
Communicate appropriated funds as a dollar amount rather than a percentage
• Agencies will no longer have to “battle” the expectation that every employee will receive the appropriated % increase
• Agencies will have an easier time in adopting the Performance to Equity Matrix
Must Do
Fund employee salary increases at the beginning of the budget and appropriation process
Sends a strong message regarding the State’s commitment to its largest investment, being its employees
Should Do
The appropriate use of funding available within agency budgets from accumulated savings resulting from vacant positions and employee turnover. Focus is only on Salary Savings during the year
Fund annual/sick leave Funding for what is a known commitment of the StateMust Do
Define “vacancy” positions. It is Hay Group’s opinion that the period between one employee leaving a position and another employee filling that position constitutes genuine vacancy savings and the Agency should have the flexibility to utilize those salary dollars
Clarifies what is a genuine vacancy saving and continues the practices of allowing Agencies to be accountable for managing their resources
Should Do

75© 2010 Hay Group. All rights reserved State of ND Eval of Comp System Final Report Oct 2010.pptx
Recommendations (cont’d)
Relativity to Market Policy Position % Increase Level of
Performance%
Increase
100% or Above 0%Exceeds
Expectations6%
92.1 – 99.9% ofMarket Target
1%+ Achieves
Expectations4%
= Increase
Less than 92%Below Market Policy Position
2% Needs Improvement 0%
Illustrative Only

APPENDICES

State of North Dakota – Classification/Reclassification Process Flow

78© 2010 Hay Group. All rights reserved State of ND Eval of Comp System Final Report Oct 2010.pptx
Component AnalysisMethods of Classification

79© 2010 Hay Group. All rights reserved State of ND Eval of Comp System Final Report Oct 2010.pptx
0
20
40
60
80
100
120
140
160
0 100 200 300 400 500 600 700 800
US
Do
llars
($00
0)
State of NDCurrent Base Salary Policy & Practice - All Employees
Practice
Pay Grade MP
125%
Pay Grade 3 4 5 6 7 8 9 10 11 12 13 14 15 16 17 18 19
75%
Policy
The graph reflects the internal relationship of actual pay to the current salary ranges
Component AnalysisSalary Inequities
80© 2010 Hay Group. All rights reserved State of ND Eval of Comp System Final Report Oct 2010.pptx
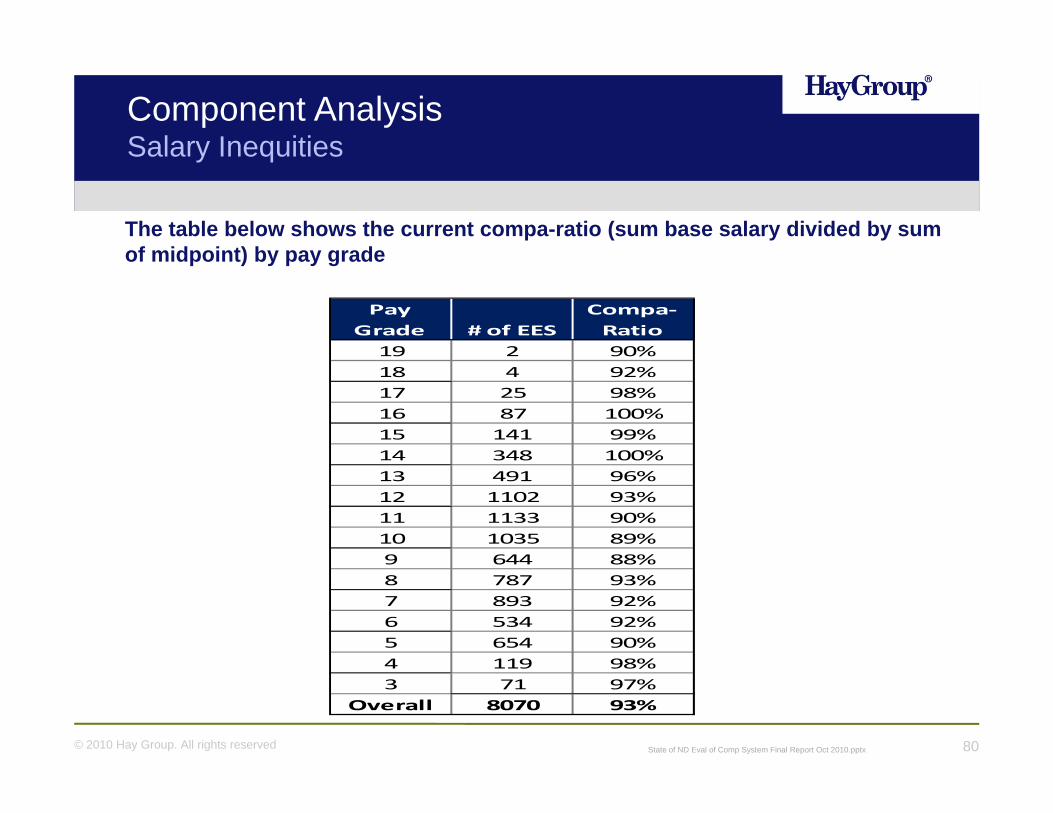
The table below shows the current compa-ratio (sum base salary divided by sum of midpoint) by pay grade
PayGrade # of EES
Compa-Ratio
19 2 90%18 4 92%17 25 98%16 87 100%15 141 99%14 348 100%13 491 96%12 1102 93%11 1133 90%10 1035 89%9 644 88%8 787 93%7 893 92%6 534 92%5 654 90%4 119 98%3 71 97%
Overall 8070 93%
Component AnalysisSalary Inequities

81© 2010 Hay Group. All rights reserved State of ND Eval of Comp System Final Report Oct 2010.pptx
0
20
40
60
80
100
120
140
160
0 100 200 300 400 500 600 700 800
US
Do
llars
($00
0)
State of NDCurrent Base Salary Practice - 3 Lines
Middle
Eval Points
High
Low
Internal pay practices revealed that the State has three distinct pay line groups:
Premium pay line:− Job families including
IT, Engineering, Legal, Labor, Nursing, and Pharmaceutical were identified as market premium positions (PGE) for at least some grade levels
General pay lineDiscounted pay line:−Social Services and Education job families show a discounted pay practice
Component AnalysisMarket Definition and Pay Ranges

82© 2010 Hay Group. All rights reserved State of ND Eval of Comp System Final Report Oct 2010.pptx
0
20
40
60
80
100
120
140
0 100 200 300 400 500 600 700 800
US
Do
llars
($00
0)
State of NDCurrent Base Salary Practice
Eval Points
Admin
Custodial, FS, Laundry
Education
EngineeringIT
Labor
Legal
Attorneys
Maint Supv IILegal
Medical
Pharmacist I
Pharmacist II
Dental Hyg
Dental Asst
Physician Asst
RN I
Ntl Res
Public Safety
Social Services
Plumber III
Plumber IIPlumber I
Electrician IIElec Tech III
The graph reflects a linear depiction of the State’s average pay by position within the occupational groups/job families
Positions paid high, in comparison, are plotted
Component AnalysisSalary Inequities

83© 2010 Hay Group. All rights reserved State of ND Eval of Comp System Final Report Oct 2010.pptx
0
20
40
60
80
100
120
140
160
0 100 200 300 400 500 600 700 800
US
Do
llars
($00
0)
State of NDCurrent Base Salary Practice - Department of Transportation
Practice
Eval Points
+20%
-20%
The graph reflects the internal relationship of actual pay to the regressed practice for the 1,047 employees in the Department of Transportation
Component AnalysisSalary Inequities
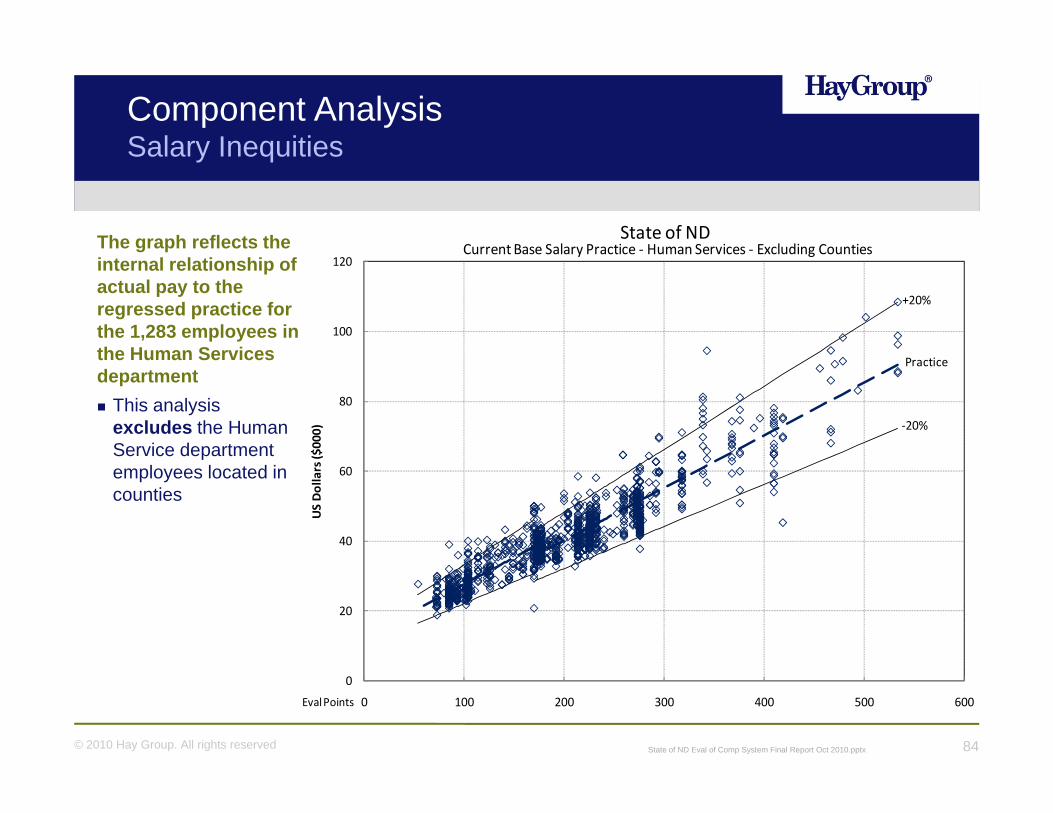
84© 2010 Hay Group. All rights reserved State of ND Eval of Comp System Final Report Oct 2010.pptx
0
20
40
60
80
100
120
0 100 200 300 400 500 600
US
Do
llars
($00
0)
State of NDCurrent Base Salary Practice - Human Services - Excluding Counties
Practice
Eval Points
+20%
-20%
The graph reflects the internal relationship of actual pay to the regressed practice for the 1,283 employees in the Human Services department
This analysis excludes the Human Service department employees located in counties
Component AnalysisSalary Inequities

85© 2010 Hay Group. All rights reserved State of ND Eval of Comp System Final Report Oct 2010.pptx
The Administrative Assistant I was also compared across agencies. The sample has a 65% spread from high to low
(0041) Administrative Assistant I
Agency # of EesAverage
Annual Pay Agency (cont'd) # of EesAverage
Annual Pay
Department of Agriculture 1 $36,384 Parks & Recreation Department 1 $28,208
Barley Council 1 $34,068 Human Services 99 $28,134
Secretary of State's Office 1 $32,280 Developmental Center (DHS) 4 $27,666
Department of Transportation 9 $32,051 Attorney General's Office 5 $27,456
Information Technology Department 2 $31,980 Veterans Home 1 $27,331
Highway Patrol 12 $31,573 Protection & Advocacy Project 1 $27,228
Land Department 3 $31,094 Job Service 9 $27,055
Workforce Safety & Insurance 19 $30,727 Fair Association 1 $27,039
Soybean Council 1 $30,703 Department of Public Instruction 3 $26,924
Game & Fish Department 8 $30,213 Veterans Affairs Department 1 $26,680
Water Commission 3 $30,192 Health Department 20 $26,525
Human Services-Counties 31 $29,554 Retirement & Investment Office 1 $26,484
Bank of North Dakota 6 $29,445 Department of Corrections & Rehabilitation 1 $25,740
Adjutant General/National Guard 2 $29,106 School for the Blind (DPI) 2 $24,534
Historical Society 2 $29,100 Penitentiary (DOCR) 3 $24,468
Youth Correctional Center (DOCR) 7 $29,076 Public Employees Retirement System 3 $24,228
State Hospital (DHS) 6 $28,902 Housing Finance Agency 1 $24,156
OMB - Central Services Division 2 $28,308 State Library (DPI) 1 $22,020
Tax Department 2 $28,224
Component AnalysisSalary Inequities

86© 2010 Hay Group. All rights reserved State of ND Eval of Comp System Final Report Oct 2010.pptx
The Registered Nurse II (24% spread) and Correctional Officer II (33% spread) were also compared across agencies
(3062) Registered Nurse II (5112) Correctional Officer II
Agency # of EesAverage
Annual Pay Agency # of EesAverage Annual
Pay
Workforce Safety & Insurance 16 $52,045 Department of Corrections & Rehabilitation 1 $43,104
Developmental Center (DHS) 5 $51,616 Penitentiary (DOCR) 79 $35,227
State Hospital (DHS) 33 $50,430 Parole & Probation Department (DOCR) 15 $35,194
Veterans Home 7 $48,136 James River Correctional Center (DOCR) 75 $32,452
Human Services 34 $44,103
Department of Corrections & Rehabilitation 16 $43,733
Health Department 1 $42,012
Component AnalysisSalary Inequities

87© 2010 Hay Group. All rights reserved State of ND Eval of Comp System Final Report Oct 2010.pptx
$0.0
$20.0
$40.0
$60.0
$80.0
$100.0
$120.0
$140.0
0 100 200 300 400 500 600 700 800
Ann
ual D
olla
rs ($
000)
Pay Grade Middle Points
Market-Central States
Legal
IT
Admin
Custodial, FS, Laundry
Education
Engineering
Labor
Ntl Res
Medical
Social Service
Pharmacist IAttorney I
PS
Pharmacist II
179 classifications were matched to the Central States markets
Component AnalysisMarket Definition and Pay Ranges

88© 2010 Hay Group. All rights reserved State of ND Eval of Comp System Final Report Oct 2010.pptx
$0.0
$20.0
$40.0
$60.0
$80.0
$100.0
$120.0
$140.0
0 100 200 300 400 500 600 700 800
An
nu
al D
olla
rs ($
00
0)
Pay Grade Middle Points
Market-Job Service
Legal
IT
Admin
Custodial, FS, Laundry
Education
Engineering
Labor
Ntl ResPublic Safety
Medical
Social Service
Pharmacist II
Pharmacists I
Phys Asst
Attorney II
Maint Supv II
Research Analyst III
Trng & Devp Admin
Research Analyst II
Attorney III
230 classifications were matched to the Job Service market
Component AnalysisMarket Definition and Pay Ranges

89© 2010 Hay Group. All rights reserved State of ND Eval of Comp System Final Report Oct 2010.pptx
The State’s average pay lags the Job Service market for the following classifications or groups of classifications by more than 15%
Component AnalysisMarket Definition and Pay Ranges
− Programmer Analyst II and III− Computer and Network Spec II− Medical Clms Proc Spc III− Account/Budget Spec II− Auditor II and III− Financial Inst Exmnr II and III− Purchasing Agent I− State Procurement Officer I and II− Attorney II and III− Human Resource Officer I− Training & Development Admin− Research Analyst II and III− Archivist I− Transportation Engineer II− Environmental Engineer II and III
− Hydrologist II and III− Planner III− Geologic Map Tech II− Registered Nurse II− Physical Therapist− Occupational Therapist− Identification Tech I and III− Correctional Officer I− Environ Scientist II and III− Agri Marketing Spec I and II− Custodial Supervisor I and II− Heating Plant Operator II− Maintenance Workers & Supervisors− Electronics Technician I, II and III− Printing Equip Op II and III

90© 2010 Hay Group. All rights reserved State of ND Eval of Comp System Final Report Oct 2010.pptx
The State’s average pay lags the Central States 10 State market for the following classifications or groups of classifications by more than 15%
Those positions also falling low to the Job Service Market are in bold font
Component AnalysisMarket Definition and Pay Ranges
− Systems Administrator III− Policyholder Clms Invest− Library Associate II− Librarian III− Historic Site Supv III− Archivist I− Environmental Engr III− Hydrologist II− Public Hlth Nurse Cons I− Physical Therapist− Occupational Therapist− Forensic Scientist II
− Epidemiologist II− Veterinarian I− Human Svc Prgm Admin III− Behavioral Health Tech I− Direct Training Tech II− Human Relations Couns− Voc Rehab Couns II− Appeals Referee− Weights & Measures Insptr− Agr Marketing Spec II− Cook I

91© 2010 Hay Group. All rights reserved State of ND Eval of Comp System Final Report Oct 2010.pptx
ND Job Code ND Title
Pay Grade
Eval Grade
ND Job Code ND Title
Pay Grade
Eval Grade
0146 ENTERPRISE SOFTWARE DEV MGR 15 14 8205 BRICKLAYER, MAINTENANCE 10 80178 ENTERPRISE IT ARCHITECT 15 14 8209 GEN TRADES MAINT WKR I 8 40179 ARCHITECT ASSOCIATE 14 13 8210 GEN TRADES MAINT WKR II 9 60180 ENT NETWORK OPERATIONS MGR 14 13 8211 PAINTER I 7 30196 ENT INFO SYS SECURITY ADMIN 15 14 8212 PAINTER II 8 40404 SUPERVISING EXAMINER 15 13 8213 PAINTER III 9 60405 CHIEF EXAMINER 16 15 8221 CARPENTER I 7 40468 SENIOR INS CO EXAMINER 12 12 8222 CARPENTER II 8 61015 SIGN LANGUAGE COMM FACILITATOR 8 6 8223 CARPENTER III 9 71016 SIGN LANG INTERPRETER 9 7 8225 NDSH CONST/MNTNC SUPERVISOR 11 103018 PHYSICIAN ASSISTANT 15 14 8231 PLUMBER I 9 43020 NURSE PRACTITIONER 15 14 8232 PLUMBER II 10 73123 PHYSICAL THERAPIST 14 12 8233 PLUMBER III 12 93125 DIR OF PHYSICAL THERAPY 15 14 8241 ELECTRICIAN I 9 43133 OCCUPATIONAL THERAPIST 13 12 8242 ELECTRICIAN II 10 73135 DIR OF OCC THERAPY 15 14 8243 ELECTRICIAN III 12 93261 PHARMACIST I 16 12 8261 SYSTEMS MECHANIC I 8 43262 PHARMACIST II 17 14 8262 SYSTEMS MECHANIC II 10 73326 DENTAL HYGIENIST 13 9 8263 SYSTEMS MECHANIC III 11 98111 HEATING PLANT OPERATOR I 8 5 8291 ELECTRONICS TECHNICIAN I 8 68112 HEATING PLANT OPERATOR II 9 7 8292 ELECTRONICS TECHNICIAN II 10 78121 HEATING PLANT SUPV I 10 8 8293 ELECTRONICS TECHNICIAN III 12 88122 HEATING PLANT SUPV II 12 10 8415 ROTARY DRILL OPERATOR 12 10
Current Pay Grade Exceptions
Component AnalysisMarket Definition and Pay Ranges

92© 2010 Hay Group. All rights reserved State of ND Eval of Comp System Final Report Oct 2010.pptx
Market analysis revealed the following positions experience a market premium compared to other jobs of similar size
Component AnalysisMarket Definition and Pay Ranges
− Pharmacist I− Pharmacist II− Plumber III− Plumber II− Plumber I− Electrician III− Electrician II− Electronics Technician III− Electronics Technician II− Electronics Technician I
− Nurse Practitioner− Psych Clinical Nurse Spec*− Registered Nurses*− Dental Hygienist− Dental Assistant*− Physician Assistant− Administrative Law Judge*− Attorney III*− Attorney II*− Attorney I*
* Theses Classifications are not currently included in the State’s list of Pay Grade exceptions.

93© 2010 Hay Group. All rights reserved State of ND Eval of Comp System Final Report Oct 2010.pptx
Component AnalysisLong-Term Salary Increase
Mechanism Descript ion 2003 2004 2005 2006 2007 2008 2009 2010Summary2003-2010
EQY Equity Increase per Administrative Rules 4-07-02 229 300 939 540 827 1,269 315 14 4,433GEN General Increase - no longer used, replaced by LGE & LGP 7 2 5,119 5,522 2,589 4,680 1,862 1 19,782
LGELegislative General Increase Equity - used when the agency prioritizes equity in distribution of a general increase 0 0 0 0 2,254 444 1,225 0 3,923
LGPLegislative General Increase Performance - used when the agency prioritizes performance in distribution of a general increase 0 0 0 0 2,170 1,589 4,759 2 8,520
MEF Market/Equity Fund - increases distributed from a Market/Equity Fund 0 0 0 0 5,053 1 4,272 0 9,326MER Merit - Performance based increase per Administrative Rules 4-07-02 66 762 424 331 324 316 216 54 2,493OTH Other - intended when an increase does not fit another category 214 359 127 151 430 144 211 11 1,647PRO Promotion Increase per Administrative Rules 4-07-02 52 63 101 173 191 189 189 21 979REC Job Reclassification Increase per Administrative Rules 4-07-02 0 19 90 49 46 49 29 25 307RED Reduction in Pay 60 75 82 79 127 115 117 27 682RES Responsibility/Workload Increase per Administrative Rules 4-07-02 208 684 565 1,173 386 484 276 58 3,834TMP Temporary Increase per Administrative Rules 4-07-02 34 49 74 63 73 103 113 6 515
Total: 870 2,313 7,521 8,081 14,470 9,383 13,584 219 56,441
Employee Movement Thru Ranges Trends for 2003-2010

94© 2010 Hay Group. All rights reserved State of ND Eval of Comp System Final Report Oct 2010.pptx
Component AnalysisLong-Term Salary Increase
Agency EQY GEN LGE LGP MEF MER OTH PRO REC RED RES TMP TotalAdjutant General 190 474 255 401 113 16 6 11 19 3 9 7 1,504Aeronautics Commission - 15 - - 6 2 - - - - 5 - 28Attorney General 86 512 1 143 229 - 102 10 26 3 25 3 1,140Bank of North Dakota 54 251 - 400 97 26 8 2 18 3 26 - 885Beef Commission - 1 - 3 - 2 - - - - - - 6Career and Technical Education 1 41 - 70 40 129 4 2 - - 3 - 290Corn Council - - - 1 - - - - - - - - 1Corrections & Rehab 506 2,336 573 - 1,159 6 49 288 83 136 345 22 5,503Council on the Arts 5 9 4 4 4 - - - - 1 - - 27Department of Agriculture 27 91 - 164 58 15 38 4 3 3 10 - 413Department of Transportation 920 3,781 1,529 1,109 1,518 862 135 100 5 30 1,733 35 11,757Dept of Financial Institutions 75 82 1 22 8 - - 29 - - 13 - 230Game and Fish Department 195 564 133 - 134 2 2 - 2 1 11 6 1,050Highway Patrol 305 652 160 - 253 442 88 18 7 6 101 1 2,033Historical Society 107 266 - 1 22 6 46 2 5 3 18 15 491Human Services 720 5,861 15 3,249 3,166 207 755 219 58 302 672 244 15,468Indian Affairs Commission - 4 - 8 1 - - - - - - - 13Industrial Commission 26 92 - 141 82 - 5 4 1 - 66 - 417Information Technology Dept 43 714 138 463 379 353 32 44 9 15 160 3 2,353Insurance Department 61 54 - 96 28 50 1 1 2 2 1 - 296Job Service 22 754 1 507 385 - 55 89 17 19 109 17 1,975Labor Commissioner 3 14 - 26 16 1 - 1 1 1 8 - 71Land Department 2 79 - 15 15 17 12 5 - 1 7 - 153Legal Counsel for Indigents 1 36 - 38 8 - - - - - 1 - 84Milk Marketing Board - 15 6 3 - 4 1 - - - 3 - 32
Employee Movement Thru RangePer Agency Trends (2003 - 2010)

95© 2010 Hay Group. All rights reserved State of ND Eval of Comp System Final Report Oct 2010.pptx
Component AnalysisLong-Term Salary Increase
Agency EQY GEN LGE LGP MEF MER OTH PRO REC RED RES TMP TotalND Barley Council - 2 - - - - - - - - - - 2ND Department of Health 268 477 892 318 390 - 67 58 - 17 189 20 2,696ND Horse Racing Commission - 5 - - - - - - - - 1 - 6ND Parks & Recreation 88 130 88 5 44 - 12 1 4 15 16 3 406ND Soybean Council 2 12 1 - - 3 1 - - - - - 19Office of Admin Hearings 4 24 1 2 3 11 5 - - - 1 - 51Office of Mgmt & Budget 157 228 26 314 165 3 34 10 4 7 90 11 1,049Protection and Advocacy 19 92 - 26 47 3 2 2 - - 1 - 192Public Employees Retire System 49 108 89 - 26 - 10 1 4 3 6 8 304Public Instruction 103 415 - - 161 1 29 4 7 60 27 66 873Public Service Commission 10 95 - 63 44 12 17 1 3 1 12 4 262School for the Blind 26 85 - - 29 - 5 - 2 3 3 4 157School for the Deaf 24 116 - 30 45 - 4 4 4 - 7 - 234Secretary of State 1 67 - 42 41 43 4 2 - - 2 - 202Securities Commissioner - 21 - 15 13 - - 1 - - - - 50Seed Department 15 101 - 31 29 55 2 - 3 - 2 - 238State Auditor 81 163 - 44 39 41 60 24 - - - - 452State Fair Association 23 - - 18 - 56 - 2 - - 2 - 101State Library - 74 - 53 53 - - 8 - - 7 - 195State Retir & Invest Office 14 40 - 29 13 - - - - 17 9 17 139State Tax Commissioner 17 216 - 346 208 115 32 11 10 18 60 26 1,059State Treasurer 3 16 - - 1 - 1 - - - - - 21State Wheat Commission - 18 - - - 6 1 - - - - - 25Tobacco Prev/Control Committee - - - - - - - - - - - - 0Veterans Affair Department - 24 - - 5 4 - - - - 4 1 38Veterans' Home 49 348 10 93 106 - 7 - 3 8 25 - 649Water Commission 129 126 - 227 143 - 14 6 3 3 18 - 669Workforce Safety & Insurance - - - - - - - 9 4 1 1 2 17Other Agenc iesChildrens Serv Coord Committee - - - - - - - - - - 1 - 1Emergency Services 2 81 - - - - 1 6 - - 24 - 114

96© 2010 Hay Group. All rights reserved State of ND Eval of Comp System Final Report Oct 2010.pptx
Component AnalysisLong-Term Salary Increase
Job* EQY GEN LGE LGP MEF MER OTH PRO REC RED RES TMP TotalACCOUNT TECHNICIAN II 26 189 23 107 85 15 3 6 4 4 30 9 501ACCOUNT/BUDGET SPEC III 17 103 24 45 42 15 9 2 - 11 26 9 303ADDICTION COUNSELOR II 82 227 5 84 110 11 39 - 1 29 15 24 627ADMIN ASSISTANT I 68 644 104 216 257 59 45 27 10 26 74 25 1,555ADMIN ASSISTANT II 66 429 85 184 187 75 29 13 5 12 70 22 1,177ADMIN ASSISTANT III 58 258 53 106 104 24 21 2 5 12 54 12 709ADMIN OFR I 17 107 14 75 44 16 12 6 5 2 18 1 317ADMIN OFR II 14 85 12 39 32 13 5 5 3 5 17 5 235ADMIN STAFF OFFICER I 27 102 18 42 50 16 3 3 5 12 22 9 309ADMIN STAFF OFFICER II 18 74 15 23 39 6 3 4 8 3 13 5 211ADMIN STAFF OFFICER III 9 54 10 18 19 18 3 2 - - 11 - 144ADVANCED CLINICAL SPEC 19 143 - 50 71 6 33 3 2 8 6 5 346AUDITOR I 12 11 1 10 6 6 24 6 1 - - - 77AUDITOR II 32 96 2 34 31 35 38 9 6 1 8 3 295AUDITOR III 20 83 4 96 75 24 6 11 6 4 10 2 341AUDITOR IV 28 98 4 44 37 15 12 6 - 2 13 4 263AUDITOR V 5 31 - 8 12 1 7 1 - - - - 65BEHAVIORAL HEALTH TECH I 25 30 - 102 36 - 27 1 10 4 29 - 264BEHAVIORAL HEALTH TECH II 99 218 1 381 249 1 67 7 27 23 82 - 1,155COOK I 16 102 1 70 67 5 36 - - 1 2 - 300CORRECTIONAL CASEWORKER 32 143 37 - 74 - - 27 - 8 16 1 338CORRECTIONAL OFFICER I 5 23 3 - 5 - 5 55 26 - 5 - 127CORRECTIONAL OFFICER II 147 627 157 - 320 - 1 64 23 46 84 2 1,471CORRECTIONAL OFFICER III 6 84 16 - 55 - - 22 1 1 6 1 192CORRECTIONAL OFFICER IV 7 16 5 - 5 - - 3 - 1 4 - 41
Employee Movement Thru RangePer Job Trends (2003 - 2010)

97© 2010 Hay Group. All rights reserved State of ND Eval of Comp System Final Report Oct 2010.pptx
Component AnalysisLong-Term Salary Increase
Job* EQY GEN LGE LGP MEF MER OTH PRO REC RED RES TMP TotalCUST SERVICE SPEC 10 177 - 123 107 - 10 9 2 6 10 6 460CUSTODIAN 33 116 9 107 65 1 12 - - 6 8 6 363DEV DISABIL CASEMGR II 10 216 1 64 115 7 3 1 - - - - 417DIRECT TRAINING TECH I 50 368 2 267 245 - 220 7 3 20 17 18 1,217DIRECT TRAINING TECH II 8 96 - 68 62 - 51 4 - 4 3 3 299ENGINEERING TECH II 2 43 13 20 7 22 1 3 - - 19 - 130ENGINEERING TECH III 42 114 31 45 29 29 5 2 - 1 40 - 338ENGINEERING TECH IV 47 203 68 63 98 49 7 4 - - 78 - 617ENVIRON SCIENTIST II 48 75 132 55 94 1 20 3 - 5 24 3 460EQUIPMENT OPERATOR II 14 693 240 16 218 176 24 10 - 3 467 1 1,862EQUIPMENT OPERATOR III 2 245 84 9 78 62 1 2 - 2 148 - 633HUMAN SVC PRGM ADMIN I 0 25 5 9 11 3 - - - 3 1 2 59HUMAN SVC PRGM ADMIN II 4 31 8 14 18 4 - 2 - 1 8 - 90HUMAN SVC PRGM ADMIN III 6 165 43 66 83 7 6 12 - 9 31 10 438HUMAN SVC PRGM ADMIN IV 7 207 15 66 95 11 3 13 - 14 20 13 464HUMAN SVC PRGM ADMIN V 12 115 20 29 48 6 2 11 - 8 30 9 290HUMAN SVC PRGM ADMIN VI 11 45 26 21 19 4 - 7 - 6 12 5 156HWY PATROL OFFICER I 21 18 - - 14 - 10 0 - 0 53 - 116HWY PATROL OFFICER II 255 337 87 - 125 263 40 7 - 5 47 1 1,167HWY PATROL SERGEANT 26 60 13 - 30 32 10 8 - - - - 179L P NURSE II 37 156 2 115 83 - 3 3 3 - 9 - 411MI CASEMANAGER II 44 361 - 102 181 8 7 3 0 15 8 19 748OFFICE ASSISTANT II 28 169 42 89 68 18 7 3 0 3 33 3 463OFFICE ASSISTANT III 49 509 58 207 209 56 25 9 3 11 80 9 1,225PAROLE & PROB OFFICER II 29 138 31 - 67 - 14 4 1 11 60 1 356PAROLE & PROB OFFICER III 19 75 17 - 40 - - 8 2 - 11 - 172PAROLE & PROB PRGM MGR 9 47 13 - 25 - 2 4 2 1 10 - 113

98© 2010 Hay Group. All rights reserved State of ND Eval of Comp System Final Report Oct 2010.pptx
Component AnalysisLong-Term Salary Increase
Job* EQY GEN LGE LGP MEF MER OTH PRO REC RED RES TMP TotalPROGRAMMER ANALYST I 6 54 10 31 23 20 1 4 - - 17 - 166PROGRAMMER ANALYST II 8 87 10 72 50 34 8 7 3 - 31 - 310PROGRAMMER ANALYST III 22 167 23 100 74 66 4 3 2 - 23 - 484REGISTERED NURSE II 72 244 16 143 89 3 5 9 - 22 25 11 639REGISTERED NURSE III 14 87 6 71 33 - - 5 - 1 2 1 220SOCIAL WORKER II 4 91 8 30 50 1 4 2 - 3 11 1 205SOCIAL WORKER III 9 116 - 25 48 6 6 2 1 5 11 4 233SR PROGRAMMER ANALYST 5 105 5 63 63 66 4 - 1 4 13 3 332TRANSPORATION TECHNICIAN I 234 233 99 218 101 54 1 - - 3 51 3 997TRANSPORTATION ENGR I 38 67 13 20 2 52 4 2 - - 2 - 200TRANSPORTATION ENGR II 50 113 62 39 44 21 6 5 2 - 65 - 407TRANSPORTATION ENGR III 62 214 112 71 101 49 5 6 - 3 110 3 736TRANSPORTATION PROJ MGR 63 130 59 47 67 15 5 9 - - 42 1 438TRANSPORTATION SRVCS SUPV 73 73 74 74 73 1 - 10 - - - - 378VOCATIONAL TRNG TECH 4 121 - 83 83 - 50 7 - - 2 - 350*Only Jobs with 300+ Occurrences Included in Analysis and Job Series with Significant Occurrence

BENEFITS REPORT

100© 2010 Hay Group. All rights reserved State of ND Eval of Comp System Final Report Oct 2010.pptx
Executive Summary
Hay Group’s review is based on benefits program information provided by the State in July of 2010 for its current FY benefit programs.Hay Group used two custom comparator groups consisting of 11 US States and 650 general market organizations contained in Hay Group’s Benefits Database.
* Colorado, Iowa, Kansas, Minnesota, Missouri, Montana, Nebraska, North Dakota, Oklahoma, South Dakota, Wyoming

101© 2010 Hay Group. All rights reserved State of ND Eval of Comp System Final Report Oct 2010.pptx
Benefits Methodology
Hay Group utilizes a proprietary actuarial valuation methodology to evaluate benefit plans in terms of the cash equivalence of the benefitsIn establishing a program’s overall market competitiveness the Hay Benefit Valuation model uses “standard cost assumptions” instead of a company’s specific costs, which eliminates the impact of such cost variables as demographics, geography, funding method, or purchasing power, etc.− The State’s health care premiums may be less in actual dollars than other
States; however, this is not a factor in determining program value under the Hay Group methodology.
The valuation model places a relative value on each specific feature of a benefit program. The value for each plan is then compiled to produce an overall program value appropriate for market comparison. In general, the more generous a particular feature is the higher the relative valueBenefit values are determined on an “Employer-paid” basis. Employer-paid benefit values are discounted to reflect the relationship of any required employee contributions to the program’s total value

102© 2010 Hay Group. All rights reserved State of ND Eval of Comp System Final Report Oct 2010.pptx
Death Benefits
The State provides a basic life insurance and AD&D plan that provides a flat dollar benefit of $1,300. Only 8% of the general market provides a flat dollar benefit, while 60% of the States do so.Most of the general market provides a benefit based on a uniform earnings multiple, such as 1x or 2x pay, with 1x pay as the most prevalent benefit level in the general market (44%). Most States provide a flat dollar benefit in the range of $14,000 to $50,000. The State’s low basic benefit is augmented by employee paid supplemental group life and AD&D plans that provide up to $200,000 in additional coverage. This type of benefit is provided by 88% of the general market and 90% of Central US States. The high prevalence among public sector organizations is due to the typically lower basic life benefit that is provided.

103© 2010 Hay Group. All rights reserved State of ND Eval of Comp System Final Report Oct 2010.pptx
Death Benefits
The State also provides employee-paid dependent group life with a maximum $100,000 spouse and $5,000 child benefit. − General market organizations typically provide $50,000 or more (58%) to spouses and
$10,000 (57%) to each child. − Central US States provide between $10,000 and $50,000 (60%) for spouses and
$10,000 (67%) to each child. The State’s death benefit program is not competitive when compared to either market. The $1,300 basic benefit is nearly equivalent to offering no benefit at all. The State’s supplemental coverage levels are competitive, but because they are at the employee’s expense, the overall value of the State’s death benefit is only marginally increased.

104© 2010 Hay Group. All rights reserved State of ND Eval of Comp System Final Report Oct 2010.pptx
Disability Benefits
The State provides a salary continuation plan only which provides benefits at full pay based on accumulation of days (12 days per year) with no maximum accumulation. This type of plan is provided by all state governments; however, 50% of the states combine salary continuance with an insured short term disability program. − 51% of the general market provides a salary continuance plan only and another
44% provide both a salary continuance plan and STD plan.− 50% of Central US States provides salary continuance plan only and 50% provide
both salary continuance and STD plans. General market organizations typically base the salary continuance on a uniform benefit (43%) and service schedule (27%), while 100% of Central US States base salary continuance on an accumulation of days, as the State does.40% of Central US States accrue 12 days of sick leave annually just as the State does, while 50% accrue 13 to 15 days per year. The State places no limit on the number of sick days an employee can accumulate, which is in line with Central US States (90%), while only 27% of the general market has no maximum accumulation of days.

105© 2010 Hay Group. All rights reserved State of ND Eval of Comp System Final Report Oct 2010.pptx
Disability Benefits
The State provides immediate eligibility as does 67% of Central US States, while only 50% of the general market group does.The State does not provide a stand along long term disability benefit (LTD), but rather, provides for disability benefits through the retirement plan. The benefit provides 25% of final average salary to disabled employees, subject to disability requirements. The benefit structure is not common in general market organizations, but is still seen in public sector organizations due to the continued high prevalence of defined benefit plans.− Most general market (77%) and Central US States (54%) provide employer paid
LTD− The benefit provided is typically 60% of pay (70% of general market and 80% of
Central US States). The State’s overall disability program is below market due primarily to the low long term disability benefit provided through the pension plan. Considered on its own, the short term disability benefit is also below market. The long term disability benefit structure is not in line with current market practice for either the general market or Central US States.

106© 2010 Hay Group. All rights reserved State of ND Eval of Comp System Final Report Oct 2010.pptx
Health Care Benefits
The State’s most prevalent plan is a PPO plan. A PPO plan is the most common for both comparator groups (68% general market and 50% for Central US States).The State pays the full premium and requires no contributions for single or family coverage. This feature puts the State above both markets.− 7% of general market employers and 40% of Central US States provide employer
paid coverage for single coverage. Only 3% of the general market and 0% of Central US States provide employer paid coverage for dependents.
− The most prevalent cost sharing range for employee coverage is 15% to 29% for the general market (56%) and less than 15% for the Central US States (60%).
− The most prevalent cost sharing range for dependent coverage is 15% to 29% for both markets (54% of the general market and 72% of Central US States).
65% of the general market and 50% of Central US States pay 90% or 100% for inpatient hospital, surgical, outpatient charges, while the State pays 80%. The State’s individual deductible of $400 is close to market when compared to both groups. 55% of the general market and 58% of Central US States have a deductible of $400 or less. The State’s $1,200 family deductible is proportional to the individual deductible, but is less competitive, as 57% of the general market and 71% of Central US States have a family deductible of $900 or less.

107© 2010 Hay Group. All rights reserved State of ND Eval of Comp System Final Report Oct 2010.pptx
Health Care Benefits
The State’s individual and family out of pocket maximums of $750 and $1,500, respectively, are above market. − 94% of the general market and 86% of Central US States have an individual
maximum of $1,000 or greater− 93% of the general market and 83% of Central US States have a family maximum
of $2,000 or greater. The State maintains a 3 tier prescription drug program, as do most general market and Central US States. However, the State also requires a prescription coinsurance – 15% generic, 25% brand formulary, 50% non-formulary – as well as a separate $1,000 out of pocket maximum, which is not common market practice. 33% of the general market and 78% of Central US States provide coverage to early and normal retirees, as the State does. The State shares the cost with retirees while only 17% of Central US States do. 61% of the general market shares the cost.

108© 2010 Hay Group. All rights reserved State of ND Eval of Comp System Final Report Oct 2010.pptx
Health Care Benefits
The State’s dental coverage is competitive with two exceptions:− The State’s annual benefit maximum of $1,000 is low. 67% of the general market
and 60% of Central US States have a maximum of $1,500 or greater.− Dental coverage is 100% employee paid. Only 10% of the general market and 20%
of Central US States are fully employee paid. Most share the cost – 71% of the general market and 60% of Central US States.
The State provides a separate vision plan, as do most general market employers and Central US States. The State’s health care program is at market due to the following:− No employee premium contributions (+)− Low annual out of pocket maximums (+)− 80% coinsurance (-)− Prescription coverage (-)− Employee paid dental (-)

109© 2010 Hay Group. All rights reserved State of ND Eval of Comp System Final Report Oct 2010.pptx
Retirement Benefits
Defined Contribution PlanThe State offers a 457 plan but does not make any employer contributions to the plan.
Defined Benefit PlanThe State offers a final average pay pension plan to employees. The plan requires employees to contribute 4%.The plan benefit is 2% of pay per year of service.
Retirement Program TrendThe trend towards defined benefit plan terminations continues, fueled more recently by the economic downturn. Many organizations across industries continue to restructure the overall design of their retirement programs and have begun to shift more attention to their defined contribution plans in an attempt to reduce costs. Efforts in this area often include reductions in the defined benefit formula (if applicable) in favor of higher employer contributions to the defined contribution plan

110© 2010 Hay Group. All rights reserved State of ND Eval of Comp System Final Report Oct 2010.pptx
Retirement Benefits
General market organizations typically provide a defined contribution plan with employer contribution only (60%), with only 30% providing both a defined contribution plan with employer contribution and a defined benefit plan. All Central US States provide a defined benefit plan and defined contribution plan. Half the group provides an employer contribution to the DC plan while the other half does not.The 3 year vesting schedule is better than both general market defined contribution plan vesting schedules and Central US States defined benefit plan schedules (5 years). As mentioned in the disability benefit section, the retirement plans provide employees with a disability benefit of 25% of salary, subject to disability requirements.The State’s retirement program is currently at market; however, there is increasing prevalence in the public sector of employer contributions to defined contribution plans, which will decrease the value of the State’s program in the future.

111© 2010 Hay Group. All rights reserved State of ND Eval of Comp System Final Report Oct 2010.pptx
Holiday and Vacation Program & Other Benefits
Holiday and Vacation ProgramThe State provides 10.5 paid holidays per year. 59% of the general market and 90% of Central US States provide 10 or more holidays. The State’s vacation schedule is competitive against both the general market and Central US States for employees at various stages of service. The 24 day maximum is at market.Accordingly, we have determined that the State provides a market competitive paid time off program.
Other BenefitsThe State provides health care and dependent care spending accounts to its employees. No tuition reimbursement or commuting assistance is provided to employees. Due to the low level of employer paid benefits in this category, the State is below market in comparison to the general market and Central US States.