state of new jersey office of the attorney general chris ... · office of the attorney general...
TRANSCRIPT
State of New Jersey
Office of the Attorney General Chris Christie Governor Kim Guadagno Lt. Governor
DEPARTMENT OF LAW AND PUBLIC SAFETY Juvenile Justice Commission
PO Box 107 Trenton, NJ 08625-0107
(609) 292-1400
Paula T. Dow Acting Attorney General
Veleria N. Lawson
Executive Director
JDAI ANNUAL DATA REPORT – 2009
The JDAI Annual Data Report follows, and presents information for the eleven New Jersey JDAI sites active throughout 2009. The report documents annual trends in key indicators of detention utilization, including admissions, length of stay (LOS), and average daily population (ADP). The report also describes trends regarding minority youth in detention, detention alternative utilization and outcomes, the reasons/acts for which youth are admitted to detention, and length of stay by the specific circumstances of release from detention. Taking into account all of these various measures, the 2009 Annual Data Report documents impressive changes in local detention systems – changes that are consistent with the application of JDAI core strategies and with the goal of safely reducing the unnecessary detention of New Jersey’s kids.
• Comparing the year prior to JDAI in each site to the current year, across all eleven sites average daily population has decreased by -42.9%. On any given day, there were 288 fewer youth in secure detention, with youth of color accounting for 88.7% of this drop.
• Across all eleven sites, more than four-thousand (4,091) fewer youth were admitted to
detention in 2009, as compared to each site’s last year prior to JDAI, a decrease of -47.5%. • Over the past year alone, all JDAI sites reduced the total number of kids admitted to detention
for a technical violation of probation, for a combined reduction of -21.0%.
• In 2009, across the eight sites reporting detention alternative outcome data, the success rate averaged 79.0%. Across these sites an average of just 3.7% of youth were discharged from a detention alternative program as the result of a new delinquency charge.
• The number of girls in detention on any given day has decreased by -60.0% across the
eleven sites.
REALIZING POTENTIAL & CHANGING FUTURES
New Jersey is an Equal Opportunity Employer Printed on Recycled Paper and Recyclable
A core principle of JDAI is recognizing that no matter how well the current system is operating, there is always room for improvement. While the accomplishments of New Jersey’s JDAI sites to-date are indeed substantial, the report’s findings indicate there remains work to be done. For example, seven of the eleven JDAI sites have experienced an increase in average length of stay since JDAI implementation. And, in 2009 youth of color remained in detention longer than white youth in eight sites. In light of the significant achievements made by JDAI sites in terms of reducing unnecessary admissions to detention, it seems renewed focus on these length of stay trends might be a worthwhile priority for the coming year.
As a reminder, the purpose of this report is to illustrate the overall impact of JDAI as a statewide initiative. Site-specific needs should continue to drive the various, additional analyses used for system-diagnosis at the local level.
1
New Jersey Juvenile Detention Alternatives Initiative (NJ~JDAI) ANNUAL REPORT – 2009
Prepared by: Jennifer LeBaron, Ph.D. NJ Juvenile Justice Commission
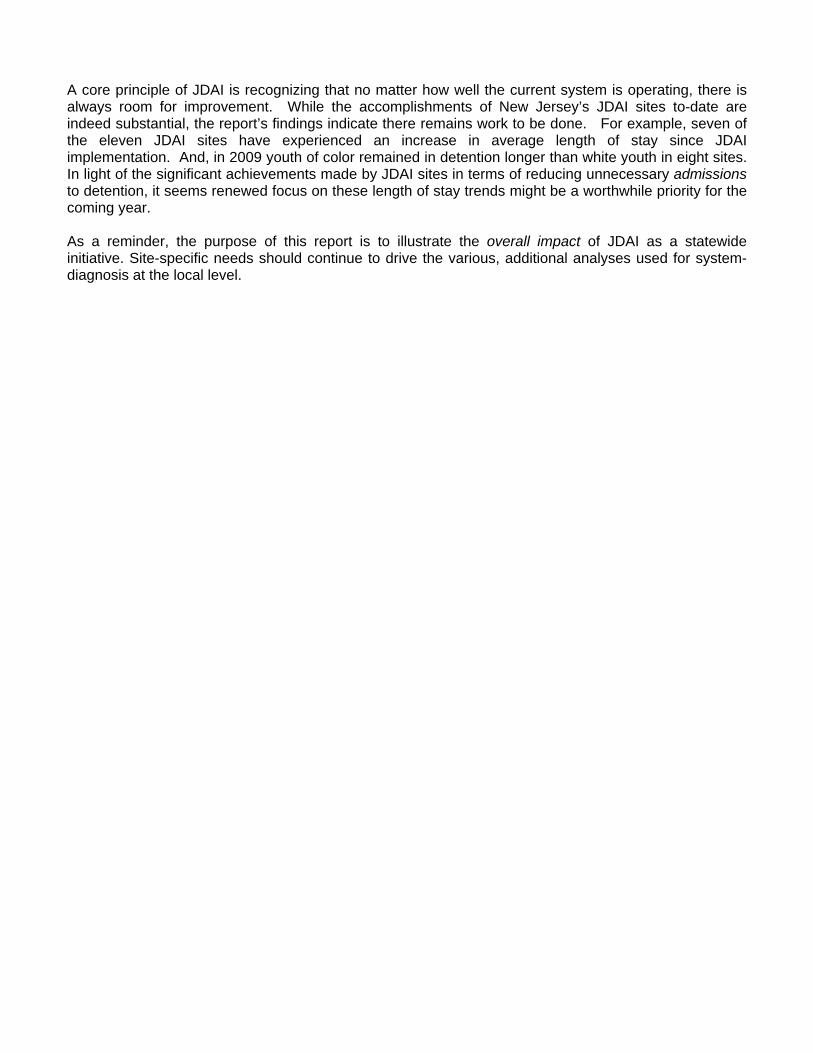
SUMMARY OF CHANGES IN KEY DETENTION UTILIZATION INDICATORS Table 1 summarizes changes in the key indicators of detention utilization over the most recent year (2008 to 2009), and from the year prior to JDAI to the present year. These three indicators include average daily population (ADP), admissions, and average length of stay (ALOS). Each of these trends will be discussed further in subsequent sections of the report. As Table 1 indicates, Atlantic is the only site to have experienced a drop in all detention utilization indicators over both the past year, and pre- vs. post-JDAI. Table 1 also illustrates that while most sites have experienced substantial decreases in admissions to detention pre- vs. post-JDAI, only two sites (Atlantic and Essex) have seen double-digit decreases in ALOS. Of course, ADP is a function of how many kids are admitted to detention and how long each youth stays. The size of the drop in admissions is so great that it generally outweighs the increases in ALOS, so the net effect is a decrease in ADP for all eleven JDAI sites. Comparing the year prior to JDAI in each site to the current year, detention ADP has decreased by -42.9% across the eleven JDAI sites.
TABLE 1. SUMMARY OF CHANGES IN KEY DETENTION UTILIZATION INDICATORS 1-Year Change 2008-2009 Pre-JDAIa to Current Year Change
ADP Admissions ALOS ADP Admissions ALOS Kids % Kids % Days % Kids % Kids % Days %Atlantic -8.1 -33.2% -71 -21.2% -5.0 -17.6% -17.8 -52.2% -204 -43.6% -5.7 -19.6%
Bergen -2.6 -20.6% +6 +4.3% +1.9 +7.6% -10.3 -50.7% -102 -41.5% -0.4 -1.5%
Burlington +0.9 +5.0% -5 -1.8% -1.2 -4.8% -1.5 -7.4% -5 -1.8% +1.9 +8.7%
Camden -3.2 -6.4% -120 -18.3% +4.2 +14.6% -47.9 -50.6% -1126 -67.8% +12.8 +63.7%
Essex -1.5 -1.3% -186 -12.6% +5.4 +19.6% -130.4 -53.5% -1166 -47.4% -6.8 -17.1%
Hudson +1.5 +2.5% -331 -35.0% +8.2 +33.6% -24.4 -28.1% -606 -49.6% +3.7 +12.8%
Mercer -12.7 -29.9% -166 -28.7% +0.5 +1.9% -30.2 -50.3% -451 -52.3% -0.4 -1.5%
Monmouth -2.2 -7.9% -15 -5.2% +6.9 +22.5% -14.3 -35.8% -237 -46.7% +5.3 +16.5%
Ocean -3.5 -16.1% -6 -3.2% -6.3 -14.0% -5.5 -23.2% -63 -26.0% +3.8 +10.9%
Somerset -1.4 -15.6% -12 -9.5% +5.7 +37.5% -1.4 -15.6% -12 -9.5% +5.7 +37.5%
Union +2.5 +7.8% -17 -3.9% +3.7 +14.1% -4.7 -12.0% -119 -22.0% +1.1 +3.8%a The pre-JDAI year for original sites was 2003, for phase 2 sites it was 2005, and for Somerset it was 2008. For this reason, Somerset’s one-year change and pre-to-post JDAI change are the same.
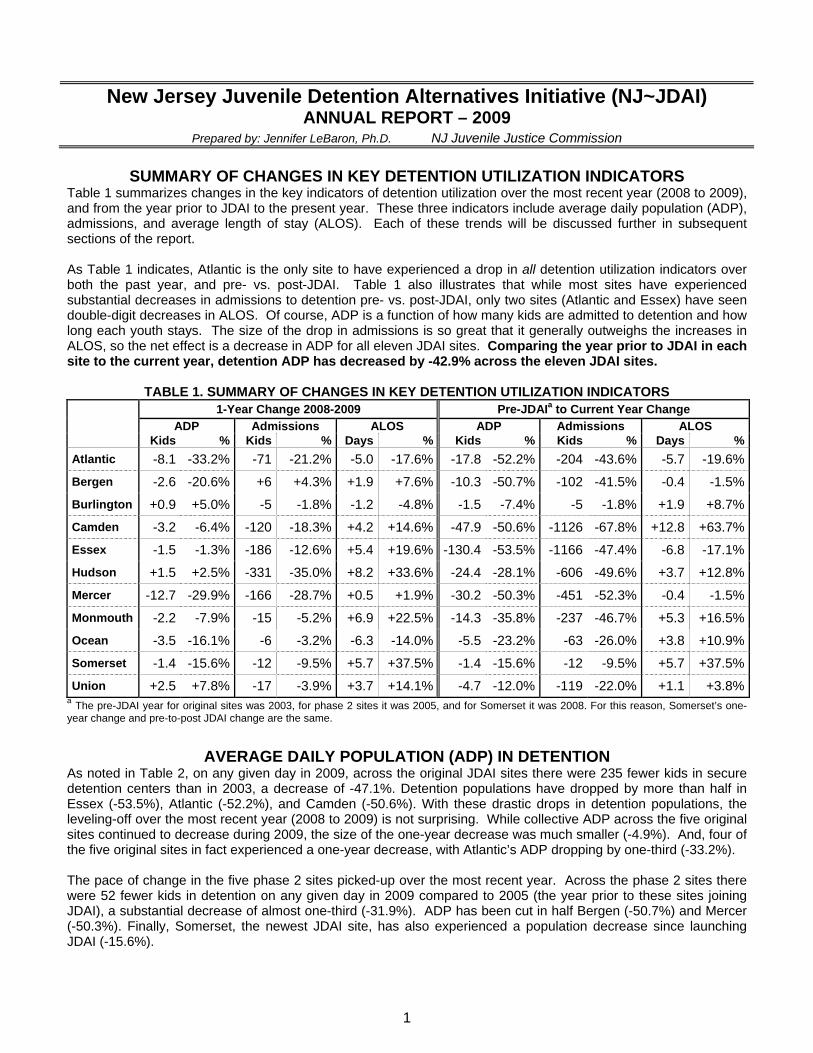
AVERAGE DAILY POPULATION (ADP) IN DETENTION As noted in Table 2, on any given day in 2009, across the original JDAI sites there were 235 fewer kids in secure detention centers than in 2003, a decrease of -47.1%. Detention populations have dropped by more than half in Essex (-53.5%), Atlantic (-52.2%), and Camden (-50.6%). With these drastic drops in detention populations, the leveling-off over the most recent year (2008 to 2009) is not surprising. While collective ADP across the five original sites continued to decrease during 2009, the size of the one-year decrease was much smaller (-4.9%). And, four of the five original sites in fact experienced a one-year decrease, with Atlantic’s ADP dropping by one-third (-33.2%). The pace of change in the five phase 2 sites picked-up over the most recent year. Across the phase 2 sites there were 52 fewer kids in detention on any given day in 2009 compared to 2005 (the year prior to these sites joining JDAI), a substantial decrease of almost one-third (-31.9%). ADP has been cut in half Bergen (-50.7%) and Mercer (-50.3%). Finally, Somerset, the newest JDAI site, has also experienced a population decrease since launching JDAI (-15.6%).
2
TABLE 2. ADP IN DETENTION 1-Yr Change ‘08-‘09 6-Yr Change ‘03-‘09 Original Sites 2003 2008 2009
Kids % Kids % Atlantic 34.1 24.4 16.3 -8.1 -33.2% -17.8 -52.2%Camden 94.6 49.9 46.7 -3.2 -6.4% -47.9 -50.6%Essex 243.6 114.7 113.2 -1.5 -1.3% -130.4 -53.5%Monmouth 40.0 27.9 25.7 -2.2 -7.9% -14.3 -35.8%Hudson 86.7 60.8 62.3 +1.5 +2.5% -24.4 -28.1%TOTAL 499.0 277.7 264.2 -13.5 -4.9% -234.8 -47.1%
1-Yr Change ‘08-‘09 4-Yr Change ‘05-‘09 Phase 2 Sites 2005 2008 2009
Kids % Kids % Mercer 60.0 42.5 29.8 -12.7 -29.9% -30.2 -50.3%Union 39.2 32.0 34.5 +2.5 +7.8% -4.7 -12.0%Bergen 20.3 12.6 10.0 -2.6 -20.6% -10.3 -50.7%Burlington 20.4 18.0 18.9 +0.9 +5.0% -1.5 -7.4%Ocean 23.7 21.7 18.2 -3.5 -16.1% -5.5 -23.2%TOTAL 163.6 126.8 111.4 -15.4 -12.1% -52.2 -31.9%
1-Yr Change ‘08-‘09 New Sites 2008 2009
Kids % Somerset 9.0 7.6 -1.4 -15.6%
Figure 1. Combined Monthly Detention ADP for 5 Original JDAI Sites, 2003-2009
100
150
200
250
300
350
400
450
500
550
JAN
'03
AP
R'0
3
JUL'
03
OC
T'03
JAN
'04
AP
R'0
4
JUL'
04
OC
T'04
JAN
'05
AP
R'0
5
JUL'
05
OC
T'05
JAN
'06
AP
R'0
6
JUL'
06
OC
T'06
JAN
'07
AP
R'0
7
JUL'
07
OC
T'07
JAN
'08
AP
R'0
8
JUL'
08
0CT'
08
JAN
'09
AP
R'0
9
JUL'
09
OC
T'09
ADMISSIONS TO DETENTION
Across the original JDAI sites, in 2009 more than three-thousand (3,339) fewer youth were admitted to detention facilities than in 2003 (Table 3), a decrease of more than half (-52.8%). While admissions decreased substantially in all five JDAI sites, Camden experienced the largest decrease, with admissions dropping by -67.8%. Downward trends continued over the past year, with admissions dropping -19.5% across the five sites. Hudson experienced the largest one-year drop (-35.0%), which was likely influenced by the launch of the Risk Screening Tool in Hudson in 2009. All five original sites are now using this objective decision-making tool to guide detention decisions made by court intake services, with the phase 2 sites to follow this year. Phase 2 JDAI sites also experienced a collective decrease in the number of youth admitted to secure detention. In 2009 more than seven hundred (740) fewer youth were admitted to detention than in 2005, a decrease of -34.0%. The pace of the decline leveled-off over the most recent year, except in Mercer where the one-year drop of -28.7% contributed to a pre- vs. post-JDAI drop in admissions of -52.3%. Comparing the year prior to JDAI in each site to the current year, across all eleven JDAI sites, more than four-thousand (4,091) fewer youth were admitted to detention, a decrease of -47.5%.

3
TABLE 3. ANNUAL ADMISSIONS TO DETENTION 1-Yr Change ‘08-‘09 6-Yr Change ‘03-‘09 Original Sites 2003 2008 2009
Kids % Kids % Atlantic 468 335 264 -71 -21.2% -204 -43.6%Camden 1661 655 535 -120 -18.3% -1126 -67.8%Essex 2460 1480 1294 -186 -12.6% -1166 -47.4%Monmouth 508 286 271 -15 -5.2% -237 -46.7%Hudson 1222 947 616 -331 -35.0% -606 -49.6%TOTAL 6319 3703 2980 -723 -19.5% -3339 -52.8%
1-Yr Change ‘08-‘09 4-Yr Change ‘05-‘09 Phase 2 Sites 2005 2008 2009
Kids % Kids % Mercer 863 578 412 -166 -28.7% -451 -52.3%Union 540 438 421 -17 -3.9% -119 -22.0%Bergen 246 138 144 +6 +4.3% -102 -41.5%Burlington 284 284 279 -5 -1.8% -5 -1.8%Ocean 242 185 179 -6 -3.2% -63 -26.0%TOTAL 2175 1623 1435 -188 -11.6% -740 -34.0%
1-Yr Change ‘08-‘09 New Sites 2008 2009
Kids % Somerset 126 114 -12 -9.5%
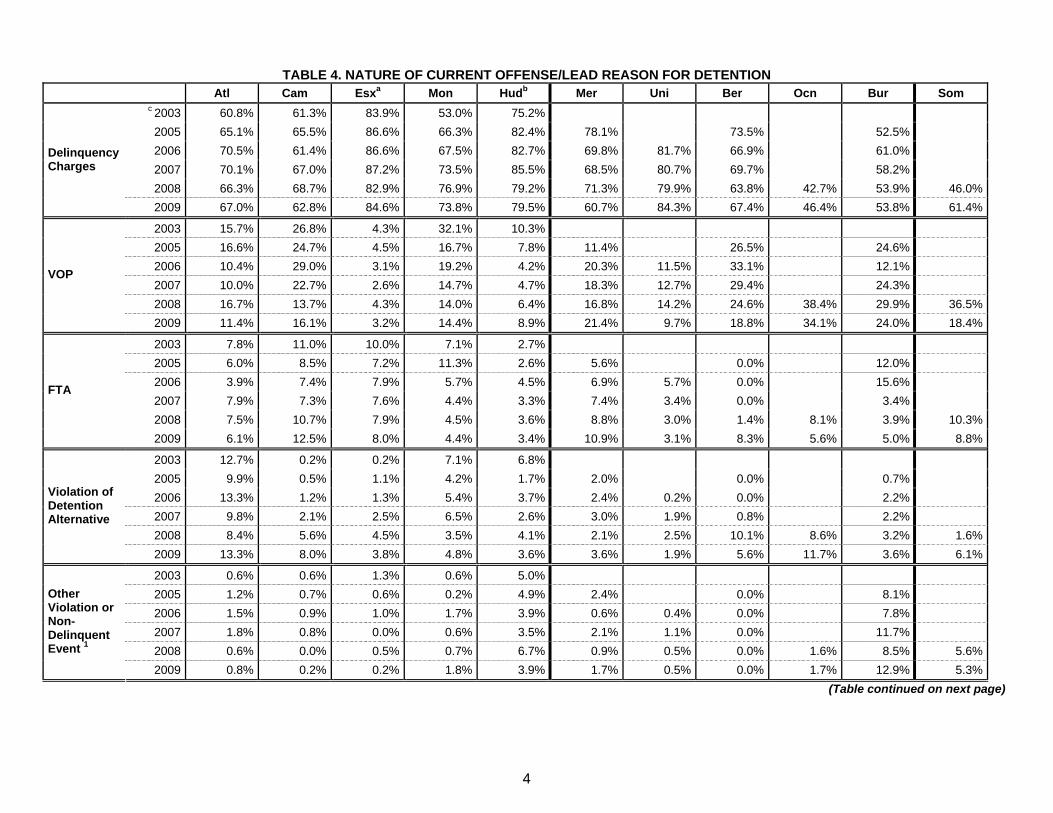
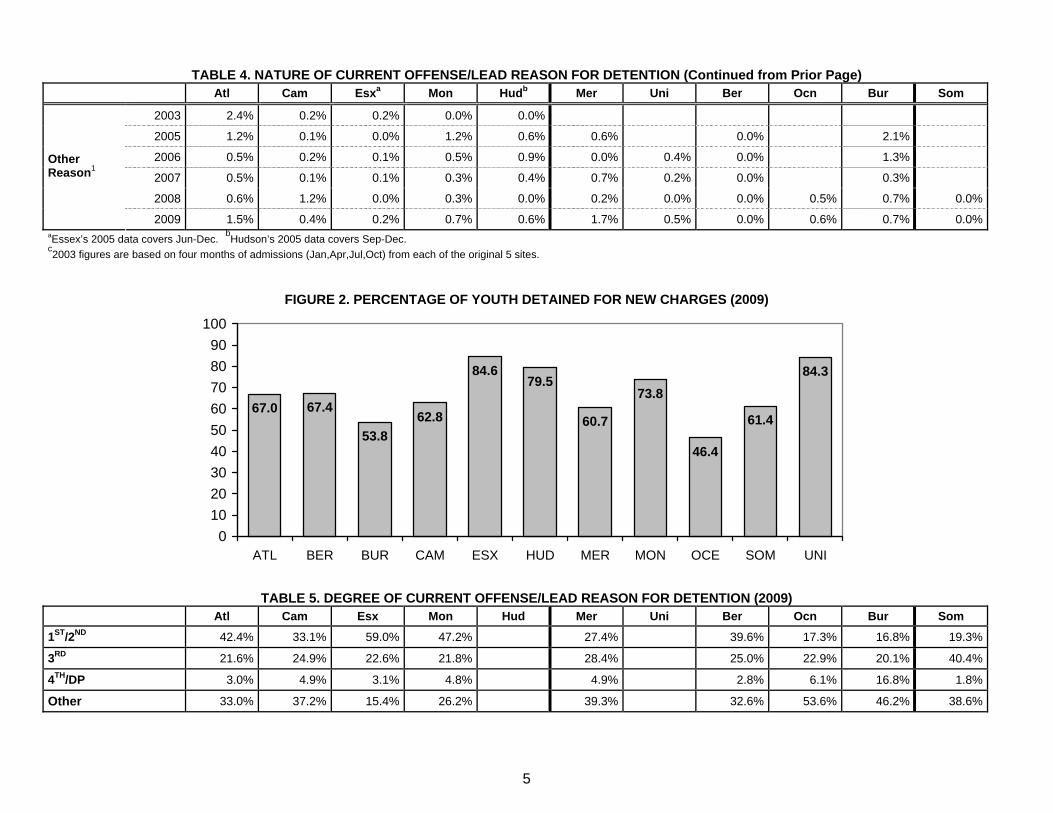
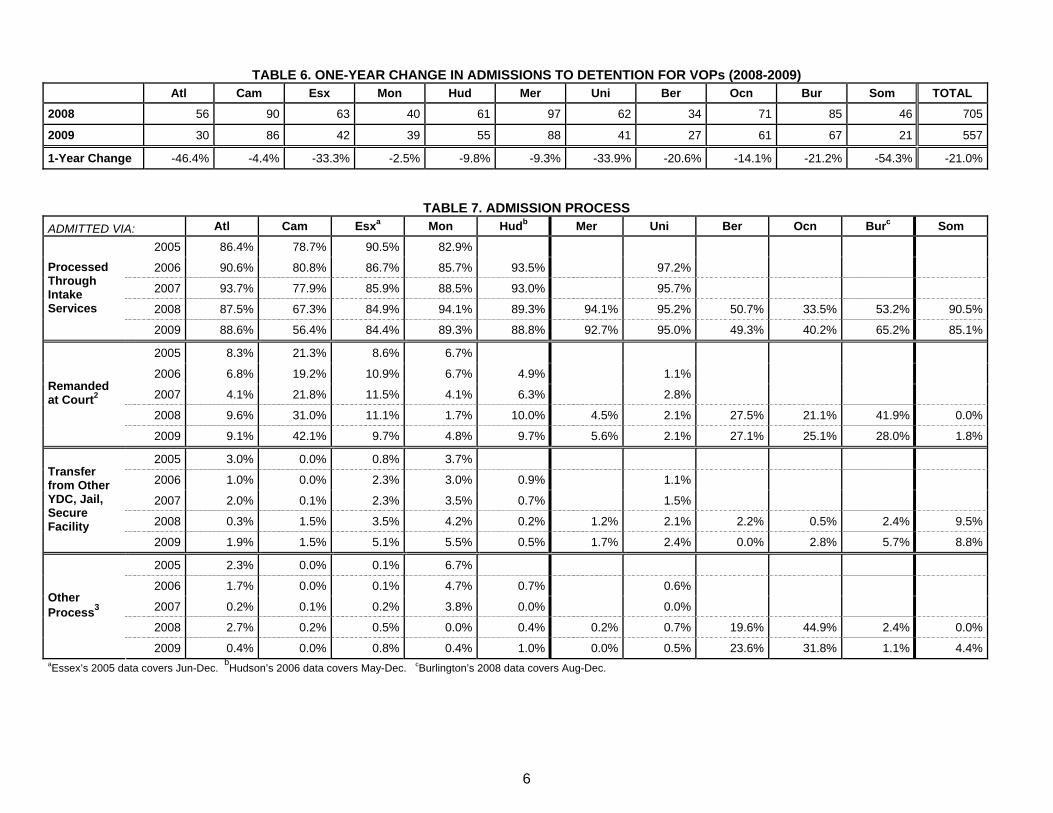
Nature of Admissions. While overall admissions have decreased since JDAI implementation, the proportion of youth admitted for new delinquency charges has generally increased in most JDAI sites (Table 4). In other words, consistent with JDAI core strategies, much of the drop in admissions can be attributed to fewer youth admitted for violations/non-delinquency matters. Monmouth’s increase in the proportion of youth admitted to detention for delinquency charges is the largest, up +20.8 percentage points from 2003 to 2009 (or 39.2%). However, as Figure 2 indicates, across sites the proportion of youth detained on new delinquency charges in 2009 varied widely, ranging from lows of 46.4% in Ocean and 53.8% in Burlington, to highs of 84.6% in Essex and 84.3% in Union. Table 5 indicates that the proportion of youth detained for the most serious offenses – those of the 1st or 2nd degree – also varied widely across counties, from a low of 16.8% of all youth detained in Burlington to a high of 59.0% in Essex. Related, a core strategy of JDAI is developing effective strategies for intervening with youth who are non-compliant with the rules of probation. Minimizing admissions to detention for a technical violation of probation is a key indicator of success in this area. Indeed, most sites have seen downward trends in the proportion of youth admitted for VOPs; Monmouth, Camden, and Somerset have seen the largest reductions. Comparing each site’s pre-JDAI year to 2009, Monmouth’s proportion of VOP admissions decreased -17.7 percentage points (or -55.1%), Somerset dropped -18.1 points (or -49.6%), and Camden dropped -10.7 points (or -39.9%). However, there is wide variation across sites. In 2009, the proportion of youth admitted for a VOP ranged from a low of 3.2% in Essex to a high of 34.1% in Ocean. Across sites the actual number of kids admitted to detention for a VOP has dropped. Table 6 illustrates that over the past year alone, all JDAI sites reduced the total number of youth admitted to detention for a VOP, for a combined reduction of -21.0%. It is important to acknowledge that the size of the one-year change in Camden is not representative of the longer-term trend experienced there since JDAI inception. For example, admissions to detention for a VOP dropped from 318 kids in 2005 to 86 kids in 2009, a remarkable reduction of -73.0%. Regarding other admission categories, youth detained for failure to appear in court ranged from a low of 3.1% in Union to a high of 12.5% in Camden. Admissions to detention for noncompliance with a detention alternative ranged from a low of 1.9% in Union to highs of 13.3% in Atlantic and 11.7% in Ocean. Finally, Table 7 provides basic data regarding the process by which youth are admitted to detention. By far the most common process for admitting youth to detention is via a call placed to Family Court Intake Services. There is variation across sites, however. For example, in 2009 youth admitted to detention via court remand ranged from lows of about 2.0% in Union and Somerset to a high of 42.1% in Camden.
4
TABLE 4. NATURE OF CURRENT OFFENSE/LEAD REASON FOR DETENTION Atl Cam Esxa Mon Hudb Mer Uni Ber Ocn Bur Som
c 2003 60.8% 61.3% 83.9% 53.0% 75.2% 2005 65.1% 65.5% 86.6% 66.3% 82.4% 78.1% 73.5% 52.5% 2006 70.5% 61.4% 86.6% 67.5% 82.7% 69.8% 81.7% 66.9% 61.0% 2007 70.1% 67.0% 87.2% 73.5% 85.5% 68.5% 80.7% 69.7% 58.2% 2008 66.3% 68.7% 82.9% 76.9% 79.2% 71.3% 79.9% 63.8% 42.7% 53.9% 46.0%
Delinquency Charges
2009 67.0% 62.8% 84.6% 73.8% 79.5% 60.7% 84.3% 67.4% 46.4% 53.8% 61.4%
2003 15.7% 26.8% 4.3% 32.1% 10.3% 2005 16.6% 24.7% 4.5% 16.7% 7.8% 11.4% 26.5% 24.6% 2006 10.4% 29.0% 3.1% 19.2% 4.2% 20.3% 11.5% 33.1% 12.1% 2007 10.0% 22.7% 2.6% 14.7% 4.7% 18.3% 12.7% 29.4% 24.3% 2008 16.7% 13.7% 4.3% 14.0% 6.4% 16.8% 14.2% 24.6% 38.4% 29.9% 36.5%
VOP
2009 11.4% 16.1% 3.2% 14.4% 8.9% 21.4% 9.7% 18.8% 34.1% 24.0% 18.4%
2003 7.8% 11.0% 10.0% 7.1% 2.7% 2005 6.0% 8.5% 7.2% 11.3% 2.6% 5.6% 0.0% 12.0% 2006 3.9% 7.4% 7.9% 5.7% 4.5% 6.9% 5.7% 0.0% 15.6% 2007 7.9% 7.3% 7.6% 4.4% 3.3% 7.4% 3.4% 0.0% 3.4% 2008 7.5% 10.7% 7.9% 4.5% 3.6% 8.8% 3.0% 1.4% 8.1% 3.9% 10.3%
FTA
2009 6.1% 12.5% 8.0% 4.4% 3.4% 10.9% 3.1% 8.3% 5.6% 5.0% 8.8%
2003 12.7% 0.2% 0.2% 7.1% 6.8% 2005 9.9% 0.5% 1.1% 4.2% 1.7% 2.0% 0.0% 0.7% 2006 13.3% 1.2% 1.3% 5.4% 3.7% 2.4% 0.2% 0.0% 2.2% 2007 9.8% 2.1% 2.5% 6.5% 2.6% 3.0% 1.9% 0.8% 2.2% 2008 8.4% 5.6% 4.5% 3.5% 4.1% 2.1% 2.5% 10.1% 8.6% 3.2% 1.6%
Violation of Detention Alternative
2009 13.3% 8.0% 3.8% 4.8% 3.6% 3.6% 1.9% 5.6% 11.7% 3.6% 6.1%
2003 0.6% 0.6% 1.3% 0.6% 5.0% 2005 1.2% 0.7% 0.6% 0.2% 4.9% 2.4% 0.0% 8.1% 2006 1.5% 0.9% 1.0% 1.7% 3.9% 0.6% 0.4% 0.0% 7.8% 2007 1.8% 0.8% 0.0% 0.6% 3.5% 2.1% 1.1% 0.0% 11.7% 2008 0.6% 0.0% 0.5% 0.7% 6.7% 0.9% 0.5% 0.0% 1.6% 8.5% 5.6%
Other Violation or Non-Delinquent Event 1
2009 0.8% 0.2% 0.2% 1.8% 3.9% 1.7% 0.5% 0.0% 1.7% 12.9% 5.3% (Table continued on next page)
5
TABLE 4. NATURE OF CURRENT OFFENSE/LEAD REASON FOR DETENTION (Continued from Prior Page) Atl Cam Esxa Mon Hudb Mer Uni Ber Ocn Bur Som
2003 2.4% 0.2% 0.2% 0.0% 0.0%
2005 1.2% 0.1% 0.0% 1.2% 0.6% 0.6% 0.0% 2.1%
2006 0.5% 0.2% 0.1% 0.5% 0.9% 0.0% 0.4% 0.0% 1.3%
2007 0.5% 0.1% 0.1% 0.3% 0.4% 0.7% 0.2% 0.0% 0.3%
2008 0.6% 1.2% 0.0% 0.3% 0.0% 0.2% 0.0% 0.0% 0.5% 0.7% 0.0%
Other Reason1
2009 1.5% 0.4% 0.2% 0.7% 0.6% 1.7% 0.5% 0.0% 0.6% 0.7% 0.0% aEssex’s 2005 data covers Jun-Dec. bHudson’s 2005 data covers Sep-Dec. c2003 figures are based on four months of admissions (Jan,Apr,Jul,Oct) from each of the original 5 sites.
FIGURE 2. PERCENTAGE OF YOUTH DETAINED FOR NEW CHARGES (2009)
67.4
53.862.8
84.679.5
60.7
73.8
46.4
61.4
84.3
67.0
0102030405060708090
100
ATL BER BUR CAM ESX HUD MER MON OCE SOM UNI
TABLE 5. DEGREE OF CURRENT OFFENSE/LEAD REASON FOR DETENTION (2009)
Atl Cam Esx Mon Hud Mer Uni Ber Ocn Bur Som 1ST/2ND 42.4% 33.1% 59.0% 47.2% 27.4% 39.6% 17.3% 16.8% 19.3%
3RD 21.6% 24.9% 22.6% 21.8% 28.4% 25.0% 22.9% 20.1% 40.4%
4TH/DP 3.0% 4.9% 3.1% 4.8% 4.9% 2.8% 6.1% 16.8% 1.8%
Other 33.0% 37.2% 15.4% 26.2% 39.3% 32.6% 53.6% 46.2% 38.6%
6
TABLE 6. ONE-YEAR CHANGE IN ADMISSIONS TO DETENTION FOR VOPs (2008-2009) Atl Cam Esx Mon Hud Mer Uni Ber Ocn Bur Som TOTAL 2008 56 90 63 40 61 97 62 34 71 85 46 705
2009 30 86 42 39 55 88 41 27 61 67 21 557
1-Year Change -46.4% -4.4% -33.3% -2.5% -9.8% -9.3% -33.9% -20.6% -14.1% -21.2% -54.3% -21.0%
TABLE 7. ADMISSION PROCESS
ADMITTED VIA: Atl Cam Esxa Mon Hudb Mer Uni Ber Ocn Burc Som
2005 86.4% 78.7% 90.5% 82.9%
2006 90.6% 80.8% 86.7% 85.7% 93.5% 97.2%
2007 93.7% 77.9% 85.9% 88.5% 93.0% 95.7%
2008 87.5% 67.3% 84.9% 94.1% 89.3% 94.1% 95.2% 50.7% 33.5% 53.2% 90.5%
Processed Through Intake Services
2009 88.6% 56.4% 84.4% 89.3% 88.8% 92.7% 95.0% 49.3% 40.2% 65.2% 85.1%
2005 8.3% 21.3% 8.6% 6.7%
2006 6.8% 19.2% 10.9% 6.7% 4.9% 1.1%
2007 4.1% 21.8% 11.5% 4.1% 6.3% 2.8%
2008 9.6% 31.0% 11.1% 1.7% 10.0% 4.5% 2.1% 27.5% 21.1% 41.9% 0.0%
Remanded at Court2
2009 9.1% 42.1% 9.7% 4.8% 9.7% 5.6% 2.1% 27.1% 25.1% 28.0% 1.8%
2005 3.0% 0.0% 0.8% 3.7%
2006 1.0% 0.0% 2.3% 3.0% 0.9% 1.1%
2007 2.0% 0.1% 2.3% 3.5% 0.7% 1.5%
2008 0.3% 1.5% 3.5% 4.2% 0.2% 1.2% 2.1% 2.2% 0.5% 2.4% 9.5%
Transfer from Other YDC, Jail, Secure Facility
2009 1.9% 1.5% 5.1% 5.5% 0.5% 1.7% 2.4% 0.0% 2.8% 5.7% 8.8%
2005 2.3% 0.0% 0.1% 6.7%
2006 1.7% 0.0% 0.1% 4.7% 0.7% 0.6%
2007 0.2% 0.1% 0.2% 3.8% 0.0% 0.0%
2008 2.7% 0.2% 0.5% 0.0% 0.4% 0.2% 0.7% 19.6% 44.9% 2.4% 0.0%
Other Process3
2009 0.4% 0.0% 0.8% 0.4% 1.0% 0.0% 0.5% 23.6% 31.8% 1.1% 4.4% aEssex’s 2005 data covers Jun-Dec. bHudson’s 2006 data covers May-Dec. cBurlington’s 2008 data covers Aug-Dec.
7
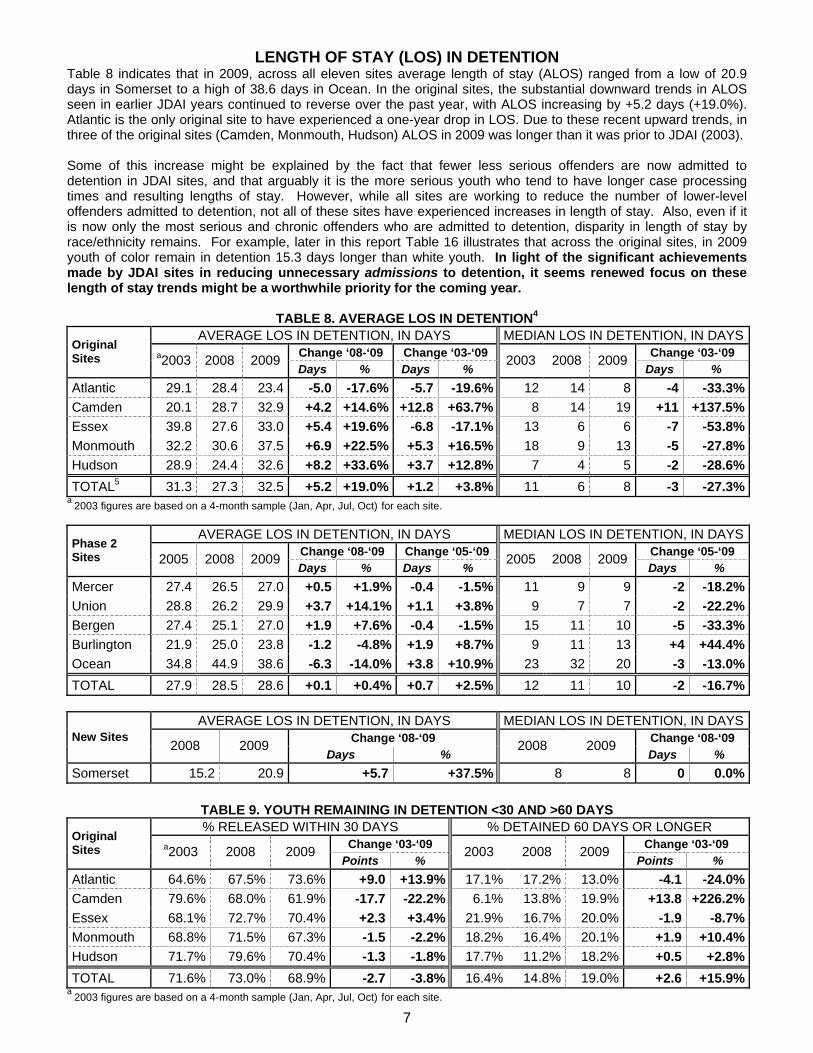
LENGTH OF STAY (LOS) IN DETENTION Table 8 indicates that in 2009, across all eleven sites average length of stay (ALOS) ranged from a low of 20.9 days in Somerset to a high of 38.6 days in Ocean. In the original sites, the substantial downward trends in ALOS seen in earlier JDAI years continued to reverse over the past year, with ALOS increasing by +5.2 days (+19.0%). Atlantic is the only original site to have experienced a one-year drop in LOS. Due to these recent upward trends, in three of the original sites (Camden, Monmouth, Hudson) ALOS in 2009 was longer than it was prior to JDAI (2003). Some of this increase might be explained by the fact that fewer less serious offenders are now admitted to detention in JDAI sites, and that arguably it is the more serious youth who tend to have longer case processing times and resulting lengths of stay. However, while all sites are working to reduce the number of lower-level offenders admitted to detention, not all of these sites have experienced increases in length of stay. Also, even if it is now only the most serious and chronic offenders who are admitted to detention, disparity in length of stay by race/ethnicity remains. For example, later in this report Table 16 illustrates that across the original sites, in 2009 youth of color remain in detention 15.3 days longer than white youth. In light of the significant achievements made by JDAI sites in reducing unnecessary admissions to detention, it seems renewed focus on these length of stay trends might be a worthwhile priority for the coming year.
TABLE 8. AVERAGE LOS IN DETENTION4 AVERAGE LOS IN DETENTION, IN DAYS MEDIAN LOS IN DETENTION, IN DAYS
Change ‘08-‘09 Change ‘03-‘09 Change ‘03-‘09 Original Sites a2003 2008 2009
Days % Days % 2003 2008 2009
Days % Atlantic 29.1 28.4 23.4 -5.0 -17.6% -5.7 -19.6% 12 14 8 -4 -33.3%Camden 20.1 28.7 32.9 +4.2 +14.6% +12.8 +63.7% 8 14 19 +11 +137.5%Essex 39.8 27.6 33.0 +5.4 +19.6% -6.8 -17.1% 13 6 6 -7 -53.8%Monmouth 32.2 30.6 37.5 +6.9 +22.5% +5.3 +16.5% 18 9 13 -5 -27.8%Hudson 28.9 24.4 32.6 +8.2 +33.6% +3.7 +12.8% 7 4 5 -2 -28.6%TOTAL5 31.3 27.3 32.5 +5.2 +19.0% +1.2 +3.8% 11 6 8 -3 -27.3%
a 2003 figures are based on a 4-month sample (Jan, Apr, Jul, Oct) for each site.
AVERAGE LOS IN DETENTION, IN DAYS MEDIAN LOS IN DETENTION, IN DAYSChange ‘08-‘09 Change ‘05-‘09 Change ‘05-‘09 Phase 2
Sites 2005 2008 2009 Days % Days %
2005 2008 2009 Days %
Mercer 27.4 26.5 27.0 +0.5 +1.9% -0.4 -1.5% 11 9 9 -2 -18.2%Union 28.8 26.2 29.9 +3.7 +14.1% +1.1 +3.8% 9 7 7 -2 -22.2%Bergen 27.4 25.1 27.0 +1.9 +7.6% -0.4 -1.5% 15 11 10 -5 -33.3%Burlington 21.9 25.0 23.8 -1.2 -4.8% +1.9 +8.7% 9 11 13 +4 +44.4%Ocean 34.8 44.9 38.6 -6.3 -14.0% +3.8 +10.9% 23 32 20 -3 -13.0%TOTAL 27.9 28.5 28.6 +0.1 +0.4% +0.7 +2.5% 12 11 10 -2 -16.7%
AVERAGE LOS IN DETENTION, IN DAYS MEDIAN LOS IN DETENTION, IN DAYS
Change ‘08-‘09 Change ‘08-‘09 New Sites 2008 2009
Days % 2008 2009
Days % Somerset 15.2 20.9 +5.7 +37.5% 8 8 0 0.0%
TABLE 9. YOUTH REMAINING IN DETENTION <30 AND >60 DAYS % RELEASED WITHIN 30 DAYS % DETAINED 60 DAYS OR LONGER
Change ‘03-‘09 Change ‘03-‘09 Original Sites a2003 2008 2009
Points % 2003 2008 2009
Points % Atlantic 64.6% 67.5% 73.6% +9.0 +13.9% 17.1% 17.2% 13.0% -4.1 -24.0%Camden 79.6% 68.0% 61.9% -17.7 -22.2% 6.1% 13.8% 19.9% +13.8 +226.2%Essex 68.1% 72.7% 70.4% +2.3 +3.4% 21.9% 16.7% 20.0% -1.9 -8.7%Monmouth 68.8% 71.5% 67.3% -1.5 -2.2% 18.2% 16.4% 20.1% +1.9 +10.4%Hudson 71.7% 79.6% 70.4% -1.3 -1.8% 17.7% 11.2% 18.2% +0.5 +2.8%TOTAL 71.6% 73.0% 68.9% -2.7 -3.8% 16.4% 14.8% 19.0% +2.6 +15.9%
a 2003 figures are based on a 4-month sample (Jan, Apr, Jul, Oct) for each site.
8
TABLE 9. YOUTH REMAINING IN DETENTION <30 AND >60 DAYS (Continued from Prior Page) % RELEASED WITHIN 30 DAYS % DETAINED 60 DAYS OR LONGER
Change ‘05-‘09 Change ‘05-‘09 Phase 2 Sites 2005 2008 2009
Points % 2005 2008 2009
Points % Mercer 73.7% 75.6% 74.9% +1.2 +1.6% 13.0% 10.2% 9.7% -3.3 -25.4%Union 71.8% 73.7% 74.7% +2.9 +4.0% 15.5% 13.8% 15.7% +0.2 +1.3%Bergen 69.1% 72.3% 72.7% +3.6 +5.2% 14.2% 14.3% 14.4% +0.2 +1.4%Burlington 75.5% 76.4% 72.8% -2.7 -3.6% 11.7% 10.6% 10.8% -0.9 -7.7%Ocean 60.9% 48.8% 63.6% +2.7 +4.4% 22.6% 28.8% 22.2% -0.4 -1.8%TOTAL 71.5% 71.4% 72.8% +1.3 +1.8% 14.7% 14.0% 13.6% -1.1 -7.5%
% RELEASED WITHIN 30 DAYS % DETAINED 60 DAYS OR LONGER
Change ‘08-‘09 Change ‘08-‘09 New Sites 2008 2009
Points % 2008 2009
Points % Somerset 82.2% 84.3% +2.1 +2.6% 1.7% 7.0% +5.3 +311.8%
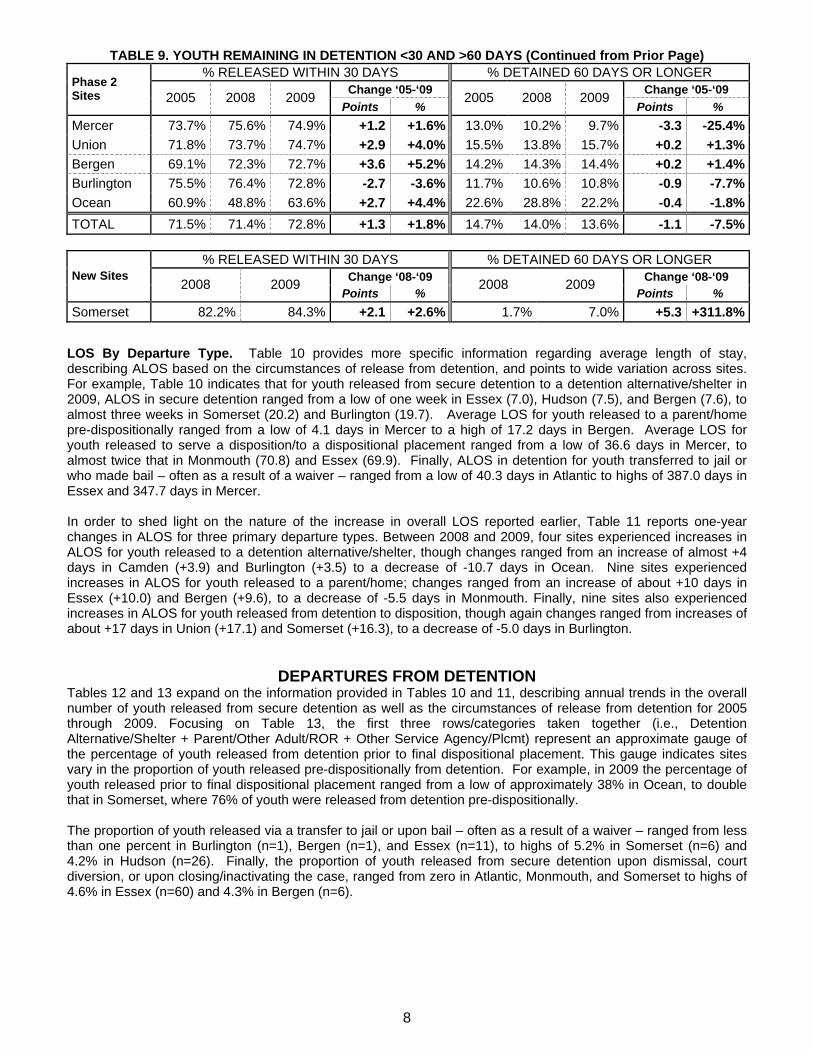
LOS By Departure Type. Table 10 provides more specific information regarding average length of stay, describing ALOS based on the circumstances of release from detention, and points to wide variation across sites. For example, Table 10 indicates that for youth released from secure detention to a detention alternative/shelter in 2009, ALOS in secure detention ranged from a low of one week in Essex (7.0), Hudson (7.5), and Bergen (7.6), to almost three weeks in Somerset (20.2) and Burlington (19.7). Average LOS for youth released to a parent/home pre-dispositionally ranged from a low of 4.1 days in Mercer to a high of 17.2 days in Bergen. Average LOS for youth released to serve a disposition/to a dispositional placement ranged from a low of 36.6 days in Mercer, to almost twice that in Monmouth (70.8) and Essex (69.9). Finally, ALOS in detention for youth transferred to jail or who made bail – often as a result of a waiver – ranged from a low of 40.3 days in Atlantic to highs of 387.0 days in Essex and 347.7 days in Mercer. In order to shed light on the nature of the increase in overall LOS reported earlier, Table 11 reports one-year changes in ALOS for three primary departure types. Between 2008 and 2009, four sites experienced increases in ALOS for youth released to a detention alternative/shelter, though changes ranged from an increase of almost +4 days in Camden (+3.9) and Burlington (+3.5) to a decrease of -10.7 days in Ocean. Nine sites experienced increases in ALOS for youth released to a parent/home; changes ranged from an increase of about +10 days in Essex (+10.0) and Bergen (+9.6), to a decrease of -5.5 days in Monmouth. Finally, nine sites also experienced increases in ALOS for youth released from detention to disposition, though again changes ranged from increases of about +17 days in Union (+17.1) and Somerset (+16.3), to a decrease of -5.0 days in Burlington.
DEPARTURES FROM DETENTION Tables 12 and 13 expand on the information provided in Tables 10 and 11, describing annual trends in the overall number of youth released from secure detention as well as the circumstances of release from detention for 2005 through 2009. Focusing on Table 13, the first three rows/categories taken together (i.e., Detention Alternative/Shelter + Parent/Other Adult/ROR + Other Service Agency/Plcmt) represent an approximate gauge of the percentage of youth released from detention prior to final dispositional placement. This gauge indicates sites vary in the proportion of youth released pre-dispositionally from detention. For example, in 2009 the percentage of youth released prior to final dispositional placement ranged from a low of approximately 38% in Ocean, to double that in Somerset, where 76% of youth were released from detention pre-dispositionally. The proportion of youth released via a transfer to jail or upon bail – often as a result of a waiver – ranged from less than one percent in Burlington (n=1), Bergen (n=1), and Essex (n=11), to highs of 5.2% in Somerset (n=6) and 4.2% in Hudson (n=26). Finally, the proportion of youth released from secure detention upon dismissal, court diversion, or upon closing/inactivating the case, ranged from zero in Atlantic, Monmouth, and Somerset to highs of 4.6% in Essex (n=60) and 4.3% in Bergen (n=6).

9
TABLE 10. AVERAGE LOS BY DEPARTURE TYPE6 RELEASE TO: Atl Cam Esx Mon Hud Mer Unia Ber Ocn7 Bur Som7
LOS 10.4 10.1 6.5 8.7 5.5 14.5 10.6 20.6 20.4 2007 N 241 317 970 152 420 149 89 39 39
LOS 12.1 11.1 7.9 10.3 5.8 13.2 13.1 13.6 23.3 16.2 17.8 2008 N 171 297 738 130 498 173 118 56 59 43 41
LOS 10.5 15.0 7.0 10.9 7.5 10.4 11.6 7.6 12.6 19.7 20.2
Detention Alternative, Shelter
2009 N 147 217 674 124 285 145 121 57 47 49 20
LOS 2.9 4.4 3.2 6.9 3.3 2.5 7.5 2.8 12.3 2007 N 26 31 361 53 220 153 71 13 137
LOS 4.9 7.7 4.1 17.3 4.4 3.3 6.8 7.6 4.2 10.6 6.6 2008 N 9 17 181 56 74 115 95 10 11 97 47
LOS 9.2 11.0 14.1 11.8 7.4 4.1 7.3 17.2 11.7 10.2 8.0
Parent, Other Adult, ROR Pre-Dispo
2009 N 13 24 118 40 48 66 74 12 7 93 61
LOS 19.3 18.0 22.7 13.3 6.8 21.0 9.8 64.0 20.7 2007 N 6 2 6 15 18 1 5 1 24
LOS 46.7 21.0 5.0 12.8 14.5 18.0 6.0 24.5 23.8 16.8 1.5 2008 N 3 5 2 6 10 5 3 2 6 15 2
LOS 33.2 24.5 63.7 12.7 8.4 14.2 3.5 10.3 26.6 12.9 18.2
Other Service Agency/ Plcmnt Pre-Dispo 2009
N 10 8 3 13 7 9 2 3 12 18 6
LOS 55.1 28.6 61.7 55.3 65.4 37.5 43.6 44.1 55.3 2007 N 124 379 523 82 242 297 87 39 71
LOS 51.3 42.0 60.2 70.6 56.1 39.2 42.5 48.0 59.2 46.1 35.3 2008 N 136 298 441 73 247 210 161 39 129 75 20
LOS 51.4 45.5 69.9 70.8 59.9 36.6 59.6 50.1 59.5 41.1 51.6
Dispo-sitional Placement
2009 N 76 253 400 73 202 148 134 57 86 79 15
LOS 67.3 80.1 111.1 167.0 156.6 171.6 85.6 49.3 74.8 2007 N 8 14 17 5 23 7 5 4 5
LOS 41.6 126.3 207.5 252.5 222.8 293.0 209.8 79.0 99.3 473.0 - 2008 N 7 22 19 2 23 7 9 2 3 1 0
LOS 40.3 120.8 387.0 281.7 203.5 347.7 305.8 58.0 71.5 275.0 95.2
Jail, Bail, Upon/After Waiver
2009 N 4 19 11 9 26 9 5 1 4 1 6
LOS 9.7 4.4 14.6 16.3 3.0 21.1 11.9 6.5 13.8 2007 N 19 21 35 14 26 16 16 15 30
LOS 6.6 8.8 12.2 37.1 6.3 7.1 7.7 5.9 7.3 11.0 3.4 2008 N 12 24 20 13 30 21 37 8 3 33 7
LOS 4.6 3.6 10.7 39.2 5.6 18.9 5.4 3.0 17.4 24.6 4.2
Other YDC/ Other Authorities
2009 N 11 12 26 10 36 17 55 3 12 29 6
(Table continued on next page)

10
TABLE 10. AVERAGE LOS BY DEPARTURE TYPE (Continued from Prior Page) RELEASE TO: Atl Cam Esx Mon Hud Mer Unia Ber Ocn7 Bur Som7
LOS 6.0 6.9 21.5 42.7 13.4 15.7 17.0 - 44.4 2007 N 3 7 72 3 67 29 6 0 8
LOS - 21.4 31.9 72.0 6.4 26.1 13.1 12.0 - 42.4 - 2008 N 0 5 54 1 57 17 11 2 0 19 0
LOS - 28.6 46.7 - 6.2 11.9 16.0 27.8 22.7 25.9 -
Dismissed, Diverted, Similar
2009 N 0 5 60 0 17 14 4 6 3 10 0
LOS - - 76.0 7.0 106.0 28.0 - 35.5 - 2007 N 0 0 33 1 1 1 0 2 0
LOS - - 75.2 - - 117.5 - - 35.0 15.0 22.0 2008 N 0 0 23 0 0 10 0 0 4 1 1
LOS - - 76.5 - - 52.3 - - 28.5 - 28.0
Time Served
2009 N 0 0 19 0 0 3 0 0 4 0 1
aUnion’s 2007 departure type data begins with May.
TABLE 11. 1-YEAR CHANGE IN ALOS FOR PRIMARY DEPARTURE TYPE CATEGORIES Detention Alternative,
Shelter Parent, Other Adult, ROR
(Pre-Dispo) Dispositional
Placement Change Change Change
2008 2009 Days % 2008 2009 Days % 2008 2009 Days %
Atlantic 12.1 10.5 -1.6 -13.2% 4.9 9.2 +4.3 +87.8% 51.3 51.4 +0.1 +0.2%
Bergen 13.6 7.6 -6.0 -44.1% 7.6 17.2 +9.6 +126.3% 48.0 50.1 +2.1 +4.4%
Burlington 16.2 19.7 +3.5 +21.6% 10.6 10.2 -0.4 -3.8% 46.1 41.1 -5.0 -10.8%
Camden 11.1 15.0 +3.9 +35.1% 7.7 11.0 +3.3 +42.9% 42.0 45.5 +3.5 +8.3%
Essex 7.9 7.0 -0.9 -11.4% 4.1 14.1 +10.0 +243.9% 60.2 69.9 +9.7 +16.1%
Hudson 5.8 7.5 +1.7 +29.3% 4.4 7.4 +3.0 +68.2% 56.1 59.9 +3.8 +6.8%
Mercer 13.2 10.4 -2.8 -21.2% 3.3 4.1 +0.8 +24.2% 39.2 36.6 -2.6 -6.6%
Monmouth 10.3 10.9 +0.6 +5.8% 17.3 11.8 -5.5 -31.8% 70.6 70.8 +0.2 +0.3%
Ocean 23.3 12.6 -10.7 -45.9% 4.2 11.7 +7.5 +178.6% 59.2 59.5 +0.3 +0.5%
Somerset 17.8 20.2 +2.4 +13.5% 6.6 8.0 +1.4 +21.2% 35.3 51.6 +16.3 +46.2%
Union 13.1 11.6 -1.5 -11.5% 6.8 7.3 +0.5 +7.4% 42.5 59.6 +17.1 +40.2%

11
TABLE 12. TOTAL ANNUAL DEPARTURES FROM DETENTION
Atl Cam Esx Mon Hud Mer Uni Ber Ocn Bur Som
2005 393 1293 1917 419 837 535 246 243 274
2006 402 1037 2113 408 977 746 494 135 223
2007 427 774 2018 326 1018 655 437 113 314
2008 338 668 1478 281 940 558 434 119 215 284 118
2009 261 538 1313 269 621 411 395 139 176 279 115
TABLE 13. NATURE OF DEPARTURES FROM DETENTION8 RELEASE TO: Atl Cam Esxa Mon Hudb Mer Unic Ber Ocn9 Bur Som9
2005 52.6% 38.7% 32.6% 40.6% 19.4% 28.6% 32.1% 21.8% 18.6% 2006 62.2% 38.2% 37.9% 42.9% 29.5% 31.6% 25.2% 11.7% 2007 56.4% 41.0% 48.1% 46.6% 41.3% 22.7% 31.6% 34.5% 12.4% 2008 50.6% 44.5% 49.9% 46.3% 53.0% 31.0% 27.2% 47.1% 27.4% 15.1% 34.7%
Detention Alternative, Shelter
2009 56.3% 40.3% 51.3% 46.1% 45.9% 35.3% 30.6% 41.0% 26.7% 17.6% 17.4%
2005 6.6% 6.5% 36.1% 17.9% 47.3% 21.4% 14.6% 8.6% 43.4% 2006 3.2% 4.8% 33.2% 19.4% 26.2% 21.4% 15.6% 47.5% 2007 6.1% 4.0% 17.9% 16.3% 21.6% 23.4% 25.2% 11.5% 43.6% 2008 2.7% 2.5% 12.2% 19.9% 7.9% 20.6% 21.9% 8.4% 5.1% 34.2% 39.8%
Parent, Other Adult, ROR Pre-Dispo
2009 5.0% 4.5% 9.0% 14.9% 7.7% 16.1% 18.7% 8.6% 4.0% 33.3% 53.0%
2005 1.5% 4.3% 0.3% 5.0% 0.4% 0.4% 0.0% 3.7% 4.7% 2006 2.2% 2.1% 0.3% 1.7% 1.4% 0.4% 0.0% 6.3% 2007 1.4% 0.3% 0.3% 4.6% 1.8% 0.2% 1.8% 0.9% 7.6% 2008 0.9% 0.7% 0.1% 2.1% 1.1% 0.9% 0.7% 1.7% 2.8% 5.3% 1.7%
Other Service Agency/ Plcmnt Pre-Dispo
2009 3.8% 1.5% 0.2% 4.8% 1.1% 2.2% 0.5% 2.2% 6.8% 6.5% 5.2%
2005 32.7% 47.1% 27.8% 31.0% 22.7% 43.1% 33.3% 40.7% 25.2% 2006 23.1% 50.2% 22.2% 30.9% 33.0% 40.6% 45.2% 22.0% 2007 29.0% 49.0% 25.9% 25.2% 23.8% 45.3% 30.9% 34.5% 22.6% 2008 40.2% 44.6% 29.8% 26.0% 26.2% 37.6% 37.1% 32.8% 60.0% 26.4% 16.9%
Dispo-sitional Placement
2009 29.1% 47.0% 30.5% 27.1% 32.5% 36.0% 33.9% 41.0% 48.9% 28.3% 13.0% (Table continued on next page)

12
TABLE 13. NATURE OF DEPARTURES FROM DETENTION (Continued from Prior Page)8
RELEASE TO: Atl Cam Esxa Mon Hudb Mer Unic Ber Ocn9 Bur Som9
2005 1.0% 1.9% 1.4% 2.4% 3.7% 0.7% 2.0% 4.5% 2.2% 2006 3.0% 1.8% 1.1% 0.7% 1.9% 0.7% 7.4% 2.2% 2007 1.9% 1.8% 0.8% 1.5% 2.3% 1.1% 1.8% 3.5% 1.6% 2008 2.1% 3.3% 1.3% 0.7% 2.4% 1.3% 2.1% 1.7% 1.4% 0.4% 0.0%
Jail, Bail, Upon/After Waiver
2009 1.5% 3.5% 0.8% 3.3% 4.2% 2.2% 1.3% 0.7% 2.3% 0.4% 5.2%
2005 5.1% 1.5% 0.5% 3.1% 0.7% 2.9% 16.7% 5.3% 4.4% 2006 4.7% 1.9% 1.5% 3.7% 1.4% 2.3% 3.7% 7.2% 2007 4.4% 2.7% 1.7% 4.3% 2.6% 2.4% 5.7% 13.3% 9.6% 2008 3.6% 3.6% 1.4% 4.6% 3.2% 3.8% 8.5% 6.7% 1.4% 11.6% 5.9%
Other YDC/ Other Authorities
2009 4.2% 2.2% 2.0% 3.7% 5.8% 4.1% 13.9% 2.2% 6.8% 10.4% 5.2%
2005 0.5% 0.0% 1.2% 0.0% 5.5% 3.0% 0.4% 3.7% 1.5% 2006 1.5% 0.8% 2.2% 0.7% 4.7% 2.7% 0.0% 3.1% 2007 0.7% 0.6% 3.6% 0.9% 6.6% 4.4% 2.1% 0.0% 2.5% 2008 0.0% 0.7% 3.7% 0.4% 6.1% 3.0% 2.5% 1.7% 0.0% 6.7% 0.0%
Dismissed, Diverted, Similar
2009 0.0% 0.9% 4.6% 0.0% 2.7% 3.4% 1.0% 4.3% 1.7% 3.6% 0.0%
2005 0.0% 0.0% 0.0% 0.0% 0.0% 0.0% 0.8% 11.5% 0.0% 2006 0.0% 0.0% 1.7% 0.0% 0.0% 0.3% 2.2% 0.0% 2007 0.0% 0.0% 1.6% 0.3% 0.1% 0.2% 0.0% 1.8% 0.0% 2008 0.0% 0.0% 1.6% 0.0% 0.0% 1.8% 0.0% 0.0% 1.9% 0.4% 0.8%
Time Served
2009 0.0% 0.0% 1.4% 0.0% 0.0% 0.7% 0.0% 0.0% 2.3% 0.0% 0.9%
2005 0.0% 0.0% 0.0% 0.0% 0.4% 0.0% 0.0% 0.0% 0.0% 2006 0.0% 0.1% 0.0% 0.0% 1.8% 0.0% 0.7% 0.0% 2007 0.0% 0.6% 0.1% 0.3% 0.1% 0.3% 1.1% 0.0% 0.0% 2008 0.0% 0.0% 0.0% 0.0% 0.1% 0.0% 0.0% 0.0% 0.0% 0.0% 0.0%
Other
2009 0.0% 0.0% 0.2% 0.0% 0.0% 0.0% 0.0% 0.0% 0.6% 0.0% 0.0% aEssex’s 2005 data is Jun-Dec. bHudson’s 2005 data is Oct-Dec. cUnion’s 2007 data begins with May.

13
DETENTION ALTERNATIVE OUTCOMES Detention alternatives are short-term placements for youth who would otherwise remain in detention while their cases are pending in court. The primary purpose of detention alternatives is to provide supervision in order to minimize the likelihood that youth will be charged for a new delinquency offense while awaiting disposition of their current case. Alternatives also help to ensure youth appear at each required court hearing. Table 14 describes outcomes for youth supervised in detention alternatives by reporting the nature of departures from alternative placement. In 2009, eight sites reported detention alternatives outcome data. Across these eight sites, the vast majority of youth were released from detention alternatives following successful completion, ranging from 66.7% in Ocean to about 87% in Hudson and Monmouth. Importantly, the proportion of youth removed from a detention alternative as the result of a new delinquency charge is small – 6% or less across sites in 2009, and ranging from 1.8% in Camden to 6.2% in Essex. Finally, in 2009 youth removed from alternative programs for non-compliance (no new charges) ranged from a low of 8.4% in Hudson to a high of 29.8% in Ocean.
TABLE 14. DETENTION ALTERNATIVE OUTCOMES Atlantic Camden Essex Monmouth Hudson^^ Mercer Burlington Ocean
2006 70.6% 81.4% 78.1% 78.0% 2007 73.6% 77.5% 84.7% 2008 78.4% 78.5% 84.8% 81.3% 83.0% 72.3%
Successful Completion
2009 83.8% 75.1% 82.2% 86.8% 87.0% 77.6% 72.7% 66.7%
2006 9.5% 4.3% 6.7% 6.6% 2007 3.5% 6.6% 3.9% 2008 2.9% 6.1% 3.3% 9.4% 4.3% 0.0%
New Charges
2009 3.8% 1.8% 6.2% 2.8% 4.7% 2.4% 4.5% 3.6%
2006 19.9% 14.3% 15.2% 15.4% 2007 22.8% 15.9% 11.3% 2008 18.6% 15.3% 11.9% 9.4% 12.8% 27.7%
Violation/ Non-Compliance (No New Charges) 2009 12.4% 23.1% 11.6% 10.4% 8.4% 20.0% 22.7% 29.8%

14
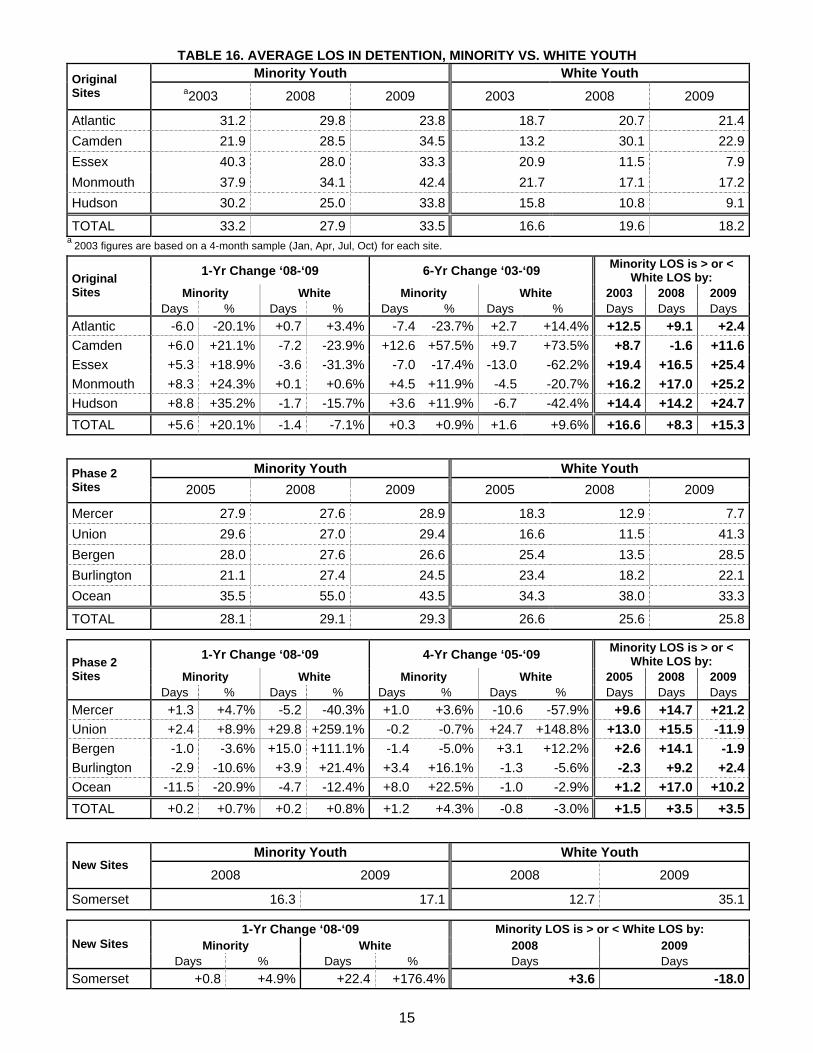
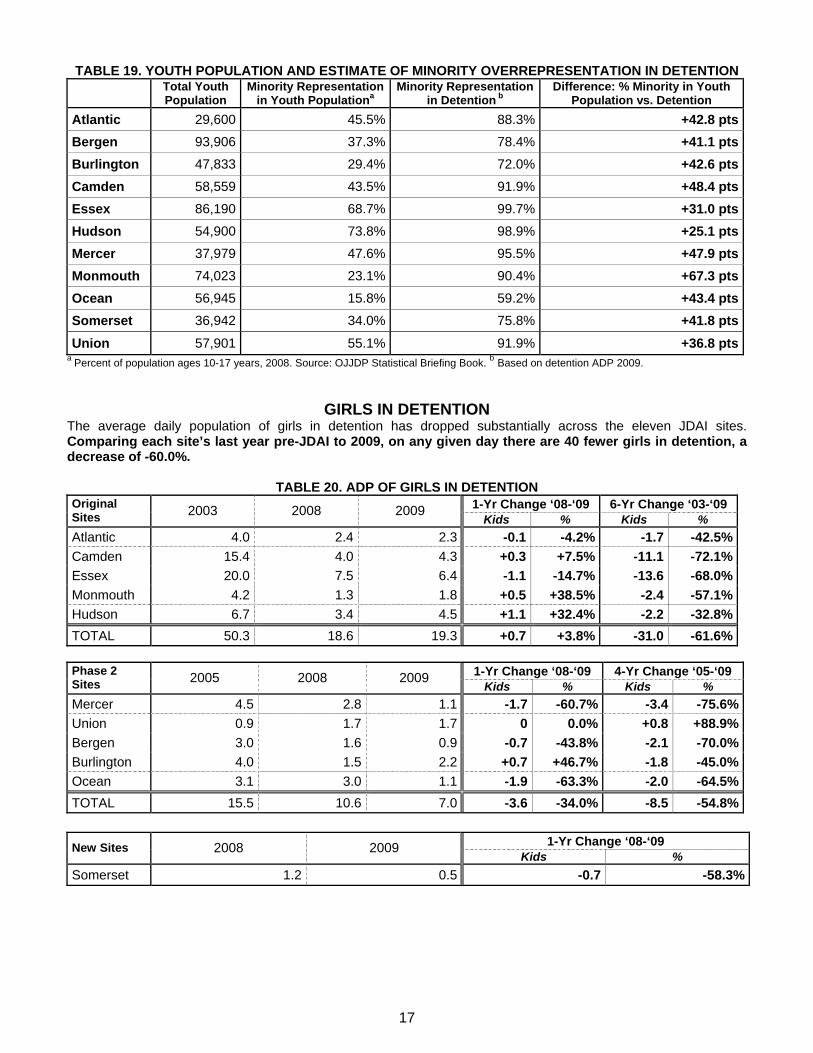
MINORITY YOUTH IN DETENTION Average Daily Population. On any given day in 2009, across the original JDAI sites there were 210 fewer youth of color in detention than in 2003, a decrease of -45.2% (Table 15). The number of minority youth in detention has dropped by about half in Essex (-53.5%), Atlantic (-52.9%), and Camden (-46.2%). In the past year alone, ADP of minority youth in detention dropped by one-third in Atlantic (-33.0%). In the five phase 2 sites, between 2005 and 2009, ADP of minority youth in detention dropped by one-third (-32.1%), with decreases of more than half in Bergen (-51.6%) and Mercer (-50.5%). The newest JDAI site, Somerset, has also experienced a decrease (-23.0%). Taking all eleven sites collectively and comparing each site’s last year pre-JDAI to 2009 indicates that on any given day, there are now 256 fewer youth of color in detention, a decrease of -42.0%; youth of color account for 88.7% of the total drop in ADP. Length of Stay. Unfortunately, like the overall length of stay trends described earlier, early gains made in terms of reducing the gap between youth of color and white youth have been essentially lost (Table 16). In 2003, in the original JDAI sites minority youth remained in detention 16.6 days longer than white youth. While in 2008 this gap had been reduced to 8.3 days, in 2009 minority youth once again remained in detention more than two weeks longer than white youth (15.3 days). In the phase 2 sites, the ALOS gap between minority youth and white youth increased from 1.5 days in 2005 to 3.5 days in 2009. However, in 2009, there were three sites where the ALOS gap between youth of color and white youth was close to zero: Atlantic (+2.4 days), Bergen (-1.9 days), and Burlington (+2.4). On the other hand, in four sites youth of color remained in detention more than three weeks longer than white youth: Essex (+25.4), Monmouth (25.2), Hudson (+24.7), and Mercer (+21.2). Disproportionality. Despite the substantial drop in the number of minority youth in detention, disproportionality in ADP has not been reduced (Table 18). While the percentage of ADP comprised of youth of color has remained essentially flat or decreased in six sites, the upward trend in the five remaining sites was more sizable. Union and Somerset saw the largest pre- vs. post-JDAI decreases, with the proportion of ADP comprised of minority youth dropping by about -6 percentage points. Conversely, increases of about +15 percentage points have occurred in Monmouth and Ocean. Finally, Table 19 provides additional context for the data presented in Tables 15 through 18. For each JDAI site, Table 19 reports the proportion of detention average daily population comprised of minority youth, as compared to minority representation in the general youth population. Disproportionality is evident in all eleven sites, ranging from 25.1 percentage points in Hudson to 67.3 points in Monmouth.
TABLE 15. ADP OF MINORITY YOUTH IN DETENTION 1-Yr Change ‘08-‘09 6-Yr Change ‘03-‘09 Original
Sites 2003 2008 2009 Kids % Kids %
Atlantic 30.6 21.5 14.4 -7.1 -33.0% -16.2 -52.9%Camden 79.9 44.7 43.0 -1.7 -3.8% -36.9 -46.2%Essex 242.6 113.2 112.9 -0.3 -0.3% -129.7 -53.5%Monmouth 29.8 25.4 23.2 -2.2 -8.7% -6.6 -22.1%Hudson 82.5 59.5 61.6 +2.1 +3.5% -20.9 -25.3%TOTAL 465.4 264.3 255.1 -9.2 -3.5% -210.3 -45.2%
1-Yr Change ‘08-‘09 4-Yr Change ‘05-‘09 Phase 2
Sites 2005 2008 2009 Kids % Kids %
Mercer 57.6 41.3 28.5 -12.8 -31.0% -29.1 -50.5%Union 38.4 31.1 31.7 +0.6 +1.9% -6.7 -17.4%Bergen 16.1 11.0 7.8 -3.2 -29.1% -8.3 -51.6%Burlington 13.4 14.2 13.6 -0.6 -4.2% +0.2 +1.5%Ocean 10.6 9.8 10.8 +1.0 +10.2% +0.2 +1.9%TOTAL 136.1 107.4 92.4 -15.0 -14.0% -43.7 -32.1%
1-Yr Change ‘08-‘09 New Sites 2008 2009
Kids % Somerset 7.4 5.7 -1.7 -23.0%
15
TABLE 16. AVERAGE LOS IN DETENTION, MINORITY VS. WHITE YOUTH Minority Youth White Youth Original
Sites a2003 2008 2009 2003 2008 2009
Atlantic 31.2 29.8 23.8 18.7 20.7 21.4Camden 21.9 28.5 34.5 13.2 30.1 22.9Essex 40.3 28.0 33.3 20.9 11.5 7.9Monmouth 37.9 34.1 42.4 21.7 17.1 17.2Hudson 30.2 25.0 33.8 15.8 10.8 9.1
TOTAL 33.2 27.9 33.5 16.6 19.6 18.2a 2003 figures are based on a 4-month sample (Jan, Apr, Jul, Oct) for each site.
1-Yr Change ‘08-‘09 6-Yr Change ‘03-‘09 Minority LOS is > or < White LOS by:
Minority White Minority White 2003 2008 2009 Original Sites
Days % Days % Days % Days % Days Days Days Atlantic -6.0 -20.1% +0.7 +3.4% -7.4 -23.7% +2.7 +14.4% +12.5 +9.1 +2.4Camden +6.0 +21.1% -7.2 -23.9% +12.6 +57.5% +9.7 +73.5% +8.7 -1.6 +11.6Essex +5.3 +18.9% -3.6 -31.3% -7.0 -17.4% -13.0 -62.2% +19.4 +16.5 +25.4Monmouth +8.3 +24.3% +0.1 +0.6% +4.5 +11.9% -4.5 -20.7% +16.2 +17.0 +25.2Hudson +8.8 +35.2% -1.7 -15.7% +3.6 +11.9% -6.7 -42.4% +14.4 +14.2 +24.7TOTAL +5.6 +20.1% -1.4 -7.1% +0.3 +0.9% +1.6 +9.6% +16.6 +8.3 +15.3
Minority Youth White Youth Phase 2 Sites 2005 2008 2009 2005 2008 2009
Mercer 27.9 27.6 28.9 18.3 12.9 7.7Union 29.6 27.0 29.4 16.6 11.5 41.3Bergen 28.0 27.6 26.6 25.4 13.5 28.5Burlington 21.1 27.4 24.5 23.4 18.2 22.1Ocean 35.5 55.0 43.5 34.3 38.0 33.3
TOTAL 28.1 29.1 29.3 26.6 25.6 25.8
1-Yr Change ‘08-‘09 4-Yr Change ‘05-‘09 Minority LOS is > or < White LOS by:
Minority White Minority White 2005 2008 2009 Phase 2 Sites
Days % Days % Days % Days % Days Days Days Mercer +1.3 +4.7% -5.2 -40.3% +1.0 +3.6% -10.6 -57.9% +9.6 +14.7 +21.2Union +2.4 +8.9% +29.8 +259.1% -0.2 -0.7% +24.7 +148.8% +13.0 +15.5 -11.9Bergen -1.0 -3.6% +15.0 +111.1% -1.4 -5.0% +3.1 +12.2% +2.6 +14.1 -1.9Burlington -2.9 -10.6% +3.9 +21.4% +3.4 +16.1% -1.3 -5.6% -2.3 +9.2 +2.4Ocean -11.5 -20.9% -4.7 -12.4% +8.0 +22.5% -1.0 -2.9% +1.2 +17.0 +10.2TOTAL +0.2 +0.7% +0.2 +0.8% +1.2 +4.3% -0.8 -3.0% +1.5 +3.5 +3.5
Minority Youth White Youth New Sites
2008 2009 2008 2009
Somerset 16.3 17.1 12.7 35.1
1-Yr Change ‘08-‘09 Minority LOS is > or < White LOS by: Minority White 2008 2009 New Sites
Days % Days % Days Days Somerset +0.8 +4.9% +22.4 +176.4% +3.6 -18.0

16
TABLE 17. % OF DETENTION ADMISSIONS COMPRISED OF MINORITY YOUTH 1-Yr Change ‘08-‘09 6-Yr Change ‘03-‘09 Original
Sites 2003 2008 2009 Pts % Pts %
Atlantic 85.0% 83.9% 86.7% +2.8 +3.3% +1.7 +2.0%Camden 80.4% 89.5% 86.5% -3.0 -3.4% +6.1 +7.6%Essex 98.5% 97.7% 98.6% +0.9 +0.9% +0.1 +0.1%Monmouth 62.8% 80.1% 79.3% -0.8 -1.0% +16.5 +26.3%Hudson 93.9% 95.6% 95.1% -0.5 -0.5% +1.2 +1.3%TOTAL 89.0% 93.1% 92.9% -0.2 -0.2% +3.9 +4.4%
1-Yr Change ‘08-‘09 4-Yr Change ‘05-‘09 Phase 2
Sites 2005 2008 2009 Pts % Pts %
Mercer 94.6% 93.6% 90.3% -3.3 -3.5% -4.3 -4.5%Union 94.8% 94.5% 95.5% +1.0 +1.1% +0.7 +0.7%Bergen 75.6% 81.2% 77.8% -3.4 -4.2% +2.2 +2.9%Burlington 66.9% 73.9% 68.8% -5.1 -6.9% +1.9 +2.8%Ocean 43.0% 37.8% 52.5% +14.7 +38.9% +9.5 +22.1%TOTAL 83.1% 83.0% 81.7% -1.3 -1.6% -1.4 -1.7%
1-Yr Change ‘08-‘09 New Sites 2008 2009
Pts % Somerset 69.8% 80.7% +10.9 +15.6%
TABLE 18. % OF DETENTION ADP COMPRISED OF MINORITY YOUTH
1-Yr Change ‘08-‘09 6-Yr Change ‘03-‘09 Original Sites 2003 2008 2009
Pts % Pts % Atlantic 89.7% 88.2% 88.3% +0.1 +0.1% -1.4 -1.6%Camden 84.5% 89.5% 91.9% +2.4 +2.7% +7.4 +8.8%Essex 99.6% 98.7% 99.7% +1.0 +1.0% +0.1 +0.1%Monmouth 74.5% 90.9% 90.4% -0.5 -0.6% +15.9 +21.3%Hudson 95.1% 97.8% 98.9% +1.1 +1.1% +3.8 +4.0%TOTAL 93.3% 95.2% 96.6% +1.4 +1.5% +3.3 +3.5%
1-Yr Change ‘08-‘09 4-Yr Change ‘05-‘09 Phase 2
Sites 2005 2008 2009 Pts % Pts %
Mercer 96.0% 97.3% 95.5% -1.8 -1.8% -0.5 -0.5%Union 98.1% 97.4% 91.9% -5.5 -5.6% -6.2 -6.3%Bergen 79.4% 87.4% 78.4% -9.0 -10.3% -1.0 -1.3%Burlington 65.6% 79.1% 72.0% -7.1 -9.0% +6.4 +9.8%Ocean 44.4% 44.9% 59.2% +14.3 +31.8% +14.8 +33.3%TOTAL 83.2% 84.7% 82.9% -1.8 -2.1% -0.3 -0.4%
1-Yr Change ‘08-‘09 New Sites 2008 2009
Pts % Somerset 81.9% 75.8% -6.1 -7.4%
17
TABLE 19. YOUTH POPULATION AND ESTIMATE OF MINORITY OVERREPRESENTATION IN DETENTION
Total Youth Population
Minority Representation in Youth Populationa
Minority Representation in Detention b
Difference: % Minority in Youth Population vs. Detention
Atlantic 29,600 45.5% 88.3% +42.8 ptsBergen 93,906 37.3% 78.4% +41.1 ptsBurlington 47,833 29.4% 72.0% +42.6 ptsCamden 58,559 43.5% 91.9% +48.4 ptsEssex 86,190 68.7% 99.7% +31.0 ptsHudson 54,900 73.8% 98.9% +25.1 ptsMercer 37,979 47.6% 95.5% +47.9 ptsMonmouth 74,023 23.1% 90.4% +67.3 ptsOcean 56,945 15.8% 59.2% +43.4 ptsSomerset 36,942 34.0% 75.8% +41.8 ptsUnion 57,901 55.1% 91.9% +36.8 pts
a Percent of population ages 10-17 years, 2008. Source: OJJDP Statistical Briefing Book. b Based on detention ADP 2009.
GIRLS IN DETENTION The average daily population of girls in detention has dropped substantially across the eleven JDAI sites. Comparing each site’s last year pre-JDAI to 2009, on any given day there are 40 fewer girls in detention, a decrease of -60.0%.
TABLE 20. ADP OF GIRLS IN DETENTION 1-Yr Change ‘08-‘09 6-Yr Change ‘03-‘09 Original
Sites 2003 2008 2009 Kids % Kids %
Atlantic 4.0 2.4 2.3 -0.1 -4.2% -1.7 -42.5%Camden 15.4 4.0 4.3 +0.3 +7.5% -11.1 -72.1%Essex 20.0 7.5 6.4 -1.1 -14.7% -13.6 -68.0%Monmouth 4.2 1.3 1.8 +0.5 +38.5% -2.4 -57.1%Hudson 6.7 3.4 4.5 +1.1 +32.4% -2.2 -32.8%TOTAL 50.3 18.6 19.3 +0.7 +3.8% -31.0 -61.6%
1-Yr Change ‘08-‘09 4-Yr Change ‘05-‘09 Phase 2
Sites 2005 2008 2009 Kids % Kids %
Mercer 4.5 2.8 1.1 -1.7 -60.7% -3.4 -75.6%Union 0.9 1.7 1.7 0 0.0% +0.8 +88.9%Bergen 3.0 1.6 0.9 -0.7 -43.8% -2.1 -70.0%Burlington 4.0 1.5 2.2 +0.7 +46.7% -1.8 -45.0%Ocean 3.1 3.0 1.1 -1.9 -63.3% -2.0 -64.5%TOTAL 15.5 10.6 7.0 -3.6 -34.0% -8.5 -54.8%
1-Yr Change ‘08-‘09 New Sites 2008 2009
Kids % Somerset 1.2 0.5 -0.7 -58.3%

18
24-Month ADP Trend: CAMDEN * ^
56 56 49 48 51 49 39 55 56 55 46 40 43 46 47 54 55 44 40 48 49 49 49 37
9
7
8 7
4 3
7
5954 56
63
53
61
47
54
49 4853
44
0
10
20
30
40
50
60
70
80
90
100
JAN
'08
FEB
'08
MA
R '0
8
AP
R '0
8
MA
Y '0
8
JUN
'08
JUL
'08
AU
G '0
8
SE
P '0
8
OC
T '0
8
NO
V '0
8
DE
C '0
8
JAN
'09
FEB
'09
MA
R '0
9
AP
R '0
9
MA
Y '0
9
JUN
'09
JUL
'09
AU
G '0
9
SE
P '0
9
OC
T '0
9
NO
V '0
9
DE
C '0
9
24-Month ADP Trend: ATLANTIC25 23 21 24 33 34 25 20 20 27 22 18 11 12 12 15 15 15 21 21 22 21 15 16
1513 12 13
21
35 35
2224
2624 23
1917
2523
32
1821
1922
26 2522
0
10
20
30
40
50
60
70JA
N '0
8
FEB
'08
MA
R '0
8
AP
R '0
8
MA
Y '0
8
JUN
'08
JUL
'08
AU
G '0
8
SE
P '0
8
OC
T '0
8
NO
V '0
8
DE
C '0
8
JAN
'09
FEB
'09
MA
R '0
9
AP
R '0
9
MA
Y '0
9
JUN
'09
JUL
'09
AU
G '0
9
SE
P '0
9
OC
T '0
9
NO
V '0
9
DE
C '0
9
DETENTION ALTERNATIVES ADP Minority Female High ADP Minority Female 2003 34.1 89.7% 11.7% 47 21.0 81.2% 6.4% 2004 30.5 90.5% 14.4% 44 19.6 83.2% 14.1% 2005 30.4 91.5% 11.3% 45 24.7 86.8% 15.2% 2006 24.8 89.1% 4.8% 43 26.3 86.6% 15.4% 2007 30.3 93.9% 10.5% 43 23.5 88.9% 11.5% 2008 24.4 88.2% 11.0% 39 22.3 83.4% 10.1% 2009 16.3 88.3% 14.0% 26 22.4 79.5% 14.7%
YDC Capacity (27)
DETENTION ALTERNATIVES ADP Minority Fem High ADP Minority Fem 2003 94.6 84.5% 16.3% 131 2004 78.9 85.5% 13.1% 113 2005 61.5 84.7% 8.9% 82 2006 47.6 85.7% 9.0% 68 2007 44.7 89.2% 6.5% 72 2008 49.9 89.5% 8.0% 65 2009 46.7 91.9% 9.2% 61 (64) 53.3 83.3% 19.5%
Detention 35 Alternatives
YDC Capacity (61)

19
`
24-Month ADP Trend: MONMOUTH
25 22 27 30 40 32 25 19 24 26 22 26 35 35 25 24 28 26 19 1827 30 33 25
15
2016
13
2219 18
16
11 1214
12
1922
2622
15 1618
16
2421 20
18
0
10
20
30
40
50
60
70
JAN
'08
FEB
'08
MA
R '0
8
AP
R '0
8
MA
Y '0
8
JUN
'08
JUL
'08
AU
G '0
8
SE
P '0
8
OC
T '0
8
NO
V '0
8
DE
C '0
8
JAN
'09
FEB
'09
MA
R '0
9
AP
R '0
9
MA
Y '0
9
JUN
'09
JUL
'09
AU
G '0
9
SE
P '0
9
OC
T '0
9
NO
V '0
9
DE
C '0
9
YDC Capacity (40)
24-Month ADP Trend: ESSEX^
111
113
116
110
105
119
126
120
119
111
105
118
132
120
102
112
117
117
111
95
43
51
47
43
48
49
41
39
37
125
109
103
115
100111 109 113 115
95 97 10294
111102
122108
115
137125 128
121 125132
126
102
84 84
0
50
100
150
200
250JA
N '0
8
FEB
'08
MA
R '0
8
AP
R '0
8
MA
Y '0
8
JUN
'08
JUL
'08
AU
G '0
8
SE
P '0
8
OC
T '0
8
NO
V '0
8
DE
C '0
8
JAN
'09
FEB
'09
MA
R '0
9
AP
R '0
9
MA
Y '0
9
JUN
'09
JUL
'09
AU
G '0
9
SE
P '0
9
OC
T '0
9
NO
V '0
9
DE
C '0
9
DETENTION ALTERNATIVES** ADP Minority Fem High ADP Minority Fem 2003 243.6 99.6% 8.2% 308 - - - 2004 171.0 99.5% 6.5% 224 - - - 2005 138.5 99.6% 5.6% 191 96.5 - - 2006 115.1 99.1% 6.4% 156 97.6 - - 2007 128.6 98.9% 4.1% 151 125.3 98.2% 5.7% 2008 114.7 98.7% 6.6% 132 105.7 95.6% 10.8% 2009 113.2 99.7% 5.7% 142 (194) 125.3 93.0% 10.2%
YDC Capacity (242)
DETENTION ALTERNATIVES ADP Minority Female High ADP Minority Female 2003 40.0 74.5% 10.5% 50 11.4 57.0% 7.9% 2004 39.5 69.6% 11.9% 54 11.6 63.8% 15.5% 2005 24.9 80.4% 15.4% 36 7.7 68.8% 3.9% 2006 22.2 80.6% 13.8% 37 13.6 75.0% 14.0% 2007 21.8 84.3% 12.7% 31 25.0 73.1% 11.0% 2008 27.9 90.9% 4.5% 44 15.5 72.4% 8.1% 2009 25.7 90.4% 6.9% 40 19.8 73.1% 5.8%
Detention 35 Alternatives
20
24-Month ADP Trend: HUDSON
57 54 53 53 58 60 60 71 68 74 66 56 67 78 71 60 56 67 70 63 61 54 53 48
93 95
106
94
83
6560
5258 59 59
5245
3741
5145
4958
67 70 70
84 84
0
20
40
60
80
100
120
140
160
JAN
'08
FEB
'08
MA
R '0
8
AP
R '0
8
MA
Y '0
8
JUN
'08
JUL
'08
AU
G '0
8
SE
P '0
8
OC
T '0
8
NO
V '0
8
DE
C '0
8
JAN
'09
FEB
'09
MA
R '0
9
AP
R '0
9
MA
Y '0
9
JUN
'09
JUL
'09
AU
G '0
9
SE
P '0
9
OC
T '0
9
NO
V '0
9
DE
C '0
9
YDC Capacity (79)
24-Month ADP Trend: MERCER
63 52 49 41 47 42 32 42 39 45 34 29 25 30 28 30 33 37 34 29 28 29 26444451540
10
20
30
40
50
60
70
80
90
100
OC
T '0
7
NO
V '0
7
DE
C '0
7
JAN
'08
FEB
'08
MA
R '0
8
AP
R '0
8
MA
Y '0
8
JUN
'08
JUL
'08
AU
G '0
8
SE
P '0
8
OC
T '0
8
NO
V '0
8
DE
C '0
8
JAN
'09
FEB
'09
MA
R '0
9
AP
R '0
9
MA
Y '0
9
JUN
'09
JUL
'09
AU
G '0
9
SE
P '0
9
OC
T '0
9
NO
V '0
9
DE
C '0
9
YDC Capacity (64)
DETENTION ALTERNATIVES^^ ADP Minority Female High ADP Minority Female 2003 86.7 95.1% 7.7% 116 2004 79.2 94.6% 9.2% 112 2005 66.2 95.7% 5.8% 94 2006 74.3 96.9% 4.6% 102 2007 63.1 98.4% 3.7% 97 2008 60.8 97.8% 5.6% 86 72.9 -- 15.4% 2009 62.3 98.9% 7.2% 84 58.6 93.0% 14.0%
DETENTION ALTERNATIVES ADP Minority Female High ADP Minority Female 2005 60.0 96.0% 7.5% 80 2006 61.2 94.2% 10.4% 80 2007 55.8 98.0% 9.1% 85 2008 42.5 97.3% 6.7% 57 2009 29.8 95.5% 3.7% 42
Detention 35 Alternatives

21
24-Month ADP Trend: UNION * ^28 35 37 30 37 33 29 29 32 32 34 28 24 22 27 26 27 34 37 39 47 43 43 44
7
12
13
14 13
10
26 2622
2831
33
28 27 2622 21
1719
17
2528
1719 19
29
24
3329
26
0
10
20
30
40
50
60
70
80JA
N '0
8
FEB
'08
MA
R '0
8
AP
R '0
8
MA
Y '0
8
JUN
'08
JUL
'08
AU
G '0
8
SE
P '0
8
OC
T '0
8
NO
V '0
8
DE
C '0
8
JAN
'09
FEB
'09
MA
R '0
9
AP
R '0
9
MA
Y '0
9
JUN
'09
JUL
'09
AU
G '0
9
SE
P '0
9
OC
T '0
9
NO
V '0
9
DE
C '0
9
YDC Capacity (34/76)
DETENTION ALTERNATIVES ADP Minority Fem High ADP Minority Fem 2005 39.2 98.1% 2.4% 55 2006 26.3 96.1% 2.9% 42 2007 28.3 97.8% 1.6% 44 2008 32.0 97.4% 5.4% 47 25.4 -- -- 2009 34.5 91.9% 4.9% 54(68) 23.7 -- --
24-Month ADP Trend: BERGEN *
11 9 11 14 14 13 18 18 10 10 8 7 6 5 10 11 15 12 12 126 12 12 12
31
2523
2725
30
27
3133 32
34 35
0
10
20
30
40
50
JAN
'08
FEB
'08
MA
R '0
8
AP
R '0
8
MA
Y '0
8
JUN
'08
JUL
'08
AU
G '0
8
SE
P '0
8
OC
T '0
8
NO
V '0
8
DE
C '0
8
JAN
'09
FEB
'09
MA
R '0
9
AP
R '0
9
MA
Y '0
9
JUN
'09
JUL
'09
AU
G '0
9
SE
P '0
9
OC
T '0
9
NO
V '0
9
DE
C '0
9
DETENTION ALTERNATIVES ADP Minority Female High ADP Minority Female 2005 20.3 79.4% 14.7% 32 2006 12.2 88.2% 13.3% 21 2007 8.9 80.3% 11.3% 15 2008 12.6 87.4% 12.3% 22 2009 10.0 78.4% 8.6% 18 29.3 -- --
YDC Capacity (41/14)
Detention 35 Alternatives

22
24-Month ADP Trend: BURLINGTON19 24 21 20 20 16 19 16 16 14 15 16 19 19 21 20 19 20 21 16 19 18 18 16
1
2
4
1
0
10
20
30
40
50
60JA
N '0
8
FEB
'08
MA
R '0
8
AP
R '0
8
MA
Y '0
8
JUN
'08
JUL
'08
AU
G '0
8
SE
P '0
8
OC
T '0
8
NO
V '0
8
DE
C '0
8
JAN
'09
FEB
'09
MA
R '0
9
AP
R '0
9
MA
Y '0
9
JUN
'09
JUL
'09
AU
G '0
9
SE
P '0
9
OC
T '0
9
NO
V '0
9
DE
C '0
9
24-Month ADP Trend: OCEAN^
32 35 34 23 24 25 15 20 18 13 12 10 11 21 18 21 25 26 21 22 14 12 13 15
7
6 6
10 10 7
6
5 8
6
3 4 4
9
8
8
9
4
5
6
8
6
3
4
0
10
20
30
40
50
60
JAN
'08
FEB
'08
MA
R '0
8
AP
R '0
8
MA
Y '0
8
JUN
'08
JUL
'08
AU
G '0
8
SE
P '0
8
OC
T '0
8
NO
V '0
8
DE
C '0
8
JAN
'09
FEB
'09
MA
R '0
9
AP
R '0
9
MA
Y '0
9
JUN
'09
JUL
'09
AU
G '0
9
SE
P '0
9
OC
T '0
9
NO
V '0
9
DE
C '0
9
DETENTION ALTERNATIVES ADP Minority Fem High ADP Minority Female 2005 20.4 65.6% 19.6% 34 2006 12.9 69.4% 21.0% 21 2007 25.1 76.4% 16.5% 40 2008 18.0 79.1% 8.2% 29 2009 18.9 72.0% 11.8% 32 (30)
DETENTION ALTERNATIVES ADP Minority Female High ADP Minority Female 2005 23.7 44.4% 13.1% 33 2006 20.3 38.7% 10.0% 32 2007 24.2 46.2% 10.7% 38 2008 21.7 44.9% 13.9% 40 2009 18.2 59.2% 6.2% 32
YDC Capacity (24)
YDC Capacity (30)
Detention 35 Alternatives
23
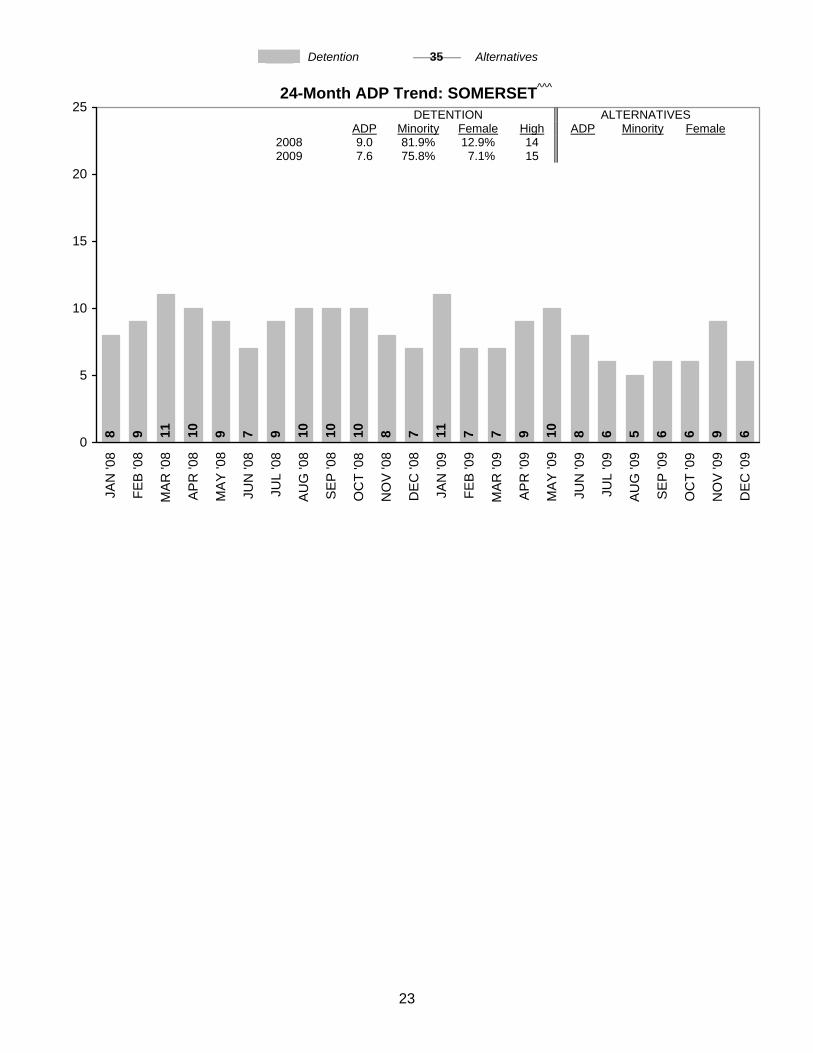
24-Month ADP Trend: SOMERSET^^^
8 9 11 10 9 7 9 10 10 10 8 7 11 7 7 9 10 8 6 5 6 6 9 60
5
10
15
20
25JA
N '0
8
FEB
'08
MA
R '0
8
AP
R '0
8
MA
Y '0
8
JUN
'08
JUL
'08
AU
G '0
8
SE
P '0
8
OC
T '0
8
NO
V '0
8
DE
C '0
8
JAN
'09
FEB
'09
MA
R '0
9
AP
R '0
9
MA
Y '0
9
JUN
'09
JUL
'09
AU
G '0
9
SE
P '0
9
OC
T '0
9
NO
V '0
9
DE
C '0
9
Detention 35 Alternatives
DETENTION ALTERNATIVES ADP Minority Female High ADP Minority Female 2008 9.0 81.9% 12.9% 14 2009 7.6 75.8% 7.1% 15
24
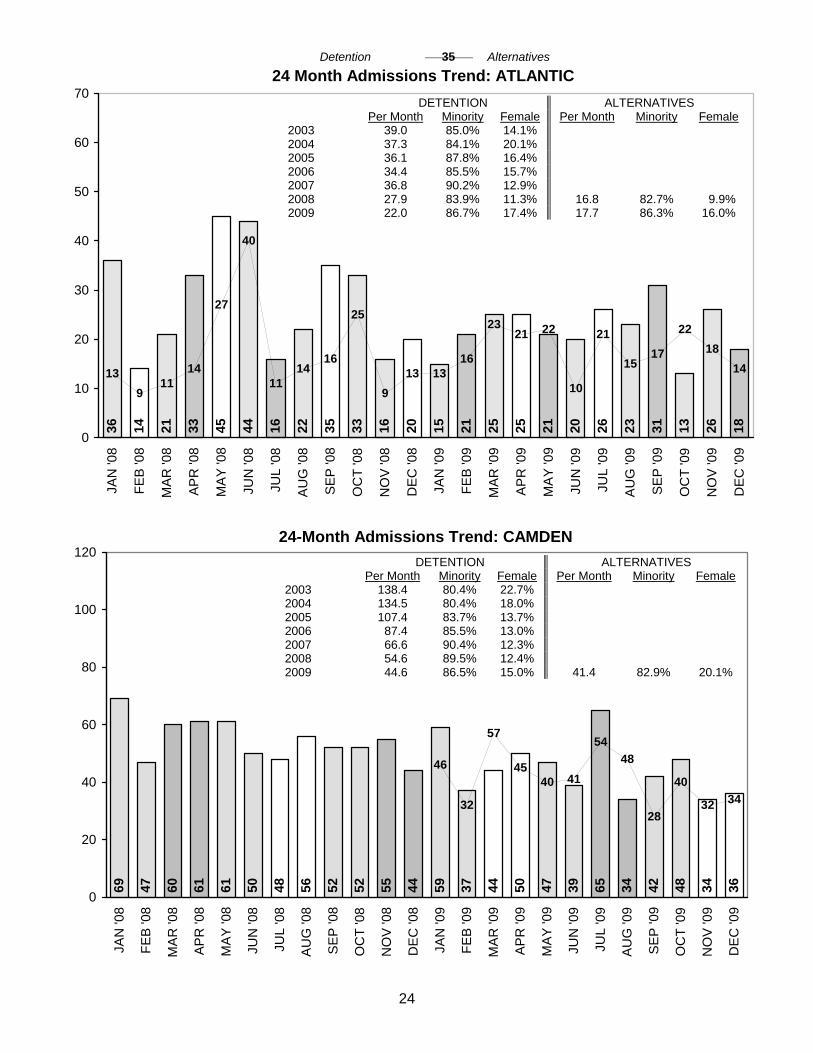
24 Month Admissions Trend: ATLANTIC
36 14 21 33 45 44 16 22 35 33 16 20 15 21 25 25 21 20 26 23 31 13 26 18
139
1114
27
40
1114
16
25
913 13
16
2321 22
10
21
1517
2218
14
0
10
20
30
40
50
60
70JA
N '0
8
FEB
'08
MA
R '0
8
AP
R '0
8
MA
Y '0
8
JUN
'08
JUL
'08
AU
G '0
8
SE
P '0
8
OC
T '0
8
NO
V '0
8
DE
C '0
8
JAN
'09
FEB
'09
MA
R '0
9
AP
R '0
9
MA
Y '0
9
JUN
'09
JUL
'09
AU
G '0
9
SE
P '0
9
OC
T '0
9
NO
V '0
9
DE
C '0
9
24-Month Admissions Trend: CAMDEN
47 60 61 61 50 48 52 52 55 59 37 44 50 47 39 65 34 42 48 34 3669 4456
46
32
57
4540 41
5448
28
40
32 34
0
20
40
60
80
100
120
JAN
'08
FEB
'08
MA
R '0
8
AP
R '0
8
MA
Y '0
8
JUN
'08
JUL
'08
AU
G '0
8
SE
P '0
8
OC
T '0
8
NO
V '0
8
DE
C '0
8
JAN
'09
FEB
'09
MA
R '0
9
AP
R '0
9
MA
Y '0
9
JUN
'09
JUL
'09
AU
G '0
9
SE
P '0
9
OC
T '0
9
NO
V '0
9
DE
C '0
9
DETENTION ALTERNATIVES Per Month Minority Female Per Month Minority Female 2003 39.0 85.0% 14.1% 2004 37.3 84.1% 20.1% 2005 36.1 87.8% 16.4% 2006 34.4 85.5% 15.7% 2007 36.8 90.2% 12.9% 2008 27.9 83.9% 11.3% 16.8 82.7% 9.9% 2009 22.0 86.7% 17.4% 17.7 86.3% 16.0%
Detention 35 Alternatives
DETENTION ALTERNATIVES Per Month Minority Female Per Month Minority Female 2003 138.4 80.4% 22.7% 2004 134.5 80.4% 18.0% 2005 107.4 83.7% 13.7% 2006 87.4 85.5% 13.0% 2007 66.6 90.4% 12.3% 2008 54.6 89.5% 12.4% 2009 44.6 86.5% 15.0% 41.4 82.9% 20.1%

25
24-Month Admissions Trend: ESSEX
137
137
133
135
121
119
143
132
87 118
103
125
133
112
86 106
115
102
122
93 7987 90159
90 8576
10085 79 74
64
101 96
6176 82 79
8899
86 8494
83 90102
84 84
0
50
100
150
200
250
300JA
N '0
8
FEB
'08
MA
R '0
8
AP
R '0
8
MA
Y '0
8
JUN
'08
JUL
'08
AU
G '0
8
SE
P '0
8
OC
T '0
8
NO
V '0
8
DE
C '0
8
JAN
'09
FEB
'09
MA
R '0
9
AP
R '0
9
MA
Y '0
9
JUN
'09
JUL
'09
AU
G '0
9
SE
P '0
9
OC
T '0
9
NO
V '0
9
DE
C '0
9
24-Month Admissions Trend: MONMOUTH
24 17 31 25 30 18 23 17 25 23 22 31 22 22 19 23 32 20 14 1832 27 21 21
12
18
7
13
19
6
16
10
15
10
5
12
24
1315 14
811
13 13 139 10 9
0
10
20
30
40
50
60
70
JAN
'08
FEB
'08
MA
R '0
8
AP
R '0
8
MA
Y '0
8
JUN
'08
JUL
'08
AU
G '0
8
SE
P '0
8
OC
T '0
8
NO
V '0
8
DE
C '0
8
JAN
'09
FEB
'09
MA
R '0
9
AP
R '0
9
MA
Y '0
9
JUN
'09
JUL
'09
AU
G '0
9
SE
P '0
9
OC
T '0
9
NO
V '0
9
DE
C '0
9
Detention 35 Alternatives
DETENTION ALTERNATIVES*** Per Month Minority Female Per Month Minority Female 2003 205.0 98.5% 13.6% 2004 167.8 97.8% 12.0% 2005 155.9 98.1% 12.6% 52.4 97.8% - 2006 178.7 97.7% 10.1% 64.9 98.1% - 2007 166.2 97.4% 8.6% 82.1 98.2% 7.2% 2008 123.3 97.7% 9.9% 82.3 98.2% 9.4% 2009 107.8 98.6% 9.5% 87.8 98.5% 8.6%
DETENTION ALTERNATIVES Per Month Minority Female Per Month Minority Female 2003 42.3 62.8% 15.0% 5.9 59.2% 9.9% 2004 47.4 64.0% 13.7% 6.0 68.1% 12.5% 2005 33.9 69.8% 16.7% 6.0 73.6% 5.6% 2006 33.8 72.7% 17.7% 9.1 72.5% 13.8% 2007 28.3 76.8% 14.7% 15.8 84.1% 11.1% 2008 23.8 80.1% 14.0% 11.9 72.7% 11.2% 2009 22.6 79.3% 13.8% 12.7 70.4% 7.2%
26
24-Month Admissions Trend: MERCER
42 56 55 51 47 50 50 39 37 35 40 30 40 49 45 31 28 38 15 2457 55 47 29
17
811
15 14 1610
15 1714 14 12 14
117
2016
10 1215
9 733
0
20
40
60
80
100
JAN
'08
FEB
'08
MA
R '0
8
AP
R '0
8
MA
Y '0
8
JUN
'08
JUL
'08
AU
G '0
8
SE
P '0
8
OC
T '0
8
NO
V '0
8
DE
C '0
8
JAN
'09
FEB
'09
MA
R '0
9
AP
R '0
9
MA
Y '0
9
JUN
'09
JUL
'09
AU
G '0
9
SE
P '0
9
OC
T '0
9
NO
V '0
9
DE
C '0
9
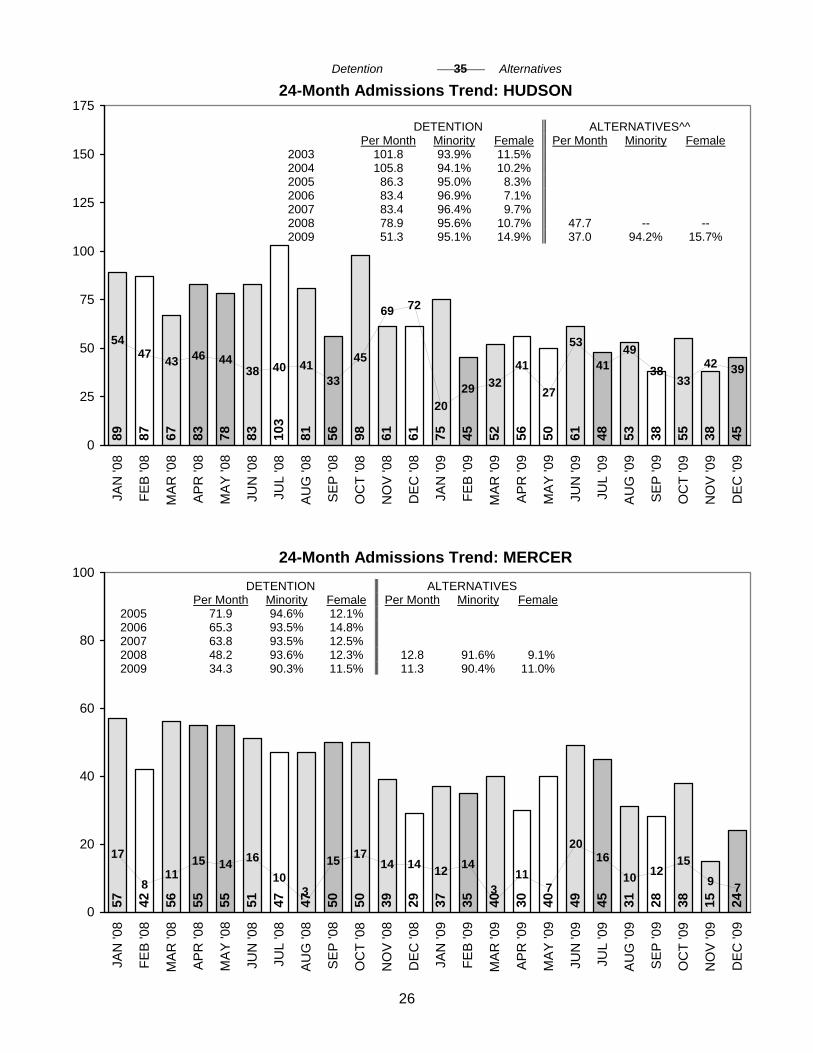
24-Month Admissions Trend: HUDSON
87 67 83 83 81 56 98 61 75 45 52 56 50 61 48 53 38 55 38 4589 78 103
61
5447 43 46 44
38 40 4133
45
69 72
2029 32
41
27
53
4149
38 42 3933
0
25
50
75
100
125
150
175JA
N '0
8
FEB
'08
MA
R '0
8
AP
R '0
8
MA
Y '0
8
JUN
'08
JUL
'08
AU
G '0
8
SE
P '0
8
OC
T '0
8
NO
V '0
8
DE
C '0
8
JAN
'09
FEB
'09
MA
R '0
9
AP
R '0
9
MA
Y '0
9
JUN
'09
JUL
'09
AU
G '0
9
SE
P '0
9
OC
T '0
9
NO
V '0
9
DE
C '0
9
DETENTION ALTERNATIVES Per Month Minority Female Per Month Minority Female 2005 71.9 94.6% 12.1% 2006 65.3 93.5% 14.8% 2007 63.8 93.5% 12.5% 2008 48.2 93.6% 12.3% 12.8 91.6% 9.1% 2009 34.3 90.3% 11.5% 11.3 90.4% 11.0%
DETENTION ALTERNATIVES^^ Per Month Minority Female Per Month Minority Female 2003 101.8 93.9% 11.5% 2004 105.8 94.1% 10.2% 2005 86.3 95.0% 8.3% 2006 83.4 96.9% 7.1% 2007 83.4 96.4% 9.7% 2008 78.9 95.6% 10.7% 47.7 -- -- 2009 51.3 95.1% 14.9% 37.0 94.2% 15.7%
Detention 35 Alternatives
27
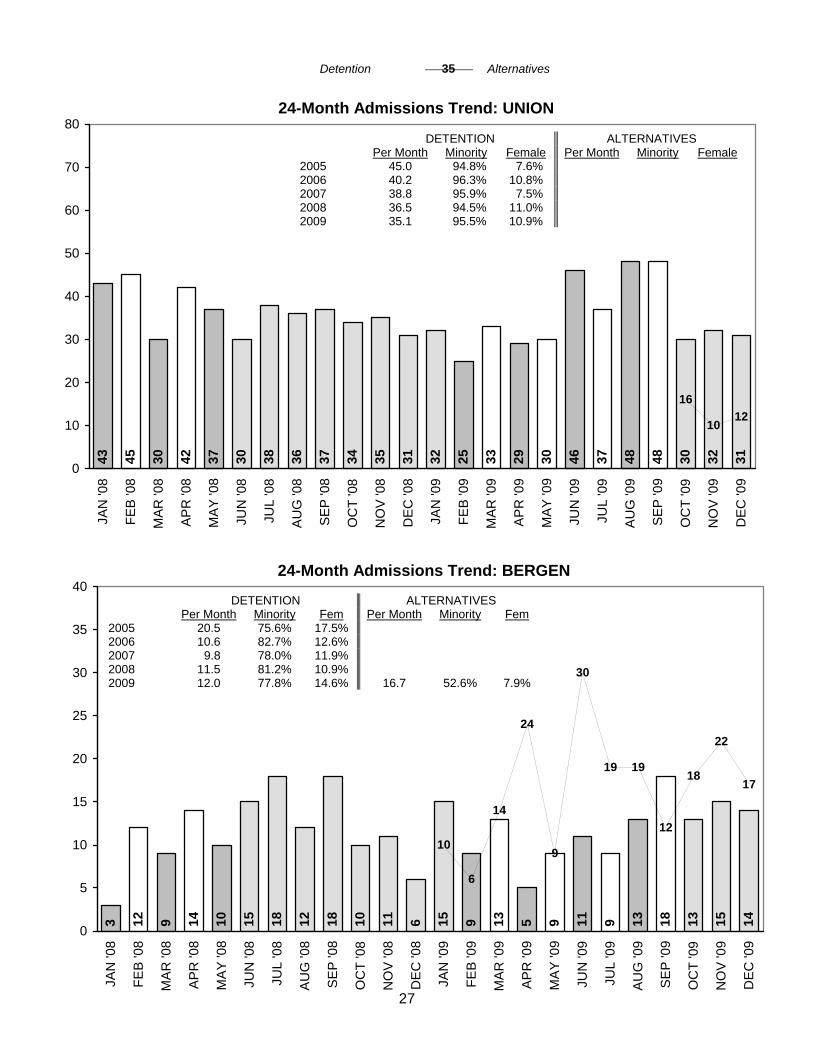
24-Month Admissions Trend: UNION45 30 42 37 30 38 37 34 35 32 25 33 29 30 46 37 48 48 30 32 3136 3143
16
1012
0
10
20
30
40
50
60
70
80JA
N '0
8
FEB
'08
MA
R '0
8
AP
R '0
8
MA
Y '0
8
JUN
'08
JUL
'08
AU
G '0
8
SE
P '0
8
OC
T '0
8
NO
V '0
8
DE
C '0
8
JAN
'09
FEB
'09
MA
R '0
9
AP
R '0
9
MA
Y '0
9
JUN
'09
JUL
'09
AU
G '0
9
SE
P '0
9
OC
T '0
9
NO
V '0
9
DE
C '0
9
24-Month Admissions Trend: BERGEN
12 9 14 10 15 18 18 10 11 15 9 13 5 9 11 9 13 18 13 15 1412 63
10
6
14
24
9
30
19 19
12
18
22
17
0
5
10
15
20
25
30
35
40
JAN
'08
FEB
'08
MA
R '0
8
AP
R '0
8
MA
Y '0
8
JUN
'08
JUL
'08
AU
G '0
8
SE
P '0
8
OC
T '0
8
NO
V '0
8
DE
C '0
8
JAN
'09
FEB
'09
MA
R '0
9
AP
R '0
9
MA
Y '0
9
JUN
'09
JUL
'09
AU
G '0
9
SE
P '0
9
OC
T '0
9
NO
V '0
9
DE
C '0
9
Detention 35 Alternatives
DETENTION ALTERNATIVES Per Month Minority Fem Per Month Minority Fem 2005 20.5 75.6% 17.5% 2006 10.6 82.7% 12.6% 2007 9.8 78.0% 11.9% 2008 11.5 81.2% 10.9% 2009 12.0 77.8% 14.6% 16.7 52.6% 7.9%
DETENTION ALTERNATIVES Per Month Minority Female Per Month Minority Female 2005 45.0 94.8% 7.6% 2006 40.2 96.3% 10.8% 2007 38.8 95.9% 7.5% 2008 36.5 94.5% 11.0% 2009 35.1 95.5% 10.9%

28
24-Month Admissions Trend: BURLINGTON23 27 19 22 25 17 27 24 24 24 28 24 31 27 24 33 24 25 16 26 27 16 21 9
4 3 4 36 5 7
4643 3
0
10
20
30
40
50
60JA
N '0
8
FEB
'08
MA
R '0
8
AP
R '0
8
MA
Y '0
8
JUN
'08
JUL
'08
AU
G '0
8
SE
P '0
8
OC
T '0
8
NO
V '0
8
DE
C '0
8
JAN
'09
FEB
'09
MA
R '0
9
AP
R '0
9
MA
Y '0
9
JUN
'09
JUL
'09
AU
G '0
9
SE
P '0
9
OC
T '0
9
NO
V '0
9
DE
C '0
9
24-Month Admissions Trend: OCEAN
18 20 15 17 12 20 12 11 9 12 15 14 23 24 15 16 14 9 9 14 1417 1321
15
7
15
8 8 97
4
96 6
3
8 79 10
7 6 5
96 6
13
20
10
20
30
40
50
JAN
'08
FEB
'08
MA
R '0
8
AP
R '0
8
MA
Y '0
8
JUN
'08
JUL
'08
AU
G '0
8
SE
P '0
8
OC
T '0
8
NO
V '0
8
DE
C '0
8
JAN
'09
FEB
'09
MA
R '0
9
AP
R '0
9
MA
Y '0
9
JUN
'09
JUL
'09
AU
G '0
9
SE
P '0
9
OC
T '0
9
NO
V '0
9
DE
C '0
9
DETENTION ALTERNATIVES Per Month Minority Female Per Month Minority Female 2005 23.7 66.9% 19.7% 2006 19.3 73.6% 25.1% 2007 27.1 74.2% 16.9% 2008 23.7 73.9% 10.9% 2009 23.3 68.8% 17.9% 4.3 57.7% 9.6%
Per Month Minority Female Per Month Minority Female 2005 20.2 43.0% 19.4% 2006 16.0 39.6% 15.6% 2007 19.4 40.8% 15.0% 2008 15.4 37.8% 19.5% 8.0 42.7% 25.0% 2009 14.9 52.5% 12.8% 7.4 40.4% 22.5%
Detention 35 Alternatives

29
24-Month Admissions Trend: SOMERSET
14 19 9 13 9 12 11 7 3 14 2 9 12 17 3 3 13 10 15 10 613 880
5
10
15
20
25
30JA
N '0
8
FEB
'08
MA
R '0
8
AP
R '0
8
MA
Y '0
8
JUN
'08
JUL
'08
AU
G '0
8
SE
P '0
8
OC
T '0
8
NO
V '0
8
DE
C '0
8
JAN
'09
FEB
'09
MA
R '0
9
AP
R '0
9
MA
Y '0
9
JUN
'09
JUL
'09
AU
G '0
9
SE
P '0
9
OC
T '0
9
NO
V '0
9
DE
C '0
9
Per Month Minority Female 2008 10.5 69.8% 18.3% 2009 9.5 80.7% 13.2%
30
24-Month Average LOS Trend: ATLANTIC21 51 36 27 21 22 37 32 18 28 33 14 21 16 12 33 23 28 34 23 28 2138270
10
20
30
40
50
60
70
80JA
N '0
8
FEB
'08
MA
R '0
8
AP
R '0
8
MA
Y '0
8
JUN
'08
JUL
'08
AU
G '0
8
SE
P '0
8
OC
T '0
8
NO
V '0
8
DE
C '0
8
JAN
'09
FEB
'09
MA
R '0
9
AP
R '0
9
MA
Y '0
9
JUN
'09
JUL
'09
AU
G '0
9
SE
P '0
9
OC
T '0
9
NO
V '0
9
DE
C '0
9
24-Month Average LOS Trend: CAMDEN
29 17 33 19 38 42 35 21 28 30 31 25 28 27 35 35 35 35 27 29 35 38 27 400
10
20
30
40
50
60
70
80
JAN
'08
FEB
'08
MA
R '0
8
AP
R '0
8
MA
Y '0
8
JUN
'08
JUL
'08
AU
G '0
8
SE
P '0
8
OC
T '0
8
NO
V '0
8
DE
C '0
8
JAN
'09
FEB
'09
MA
R '0
9
AP
R '0
9
MA
Y '0
9
JUN
'09
JUL
'09
AU
G '0
9
SE
P '0
9
OC
T '0
9
NO
V '0
9
DE
C '0
9
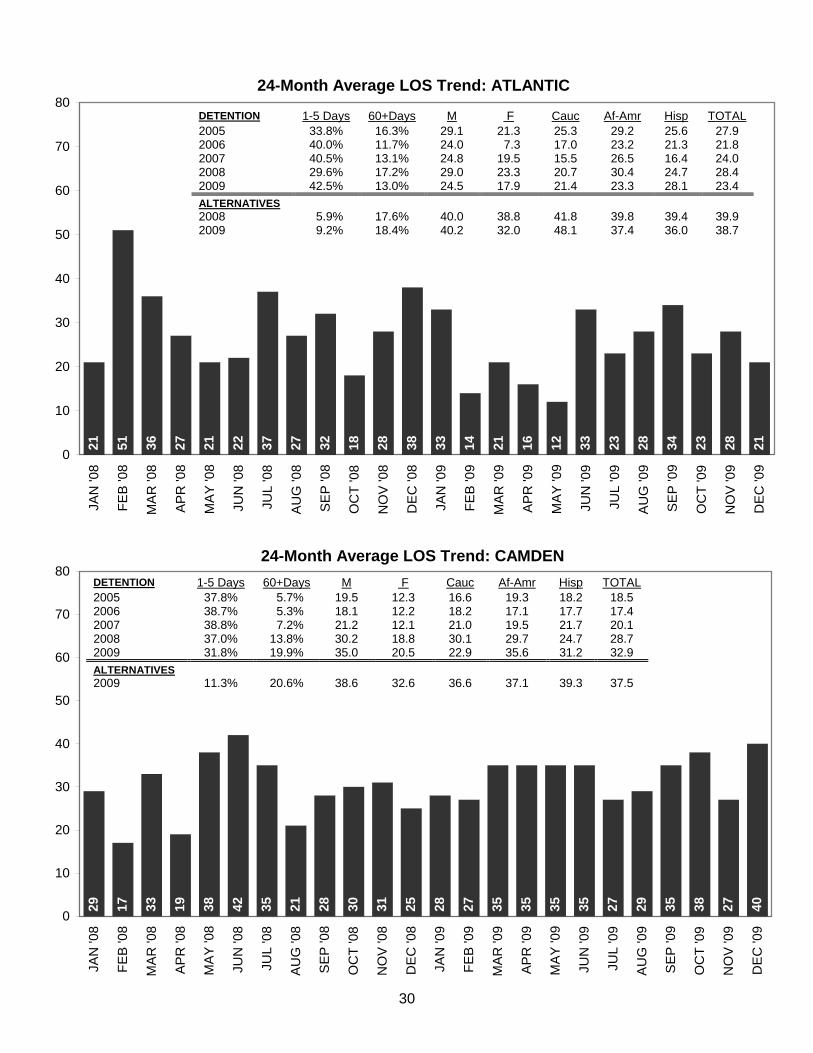
DETENTION 1-5 Days 60+Days M F Cauc Af-Amr Hisp TOTAL 2005 33.8% 16.3% 29.1 21.3 25.3 29.2 25.6 27.9 2006 40.0% 11.7% 24.0 7.3 17.0 23.2 21.3 21.8 2007 40.5% 13.1% 24.8 19.5 15.5 26.5 16.4 24.0 2008 29.6% 17.2% 29.0 23.3 20.7 30.4 24.7 28.4 2009 42.5% 13.0% 24.5 17.9 21.4 23.3 28.1 23.4 ALTERNATIVES 2008 5.9% 17.6% 40.0 38.8 41.8 39.8 39.4 39.9 2009 9.2% 18.4% 40.2 32.0 48.1 37.4 36.0 38.7
DETENTION 1-5 Days 60+Days M F Cauc Af-Amr Hisp TOTAL 2005 37.8% 5.7% 19.5 12.3 16.6 19.3 18.2 18.5 2006 38.7% 5.3% 18.1 12.2 18.2 17.1 17.7 17.4 2007 38.8% 7.2% 21.2 12.1 21.0 19.5 21.7 20.1 2008 37.0% 13.8% 30.2 18.8 30.1 29.7 24.7 28.7 2009 31.8% 19.9% 35.0 20.5 22.9 35.6 31.2 32.9 ALTERNATIVES 2009 11.3% 20.6% 38.6 32.6 36.6 37.1 39.3 37.5
31
24-Month Average LOS Trend: ESSEX29 29 25 23 34 33 20 31 24 18 38 30 33 34 34 33 32 38 33 28 36 29 25 390
10
20
30
40
50
60
70
80JA
N '0
8
FEB
'08
MA
R '0
8
AP
R '0
8
MA
Y '0
8
JUN
'08
JUL
'08
AU
G '0
8
SE
P '0
8
OC
T '0
8
NO
V '0
8
DE
C '0
8
JAN
'09
FEB
'09
MA
R '0
9
AP
R '0
9
MA
Y '0
9
JUN
'09
JUL
'09
AU
G '0
9
SE
P '0
9
OC
T '0
9
NO
V '0
9
DE
C '0
9
24-Month Average LOS Trend: MONMOUTH
25 24 36 29 14 45 33 43 45 26 32 31 20 26 74 56 18 43 40 27 23 42 40 340
10
20
30
40
50
60
70
80
JAN
'08
FEB
'08
MA
R '0
8
AP
R '0
8
MA
Y '0
8
JUN
'08
JUL
'08
AU
G '0
8
SE
P '0
8
OC
T '0
8
NO
V '0
8
DE
C '0
8
JAN
'09
FEB
'09
MA
R '0
9
AP
R '0
9
MA
Y '0
9
JUN
'09
JUL
'09
AU
G '0
9
SE
P '0
9
OC
T '0
9
NO
V '0
9
DE
C '0
9
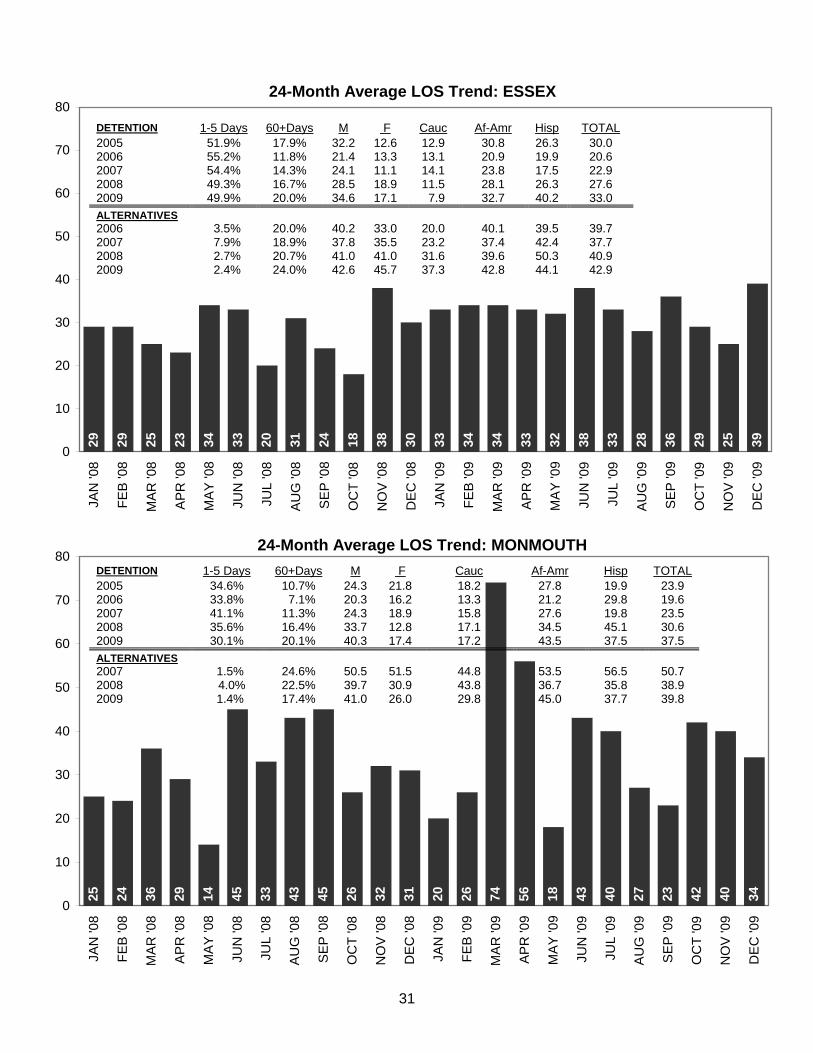
DETENTION 1-5 Days 60+Days M F Cauc Af-Amr Hisp TOTAL 2005 51.9% 17.9% 32.2 12.6 12.9 30.8 26.3 30.0 2006 55.2% 11.8% 21.4 13.3 13.1 20.9 19.9 20.6 2007 54.4% 14.3% 24.1 11.1 14.1 23.8 17.5 22.9 2008 49.3% 16.7% 28.5 18.9 11.5 28.1 26.3 27.6 2009 49.9% 20.0% 34.6 17.1 7.9 32.7 40.2 33.0 ALTERNATIVES 2006 3.5% 20.0% 40.2 33.0 20.0 40.1 39.5 39.7 2007 7.9% 18.9% 37.8 35.5 23.2 37.4 42.4 37.7 2008 2.7% 20.7% 41.0 41.0 31.6 39.6 50.3 40.9 2009 2.4% 24.0% 42.6 45.7 37.3 42.8 44.1 42.9
DETENTION 1-5 Days 60+Days M F Cauc Af-Amr Hisp TOTAL 2005 34.6% 10.7% 24.3 21.8 18.2 27.8 19.9 23.9 2006 33.8% 7.1% 20.3 16.2 13.3 21.2 29.8 19.6 2007 41.1% 11.3% 24.3 18.9 15.8 27.6 19.8 23.5 2008 35.6% 16.4% 33.7 12.8 17.1 34.5 45.1 30.6 2009 30.1% 20.1% 40.3 17.4 17.2 43.5 37.5 37.5 ALTERNATIVES 2007 1.5% 24.6% 50.5 51.5 44.8 53.5 56.5 50.7 2008 4.0% 22.5% 39.7 30.9 43.8 36.7 35.8 38.9 2009 1.4% 17.4% 41.0 26.0 29.8 45.0 37.7 39.8

32
24-Month Average LOS Trend: HUDSON16 21 18 27 23 29 16 16 31 38 24 33 31 25 41 35 23 37 32 24 31 39 35 350
10
20
30
40
50
60
70
80JA
N '0
8
FEB
'08
MA
R '0
8
AP
R '0
8
MA
Y '0
8
JUN
'08
JUL
'08
AU
G '0
8
SE
P '0
8
OC
T '0
8
NO
V '0
8
DE
C '0
8
JAN
'09
FEB
'09
MA
R '0
9
AP
R '0
9
MA
Y '0
9
JUN
'09
JUL
'09
AU
G '0
9
SE
P '0
9
OC
T '0
9
NO
V '0
9
DE
C '0
9
24-Month Average LOS Trend: UNION
36 20 40 41 20 21 33 27 11 24 22 21 44 16 12 12 44 42 25 22 23 44 33 370
10
20
30
40
50
60
70
80
JAN
'08
FEB
'08
MA
R '0
8
AP
R '0
8
MA
Y '0
8
JUN
'08
JUL
'08
AU
G '0
8
SE
P '0
8
OC
T '0
8
NO
V '0
8
DE
C '0
8
JAN
'09
FEB
'09
MA
R '0
9
AP
R '0
9
MA
Y '0
9
JUN
'09
JUL
'09
AU
G '0
9
SE
P '0
9
OC
T '0
9
NO
V '0
9
DE
C '0
9
DETENTION 1-5 Days 60+Days M F Cauc Af-Amr Hisp TOTAL 2005(Sep-Dec) 62.3% 13.7% 23.5 11.0 27.3 28.4 13.9 22.7 2006 57.4% 15.9% 28.4 22.2 27.3 32.6 22.4 28.0 2007 66.8% 14.2% 24.6 10.5 8.9 29.3 16.2 23.3 2008 61.5% 11.2% 25.6 14.1 10.8 34.2 12.2 24.4 2009 50.1% 18.2% 35.6 15.6 9.1 40.0 23.5 32.6 ALTERNATIVES 2008 (Jun-Dec) 6.6% 28.9% - - - - - 47.8 2009 4.4% 23.1% 43.7 45.2 43.4 46.2 41.2 44.0
1-5 Days 60+Days M F Cauc Af-Amr Hisp TOTAL 2005 33.5% 15.5% 29.8 17.2 16.6 29.9 29.0 28.8 2006 41.5% 11.5% 23.2 6.6 29.9 20.5 25.1 21.5 2007 44.2% 7.6% 20.3 5.4 9.3 20.1 17.8 19.2 2008 36.4% 13.8% 27.8 13.0 11.5 27.0 26.9 26.2 2009 42.5% 15.7% 31.8 15.6 41.3 28.5 32.6 29.9

33
24-Month Average LOS Trend: BERGEN6 18 13 18 24 18 37 35 35 29 23 23 19 40 32 18 23 52 55 18 27 30 19 220
10
20
30
40
50
60
70
80JA
N '0
8
FEB
'08
MA
R '0
8
AP
R '0
8
MA
Y '0
8
JUN
'08
JUL
'08
AU
G '0
8
SE
P '0
8
OC
T '0
8
NO
V '0
8
DE
C '0
8
JAN
'09
FEB
'09
MA
R '0
9
AP
R '0
9
MA
Y '0
9
JUN
'09
JUL
'09
AU
G '0
9
SE
P '0
9
OC
T '0
9
NO
V '0
9
DE
C '0
9
1-5 Days 60+Days M F Cauc Af-Amr Hisp TOTAL 2005 30.1% 14.2% 27.6 26.3 25.4 25.4 31.0 27.4 2006 34.1% 23.0% 38.5 35.8 34.7 40.3 38.4 38.1 2007 37.2% 17.7% 26.6 25.7 23.0 30.2 25.4 26.5 2008 37.8% 14.3% 24.2 32.9 13.5 29.6 24.8 25.1 2009 41.0% 14.4% 28.5 18.7 28.5 28.9 17.3 27.0
24-Month Average LOS Trend: MERCER
37 23 27 16 20 31 60 19 14 18 24 25 25 13 19 20 15 16 43 48 46 22 29 250
10
20
30
40
50
60
70
80
JAN
'08
FEB
'08
MA
R '0
8
AP
R '0
8
MA
Y '0
8
JUN
'08
JUL
'08
AU
G '0
8
SE
P '0
8
OC
T '0
8
NO
V '0
8
DE
C '0
8
JAN
'09
FEB
'09
MA
R '0
9
AP
R '0
9
MA
Y '0
9
JUN
'09
JUL
'09
AU
G '0
9
SE
P '0
9
OC
T '0
9
NO
V '0
9
DE
C '0
9
DETENTION 1-5 Days 60+Days M F Cauc Af-Amr Hisp TOTAL 2005 36.2% 13.0% 28.9 15.9 18.3 28.5 21.2 27.4 2006 36.9% 15.1% 32.9 19.4 17.5 30.9 44.2 30.9 2007 39.2% 11.1% 25.0 18.4 11.6 26.1 16.8 24.1 2008 41.8% 10.2% 27.6 17.7 12.9 28.5 19.1 26.5 2009 43.3% 9.7% 29.2 10.2 7.7 28.4 33.8 27.0 ALTERNATIVES 2008 8.7% 8.7% 26.8 33.7 24.8 27.1 31.7 27.5 2009 5.6% 6.4% 25.3 21.7 19.2 24.8 30.8 24.9

34
24-Month Average LOS Trend: BURLINGTON29 26 34 20 30 34 23 23 34 14 24 15 21 12 23 25 28 22 26 24 19 24 22 500
10
20
30
40
50
60
70
80JA
N '0
8
FEB
'08
MA
R '0
8
AP
R '0
8
MA
Y '0
8
JUN
'08
JUL
'08
AU
G '0
8
SE
P '0
8
OC
T '0
8
NO
V '0
8
DE
C '0
8
JAN
'09
FEB
'09
MA
R '0
9
AP
R '0
9
MA
Y '0
9
JUN
'09
JUL
'09
AU
G '0
9
SE
P '0
9
OC
T '0
9
NO
V '0
9
DE
C '0
9
24-Month Average LOS Trend: OCEAN
43 53 53 57 34 36 65 24 34 46 37 19 52 36 25 43 26 40 35 24 54 73 43 260
10
20
30
40
50
60
70
80
JAN
'08
FEB
'08
MA
R '0
8
AP
R '0
8
MA
Y '0
8
JUN
'08
JUL
'08
AU
G '0
8
SE
P '0
8
OC
T '0
8
NO
V '0
8
DE
C '0
8
JAN
'09
FEB
'09
MA
R '0
9
AP
R '0
9
MA
Y '0
9
JUN
'09
JUL
'09
AU
G '0
9
SE
P '0
9
OC
T '0
9
NO
V '0
9
DE
C '0
9
DETENTION 1-5 Days 60+Days M F Cauc Af-Amr Hisp TOTAL 2005 39.8% 11.7% 21.5 23.4 23.4 22.1 13.1 21.9 2006 45.7% 9.0% 19.8 15.7 22.7 17.8 16.8 18.8 2007 30.9% 14.0% 25.3 27.0 25.9 26.0 17.7 25.6 2008 31.0% 10.6% 25.6 20.9 18.2 27.5 27.1 25.0 2009 27.2% 10.8% 25.4 16.3 22.1 25.9 9.1 23.8 ALTERNATIVES 2008 0.0% 4.3% 32.2 22.4 26.2 32.3 n/a 30.8 2009 0.0% 9.1% 35.6 21.2 32.9 34.2 n/a 33.9
DETENTION 1-5 Days 60+Days M F Cauc Af-Amr Hisp TOTAL 2005 23.5% 22.6% 37.3 24.6 34.2 35.7 36.1 34.8 2008 16.7% 28.8% 45.6 42.1 38.0 52.5 60.0 44.9 2009 21.0% 22.2% 41.5 17.5 33.3 41.7 48.0 38.6 ALTERNATIVES 2008 12.9% 22.8% 51.6 36.4 55.5 37.4 49.3 48.1 2009 14.3% 13.1% 34.2 31.2 32.1 38.4 31.0 33.5
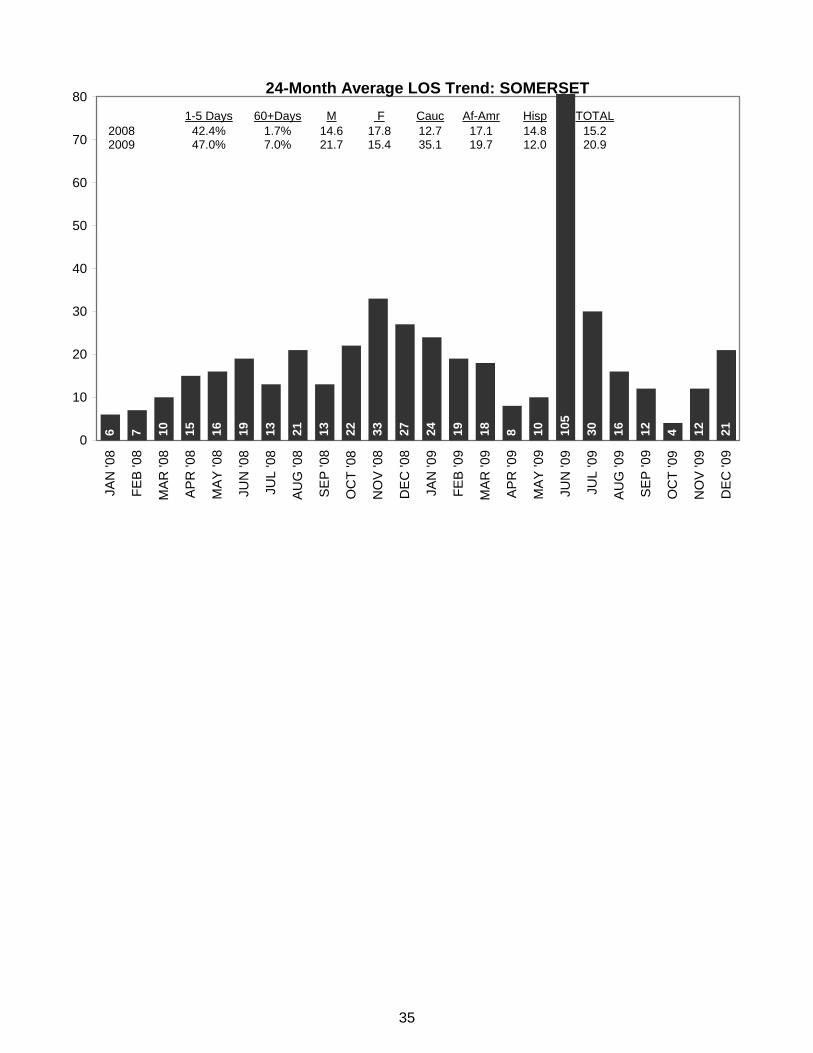
35
24-Month Average LOS Trend: SOMERSET6 7 10 15 16 19 13 21 13 22 33 27 24 19 18 8 10 10
5
30 16 12 4 12 210
10
20
30
40
50
60
70
80JA
N '0
8
FEB
'08
MA
R '0
8
AP
R '0
8
MA
Y '0
8
JUN
'08
JUL
'08
AU
G '0
8
SE
P '0
8
OC
T '0
8
NO
V '0
8
DE
C '0
8
JAN
'09
FEB
'09
MA
R '0
9
AP
R '0
9
MA
Y '0
9
JUN
'09
JUL
'09
AU
G '0
9
SE
P '0
9
OC
T '0
9
NO
V '0
9
DE
C '0
9
1-5 Days 60+Days M F Cauc Af-Amr Hisp TOTAL 2008 42.4% 1.7% 14.6 17.8 12.7 17.1 14.8 15.2 2009 47.0% 7.0% 21.7 15.4 35.1 19.7 12.0 20.9

36
Notes General Note: If and when data modifications or updates occur, previously distributed reports are not adjusted and redistributed. Instead, subsequent reports are adjusted to reflect the most recently verified data for any reporting period. The detention specialist assigned to each site can provide clarification regarding any data changes in a given site. * Note regarding capacity/ADP/LOS. ADP figures for any county with a cap or restriction on daily population include youth held out-of-county, i.e., reflect total youth from that county in secure detention. Bergen’s full, rated capacity is 41; restricted capacity is 14. Prior to moving into a new detention facility in December, 2007, Camden developed a self-imposed soft-cap of 63, at which point Camden housed girls out-of-county, and those girls are included in the ADP; Camden’s capacity increased in December, 2007, to 61 with the move to the new facility. Likewise, Union’s capacity increased in September, 2008, to 76, upon opening a new detention center. Note that LOS figures for counties under such a cap/restriction reflects the length of stay in secure detention, including time spent in-county and out-of-county. ** Essex expanded alternative ADP data capacity to include race and gender in September 2007, so 2007 figures for % minority and % female cover September-December. *** Essex 2005 alternatives admissions data include June-December (7 months). ^ ADP Graphs. Camden and Essex: Both counties entered into formal, contractual agreements with counties that closed detention centers. Gloucester youth are now held at Camden, and Passaic youth at Essex. Because one purpose of the ADP graph is to reflect detention population relative to capacity, Gloucester and Passaic youth are depicted in the bars on the Camden and Essex graphs, respectively, though separated out using a darker color. Then, in the table inserted in the graph, the “high count” first reflects only youth from Camden or Essex, and then the combined high count follows in parentheses. The remaining year-to-date information in the table reflects only Camden/Essex youth (ADP, % minority, % female, and alternatives figures), as does all other data included in this report.
Union: Union recently entered into a formal, contractual agreement to house “unaccompanied alien children” in the custody of the U.S. Office of Refugee Resettlement (ORR), Division of Unaccompanied Children’s Services (DUCS). (This is organizationally located within the Department of Health and Human Services, Administration for Children & Families). As with the Camden and Essex ADP graphs, the DUCS youth are depicted in the bars on the Union ADP graph, but separated out using a darker color. Then, in the table inserted in the graph, the “high count” first reflects only youth from Union, and then the combined high count follows in parentheses. The remaining year-to-date information in the table reflects only Union youth (ADP, % minority, % female, and alternatives figures), as does all other data included in this report.
Ocean: Ocean operates an approved 60-day, post-dispositional commitment program. The committed youth are depicted in the bars on the Ocean ADP graph, but separated out using a darker color. However, in the table inserted in the graph the “high count” only reflects the pre-disposition youth, as counts for committed youth in detention are only reported to the JJC in the aggregate for the entire month (i.e., daily counts are not submitted). The remaining year-to-date information in the table reflects only Union youth (ADP, % minority, % female, and alternatives figures), as does all other data included in this report. Total annual ADP for Ocean (detention + committed youth) for 2005=26.5, 2006=23.8, 2007=30.3, 2008=28.3, and 2009=24.2. ^^ Hudson’s alternatives data at this point does not yet include/reflect youth placed in the shelter in lieu of detention. ^^^Somerset’s ADP graph does not include a figure for capacity because Somerset houses youth in the Middlesex detention center, and so there is no distinct capacity for Somerset. Also, Middlesex operates an approved, 60-day post-dispositional commitment program that Somerset can utilize, however at this point Somerset’s graph only reflects pre-disposition youth (note that the number of Somerset youth housed on committed status is very often zero, and usually not more than one).

37
1“Other Violation or Non-Delinquent Event” includes situations such as municipal warrants; violation of a deferred disposition; violation of drug court; return to detention from an alternative for family issues, equipment problems, similar; violation of diversion; contempt of court on non-delinquency matter; violations of other court-ordered conditions that are not clearly a VOP or detention alternative violation; and violations where the exact nature is unknown. “Other Reason” includes out-of-state warrants, parole warrants, detainers, and temporary detention for the purpose of testifying at a trial; in Hudson, the “other” category also includes cases where the exact nature of the offense/admission was unknown (pre-2008 only). 2 Court remand includes youth remanded to detention at any point in the case process. Note that this includes youth previously in the community or on a detention alternative who have not been charged with a new offense or violation, but who are remanded upon adjudication to await disposition, or upon disposition to await placement. In other words, the primary reason for the remand is tied to the case process, and not to new behavior of the youth. However, when this occurs, the “Nature of Offense/Lead Reason for Detention” for which the youth is detained is recorded as the charge for which the youth was newly adjudicated or disposed. 3 “Other” admission process includes situations such as youth admitted directly on a warrant to detain or from a detention alternative (without a call to/processing via intake services); youth brought directly to the detention center by an alternative program on a violation (without a warrant); extradition from out-of-state; return on detainer from a hospital/mental health facility pre-disposition; via the prosecutor’s office; and a few cases where the exact nature of the admission process is unknown. 4 Length of stay is calculated based on youth departing detention during the time period of interest, and for each youth, LOS is the number of days between and including the departure date and the admission date. See note * above regarding calculation of LOS for facilities under a cap or population restriction. 5 The “Total” LOS figures here represent the combined LOS for all youth departing detention in these 5 sites. A different approach might be to report the site average as the “Total.” These two different “Totals” have different interpretations: one total focuses on youth, one total focuses on sites. These two methods often produce similar results. For instance, Total average LOS for all youth in 2008 is reported in the table as 27.4; adding up each site’s average LOS and dividing by the number of sites results in a site average of 28.0 for LOS. However, if one of the high-volume sites is substantially different on a measure than the other sites, these two approaches can yield somewhat different results. In short, from a youth perspective, the high-volume site is represented in a total based on all youth more frequently than the other sites, but in a site average, the high-volume site is only represented once. Also, if there is substantial cross-site variation in the months for which data were available in a given year, then slightly more noticeable differences in the results produced by the two different methods may appear. There are benefits to each approach, and in this case the former, “all youth” method is chosen for two reasons: a) using a total for all youth allows for more direct statements about JDAI’s impact on youth, as opposed to sites; and b) the report provides the information necessary for the reader to compute site-averages, but the reverse is not true (i.e., the reader would need thousands of youth records to calculate all-youth totals), so by presenting results using the all-youth method, the reader can have results using both approaches, if desired. Note that this affects only tables where the multi-site “Total” is presented, and where that Total is an average or percent. 6 Departure Type Clarification “Detention Alternative/Shelter” includes youth released to detention alternatives/alternative supervision/shelter a) prior to the final case disposition or b) at/post-disposition, but prior to final dispositional placement (i.e., released to alternative supervision to await placement availability). Situation b) occurs infrequently, and as such is not reported as its own category in this report.
“Other Service Agency/Placement (pre-dispo)” includes youth released to a hospital; mental health/diagnostic facility; DYFS custody; treatment or dispositional program, pre-dispositionally; or youth released to their dispositional placement prior to the date of final disposition.
“Jail, Bail, Upon/After Waiver” includes youth who were transferred to the jail for any reason (waiver, adult charges filed in criminal, age, etc.), youth who made bail or who were ROR after adult charges were filed in criminal court, and youth who were otherwise released upon or after waiver.

38
“Other Authorities” include youth released to the custody of out-of-state authorities (typically youth admitted on out-of-state warrants); BICE (immigration); JJC parole or secure facility (typically following admission for a parole warrant); or the police (typically when it is determined youth was in fact an adult).
“Similar” in the “dismissed/diverted” category includes cases where no charges were formally filed in court, the case was closed or inactivated, cases where a youth, having been admitted as a sanction for drug-court noncompliance, was returned home to continue with drug court, and cases where no indictment was returned for a youth waived to adult court (and the charges were not reopened in juvenile court).
“Other” cases are those where the circumstances of release could not be clearly determined, or rare occurrences that do not fall into any of the above categories. NOTE: In light of the very small number of cases that fall into this category, LOS for cases categorized as “other” is not included in LOS by Departure Type table. 7 For Ocean and Somerset, data regarding departures and LOS pertain to youth leaving/LOS in the detention center on “detention status.” In other words, if a youth in the detention center pre-dispositionally is ultimately disposed to the detention commitment program, the “departure date” used in the youth’s LOS calculation is the date the youth’s status changed from “detention” to “disposed/commitment,” and the departure type will be recorded as “dispositional placement.” 8 See note 6 above regarding departure types. 9 See note 7 above regarding Ocean and Somerset.