state of migration in nepal - ceslam of... · 4.9 reasons for internal migration 29 4.10 occupation...
TRANSCRIPT
STATE OF MIGRATIONIN NEPAL
Sanjay Sharma, Shibani PandeyDinesh Pathak & Bimbika Sijapati-Basnett
Research Paper VI
9 789937 282611
STATE OF MIGRATION IN NEPAL

State of Migration in nepal
research paper Vi
Sanjay Sharma, Shibani pandey Dinesh pathak & Bimbika Sijapati-Basnett
© Centre for the Study of Labour and Mobility, 2014
ISBN: 978 9937 2 8260 1
Centre for the Study of Labour and MobilitySocial Science Baha345 Ramchandra Marg, Battisputali, Kathmandu – 9, NepalTel: +977-1-4472807, 4480091 • Fax: [email protected] • www.ceslam.org
Printed in Nepal by Variety Printers, Kuleshwor, Kathmandu.
Support for this publication was made available by the Open Society Foundations, New York.

Contents
1. Introduction 1
2. Methodology 2 2.1 Understanding the Concepts 3 2.2 Additional Issues for Consideration 8
3. Absentees 10 3.1 Gender of Absentee Population 10 3.2 Age of Absentee Population 11 3.3 Marital Status of Absentee Population 13 3.4 Origin of Absentee Population 14 3.5 Destination of Absentee Population 15 3.6 Education Level of Absentee Population 16 3.7 Economic Status of Absentee Population 17 3.8 Reason for Absence 18
4. Internal Migration 20 4.1 Gender of Internal Migrants 20 4.2 Age of Internal Migrants 21 4.3 Marital Status of Internal Migrants 21 4.4 Origin of Internal Migrants 21 4.5 Destination of Internal Migrants 24 4.6 Ethnicity of Internal Migrants 27 4.7 Education Level of Internal Migrants 27 4.8 Economic Status of Internal Migrants 28 4.9 Reasons for Internal Migration 29 4.10 Occupation of Internal Migrants 30
5. International Migration 32 5.1 Trends 32 5.2 Gender of International Migrants 34 5.3 Age of International Migrants 34 5.4 Age at Migration 34 5.5 Marital Status of International Migrants 36 5.6 Origin of International Migrants 36 5.7 Destination of International Migrants 39

iv
5.8 Education Level of International Migrants 41 5.9 Economic Status of International Migrants 42 5.10 Ethnicity of International Migrants 43 5.11 Reasons for Migration 43
6. Labour Migration 46 6.1 Trends 46 6.2 Gender of Labour Migrants 47 6.3 Age of Labour Migrants 48 6.4 Education Level of Labour Migrants 49 6.5 Marital Status of Labour Migrants 50 6.6 Origin of Labour Migrants 51 6.7 Destination of Labour Migrants 51 6.8 Economic Status of Labour Migrants 54 6.9 Ethnicity of Labour Migrants 55 6.10 Occupation of Labour Migrants 56
7. Immigration 60 7.1 Trends 60 7.2 Gender of Immigrants 61 7.3 Origin of Immigrants 61 7.4 Destination of Immigrants 62
8. Remittances 65 8.1 External Remittances over the Years 65 8.2 Inflow of Remittances 66 8.3 Distribution of Remittances 68 8.4 Ethnicity of Remittance-Receiving Households 69 8.5 Remittances: External and Internal 70 8.6 Age of Individuals Sending Remittances 70 8.7 Gender of Individuals Sending Remittances 71 8.8 Economic Status of Remittance-Receiving Households 72 8.9 Use of Remittances 73
9. Conclusion 75
Notes 78 Annexes 83 References 89
v
LIst of tAbLesTable 1: Indicators Used in the Surveys 2Table 2: Recent Surveys, Variables and Definitions Used 6Table 3: Internal Migration (by place of origin and destination) 25Table 4: Receipt of Remittances (by development and ecological region) 68
LIst of fIguRes Fig. 1: Gender of Absentees 10Fig. 2: Absentees and Non-Absentees (by gender) 11Fig. 3: Age Distribution of Absentees 11Fig. 4: Female Absentees (by age group) 12Fig. 5: Male Absentees (by age group) 12Fig. 6: Marital Status of Absentees 13Fig. 7: Distribution of Absentees (by ecological region) 14Fig. 8: Regional Distribution of Absentees 15Fig. 9: Destination of Absentees 15Fig. 10: Destination of Absentees (by gender) 16Fig. 11: Education Level of Absentees 16Fig. 12: Consumption Quintile of Absentees 17Fig. 13: Destination of Absentee Households (by consumption quintile) 18Fig. 14: Reason for Absence 19Fig. 15: Reason for Absence (by gender) 19Fig. 16: Gender of Internal Migrants 20Fig. 17: Age of Internal Migrants 21Fig. 18: Marital Status of Internal Migrants 22Fig. 19: Origin of Internal Migrants (by ecological region) 22Fig. 20: Origin of Internal Migrants (by development region) 23Fig. 21: Origin of Internal Migrants (by locality and gender) 23Fig. 22: Trends in Internal Migration (by origin and current location) 24Fig. 23: Destination of Internal Migrants 26Fig. 24: Probability of Household with Internal Migrants (by ethnicity) 26Fig. 25: Education Level of Internal Migrants 27Fig. 26: Gender-wise Education Level of Internal Migrants 28Fig. 27: Consumption Quintile of Internal Migrant Households 29Fig. 28: Reason for Internal Migration 29Fig. 29: Reason for Internal Migration (by gender) 30
vi
Fig. 30: Occupation of Internal Migrants before and after Migration 31Fig. 31: International Migrants from Nepal 32Fig. 32: Percentage of International Migrants (of total population) 33Fig. 33: Gender of International Migrants 33Fig. 34: Age of International Migrants 34Fig. 35: Age at International Migration 35Fig. 36: Marital Status of International Migrants 35Fig. 37: Origin of International Migration (rural/urban) 36Fig. 38: Percentage of International Migrants (by ecological region) 37Fig. 39: Percentage of International Migrants (by development region) 37Fig. 40: Origin of International Migrants (by eco-development region) 38Fig. 41: International Migrants’ District of Origin 39Fig. 42: Destination of International Migrants 40Fig. 43: Destination of International Migrants (by gender) 40Fig. 44: Gender Distribution of International Migrants (by destination) 41Fig. 45: Education Level of International Migrants (NLSS) 41Fig. 46: Education Level of International Migrants (National Census) 42Fig. 47: Consumption Quintile of Households with International Migrants 42Fig. 48: Reason for International Migration (NLSS) 43Fig. 49: Reason for International Migration (NDHS) 44 (by gender and destination)Fig. 50: Reason for International Migration (National Census) 45 (by gender and destination) Fig. 51: Number of Labour Permits Issued 46Fig. 52: Gender Breakdown across Destinations, 2006/2007–2012/2013 47Fig. 53: Average Age of Labour Migrants (by destination) 49Fig. 54: Education Level of Labour Migrants 49Fig. 55: Education Level of Labour Migrants (by destination) 50Fig. 56: Marital Status of Labour Migrants 50Fig. 57: Origin of Labour Migrants (by ecological region) 51Fig. 58: Origin of Labour Migrants (by development region) 51Fig. 59: Labour Permits Issued, 1993/94–2012/13 52Fig. 60: Labour Permits, 1993/94–2012/13 (by destination) 53Fig. 61: Labour Permits Issued to Top Four Destinations 54Fig. 62: Probability of Household with Migrants 55 (by wealth quintile and destination)

vii
Fig. 63: Destination of Labour Migrants (by ethnicity) 56Fig. 64: Sectors of Employment 56Fig. 65: Sectors of Employment (female labour migrants) 57Fig. 66: Skill Levels of Labour Migrants 58Fig. 67: Occupation before and after Foreign Employment 59Fig. 68: Immigration Trend over the Years 60Fig. 69: Gender of Immigrants 61Fig. 70: Origin Countries of Immigrants 61Fig. 71: Destination of Immigrants (by location) 62Fig. 72: Destination of Immigrants (by country of origin and location) 62Fig. 73: Destination of Immigrants (by country of origin and ecological zone) 63Fig. 74: Destination of Immigrants (by ecological region) 64Fig. 75: Workers’ Remittances (in billion NPR) 66Fig. 76: Share of Remittances Received (NMS) (from destination) 67Fig. 77: Share of Remittances (NLSS) (from destination) 67Fig. 78: Average Remittance Received (in NPR ’000) (from destination) 68Fig. 79: Per Capita Remittance (in NPR ’000) 69Fig. 80: Share of Total Remittance Amount 70Fig. 81: Age of Individuals Sending Remittances 71Fig. 82: Gender of Individuals Sending Remittances 71Fig. 83: Total Remittance Received (by consumption quintile) 72Fig. 84: Internal Remittance Received (by consumption quintile) 72Fig. 85: External Remittance Received (by consumption quintile) 73Fig. 86: Use of Remittances 73
ANNeXesAnnex I: Destination Countries by Gender 84Annex II: Destination Countries by Reason for Migration and Gender 85Annex III: International Migrants by Caste/Ethnicity 86

1. IntroduCtIon
Migration is a common phenomenon in both its domestic and international dimensions in Nepal. Traditionally, most of the migration took place within the country’s borders, with some people going to India and Tibet. Nepal’s entry into the global economy has since re-defined these historical trends, and, now, Nepalis can be found spread across the globe. Labour migration to the Gulf states and Malaysia has seen significant growth over the years and now accounts for an increasingly larger share of Nepal’s international migration, while immigration into Nepal continues to be mostly from India – a fact facilitated by the open border between the two countries.
The impact of these movements is evident in the country’s shifting demographics as well as in changes taking place in the socio-economic arena. But despite the long history of active migration in Nepal, systematic studies of the phenomenon are quite recent, and, as yet, still very few and far between. However, as will be elaborated upon in the next section, with recent nation-wide surveys, primarily the Nepal Living Standards Survey 2010/11, the National Census 2011, and the Nepal Migration Survey 2009, covering significant grounds on migration, unavailability of data is no longer a significant barrier to understanding migration trends in the country.
This paper uses publicly accessible information to provide an overview of the current state of migration in the country. Drawing mainly upon national-level surveys conducted over the last decade or so, it seeks to examine patterns of migration within Nepal, from Nepal to international destinations, and immigration into Nepal. It also analyses the socio-economic profile of migrants and other indicators such as reasons for migration, areas of employment, literacy levels, economic status, and caste/ethnic identity to provide a broad understanding of migration trends in Nepal and identify gaps in information and highlight areas that require further investigation.

2. Methodology
The data used here is taken from the Nepal Living Standards Survey 2010/11, the National Census of 2001 and 2011, the Nepal Demographic Health Survey 2006 and 2011, the Nepal Labour Force Survey 2008, and the Nepal Migration Survey 2009. Where required, records maintained by the Department of Foreign Employment (DoFE) have also been considered. The paper also goes beyond the published reports on the Nepal Living Standards Survey (NLSS) 2010/11 and analyses the NLSS raw data provided by the Central Bureau of Statistics (CBS).1
The chapter divisions of this paper follows the different ways in which the condition of migration has been captured in these surveys: absentees, internal migrants, international migrants, international labour migrants, and immigrants in Nepal. Given its overall importance to the country, the issue of remittances has been dealt with in a separate section.
Table 1: Indicators Used in the Surveys1. Absentees i. genderii. ageiii. marital statusiv. place of origin v. destinationvi. level of educationvii. wealth quintile2 viii. reason for absence
2. Internal Absenteesi. genderii. ageiii. marital statusiv. place of originv. destination vi. level of education vii. wealth quintileviii. reason for migrationix. ethnic backgroundx. occupational status
3. International Migrantsi. genderii. ageiii. marital statusiv. place of originv. destination vi. level of education vii. wealth quintileviii. reason for migrationix. ethnic background x. occupation
4. Labour Migrantsi. genderii. ageiii. marital statusiv. place of originv. destinationvi. level of educationvii. wealth quintileviii. ethnic backgroundix. occupation
5. Immigrantsi. genderii. country of origin iii. place of settlement in
Nepal
6. Remittancesi. genderii. ageiii. sourceiv. receiving areav. wealth quintilevi. ethnic backgroundvii. use
A major limitation of the paper is that it is constrained by the data in the aforementioned surveys, which, apart from the Nepal Migration Survey 2009,

State of Migration in nepal 3
deal with subjects beyond migration as well (e.g., the purpose of the Nepal Living Standards Survey is to measure poverty). Accordingly, only the indicators given in Table 1 have been considered while dealing with migration in its various manifestations.
2.1 Understanding the Concepts
One of the problems with using information from so many different sources lies in making comparisons because of how each has conceptualised the terms ‘migrant’, ‘absentee’ and ‘migration’ as well as the indicators mentioned in Table 2.3 Despite this difficulty and recognising the limitations it imposes, this paper attempts to provide a complete overview of the current state of migration as can be derived from existing national surveys, and, to the extent possible, by deploying cross-survey analyses.
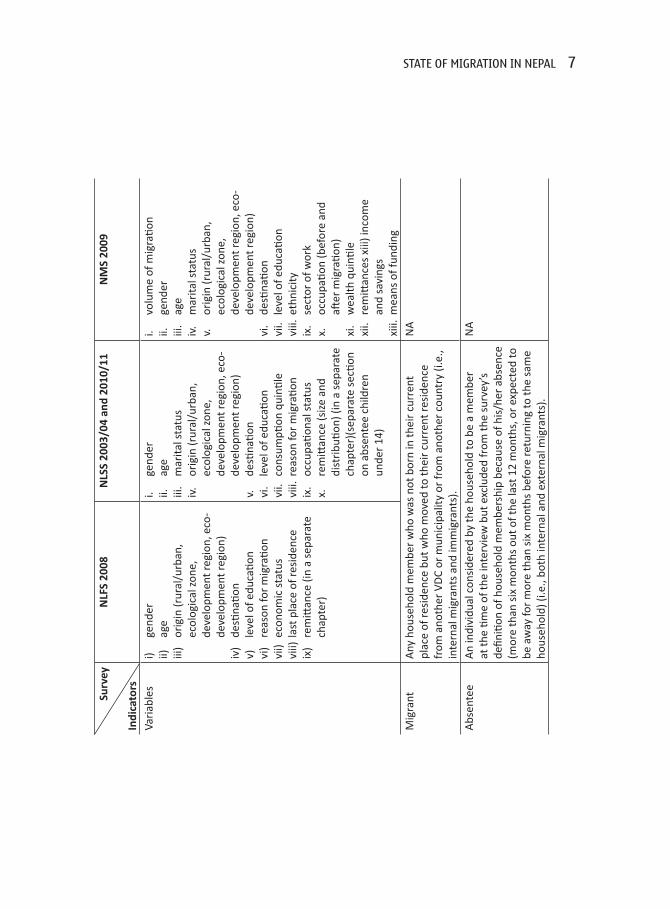
The following sub-sections consist of brief introductions to all the surveys and the national census with a focus on the major migration-related indicators used in this paper. (See also Table 2 for a comparison across surveys.)
2.1.1 Nepal Living Standards Survey, 2003/04 and 2010/11The Nepal Living Standards Survey (NLSS) collects household-level information across Nepal on a number of indicators aimed at understanding people’s socio-economic status and overall living standards such as household demographics, income, remittances, consumption, expenses, health, employment, education, credit and savings. Of the three living standard surveys conducted in Nepal to date, only the latter two, NLSS 2003/04 and 2010/11, collected information related to migration. NLSS 2003/04 had a sample size of 5072 households and NLSS 2010/11 had 7020.4 For this paper, in addition to making use of the NLSS reports, a separate analysis of the raw data was undertaken for a more in-depth understanding of the migration dynamics.
Variables: NLSS 2003/04 and 2010/11 contains comprehensive information about migrants in terms of: i) gender, ii) age, iii) marital status, iv) origin (rural/urban, ecological zone, development region, eco-development region), v) destination, vi) level of education, vii) consumption quintile, viii) reason for

4 State of Migration in nepal
migration, ix) occupational status, x) remittance (size and distribution) and profile of remitters, and xi) absentee children under 14.
DefinitionsMigrant: The survey’s definition of migration is ‘geographical or spatial mobility between one geographical unit and another,’5 while a migrant is considered to be ‘a person who has changed his/her residence from a previous place (another Village Development Committee or municipality or another country) to the present place (VDC or municipality)’.6
Absentee: An absentee is an individual considered by the household to be a member at the time of the interview but who is excluded from the survey’s definition of household membership because of his/her prolonged absence (currently or expected to be away for more than six months).7
Migrants are counted at the destination and, hence, by definition, are all living within the country, including immigrants, whereas absentees are enumerated at the place of origin and can consist of both internal and external migrants.
2.1.2 National Census, 2001 and 2011The National Census is a decennial undertaking that collects information on the population and socio-economic characteristics of the country.
Variables: This paper includes information from the census on: i) gender, ii) age (at migration), iii) origin (rural/urban, ecological zone, development region, eco-development region), iv) destination, v) reason for migration, vi) duration of migration, vii) level of education, viii) place of residence (in Nepal), ix) country of origin (for immigrants), x) place of birth, and xi) duration of migration.
DefinitionsMigrant: A migrant is defined in the census as ‘a person who moves either from his [or her] place of birth to another area or keeps on moving stepwise8 or circular9 by changing his [or her] residence more or less frequently by being either seasonal, temporary, semi-permanent or permanent migrant depending upon the duration of migration and reasons for migration within a defined geographic area’.10

State of Migration in nepal 5
Absentee: The census considers an absentee to be any member of a household who has been abroad for six or more months prior to the time of enumeration.Migrants are counted at the destination and, hence, are all living within the country whereas absentees, although enumerated at the place of origin, denote only external migrants. The census deals with immigrants as a separate category.
2.1.3 National Demographic and Health Survey, 2006 and 2011The National Demographic and Health Survey (NDHS) examines issues of health and population using nationally representative household-level data. This paper draws on the last two NDHSs, 2006 (8707 households) and 2011 (10,826 households).11
Variables: Both surveys profile migrants by: i) gender, ii) age (at migration), iii) origin (rural/urban, ecological zone, development region, eco-development region), iv) destination, v) reason for migration, and vi) duration of migration. Additionally, NDHS 2006 also includes information on the education level of migrants and their marital status, while NDHS 2011 analyses wealth quintiles.
DefinitionMigrant: While NDHS 2006 collected information on the status of household members who had migrated in the 12-month period prior to the survey, NDHS 2011 also included individuals who had migrated from the household in the previous 10 years prior to the survey. NDHS 2011 made a distinction between ‘life-time migration’ and ‘period migration’, with the former indicating a permanent shift in place of residence that occurred more than five years before the survey,12 and the latter referring to the mobility patterns of internal migrants in the five years before the survey. These differences apart, both NDHSs considered internal migrants as well as international migrants, distinguishing between those who had gone to India and those going to other countries.
2.1.4 National Labour Force Survey, 2008The National Labour Force Survey (NLFS) was designed to collect information on the status of the labour market by producing vital statistics on the conditions of employment, unemployment, under-employment and other information

6 State of Migration in nepal
Tabl
e 2:
Rec
ent S
urve
ys, V
aria
bles
and
Def
initi
ons U
sed
S
urve
y
Indi
cato
rs
Cens
us 2
001
Cens
us 2
011
NDH
S 20
06N
DHS
2011
Vari
able
si.
ge
nder
ii.
orig
in (r
ural
/urb
an,
ecol
ogic
al z
one,
de
velo
pmen
t reg
ion,
eco
-de
velo
pmen
t reg
ion)
iii.
desti
natio
niv
. re
ason
for
mig
ratio
nv.
pl
ace
of re
side
nce
(in
Nep
al)
vi.
coun
try
of o
rigi
n (f
or
imm
igra
nts)
pla
ce o
f bir
thvi
i. ag
e (o
f im
mig
rant
s)
i. ge
nder
ii.
age
(at m
igra
tion)
iii.
orig
in (r
ural
/urb
an,
ecol
ogic
al z
one,
de
velo
pmen
t reg
ion,
eco
-de
velo
pmen
t reg
ion)
iv
. de
stina
tion
v.
reas
on fo
r m
igra
tion
vi.
dura
tion
of m
igra
tion
vii.
lev
el o
f edu
catio
nvi
ii. p
lace
of r
esid
ence
(in
Nep
al)
ix.
coun
try
of o
rigi
n (f
or
imm
igra
nts)
x.
plac
e of
bir
thxi
. du
ratio
n of
mig
ratio
n
i.
gend
erii.
ag
eiii
. m
arita
l sta
tus
iv.
orig
in (r
ural
/urb
an,
ecol
ogic
al z
one,
de
velo
pmen
t reg
ion,
eco
-de
velo
pmen
t reg
ion)
v.
leve
l of e
duca
tion
vi.
desti
natio
nvi
i. d
urati
on o
f mig
ratio
n
i. g
ende
rii.
ag
e (a
t mig
ratio
n)iii
. or
igin
(rur
al/u
rban
, ec
olog
ical
zon
e,
deve
lopm
ent r
egio
n, e
co-
deve
lopm
ent r
egio
n)iv
. de
stina
tion
v.
reas
on fo
r m
igra
tion
vi
dura
tion
of m
igra
tion
vii.
wea
lth q
uinti
le
Mig
rant
A p
erso
n w
ho m
oves
eith
er fr
om h
is [o
r he
r] p
lace
of b
irth
to
anot
her
area
or
keep
s on
mov
ing
step
wis
e14 o
r ci
rcul
ar15
by
chan
ging
his
[or
her]
resi
denc
e m
ore
or le
ss fr
eque
ntly
by
bein
g ei
ther
a s
easo
nal,
tem
pora
ry, s
emi-p
erm
anen
t or
perm
anen
t m
igra
nt, d
epen
ding
upo
n th
e du
ratio
n of
mig
ratio
n an
d re
ason
s fo
r m
igra
tion
with
in a
defi
ned
geog
raph
ic a
rea
(i.e.
, int
erna
l m
igra
nts
only
).
A h
ouse
hold
mem
ber
who
had
m
oved
aw
ay in
the
12-m
onth
pe
riod
pri
or to
the
surv
ey.
A p
erso
n w
ho h
as m
igra
ted
away
from
the
hous
ehol
d in
the
10 y
ears
pri
or to
the
surv
ey.
Abs
ente
eA
ny m
embe
r of
a h
ouse
hold
who
has
bee
n ab
road
for
six
or
mor
e m
onth
s pr
ior
to th
e tim
e of
enu
mer
ation
(i.e
., ex
tern
al
mig
rant
s on
ly).
State of Migration in nepal 7
S
urve
y
Indi
cato
rs
NLF
S 20
08N
LSS
2003
/04
and
2010
/11
NM
S 20
09
Vari
able
si)
ge
nder
ii)
age
iii)
orig
in (r
ural
/urb
an,
ecol
ogic
al z
one,
de
velo
pmen
t reg
ion,
eco
-de
velo
pmen
t reg
ion)
iv)
desti
natio
nv)
le
vel o
f edu
catio
nvi
) re
ason
for
mig
ratio
nvi
i) e
cono
mic
sta
tus
viii)
last
pla
ce o
f res
iden
ceix
) re
mitt
ance
(in
a se
para
te
chap
ter)
i. ge
nder
ii.
age
iii.
mar
ital s
tatu
siv
. or
igin
(rur
al/u
rban
, ec
olog
ical
zon
e,
deve
lopm
ent r
egio
n, e
co-
deve
lopm
ent r
egio
n)v.
de
stina
tion
vi.
leve
l of e
duca
tion
vii.
con
sum
ption
qui
ntile
viii.
rea
son
for
mig
ratio
nix
. oc
cupa
tiona
l sta
tus
x.
rem
ittan
ce (s
ize
and
dist
ribu
tion)
(in
a se
para
te
chap
ter)
(sep
arat
e se
ction
on
abs
ente
e ch
ildre
n un
der
14)
i. vo
lum
e of
mig
ratio
nii.
ge
nder
iii.
age
iv.
mar
ital s
tatu
s v.
or
igin
(rur
al/u
rban
, ec
olog
ical
zon
e,
deve
lopm
ent r
egio
n, e
co-
deve
lopm
ent r
egio
n)vi
. de
stina
tion
vii.
leve
l of e
duca
tion
viii.
eth
nici
tyix
. se
ctor
of w
ork
x.
occu
patio
n (b
efor
e an
d aft
er m
igra
tion)
xi.
wea
lth q
uinti
lexi
i. r
emitt
ance
s xi
ii) in
com
e an
d sa
ving
sxi
ii. m
eans
of f
undi
ngM
igra
ntA
ny h
ouse
hold
mem
ber
who
was
not
bor
n in
thei
r cu
rren
t pl
ace
of re
side
nce
but w
ho m
oved
to th
eir
curr
ent r
esid
ence
fr
om a
noth
er V
DC
or m
unic
ipal
ity o
r fr
om a
noth
er c
ount
ry (i
.e.,
inte
rnal
mig
rant
s an
d im
mig
rant
s).
NA
Abs
ente
eA
n in
divi
dual
con
side
red
by th
e ho
useh
old
to b
e a
mem
ber
at th
e tim
e of
the
inte
rvie
w b
ut e
xclu
ded
from
the
surv
ey’s
de
finiti
on o
f hou
seho
ld m
embe
rshi
p be
caus
e of
his
/her
abs
ence
(m
ore
than
six
mon
ths
out o
f the
last
12
mon
ths,
or
expe
cted
to
be a
way
for
mor
e th
an s
ix m
onth
s be
fore
retu
rnin
g to
the
sam
e ho
useh
old)
(i.e
., bo
th in
tern
al a
nd e
xter
nal m
igra
nts)
.
NA
8 State of Migration in nepal
relevant to labour. Two NLFSs have been administered in Nepal thus far, one in 1998/99 and another in 2008. This paper considers only the 2008 survey (which had a sample size of 15,976 households).13
Variables: NLFS 2008 contains information specific to migrant workers, namely, i) gender, ii) age, iii) origin (rural/urban, ecological zone, development region, eco-development region), iv) destination, v) level of education, vi) reason for migration, vii) economic status, viii) last place of residence, and ix) remittance (in a separate chapter).
The definitions of ‘migrant’ and ‘absentee’ used in NLFS follow NLSS.
2.1.5 Nepal Migration Survey, 2009The findings of the Nepal Migration Survey (NMS) 2009 (sample size of 3,200 households) are given in the World Bank report ‘Large-scale Migration & Remittances in Nepal: Opportunities, Issues, Challenges & Opportunities’.
Variables: While the primary focus of NMS is on international migration, it does contain information on internal migration as well. Some of the key variables considered by this survey are: i) volume of migration, ii) gender, iii) age, iv) marital status, v) origin (rural/urban, ecological zone, development region, eco-development region), vi) destination, vii) level of education, viii) ethnicity, ix) sector of work, x) occupation (before and after migration), xi) wealth quintile, xii) remittances, xiii) income and savings, and xiv) means of funding, among others.
2.2 Additional Issues for Consideration
Since migration has become a major societal phenomenon in the last couple of decades, all national surveys have perforce recognised it by now, and the more recent ones have dealt with it at some length. To take one example, while NLFS 1998/99 did not feature any questions on migration, NLFS 2008 devoted a whole chapter to it. It would, however, be naïve to expect every large-scale survey to give equal weight to migration because each has been conducted with its own particular focus, and only the Nepal Migration Survey 2009 has looked specifically at migration.
State of Migration in nepal 9
The overlaps in and analyses of common indicators in the surveys greatly serve the purpose of producing comparative data, cross-checking trends, and fostering a better understanding of issues. But, since the surveys do not examine the same indicators, direct comparisons are difficult and could potentially be misleading. This is true not only for the different surveys, but also for the same survey over different years. For instance, NDHS 2006 collected information on the educational and marital status of migrants, while NDHS 2011 did not. Additionally, unlike NDHS 2011, NDHS 2006 did not look at some key indicators relevant to the background characteristics of migrants such as their economic status (as inferred from wealth quintiles) and reasons for migration.
There are also differences in the way different surveys define and categorise migration as alluded to in the previous section. The distinctions between an absentee and a migrant and between internal and international migrants are not clear in all the surveys. Had a common definition been employed and the same set of indicators studied across time, a comparative analysis of migratory behaviour may have been more straightforward and meaningful. The fact remains that since the majority of the surveys analysed in this paper – the National Census, NLFS and NLSS – were administered by the same institution, the Central Bureau of Statistics, adopting such an approach would not have been impossible either.
3. Absentees
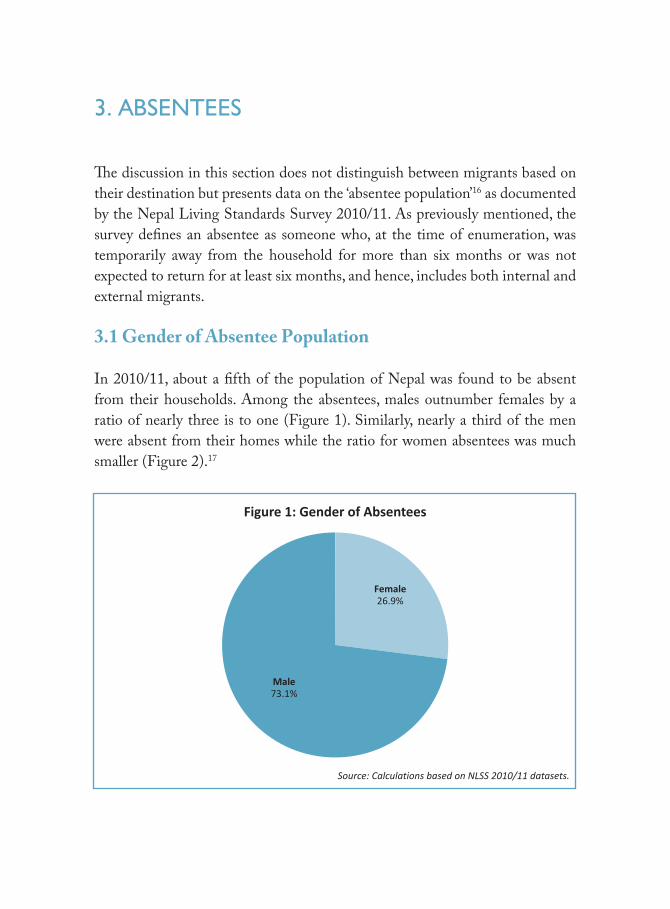
The discussion in this section does not distinguish between migrants based on their destination but presents data on the ‘absentee population’16 as documented by the Nepal Living Standards Survey 2010/11. As previously mentioned, the survey defines an absentee as someone who, at the time of enumeration, was temporarily away from the household for more than six months or was not expected to return for at least six months, and hence, includes both internal and external migrants.
3.1 Gender of Absentee Population
In 2010/11, about a fifth of the population of Nepal was found to be absent from their households. Among the absentees, males outnumber females by a ratio of nearly three is to one (Figure 1). Similarly, nearly a third of the men were absent from their homes while the ratio for women absentees was much smaller (Figure 2).17
Figure 1: Gender of Absentees
Source: Calculations based on NLSS 2010/11 datasets.
Male73.1%
Female 26.9%

State of Migration in nepal 11
3.2 Age of Absentee Population
In terms of age distribution, nearly half the absentees fall in the age group 15-29 years, followed by those aged 30-44.18 The former age group, which consists largely of individuals who have joined the workforce recently, can be considered to be the most active and most mobile category of individuals.
Figure 2: Absentees and Non-Absentees (by gender)
Source: Nepal Living Standards Survey 2010/11.
Male Female
Present in household Absent from household
70.2%
29.8%
10.9%
89.1%
60 years and above1.4%
Figure 3: Age Distribution of Absentees
Source: Calculations based on NLSS 2010/11 datasets.
0-4 years5.5%
5-14 years13.2%
15-29 years49.5%
30-44 years24.9%
45-59 years5.6%

100
90
80
70
60
50
40
30
20
10
0
Figure 4: Female Absentees (by age group)
Source: Nepal Living Standards Survey 2010/11.
0-4 years 5-14 years 15-29 years 30-44 years 45-60 years 60 years andabove
Absentee Non-absentee
10.4% 10.5%3.3% 2.2%
8.3%
19.3%
80.7%
89.6% 89.5%
96.7%97.8%
91.7%
100
90
80
70
60
50
40
30
20
10
0
Figure 5: Male Absentees (by age group)
0-4 years 5-14 years 15-29 years 30-44 years 45-60 years 60 years andabove
Absentee Non-absentee
Source: Nepal Living Standards Survey 2010/11.
12% 13.8%
55.8%
45.8%
54.2%
44.2%
86.2% 85.7%88%
14.3%3.9%
96.1%
State of Migration in nepal 13
Figures 4 and 5 reiterate the fact that women are not as mobile as their male counterparts. The proportion of absentee females is relatively low across all age groups. The highest is in the age group 15-29 years, with nearly 20 per cent of the female population from that cohort absent from their households in 2010/11.19
The proportion of absentees is higher among males than females across all age groups. As with women, the largest proportion of the male absentee population is also in the age group 15-29 years, with more than half the men from this group absent from their homes in 2010/11 along with a significant number from the 30-44 group. 20
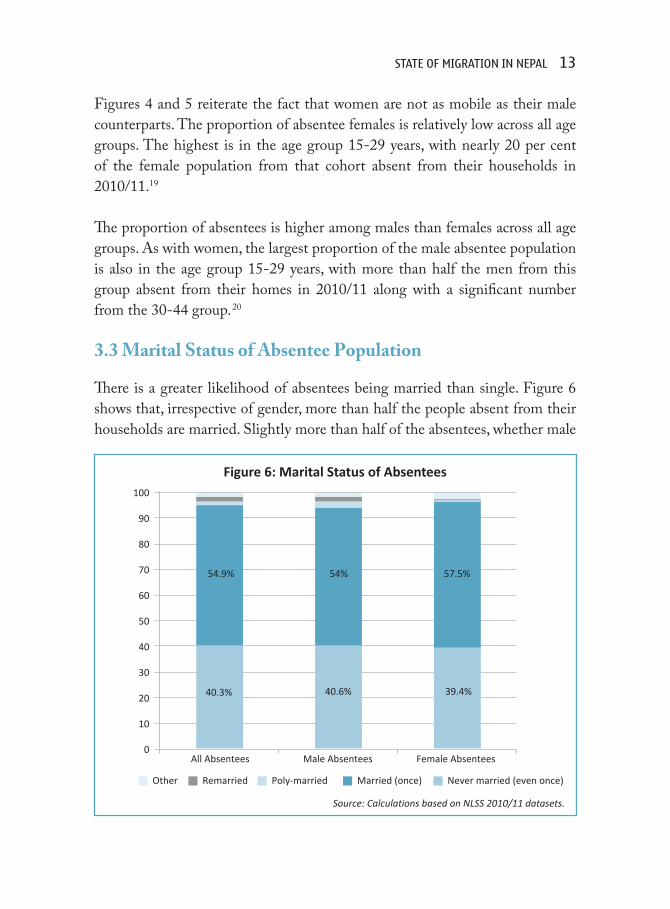
3.3 Marital Status of Absentee Population
There is a greater likelihood of absentees being married than single. Figure 6 shows that, irrespective of gender, more than half the people absent from their households are married. Slightly more than half of the absentees, whether male
100
90
80
70
60
50
40
30
20
10
0
Figure 6: Marital Status of Absentees
Source: Calculations based on NLSS 2010/11 datasets.
Other Remarried Poly-married Married (once) Never married (even once)
All Absentees Male Absentees Female Absentees
54.9%
40.3% 40.6%
54%
39.4%
57.5%

14 State of Migration in nepal
or female, have been married once, but this proportion is slightly higher in the case of females than males. Cases of poly-marriages and re-marriages are found to a certain degree among male absentees, but are very rare among female absentees.21
3.4 Origin of Absentee Population
Nearly half the individuals absent from their households are from the Hill region, and only a small number are from the Mountains.22 This could be a result of the varying population sizes living in the three ecological regions.23
The link between population size and the proportion of absentees is seen across developmental regions as well. The most-populated Central Region accounts for the highest proportion of absentees while the least-populated Far-Western Region contributes the smallest proportion. There is, however, a slight discrepancy in this trend while comparing the Eastern and Western Regions. A total of 21.9 per cent (5,811,555) of Nepal’s population live in the Eastern Region and 18.6 per cent (4,926,765) in the Western Region.24 But, as shown in Figure 8, the proportion of absentees is slightly greater in the Western Region than in the Eastern.
Source: Calculations based on NLSS 2010/11 datasets.
Figure 7: Distribution of Absentees (by ecological region)
Mountain9.6%
Hill47.4%
Tarai43%

State of Migration in nepal 15
3.5 Destination of Absentee PopulationUnderscoring historical trends, even as the number of Nepalis going abroad has continued to rise in the past couple of decades, the majority of absentees are found to have moved within Nepal.25
Figure 8: Regional Distribution of Absentees
Source: Calculations based on NLSS 2010/11 datasets.
Far-Western10.8%
Mid-Western11.4%
Western24.2%
Central31.8%
Eastern22%
Figure 9: Destination of Absentees
Source: Nepal Living Standards Survey 2010/11.
Within Nepal 56.9%
Outside Nepal 43.1%
16 State of Migration in nepal
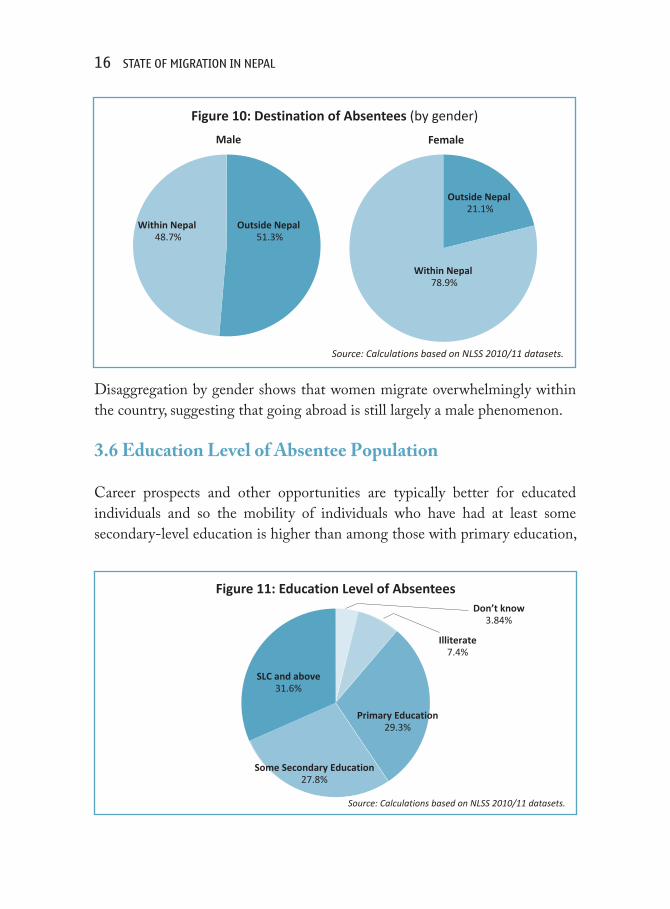
Disaggregation by gender shows that women migrate overwhelmingly within the country, suggesting that going abroad is still largely a male phenomenon.
3.6 Education Level of Absentee Population
Career prospects and other opportunities are typically better for educated individuals and so the mobility of individuals who have had at least some secondary-level education is higher than among those with primary education,
Source: Calculations based on NLSS 2010/11 datasets.
Figure 11: Education Level of AbsenteesDon’t know
3.84%
Illiterate7.4%
Primary Education29.3%
Some Secondary Education27.8%
SLC and above 31.6%
Source: Calculations based on NLSS 2010/11 datasets.
Within Nepal 48.7%
Outside Nepal 51.3%
Within Nepal 78.9%
Figure 10: Destination of Absentees (by gender)
Outside Nepal 21.1%
Male Female
State of Migration in nepal 17
and individuals with primary education have higher mobility than the illiterate, the least mobile group. Individuals who have received at least their School Leaving Certificate (SLC),26 the widely regarded benchmark of formal education in Nepal, account for the majority of absentees.27 A breakdown of the education levels of absentees is presented in Figure 11.
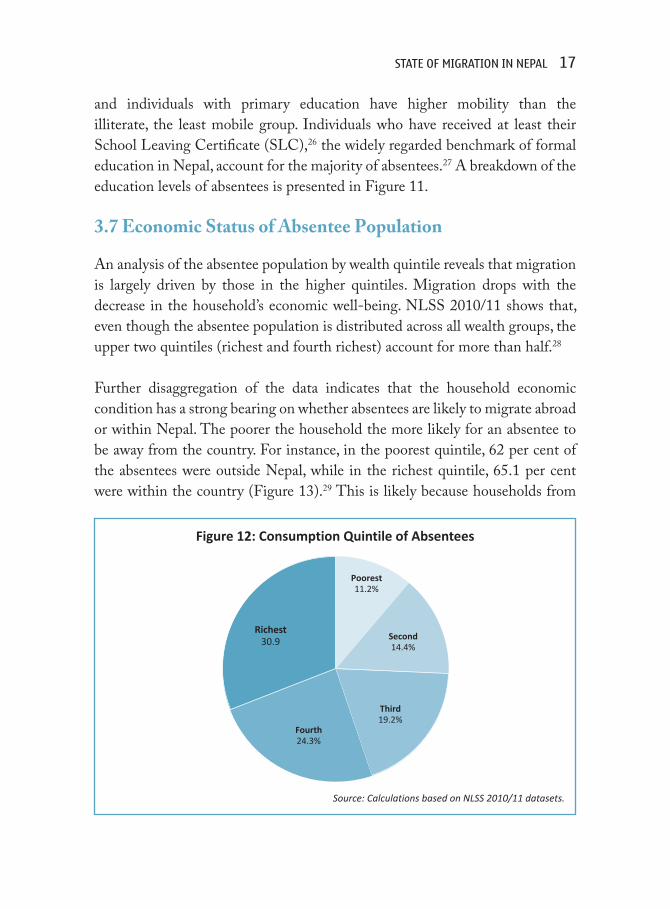
3.7 Economic Status of Absentee Population
An analysis of the absentee population by wealth quintile reveals that migration is largely driven by those in the higher quintiles. Migration drops with the decrease in the household’s economic well-being. NLSS 2010/11 shows that, even though the absentee population is distributed across all wealth groups, the upper two quintiles (richest and fourth richest) account for more than half.28
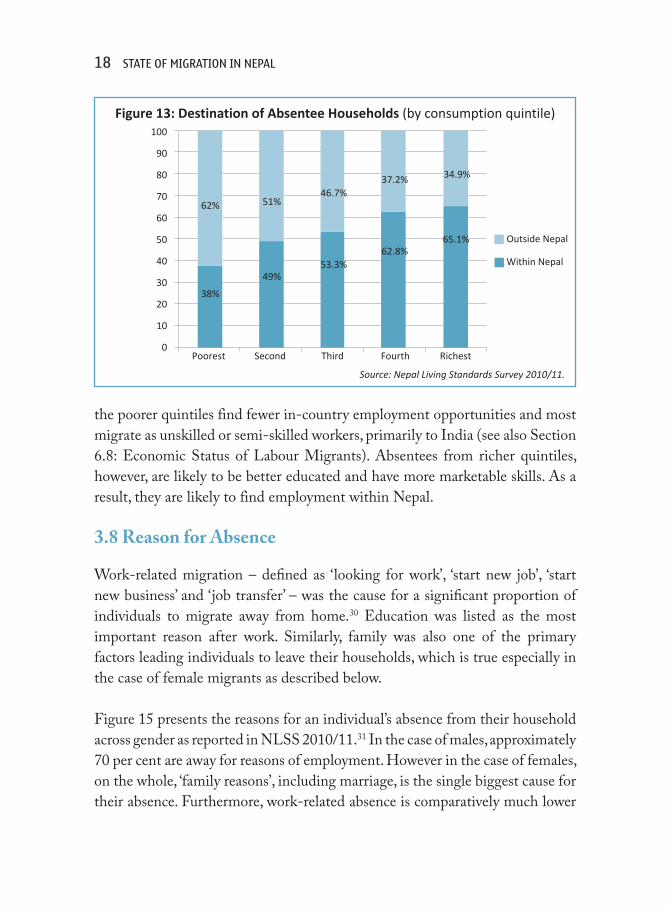
Further disaggregation of the data indicates that the household economic condition has a strong bearing on whether absentees are likely to migrate abroad or within Nepal. The poorer the household the more likely for an absentee to be away from the country. For instance, in the poorest quintile, 62 per cent of the absentees were outside Nepal, while in the richest quintile, 65.1 per cent were within the country (Figure 13).29 This is likely because households from
Fourth 24.3%
Third 19.2%
Second 14.4%
Poorest 11.2%
Figure 12: Consumption Quintile of Absentees
Source: Calculations based on NLSS 2010/11 datasets.
Richest30.9
18 State of Migration in nepal
100
90
80
70
60
50
40
30
20
10
0
Figure 13: Destination of Absentee Households (by consumption quintile)
Poorest Second Third Fourth Richest
38%
49%53.3%
62.8%65.1%
62% 51%46.7%
37.2% 34.9%
Within Nepal
Outside Nepal
Source: Nepal Living Standards Survey 2010/11.
the poorer quintiles find fewer in-country employment opportunities and most migrate as unskilled or semi-skilled workers, primarily to India (see also Section 6.8: Economic Status of Labour Migrants). Absentees from richer quintiles, however, are likely to be better educated and have more marketable skills. As a result, they are likely to find employment within Nepal.
3.8 Reason for Absence
Work-related migration – defined as ‘looking for work’, ‘start new job’, ‘start new business’ and ‘job transfer’ – was the cause for a significant proportion of individuals to migrate away from home.30 Education was listed as the most important reason after work. Similarly, family was also one of the primary factors leading individuals to leave their households, which is true especially in the case of female migrants as described below.
Figure 15 presents the reasons for an individual’s absence from their household across gender as reported in NLSS 2010/11.31 In the case of males, approximately 70 per cent are away for reasons of employment. However in the case of females, on the whole, ‘family reasons’, including marriage, is the single biggest cause for their absence. Furthermore, work-related absence is comparatively much lower

State of Migration in nepal 19
among women than men, which suggests that men leave their homes to earn while women’s absence is tied more to the migration of their respective families. Interestingly, in terms of proportion, more women than men migrate in pursuit of education.32
Figure 14: Reason for Absence
Source: Nepal Living Standards Survey 2010/11.
Family19.5%
Study21.3%
Work27.4%
Others31.9%
Figure 15: Reason for Absence (by gender)
Source: Nepal Living Standards Survey 2010/11.
Work17.2%
Study26.1%
Family reasons48.3%
Others8.4%
Work67.9%
Study19.6%
Family reasons9.4%
Female MaleOthers3.1%
4. InternAl MIgrAtIon33
While mobility within the country has always been a key dimension of migration in Nepal, the focus of research in recent years has been almost exclusively on external labour migration. This chapter considers data from NLSS 2010/11, particularly the raw data provided by the CBS, and NDHS 2011, NLFS 2008, National Census 2001, and Nepal Migration Survey 2009 to assess the situation of internal migrants in the country.
4.1 Gender of Internal Migrants
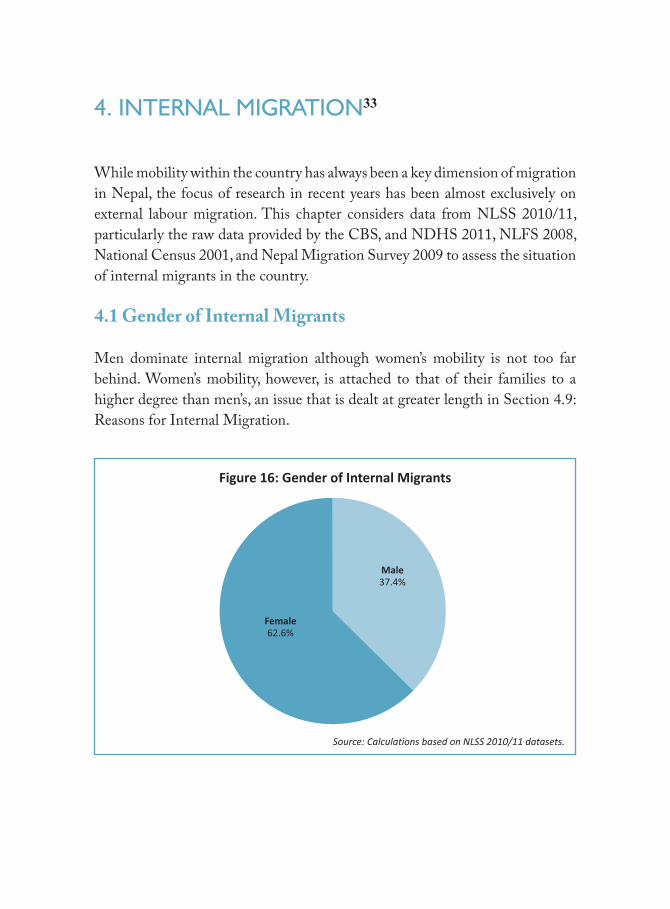
Men dominate internal migration although women’s mobility is not too far behind. Women’s mobility, however, is attached to that of their families to a higher degree than men’s, an issue that is dealt at greater length in Section 4.9: Reasons for Internal Migration.
Figure 16: Gender of Internal Migrants
Source: Calculations based on NLSS 2010/11 datasets.
Female62.6%
Male37.4%
State of Migration in nepal 21
4.2 Age of Internal Migrants
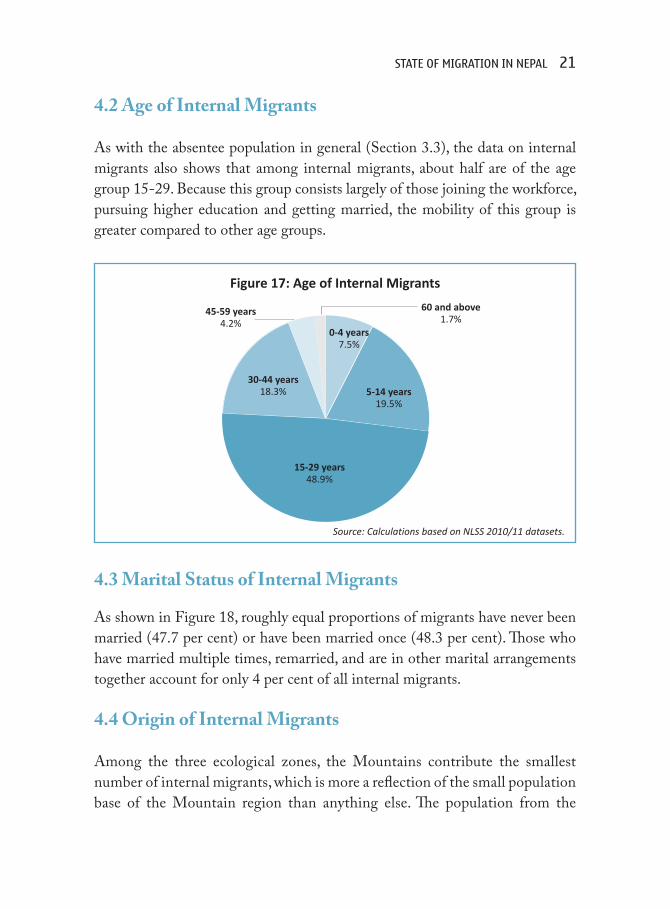
As with the absentee population in general (Section 3.3), the data on internal migrants also shows that among internal migrants, about half are of the age group 15-29. Because this group consists largely of those joining the workforce, pursuing higher education and getting married, the mobility of this group is greater compared to other age groups.
4.3 Marital Status of Internal Migrants
As shown in Figure 18, roughly equal proportions of migrants have never been married (47.7 per cent) or have been married once (48.3 per cent). Those who have married multiple times, remarried, and are in other marital arrangements together account for only 4 per cent of all internal migrants.
4.4 Origin of Internal Migrants
Among the three ecological zones, the Mountains contribute the smallest number of internal migrants, which is more a reflection of the small population base of the Mountain region than anything else. The population from the
Figure 17: Age of Internal Migrants
Source: Calculations based on NLSS 2010/11 datasets.
0-4 years 7.5%
5-14 years19.5%
15-29 years48.9%
30-44 years18.3%
45-59 years4.2%
60 and above1.7%

22 State of Migration in nepal
Figure 18: Marital Status of Internal Migrants
Source: Calculations based on NLSS 2010/11 datasets.
Never married47.7%
Single married48.3%
Poly-married 1.3%
Re-married 1.5%
Other 1.2%
Hills is more mobile compared to those from the other two regions.
A vast majority of internal migrants, as reported by their household members, have origins in the Eastern, Central and Western regions (Figure 20). Nine out
Source: Calculations based on NLSS 2010/11 datasets.
Mountain11.7%
Hill49.3%
Figure 19: Origin of Internal Migrants (by ecological region)
Tarai39%

State of Migration in nepal 23
Figure 20: Origin of Internal Migrants (by development region)
Source: Calculations based on NLSS 2010/11 datasets.
Far-Western9.8%
Mid-Western10.3%
Western20.6%
Central36.7%
Eastern22.6%
Figure 21: Origin of Internal Migrants (by locality and gender)
Source: Nepal Labour Force Survey 2008.Female Male
9.1%
90.9%
10.1%
89.9%
Rural
Urban
of 10 internal migrants originate in the rural areas (Figure 21), a proportion that holds true across the gender divide as well.
Similarly, rural-to-rural migration accounts for more than 60 per cent of all internal migration (Figure 22). In fact, the volume of migration between rural areas is three times more than that of rural-to-urban migration.34

24 State of Migration in nepal
Rural-to-rural areas62.5%
Rural-to-urban areas17.7%
Urban-to-rural areas4.2%
Urban-to-urban areas3%
Outside Nepal to rural areas10.2%
Outside Nepal to urban areas2.5%
Figure 22: Trends in Internal Migration (by origin and current location)
Source: Nepal Labour Force Survey 2008.
4.5 Destination of Internal Migrants
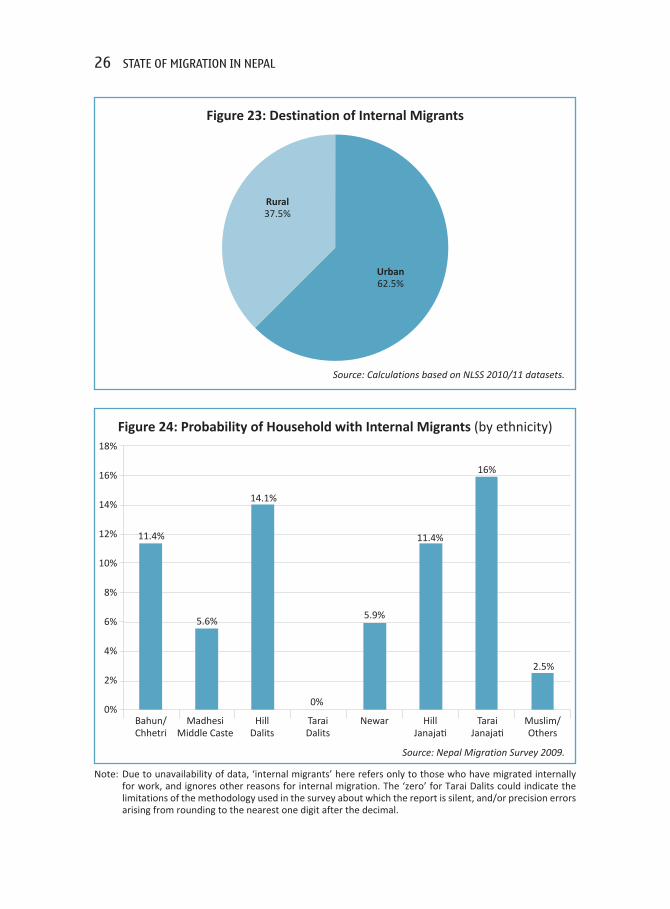
According to NLSS 2010/11, over a fifth of Nepal’s population consists of internal migrants, with the proportion of the migrant population being higher in urban areas than in the rural parts (Figure 23). Notably, even though survey results suggest that more than half of all urban residents are internal migrants and that the proportion of migrants in the rural areas is relatively small, since 83 per cent of Nepal’s population lives in rural areas the actual number of migrants in rural areas is much larger.35
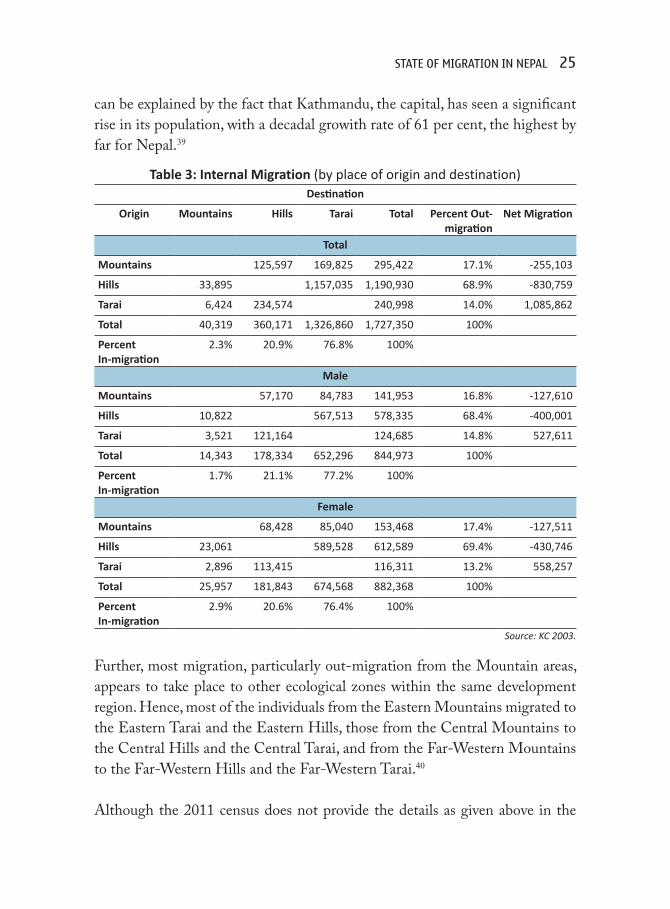
As stated earlier, 57 per cent of individuals absent from their households can be found within Nepal.36 The Tarai is the top recipient of internal migrants. As illustrated in Table 3, among all ecological zones, net migration37 is positive only in the Tarai region while the Hill region has the highest percentage of out-migration. This indicates a continuity in the Hill-to-Tarai migration that began in the late 1950s.38 Among development regions, the Central Region has the highest percentage of internal migrants, followed closely by the Eastern Region. That the Central Region is the highest recipient of internal migrants
State of Migration in nepal 25
can be explained by the fact that Kathmandu, the capital, has seen a significant rise in its population, with a decadal growith rate of 61 per cent, the highest by far for Nepal.39
Table 3: Internal Migration (by place of origin and destination)Destination
Origin Mountains Hills Tarai Total Percent Out-migration
Net Migration
Total
Mountains 125,597 169,825 295,422 17.1% -255,103
Hills 33,895 1,157,035 1,190,930 68.9% -830,759
Tarai 6,424 234,574 240,998 14.0% 1,085,862
Total 40,319 360,171 1,326,860 1,727,350 100%
Percent In-migration
2.3% 20.9% 76.8% 100%
Male
Mountains 57,170 84,783 141,953 16.8% -127,610
Hills 10,822 567,513 578,335 68.4% -400,001
Tarai 3,521 121,164 124,685 14.8% 527,611
Total 14,343 178,334 652,296 844,973 100%
Percent In-migration
1.7% 21.1% 77.2% 100%
Female
Mountains 68,428 85,040 153,468 17.4% -127,511
Hills 23,061 589,528 612,589 69.4% -430,746
Tarai 2,896 113,415 116,311 13.2% 558,257
Total 25,957 181,843 674,568 882,368 100%
Percent In-migration
2.9% 20.6% 76.4% 100%
Source: KC 2003.
Further, most migration, particularly out-migration from the Mountain areas, appears to take place to other ecological zones within the same development region. Hence, most of the individuals from the Eastern Mountains migrated to the Eastern Tarai and the Eastern Hills, those from the Central Mountains to the Central Hills and the Central Tarai, and from the Far-Western Mountains to the Far-Western Hills and the Far-Western Tarai.40
Although the 2011 census does not provide the details as given above in the
26 State of Migration in nepal
Figure 23: Destination of Internal Migrants
Source: Calculations based on NLSS 2010/11 datasets.
Urban62.5%
Rural37.5%
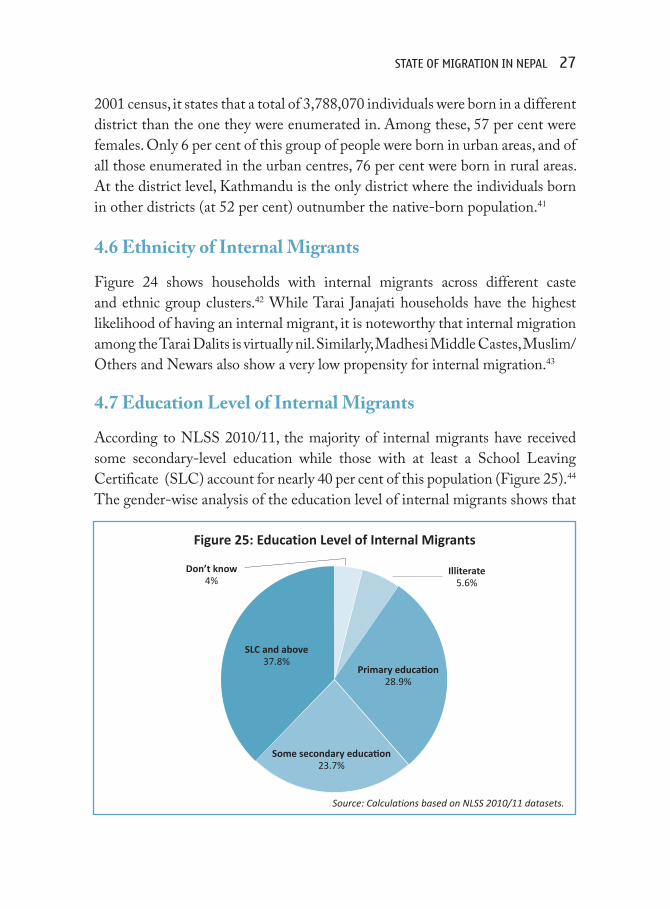
Figure 24: Probability of Household with Internal Migrants (by ethnicity)
Source: Nepal Migration Survey 2009.
Note: Due to unavailability of data, ‘internal migrants’ here refers only to those who have migrated internally for work, and ignores other reasons for internal migration. The ‘zero’ for Tarai Dalits could indicate the limitations of the methodology used in the survey about which the report is silent, and/or precision errors arising from rounding to the nearest one digit after the decimal.
18%
16%
14%
12%
10%
8%
6%
4%
2%
0%
11.4%
5.6%
14.1%
0%
5.9%
11.4%
16%
2.5%
Bahun/Chhetri
Madhesi Middle Caste
Hill Dalits
Tarai Dalits
Newar Hill Janajati
Tarai Janajati
Muslim/Others
State of Migration in nepal 27
2001 census, it states that a total of 3,788,070 individuals were born in a different district than the one they were enumerated in. Among these, 57 per cent were females. Only 6 per cent of this group of people were born in urban areas, and of all those enumerated in the urban centres, 76 per cent were born in rural areas. At the district level, Kathmandu is the only district where the individuals born in other districts (at 52 per cent) outnumber the native-born population.41
4.6 Ethnicity of Internal Migrants
Figure 24 shows households with internal migrants across different caste and ethnic group clusters.42 While Tarai Janajati households have the highest likelihood of having an internal migrant, it is noteworthy that internal migration among the Tarai Dalits is virtually nil. Similarly, Madhesi Middle Castes, Muslim/Others and Newars also show a very low propensity for internal migration.43
4.7 Education Level of Internal Migrants
According to NLSS 2010/11, the majority of internal migrants have received some secondary-level education while those with at least a School Leaving Certificate (SLC) account for nearly 40 per cent of this population (Figure 25).44
The gender-wise analysis of the education level of internal migrants shows that
Figure 25: Education Level of Internal Migrants
Source: Calculations based on NLSS 2010/11 datasets.
Don’t know 4%
Illiterate 5.6%
Primary education 28.9%
Some secondary education 23.7%
SLC and above37.8%

28 State of Migration in nepal
proportion of males and females have some secondary education. However, more females than males have no education and fewer females than males are educated to the level of SLC and above.
4.8 Economic Status of Internal Migrants
Internal migration declines sharply with decrease in economic status (Figure 27). The richer the household the higher the likelihood of its members having migrated internally; the probability of a household from the richest quintile having internal migrants is nearly five times greater than that of one from the lowest quintile.
100
90
80
70
60
50
40
30
20
10
0
Figure 26: Gender-wise Education Level of Internal Migrants
Source: Nepal Demographic and Health Survey 2006.
SLC and above Primary EducationSome Secondary Education No Education
Male Female
9.5%
24.4%
22%
17.9%
34%
33.6%
34.5%24.1%

State of Migration in nepal 29
4.9 Reasons for Internal Migration
In general, education and family are commonly cited reasons for the internal migration of those aged below 15 years. It is a common practice among families living in areas without educational opportunities to send their children to study elsewhere. Migrants from older age groups typically migrate for family reasons,45 employment and the pursuit of an easier lifestyle.
Source: Calculations based on NLSS 2010/11 datasets.
Poorest 7.5%
Second12.5%
Third17.9%
Fourth26.8%
Richest35.3%
Figure 27: Consumption Quintile of Internal Migrant Households
Other6.6%
Together with family/relatives19.4%
Other family reasons11.5%
Other work related18.2%
Looking for work13.0%
Figure 28: Reason for Internal Migration
Source: Calculations based on NLSS 2010/11 datasets.
Education and training31.3%

30 State of Migration in nepal
As stated earlier, work-related issues are the main reasons cited for migration. Nearly a third of the internal migration is attributed to employment (Figure 28). ‘Education and training’ and family reasons are other factors inducing people to migrate to other parts of the country.
There are, however, notable differences across the gender groups (Figure 29) as shown by NDHS 2011. Marriage is the main reason for female migration, which is followed by other family-related reasons, study and work. In contrast, the primary reasons for male internal migration are employment (50.6 per cent) and education (32.5 per cent).46
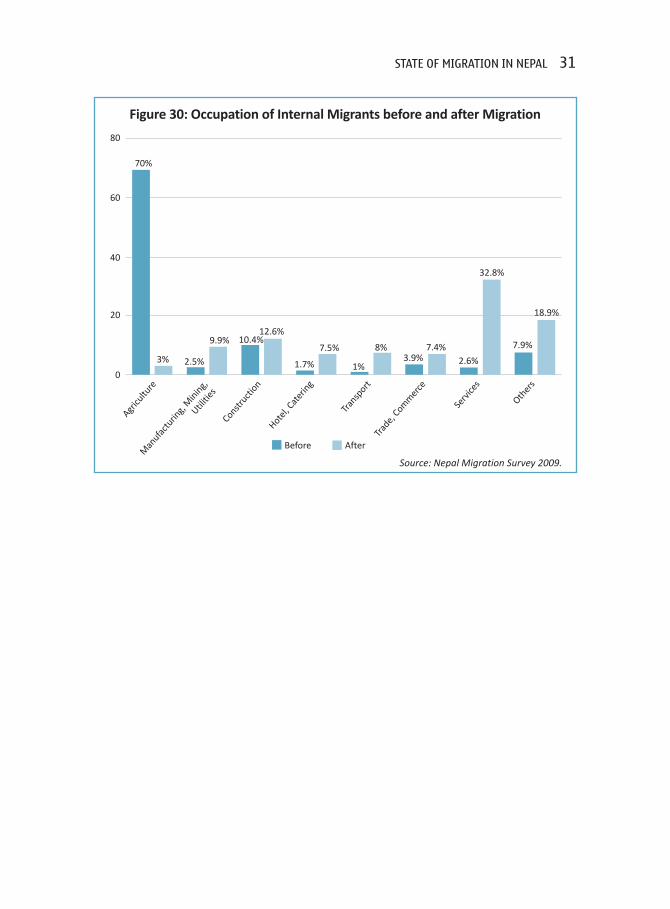
4.10 Occupation of Internal Migrants
Figure 30 shows the distribution of internal migrants47 across various sectors of employment before and after migration. Prior to migration, 70 per cent of those who had migrated internally reported being involved in agriculture, whereas the post-migration engagement in agriculture dropped to a measly 3 per cent.48 The services sector experienced a net increase of approximately 30 per cent, indicating that this is the sector that accommodated a significant proportion of the internal migrants. Manufacturing, mining and utilities; construction; hotel and catering; transport; and trade and commerce are other key sectors that attracted internal migrants within Nepal.49
Figure 29: Reason for Internal Migration (by gender)
Source: Nepal Demographic and Health Survey 2011.
Work49.7%
Study32%
Family reasons16.4%
Other2%
Work6%Study
14.4%
Family reasons20.1%
Other0.7%
Marriage58.9%
Female Male
State of Migration in nepal 31
80
60
40
20
0
70%
3% 2.5%
9.9% 10.4%12.6%
1.7%
7.5%
1%
8%3.9%
7.4%2.6%
32.8%
7.9%
18.9%
Source: Nepal Migration Survey 2009.
Agricu
lture
Man
ufactu
ring,
Mining,
Utiliti
esConstr
uction
Hotel, C
ater
ing
Transp
ortTra
de, Com
mer
ce
Serv
ices
Other
s
Before After
Figure 30: Occupation of Internal Migrants before and after Migration

5. InternAtIonAl MIgrAtIon
Migration to international destinations, primarily for employment, has been a defining feature of Nepali migration since the late 1990s. It is estimated that more than four million migrants are abroad and that nearly half of all households in Nepal either have at least one migrant in a foreign country or someone who has returned from a stint abroad. India, the Gulf region (primarily Qatar, Saudi Arabia and the UAE) and Malaysia are the main international destinations for Nepali migrants.50
5.1 Trends
Over the past 60 years, the number of international migrants has increased significantly from about 200,000 in the 1950s to approximately two million by 2011 (Figure 31). The most visible change occurred between 2001 and 2011 when the number of Nepalis abroad more than doubled.
The data over the years suggests that the proportion of international migrants
2,500,000
2,000,000
1,500,000
1,000,000
500,000
0
Male Female Total
173,619 198,120328,448
24,501 74,529
402,977
548,002
110,288
658,290 679,469
82,712
762,181
1,684,029
1,921,494
237,400
1952/54 1981 1991 2001 2011
Figure 31: International Migrants from Nepal
Source: Kansakar 2003; CBS 2014.

State of Migration in nepal 33
has continuously increased over the years. The growing popularity of foreign employment and student migration has increased the proportion of international migrants from 2.3 per cent of the total population in 1952/54 census to 7.3 per cent by the year 2011 (Figure 32).
8.0%
7.0%
6.0%
5.0%
4.0%
3.2%
2.0%
1.0%
0.0%
2.3%
1952/56 1961 1981 1991 2001 2011
3.4%
2.6%
3.4%
3.2%
7.3%
Figure 32: Percentage of International Migrants (of total population)
Source: Kansakar 2003; CBS 2014.
Figure 33 : Gender of International Migrants
Male1,684,029 (87.6%)
Female237,400 (12.4%)
Source: National Census 2011.
34 State of Migration in nepal
5.2 Gender of International Migrants
Females constitute a significantly lower percentage of international migrants (Figure 33), a ratio that has remained quite unchanged even in the intercensal decade between 2001 and 2011 that saw an exponential increase in international migration, registering only 12 females for every 100 males abroad in the 2011 census, a marginal increase compared to 11:100 in 2001. The smaller number of females among international migrants could also be due to various discrepancies in data,51 as will be discussed in Section 6.2: Gender of Labour Migrants.
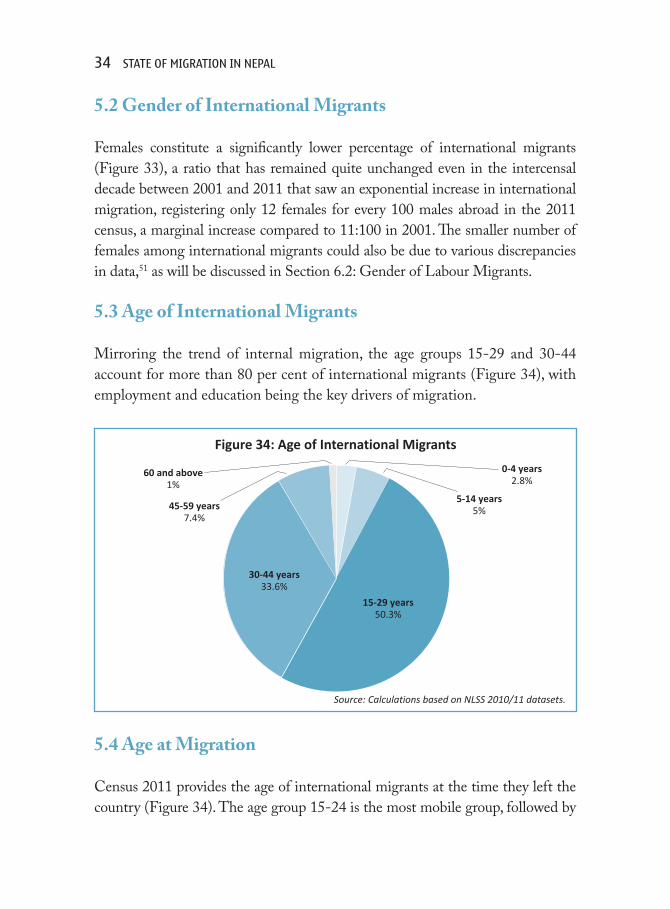
5.3 Age of International Migrants
Mirroring the trend of internal migration, the age groups 15-29 and 30-44 account for more than 80 per cent of international migrants (Figure 34), with employment and education being the key drivers of migration.
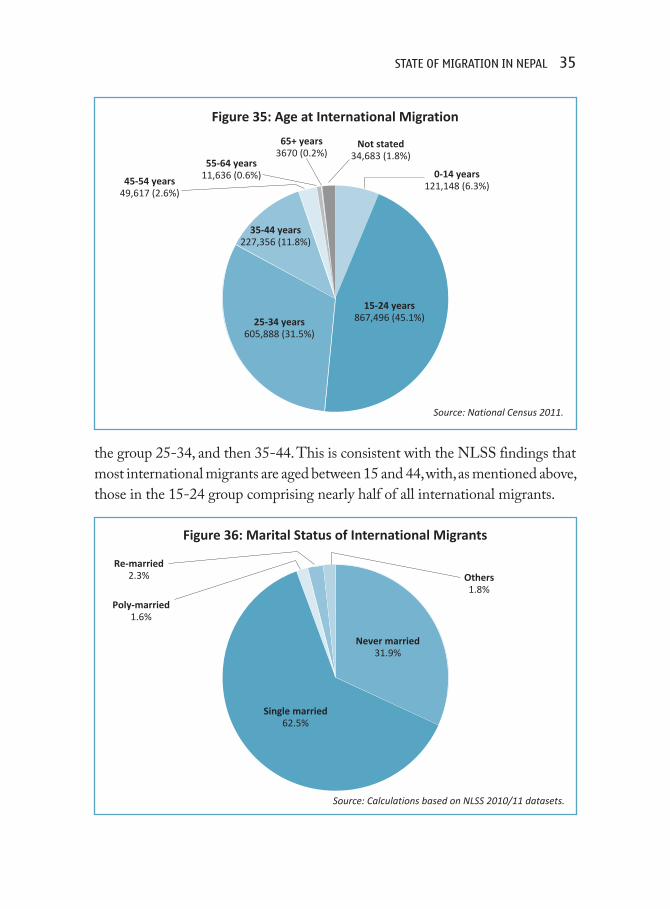
5.4 Age at Migration
Census 2011 provides the age of international migrants at the time they left the country (Figure 34). The age group 15-24 is the most mobile group, followed by
0-4 years2.8%
5-14 years5%
15-29 years50.3%
30-44 years33.6%
45-59 years7.4%
60 and above1%
Figure 34: Age of International Migrants
Source: Calculations based on NLSS 2010/11 datasets.
State of Migration in nepal 35
0-14 years121,148 (6.3%)
15-24 years867,496 (45.1%)25-34 years
605,888 (31.5%)
35-44 years227,356 (11.8%)
45-54 years49,617 (2.6%)
55-64 years11,636 (0.6%)
65+ years3670 (0.2%)
Not stated34,683 (1.8%)
Figure 35: Age at International Migration
Source: National Census 2011.
Never married31.9%
Single married62.5%
Poly-married1.6%
Re-married2.3% Others
1.8%
Figure 36: Marital Status of International Migrants
Source: Calculations based on NLSS 2010/11 datasets.
the group 25-34, and then 35-44. This is consistent with the NLSS findings that most international migrants are aged between 15 and 44, with, as mentioned above, those in the 15-24 group comprising nearly half of all international migrants.
36 State of Migration in nepal
5.5 Marital Status of International Migrants
A dominant majority of international migrants are married as is the case among internal migrants.
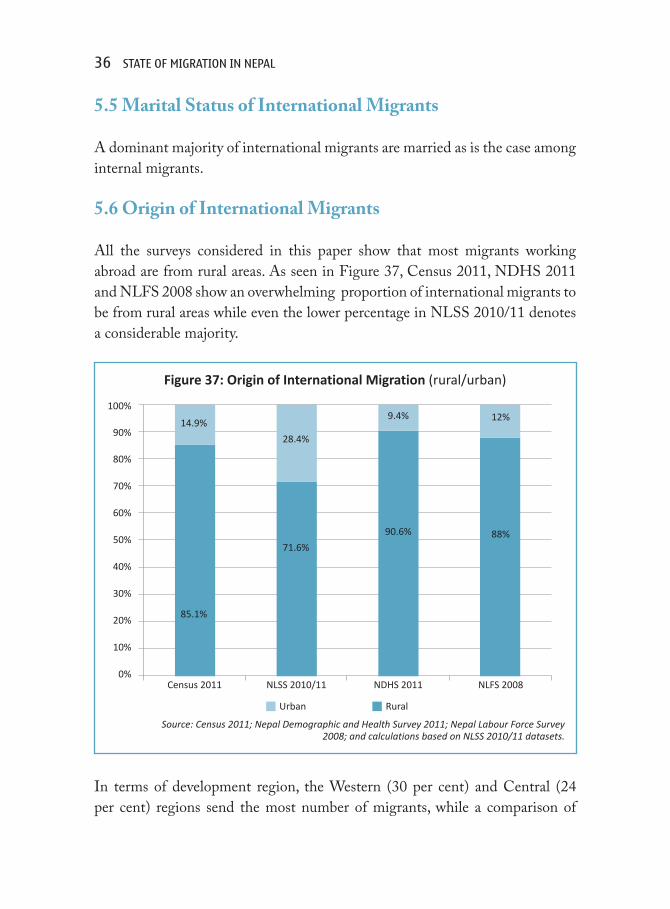
5.6 Origin of International Migrants
All the surveys considered in this paper show that most migrants working abroad are from rural areas. As seen in Figure 37, Census 2011, NDHS 2011 and NLFS 2008 show an overwhelming proportion of international migrants to be from rural areas while even the lower percentage in NLSS 2010/11 denotes a considerable majority.
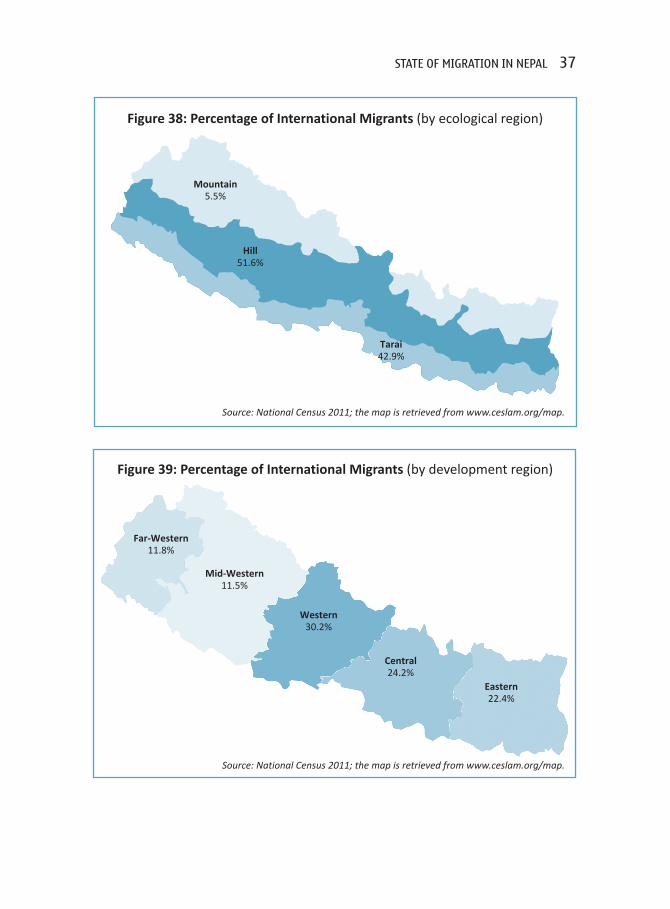
In terms of development region, the Western (30 per cent) and Central (24 per cent) regions send the most number of migrants, while a comparison of
Urban Rural
100%
90%
80%
70%
60%
50%
40%
30%
20%
10%
0%Census 2011 NLSS 2010/11 NDHS 2011 NLFS 2008
85.1%
14.9%
28.4%
71.6%
90.6%
9.4% 12%
88%
Source: Census 2011; Nepal Demographic and Health Survey 2011; Nepal Labour Force Survey 2008; and calculations based on NLSS 2010/11 datasets.
Figure 37: Origin of International Migration (rural/urban)
State of Migration in nepal 37
Figure 39: Percentage of International Migrants (by development region)
Far-Western11.8%
Mid-Western11.5%
Western30.2%
Central24.2%
Eastern22.4%
Source: National Census 2011; the map is retrieved from www.ceslam.org/map.
Figure 38: Percentage of International Migrants (by ecological region)
Source: National Census 2011; the map is retrieved from www.ceslam.org/map.
Mountain5.5%
Hill51.6%
Tarai42.9%
38 State of Migration in nepal
30%
25%
20%
15%
10%
5%
0%
Figure 40: Origin of International Migrants (by eco-development region)
Source: National Census 2011.
East
ern
Tara
i
East
ern
Hill
s
East
ern
Mou
ntai
ns
Cent
ral T
arai
Cent
ral H
ills
Cent
ral M
ount
ains
Wes
tern
Tar
ai
Wes
tern
Hill
s
Wes
tern
Mou
ntai
ns
Mid
-Wes
tern
Tar
ai
Mid
-Wes
tern
Hill
s
Mid
-Wes
tern
Mou
ntai
ns
Far-
Wes
tern
Tar
ai
Far-
Wes
tern
Hill
s
Far-
Wes
tern
Mou
ntai
ns
6.7%
14.2%
1.4% 0.3%
6.6%
4.7%
0.1%
8.2%
1.7% 2%
4.5%5.3%
11.9%10.5%
21.9%
ecological zones shows the Hills (51.6 per cent) sending more migrants abroad than the Tarai (42.9 per cent) and the Mountains (5.5 per cent) combined.52
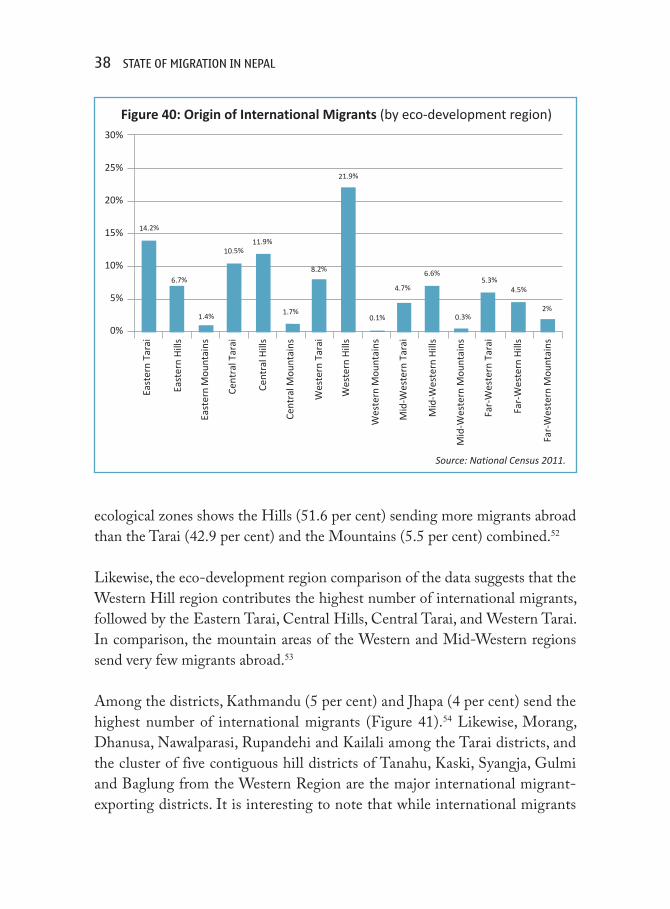
Likewise, the eco-development region comparison of the data suggests that the Western Hill region contributes the highest number of international migrants, followed by the Eastern Tarai, Central Hills, Central Tarai, and Western Tarai. In comparison, the mountain areas of the Western and Mid-Western regions send very few migrants abroad.53
Among the districts, Kathmandu (5 per cent) and Jhapa (4 per cent) send the highest number of international migrants (Figure 41).54 Likewise, Morang, Dhanusa, Nawalparasi, Rupandehi and Kailali among the Tarai districts, and the cluster of five contiguous hill districts of Tanahu, Kaski, Syangja, Gulmi and Baglung from the Western Region are the major international migrant-exporting districts. It is interesting to note that while international migrants

State of Migration in nepal 39
Figure 41: International Migrants’ District of Origin
Source: National Census 2011; the map is retrieved from www.ceslam.org/map.
0-20,00020,001-40,00040,001-60,00060,001-80,00080,001-100,000
KathmanduJhapa
MorangDhanusha
NawalparasiRupandehi
Kailali
TanahuSyangja
Kaski
Gulmi
Baglung
from the Tarai and the Western Hills originate in a number of districts, nearly half of those from the Central Hills have origins in Kathmandu.55
5.7 Destination of International Migrants
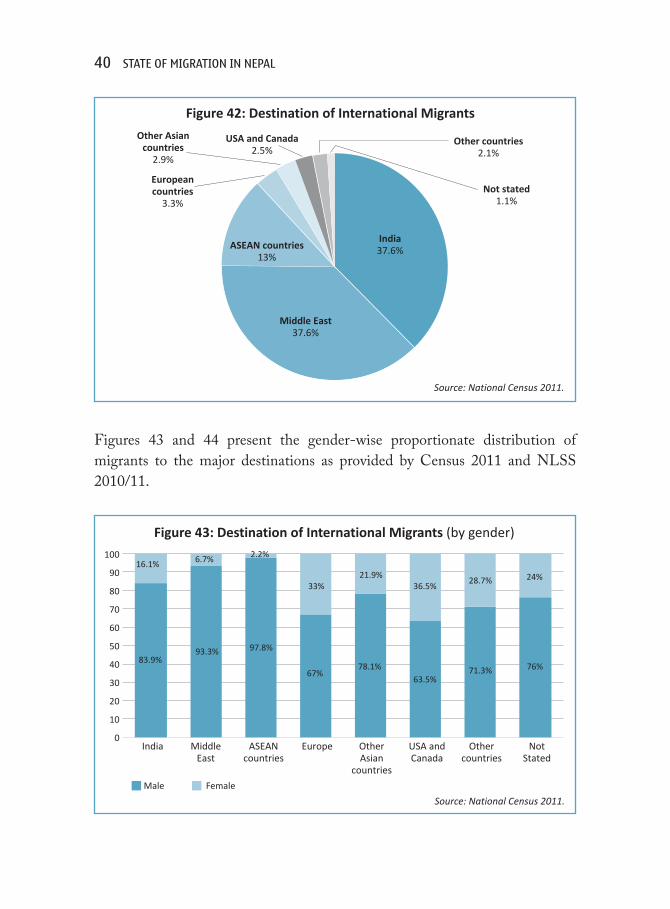
Given its proximity and socio-cultural affinities, and further assisted by the open border between the two countries, India has been a favourite destination for Nepalis.56 But, now, the countries of the Middle East57 have overtaken India as the primary destination for Nepali males. For female migrants, however, India still stands out as the top destination. In terms of proportion, the ratio of females going to the West (USA, Canada and the European Union) is higher than those going anywhere else. Of the total migrants in the ‘USA and Canada’, and ‘European Union countries’, 33 per cent and 37 per cent, respectively, are females, with those going to ‘Other Asian’ countries (at 21.9 per cent) a distant third (see Figure 43).58
40 State of Migration in nepal
Figures 43 and 44 present the gender-wise proportionate distribution of migrants to the major destinations as provided by Census 2011 and NLSS 2010/11.
Figure 42: Destination of International Migrants
Source: National Census 2011.
India37.6%
Middle East37.6%
ASEAN countries13%
European countries
3.3%
Other Asian countries
2.9%
USA and Canada2.5%
Other countries2.1%
Not stated1.1%
Male Female
100
90
80
70
60
50
40
30
20
10
0
83.9%
16.1%
93.3%
6.7%
97.8%
67%78.1%
63.5%71.3% 76%
2.2%
33%21.9%
36.5%28.7% 24%
Figure 43: Destination of International Migrants (by gender)
Source: National Census 2011.
India Middle East
ASEANcountries
Europe OtherAsian
countries
USA andCanada
Othercountries
NotStated

State of Migration in nepal 41
Figure 45: Education Level of International Migrants (NLSS)
Source: Calculations based on NLSS 2010/11 datasets.
Primary Education29.9%
Some Secondary Education33.1%
SLC and above23.7%
Don’t know3.7%
Illiterate9.6%
100
90
80
70
60
50
40
30
20
10
0
97.8%
2.2%
86.8%
13.2%
84.8%
15.2%
96.2%
3.8%
98.0%
2.0%
69.1%
30.9%
All countries India Malaysia Other countriesMiddle East(UAE, Saudi Arabia
and Qatar)
Figure 44: Gender Distribution of International Migrants (by destination)
Source: Calculations based on NLSS 2010/11 datasets.Male Female
5.8 Education Level of International Migrants
While most migrants going abroad have received some level of education, only a quarter have been educated beyond the secondary level, as both NLSS 2010/11 and Census 2011 have shown (Figures 45 and 46).59

42 State of Migration in nepal
Figure 46: Education Level of International Migrants (National Census)
Source: National Census 2011.
Beginner1.4%
Primary (Class 1-5)21.6%
Lower Secondary (Class 6-8)19.8%
Secondary (Class 9-10) 13%
SLC 12.2%
Intermediate 7.2%
Graduate3%
Post-Graduate1%
Non-formal 4.3%
Not stated12.5%
Illiterate 4%
5.9 Economic Status of International Migrants
While individuals belonging to the whole range of consumption quintiles are found to have migrated to foreign lands, as with internal migrants, the richer the household, the higher the probability of its having international migrants (see Section 4.8: Economic Status of Internal Migrants). But, there are some notable
Poorest16.1%
Second17.1%
Third20.9%
Fourth21%
Richest25%
Figure 47: Consumption Quintile of Households with International Migrants
Source: Calculations based on NLSS 2010/11 datasets.

State of Migration in nepal 43
Figure 48: Reason for International Migration (NLSS)
Source: Calculations based on NLSS 2010/11 datasets.
Together with family/relatives9.7%
Other family reasons2.6%
Education and training6.1%
Looking for work42.9%
Other work related36.1%
Other2.5%
differences as well. Only 7.5 per cent of the poorest quintile figured among the internal migrants whereas that figure is 16 per cent among international migrants. More significantly, within the top two quintiles there were more migrants moving within the country than going abroad.
5.10 Ethnicity of International Migrants
At the time of publication, the Census 2011 data on the caste and ethnicity of international migrants had not been released by the CBS. Social Inclusion Atlas of Nepal (CDSA 2014) provides that information but since there are some discrepancies between the data presented in that volume and the CBS data, it has not been included in the discussion here. However, because of its significance, the data presented in Social Inclusion Atlas has been presented in Annex 3 of this paper.
5.11 Reasons for Migration
Migration to the Gulf countries and Malaysia has accelerated since the 1990s for a number of reasons, including:

44 State of Migration in nepal
• Nepal’s adoption of liberal policies on foreign employment and foreign travel; • A general sense of insecurity arising out of the Maoist insurgency that lasted
from 1996 to 2006; and• The coincident growth in the economies of destination countries.60
Lack of employment opportunities and critical infrastructure required to support robust economies, particularly in Nepal’s rural areas, continue to be the major drivers of international migration. As a result, an overwhelming majority (79 per cent) go abroad for work (Figure 48). 61
However, as can been seen in Figures 49 and 50, the primary reasons for migration also vary across gender and destination country.62 A very high percentage of men migrate to India and other countries for work, but that is true for only a few female migrants going to India.63 NDHS 2011 (Figure 49) and Census 2011 (Figure 50) both agree that the proportion of females migrating for work is higher in other countries. Marriage and dependence on other migrant family members were the primary reason for women migrating to India whereas of the
Source: Nepal Demographic and Health Survey 2011.
100
90
80
70
60
50
40
30
20
10
0Male MaleFemale Female
India Other countries
OthersFamily reasonsMarriageWork
Figure 49: Reason for International Migration (NDHS) (by gender and destination)
87.5%
4.1%8.0%
94.5%
44.6%
14.8%
30.4%
9.2%1.1%
14.3%
10.3%
66.8%
5.7%2.9%
4.6%
Study

State of Migration in nepal 45
Source: National Census 2011.
100
90
80
70
60
50
40
30
20
10
0
Figure 50: Reason for International Migration (National Census) (by gender and destination)
Male MaleFemale Female
India Countries except India
Not stated
Study
Others
Institutional job
Dependent
Private job
Conflict
Business
75.3%
9.4%
50.3%
49.9%
20.7%
14.7%
75.5%
11.6%
28.9%
6.2%
women who went to other countries, a smaller proportion cited marriage as the main reason. Both sources also show that a higher proportion of women went abroad for studies compared to men.64 It should, however, be noted that this does not mean more women than men are studying abroad; only many more men migrate abroad for work. Census 2011 shows that a total of 76,886 males and 33,678 females abroad for studies with males numbering 21,670 in India and 55,216 in countries other than India and the corresponding figures for female students were 8,612 and 25,066.65

6. lAbour MIgrAtIon
6.1 Trends
The number of Nepalis going abroad for employment has been rising steadily, and, at times, rapidly, over the past couple of decades. Figure 51 shows the number of Nepalis who obtained labour permits from the Department of Foreign Employment (DoFE)66 over the course of the 18 years that records have been maintained for. It is striking that the number of labour permits issued increased by more than a hundred times in that period – from 3605 in 1993/94 to 453,543 in 2012/13.
There have been noticeable surges two times and even a decrease in one year. As indicated by the circles in Figure 51, there was a sharp increase in 1998/99 and 2001/02, which could have resulted from the dearth of employment opportunities and growing insecurity in the country, both by-products of the socio-political unrest that had engulfed Nepal at that time,67 but could have also resulted from a more liberal policy regime, especially after the enactment of the Foreign Employment Act of 200768 as well as international migration
500,000450,000400,000350,000300,000250,000200,000150,000100,000
50,0000
1993
/94
1994
/95
1995
/96
1996
/97
1997
/98
1998
/99
1999
/200
0
2000
/01
2001
/02
2002
/03
2003
/04
2004
/05
2005
/06
2006
/07
2007
/08
2008
/09
2009
/10
2010
/11
2011
/12
2012
/13
3605 2159 32597745
27,796 55,025
104,736
105,043139,718
165,252
294,094
219,965
354,716384,665
453,543
35,543
204,533
249,051
Figure 51: Number of Labour Permits Issued
Source: Department of Foreign Employment.

State of Migration in nepal 47
100
90
80
70
60
50
40
30
20
10
0
Male Female
440,975 (99.7%)
1413 (0.3%)
42,847 (59.5%)
1829 (35.2%)
3367 (64.8%)
29,142 (40.5%)
666 (6.2%)
10,047 (93.8%)
Saudi Arabia Kuwait Israel Lebanon
Figure 52: Gender Breakdown across Destinations, 2006/2007–2012/201373
Note: India is not included here.Source: Department of Foreign Employment.
being increasingly seen as a means to gainful employment. On the other hand, in 2008/09, the number of individuals going abroad for employment actually decreased. This resulted from the global financial downturn of 2008, when Malaysia, the biggest importer of Nepali labourers for some years till then (Figure 61), started giving greater priority to its citizens than to migrant workers, and also tightened its immigration policies to restrict ‘irregular’ and ‘illegal’ migration.69
6.2 Gender of Labour Migrants
As mentioned earlier, the population of female migrant workers is much smaller than that of males. According to the 2011 Census, only 12 per cent of the total international migrants (1,921,494) were women (including those going to India).70 Other sources estimate this figure to be 6 to 7 per cent71

48 State of Migration in nepal
and 16 per cent.72 The DoFE records show fewer than 4 per cent of the labour permits issued to females in the period 2006/07 to 2012/13.74 It should, however, be noted that a significant number of female migrants also use ‘irregular’ channels of migration, i.e., travelling via Indian airports which do not require migrant workers to produce their work permits or on tourist visas to circumvent the periodic government bans imposed on women’s mobility to certain countries, and, hence, are not captured in the figures, and especially in the data maintained by the DoFE.75
Despite restrictions, women have been going abroad for work in some numbers. Lebanon was a major destination for female migrant workers until 2009 when the Nepali government banned women from working there as domestic workers. The ban brought a drastic decrease in the number of labour permits issued to Nepali women going to Lebanon. In the fiscal year 2007/08, 2490 women were issued permits to work in Lebanon; this number reached 3696 in the year 2009/10, but in the year 2010/11, it decreased to 84, rising slightly to 369 in 2012/13.76
As illustrated in Figure 52, in the period under consideration, over 90 per cent of Nepali migrants working in Lebanon were women. Kuwait and Israel are other popular destinations for women migrant workers while Saudi Arabia primarily entertains male migrant workers with females comprising only 0.3 per cent of all Nepali migrants going to Saudi Arabia between 1993/94 and 2012/13.77 Part of this seeming variance in the choice of destinations by women and men could be a reflection of the fact that a sizeable proportion of females who do migrate to Gulf countries like Saudi Arabia are not included in the DoFE data because they use irregular/’illegal’ channels to go to these countries.78
6.3 Age of Labour Migrants
The average age of a labour migrant working abroad is 30 years.79 But there are differences between destination countries. The age of labour migrants going to countries like India, Malaysia and the Gulf states is much lower than that of those going to other countries.

STATE OF MIGRATION IN NEPAL 49
32
31
30
29
28
27 All India Gulf Malaysia Others
29.829.9
29.4
28.9
31.7
Figure 53: Average Age of Labour Migrants (by destination)
Source: Nepal Migration Survey 2009.
Figure 54: Education Level of Labour Migrants
Not Attended School 13%
Primary School21.4%
Secondary School 53.4%
Higher Secondary School 7.9%
Bachelor’s and above4.4%
Source: Nepal Migration Survey 2009.
6.4 Education Level of Labour Migrants
As Figure 54 shows, most labour migrants have obtained some level of education, with those without any formal schooling consisting just 13 per cent of the total.80

50 STATE OF MIGRATION IN NEPAL
The better-educated and -skilled workers tend to opt for employment in industrialised countries in the West, while those seeking employment in India, Malaysia and the Gulf are generally less educated. More than a third of the migrants to other countries have received at least a bachelor’s degree compared to less than 2 per cent of migrants to countries such as India, Malaysia and the Gulf region.81
6.5 Marital Status of Labour MigrantsIn terms of marital status a definite majority of labour migrants were married, a trend similar to the other categories discussed earlier, namely, ‘absentees’, ‘internal migrants’, and ‘international migrants’.82
Not attended school
Primary School(1-5)
Secondary School(6-10)
HigherSecondary
(11-12)
Bachelor’s and higher
AllIndiaGulf countriesMalaysiaOthers
80
70
60
50
40
30
20
10
0
Figure 55: Education Level of Labour Migrants (by destination)
Source: Nepal Migration Survey 2009.
Source: Nepal Migration Survey 2009.
Figure 56: Marital Status of Labour Migrants
Never Married34.3%
Married65.7%

State of Migration in nepal 51
Figure 57: Origin of Labour Migrants (by ecological region)
Source: Nepal Migration Survey 2009.
Mid-Western11.2%
Western27.6%
Eastern28.3%
Figure 58: Origin of Labour Migrants (by development region)
Source: Nepal Migration Survey 2009.
Far-Western10.5%
Central22.3%
6.6 Origin of Labour Migrants
As discussed under the sections ‘Absentee Population’ and ‘International Migration’, the majority of migrants who opt for foreign employment also originate in the Tarai and the Hills, while only a small proportion migrate from the Mountain region.
Mountain4.3%
Hill45.1%
Tarai50.6%

52 State of Migration in nepal
In terms of regional distribution, the Eastern, Central and Western regions contribute more than three quarters of international labour migrants.83
Nearly all migrants from the Far-Western region (93 per cent) are India-bound and a very high proportion of migrants (71 per cent) from the Mid-Western region also go to India.84 On the other hand, migrants from the Eastern, Central and Western regions constitute the largest proportion of the Nepali workforce in Malaysia and the Gulf, at 71, 57 and 49 per cent respectively.85 The destination countries will be discussed at greater length in subsequent sections.
6.7 Destination of Labour Migrants
Information on the destination of migrant workers is available from the Department of Foreign Employment since, by law, individuals are required to obtain government approval (in the form of labour permits) before going abroad.86 However, the absence of systematic records of labour migrants, particularly, data on migrant returnees or those who re-migrate (with another labour permit)87 makes the data misleading. Also missing from the data is that population of workers who may have migrated through informal/illegal channels.
Num
ber
of L
abou
r Pe
rmits
1,000,000
900,000
800,000
700,000
600,000
500,000
400,000
300,000
200,000
100,000
0
932,152
793,881
589,891
371,908
81,49237,294 21,056 20,147 10,713
60,708
Malaysia Qatar Saudi Arabia
UAE Kuwait Bahrain Oman South Korea
Lebanon Others
Figure 59: Labour Permits Issued, 1993/94–2012/13
Source: Department of Foreign Employment.
Note: In the case of South Korea and Lebanon, the figures are only for the period 2006/07 to 2012/13.

State of Migration in nepal 53
Malaysia31.9%
Qatar27.2%
Saudi Arabia20.2%
UAE12.7%
Kuwait2.8%
Others5.1%
Figure 60: Labour Permits, 1993/94–2012/13 (by destination)
Source: Department of Foreign Employment.
Nonetheless, the annual data from the Department of Foreign Employment does provide some indication of the number of Nepali migrant workers in different countries around the world. Since the provision for obtaining labour permits does not apply to those going to India, little is known about the number of Nepalis working there.88
Figure 61 presents the number of labour permits issued for the four most popular destinations from 1993/94 to 2012/13. Malaysia is the most popular labour migrant destination followed by the six Gulf states. Migration to South Korea began more recently and only a few thousand have gone there so far.
Although the Government of Nepal has identified 108 international destinations for foreign employment,89 data on labour permits issued between 1993/94 and 2012/13 reveals that more than 90 per cent of Nepali migrant workers went to just four countries: Malaysia (32 per cent), Qatar (27 per cent), Saudi Arabia (20 per cent) and the United Arab Emirates (13 per cent) (Figure 58).90
As shown in Figure 61, Saudi Arabia was the top international migrant
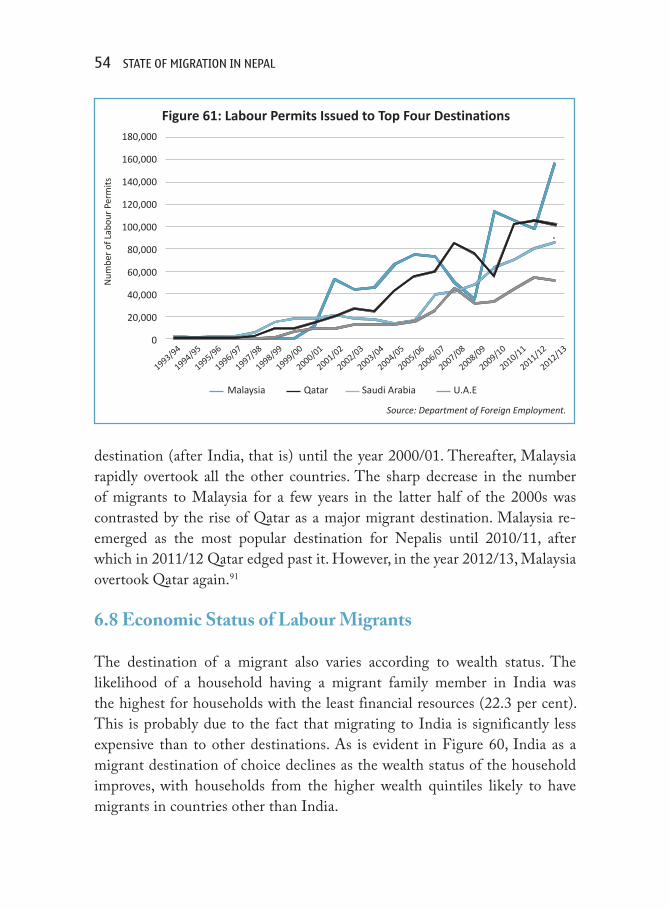
54 State of Migration in nepal
Source: Department of Foreign Employment.
2010/11
2011/12
2012/13
Figure 61: Labour Permits Issued to Top Four DestinationsN
umbe
r of
Lab
our
Perm
its
180,000
160,000
140,000
120,000
100,000
80,000
60,000
40,000
20,000
0
1993/94
1994/95
1995/96
1996/97
1997/98
1998/99
1999/00
2000/01
2001/02
2002/03
2005/06
2003/04
2006/07
2008/09
2004/05
2007/08
2009/10
Malaysia Qatar Saudi Arabia U.A.E
destination (after India, that is) until the year 2000/01. Thereafter, Malaysia rapidly overtook all the other countries. The sharp decrease in the number of migrants to Malaysia for a few years in the latter half of the 2000s was contrasted by the rise of Qatar as a major migrant destination. Malaysia re-emerged as the most popular destination for Nepalis until 2010/11, after which in 2011/12 Qatar edged past it. However, in the year 2012/13, Malaysia overtook Qatar again.91
6.8 Economic Status of Labour Migrants
The destination of a migrant also varies according to wealth status. The likelihood of a household having a migrant family member in India was the highest for households with the least financial resources (22.3 per cent). This is probably due to the fact that migrating to India is significantly less expensive than to other destinations. As is evident in Figure 60, India as a migrant destination of choice declines as the wealth status of the household improves, with households from the higher wealth quintiles likely to have migrants in countries other than India.
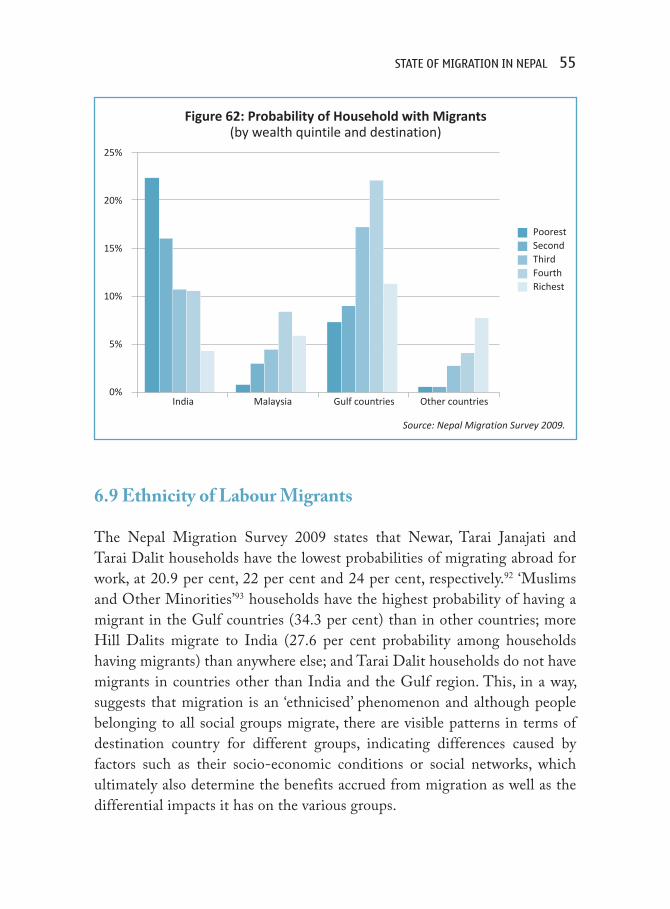
State of Migration in nepal 55
Figure 62: Probability of Household with Migrants (by wealth quintile and destination)
25%
20%
15%
10%
5%
0%Other countriesGulf countriesMalaysiaIndia
PoorestSecondThirdFourthRichest
Source: Nepal Migration Survey 2009.
6.9 Ethnicity of Labour Migrants
The Nepal Migration Survey 2009 states that Newar, Tarai Janajati and Tarai Dalit households have the lowest probabilities of migrating abroad for work, at 20.9 per cent, 22 per cent and 24 per cent, respectively.92 ‘Muslims and Other Minorities’93 households have the highest probability of having a migrant in the Gulf countries (34.3 per cent) than in other countries; more Hill Dalits migrate to India (27.6 per cent probability among households having migrants) than anywhere else; and Tarai Dalit households do not have migrants in countries other than India and the Gulf region. This, in a way, suggests that migration is an ‘ethnicised’ phenomenon and although people belonging to all social groups migrate, there are visible patterns in terms of destination country for different groups, indicating differences caused by factors such as their socio-economic conditions or social networks, which ultimately also determine the benefits accrued from migration as well as the differential impacts it has on the various groups.
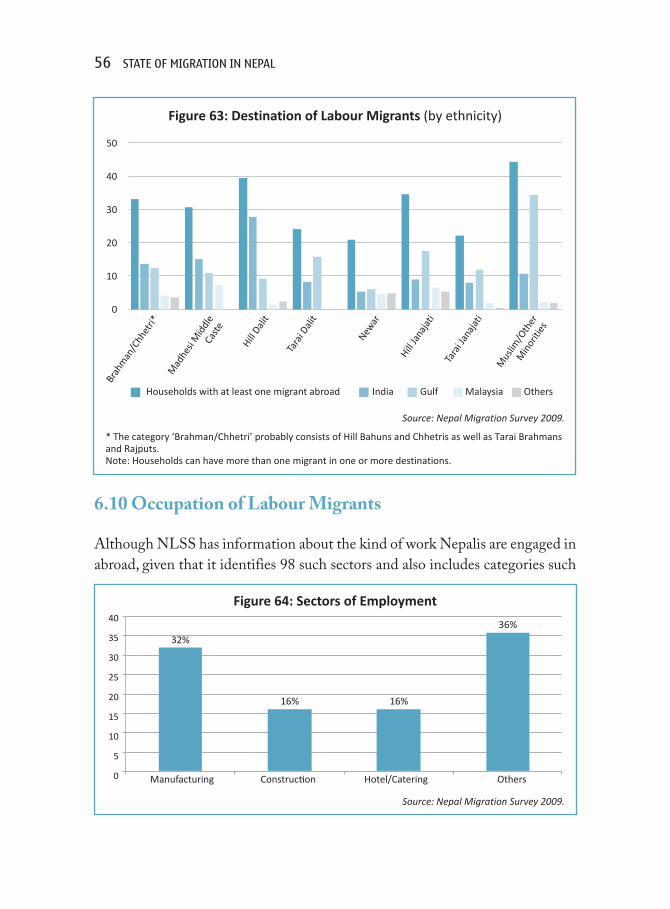
56 State of Migration in nepal
Households with at least one migrant abroad India Gulf Malaysia Others
50
40
30
20
10
0
Brah
man
/Chh
etri*
Mad
hesi
Mid
dle
Caste
Hill Dali
t
Tara
i Dali
t
Newar
Hill Ja
naja
ti
Tara
i Jan
ajat
i
Mus
lim/O
ther
Min
oriti
es
Figure 63: Destination of Labour Migrants (by ethnicity)
Source: Nepal Migration Survey 2009.
* The category ‘Brahman/Chhetri’ probably consists of Hill Bahuns and Chhetris as well as Tarai Brahmans and Rajputs.Note: Households can have more than one migrant in one or more destinations.
40
35
30
25
20
15
10
5
0
36%
16%16%
32%
Manufacturing Construction Hotel/Catering Others
Figure 64: Sectors of Employment
Source: Nepal Migration Survey 2009.
6.10 Occupation of Labour Migrants
Although NLSS has information about the kind of work Nepalis are engaged in abroad, given that it identifies 98 such sectors and also includes categories such

State of Migration in nepal 57
Figure 65: Sectors of Employment (female labour migrants)
Source: Nepal Migration Survey 2009.
Female Migrants in India Female Migrants in Other Countries
Education21%
Manufacturing17%
Trade 11%
Others36%
Manufacturing13%
Health and Medical Service
12%
Hotel Catering (including domestic work)
19%
Others 56%
Hotel Catering (including domestic work)
15%
as students (8 per cent) and a large proportion (21 per cent) reporting ‘Don’t Know’, analysis of the data is not altogether helpful in understanding what work Nepali labour migrants do in destination countries.
The Nepal Migration Survey 2009, on the other hand, clearly spells out the major occupations of Nepali in foreign countries. The data shows that most Nepalis seek employment in one of three main sectors: manufacturing (32 per cent), construction (16 per cent), and hotel/catering (16 per cent). Although the survey does not mention which other areas the remaining 36 per cent are engaged in, it does provide additional information on the major work destinations. For migrants in India, manufacturing (24 per cent) and hotel/catering (21 per cent) are the top two employment sectors, followed by the agricultural sector in which 12 per cent of them work.94 In the Gulf countries, manufacturing attracts most workers (35 per cent) followed by the construction sector (21 per cent). In Malaysia, 62 per cent of the migrants go into manufacturing.95
The sector-specific analysis of employment for female labour migrants going to India and the rest of the world in the Nepal Migration Survey 2009 suggests a wide array of employment areas they are engaged in (Figure 65). A substantial

58 State of Migration in nepal
proportion of women are found working in ‘education’ in India. Manufacturing, domestic work, hotel and catering are the other key sectors that attract Nepali women migrants in all parts of the world.96
Data from the Department of Foreign Employment (DoFE) suggests that a very high percentage of unskilled migrants go abroad for work compared to a negligible proportion of professionals (Figure 66).97 Similarly, it also suggests that the proportion of skilled female migrants is higher than that of skilled males (even though female migrants are far fewer in numbers).
Figure 66: Skill Levels of Labour Migrants100
90
80
70
60
50
40
30
20
10
0
Source: Department of Foreign Employment.
Male Male Male MaleFemale Female Female Female
2009 2010 2011 2012
17.0%
7.5%
75.4%
46.0% 5.5%
81.9%
12.5%24.3%
17.6%32.3%
14.6% 15.6%
8.5% 3.2%
81.0%
7.4%3.8%
71.9%74.9%
64.1%
76.9%3.4%
52.0%
2.0%
Professional Semi-Skilled UnskilledSkilled
Most of the international migrants are found to change their profession upon their return with the most significant difference seen in agriculture (Figure 67). Almost 90 per cent of the individuals previously engaged in agriculture do not return to that profession after a stint abroad. The sector most popular among returnees is manufacturing, mining and utilities.
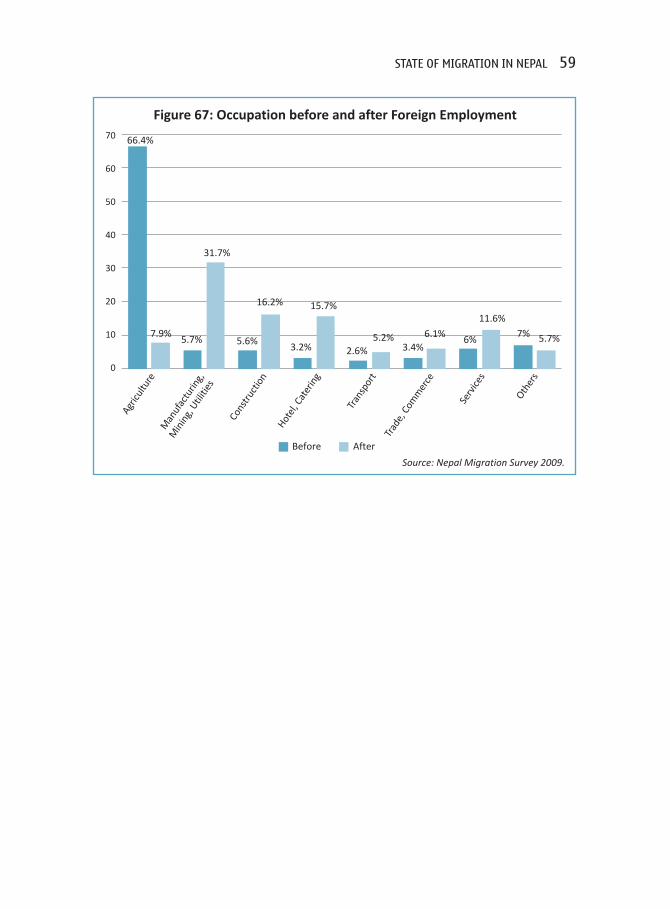
State of Migration in nepal 59
Figure 67: Occupation before and after Foreign Employment
Source: Nepal Migration Survey 2009.
70
60
50
40
30
20
10
0
66.4%
Agricu
lture
Man
ufac
turin
g,
Min
ing,
Util
ities
Cons
truct
ion
Hotel
, Cat
erin
g
Tran
spor
tTr
ade,
Com
mer
ce
Serv
ices
Other
s
Before After
3.4%5.2%
2.6%
15.7%
3.2%
16.2%
5.6%
31.7%
5.7%7.9% 5.7%7%
11.6%
6%6.1%

7. IMMIgrAtIon98
7.1 Trends
Immigration in Nepal, as tracked by decennial censuses from 1961 to 2011, has been more or less steady except for fluctuations between 1971 and 1991. Immigration shot up nearly three and a half times from 1971 to 1981, peaking at 483,019 in 1981. However, it plummeted by more than five times in 1981-1991, reaching a level in 1991 less than that of 1961. A steady growth of immigration was witnessed from 1991 to 2011, but the number of immigrants recorded in 2011 was only slightly more than in 1961.99 Except for the year 1981, it could be seen that most of the immigrants are Indian citizens.
600,000
500,000
400,000
300,000
200,000
100,000
076,311
1961 1971 1981 1991 2001 2011
128,829 116,75568,489 102,468 120,891
Other Citizens Indian Citizens
Figure 68: Immigration Trend over the Years
33,750
7648
364,264
21,93814,103
18,019
Source: Kansakar 1984, 2003; National Census 2011.
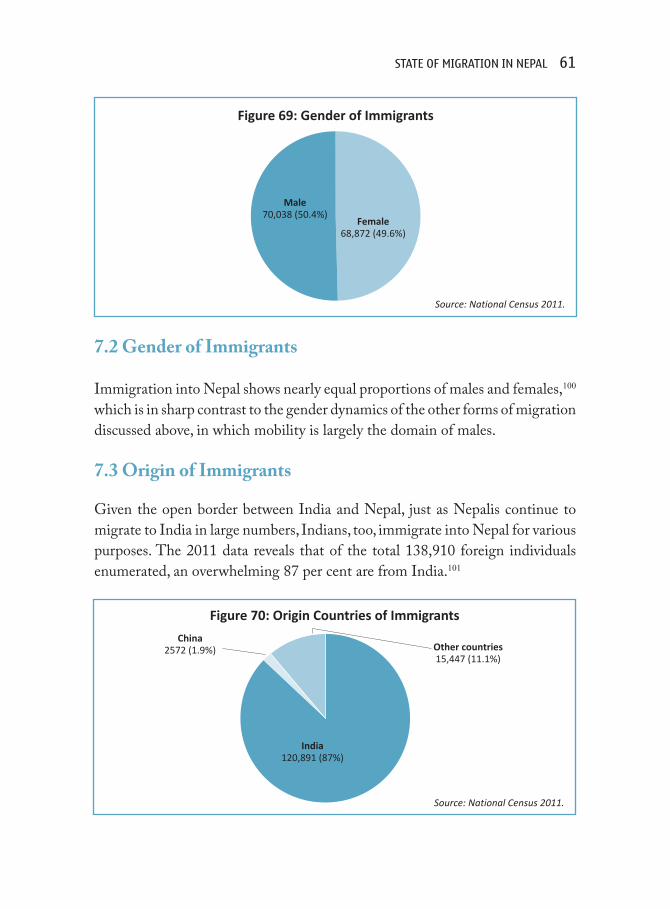
State of Migration in nepal 61
Figure 69: Gender of Immigrants
Source: National Census 2011.
Male70,038 (50.4%)
Female68,872 (49.6%)
Figure 70: Origin Countries of Immigrants
Source: National Census 2011.
India120,891 (87%)
China2572 (1.9%) Other countries
15,447 (11.1%)
7.2 Gender of Immigrants
Immigration into Nepal shows nearly equal proportions of males and females,100 which is in sharp contrast to the gender dynamics of the other forms of migration discussed above, in which mobility is largely the domain of males.
7.3 Origin of Immigrants
Given the open border between India and Nepal, just as Nepalis continue to migrate to India in large numbers, Indians, too, immigrate into Nepal for various purposes. The 2011 data reveals that of the total 138,910 foreign individuals enumerated, an overwhelming 87 per cent are from India.101

62 State of Migration in nepal
Figure 71: Destination of Immigrants (by location)
Urban73,736 (53.1%)
Rural65,174 (46.9%)
Source: National Census 2011.
7.4 Destination of Immigrants
The national census shows that while more immigrants prefer urban destinations over rural ones, their percentage is only 6 per cent higher (Figure 71). In terms of gender distribution, however, there is great variation. There are more male
49.3%
80,000
40,000
0
Num
ber
of m
igra
nts
1%
Total urban
India 68,427 43,944 24,483 52,464 19,815 32,649
China 1,412 736 676 1,160 489 671
Other countries 3,897 1661 2,236 11,550 3,393 8,157
Male Male FemaleFemale Total urban
Figure 72: Destination of Immigrants (by country of origin and location)
Source: National Census 2011.
2.4%0.4%
14.3%
8.3%
0.8%
37.8%
1.6%0.5%
17.6%
1.2%
23.5%
0.5%
31.6%
2.8%5.9%
0.5%
Other countriesChinaIndia

State of Migration in nepal 63
immigrants in Nepal’s urban areas, reflective of the fact that male immigrants are attracted to employment opportunities in urban areas. On the other hand, female immigrants outnumber males immigrants in Nepal’s rural areas, and, as previously mentioned, most of these females would have immigrated to Nepal following marriage.102
The regional distribution of immigrants in terms of ecological region (Figure 74) shows that the Tarai region is the most preferred destination among immigrants, with 56 per cent choosing the Tarai as a destination, followed by 42 per cent going to the Hills and only about one per cent to the Mountains.103 The proportion of female in-migrants is higher than male in-migrants in the Tarai, primarily due to the high prevalence of cross-border marriages in the region.
Figure 73: Destination of Immigrants (by country of origin and ecological zone)
Male Male MaleFemale Female Female
Mountain Hill Tarai
3963
1946
1706
361
69
682
35,101
914
21,674
15,346
1057
4064
28,353
117
2717
41,425
224
5647
India
China
Other countries
0.3% 0.3%0.1% 0%0.1% 0.5%
25.2%
0.7%1.6%
11.0%
0.8%3.0%
20.4%
0.1%2.0%
29.8%
0.2%
4.1%
Num
ber
of m
igra
nts
45,000
35,000
25,000
15,000
5000
Source: National Census 2011.Other countriesChinaIndia

64 State of Migration in nepal
Figure 74: Destination of Immigrants (by ecological region)
Source: National Census 2011.
Mountain1.3%
Hill42.2%
Tarai56.5%
8. reMIttAnCes
In a context where foreign labour migration and international remittances have been the focus of attention, an attempt has been made in this section to not just understand the inflow of remittance into Nepal from external sources, but also the circulation of domestic remittances in the country through an analysis of the NLSS 2010/11 datasets.
8.1 External Remittances over the Years
In 2012, Nepal ranked third globally for the remittances it received from abroad as a percentage of its gross domestic product (GDP). Accounting for 24.7 per cent equivalent of Nepal’s GDP, remittance earnings were estimated at more than USD 5.2 billion, and this figure is expected to rise as labour migration to the Gulf countries and elsewhere continues to increase.104
External remittance earnings not only constitute the country’s biggest source of foreign exchange but also account for a substantial share of Nepal’s per capita income, plays an important role in boosting Nepal’s economic growth, and in aiding poverty alleviation efforts as well.105 It is estimated that ‘a 10 percent increase in official per-capita remittance leads to a 3.5 percent decline in the proportion of people living in poverty’.106 The first evidence of that came with NLSS 2003/04, which showed that the increase in remittances between 1995/96 and 2003/04 contributed anywhere between a third to a half in reducing overall poverty headcount rate in that period.107 Further, NLSS 2010/11 also attributes the reduction in poverty from 42 per cent to 25 per cent between 1995/96 and 2010/11 largely to the remittance-led economic growth.108
Figure 75 shows the volume of remittances received from workers outside Nepal from 1990/91 to 2011/12, an increase by more than 150 times in that period.109 However, because the figures are based on Nepal Rastra Bank’s data, they represent remittances received formally though financial institutions only. Most remittances, especially from India, come via informal means like hundi110 or are brought back by individuals and as such fall below the radar of Nepal
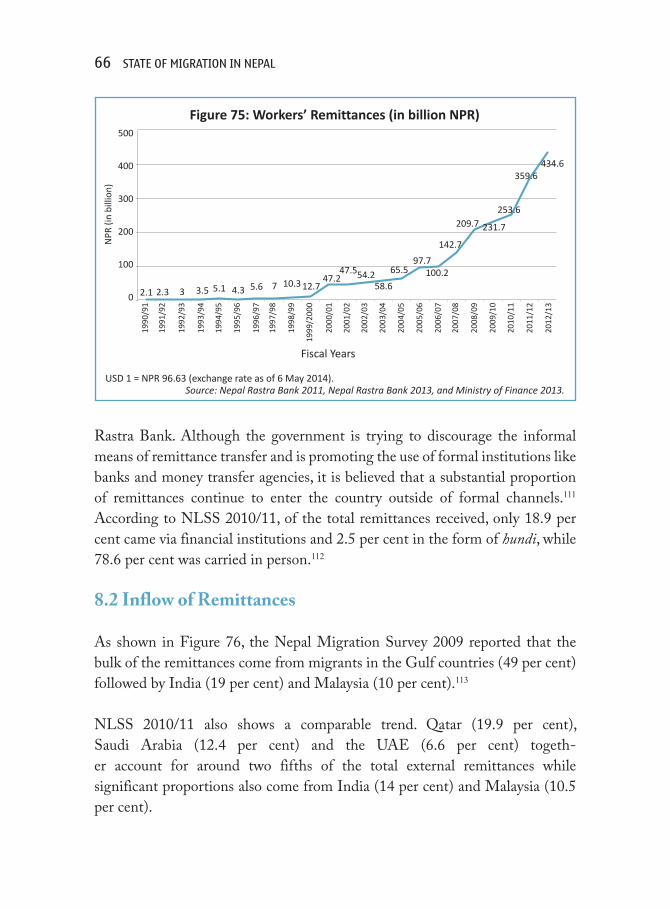
66 State of Migration in nepal
Figure 75: Workers’ Remittances (in billion NPR)
Fiscal Years
NPR
(in
billi
on)
500
400
300
200
100
0
1990
/91
1991
/92
1992
/93
1993
/94
1994
/95
1995
/96
1996
/97
1997
/98
1998
/99
2000
/01
1999
/200
0
2001
/02
2002
/03
2003
/04
2004
/05
2005
/06
2006
/07
2007
/08
2008
/09
2009
/10
2010
/11
2011
/12
2012
/13
2.1 2.3 3 3.5 5.1 4.3 5.6 7 12.747.2
47.554.2 65.5 100.297.7
209.7
142.7
231.7
253.6
359.6434.6
USD 1 = NPR 96.63 (exchange rate as of 6 May 2014).Source: Nepal Rastra Bank 2011, Nepal Rastra Bank 2013, and Ministry of Finance 2013.
10.3 58.6
Rastra Bank. Although the government is trying to discourage the informal means of remittance transfer and is promoting the use of formal institutions like banks and money transfer agencies, it is believed that a substantial proportion of remittances continue to enter the country outside of formal channels.111 According to NLSS 2010/11, of the total remittances received, only 18.9 per cent came via financial institutions and 2.5 per cent in the form of hundi, while 78.6 per cent was carried in person.112
8.2 Inflow of Remittances
As shown in Figure 76, the Nepal Migration Survey 2009 reported that the bulk of the remittances come from migrants in the Gulf countries (49 per cent) followed by India (19 per cent) and Malaysia (10 per cent).113
NLSS 2010/11 also shows a comparable trend. Qatar (19.9 per cent), Saudi Arabia (12.4 per cent) and the UAE (6.6 per cent) togeth-er account for around two fifths of the total external remittances while significant proportions also come from India (14 per cent) and Malaysia (10.5 per cent).

State of Migration in nepal 67
Figure 76: Share of Remittances Received (NMS) (from destination)
Source: Nepal Migration Survey 2009.
Figure 77: Share of Remittances Received (NLSS) (from destination)
Source: Calculations based on NLSS 2010/11 datasets.
Qatar19.9%
India14%
Saudi Arabia 12.4%
Malaysia 10.5%
UAE 6.6%
USA 4.2%
UK 3.7%
Other countries 28.7%
The average remittances received from India is much lower compared to other countries. For instance, the average remittance received from Qatar, Nepal’s largest source of external remittances, is nearly four times larger than that from India, the destination believed to host the largest number of Nepalis.
India19.2%
Gulf countries48.9%
Malaysia10.5%
Other countries 21.4%

68 State of Migration in nepal
Qatar India SaudiArabia
Malaysia UAE USA UK Allcountries
115.8
29.5
108.693.5
133.1
254.1
164.8
101.4
300
250
200
150
100
50
0
NPR
‘000
Figure 78: Average Remittance Received (in NPR ’000) (from destination)
Source: Calculations based on NLSS 2010/11 datasets.
8.3 Distribution of Remittances
The Eastern Tarai (20.6 per cent) and Western Hills (18.6 per cent) receive the highest shares of the external remittances even though the impact of remittance earnings is felt across the country, albeit in varying degrees.114 Apart from the exception of the Eastern Mountains, the Mountain region as a whole receives very little of the national remittance inflow.
Table 4: Receipt of Remittances (by development and ecological region)
Mountain Hill Tarai Total1 Eastern Region 5.9% 6.1% 20.6% 32.5%2 Central Region 1.3% 8.6% 16.7% 26.6%3 Western Region115 - 18.6% 10.4% 29%4 Mid-western Region 0.3% 1.4% 6.5% 8.2%5 Far-western Region 0.4% 1.8% 1.6% 3.7%
Total 7.9% 36.4% 55.7% 100%Source: Nepal Migration Survey 2009.
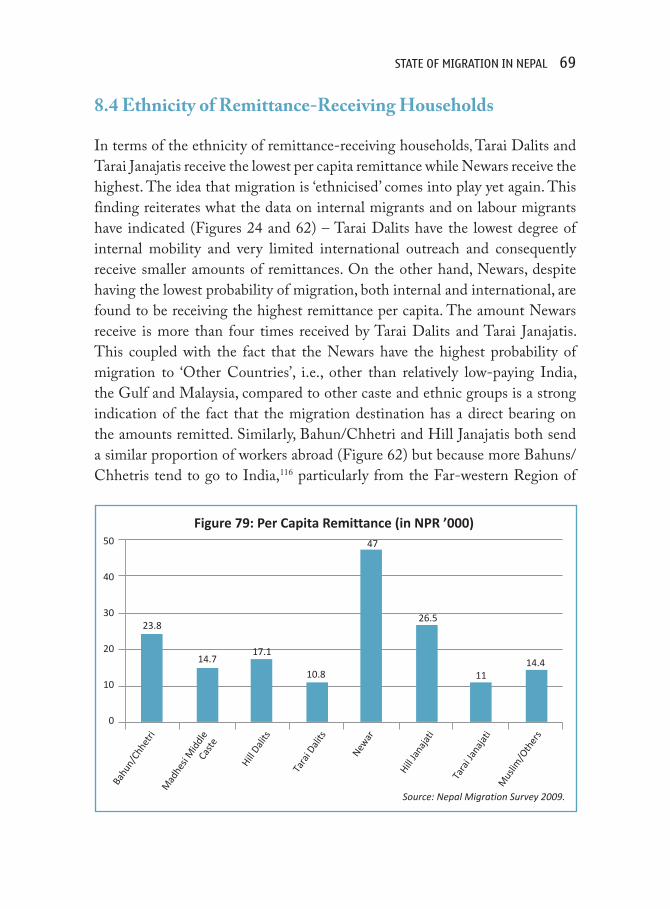
State of Migration in nepal 69
8.4 Ethnicity of Remittance-Receiving Households
In terms of the ethnicity of remittance-receiving households, Tarai Dalits and Tarai Janajatis receive the lowest per capita remittance while Newars receive the highest. The idea that migration is ‘ethnicised’ comes into play yet again. This finding reiterates what the data on internal migrants and on labour migrants have indicated (Figures 24 and 62) – Tarai Dalits have the lowest degree of internal mobility and very limited international outreach and consequently receive smaller amounts of remittances. On the other hand, Newars, despite having the lowest probability of migration, both internal and international, are found to be receiving the highest remittance per capita. The amount Newars receive is more than four times received by Tarai Dalits and Tarai Janajatis. This coupled with the fact that the Newars have the highest probability of migration to ‘Other Countries’, i.e., other than relatively low-paying India, the Gulf and Malaysia, compared to other caste and ethnic groups is a strong indication of the fact that the migration destination has a direct bearing on the amounts remitted. Similarly, Bahun/Chhetri and Hill Janajatis both send a similar proportion of workers abroad (Figure 62) but because more Bahuns/Chhetris tend to go to India,116 particularly from the Far-western Region of
50
40
30
20
10
0
Figure 79: Per Capita Remittance (in NPR ’000)
Source: Nepal Migration Survey 2009.
Bahu
n/Ch
hetri
Mad
hesi
Mid
dle
Cast
e
Hill Dali
ts
Tara
i Dali
ts
Newar
Hill Ja
naja
ti
Tara
i Jan
ajat
iM
uslim
/Oth
ers
23.8
14.411
26.5
47
10.8
17.114.7

70 State of Migration in nepal
the country,117 while more of the Janajatis go to the Gulf, the latter as a group fare slightly better in terms of per capita earnings from remittances.
8.5 Remittances: External and Internal
According to NLSS 2010/ 2011, of the total remittance amount received by Nepali households 20 per cent comes from the internal sources.
8.6 Age of Individuals Sending Remittances
More than 70 per cent of both internal and international remittance earnings is sent by individuals in the 15-44 age group, which is consistent with the higher mobility of this cohort. A further breakdown shows that the rate of remittance is slightly higher for the 30-44 group even though individuals aged 15-29 make up nearly half of all absentees (Figure 3). The age group 30-44 comprise only about a quarter of the total absentee population but contribute 38 per cent of the remit-tances. A reason for this could be that quite a few of the absentees aged 15-29 are students and therefore unable to remit money home. Likewise, as far as work experience goes, those in this age group tend to be less experienced compared to those in the 30-44 category, which, in turn, could mean smaller earnings.
Figure 80: Share of Total Remittance Amount
Source: Nepal Living Standards Survey 2010/11.
Internal19.6%
External80.4%
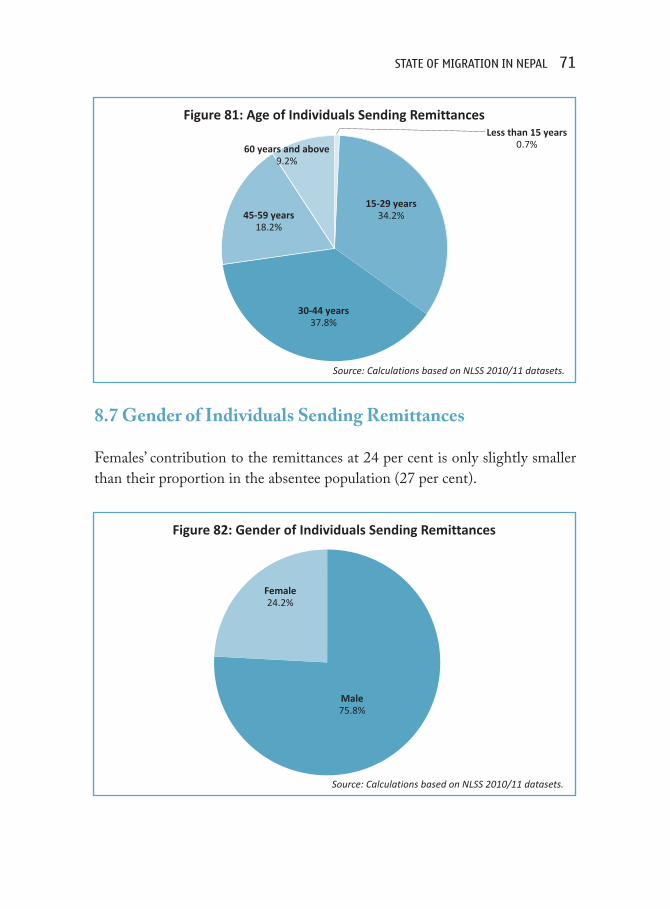
State of Migration in nepal 71
Figure 81: Age of Individuals Sending Remittances
Source: Calculations based on NLSS 2010/11 datasets.
Less than 15 years0.7%
15-29 years34.2%
30-44 years37.8%
45-59 years18.2%
60 years and above9.2%
Figure 82: Gender of Individuals Sending Remittances
Source: Calculations based on NLSS 2010/11 datasets.
Male75.8%
Female24.2%
8.7 Gender of Individuals Sending Remittances
Females’ contribution to the remittances at 24 per cent is only slightly smaller than their proportion in the absentee population (27 per cent).
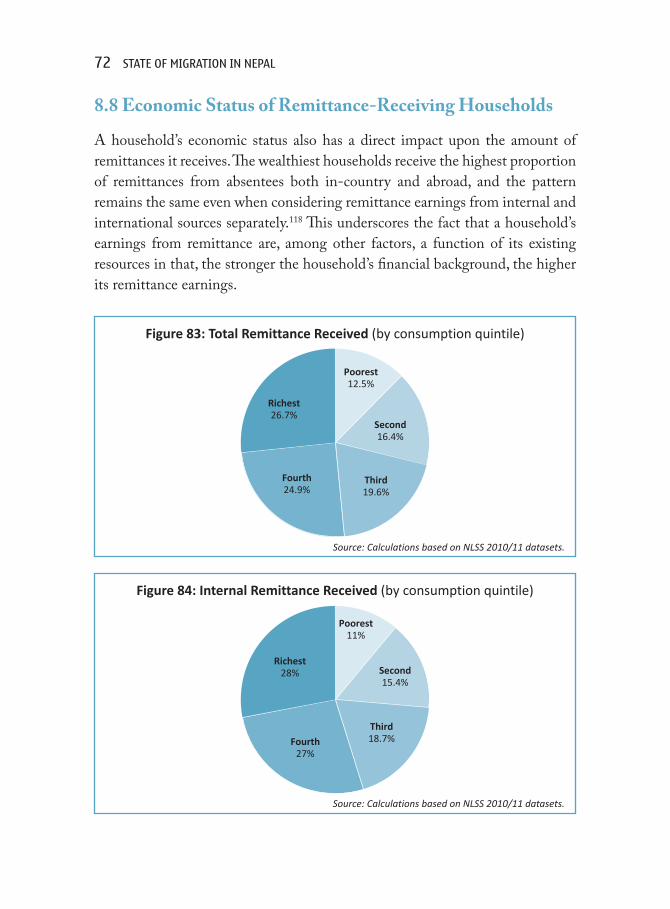
72 State of Migration in nepal
Figure 84: Internal Remittance Received (by consumption quintile)
Source: Calculations based on NLSS 2010/11 datasets.
Poorest11%
Second15.4%
Third18.7%Fourth
27%
Richest28%
Figure 83: Total Remittance Received (by consumption quintile)
Source: Calculations based on NLSS 2010/11 datasets.
Poorest12.5%
Second16.4%
Third19.6%
Fourth24.9%
Richest26.7%
8.8 Economic Status of Remittance-Receiving Households
A household’s economic status also has a direct impact upon the amount of remittances it receives. The wealthiest households receive the highest proportion of remittances from absentees both in-country and abroad, and the pattern remains the same even when considering remittance earnings from internal and international sources separately.118 This underscores the fact that a household’s earnings from remittance are, among other factors, a function of its existing resources in that, the stronger the household’s financial background, the higher its remittance earnings.

State of Migration in nepal 73
Figure 86: Use of Remittances
Source: Nepal Living Standards Survey 2010/11.
Daily consumption78.9%
Repay loans7.1%
Household property4.5%
Education3.5%
Capital formation2.4%
Others3.6%
8.9 Use of Remittances
According to NLSS 2003/04 and 2010/11, at the household level remittances have raised living standards by boosting consumption, and to some extent enabling repayment of loans and helping acquisition of property. Figure 86 illustrates the breakdown of a household’s use of remittance earnings. Almost 80 per cent is spent in meeting daily consumption119 needs.120 Repayment of
Figure 85: External Remittance Received (by consumption quintile)
Source: Calculations based on NLSS 2010/11 datasets.
Poorest14.5%
Second17.8%
Third20.9%
Fourth22%
Richest24.9%

74 State of Migration in nepal
loans (7 per cent) appears to be the next common item of expenditure from remittance earnings after consumption needs have been met. It is reasonable to believe that some, if not all, of these loans were taken for the purpose of going for foreign employment. Recruitment agencies are often found charging huge fees to arrange international jobs while migrants also incur other costs associated with migrating abroad such as transportation costs from various parts of the country to Kathmandu and the cost of living in Kathmandu before departure. Capital formation, which may refer to the acquisition of fixed assets, accounts for the smallest proportion of the listed expenditures.121
9. ConClusIon
Nepali migration to international destinations has grown substantially over the years. Almost half the households in Nepal have at least one migrant abroad or a returnee. Most of the out-bound migration from Nepal is for foreign employment. The number of labour permits issued by the Department of Foreign Employment rose more 150 times between 1993 and 2013.
India still remains the top destination for foreign employment, followed by the Gulf countries (Qatar, Saudi Arabia, the UAE, Kuwait, Bahrain and Oman), Malaysia, South Korea, and, finally, the developed countries of the West. In terms of gender, while the aforementioned countries are more favoured by men, more women than men are found going to destinations like Israel and Lebanon.
There is a lack of consensus in the surveys considered in this paper regarding the origins of the internal migrant population. But, there is congruity in the data pertaining to the origin of international migrants in relation to destinations, with migrants from the Hill districts of the Far-Western and Mid-Western regions more likely to migrate to India while those from the Western and Eastern regions, both Hill and Tarai, show a higher tendency to migrate to Malaysia and the Gulf countries.
Likewise, migration destinations were found to vary with level of affluence, with the likelihood of having a member working abroad the highest for households that belong to the richer quintiles. Poorer households were likely to have migrant family members in India while the relatively better-off migrants head out to the Gulf countries. In terms of proportion, the majority of the individuals going to the developed countries are from the richest quintile. A similar relationship exists between migrants’ education levels and their destination. Well-educated migrants either migrate to urban centres, largely located in the country’s Central Region or to developed countries in pursuit of high-skill jobs. Migrants with little education and few vocational skills tend to migrate mostly to India and also to the Gulf region, where they seek employment in sectors that are labour-intensive.
76 State of Migration in nepal
Despite the increase in the number of Nepalis going abroad for various reasons, including employment, internal migration continues to account for most of the migration in Nepal. Migration between rural areas within Nepal is the predominant feature of internal migration while the rural-to-urban migration has also been growing considerably, leading to a steep increase of the urban population over the years.122
Unlike for women, employment is the primary driver of migration among male migrants, both within Nepal and those going abroad for foreign employment. Most women going to international destinations, mainly India, do so for reasons of marriage. However, more and more women are now on the move for work-related reasons spanning a number of destinations across the globe. The Gulf and other developed countries attract this type of migration.
In terms of ethnicity of migrants, Hill Dalits have a high likelihood of migrating to India, whereas most Muslims have a propensity to migrate to the Gulf countries. Tarai Dalits and Newars are found to be much less mobile internationally compared to all other groups. Newars have the lowest tendency to migrate to any internal or international destination, yet they receive the highest amount of remittances per capita.
The Gulf countries have become the biggest source of remittances with the Nepali migrant worker base in these countries increasing more than ever. These countries account for nearly half of Nepal’s total remittance earnings. However, even though the volume of total remittance earnings has increased dramatically over the years, the data shows that remittances are used mostly for sustenance, i.e., to meet daily needs and repay loans.
Most of the migrants – internal or international – were engaged in agriculture prior to migration, but the overwhelming majority do not return to farming once they have migrated. Internal migrant returnees favour service sector jobs the most after migration, whereas international returnees prefer manufacturing and utilities; construction; and the hospitality sector.
State of Migration in nepal 77
Since migration has a deep impact on the lives of individual Nepalis, the society and also the country, there is a need for more structured, consistent and periodic studies to help understand the various dimensions related to migration and its impact. This paper has made an attempt in that direction by providing a broad overview of the patterns of migration using extant sources. In the process, it has become evident that there is a need for some degree of coordination among surveys, particularly since these are few and far between. As all surveys have begun to look at some aspects of migration, were there to be consistency in defining at least a core set of indicators, comparability and trend analysis would be possible, helping generate a greater understanding of the rapidly evolving nature of migration and also in improving the management of the migration process itself.

notes
1. The raw data was analysed using STATA.2. Read wealth quintile as consumption quintile in the case of NLSS.3. See Sharma and Sharma (2011), for a more detailed discussion on the methodologies,
variables used and key findings from the major surveys in Nepal, including the ones discussed here.
4. Our analysis in STATA is based on cross-section data of 5988 households.5. CBS 2011, 131.6. Ibid, 131.7. Ibid, 132.8. ‘Stepwise migration, simply defined, is a pattern, pathway, or strategy in which
migrants move from one transit [destination] (the stepping stone) to the next until they reach the most preferred/desired destination’ (Maria Reinaruth D. Carlos, ‘The Stepwise International Migration of Filipino Nurses and Its Policy Implications for Their Retention in Japan,’ Working Paper Series, Studies on Multicultural Societies No. 23, Afrasian Research Centre, Ryukoku University, 2013, 6.
9. Circular migration ‘takes a social unit to a destination through a set of arrangements which returns it to the origin after a well-defined interval’ (Charles Tilly, ‘Migration in Modern European History,’ in The Migration Reader: Exploring Politics and Policies, edited by Anthony M. Messina and Gallya Lahav, 126-146, Colorado: Lynne Rienner Publishers, 2006).
10. KC 2003, 125 and 147.11. The first and second Demographic and Health Surveys, conducted in 1996 and 2001
respectively, did not feature anything on migration and hence been excluded here.12. MoHP, New Era and ICF International 2012, 22.13. NLFS 1998/99 did not collect any information on migration.14. See footnote 8.15. See footnote 9.16. For the purpose of this paper, absentee population includes all those individuals
who are absent from their homes at the time of enumeration, regardless of their destination (inside or outside the country), and not to be confused with how the census defines ‘absentee’ (see Table 2).
17. CBS 2011, 138.18. Ibid.19. Ibid.20. Ibid, 138.21. Ibid.22. Ibid.23. CBS 2012, 39. The 2011 census of Nepal reported that there are only 6.7 per

State of Migration in nepal 79
cent (1,781,792) individuals residing in the Mountain region, while 43 per cent (11,394,007) and 50.3 per cent (13,318,705) live in the Hills and Tarai respectively.
24. Ibid, 39.25. CBS 2011.26. More popularly known as SLC, this standardised examination is taken at the end of
10 years of schooling.27. CBS 2011.28. Ibid, 138.29. Ibid, 139.30. Ibid.31. As mentioned in the NLSS 2010/11 report, the mentioned reasons are for individuals
aged five and over.32. CBS 2011, 140.33. Internal migration here refers to those individuals who have moved within the
country. Rather than choose ‘internal migrants’ as defined by NLSS, this paper analyses absentees living within Nepal. This is for two reasons: first, immigrants from abroad are also counted among ‘internal migrants’ by NLSS, and, second, women who migrated because of marriage are regarded as migrants by NLSS despite their being a permanent member of the household they are married into. In the absentee category, however, because the natal homes of married women do not regard them as household members, they are not regarded as migrants. Hence, ‘internal migrants’ in the sections below should be understood as internal absentees, as defined by NLSS. We have used ‘migrants’ instead of ‘absentees’ to reduce possible confusion between the two terms. See Table 2.
34. CBS 2009.35. CBS 2012.36. CBS 2011.37. The rate of people moving into a region less the number of people moving out of the
same region.38. CBS 2002.39. CBS 2012, 3.40. KC 2003, 138.41. CBS 2014.42. This covers only the migrants who have moved internally for work and does not
include other categories.43. World Bank 2011.44. CBS 2011.45. NLSS does not list ‘marriage’ as a category under ‘reason for absence’. However, as
seen in Figure 29, marriage is analysed separately as a reason by NDHS. 46. MoHP, New Era and ICF International 2012.47. Internal migrants are categorised under ‘Nepal migrants’ by the Nepal Migration

80 State of Migration in nepal
Survey 2009 and denote only work migrants.48. World Bank 2011.49. Ibid.50. CBS 2014; World Bank 2011.51. Studies reveal that because of the stigma attached to international migration in the
South Asian context, families do not tend to reveal the migration of females (Haque 2005; Sharma and Sharma 2011).
52. CBS 2012.53. Ibid.54. Ibid.55. Ibid.56. For numbers and detailed category of destination countries, see Annex I.57. ‘Middle East’ here presumably also includes Israel and Lebanon in addition to the
six Gulf states, namely Bahrain, Kuwait, Oman, Qatar, Saudi Arabia and the United Arab Emirates.
58. CBS 2014.59. CBS 2011; CBS 2014.60. World Bank 2011.61. CBS 2014; MoHP, New ERA and ICF International 2012.62. Ibid.63. Ibid. It should be noted that the number of international women migrants is
extremely small compared to their male counterparts. 64. Ibid.65. A detailed description of reason for migration by destination country and gender has
been presented in Annex II.66. Any migrant who wants to go abroad for work has to receive labour permits from the
Department of Foreign Employment. To receive this permit/approval, documents such as passport, visa, contract, insurance policy, and orientation training certificate, among others, need to be presented. However, as Nepal and India share an open border, no labour permit, legal documents or visa is required to cross the Nepal-India border. Therefore, the individuals who have migrated to India have not been counted in this section.
67. The Maoist insurgency that began in 1996 had spread from its core areas by 1998/99 and the fighting intensified after November 2001 when the army was dragged into the conflict.
68. See Sijapati and Limbu (2012) for more details on the policies and regulations affecting foreign labour migration from Nepal.
69. Abidin and Rasiah 2009.70. CBS 2012.71. World Bank 2011.72. MoHP, New ERA and ICF International 2012.
State of Migration in nepal 81
73. The figures provided begin in the fiscal year 2006/07, which is when the DoFE started keeping gender-disaggregated data.
74. Department of Foreign Employment (www.dofe.gov.np).75. Bans have been imposed and lifted over the years, starting in 1998 when women were
prevented from working in the Gulf states. At the time of publication, women under the age of 30 were prohibited from going as domestic workers to Kuwait, Qatar, Saudi Arabia and the UAE.
76. Department of Foreign Employment (www.dofe.gov.np). http://dofe.gov.np/uploads /document/Chaitra%202070_20140430052407.pdf. Accessed 6 May 2014.
77. Department of Foreign Employment (www.dofe.gov.np).78. Sijapati and Limbu 2012. There is also anecdotal evidence gathered by researchers
from CESLAM in Tanahu district that under-reporting of international female migration is common due to the stigma attached to it.
79. To be precise, 29.8 years. World Bank 2011, 32.80. World Bank 2011.81. Ibid, 33.82. Ibid.83. Ibid.84. Ibid.85. Ibid.86. Because the data maintained by the DoFE and the study carried out by the World
Bank are specific to work migrants, only those two sources have been used here. Census 2011 deals with international migrants in general and not particularly with labour migrants alone.
87. The DoFE requires labour migrants to receive permits every time they go for foreign employment.
88. For more information, see Sharma and Thapa (2013).89. This does not include migrants going to India. http://dofe.gov.np/uploads/cmsfiles/
file/regognized%20Country_20120420021555.pdf. Accessed 9 July 2013.90. Department of Foreign Employment (www.dofe.gov.np).91. Ibid.92. World Bank 2011.93. There is no indication in the report about which group or groups of individuals ‘Other
Minorities’ refer to.94. World Bank 2011.95. Ibid.96. Ibid.97. This data is for countries other than India.98. Immigration into Nepal is regarded here as the migration of foreign citizenship holders
into the territories of the country and not the migration of foreign-born Nepali citizens. The data for both these categories is provided in the National Census 2011.

82 State of Migration in nepal
99. Kansakar 2003; National Census 2011.100. CBS 2012.101. Ibid.102. Ibid.103. Ibid.104. Ratha et al 2014.105. The World Bank (2011, 5; 80) reports that remittance earnings as a share of Nepal’s
GDP is increasing ’and it is the country’s biggest source of foreign exchange.106. Adams and Page 2006, cited in World Bank 2011, 1.107. CBS et al. 2006.108. CBS 2011.109. NRB 2011.110. Hundi is ‘a traditional system of remittance transfer widely practiced in the
subcontinent whereby individuals in destination countries give money to an agent, who instructs his/her associates back home to deliver the money to the concerned individual referred by the remitter’ (Sijapati and Limbu 2012, 17).
111. Sharma and Thapa 2013.112. CBS 2011.113. World Bank 2011.114. Ibid.115. It is not clear why there is no representation of remittance recipients in the Western
Mountains. One speculation here could be that the amount is very low to be captured here, or it could be that the sample size was very small in that region.
116. World Bank 2011, 37.117. Pfaff-Czarnecka 1995; Thieme 2006.118. Remittances from absentees who have migrated within Nepal have been referred to
as ‘internal sources’ and from those in foreign countries as ‘external sources’.119. NLSS does not explain what items are covered by ‘daily consumption’.120. CBS 2011.121. Ibid.122. At 4.7 per cent, Nepal has one of the highest urbanisation rates in the world and
the highest in South Asia. http://www.indexmundi.com/nepal/urbanization.html. Accessed on 3 May 2013.

Annexes
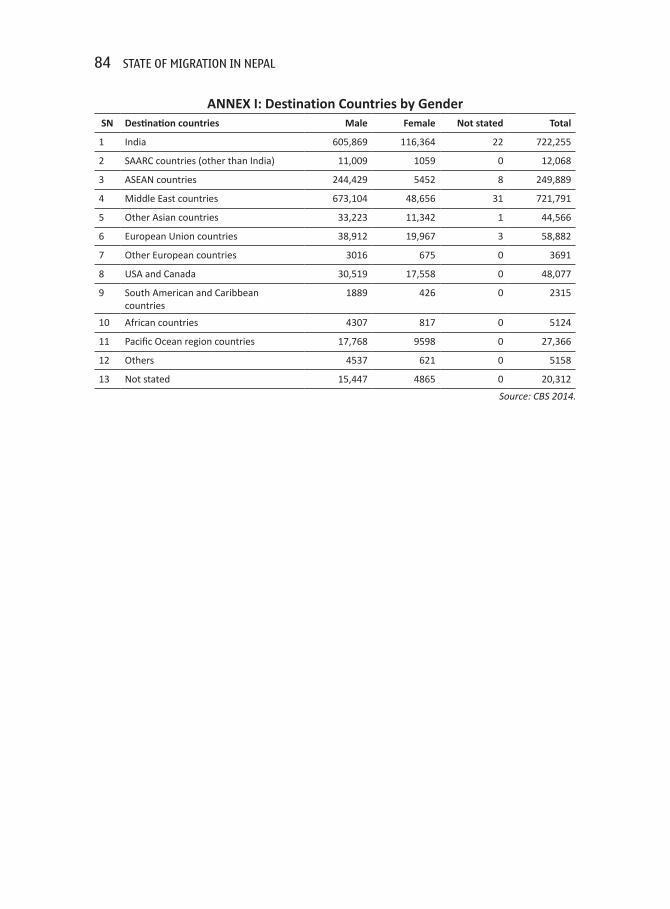
84 State of Migration in nepal
ANNEX I: Destination Countries by GenderSN Destination countries Male Female Not stated Total
1 India 605,869 116,364 22 722,255
2 SAARC countries (other than India) 11,009 1059 0 12,068
3 ASEAN countries 244,429 5452 8 249,889
4 Middle East countries 673,104 48,656 31 721,791
5 Other Asian countries 33,223 11,342 1 44,566
6 European Union countries 38,912 19,967 3 58,882
7 Other European countries 3016 675 0 3691
8 USA and Canada 30,519 17,558 0 48,077
9 South American and Caribbean countries
1889 426 0 2315
10 African countries 4307 817 0 5124
11 Pacific Ocean region countries 17,768 9598 0 27,366
12 Others 4537 621 0 5158
13 Not stated 15,447 4865 0 20,312
Source: CBS 2014.

ANN
EX II
: Des
tinat
ion
Coun
trie
s by
Reas
on fo
r Mig
ratio
n an
d G
ende
r
To
tal
abse
ntIn
dia
SAAR
C co
untr
ies
(oth
er
than
In
dia)
ASEA
N
coun
trie
sM
iddl
e Ea
st
Oth
er
Asia
n co
untr
ies
Euro
pean
U
nion
co
untr
ies
Oth
er
Euro
pean
co
untr
ies
USA
and
Ca
nada
Sout
h Am
eric
an/
Carib
bean
co
untr
ies
Afric
an
coun
trie
s
Paci
fic
Oce
an
Regi
on
coun
trie
s
Oth
er
coun
trie
sN
ot
stat
ed
Mal
e
Tota
l1,
684,
029
605,
869
11,0
0924
4,42
967
3,10
433
,223
38,9
123,
016
30,5
191,
889
4,30
717
,768
4,53
715
,447
Busi
ness
9,77
35,
982
612,
211
5859
535
556
228
915
5725
121
Priv
ate
job
1,27
0,56
845
6,31
87,
467
189,
715
557,
955
20,4
7213
,275
1,55
37,
918
948
2,52
82,
768
3,12
96,
522
Insti
tutio
nal
job
181,
952
57,0
831,
444
30,5
5579
,885
3,84
83,
965
286
1,82
132
777
458
350
887
3
Stud
y76
,886
21,6
701,
358
1,18
11,
595
4,98
414
,633
760
15,8
6420
355
313
,178
321
586
Confl
ict
2,24
989
924
276
721
3774
1079
215
4121
50
Depe
nden
t54
,764
31,6
4827
58,
380
2,44
42,
159
5,04
516
22,
707
9719
778
621
065
4
Oth
ers
20,2
308,
509
832,
636
6,62
034
558
024
963
2876
7667
223
Not
Sta
ted
67,6
0723
,760
297
9,47
523
,826
783
985
165
939
275
149
279
256
6,41
8
Fem
ale
Tota
l23
7,40
011
6,36
41,
059
5,45
248
,656
11,3
4219
,967
675
17,5
5842
681
79,
598
621
4,86
5
Busi
ness
1,91
11,
327
951
318
512
411
112
13
532
30
Priv
ate
job
93,9
9333
,650
294
3,03
040
,988
5,42
74,
518
183
3,11
615
434
31,
197
256
837
Insti
tutio
nal
job
10,5
292,
513
4851
94,
383
890
994
2968
429
7423
421
111
Stud
y33
,678
8,61
254
040
948
61,
679
6,63
520
68,
038
7917
86,
381
139
296
Confl
ict
394
221
27
4117
343
420
220
14
Depe
nden
t76
,341
58,5
6111
61,
117
530
2,58
66,
430
169
4,10
176
164
1,38
314
496
4
Oth
ers
6,45
14,
154
1199
564
187
485
1171
74
1211
012
85
Not
Sta
ted
14,1
037,
326
3922
01,
661
371
747
6374
883
4122
046
2,53
8
Sour
ce: C
BS 2
014.

Caste/ethnic Group
Population 2011
Per cent absent
Absentee population
Hill Castes
1 Bahun 3,226,903 7.8% 250,085
2 Chhetri 4,398,053 7.5% 331,613
3 Sanyasi/Dasnami 227,822 7.8% 17,861
4 Thakuri 425,623 7.0% 29,708
Tarai Castes
1 Badhaee 28,932 3.6% 1,047
2 Baraee 80,597 4.0% 3,240
3 Bin 75,195 4.1% 3,083
4 Brahman Tarai 134,106 3.9% 5,244
5 Dev 2147 2.1% 46
6 Dhunia 14,846 5.8% 863
7 Gaderi/Bhedihar 26,375 4.5% 1,197
8 Hajam/Thakur
117,758 3.2% 3,733
9 Haluwai 83,869 3.8% 3,195
10 Kahar 53,159 2.9% 1,526
11 Kalwar 128,232 2.4% 3,065
12 Kamar 1787 2.4% 42
13 Kanu 125,184 10.7% 13,407
14 Kathabaniyan 138,637 2.1% 2,925
15 Kayastha 44,304 2.5% 1,090
16 Kewat 153,772 5.6% 8,657
17 Koiri/Kushwaha
306,393 3.3% 9,958
18 Kori 12,276 1.3% 157
19 Kumhar 62,399 2.8% 1,722
20 Kurmi 231,129 2.0% 4,507
21 Lodh 32,837 2.9% 959
22 Lohar 101,421 5.5% 5,538
23 Mali 14,995 3.6% 541
24 Mallaha 173,261 3.2% 5,458
25 Marwari 51,443 2.5% 1,307
26 Nuniya 70,540 3.1% 2,215
27 Nurang 278 5.1% 14
28 Rajbhar 9,542 3.3% 314
29 Rajdhob 13,422 3.0% 401
30 Rajput 41,972 2.4% 1,003
31 Sonar 64,335 2.7% 1,750
32 Sudhi 93,115 5.4% 4,982
Caste/ethnic Group
Per cent absent
Absentee population
33 Teli 369,688 3.3% 12,163
34 Yadav 1,054,458 3.6% 37,644
Hill Dalit
1 Badi 38,603 9.9% 3,814
2 Damai/Dholi 472,862 9.8% 46,530
3 Gaine 6791 8.7% 591
4 Kami 1,258,554 10.7% 134,791
5 Sarki 374,816 10.4% 38,943
Tarai Dalit
1 Bantar/Sardar 55,104 3.7% 2,039
2 Chamar/Harijan Ram
335,893 3.6% 11,958
3 Chidimar 1254 0.4% 5
4 Dhandi 1982 3.9% 77
5 Dhankar/Dharikar 2681 3.8% 101
6 Dhobi 109,079 3.4% 3,676
7 Dom 13,268 1.2% 153
8 Dusadh/Paswan/Pasi
208,910 3.1% 6,518
9 Halkhor 4003 1.0% 40
10 Kalar 1077 4.4% 48
11 Khatwe 100,921 5.5% 5,561
12 Musahar 234,490 2.3% 5,370
13 Natuwa 3062 2.6% 79
14 Sarbaria 4906 2.5% 124
15 Tatma/Tatwa 104,865 4.9% 5,117
Mountain Janajati
1 Bhote 13,397 4.5% 600
2 Byasi/Sauka 3895 3.3% 129
3 Dolpo 4107 4.2% 173
4 Lhomi 1614 6.8% 110
5 Lhopa 2624 11.1% 291
6 Sherpa 112,946 8.2% 9,216
7 Thakali 13,215 12.8% 1,689
8 Topkegola 1,523 6.9% 105
9 Walung 1,249 9.5% 119
Hill Janajati
1 Aathpariya 5,977 9.7% 579
2 Bahing 3096 6.3% 195
3 Bantawa 4604 7.3% 337
ANNEX III: International Migrants by Caste/Ethnicity

Caste/ethnic Group
Population 2011
Per cent absent
Absentee population
4 Brahmu/Baramo 8,140 8.5% 691
5 Chamling 6668 9.4% 625
6 Chepang/Praja 68,399 1.1% 759
7 Chhantyal/Chhantel 11,810 11.8% 1,388
8 Dura 5394 11.0% 595
9 Ghale 22,881 10.3% 2,366
10 Gharti/Bhujel 118,650 8.2% 9,706
11 Gurung 522,641 12.7% 66,271
12 Hayu 2925 3.4% 99
13 Hyolmo 10,752 18.9% 2,029
14 Jirel 5774 6.1% 352
15 Khaling 1571 7.1% 112
16 Khawas 18,513 5.4% 1,003
17 Kulung 28,613 4.3% 1,222
18 Kusunda 273 6.2% 17
19 Lepcha 3445 4.2% 144
20 Limbu 387,300 10.0% 38,691
21 Loharung 1153 6.8% 78
22 Magar 1,887,733 9.9% 186,130
23 Mewahang/ Bala
3100 7.2% 224
24 Nachhiring 7154 5.2% 373
25 Newar 1,321,933 5.4% 71,120
26 Pahari 13,615 1.6% 219
27 Rai 620,004 8.3% 51,212
28 Sampang 1681 9.6% 162
29 Sunuwar 55,712 6.8% 3,788
30 Tamang 1,539,830 6.4% 99,011
31 Thami 28,671 3.5% 989
32 Thulung 3535 7.9% 277
33 Yakkha 24,336 8.5% 2,064
34 Yamphu 6933 5.6% 389
Inner Tarai Janajati
1 Bote 10,397 8.4% 869
Caste/ethnic Group
Population 2011
Per cent absent
Absentee population
2 Danuwar 84,115 5.4% 4,517
3 Darai 16,789 8.8% 1,476
4 Kumal 121,196 8.2% 9,914
5 Majhi 83,727 5.2% 4,312
6 Raji 4235 6.5% 274
7 Raute 618 4.0% 25
Tarai Janajati
1 Amat 3,830 4.7% 180
2 Dhanuk 219,808 5.0% 11,078
3 Dhimal 26,298 10.0% 2,625
4 Gangai 36,988 4.0% 1,494
5 Jhangad/Dhagar
37,424 3.8% 1,426
6 Kisan 1739 8.2% 142
7 Koche 1635 4.6% 75
8 Meche 4867 7.8% 382
9 Munda 2350 3.4% 80
10 Pattharkatta/Kuswadia
3182 3.9% 123
11 Rajbanshi 115,242 4.5% 5,128
12 Satar/Santhal
51,735 3.2% 1,661
13 Tajpuriya 19,213 4.8% 913
14 Tharu 1,737,470 3.3% 57,510
Others
1 Bangali 26,582 3.5% 928
2 Musalman 1,164,255 5.3% 61,240
3 Punjabi/Sikh 7176 3.6% 260
Unspecified
4 Dalit Others 155,354 12.2% 18,907
5 Janajati Others 1228 4.6% 56
6 Tarai Others 103,811 3.7% 3,883
7 Undefined Others 15,277 7.6% 1,153
8 Foreigner 6651 2.9% 194
Total 2,6494,504 1,784,270
Source: Adapted from Social Inclusion Atlas of Nepal (CDSA 2014). The classification of the groups follows Sharma 2014.
‘Absentee’ here meets this paper’s definition of an international migrant (see Table 2). According to Census 2011, the number of such absentees was 1,921,494 (CBS 2012). But, because calculations derived from the percentage figures given in Social Inclusion Atlas of Nepal add up to 1,784,270 only, the authors could not be sure about the other data given in the book, such as international migrants making up 6.76 per cent of the population, or Janajatis constituting 29 per cent of the total international migrant population, Chhetris 21.3 per cent, Hill Dalits 13, Other Madhesi Castes 6.7, Tarai Janajatis 4.5, Newars 3.9, and Madhesi Dalits 2.9.


referenCes
Books, Journal Articles, Reports
Abidin, Mahani Zainal and Rajah Rasiah. 2009. The Global Financial Crisis and the Malaysian Economy: Impact and Responses. Kuala Lumpur: United Nations Development Programme.
Central Bureau of Statistics (CBS). 2002. Population Census 2001, National Report. Kathmandu: Central Bureau of Statistics.
_____. 2004. Nepal Living Standards Survey 2003/04. Kathmandu: Central Bureau of Statistics.
_____. 2009. Report on the Nepal Labour Force Survey 2008. Kathmandu: Central Bureau of Statistics.
_____. 2011. Nepal Living Standards Survey 2010/11. Kathmandu: Central Bureau of Statistics.
_____. 2012. National Population and Housing Census 2011 (National Report). Kathmandu: Central Bureau of Statistics.
_____. 2014. National Population and Housing Census 2011: Household Tables. Kathmandu: Central Bureau of Statistics.
CBS, World Bank, Department for International Development and Asian Development Bank. 2006. Resilience amidst Conflict: An Assessment of Poverty in Nepal 1995/96-2003/04. Kathmandu: CBS, World Bank, Department for International Development and Asian Development Bank.
Central Department of Sociology/Anthropology (CDSA). 2014. Social Inclusion Atlas of Nepal: Household Facilities and Occupation, Volume IV. Kathmandu: CDSA, Tribhuvan University.
Ghimire, Prabhakar. 2009. ‘Govt reopens Lebanon for Nepali workers.’ Republica. Accessed 13 May 2014. http://archives.myrepublica.com/portal/index.php?action=news_details&news_id=4930
Gurung, Ganesh. 2009. ‘Major Events in 2009.’ In Nepal Migration Year Book 2009, edited by Anita (Bhattarai) Ghimire, Bishnu Raj Upreti, Ganesh Gurung and Jagannath Adhikari, 94-96. Kathmandu and Lalitpur: Nepal Institute of Development Studies and Swiss National Centre of Competence in Research (NCCR) North-South.
Hamill, Kathleen. 2011. Trafficking of Migrant Domestic Workers in Lebanon: A Legal Analysis. Beirut: Kafa (Enough) Violence & Exploitation.
Haque, Md. Shahidul. 2005. ‘Migration Trends and Patterns in South Asia and
90 State of Migration in nepal
Management Approaches and Initiatives.’ Asia-Pacific Population Journal 20(3): 39-60.
Kansakar, Vidhya Bir Singh. 1984. ‘Indo-Nepal Migration: Problems and Prospects.’ Contributions to Nepalese Studies 11(2): 49-69.
_____. 2003. ‘International Migration and Citizenship in Nepal.’ In Population Monograph of Nepal, 85-119. Kathmandu: Central Bureau of Statistics.
KC, Bal Kumar. 2003. ‘Internal Migration in Nepal.’ In Population Monograph of Nepal, 121-168. Kathmandu: Central Bureau of Statistics.
Ministry of Finance (MoF). 2013. Economic Survey: Fiscal Year 2012/13. Kathmandu: MoF, Government of Nepal
Ministry of Health and Population (MoHP), New ERA, and Macro International Inc. 2007. National Demographic and Health Survey 2006. Kathmandu: MoHP, New ERA, and USAID.
MoHP, New ERA, and ICF International. 2012. National Demographic and Health Survey 2011. Kathmandu: MoHP, New ERA, and USAID.
Nepal Rastra Bank (NRB). 2011. Monetary Policy 2011/12. Kathmandu: Nepal Rastra Bank._____. 2013. ‘Current Macroeconomic Situation of Nepal: Based on Annual Data
of FY 2012/13,’ last modified 6 May 2014. http://www.nrb.org.np/ofg/current_macroeconomic/Current_Macroeconomic_Situation_(English)--2070-05_Text_(Based_on_Annual_Data_of_2069-70).pdf.
Pfaff-Czarnecka, Joanna. 1995. ‘Migration under Marginality Conditions: The Case of Bajhang.’ In Rural-Urban Linkages: A Challenge for Swiss Development Cooperation, 97-107. Zurich, Kathmandu: Interdisciplinary Consulting Group for National resources and Infrastructure Management (INFRAS) and Interdisciplinary Analysts (IDA).
Ratha, Dilip and William Shaw. 2007. ‘South-South Migration and Remittances.’ World Bank Working Paper 102. World Bank.
Seddon, David, Jagannath Adhikari and Ganesh Gurung. 2001. The New Lahures: Foreign Employment and Remittance Economy of Nepal. Kathmandu: Nepal Institute of Development Studies.
Sijapati, Bandita and Amrita Limbu. 2012. Governing Labour Migration in Nepal: An Analysis of Existing Policies and Institutional Mechanism. Kathmandu: Centre for the Study of Labour and Mobility/Himal Books.
Sharma, Jeevan Raj and Sanjay Sharma. 2011. ‘Enumerating Migration in Nepal’, Working Paper I. Kathmandu: Centre for the Study of Labour and Mobility.
Sharma, Pitamber. 2014. Some Aspects of Nepal’s Social Demography: Census 2011 Update. Kathmandu: Social Science Baha/Himal Books.
Sharma, Sanjay and Deepak Thapa. 2013. ‘Taken for Granted: Nepali Migration

State of Migration in nepal 91
to India.’ Working Paper III. Kathmandu: Centre for the Study of Labour and Mobility.
Shishir, Prakatkumar. 2014. ‘Gharelu Mahila Kaamdaarko Shram Swikriti Banda’ [in Nepali]. Nagarik. Accessed 13 May 2014. http://www.nagariknews.com/society/story/16670/16670.
Shrestha, Shreejana. 2014. ‘Women Migrant Workers Flying to Gulf via India to Skirt Age Limit Rule.’ Republica. Accessed 13 May 2014. http://www.myrepublica.com/portal/index.php?action=news_details&news_id=74044.
Siddiqui, Tasneem. 2008. ‘Migration and Gender in Asia.’ Paper presented at the United Nations Expert Group Meeting on International Migration and Development in Asia and the Pacific, Bangkok, Thailand, September 20-21.
Thieme, Susan. 2006. Social Networks and Migration: Far West Nepalese Labour Migrants in Delhi. Berlin: LIT Verlag.
United Nations Development Programme (UNDP). 2009. Nepal Human Development Report 2009. Kathmandu: UNDP.
World Bank. 2011. Large-Scale Migration and Remittances in Nepal: Issues, Challenges, and Opportunities. Kathmandu: World Bank.
_____. 2014. ‘Migration and Remittances: Recent Developments and Outlook.’ Migration and Development Brief 22. World Bank.
Web Sourceswww.ceslam.orgwww.dofe.gov.npwww.indexmundi.com
Sanjay Sharma and Dinesh Pathak are researchers at the Centre for the Study of Labour and Mobility. shibani Pandey is a news anchor/reporter with Kantipur Television and a contributing writer to The Kathmandu Post. bimbika sijapati-basnett is a Post-Doctoral Research Fellow at the Center for International Forestry Research, Bogor, Indonesia.

STATE OF MIGRATIONIN NEPAL
Sanjay Sharma, Shibani PandeyDinesh Pathak & Bimbika Sijapati-Basnett
Research Paper VI
9 789937 282611
STATE OF MIGRATION IN NEPAL