state of indiana - in.gov · state of indiana office of management ... principals, speech...
TRANSCRIPT

STATE OF INDIANA
OFFICE OF MANAGEMENT & BUDGET Ryan Kitchell
200 W. Washington St., Room 212 Director
Indianapolis, IN 46204
317-232-5617
To: Indiana State Board of Education, Governor Daniels, and Indiana General Assembly
From: Ryan Kitchell, OMB Director
Date: June 3, 2008
Re: Student Instructional Expenditure Report for 2006-07 School Year
Pursuant to IC 20-42.5-3-5 (which was originally brought into law by HEA 2006-1006), I hereby
submit this report showing the progress of each school corporation, of all school corporations in
each educational service center's area, and in Indiana as a whole in improving the ratio of student
instructional expenditures to all other expenditures for the 2006-07 school year.
In March 2007, the Indiana State Board of Education approved the classification of each
expenditure account from the school finance chart of accounts into one of four categories:
1) Student academic achievement expenditures – examples include teacher salaries,
principals, speech pathologists, media services, and textbooks
2) Student instructional support expenditures – guidance counselors, nurses, curriculum
development, superintendents, school boards, and technology
3) Overhead and operational expenditures – legal services, business support,
maintenance, transportation, food service, and athletic coaches
4) Nonoperational expenditures – school construction, debt, interest, lease rental
Furthermore, “Student Instructional Expenditures” were defined as the sum of expenditures
under Category 1 and Category 2.
Statewide, Indiana school corporations improved the Student Instructional Expenditures ratio
from 60.6% during the 2005-06 school year to 61.4% for 2006-07. Out of 321 school
corporations and charter schools, 172 improved over the previous year. These corporations and
schools are shaded in green on the list starting on page 8 of this report.
I offer a few clarifications and observations about this report:
The source data for this report are from the Biannual Financial Report (more commonly
known as the Form 9) submitted by school corporations to the Department of Education.
OMB has used the expenditures as originally entered and submitted by each district.

2
Data for the nine Educational Service Centers (ESC’s) begin on page 6. It should be
noted that ESC membership is optional, and that school corporations are allowed to join
an ESC outside the one designated for their county. The figures are for all school
corporations located in each ESC’s designated area, and thus may differ from the actual
membership of each ESC.
In addition to benchmarking against the 2005-06 school year (FY 2006) as the law
requires, we have also provided data for the 1996-97 school year (FY 1997), so that 10-
year trends may be analyzed as well. In 1996-97, the statewide Student Instructional
Expenditures ratio was 63.2%. A primary reason for the decreased ratio over the past
decade is the increased debt incurred related to school construction. Annual
nonoperational expenditures (Category 4) increased by 79% (or $824 million) over the
ten-year period while all other spending increased by only 59%.
When analyzing individual school corporation Student Instructional Expenditures ratios,
the focus should be on comparing that corporation to itself at a previous point in time,
rather than inter-district comparisons, which may require more analysis and explanations
as conditions vary from one district to the next.
Readers may notice that the 2005-06 ratios presented in this report differ slightly from
those provided last year by the State Board of Education. There are two reasons for this
variance:
1) Account 12150 (High Ability Students) had been added to the chart of accounts since
last year’s report and is categorized as “Student Academic Achievement.” Accounts
used which either do not appear on the chart of accounts or are account classifications
(instead of detailed expenditure accounts) are listed as “Not Categorized.”
2) Charter schools which opened in the fall of 2006 had some small start-up expenses in
2005-06 which have been included for the sake of completeness.
As is contemplated in the state statue referenced above, the Office of Management and
Budget is available to provide technical assistance to each school corporation that did not
have an improved ratio of student instructional expenditures. Clearly improvements in
this regard would have meaningful results. A 1% increase in the ratio statewide would
mean an additional $100 million available for student instruction.
It is not lost on us that eleven months have now passed since the time period this report covers
ended. Much of that delay is due to the time required to acquire and balance the Form 9
information. HEA 2006-1006 also mandated that the Department of Education, with assistance
from the Office of Management and Budget, develop a plan to upgrade the financial
management, analysis, and reporting system (FinMARS) for school corporations and schools.
This plan was written and published in September 2006. (The full document is online at
www.doe.in.gov/publications/FinMARS.html.)
The FinMARS plan has not yet been implemented. If put into practice, the timeliness and ease
of access to school financial data in Indiana would be greatly improved. In advance of the 2009
General Assembly, we would encourage a renewed discussion among legislators, State Board of
Education members, and school leaders concerning how to modernize the accounting for
education spending in Indiana.

Table of Contents
School Corporation Page School Corporation Page School Corporation Page
Cover Memo 1 Center Grove Com Sch Corp (4205) 132 East Gibson School Corporation (2725) 258
Table of Contents 3 Centerville-Abington Com Schs (8360) 136 East Noble School Corp (6060) 261
Ratio of Instructional Expenditures by ESC Area 6 Central Noble Com School Corp (6055) 140 East Porter County School Corp (6510) 266
Counties in Education Service Center Areas 7 Challenge Foundation Academy (9645) 144 East Washington School Corp (8215) 270
Ratio of Instructional Expenditures by School Corp 8 Charles A Tindley Accelerated Schl (9445) 146 Eastbrook Community Sch Corp (2815) 274
Statewide 17 Charter School of the Dunes (9310) 148 Eastern Greene Schools (2940) 278
21st Century Charter Sch of Gary (9545) 24 Christel House Academy (9380) 151 Eastern Hancock Co Com Sch Corp (3145) 282
21st Century Charter School (9370) 26 Clark-Pleasant Com School Corp (4145) 154 Eastern Howard School Corp (3480) 285
21st Century Fountain Square (9480) 29 Clarksville Com School Corp (1000) 158 Eastern Pulaski Com Sch Corp (6620) 289
Adams Central Community Schools (0015) 32 Clay Community Schools (1125) 162 Edinburgh Community Sch Corp (4215) 293
Alexandria Com School Corp (5265) 36 Clinton Central School Corp (1150) 166 Elkhart Community Schools (2305) 297
Anderson Community School Corp (5275) 40 Clinton Prairie School Corp (1160) 169 Elwood Community School Corp (5280) 301
Andrew J Brown Academy (9615) 44 Cloverdale Community Schools (6750) 173 Eminence Community School Corp (5910) 306
Argos Community Schools (5470) 45 Community Montessori Inc (9320) 177 Evansville-Vanderburgh Sch Corp (7995) 309
Attica Consolidated Sch Corp (2435) 49 Community Schools of Frankfort (1170) 180 Fairfield Community Schools (2155) 314
Avon Community School Corp (3315) 53 Concord Community Schools (2270) 184 Fayette County School Corp (2395) 318
Barr-Reeve Com Schools Inc (1315) 57 Covington Community Sch Corp (2440) 188 Flanner House Elementary School (9390) 323
Bartholomew Con School Corp (0365) 61 Cowan Community School Corp (1900) 192 Flat Rock-Hawcreek School Corp (0370) 325
Batesville Community Sch Corp (6895) 66 Crawford Co Com School Corp (1300) 196 Fort Wayne Community Schools (0235) 328
Baugo Community Schools (2260) 70 Crawfordsville Com Schools (5855) 200 Franklin Community School Corp (4225) 333
Beech Grove City Schools (5380) 74 Crothersville Community Schools (3710) 204 Franklin County Com Sch Corp (2475) 337
Benton Community School Corp (0395) 78 Crown Point Community Sch Corp (4660) 207 Franklin Township Com Sch Corp (5310) 341
Blackford County Schools (0515) 82 Culver Community Schools Corp (5455) 211 Frankton-Lapel Community Schs (5245) 345
Bloomfield School District (2920) 86 Daleville Community Schools (1940) 214 Fremont Community Schools (7605) 349
Blue River Valley Schools (3405) 89 Danville Community School Corp (3325) 217 Frontier School Corporation (8525) 353
Bremen Public Schools (5480) 93 Decatur County Com Schools (1655) 221 Galileo Charter School (9565) 357
Brown County School Corporation (0670) 97 Decatur Discovery Academy Inc (9525) 225 Garrett-Keyser-Butler Com (1820) 359
Brownsburg Community Sch Corp (3305) 101 DeKalb Co Ctl United Sch Dist (1835) 227 Gary Community School Corp (4690) 363
Brownstown Cnt Com Sch Corp (3695) 105 DeKalb Co Eastern Com Sch Dist (1805) 231 Gary Lighthouse Charter School (9535) 367
C A Beard Memorial School Corp (3455) 109 Delaware Community School Corp (1875) 235 Goodwill Educ Initiatives II (9475) 369
Campagna Academy Charter School (9300) 113 Delphi Community School Corp (0755) 239 Goodwill Educ Initiatives Inc (9470) 371
Cannelton City Schools (6340) 115 Dewey Township Schools (4790) 243 Goshen Community Schools (2315) 373
Carmel Clay Schools (3060) 119 Duneland School Corporation (6470) 246 Greater Clark County Schools (1010) 377
Carroll Consolidated Sch Corp (0750) 123 East Allen County Schools (0255) 250 Greater Jasper Con Schs (2120) 382
Cass Township Schools (4770) 126 East Chicago Lighthouse Charter (9595) 254 Greencastle Community Sch Corp (6755) 386
Caston School Corporation (2650) 129 East Chicago Urban Enterprise Acad (9555) 256 Greenfield-Central Com Schools (3125) 389
3Office of Management and Budget
June 3, 2008

School Corporation Page School Corporation Page School Corporation Page
Greensburg Community Schools (1730) 393 M S D Decatur Township (5300) 534 New Castle Community Sch Corp (3445) 695
Greenwood Community Sch Corp (4245) 397 M S D Lawrence Township (5330) 539 New Community School (9340) 699
Griffith Public Schools (4700) 400 M S D Martinsville Schools (5925) 544 New Harmony Town & Twp Con Sch (6610) 701
Hamilton Community Schools (7610) 404 M S D Mount Vernon (6590) 549 New Prairie United School Corp (4805) 704
Hamilton Heights School Corp (3025) 408 M S D North Posey Co Schools (6600) 553 Nineveh-Hensley-Jackson United (4255) 707
Hamilton Southeastern Schools (3005) 412 M S D of New Durham Township (4860) 557 Noblesville Schools (3070) 710
Hanover Community School Corp (4580) 415 M S D Perry Township (5340) 560 North Adams Community Schools (0025) 715
Herron Charter (9650) 419 M S D Pike Township (5350) 565 North Daviess Com Schools (1375) 719
Hope Academy (9655) 421 M S D Shakamak Schools (2960) 570 North Gibson School Corp (2735) 723
Huntington Co Com Sch Corp (3625) 423 M S D Southwest Allen County (0125) 574 North Harrison Com School Corp (3180) 727
Indianapolis Public Schools (5385) 427 M S D Steuben County (7615) 578 North Judson-San Pierre Sch Corp (7515) 731
Indpls Lighthouse Charter School (9575) 432 M S D Wabash County Schools (8050) 582 North Knox School Corp (4315) 734
Irvington Community School (9330) 434 M S D Warren County (8115) 586 North Lawrence Com Schools (5075) 738
Jac-Cen-Del Community Sch Corp (6900) 436 M S D Warren Township (5360) 590 North Miami Community Schools (5620) 742
Jay School Corp (3945) 440 M S D Washington Township (5370) 595 North Montgomery Com Sch Corp (5835) 746
Jennings County Schools (4015) 445 M S D Wayne Township (5375) 600 North Newton School Corp (5945) 750
John Glenn School Corporation (7150) 450 Maconaquah School Corp (5615) 604 North Putnam Community Schools (6715) 754
Joshua Academy (9495) 453 Madison Consolidated Schools (3995) 608 North Spencer County Sch Corp (7385) 758
Kankakee Valley School Corp (3785) 456 Madison-Grant United Sch Corp (2825) 612 North Vermillion Com Sch Corp (8010) 762
KIPP Indpls College Preparatory (9400) 460 Manchester Community Schools (8045) 616 North West Hendricks Schools (3295) 766
KIPP Lead College Prep Charter (9635) 463 Marion Community Schools (2865) 620 North White School Corp (8515) 770
Knox Community School Corp (7525) 465 Medora Community School Corp (3640) 625 Northeast Dubois Co Sch Corp (2040) 774
Kokomo-Center Twp Con Sch Corp (3500) 469 Merrillville Community School (4600) 628 Northeast School Corp (7645) 777
Lafayette School Corporation (7855) 473 Michigan City Area Schools (4925) 632 Northeastern Wayne Schools (8375) 781
Lake Central School Corp (4615) 478 Middlebury Community Schools (2275) 637 Northern Com Sch Tipton Co (7935) 784
Lake Ridge Schools (4650) 482 Milan Community Schools (6910) 641 Northern Wells Com Schools (8435) 788
Lake Station Community Schools (4680) 486 Mill Creek Community Sch Corp (3335) 645 Northwest Allen County Schools (0225) 792
Lakeland School Corporation (4535) 489 Mississinewa Community School Corp (2855) 649 Northwestern Con School Corp (7350) 795
Lanesville Community School Corp (3160) 493 Mitchell Community Schools (5085) 652 Northwestern School Corp (3470) 798
LaPorte Community School Corp (4945) 496 Monroe Central School Corp (6820) 656 Oak Hill United School Corp (5625) 801
Lawrence Early College HS for S&T (9660) 500 Monroe County Com Sch Corp (5740) 660 Options Charter Sch - Noblesville (9640) 805
Lawrenceburg Com School Corp (1620) 502 Monroe-Gregg School District (5900) 664 Options Charter School - Carmel (9325) 807
Lebanon Community School Corp (0665) 506 Montessori Academy @ Geist (9665) 668 Oregon-Davis School Corp (7495) 810
Liberty-Perry Com School Corp (1895) 510 Mooresville Con School Corp (5930) 670 Orleans Community Schools (6145) 814
Linton-Stockton School Corp (2950) 514 Mt Pleasant Twp Com Sch Corp (1910) 674 Paoli Community School Corp (6155) 818
Logansport Community Sch Corp (0875) 518 Mt Vernon Community Sch Corp (3135) 678 Penn-Harris-Madison Sch Corp (7175) 822
Loogootee Community Sch Corp (5525) 522 Muncie Community Schools (1970) 681 Perry Central Com Schools Corp (6325) 826
M S D Bluffton-Harrison (8445) 526 Nettle Creek School Corp (8305) 686 Peru Community Schools (5635) 830
M S D Boone Township (6460) 530 New Albany-Floyd Co Con Sch (2400) 690 Pike County School Corp (6445) 834
4Office of Management and Budget
June 3, 2008

School Corporation Page School Corporation Page School Corporation Page
Pioneer Regional School Corp (0775) 838 South Adams Schools (0035) 986 Turkey Run Community Sch Corp (6310) 1134
Plainfield Community Sch Corp (3330) 841 South Bend Community Sch Corp (7205) 990 Twin Lakes School Corp (8565) 1137
Plymouth Community School Corp (5485) 845 South Central Com School Corp (4940) 995 Union Co Clg Corner Joint Sch Dist (7950) 1141
Portage Township Schools (6550) 849 South Dearborn Com School Corp (1600) 998 Union School Corporation (6795) 1144
Porter Township School Corp (6520) 853 South Gibson School Corp (2765) 1001 Union Township School Corp (6530) 1147
Prairie Heights Com Sch Corp (4515) 857 South Harrison Com Schools (3190) 1004 Union-North United School Corp (7215) 1150
Prairie Township Schools (4880) 861 South Henry School Corp (3415) 1008 Valparaiso Community Schools (6560) 1154
Randolph Central School Corp (6825) 863 South Knox School Corp (4325) 1012 Veritas Academy (9360) 1158
Randolph Eastern School Corp (6835) 867 South Madison Com Sch Corp (5255) 1016 Vigo County School Corp (8030) 1161
Randolph Southern School Corp (6805) 871 South Montgomery Com Sch Corp (5845) 1020 Vincennes Community Sch Corp (4335) 1166
Rensselaer Central School Corp (3815) 875 South Newton School Corp (5995) 1024 Wabash City Schools (8060) 1170
Richland-Bean Blossom C S C (5705) 879 South Putnam Community Schools (6705) 1028 Wa-Nee Community Schools (2285) 1174
Richmond Community School (8385) 883 South Ripley Com Sch Corp (6865) 1032 Warrick County School Corp (8130) 1178
Rising Sun-Ohio Co Com (6080) 888 South Spencer County Sch Corp (7445) 1036 Warsaw Community Schools (4415) 1182
River Forest Community Sch Corp (4590) 891 South Vermillion Com Sch Corp (8020) 1040 Washington Com Schools Inc (1405) 1186
Rochester Community Sch Corp (2645) 895 Southeast Dubois Co Sch Corp (2100) 1044 Wawasee Community School Corp (4345) 1190
Rockville Community School Corp (6300) 899 Southeast Fountain School Corp (2455) 1048 Wes-Del Community Schools (1885) 1194
Rossville Con School District (1180) 903 Southeastern School Corp (0815) 1052 West Central School Corp (6630) 1198
Rural Community Schools Inc (9465) 906 Southern Hancock Co Com Sch Corp (3115) 1055 West Clark Community Schools (0940) 1202
Rush County Schools (6995) 908 Southern Wells Com Schools (8425) 1059 West Gary Lighthouse Charter (9585) 1206
Salem Community Schools (8205) 912 Southwest Dubois Co Sch Corp (2110) 1063 West Lafayette Com School Corp (7875) 1208
School City of East Chicago (4670) 916 Southwest Parke Com Sch Corp (6260) 1067 West Noble School Corporation (6065) 1212
School City of Hammond (4710) 921 Southwest School Corp (7715) 1070 West Washington School Corp (8220) 1216
School City of Hobart (4730) 927 Southwestern Con Sch Shelby Co (7360) 1074 Western Boone Co Com Sch Dist (0615) 1219
School City of Mishawaka (7200) 931 Southwestern-Jefferson Co Con (4000) 1078 Western School Corp (3490) 1222
School Town of Highland (4720) 935 Spencer-Owen Community Schools (6195) 1082 Western Wayne Schools (8355) 1226
School Town of Munster (4740) 939 Springs Valley Com School Corp (6160) 1086 Westfield-Washington Schools (3030) 1230
School Town of Speedway (5400) 943 Sunman-Dearborn Com Sch Corp (1560) 1090 Westview School Corporation (4525) 1234
Scott County School District 1 (7230) 946 Switzerland County School Corp (7775) 1094 White River Valley Sch Dist (2980) 1238
Scott County School District 2 (7255) 950 Taylor Community School Corp (3460) 1098 Whiting School City (4760) 1242
SE Neighborhood Sch of Excellence (9485) 954 Tell City-Troy Twp School Corp (6350) 1102 Whitko Community School Corp (4455) 1246
Seymour Community Schools (3675) 956 Thea Bowman Leadership Academy (9460) 1106 Whitley Co Cons Schools (8665) 1250
Shelby Eastern Schools (7285) 960 Timothy L Johnson Academy (9350) 1108 Zionsville Community Schools (0630) 1255
Shelbyville Central Schools (7365) 964 Tippecanoe School Corp (7865) 1110
Shenandoah School Corporation (3435) 968 Tippecanoe Valley School Corp (4445) 1115
Sheridan Community Schools (3055) 972 Tipton Community School Corp (7945) 1119
Shoals Community School Corp (5520) 976 Tri-County School Corp (8535) 1123
Signature School Inc (9315) 980 Tri-Creek School Corp (4645) 1127
Smith-Green Community Schools (8625) 982 Triton School Corporation (5495) 1131
5Office of Management and Budget
June 3, 2008
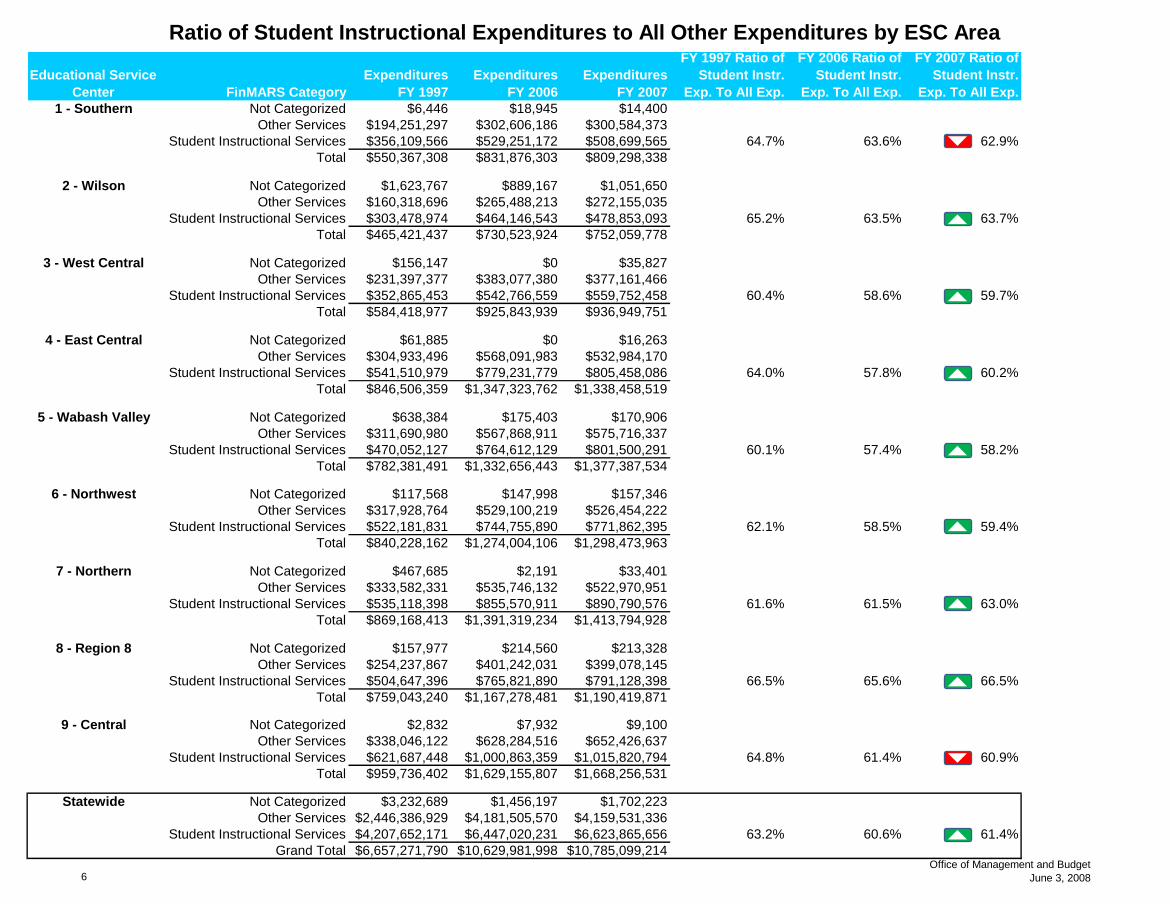
Ratio of Student Instructional Expenditures to All Other Expenditures by ESC Area
Educational Service
Center FinMARS Category
Expenditures
FY 1997
Expenditures
FY 2006
Expenditures
FY 2007
FY 1997 Ratio of
Student Instr.
Exp. To All Exp.
FY 2006 Ratio of
Student Instr.
Exp. To All Exp.
FY 2007 Ratio of
Student Instr.
Exp. To All Exp.
1 - Southern Not Categorized $6,446 $18,945 $14,400
Other Services $194,251,297 $302,606,186 $300,584,373
Student Instructional Services $356,109,566 $529,251,172 $508,699,565 64.7% 63.6% 62.9%
Total $550,367,308 $831,876,303 $809,298,338
2 - Wilson Not Categorized $1,623,767 $889,167 $1,051,650
Other Services $160,318,696 $265,488,213 $272,155,035
Student Instructional Services $303,478,974 $464,146,543 $478,853,093 65.2% 63.5% 63.7%
Total $465,421,437 $730,523,924 $752,059,778
3 - West Central Not Categorized $156,147 $0 $35,827
Other Services $231,397,377 $383,077,380 $377,161,466
Student Instructional Services $352,865,453 $542,766,559 $559,752,458 60.4% 58.6% 59.7%
Total $584,418,977 $925,843,939 $936,949,751
4 - East Central Not Categorized $61,885 $0 $16,263
Other Services $304,933,496 $568,091,983 $532,984,170
Student Instructional Services $541,510,979 $779,231,779 $805,458,086 64.0% 57.8% 60.2%
Total $846,506,359 $1,347,323,762 $1,338,458,519
5 - Wabash Valley Not Categorized $638,384 $175,403 $170,906
Other Services $311,690,980 $567,868,911 $575,716,337
Student Instructional Services $470,052,127 $764,612,129 $801,500,291 60.1% 57.4% 58.2%
Total $782,381,491 $1,332,656,443 $1,377,387,534
6 - Northwest Not Categorized $117,568 $147,998 $157,346
Other Services $317,928,764 $529,100,219 $526,454,222
Student Instructional Services $522,181,831 $744,755,890 $771,862,395 62.1% 58.5% 59.4%
Total $840,228,162 $1,274,004,106 $1,298,473,963
7 - Northern Not Categorized $467,685 $2,191 $33,401
Other Services $333,582,331 $535,746,132 $522,970,951
Student Instructional Services $535,118,398 $855,570,911 $890,790,576 61.6% 61.5% 63.0%
Total $869,168,413 $1,391,319,234 $1,413,794,928
8 - Region 8 Not Categorized $157,977 $214,560 $213,328
Other Services $254,237,867 $401,242,031 $399,078,145
Student Instructional Services $504,647,396 $765,821,890 $791,128,398 66.5% 65.6% 66.5%
Total $759,043,240 $1,167,278,481 $1,190,419,871
9 - Central Not Categorized $2,832 $7,932 $9,100
Other Services $338,046,122 $628,284,516 $652,426,637
Student Instructional Services $621,687,448 $1,000,863,359 $1,015,820,794 64.8% 61.4% 60.9%
Total $959,736,402 $1,629,155,807 $1,668,256,531
Statewide Not Categorized $3,232,689 $1,456,197 $1,702,223
Other Services $2,446,386,929 $4,181,505,570 $4,159,531,336
Student Instructional Services $4,207,652,171 $6,447,020,231 $6,623,865,656 63.2% 60.6% 61.4%
Grand Total $6,657,271,790 $10,629,981,998 $10,785,099,214
6Office of Management and Budget
June 3, 2008

Counties in Education Service Center Areas
1 2 3 4 5 6
Southern Wilson West Central East Central Wabash Valley Northwest
Crawford Clark Brown Bartholomew Benton Jasper
Daviess Dearborn Clay Decatur Boone Lake
DuBois Floyd Greene Delaware Carroll Newton
Gibson Harrison Hendricks Fayette Cass Porter
Knox Jackson Monroe Franklin Clinton
Lawrence Jefferson Morgan Hancock Fountain
Martin Jennings Owen Henry Hamilton
Orange Ohio Parke Johnson Howard
Perry Ripley Putnam Madison Miami
Pike Scott Sullivan Randolph Montgomery
Posey Switzerland Vermillion Rush Tippecanoe
Spencer Washington Vigo Shelby Tipton
Vanderburgh Union Warren
Warrick Wayne White
7 8 9
Northern Region 8 Central
Elkhart Adams Marion
Fulton Allen
Kosciusko Blackford
LaGrange DeKalb
LaPorte Grant
Marshall Huntington
Pulaski Jay
St. Joseph Noble
Starke Steuben
Wabash
Wells
Whitley
Source: DOE website -- http://www.doe.state.in.us/htmls/esc.html
7Office of Management and Budget
June 3, 2008

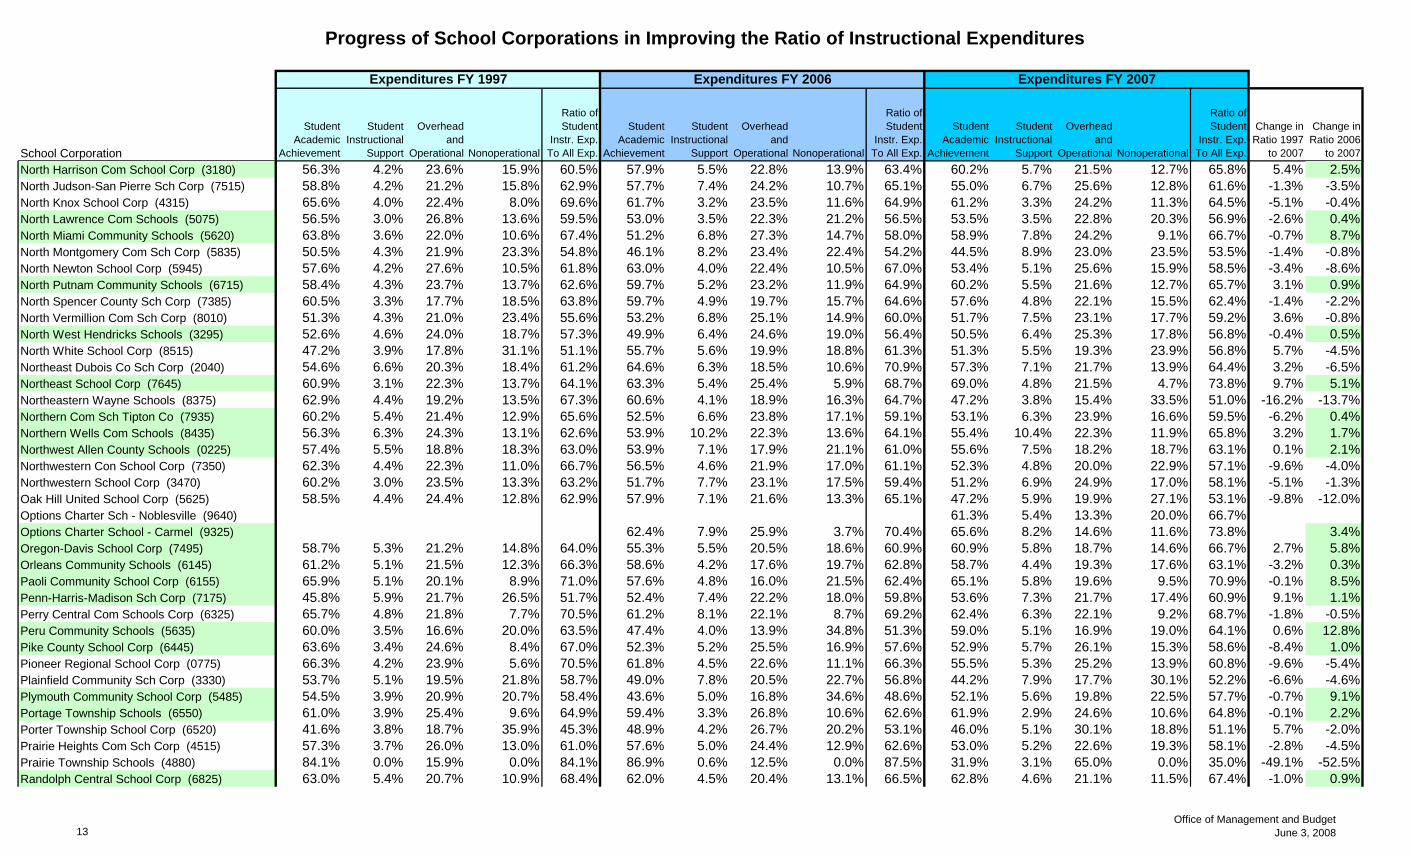
Progress of School Corporations in Improving the Ratio of Instructional Expenditures
School Corporation
Student
Academic
Achievement
Student
Instructional
Support
Overhead
and
Operational Nonoperational
Ratio of
Student
Instr. Exp.
To All Exp.
Student
Academic
Achievement
Student
Instructional
Support
Overhead
and
Operational Nonoperational
Ratio of
Student
Instr. Exp.
To All Exp.
Student
Academic
Achievement
Student
Instructional
Support
Overhead
and
Operational Nonoperational
Ratio of
Student
Instr. Exp.
To All Exp.
Change in
Ratio 1997
to 2007
Change in
Ratio 2006
to 2007
Statewide 58.0% 5.2% 21.1% 15.7% 63.2% 54.3% 6.4% 21.3% 18.0% 60.6% 54.9% 6.6% 21.2% 17.3% 61.4% -1.8% 0.8%
21st Century Charter Sch of Gary (9545) 40.4% 14.1% 29.8% 15.8% 54.4% 46.6% 18.4% 22.5% 12.5% 65.0% 10.5%
21st Century Charter School (9370) 47.0% 12.4% 35.2% 5.5% 59.4% 56.8% 6.5% 29.4% 7.4% 63.3% 3.9%
21st Century Fountain Square (9480) 38.4% 18.0% 27.7% 15.9% 56.4% 50.0% 15.9% 25.3% 8.8% 65.9% 9.5%
Adams Central Community Schools (0015) 57.8% 5.5% 23.1% 13.6% 63.3% 57.5% 6.8% 25.4% 10.3% 64.3% 52.3% 6.2% 20.2% 21.3% 58.6% -4.8% -5.7%
Alexandria Com School Corp (5265) 66.6% 7.5% 20.5% 5.4% 74.1% 66.1% 8.1% 17.5% 8.2% 74.2% 65.1% 9.1% 15.6% 10.3% 74.1% 0.0% -0.1%
Anderson Community School Corp (5275) 66.1% 5.6% 19.5% 8.8% 71.7% 37.4% 3.1% 28.3% 31.2% 40.5% 56.9% 4.9% 19.2% 19.0% 61.8% -9.9% 21.3%
Andrew J Brown Academy (9615) 100.0% 0.0% 0.0% 0.0% 100.0% 73.4% 9.6% 17.0% 0.0% 83.0% -17.0%
Argos Community Schools (5470) 60.2% 5.3% 16.7% 17.8% 65.5% 56.8% 4.9% 21.6% 16.7% 61.7% 58.1% 5.5% 20.8% 15.6% 63.5% -1.9% 1.9%
Attica Consolidated Sch Corp (2435) 65.7% 5.9% 21.6% 6.7% 71.7% 57.5% 5.3% 18.8% 18.4% 62.8% 56.6% 6.1% 18.9% 18.4% 62.7% -9.0% -0.1%
Avon Community School Corp (3315) 49.0% 3.5% 20.5% 26.9% 52.6% 44.5% 4.1% 27.9% 23.5% 48.6% 46.0% 4.5% 25.4% 24.1% 50.5% -2.1% 1.9%
Barr-Reeve Com Schools Inc (1315) 61.7% 7.4% 18.9% 12.0% 69.1% 61.0% 8.3% 18.4% 12.3% 69.3% 60.7% 8.5% 18.2% 12.6% 69.1% 0.0% -0.1%
Bartholomew Con School Corp (0365) 54.1% 4.7% 17.2% 23.9% 58.8% 54.5% 8.5% 20.5% 16.5% 63.0% 55.6% 7.8% 22.4% 14.2% 63.4% 4.5% 2.0%
Batesville Community Sch Corp (6895) 61.3% 4.6% 19.4% 14.7% 65.9% 59.5% 4.5% 22.8% 13.2% 64.0% 60.1% 4.9% 21.6% 13.4% 65.0% -0.9% 1.1%
Baugo Community Schools (2260) 54.9% 4.0% 24.3% 16.7% 59.0% 52.9% 3.4% 21.4% 22.3% 56.3% 49.0% 3.7% 23.7% 23.6% 52.7% -6.3% -3.6%
Beech Grove City Schools (5380) 52.3% 4.2% 19.3% 24.2% 56.5% 56.1% 8.8% 20.4% 14.8% 64.9% 56.0% 8.5% 18.9% 16.7% 64.5% 8.0% -0.4%
Benton Community School Corp (0395) 59.1% 5.1% 26.5% 9.3% 64.2% 47.0% 5.4% 22.1% 25.6% 52.4% 49.6% 5.0% 19.0% 26.3% 54.7% -9.5% 2.3%
Blackford County Schools (0515) 65.4% 5.4% 23.4% 5.8% 70.8% 57.3% 7.2% 19.8% 15.6% 64.6% 55.6% 7.8% 20.2% 16.5% 63.3% -7.5% -1.2%
Bloomfield School District (2920) 57.5% 3.7% 19.2% 19.6% 61.2% 56.3% 4.4% 19.4% 19.9% 60.7% 59.3% 4.2% 20.8% 15.6% 63.5% 2.3% 2.9%
Blue River Valley Schools (3405) 60.4% 6.3% 19.7% 13.6% 66.7% 61.5% 6.4% 22.1% 10.0% 67.9% 60.1% 6.0% 20.0% 13.8% 66.1% -0.6% -1.8%
Bremen Public Schools (5480) 52.6% 4.0% 18.9% 24.5% 56.6% 54.7% 7.2% 20.4% 17.7% 61.9% 48.5% 6.3% 16.8% 28.4% 54.8% -1.7% -7.1%
Brown County School Corporation (0670) 60.7% 5.2% 22.8% 11.3% 65.9% 51.5% 9.2% 25.4% 13.9% 60.7% 54.0% 7.8% 25.7% 12.5% 61.8% -4.1% 1.1%
Brownsburg Community Sch Corp (3305) 51.5% 3.1% 18.8% 26.6% 54.6% 44.9% 4.9% 18.7% 31.6% 49.8% 49.5% 5.7% 19.2% 25.6% 55.2% 0.6% 5.4%
Brownstown Cnt Com Sch Corp (3695) 63.9% 5.6% 21.2% 9.3% 69.5% 59.8% 6.5% 22.4% 11.3% 66.3% 59.8% 5.6% 22.4% 12.2% 65.4% -4.1% -0.9%
C A Beard Memorial School Corp (3455) 61.7% 5.2% 23.0% 10.1% 66.9% 54.8% 5.0% 23.1% 17.1% 59.8% 54.1% 6.2% 25.7% 14.0% 60.3% -6.6% 0.5%
Campagna Academy Charter School (9300) 66.3% 15.6% 16.6% 1.5% 81.9% 54.8% 14.4% 25.2% 5.7% 69.1% -12.7%
Cannelton City Schools (6340) 73.7% 9.2% 15.0% 2.1% 82.9% 64.9% 18.5% 15.5% 1.0% 83.4% 63.1% 18.3% 16.5% 1.9% 81.4% -1.4% -1.9%
Carmel Clay Schools (3060) 53.0% 3.2% 20.0% 23.9% 56.2% 49.0% 3.4% 20.2% 27.5% 52.3% 51.2% 3.5% 21.3% 23.9% 54.8% -1.4% 2.4%
Carroll Consolidated Sch Corp (0750) 53.3% 4.1% 18.6% 24.0% 57.4% 55.1% 26.6% 17.3% 1.0% 81.7% 48.6% 10.1% 21.3% 20.1% 58.6% 1.2% -23.1%
Cass Township Schools (4770) 73.4% 2.0% 17.1% 7.4% 75.5% 73.5% 5.4% 20.9% 0.3% 78.9% 74.2% 5.7% 19.0% 1.2% 79.9% 4.4% 1.0%
Caston School Corporation (2650) 60.7% 5.9% 25.5% 7.9% 66.6% 53.7% 7.3% 23.6% 15.3% 61.1% 54.6% 7.6% 24.9% 12.9% 62.2% -4.4% 1.1%
Center Grove Com Sch Corp (4205) 58.3% 4.3% 20.2% 17.2% 62.5% 49.9% 8.1% 19.9% 22.1% 58.0% 45.6% 8.5% 19.6% 26.2% 54.2% -8.4% -3.8%
Centerville-Abington Com Schs (8360) 59.9% 4.0% 23.4% 12.7% 63.9% 53.5% 4.6% 25.5% 16.4% 58.1% 55.3% 5.3% 25.0% 14.3% 60.7% -3.2% 2.6%
Central Noble Com School Corp (6055) 54.6% 9.2% 22.7% 13.5% 63.8% 57.7% 6.1% 23.6% 12.6% 63.8% 57.0% 6.2% 24.3% 12.5% 63.2% -0.6% -0.6%
Challenge Foundation Academy (9645) 15.3% 47.7% 16.2% 20.7% 63.0% 55.2% 10.3% 20.8% 13.7% 65.5% 2.5%
Charles A Tindley Accelerated Schl (9445) 46.8% 17.7% 26.1% 9.4% 64.5% 52.1% 13.5% 24.2% 10.3% 65.5% 1.0%
Charter School of the Dunes (9310) 45.4% 3.5% 41.1% 6.6% 48.9% 43.0% 5.7% 40.5% 7.3% 48.8% -0.1%
Christel House Academy (9380) 50.2% 11.5% 36.2% 2.0% 61.8% 50.9% 5.0% 42.9% 1.1% 56.0% -5.8%
Expenditures FY 2007Expenditures FY 2006Expenditures FY 1997
8Office of Management and Budget
June 3, 2008

Progress of School Corporations in Improving the Ratio of Instructional Expenditures
School Corporation
Student
Academic
Achievement
Student
Instructional
Support
Overhead
and
Operational Nonoperational
Ratio of
Student
Instr. Exp.
To All Exp.
Student
Academic
Achievement
Student
Instructional
Support
Overhead
and
Operational Nonoperational
Ratio of
Student
Instr. Exp.
To All Exp.
Student
Academic
Achievement
Student
Instructional
Support
Overhead
and
Operational Nonoperational
Ratio of
Student
Instr. Exp.
To All Exp.
Change in
Ratio 1997
to 2007
Change in
Ratio 2006
to 2007
Expenditures FY 2007Expenditures FY 2006Expenditures FY 1997
Clark-Pleasant Com School Corp (4145) 55.9% 3.0% 18.5% 22.6% 58.9% 38.3% 3.5% 33.1% 25.1% 41.8% 38.4% 3.9% 28.3% 29.4% 42.2% -16.7% 0.4%
Clarksville Com School Corp (1000) 53.1% 3.6% 19.5% 23.8% 56.7% 56.2% 5.5% 19.0% 19.3% 61.7% 51.5% 5.1% 17.8% 25.5% 56.7% -0.1% -5.1%
Clay Community Schools (1125) 46.6% 3.3% 16.9% 33.3% 49.9% 55.7% 5.2% 23.2% 16.0% 60.8% 55.3% 4.8% 23.4% 16.6% 60.1% 10.2% -0.8%
Clinton Central School Corp (1150) 61.8% 3.6% 24.7% 10.0% 65.4% 58.8% 4.5% 26.1% 10.6% 63.3% 54.2% 4.7% 21.1% 20.0% 58.9% -6.5% -4.5%
Clinton Prairie School Corp (1160) 53.0% 4.2% 23.0% 19.8% 57.2% 49.7% 4.1% 22.7% 23.5% 53.8% 48.7% 4.2% 23.9% 23.3% 52.9% -4.3% -0.9%
Cloverdale Community Schools (6750) 57.9% 6.6% 20.5% 13.3% 64.5% 48.9% 5.6% 28.5% 16.9% 54.6% 52.7% 6.1% 20.5% 20.7% 58.8% -6.8% 4.2%
Community Montessori Inc (9320) 16.1% 4.7% 12.4% 66.8% 20.8% 40.7% 12.2% 36.5% 10.7% 52.8% 32.1%
Community Schools of Frankfort (1170) 62.6% 4.4% 19.3% 13.7% 67.0% 56.8% 5.9% 19.3% 18.0% 62.7% 59.2% 6.1% 18.7% 16.0% 65.3% -1.7% 2.6%
Concord Community Schools (2270) 40.2% 3.8% 16.9% 39.1% 44.0% 57.6% 5.1% 18.2% 19.1% 62.7% 49.7% 5.4% 20.2% 24.7% 55.1% 11.1% -7.6%
Covington Community Sch Corp (2440) 61.1% 5.1% 21.9% 11.9% 66.2% 50.9% 8.1% 21.8% 19.2% 59.0% 57.3% 8.5% 22.8% 11.4% 65.8% -0.4% 6.8%
Cowan Community School Corp (1900) 54.6% 6.2% 22.1% 17.1% 60.8% 41.8% 6.2% 16.6% 35.4% 48.0% 46.6% 7.0% 16.6% 29.9% 53.6% -7.3% 5.6%
Crawford Co Com School Corp (1300) 65.4% 3.4% 20.7% 10.5% 68.8% 61.7% 4.0% 19.7% 14.5% 65.7% 63.0% 3.4% 17.2% 16.5% 66.4% -2.4% 0.7%
Crawfordsville Com Schools (5855) 54.0% 4.5% 22.3% 19.1% 58.6% 48.5% 6.5% 24.7% 20.4% 55.0% 49.0% 6.7% 26.1% 18.1% 55.8% -2.8% 0.8%
Crothersville Community Schools (3710) 67.8% 5.9% 22.0% 4.3% 73.7% 57.0% 5.7% 19.3% 18.0% 62.7% 57.0% 5.7% 18.7% 18.6% 62.7% -10.9% 0.0%
Crown Point Community Sch Corp (4660) 59.1% 3.6% 27.9% 9.4% 62.7% 49.7% 3.2% 22.9% 24.1% 52.9% 48.2% 3.5% 22.1% 26.2% 51.7% -11.0% -1.2%
Culver Community Schools Corp (5455) 65.6% 5.4% 23.1% 5.9% 71.0% 53.8% 5.3% 21.8% 19.2% 59.1% 54.7% 5.3% 23.1% 16.9% 60.0% -11.0% 1.0%
Daleville Community Schools (1940) 52.8% 5.6% 23.7% 17.8% 58.5% 49.7% 6.7% 32.1% 11.5% 56.4% 51.8% 7.9% 26.9% 13.4% 59.7% 1.2% 3.3%
Danville Community School Corp (3325) 56.2% 4.2% 26.4% 13.3% 60.3% 48.1% 6.3% 23.9% 21.7% 54.4% 46.0% 6.0% 22.6% 25.5% 51.9% -8.4% -2.5%
Decatur County Com Schools (1655) 65.4% 5.0% 21.0% 8.6% 70.4% 62.0% 5.8% 22.2% 10.0% 67.8% 61.7% 6.0% 21.3% 10.9% 67.8% -2.6% -0.1%
Decatur Discovery Academy Inc (9525) 60.9% 16.3% 6.3% 16.5% 77.1% 69.6% 8.5% 8.8% 13.1% 78.1% 1.0%
DeKalb Co Ctl United Sch Dist (1835) 58.7% 4.6% 20.2% 16.5% 63.3% 56.4% 7.1% 19.2% 17.3% 63.5% 55.9% 8.9% 18.4% 16.8% 64.8% 1.5% 1.3%
DeKalb Co Eastern Com Sch Dist (1805) 52.8% 4.8% 19.6% 22.8% 57.6% 54.5% 7.6% 20.7% 17.1% 62.2% 56.1% 8.4% 20.6% 14.9% 64.5% 6.8% 2.3%
Delaware Community School Corp (1875) 54.8% 4.2% 18.9% 22.0% 59.0% 53.9% 4.8% 25.2% 16.2% 58.7% 53.8% 4.9% 24.3% 17.0% 58.7% -0.4% 0.0%
Delphi Community School Corp (0755) 45.9% 4.1% 19.4% 26.6% 50.0% 51.5% 5.0% 20.0% 23.5% 56.5% 53.2% 5.7% 21.2% 19.9% 58.9% 6.8% 2.3%
Dewey Township Schools (4790) 74.1% 3.1% 22.7% 0.1% 77.2% 73.5% 7.8% 18.3% 0.4% 81.3% 68.0% 11.2% 20.1% 0.7% 79.2% 1.9% -2.1%
Duneland School Corporation (6470) 56.9% 4.3% 25.9% 12.9% 61.3% 51.5% 4.7% 25.1% 18.8% 56.1% 55.7% 4.2% 22.6% 17.4% 60.0% -1.3% 3.8%
East Allen County Schools (0255) 62.9% 3.9% 23.1% 10.1% 66.8% 60.7% 5.4% 21.7% 12.1% 66.2% 63.3% 5.1% 22.3% 9.3% 68.4% 1.6% 2.2%
East Chicago Lighthouse Charter (9595) 36.4% 55.4% 4.4% 3.9% 91.7% 50.8% 17.4% 32.0% -0.2% 68.2% -23.5%
East Chicago Urban Enterprise Acad (9555) 30.9% 4.7% 9.5% 54.9% 35.6% 66.4% 9.7% 23.2% 0.6% 76.1% 40.5%
East Gibson School Corporation (2725) 49.5% 2.5% 18.0% 29.9% 52.1% 57.2% 2.8% 24.9% 15.1% 60.0% 59.3% 2.9% 25.6% 12.2% 62.2% 10.1% 2.2%
East Noble School Corp (6060) 59.6% 5.1% 19.8% 15.5% 64.7% 53.3% 9.6% 20.5% 16.6% 62.9% 53.2% 9.8% 20.5% 16.4% 63.0% -1.7% 0.1%
East Porter County School Corp (6510) 63.7% 6.0% 21.4% 8.9% 69.8% 50.5% 4.8% 21.5% 23.2% 55.3% 50.7% 4.3% 21.5% 23.6% 55.0% -14.8% -0.3%
East Washington School Corp (8215) 66.1% 6.7% 17.6% 9.6% 72.7% 62.1% 9.0% 17.0% 11.9% 71.1% 63.2% 7.8% 17.7% 11.2% 71.1% -1.7% 0.0%
Eastbrook Community Sch Corp (2815) 61.0% 5.1% 23.9% 10.0% 66.1% 59.9% 7.6% 20.1% 12.4% 67.5% 60.1% 6.8% 20.1% 13.0% 66.8% 0.7% -0.6%
Eastern Greene Schools (2940) 67.5% 6.6% 24.2% 1.7% 74.1% 59.0% 6.4% 25.5% 9.1% 65.4% 40.3% 4.5% 17.4% 37.8% 44.8% -29.3% -20.7%
Eastern Hancock Co Com Sch Corp (3145) 44.6% 2.3% 21.1% 32.0% 46.8% 55.1% 4.9% 25.6% 14.5% 60.0% 55.0% 4.7% 25.8% 14.5% 59.7% 12.9% -0.2%
Eastern Howard School Corp (3480) 57.5% 3.7% 19.5% 19.3% 61.2% 51.3% 5.9% 21.6% 21.2% 57.2% 48.0% 6.4% 20.5% 25.0% 54.5% -6.7% -2.7%
Eastern Pulaski Com Sch Corp (6620) 61.3% 4.1% 21.3% 13.3% 65.4% 58.4% 5.0% 18.3% 18.3% 63.4% 58.2% 5.5% 24.5% 11.6% 63.7% -1.5% 0.4%
9Office of Management and Budget
June 3, 2008

Progress of School Corporations in Improving the Ratio of Instructional Expenditures
School Corporation
Student
Academic
Achievement
Student
Instructional
Support
Overhead
and
Operational Nonoperational
Ratio of
Student
Instr. Exp.
To All Exp.
Student
Academic
Achievement
Student
Instructional
Support
Overhead
and
Operational Nonoperational
Ratio of
Student
Instr. Exp.
To All Exp.
Student
Academic
Achievement
Student
Instructional
Support
Overhead
and
Operational Nonoperational
Ratio of
Student
Instr. Exp.
To All Exp.
Change in
Ratio 1997
to 2007
Change in
Ratio 2006
to 2007
Expenditures FY 2007Expenditures FY 2006Expenditures FY 1997
Edinburgh Community Sch Corp (4215) 68.0% 7.4% 16.9% 7.7% 75.4% 59.1% 7.0% 16.6% 17.3% 66.1% 62.3% 7.7% 16.8% 13.1% 70.0% -5.4% 3.9%
Elkhart Community Schools (2305) 56.5% 6.0% 20.3% 17.2% 62.5% 58.5% 8.5% 20.4% 12.6% 67.0% 60.1% 6.6% 17.4% 15.8% 66.7% 4.2% -0.3%
Elwood Community School Corp (5280) 61.9% 5.0% 19.5% 13.5% 66.9% 56.7% 6.0% 20.5% 16.7% 62.8% 58.2% 7.3% 20.2% 14.2% 65.5% -1.4% 2.8%
Eminence Community School Corp (5910) 59.9% 3.7% 27.9% 8.5% 63.6% 56.8% 5.3% 22.6% 15.3% 62.1% 56.2% 4.9% 24.4% 14.5% 61.1% -2.5% -1.0%
Evansville-Vanderburgh Sch Corp (7995) 60.3% 5.5% 22.5% 11.7% 65.8% 60.3% 6.4% 18.8% 14.4% 66.7% 56.2% 7.7% 21.0% 15.1% 63.9% -1.9% -2.8%
Fairfield Community Schools (2155) 63.1% 4.1% 21.9% 10.9% 67.2% 50.7% 3.7% 18.9% 26.7% 54.4% 55.5% 3.7% 20.6% 20.1% 59.2% -8.0% 4.8%
Fayette County School Corp (2395) 66.3% 3.9% 21.7% 8.2% 70.1% 59.9% 7.5% 24.1% 8.6% 67.3% 62.8% 7.8% 22.5% 6.9% 70.6% 0.5% 3.3%
Flanner House Elementary School (9390) 64.6% 7.5% 27.9% 0.0% 72.1% 59.1% 10.7% 30.1% 0.1% 69.9% -2.3%
Flat Rock-Hawcreek School Corp (0370) 65.4% 4.1% 19.4% 11.1% 69.5% 63.7% 3.8% 19.0% 13.6% 67.5% 65.4% 3.7% 21.8% 9.1% 69.1% -0.4% 1.6%
Fort Wayne Community Schools (0235) 63.0% 6.2% 21.4% 9.3% 69.3% 62.8% 7.7% 19.5% 9.9% 70.6% 62.5% 7.9% 19.4% 10.2% 70.4% 1.1% -0.2%
Franklin Community School Corp (4225) 56.3% 4.0% 23.2% 16.5% 60.2% 53.7% 3.6% 22.1% 20.6% 57.3% 49.3% 3.6% 21.6% 25.5% 52.9% -7.4% -4.4%
Franklin County Com Sch Corp (2475) 61.5% 4.0% 23.4% 11.2% 65.4% 60.1% 5.3% 22.2% 12.4% 65.4% 62.0% 4.9% 21.3% 11.8% 66.9% 1.5% 1.5%
Franklin Township Com Sch Corp (5310) 58.5% 6.0% 22.3% 13.2% 64.5% 42.9% 6.1% 19.6% 31.4% 49.0% 44.6% 6.3% 19.2% 29.9% 50.9% -13.6% 1.9%
Frankton-Lapel Community Schs (5245) 58.9% 4.4% 20.5% 16.2% 63.3% 53.5% 5.0% 22.8% 18.7% 58.5% 53.8% 5.6% 22.6% 18.0% 59.4% -3.9% 0.9%
Fremont Community Schools (7605) 49.7% 4.2% 21.0% 25.1% 53.9% 52.7% 5.5% 19.9% 22.0% 58.2% 55.2% 5.5% 19.9% 19.5% 60.7% 6.8% 2.5%
Frontier School Corporation (8525) 51.6% 5.6% 18.8% 24.0% 57.2% 54.4% 7.4% 18.3% 19.9% 61.8% 54.0% 7.2% 17.9% 21.0% 61.2% 4.0% -0.6%
Galileo Charter School (9565) 37.6% 6.3% 15.5% 40.6% 43.9% 63.7% 9.5% 24.5% 2.2% 73.2% 29.3%
Garrett-Keyser-Butler Com (1820) 62.3% 5.5% 21.6% 10.7% 67.7% 60.2% 6.4% 21.8% 11.6% 66.6% 58.5% 6.6% 20.6% 14.3% 65.1% -2.7% -1.5%
Gary Community School Corp (4690) 64.3% 8.1% 23.4% 4.1% 72.4% 54.1% 8.8% 27.4% 9.7% 62.9% 57.1% 8.7% 28.2% 6.0% 65.8% -6.7% 2.9%
Gary Lighthouse Charter School (9535) 36.5% 16.1% 29.8% 17.6% 52.6% 39.8% 12.2% 34.0% 14.0% 52.0% -0.6%
Goodwill Education Initiatives II (9475) 58.9% 6.9% 12.4% 21.8% 65.8% 73.1% 13.5% 9.2% 4.1% 86.7% 20.9%
Goodwill Education Initiatives Inc (9470) 58.4% 7.6% 10.9% 23.1% 66.1% 72.9% 12.5% 9.6% 5.0% 85.4% 19.4%
Goshen Community Schools (2315) 61.2% 5.4% 18.8% 14.6% 66.6% 62.3% 4.6% 17.8% 15.3% 66.9% 61.7% 4.8% 17.1% 16.3% 66.6% 0.0% -0.3%
Greater Clark County Schools (1010) 62.3% 4.2% 20.3% 10.7% 66.5% 64.2% 6.9% 19.3% 8.7% 71.1% 62.9% 6.1% 19.7% 10.3% 69.0% 1.6% -2.0%
Greater Jasper Con Schs (2120) 62.9% 5.3% 16.8% 15.0% 68.2% 59.9% 4.7% 15.9% 19.4% 64.6% 58.0% 5.0% 16.7% 20.3% 63.0% -5.2% -1.6%
Greencastle Community Sch Corp (6755) 56.6% 5.7% 20.9% 16.9% 62.2% 48.2% 8.2% 22.5% 21.1% 56.4% 49.3% 8.8% 23.6% 18.3% 58.1% -4.2% 1.7%
Greenfield-Central Com Schools (3125) 45.8% 2.9% 13.9% 37.5% 48.6% 58.5% 4.6% 19.1% 17.8% 63.1% 50.7% 7.5% 18.6% 23.3% 58.1% 9.5% -5.0%
Greensburg Community Schools (1730) 66.3% 4.9% 20.7% 8.1% 71.2% 53.7% 6.0% 24.7% 15.5% 59.7% 52.1% 6.5% 23.2% 18.3% 58.6% -12.6% -1.1%
Greenwood Community Sch Corp (4245) 59.5% 3.1% 19.2% 18.2% 62.6% 59.3% 3.5% 18.8% 18.4% 62.8% 59.6% 3.6% 19.8% 17.0% 63.2% 0.6% 0.4%
Griffith Public Schools (4700) 66.0% 4.1% 19.3% 10.7% 70.1% 59.0% 3.3% 17.9% 19.9% 62.2% 53.0% 4.0% 20.4% 22.5% 57.0% -13.0% -5.2%
Hamilton Community Schools (7610) 60.7% 8.7% 20.9% 9.8% 69.3% 55.7% 9.4% 24.0% 10.8% 65.1% 51.4% 8.5% 21.8% 18.2% 60.0% -9.4% -5.1%
Hamilton Heights School Corp (3025) 55.9% 4.1% 21.2% 18.8% 60.0% 49.8% 6.5% 22.1% 21.5% 56.3% 49.3% 5.4% 24.0% 21.3% 54.8% -5.2% -1.6%
Hamilton Southeastern Schools (3005) 46.7% 3.9% 17.2% 32.1% 50.7% 46.3% 6.0% 20.9% 26.8% 52.3% 47.1% 5.8% 21.5% 25.6% 52.9% 2.2% 0.6%
Hanover Community School Corp (4580) 36.2% 2.9% 12.0% 48.8% 39.1% 33.7% 3.6% 14.9% 47.8% 37.3% 45.3% 4.9% 20.9% 28.9% 50.2% 11.1% 12.9%
Herron Charter (9650) 10.2% 34.1% 4.2% 51.4% 44.4% 50.7% 16.3% 14.9% 18.1% 67.0% 22.6%
Hope Academy (9655) 82.3% 4.6% 10.0% 3.1% 86.9%
Huntington Co Com Sch Corp (3625) 65.6% 4.7% 22.4% 7.3% 70.3% 56.5% 9.1% 20.2% 14.2% 65.7% 58.2% 8.5% 21.8% 11.5% 66.6% -3.6% 1.0%
Indianapolis Public Schools (5385) 62.5% 7.1% 22.7% 7.7% 69.6% 54.3% 11.0% 20.4% 14.3% 65.3% 56.9% 10.5% 20.6% 12.1% 67.4% -2.2% 2.1%
10Office of Management and Budget
June 3, 2008

Progress of School Corporations in Improving the Ratio of Instructional Expenditures
School Corporation
Student
Academic
Achievement
Student
Instructional
Support
Overhead
and
Operational Nonoperational
Ratio of
Student
Instr. Exp.
To All Exp.
Student
Academic
Achievement
Student
Instructional
Support
Overhead
and
Operational Nonoperational
Ratio of
Student
Instr. Exp.
To All Exp.
Student
Academic
Achievement
Student
Instructional
Support
Overhead
and
Operational Nonoperational
Ratio of
Student
Instr. Exp.
To All Exp.
Change in
Ratio 1997
to 2007
Change in
Ratio 2006
to 2007
Expenditures FY 2007Expenditures FY 2006Expenditures FY 1997
Indpls Lighthouse Charter School (9575) 46.4% 3.7% 49.7% 0.2% 50.1% 27.0% 7.2% 21.8% 44.0% 34.2% -15.9%
Irvington Community School (9330) 49.2% 3.5% 17.0% 30.3% 52.8% 51.8% 3.7% 14.3% 30.2% 55.5% 2.8%
Jac-Cen-Del Community Sch Corp (6900) 57.8% 5.3% 22.7% 14.2% 63.1% 58.7% 6.0% 23.8% 11.5% 64.7% 60.5% 5.4% 21.2% 12.9% 65.9% 2.8% 1.2%
Jay School Corp (3945) 63.8% 4.0% 22.9% 9.2% 67.9% 59.1% 4.6% 22.1% 14.2% 63.7% 63.3% 5.9% 23.1% 7.7% 69.2% 1.3% 5.5%
Jennings County Schools (4015) 61.9% 5.5% 23.2% 9.4% 67.4% 58.0% 6.2% 24.0% 11.8% 64.2% 59.9% 6.6% 23.2% 10.2% 66.6% -0.8% 2.4%
John Glenn School Corporation (7150) 65.9% 4.7% 18.8% 10.6% 70.6% 46.3% 4.5% 15.2% 34.0% 50.8% 57.2% 5.5% 17.5% 19.7% 62.7% -7.9% 11.9%
Joshua Academy (9495) 64.4% 4.9% 25.4% 5.4% 69.3% 61.9% 5.3% 26.1% 6.7% 67.3% -2.0%
Kankakee Valley School Corp (3785) 59.8% 5.3% 19.9% 15.0% 65.0% 54.5% 6.9% 21.4% 17.2% 61.4% 56.6% 6.7% 21.9% 14.8% 63.3% -1.8% 1.9%
KIPP Indpls College Preparatory (9400) 50.4% 6.0% 22.7% 20.9% 56.4% 58.7% 6.3% 27.7% 7.3% 65.0% 8.6%
KIPP Lead College Prep Charter (9635) 64.1% 10.5% 21.5% 3.9% 74.6% 57.5% 2.7% 32.2% 7.6% 60.2% -14.4%
Knox Community School Corp (7525) 58.4% 7.2% 20.2% 14.2% 65.6% 60.2% 5.4% 20.8% 13.7% 65.5% 60.5% 3.9% 19.2% 16.4% 64.4% -1.2% -1.1%
Kokomo-Center Twp Con Sch Corp (3500) 57.3% 10.1% 19.7% 12.9% 67.4% 59.0% 9.5% 21.4% 10.1% 68.5% 59.6% 9.4% 20.7% 10.4% 69.0% 1.6% 0.5%
Lafayette School Corporation (7855) 57.5% 6.1% 16.2% 20.1% 63.6% 61.7% 8.3% 18.7% 11.4% 70.0% 61.7% 8.2% 19.1% 11.1% 69.9% 6.2% -0.1%
Lake Central School Corp (4615) 55.1% 3.1% 25.8% 16.0% 58.2% 59.6% 3.1% 23.6% 13.6% 62.7% 56.7% 2.7% 26.6% 14.0% 59.4% 1.3% -3.3%
Lake Ridge Schools (4650) 65.9% 4.4% 24.3% 5.5% 70.3% 53.1% 5.3% 20.5% 21.1% 58.4% 60.2% 6.7% 22.8% 10.3% 67.0% -3.3% 8.5%
Lake Station Community Schools (4680) 57.8% 5.5% 20.9% 15.7% 63.3% 58.4% 6.7% 25.6% 9.4% 65.0% 55.3% 7.1% 22.9% 14.7% 62.4% -1.0% -2.7%
Lakeland School Corporation (4535) 61.7% 3.9% 22.3% 12.1% 65.6% 56.7% 3.4% 21.6% 18.2% 60.2% 61.4% 3.6% 22.0% 13.0% 65.0% -0.6% 4.9%
Lanesville Community School Corp (3160) 57.0% 5.1% 19.2% 18.7% 62.1% 52.6% 7.2% 22.3% 18.0% 59.8% 55.5% 7.1% 21.5% 15.9% 62.6% 0.5% 2.8%
LaPorte Community School Corp (4945) 46.7% 3.7% 18.0% 31.6% 50.4% 49.1% 4.2% 18.7% 28.0% 53.3% 54.6% 4.9% 20.8% 19.7% 59.5% 9.1% 6.2%
Lawrence Early College HS for S&T (9660) 69.0% 3.8% 27.2% 0.0% 72.8%
Lawrenceburg Com School Corp (1620) 55.9% 4.9% 21.1% 18.1% 60.8% 51.3% 4.9% 23.5% 20.2% 56.2% 54.2% 5.7% 23.8% 16.3% 59.9% -0.9% 3.7%
Lebanon Community School Corp (0665) 52.2% 4.1% 21.3% 22.4% 56.3% 47.2% 6.0% 23.8% 23.1% 53.2% 46.9% 6.1% 23.3% 23.7% 53.0% -3.3% -0.1%
Liberty-Perry Com School Corp (1895) 55.3% 7.8% 19.5% 17.4% 63.1% 57.7% 7.0% 21.7% 13.6% 64.7% 59.8% 7.7% 21.9% 10.6% 67.5% 4.3% 2.8%
Linton-Stockton School Corp (2950) 69.7% 5.6% 18.2% 6.5% 75.3% 60.3% 6.7% 19.2% 13.8% 67.0% 61.0% 7.0% 19.7% 12.3% 68.0% -7.3% 1.0%
Logansport Community Sch Corp (0875) 61.6% 4.0% 19.7% 14.2% 65.6% 59.8% 3.8% 21.6% 14.4% 63.5% 59.4% 4.3% 21.7% 14.3% 63.6% -2.1% 0.1%
Loogootee Community Sch Corp (5525) 68.1% 3.8% 18.3% 9.8% 71.9% 68.4% 5.1% 19.3% 7.3% 73.4% 69.1% 7.3% 19.4% 4.3% 76.3% 4.4% 2.9%
M S D Bluffton-Harrison (8445) 63.4% 5.1% 21.9% 9.6% 68.5% 57.6% 5.8% 21.1% 15.5% 63.4% 57.8% 4.9% 21.4% 15.9% 62.7% -5.8% -0.8%
M S D Boone Township (6460) 67.2% 5.0% 17.4% 10.5% 72.2% 33.8% 2.7% 15.6% 47.9% 36.5% 46.5% 3.8% 20.8% 28.8% 50.3% -21.9% 13.8%
M S D Decatur Township (5300) 55.3% 5.9% 20.5% 18.4% 61.2% 53.3% 6.9% 26.6% 13.2% 60.2% 49.6% 6.6% 25.0% 18.8% 56.2% -5.0% -4.0%
M S D Lawrence Township (5330) 55.4% 6.2% 16.5% 22.0% 61.5% 54.5% 4.9% 17.6% 23.0% 59.4% 55.7% 3.9% 19.4% 21.0% 59.6% -1.9% 0.2%
M S D Martinsville Schools (5925) 61.7% 5.3% 22.2% 10.8% 67.0% 56.0% 6.4% 26.7% 11.0% 62.4% 58.4% 6.7% 24.8% 10.2% 65.1% -2.0% 2.7%
M S D Mount Vernon (6590) 55.2% 4.5% 21.3% 19.0% 59.7% 52.5% 4.8% 23.3% 19.4% 57.2% 51.2% 4.9% 23.1% 20.8% 56.1% -3.6% -1.1%
M S D North Posey Co Schools (6600) 61.5% 3.1% 17.5% 17.8% 64.6% 59.7% 6.0% 17.5% 16.8% 65.7% 58.8% 5.9% 17.3% 18.0% 64.7% 0.1% -1.0%
M S D of New Durham Township (4860) 66.4% 7.4% 25.3% 0.8% 73.9% 54.6% 12.2% 18.2% 15.0% 66.8% 49.4% 12.6% 20.5% 17.5% 62.0% -11.9% -4.8%
M S D Perry Township (5340) 56.3% 5.6% 19.2% 18.8% 61.9% 52.4% 7.1% 21.6% 18.9% 59.5% 54.3% 6.9% 21.7% 17.2% 61.2% -0.7% 1.7%
M S D Pike Township (5350) 48.2% 5.1% 18.8% 27.9% 53.3% 52.4% 7.9% 18.6% 21.2% 60.3% 45.8% 10.0% 17.5% 26.8% 55.7% 2.4% -4.6%
M S D Shakamak Schools (2960) 63.9% 4.8% 18.2% 13.2% 68.7% 64.6% 6.9% 19.8% 8.7% 71.5% 68.5% 5.3% 18.3% 7.8% 73.8% 5.2% 2.3%
M S D Southwest Allen County (0125) 55.4% 5.4% 18.1% 21.2% 60.8% 52.6% 5.5% 17.4% 24.5% 58.0% 54.3% 6.4% 16.3% 23.0% 60.7% 0.0% 2.7%
11Office of Management and Budget
June 3, 2008

Progress of School Corporations in Improving the Ratio of Instructional Expenditures
School Corporation
Student
Academic
Achievement
Student
Instructional
Support
Overhead
and
Operational Nonoperational
Ratio of
Student
Instr. Exp.
To All Exp.
Student
Academic
Achievement
Student
Instructional
Support
Overhead
and
Operational Nonoperational
Ratio of
Student
Instr. Exp.
To All Exp.
Student
Academic
Achievement
Student
Instructional
Support
Overhead
and
Operational Nonoperational
Ratio of
Student
Instr. Exp.
To All Exp.
Change in
Ratio 1997
to 2007
Change in
Ratio 2006
to 2007
Expenditures FY 2007Expenditures FY 2006Expenditures FY 1997
M S D Steuben County (7615) 51.5% 6.5% 22.1% 19.9% 58.0% 47.3% 7.2% 22.8% 22.7% 54.4% 48.1% 8.5% 20.9% 22.5% 56.6% -1.4% 2.1%
M S D Wabash County Schools (8050) 66.6% 4.4% 18.4% 10.7% 70.9% 62.0% 6.8% 17.5% 13.7% 68.8% 62.9% 6.7% 17.5% 12.9% 69.6% -1.3% 0.8%
M S D Warren County (8115) 57.1% 3.5% 21.6% 17.8% 60.6% 55.6% 5.4% 24.9% 14.1% 60.9% 52.6% 5.0% 27.8% 14.6% 57.6% -3.0% -3.4%
M S D Warren Township (5360) 58.2% 8.4% 22.4% 11.0% 66.6% 50.5% 8.7% 20.7% 20.1% 59.2% 48.3% 8.1% 18.6% 25.0% 56.4% -10.2% -2.8%
M S D Washington Township (5370) 52.4% 7.9% 21.8% 17.9% 60.3% 60.2% 7.5% 22.2% 10.1% 67.7% 56.7% 9.3% 21.2% 12.8% 66.0% 5.7% -1.8%
M S D Wayne Township (5375) 60.1% 4.5% 26.3% 9.1% 64.7% 51.5% 5.5% 18.4% 24.6% 57.0% 48.2% 5.3% 19.9% 26.6% 53.5% -11.2% -3.5%
Maconaquah School Corp (5615) 61.2% 6.0% 21.2% 11.7% 67.1% 56.8% 7.5% 19.9% 15.8% 64.3% 58.7% 8.0% 20.8% 12.5% 66.6% -0.5% 2.3%
Madison Consolidated Schools (3995) 62.6% 5.3% 19.9% 12.1% 67.9% 58.9% 5.9% 17.6% 17.6% 64.8% 52.4% 14.2% 16.5% 16.8% 66.6% -1.3% 1.8%
Madison-Grant United Sch Corp (2825) 62.8% 3.8% 23.0% 10.5% 66.5% 66.1% 4.2% 19.3% 10.3% 70.4% 62.9% 5.6% 19.5% 12.0% 68.5% 1.9% -1.9%
Manchester Community Schools (8045) 53.0% 4.5% 18.0% 24.5% 57.5% 53.7% 4.7% 22.1% 19.5% 58.4% 51.6% 4.5% 23.7% 20.2% 56.1% -1.4% -2.3%
Marion Community Schools (2865) 63.5% 6.0% 24.0% 6.4% 69.5% 58.6% 5.5% 23.0% 12.9% 64.1% 60.7% 6.4% 23.5% 9.4% 67.1% -2.4% 3.0%
Medora Community School Corp (3640) 65.6% 6.6% 12.4% 15.5% 72.2% 62.1% 7.6% 16.1% 14.2% 69.7% 64.4% 7.5% 14.3% 13.8% 71.9% -0.3% 2.1%
Merrillville Community School (4600) 50.9% 2.7% 23.2% 23.2% 53.6% 45.9% 6.0% 19.9% 28.2% 52.0% 46.2% 6.1% 20.2% 27.5% 52.3% -1.3% 0.3%
Michigan City Area Schools (4925) 61.0% 4.8% 21.8% 12.4% 65.8% 54.7% 6.7% 25.4% 13.3% 61.4% 52.6% 7.2% 24.1% 16.2% 59.7% -6.1% -1.6%
Middlebury Community Schools (2275) 54.4% 4.2% 23.5% 18.0% 58.5% 50.6% 4.1% 26.8% 18.5% 54.8% 51.6% 4.3% 27.8% 16.3% 55.9% -2.7% 1.1%
Milan Community Schools (6910) 60.0% 5.7% 22.5% 11.7% 65.8% 61.7% 7.2% 22.1% 9.0% 68.9% 61.5% 5.6% 23.5% 9.4% 67.1% 1.3% -1.8%
Mill Creek Community Sch Corp (3335) 43.7% 4.1% 18.9% 33.3% 47.8% 32.6% 3.9% 14.9% 48.6% 36.5% 44.7% 5.8% 20.3% 29.2% 50.5% 2.7% 14.0%
Mississinewa Community School Corp (2855) 67.2% 5.3% 20.4% 7.2% 72.4% 66.0% 6.5% 16.1% 11.5% 72.4% 66.3% 6.8% 17.3% 9.6% 73.1% 0.7% 0.7%
Mitchell Community Schools (5085) 62.1% 3.0% 21.7% 13.2% 65.1% 44.0% 3.7% 14.6% 37.7% 47.7% 57.0% 3.9% 18.9% 20.2% 60.9% -4.2% 13.2%
Monroe Central School Corp (6820) 62.3% 3.8% 21.9% 12.0% 66.2% 64.1% 5.3% 19.9% 10.6% 69.5% 62.7% 5.1% 21.7% 10.4% 67.9% 1.7% -1.6%
Monroe County Com Sch Corp (5740) 49.6% 5.7% 19.7% 25.0% 55.2% 51.8% 7.1% 24.5% 16.7% 58.9% 54.9% 7.2% 24.3% 13.5% 62.2% 6.9% 3.3%
Monroe-Gregg School District (5900) 58.5% 4.6% 23.8% 13.1% 63.0% 41.9% 4.9% 20.4% 32.8% 46.8% 43.2% 5.5% 20.8% 30.4% 48.8% -14.3% 1.9%
Montessori Academy @ Geist (9665) 8.2% 0.0% 91.8% 0.0% 8.2% 57.7% 8.7% 22.2% 11.4% 66.4% 58.2%
Mooresville Con School Corp (5930) 56.7% 4.5% 19.8% 19.1% 61.1% 54.5% 5.1% 24.5% 15.9% 59.6% 55.2% 5.0% 24.5% 15.4% 60.1% -1.0% 0.6%
Mt Pleasant Twp Com Sch Corp (1910) 58.1% 5.1% 22.9% 13.9% 63.2% 50.9% 5.7% 23.7% 19.8% 56.5% 52.1% 5.6% 23.7% 18.6% 57.6% -5.6% 1.1%
Mt Vernon Community Sch Corp (3135) 51.9% 3.7% 20.9% 23.5% 55.6% 52.4% 4.6% 23.0% 20.0% 57.0% 56.3% 4.6% 20.9% 18.2% 60.8% 5.2% 3.8%
Muncie Community Schools (1970) 58.2% 6.0% 27.2% 8.6% 64.2% 53.6% 5.7% 30.2% 10.5% 59.3% 51.8% 6.4% 17.6% 24.2% 58.2% -6.0% -1.1%
Nettle Creek School Corp (8305) 63.2% 5.0% 22.6% 9.1% 68.2% 56.5% 5.9% 23.2% 14.5% 62.4% 58.7% 6.7% 22.5% 12.0% 65.4% -2.8% 3.0%
New Albany-Floyd Co Con Sch (2400) 52.1% 10.0% 16.9% 21.0% 62.1% 51.2% 5.3% 21.3% 22.2% 56.5% 53.0% 5.3% 21.1% 20.6% 58.2% -3.9% 1.7%
New Castle Community Sch Corp (3445) 65.1% 5.3% 20.3% 9.3% 70.4% 60.4% 5.0% 24.0% 10.6% 65.4% 58.4% 6.0% 23.5% 12.2% 64.4% -6.0% -1.0%
New Community School (9340) 61.7% 15.8% 18.2% 4.3% 77.5% 60.6% 14.8% 22.1% 2.6% 75.3% -2.2%
New Harmony Town & Twp Con Sch (6610) 64.0% 9.8% 18.0% 7.8% 73.9% 63.3% 10.9% 20.1% 5.8% 74.2% 57.5% 11.3% 17.3% 13.8% 68.9% -5.2% -5.3%
New Prairie United School Corp (4805) 48.6% 3.7% 18.3% 29.4% 52.3% 55.0% 4.8% 24.0% 16.2% 59.9% 53.0% 4.7% 22.1% 20.2% 57.7% 5.4% -2.2%
Nineveh-Hensley-Jackson United (4255) 55.6% 4.0% 22.8% 17.6% 59.6% 52.0% 6.0% 21.9% 20.0% 58.1% 52.4% 5.9% 23.5% 18.2% 58.3% -1.3% 0.2%
Noblesville Schools (3070) 54.6% 3.9% 18.7% 22.8% 58.5% 49.8% 5.0% 19.2% 26.0% 54.9% 53.4% 5.5% 20.6% 20.5% 58.9% 0.4% 4.0%
North Adams Community Schools (0025) 58.9% 7.4% 23.0% 10.7% 66.3% 49.9% 8.7% 23.3% 18.0% 58.6% 50.5% 8.0% 23.3% 18.3% 58.4% -7.9% -0.2%
North Daviess Com Schools (1375) 65.7% 3.7% 21.3% 9.3% 69.4% 56.3% 7.3% 19.6% 16.7% 63.6% 55.3% 6.8% 20.6% 17.3% 62.1% -7.3% -1.5%
North Gibson School Corp (2735) 59.4% 4.7% 25.9% 10.0% 64.1% 55.7% 7.9% 25.3% 11.1% 63.6% 53.6% 7.0% 25.6% 13.8% 60.6% -3.6% -3.1%
12Office of Management and Budget
June 3, 2008
Progress of School Corporations in Improving the Ratio of Instructional Expenditures
School Corporation
Student
Academic
Achievement
Student
Instructional
Support
Overhead
and
Operational Nonoperational
Ratio of
Student
Instr. Exp.
To All Exp.
Student
Academic
Achievement
Student
Instructional
Support
Overhead
and
Operational Nonoperational
Ratio of
Student
Instr. Exp.
To All Exp.
Student
Academic
Achievement
Student
Instructional
Support
Overhead
and
Operational Nonoperational
Ratio of
Student
Instr. Exp.
To All Exp.
Change in
Ratio 1997
to 2007
Change in
Ratio 2006
to 2007
Expenditures FY 2007Expenditures FY 2006Expenditures FY 1997
North Harrison Com School Corp (3180) 56.3% 4.2% 23.6% 15.9% 60.5% 57.9% 5.5% 22.8% 13.9% 63.4% 60.2% 5.7% 21.5% 12.7% 65.8% 5.4% 2.5%
North Judson-San Pierre Sch Corp (7515) 58.8% 4.2% 21.2% 15.8% 62.9% 57.7% 7.4% 24.2% 10.7% 65.1% 55.0% 6.7% 25.6% 12.8% 61.6% -1.3% -3.5%
North Knox School Corp (4315) 65.6% 4.0% 22.4% 8.0% 69.6% 61.7% 3.2% 23.5% 11.6% 64.9% 61.2% 3.3% 24.2% 11.3% 64.5% -5.1% -0.4%
North Lawrence Com Schools (5075) 56.5% 3.0% 26.8% 13.6% 59.5% 53.0% 3.5% 22.3% 21.2% 56.5% 53.5% 3.5% 22.8% 20.3% 56.9% -2.6% 0.4%
North Miami Community Schools (5620) 63.8% 3.6% 22.0% 10.6% 67.4% 51.2% 6.8% 27.3% 14.7% 58.0% 58.9% 7.8% 24.2% 9.1% 66.7% -0.7% 8.7%
North Montgomery Com Sch Corp (5835) 50.5% 4.3% 21.9% 23.3% 54.8% 46.1% 8.2% 23.4% 22.4% 54.2% 44.5% 8.9% 23.0% 23.5% 53.5% -1.4% -0.8%
North Newton School Corp (5945) 57.6% 4.2% 27.6% 10.5% 61.8% 63.0% 4.0% 22.4% 10.5% 67.0% 53.4% 5.1% 25.6% 15.9% 58.5% -3.4% -8.6%
North Putnam Community Schools (6715) 58.4% 4.3% 23.7% 13.7% 62.6% 59.7% 5.2% 23.2% 11.9% 64.9% 60.2% 5.5% 21.6% 12.7% 65.7% 3.1% 0.9%
North Spencer County Sch Corp (7385) 60.5% 3.3% 17.7% 18.5% 63.8% 59.7% 4.9% 19.7% 15.7% 64.6% 57.6% 4.8% 22.1% 15.5% 62.4% -1.4% -2.2%
North Vermillion Com Sch Corp (8010) 51.3% 4.3% 21.0% 23.4% 55.6% 53.2% 6.8% 25.1% 14.9% 60.0% 51.7% 7.5% 23.1% 17.7% 59.2% 3.6% -0.8%
North West Hendricks Schools (3295) 52.6% 4.6% 24.0% 18.7% 57.3% 49.9% 6.4% 24.6% 19.0% 56.4% 50.5% 6.4% 25.3% 17.8% 56.8% -0.4% 0.5%
North White School Corp (8515) 47.2% 3.9% 17.8% 31.1% 51.1% 55.7% 5.6% 19.9% 18.8% 61.3% 51.3% 5.5% 19.3% 23.9% 56.8% 5.7% -4.5%
Northeast Dubois Co Sch Corp (2040) 54.6% 6.6% 20.3% 18.4% 61.2% 64.6% 6.3% 18.5% 10.6% 70.9% 57.3% 7.1% 21.7% 13.9% 64.4% 3.2% -6.5%
Northeast School Corp (7645) 60.9% 3.1% 22.3% 13.7% 64.1% 63.3% 5.4% 25.4% 5.9% 68.7% 69.0% 4.8% 21.5% 4.7% 73.8% 9.7% 5.1%
Northeastern Wayne Schools (8375) 62.9% 4.4% 19.2% 13.5% 67.3% 60.6% 4.1% 18.9% 16.3% 64.7% 47.2% 3.8% 15.4% 33.5% 51.0% -16.2% -13.7%
Northern Com Sch Tipton Co (7935) 60.2% 5.4% 21.4% 12.9% 65.6% 52.5% 6.6% 23.8% 17.1% 59.1% 53.1% 6.3% 23.9% 16.6% 59.5% -6.2% 0.4%
Northern Wells Com Schools (8435) 56.3% 6.3% 24.3% 13.1% 62.6% 53.9% 10.2% 22.3% 13.6% 64.1% 55.4% 10.4% 22.3% 11.9% 65.8% 3.2% 1.7%
Northwest Allen County Schools (0225) 57.4% 5.5% 18.8% 18.3% 63.0% 53.9% 7.1% 17.9% 21.1% 61.0% 55.6% 7.5% 18.2% 18.7% 63.1% 0.1% 2.1%
Northwestern Con School Corp (7350) 62.3% 4.4% 22.3% 11.0% 66.7% 56.5% 4.6% 21.9% 17.0% 61.1% 52.3% 4.8% 20.0% 22.9% 57.1% -9.6% -4.0%
Northwestern School Corp (3470) 60.2% 3.0% 23.5% 13.3% 63.2% 51.7% 7.7% 23.1% 17.5% 59.4% 51.2% 6.9% 24.9% 17.0% 58.1% -5.1% -1.3%
Oak Hill United School Corp (5625) 58.5% 4.4% 24.4% 12.8% 62.9% 57.9% 7.1% 21.6% 13.3% 65.1% 47.2% 5.9% 19.9% 27.1% 53.1% -9.8% -12.0%
Options Charter Sch - Noblesville (9640) 61.3% 5.4% 13.3% 20.0% 66.7%
Options Charter School - Carmel (9325) 62.4% 7.9% 25.9% 3.7% 70.4% 65.6% 8.2% 14.6% 11.6% 73.8% 3.4%
Oregon-Davis School Corp (7495) 58.7% 5.3% 21.2% 14.8% 64.0% 55.3% 5.5% 20.5% 18.6% 60.9% 60.9% 5.8% 18.7% 14.6% 66.7% 2.7% 5.8%
Orleans Community Schools (6145) 61.2% 5.1% 21.5% 12.3% 66.3% 58.6% 4.2% 17.6% 19.7% 62.8% 58.7% 4.4% 19.3% 17.6% 63.1% -3.2% 0.3%
Paoli Community School Corp (6155) 65.9% 5.1% 20.1% 8.9% 71.0% 57.6% 4.8% 16.0% 21.5% 62.4% 65.1% 5.8% 19.6% 9.5% 70.9% -0.1% 8.5%
Penn-Harris-Madison Sch Corp (7175) 45.8% 5.9% 21.7% 26.5% 51.7% 52.4% 7.4% 22.2% 18.0% 59.8% 53.6% 7.3% 21.7% 17.4% 60.9% 9.1% 1.1%
Perry Central Com Schools Corp (6325) 65.7% 4.8% 21.8% 7.7% 70.5% 61.2% 8.1% 22.1% 8.7% 69.2% 62.4% 6.3% 22.1% 9.2% 68.7% -1.8% -0.5%
Peru Community Schools (5635) 60.0% 3.5% 16.6% 20.0% 63.5% 47.4% 4.0% 13.9% 34.8% 51.3% 59.0% 5.1% 16.9% 19.0% 64.1% 0.6% 12.8%
Pike County School Corp (6445) 63.6% 3.4% 24.6% 8.4% 67.0% 52.3% 5.2% 25.5% 16.9% 57.6% 52.9% 5.7% 26.1% 15.3% 58.6% -8.4% 1.0%
Pioneer Regional School Corp (0775) 66.3% 4.2% 23.9% 5.6% 70.5% 61.8% 4.5% 22.6% 11.1% 66.3% 55.5% 5.3% 25.2% 13.9% 60.8% -9.6% -5.4%
Plainfield Community Sch Corp (3330) 53.7% 5.1% 19.5% 21.8% 58.7% 49.0% 7.8% 20.5% 22.7% 56.8% 44.2% 7.9% 17.7% 30.1% 52.2% -6.6% -4.6%
Plymouth Community School Corp (5485) 54.5% 3.9% 20.9% 20.7% 58.4% 43.6% 5.0% 16.8% 34.6% 48.6% 52.1% 5.6% 19.8% 22.5% 57.7% -0.7% 9.1%
Portage Township Schools (6550) 61.0% 3.9% 25.4% 9.6% 64.9% 59.4% 3.3% 26.8% 10.6% 62.6% 61.9% 2.9% 24.6% 10.6% 64.8% -0.1% 2.2%
Porter Township School Corp (6520) 41.6% 3.8% 18.7% 35.9% 45.3% 48.9% 4.2% 26.7% 20.2% 53.1% 46.0% 5.1% 30.1% 18.8% 51.1% 5.7% -2.0%
Prairie Heights Com Sch Corp (4515) 57.3% 3.7% 26.0% 13.0% 61.0% 57.6% 5.0% 24.4% 12.9% 62.6% 53.0% 5.2% 22.6% 19.3% 58.1% -2.8% -4.5%
Prairie Township Schools (4880) 84.1% 0.0% 15.9% 0.0% 84.1% 86.9% 0.6% 12.5% 0.0% 87.5% 31.9% 3.1% 65.0% 0.0% 35.0% -49.1% -52.5%
Randolph Central School Corp (6825) 63.0% 5.4% 20.7% 10.9% 68.4% 62.0% 4.5% 20.4% 13.1% 66.5% 62.8% 4.6% 21.1% 11.5% 67.4% -1.0% 0.9%
13Office of Management and Budget
June 3, 2008

Progress of School Corporations in Improving the Ratio of Instructional Expenditures
School Corporation
Student
Academic
Achievement
Student
Instructional
Support
Overhead
and
Operational Nonoperational
Ratio of
Student
Instr. Exp.
To All Exp.
Student
Academic
Achievement
Student
Instructional
Support
Overhead
and
Operational Nonoperational
Ratio of
Student
Instr. Exp.
To All Exp.
Student
Academic
Achievement
Student
Instructional
Support
Overhead
and
Operational Nonoperational
Ratio of
Student
Instr. Exp.
To All Exp.
Change in
Ratio 1997
to 2007
Change in
Ratio 2006
to 2007
Expenditures FY 2007Expenditures FY 2006Expenditures FY 1997
Randolph Eastern School Corp (6835) 65.6% 6.3% 19.4% 8.8% 71.8% 62.0% 6.7% 18.8% 12.6% 68.7% 44.7% 5.0% 15.5% 34.8% 49.7% -22.1% -18.9%
Randolph Southern School Corp (6805) 63.7% 6.2% 21.9% 8.2% 69.9% 59.7% 8.1% 24.5% 7.7% 67.8% 59.4% 8.0% 25.5% 7.1% 67.4% -2.5% -0.4%
Rensselaer Central School Corp (3815) 56.8% 4.7% 25.0% 13.2% 61.5% 59.2% 5.1% 24.3% 11.4% 64.3% 58.6% 4.7% 23.4% 13.3% 63.3% 1.6% -1.0%
Richland-Bean Blossom C S C (5705) 63.4% 5.1% 20.2% 11.3% 68.6% 56.9% 5.9% 21.2% 16.1% 62.7% 57.6% 5.7% 21.3% 15.4% 63.3% -5.3% 0.6%
Richmond Community School (8385) 64.5% 6.4% 19.3% 9.8% 70.9% 61.1% 9.5% 19.9% 9.5% 70.6% 59.6% 10.4% 20.6% 9.4% 70.0% -0.9% -0.6%
Rising Sun-Ohio Co Com (6080) 73.9% 5.5% 15.3% 5.3% 79.4% 69.6% 5.9% 20.4% 4.0% 75.5% 69.6% 6.3% 20.2% 3.8% 76.0% -3.4% 0.4%
River Forest Community Sch Corp (4590) 63.4% 6.0% 22.0% 8.5% 69.4% 45.1% 5.5% 22.6% 26.7% 50.7% 31.4% 4.4% 15.9% 48.2% 35.8% -33.6% -14.8%
Rochester Community Sch Corp (2645) 60.8% 5.8% 19.5% 13.9% 66.6% 55.7% 9.0% 20.4% 14.9% 64.7% 55.0% 10.1% 19.3% 15.6% 65.1% -1.5% 0.3%
Rockville Community School Corp (6300) 59.5% 4.3% 19.8% 16.4% 63.7% 52.7% 7.8% 17.1% 22.4% 60.5% 51.7% 7.1% 18.3% 23.0% 58.8% -5.0% -1.7%
Rossville Con School District (1180) 63.7% 5.4% 20.5% 10.4% 69.1% 57.1% 7.6% 20.3% 15.0% 64.7% 56.6% 8.7% 21.0% 13.6% 65.3% -3.8% 0.6%
Rural Community Schools Inc (9465) 85.1% 3.7% 11.2% 0.0% 88.8% 72.9% 5.9% 17.6% 0.0% 78.9% -7.0%
Rush County Schools (6995) 64.6% 3.7% 23.2% 8.5% 68.3% 59.7% 4.6% 25.2% 10.5% 64.3% 60.5% 4.7% 24.2% 10.6% 65.2% -3.1% 0.9%
Salem Community Schools (8205) 67.8% 5.0% 22.9% 4.4% 72.8% 58.2% 5.9% 19.4% 16.5% 64.1% 58.3% 5.7% 20.2% 15.8% 64.0% -8.8% -0.1%
School City of East Chicago (4670) 47.2% 7.4% 19.3% 26.0% 54.7% 48.0% 11.9% 20.6% 19.4% 59.9% 45.5% 12.2% 21.8% 20.6% 57.6% 3.0% -2.3%
School City of Hammond (4710) 62.3% 4.8% 24.6% 8.3% 67.1% 55.9% 8.9% 20.7% 14.5% 64.8% 55.6% 9.5% 20.1% 14.8% 65.1% -1.9% 0.3%
School City of Hobart (4730) 60.9% 7.8% 20.2% 11.1% 68.7% 43.9% 6.7% 17.7% 31.7% 50.6% 53.7% 8.8% 21.1% 16.4% 62.5% -6.2% 11.8%
School City of Mishawaka (7200) 69.1% 5.5% 16.2% 9.2% 74.6% 61.8% 7.3% 17.6% 13.3% 69.1% 63.7% 7.1% 16.7% 12.5% 70.8% -3.8% 1.7%
School Town of Highland (4720) 58.5% 5.7% 22.0% 13.8% 64.2% 55.7% 6.3% 26.5% 11.5% 62.0% 53.0% 6.5% 27.6% 12.9% 59.5% -4.7% -2.5%
School Town of Munster (4740) 38.4% 2.7% 14.6% 44.4% 41.0% 52.6% 4.4% 20.3% 22.7% 57.0% 52.0% 4.2% 22.6% 21.2% 56.2% 15.2% -0.8%
School Town of Speedway (5400) 61.1% 2.2% 19.4% 17.3% 63.3% 65.1% 3.7% 20.2% 11.0% 68.8% 61.2% 3.8% 17.9% 17.0% 65.0% 1.8% -3.8%
Scott County School District 1 (7230) 65.5% 7.1% 18.6% 8.8% 72.6% 59.9% 5.5% 18.7% 15.9% 65.4% 59.3% 6.4% 20.8% 13.5% 65.8% -6.9% 0.4%
Scott County School District 2 (7255) 63.5% 5.0% 21.1% 10.3% 68.5% 56.1% 6.1% 22.5% 15.3% 62.2% 53.8% 5.7% 22.5% 18.0% 59.5% -9.0% -2.7%
SE Neighborhood Sch of Excellence (9485) 43.0% 14.9% 40.4% 1.7% 57.9% 49.0% 11.0% 35.1% 4.9% 60.0% 2.2%
Seymour Community Schools (3675) 55.3% 4.5% 19.4% 20.7% 59.8% 57.4% 5.9% 18.7% 17.9% 63.3% 59.5% 7.7% 18.7% 14.2% 67.2% 7.3% 3.8%
Shelby Eastern Schools (7285) 62.7% 4.7% 19.4% 13.1% 67.4% 53.4% 5.6% 19.9% 21.1% 59.0% 55.2% 4.4% 21.9% 18.5% 59.6% -7.8% 0.6%
Shelbyville Central Schools (7365) 62.0% 3.0% 21.4% 13.5% 65.0% 55.6% 3.9% 20.1% 20.4% 59.5% 50.8% 4.8% 18.8% 25.7% 55.5% -9.5% -4.0%
Shenandoah School Corporation (3435) 57.6% 4.3% 21.5% 16.5% 62.0% 55.4% 5.5% 22.0% 17.1% 60.9% 55.2% 5.3% 20.9% 18.6% 60.5% -1.4% -0.4%
Sheridan Community Schools (3055) 65.7% 3.5% 24.6% 6.2% 69.2% 57.0% 8.7% 25.5% 8.9% 65.7% 56.3% 8.4% 27.4% 7.9% 64.7% -4.5% -0.9%
Shoals Community School Corp (5520) 63.3% 4.8% 21.6% 10.3% 68.1% 53.1% 6.6% 21.3% 19.0% 59.7% 55.4% 8.5% 22.9% 13.3% 63.9% -4.2% 4.2%
Signature School Inc (9315) 82.7% 6.4% 10.2% 0.7% 89.1% 77.1% 7.1% 14.6% 1.1% 84.2% -4.9%
Smith-Green Community Schools (8625) 58.0% 6.6% 22.8% 12.6% 64.6% 58.4% 9.2% 18.0% 14.4% 67.5% 59.0% 8.8% 21.7% 10.5% 67.8% 3.2% 0.3%
South Adams Schools (0035) 61.6% 5.7% 22.7% 10.0% 67.2% 56.0% 7.5% 23.2% 13.3% 63.5% 59.1% 7.0% 20.4% 13.5% 66.1% -1.1% 2.6%
South Bend Community Sch Corp (7205) 60.2% 5.3% 20.8% 13.7% 65.5% 54.7% 6.1% 20.2% 19.1% 60.8% 58.9% 6.6% 22.0% 12.5% 65.5% 0.0% 4.7%
South Central Com School Corp (4940) 56.7% 6.1% 25.0% 12.2% 62.8% 46.6% 5.5% 23.2% 24.8% 52.1% 56.7% 6.4% 24.1% 12.7% 63.2% 0.4% 11.1%
South Dearborn Com School Corp (1600) 62.5% 2.8% 20.5% 14.3% 65.3% 64.0% 3.8% 20.0% 12.3% 67.7% 54.6% 3.2% 18.6% 23.6% 57.8% -7.5% -9.9%
South Gibson School Corp (2765) 58.1% 2.0% 18.0% 22.0% 60.1% 54.6% 6.6% 22.1% 16.8% 61.2% 52.6% 6.9% 21.9% 18.6% 59.5% -0.6% -1.6%
South Harrison Com Schools (3190) 58.2% 4.1% 23.7% 14.1% 62.2% 54.9% 7.2% 18.2% 19.7% 62.1% 57.6% 6.0% 17.0% 19.4% 63.6% 1.4% 1.6%
South Henry School Corp (3415) 59.1% 4.9% 30.0% 6.0% 64.0% 62.3% 4.6% 24.9% 8.2% 66.9% 61.8% 6.4% 24.1% 7.6% 68.1% 4.3% 1.3%
14Office of Management and Budget
June 3, 2008

Progress of School Corporations in Improving the Ratio of Instructional Expenditures
School Corporation
Student
Academic
Achievement
Student
Instructional
Support
Overhead
and
Operational Nonoperational
Ratio of
Student
Instr. Exp.
To All Exp.
Student
Academic
Achievement
Student
Instructional
Support
Overhead
and
Operational Nonoperational
Ratio of
Student
Instr. Exp.
To All Exp.
Student
Academic
Achievement
Student
Instructional
Support
Overhead
and
Operational Nonoperational
Ratio of
Student
Instr. Exp.
To All Exp.
Change in
Ratio 1997
to 2007
Change in
Ratio 2006
to 2007
Expenditures FY 2007Expenditures FY 2006Expenditures FY 1997
South Knox School Corp (4325) 63.6% 5.4% 26.2% 4.8% 69.0% 53.4% 6.8% 20.4% 19.3% 60.2% 51.6% 6.6% 20.5% 21.2% 58.3% -10.7% -2.0%
South Madison Com Sch Corp (5255) 45.5% 3.0% 15.0% 36.5% 48.5% 48.6% 5.5% 17.4% 28.5% 54.1% 49.3% 5.2% 19.3% 26.2% 54.5% 5.9% 0.4%
South Montgomery Com Sch Corp (5845) 56.4% 2.6% 21.3% 19.7% 59.0% 36.9% 3.1% 22.4% 37.5% 40.1% 45.2% 3.7% 21.5% 29.7% 48.9% -10.1% 8.8%
South Newton School Corp (5995) 43.7% 4.3% 19.6% 32.3% 48.1% 52.1% 6.5% 22.2% 19.2% 58.6% 51.6% 6.0% 22.5% 19.9% 57.6% 9.6% -1.0%
South Putnam Community Schools (6705) 57.0% 4.3% 21.1% 17.6% 61.3% 47.0% 7.0% 17.9% 28.2% 53.9% 36.8% 3.9% 44.2% 15.1% 40.7% -20.6% -13.2%
South Ripley Com Sch Corp (6865) 64.9% 4.1% 22.1% 8.9% 69.0% 62.1% 7.8% 23.5% 6.7% 69.8% 61.5% 7.4% 23.3% 7.8% 68.9% -0.1% -0.9%
South Spencer County Sch Corp (7445) 61.7% 3.0% 21.8% 13.6% 64.6% 53.9% 4.9% 19.7% 21.4% 58.9% 50.3% 4.6% 19.6% 25.6% 54.9% -9.8% -4.0%
South Vermillion Com Sch Corp (8020) 57.1% 3.9% 20.9% 18.1% 61.0% 53.1% 4.7% 24.1% 18.1% 57.8% 56.4% 5.0% 23.7% 14.9% 61.3% 0.4% 3.6%
Southeast Dubois Co Sch Corp (2100) 54.4% 3.7% 16.6% 25.2% 58.1% 53.7% 5.2% 17.2% 23.9% 59.0% 57.7% 5.5% 19.4% 17.4% 63.2% 5.1% 4.3%
Southeast Fountain School Corp (2455) 62.4% 4.2% 23.9% 9.5% 66.6% 50.7% 3.8% 31.7% 13.7% 54.6% 53.5% 4.0% 23.2% 19.3% 57.5% -9.2% 2.9%
Southeastern School Corp (0815) 65.0% 3.6% 22.1% 9.3% 68.6% 61.1% 3.4% 25.1% 10.3% 64.6% 60.4% 3.4% 26.2% 10.0% 63.9% -4.8% -0.7%
Southern Hancock Co Com Sch Corp (3115) 55.5% 5.0% 24.3% 15.2% 60.5% 48.4% 3.3% 25.4% 22.9% 51.7% 46.0% 3.4% 24.1% 26.6% 49.4% -11.2% -2.3%
Southern Wells Com Schools (8425) 62.6% 5.6% 24.6% 7.0% 68.2% 60.4% 8.4% 27.0% 4.2% 68.8% 60.1% 8.2% 24.0% 7.7% 68.3% 0.0% -0.4%
Southwest Dubois Co Sch Corp (2110) 66.3% 4.4% 17.5% 11.7% 70.7% 57.8% 11.0% 17.9% 13.4% 68.7% 58.1% 12.2% 17.2% 12.5% 70.3% -0.5% 1.5%
Southwest Parke Com Sch Corp (6260) 56.1% 4.7% 22.3% 16.9% 60.8% 51.5% 4.7% 22.9% 20.9% 56.2% 54.5% 5.3% 23.8% 16.4% 59.8% -1.0% 3.6%
Southwest School Corp (7715) 58.6% 1.7% 19.9% 19.7% 60.3% 53.6% 4.1% 23.3% 19.0% 57.7% 55.9% 5.1% 23.3% 15.7% 61.0% 0.7% 3.3%
Southwestern Con Sch Shelby Co (7360) 59.0% 5.1% 24.5% 11.4% 64.1% 47.4% 6.3% 22.6% 23.7% 53.7% 53.9% 6.7% 24.7% 14.7% 60.6% -3.5% 7.0%
Southwestern-Jefferson Co Con (4000) 59.9% 3.8% 22.4% 13.9% 63.7% 65.0% 5.2% 22.4% 7.3% 70.3% 59.9% 6.1% 24.9% 9.1% 66.0% 2.3% -4.3%
Spencer-Owen Community Schools (6195) 63.1% 3.9% 19.1% 13.9% 67.1% 55.8% 4.4% 21.7% 18.1% 60.1% 58.1% 4.4% 22.9% 14.6% 62.5% -4.6% 2.3%
Springs Valley Com School Corp (6160) 60.8% 5.2% 22.4% 11.5% 66.1% 61.1% 7.3% 22.1% 9.4% 68.5% 59.6% 7.1% 22.4% 10.9% 66.7% 0.6% -1.8%
Sunman-Dearborn Com Sch Corp (1560) 62.3% 5.9% 20.0% 11.8% 68.2% 56.8% 5.2% 19.9% 18.2% 61.9% 53.0% 4.8% 18.2% 24.0% 57.7% -10.5% -4.2%
Switzerland County School Corp (7775) 50.9% 3.1% 20.2% 25.9% 54.0% 61.8% 6.4% 24.3% 7.5% 68.2% 63.1% 6.2% 23.7% 6.9% 69.3% 15.4% 1.1%
Taylor Community School Corp (3460) 65.4% 4.3% 18.1% 12.3% 69.7% 57.8% 5.8% 20.3% 16.1% 63.6% 56.1% 6.2% 21.6% 16.1% 62.3% -7.4% -1.3%
Tell City-Troy Twp School Corp (6350) 66.2% 4.4% 18.2% 11.2% 70.6% 68.6% 5.2% 12.6% 13.6% 73.8% 58.9% 5.2% 17.9% 18.0% 64.1% -6.6% -9.7%
Thea Bowman Leadership Academy (9460) 60.0% 19.8% 17.1% 3.1% 79.8% 64.4% 14.1% 17.3% 4.3% 78.5% -1.3%
Timothy L Johnson Academy (9350) 52.1% 14.7% 28.1% 1.7% 66.8% 45.6% 15.9% 30.4% 2.2% 61.5% -3.8%
Tippecanoe School Corp (7865) 54.7% 3.4% 19.7% 22.2% 58.1% 51.1% 4.2% 19.2% 25.5% 55.4% 52.9% 4.4% 18.8% 24.0% 57.2% -0.9% 1.9%
Tippecanoe Valley School Corp (4445) 58.0% 6.6% 23.1% 12.3% 64.6% 53.9% 10.8% 19.0% 16.3% 64.7% 53.5% 11.0% 18.9% 16.6% 64.5% -0.1% -0.2%
Tipton Community School Corp (7945) 58.5% 4.3% 22.0% 15.1% 62.9% 55.9% 4.6% 23.2% 16.3% 60.5% 55.7% 4.9% 21.8% 17.6% 60.6% -2.3% 0.1%
Tri-County School Corp (8535) 64.4% 4.8% 22.8% 8.1% 69.1% 48.9% 7.1% 22.5% 21.5% 56.0% 52.2% 7.6% 18.4% 21.8% 59.8% -9.3% 3.8%
Tri-Creek School Corp (4645) 57.2% 4.6% 24.3% 13.9% 61.7% 44.6% 4.7% 18.1% 32.6% 49.3% 42.4% 5.5% 29.5% 22.7% 47.8% -13.9% -1.5%
Triton School Corporation (5495) 57.2% 5.5% 23.3% 14.0% 62.7% 57.9% 7.0% 22.5% 12.6% 65.0% 59.2% 7.4% 19.9% 13.5% 66.6% 3.9% 1.6%
Turkey Run Community Sch Corp (6310) 61.8% 6.5% 21.5% 10.2% 68.3% 53.1% 7.4% 21.1% 18.4% 60.5% 54.1% 6.6% 23.2% 16.1% 60.7% -7.7% 0.1%
Twin Lakes School Corp (8565) 53.9% 5.4% 20.2% 20.4% 59.3% 57.0% 5.1% 19.1% 18.8% 62.1% 52.9% 5.7% 20.6% 20.8% 58.6% -0.7% -3.5%
Union Co/Clg Corner Joint Sch Dist (7950) 62.8% 4.6% 20.4% 12.1% 67.4% 58.5% 10.2% 18.6% 12.7% 68.6% 58.9% 9.9% 18.8% 12.4% 68.8% 1.3% 0.1%
Union School Corporation (6795) 60.1% 5.6% 23.7% 10.6% 65.7% 59.1% 6.9% 23.6% 10.5% 65.9% 56.9% 4.8% 24.2% 14.2% 61.7% -4.0% -4.3%
Union Township School Corp (6530) 57.4% 4.5% 24.0% 14.0% 62.0% 54.2% 4.4% 22.3% 19.0% 58.6% 53.6% 5.2% 25.0% 16.2% 58.8% -3.2% 0.2%
Union-North United School Corp (7215) 55.6% 6.0% 21.9% 16.5% 61.6% 58.9% 8.4% 24.0% 8.6% 67.4% 52.9% 10.4% 22.5% 14.2% 63.3% 1.7% -4.1%
15Office of Management and Budget
June 3, 2008
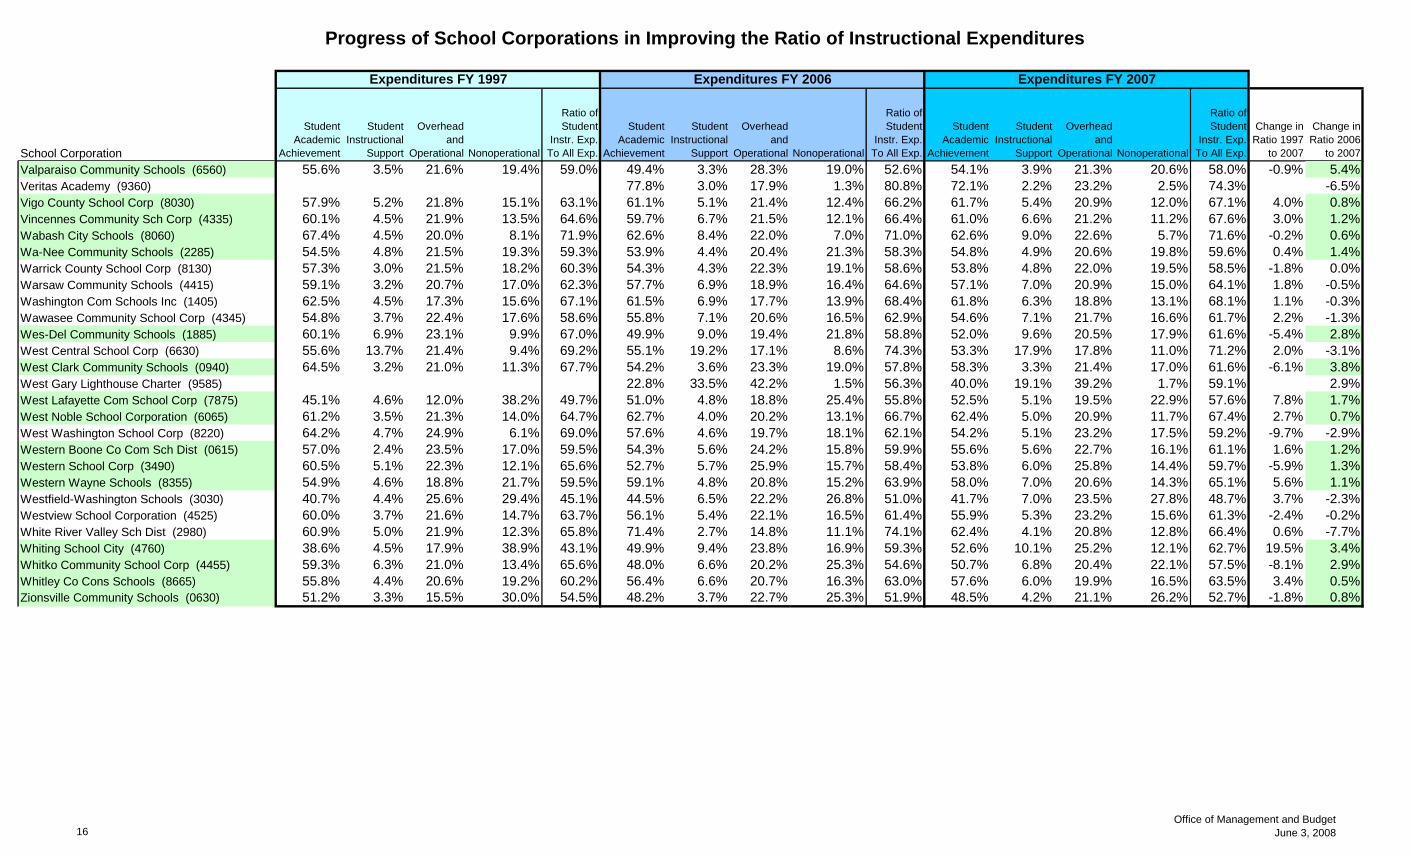
Progress of School Corporations in Improving the Ratio of Instructional Expenditures
School Corporation
Student
Academic
Achievement
Student
Instructional
Support
Overhead
and
Operational Nonoperational
Ratio of
Student
Instr. Exp.
To All Exp.
Student
Academic
Achievement
Student
Instructional
Support
Overhead
and
Operational Nonoperational
Ratio of
Student
Instr. Exp.
To All Exp.
Student
Academic
Achievement
Student
Instructional
Support
Overhead
and
Operational Nonoperational
Ratio of
Student
Instr. Exp.
To All Exp.
Change in
Ratio 1997
to 2007
Change in
Ratio 2006
to 2007
Expenditures FY 2007Expenditures FY 2006Expenditures FY 1997
Valparaiso Community Schools (6560) 55.6% 3.5% 21.6% 19.4% 59.0% 49.4% 3.3% 28.3% 19.0% 52.6% 54.1% 3.9% 21.3% 20.6% 58.0% -0.9% 5.4%
Veritas Academy (9360) 77.8% 3.0% 17.9% 1.3% 80.8% 72.1% 2.2% 23.2% 2.5% 74.3% -6.5%
Vigo County School Corp (8030) 57.9% 5.2% 21.8% 15.1% 63.1% 61.1% 5.1% 21.4% 12.4% 66.2% 61.7% 5.4% 20.9% 12.0% 67.1% 4.0% 0.8%
Vincennes Community Sch Corp (4335) 60.1% 4.5% 21.9% 13.5% 64.6% 59.7% 6.7% 21.5% 12.1% 66.4% 61.0% 6.6% 21.2% 11.2% 67.6% 3.0% 1.2%
Wabash City Schools (8060) 67.4% 4.5% 20.0% 8.1% 71.9% 62.6% 8.4% 22.0% 7.0% 71.0% 62.6% 9.0% 22.6% 5.7% 71.6% -0.2% 0.6%
Wa-Nee Community Schools (2285) 54.5% 4.8% 21.5% 19.3% 59.3% 53.9% 4.4% 20.4% 21.3% 58.3% 54.8% 4.9% 20.6% 19.8% 59.6% 0.4% 1.4%
Warrick County School Corp (8130) 57.3% 3.0% 21.5% 18.2% 60.3% 54.3% 4.3% 22.3% 19.1% 58.6% 53.8% 4.8% 22.0% 19.5% 58.5% -1.8% 0.0%
Warsaw Community Schools (4415) 59.1% 3.2% 20.7% 17.0% 62.3% 57.7% 6.9% 18.9% 16.4% 64.6% 57.1% 7.0% 20.9% 15.0% 64.1% 1.8% -0.5%
Washington Com Schools Inc (1405) 62.5% 4.5% 17.3% 15.6% 67.1% 61.5% 6.9% 17.7% 13.9% 68.4% 61.8% 6.3% 18.8% 13.1% 68.1% 1.1% -0.3%
Wawasee Community School Corp (4345) 54.8% 3.7% 22.4% 17.6% 58.6% 55.8% 7.1% 20.6% 16.5% 62.9% 54.6% 7.1% 21.7% 16.6% 61.7% 2.2% -1.3%
Wes-Del Community Schools (1885) 60.1% 6.9% 23.1% 9.9% 67.0% 49.9% 9.0% 19.4% 21.8% 58.8% 52.0% 9.6% 20.5% 17.9% 61.6% -5.4% 2.8%
West Central School Corp (6630) 55.6% 13.7% 21.4% 9.4% 69.2% 55.1% 19.2% 17.1% 8.6% 74.3% 53.3% 17.9% 17.8% 11.0% 71.2% 2.0% -3.1%
West Clark Community Schools (0940) 64.5% 3.2% 21.0% 11.3% 67.7% 54.2% 3.6% 23.3% 19.0% 57.8% 58.3% 3.3% 21.4% 17.0% 61.6% -6.1% 3.8%
West Gary Lighthouse Charter (9585) 22.8% 33.5% 42.2% 1.5% 56.3% 40.0% 19.1% 39.2% 1.7% 59.1% 2.9%
West Lafayette Com School Corp (7875) 45.1% 4.6% 12.0% 38.2% 49.7% 51.0% 4.8% 18.8% 25.4% 55.8% 52.5% 5.1% 19.5% 22.9% 57.6% 7.8% 1.7%
West Noble School Corporation (6065) 61.2% 3.5% 21.3% 14.0% 64.7% 62.7% 4.0% 20.2% 13.1% 66.7% 62.4% 5.0% 20.9% 11.7% 67.4% 2.7% 0.7%
West Washington School Corp (8220) 64.2% 4.7% 24.9% 6.1% 69.0% 57.6% 4.6% 19.7% 18.1% 62.1% 54.2% 5.1% 23.2% 17.5% 59.2% -9.7% -2.9%
Western Boone Co Com Sch Dist (0615) 57.0% 2.4% 23.5% 17.0% 59.5% 54.3% 5.6% 24.2% 15.8% 59.9% 55.6% 5.6% 22.7% 16.1% 61.1% 1.6% 1.2%
Western School Corp (3490) 60.5% 5.1% 22.3% 12.1% 65.6% 52.7% 5.7% 25.9% 15.7% 58.4% 53.8% 6.0% 25.8% 14.4% 59.7% -5.9% 1.3%
Western Wayne Schools (8355) 54.9% 4.6% 18.8% 21.7% 59.5% 59.1% 4.8% 20.8% 15.2% 63.9% 58.0% 7.0% 20.6% 14.3% 65.1% 5.6% 1.1%
Westfield-Washington Schools (3030) 40.7% 4.4% 25.6% 29.4% 45.1% 44.5% 6.5% 22.2% 26.8% 51.0% 41.7% 7.0% 23.5% 27.8% 48.7% 3.7% -2.3%
Westview School Corporation (4525) 60.0% 3.7% 21.6% 14.7% 63.7% 56.1% 5.4% 22.1% 16.5% 61.4% 55.9% 5.3% 23.2% 15.6% 61.3% -2.4% -0.2%
White River Valley Sch Dist (2980) 60.9% 5.0% 21.9% 12.3% 65.8% 71.4% 2.7% 14.8% 11.1% 74.1% 62.4% 4.1% 20.8% 12.8% 66.4% 0.6% -7.7%
Whiting School City (4760) 38.6% 4.5% 17.9% 38.9% 43.1% 49.9% 9.4% 23.8% 16.9% 59.3% 52.6% 10.1% 25.2% 12.1% 62.7% 19.5% 3.4%
Whitko Community School Corp (4455) 59.3% 6.3% 21.0% 13.4% 65.6% 48.0% 6.6% 20.2% 25.3% 54.6% 50.7% 6.8% 20.4% 22.1% 57.5% -8.1% 2.9%
Whitley Co Cons Schools (8665) 55.8% 4.4% 20.6% 19.2% 60.2% 56.4% 6.6% 20.7% 16.3% 63.0% 57.6% 6.0% 19.9% 16.5% 63.5% 3.4% 0.5%
Zionsville Community Schools (0630) 51.2% 3.3% 15.5% 30.0% 54.5% 48.2% 3.7% 22.7% 25.3% 51.9% 48.5% 4.2% 21.1% 26.2% 52.7% -1.8% 0.8%
16Office of Management and Budget
June 3, 2008

School Corporation Expenditures by HB 1006 Expenditure Categories
Biannual Financial Report Data
Statewide
1006 Category Account FY 1997 FY 2006 FY 2007
10 Year
Increase
1 Year
Increase
Student Academic Achievement
11025 Non Special Ed Preschool $0 $470,858 $2,486,192 n/a 428%
11050 Full Day Kindergarten $0 $28,745,933 $36,335,738 n/a 26%
11100 Elementary $1,072,996,985 $1,383,411,540 $1,415,147,653 32% 2%
11200 Middle/Junior High $414,429,995 $538,207,842 $538,865,037 30% 0%
11300 High School $651,199,065 $808,153,265 $822,634,453 26% 2%
11350 Honors Diploma Award $0 $1,894,692 $2,253,708 n/a 19%
11355 Academic Honors - High Ability Student Program $0 $2,394,175 $7,764,478 n/a 224%
11410 Agriculture A $3,833,944 $5,361,928 $5,788,561 51% 8%
11420 Agriculture B $4,713,636 $5,444,128 $5,655,581 20% 4%
11430 Distributive Education $2,550,108 $2,289,043 $2,251,322 -12% -2%
11440 Health Occupations $1,297,560 $1,990,290 $1,806,426 39% -9%
11450 Consumer and Homemaking $14,399,535 $16,434,664 $16,872,859 17% 3%
11460 Occupational Home Economics $2,543,511 $3,107,142 $3,362,516 32% 8%
11470 Business Education $5,413,001 $6,592,473 $6,510,120 20% -1%
11480 Industrial Education A $9,841,423 $11,742,823 $11,587,297 18% -1%
11490 Industrial Education B $3,723,938 $4,765,677 $4,960,634 33% 4%
11510 Cooperative Education $3,540,578 $3,220,116 $3,252,941 -8% 1%
11520 Area School Participation $7,826,730 $10,719,503 $11,538,272 47% 8%
11590 Other Vocational Education Programs $9,575,571 $12,242,253 $11,217,324 17% -8%
11610 Elementary $98,349 $443,424 $465,234 373% 5%
11620 Middle/Junior High $322,178 $1,933,608 $1,659,059 415% -14%
11630 High School $1,262,851 $8,732,578 $9,605,177 > 500% 10%
11900 Other Regular Programs $3,123,453 $1,018,953 $677,055 -78% -34%
11910 Competency Testing $1,743,228 $3,772,116 $3,631,372 108% -4%
11920 Project 4R $1,865,048 $72,524 $51,281 -97% -29%
12100 Gifted and Talented $19,038,989 $17,824,656 $17,537,047 -8% -2%
12150 High Ability Students $0 $2,290,368 $3,928,034 n/a 72%
12210 Mild Mental Handicap $56,866,327 $110,180,011 $114,672,556 102% 4%
12220 Moderate Mental Handicap $12,540,728 $23,176,951 $24,825,459 98% 7%
12230 Mental Handicap $7,841,458 $22,009,930 $22,651,097 189% 3%
12310 Orthopedic Impairment $7,968,119 $21,251,166 $20,560,637 158% -3%
12320 Multiple Handicap $6,893,208 $9,477,567 $9,760,344 42% 3%
12330 Visual Impairment $1,282,085 $2,419,777 $2,524,020 97% 4%
12340 Hearing Impairment $4,336,086 $7,051,549 $7,634,585 76% 8%
12350 Homebound $4,215,293 $5,613,859 $5,948,982 41% 6%
12410 Emotional Handicap - Full Time $19,052,835 $35,256,651 $35,705,865 87% 1%
12420 Emotional Handicap - All Others $1,362,822 $6,134,329 $6,152,443 351% 0%
12510 Communication Disorder $12,501,806 $21,806,673 $22,160,938 77% 2%
12520 Compensatory $18,705,835 $9,801,817 $11,172,386 -40% 14%
12610 Learning Disability - Full Time $38,217,359 $69,895,890 $71,063,828 86% 2%
12620 Learning Disability - All Others $20,645,771 $40,353,168 $43,082,625 109% 7%
17Office of Management and Budget
June 3, 2008

School Corporation Expenditures by HB 1006 Expenditure Categories
Biannual Financial Report Data
Statewide
1006 Category Account FY 1997 FY 2006 FY 2007
10 Year
Increase
1 Year
Increase
12710 Equal Opportunity At Risk $19,243,839 $20,765,381 $21,172,508 10% 2%
12810 Special Education Preschool $14,101,051 $28,988,256 $30,101,420 113% 4%
12900 Other Special Programs $34,289,240 $71,777,232 $74,450,862 117% 4%
13100 Adult Basic Education $11,221,954 $14,000,407 $14,003,233 25% 0%
13200 Advanced Adult Education $2,996,384 $2,827,179 $2,802,402 -6% -1%
13300 Occupational Programs $1,437,775 $1,332,833 $1,332,994 -7% 0%
13600 Special Interest Programs $2,007,174 $3,159,153 $3,083,051 54% -2%
13900 Other Adult/Continuing Ed Programs $3,895,087 $4,817,489 $5,004,925 28% 4%
14100 Elementary $6,733,625 $8,249,940 $8,798,817 31% 7%
14200 Middle/Junior High $1,612,287 $2,528,584 $2,544,835 58% 1%
14300 High School $13,380,705 $15,235,235 $15,391,080 15% 1%
15100 Non-Credit Enrichment Programs $469,187 $622,859 $825,150 76% 32%
16100 Remediation Testing $22,986,832 $24,285,248 $24,490,592 7% 1%
16200 Preventive Remediation $11,634,067 $16,084,684 $15,952,960 37% -1%
21510 Service Area Direction $697,709 $939,226 $1,036,350 49% 10%
21520 Speech Pathology Services $9,966,253 $16,850,667 $17,982,709 80% 7%
21530 Audiology Services $269,141 $639,280 $705,261 162% 10%
21590 Other Speech Pathology/Audiology Services $1,059,745 $1,538,983 $1,502,422 42% -2%
22210 Service Area Direction $9,514,516 $13,549,212 $13,584,151 43% 0%
22220 School Library $60,120,341 $71,228,014 $71,550,030 19% 0%
22230 Audiovisual $5,917,014 $4,391,394 $4,060,531 -31% -8%
22240 Education Television $686,258 $330,820 $264,878 -61% -20%
22250 Computer Assisted Instruction Services $22,760,855 $22,049,191 $21,589,713 -5% -2%
22290 Other Education Media Services $2,206,110 $4,068,968 $4,523,734 105% 11%
24100 Office of the Principal Services $234,565,186 $332,796,398 $344,207,102 47% 3%
25810 Direction of Rental Services $961,268 $1,374,650 $1,008,011 5% -27%
25820 Textbooks and Repairs $60,616,328 $82,371,535 $61,326,950 1% -26%
25840 Other Textbook Rental Services $3,658,334 $5,506,899 $4,038,815 10% -27%
25850 Direction of Resale Service $111,841 $160,807 $157,827 41% -2%
25860 Textbooks and Workbooks $6,635,235 $15,780,169 $12,529,254 89% -21%
25870 Materials and Supplies $1,115,207 $1,770,392 $1,962,208 76% 11%
25890 Other Textbook Resale Services $178,392 $314,033 $262,012 47% -17%
26497 Teachers Retirement Fund $92,379,944 $218,960,622 $232,717,462 152% 6%
41100 Transfer Tuition $42,637,034 $37,576,868 $38,900,910 -9% 4%
41300 Area Vocational Schools $21,397,417 $36,080,678 $35,578,847 66% -1%
41400 Joint Services and Supply $120,097,401 $149,891,607 $156,727,853 31% 5%
41500 lnterlocal Agreements - Special Education $1,859,937 $8,259,949 $8,597,678 362% 4%
41600 Joint Services and Supply - Other $609,557 $3,908,230 $1,766,789 190% -55%
41700 Interlocal Agreements - Other $679,141 $1,249,680 $1,076,943 59% -14%
41800 Payments to Charter Schools $0 $11,251 $2,609 n/a -77%
41900 Other $877,402 $3,914,626 $2,642,606 201% -32%
42000 Pymts. to Governmental Units - Out of State $31,505 $20,749 $16,761 -47% -19%
18Office of Management and Budget
June 3, 2008

School Corporation Expenditures by HB 1006 Expenditure Categories
Biannual Financial Report Data
Statewide
1006 Category Account FY 1997 FY 2006 FY 2007
10 Year
Increase
1 Year
Increase
43500 Debt Services TRB Transfers - Transfers Author $0 $58,368 $50,688 n/a -13%
Student Academic Achievement Total $3,295,387,688 $4,517,973,657 $4,606,087,068 40% 2%
Student Instructional Support
21110 Service Area Direction $4,061,186 $8,929,240 $10,662,818 163% 19%
21120 Attendance Services $3,035,574 $3,550,385 $3,704,663 22% 4%
21130 Social Work Services $8,090,866 $6,991,294 $7,076,546 -13% 1%
21140 Pupil Accounting $363,523 $445,443 $450,698 24% 1%
21190 Other Attendance/Social Work Services $2,477,967 $3,419,237 $3,275,129 32% -4%
21210 Service Area Direction $10,776,129 $11,423,694 $11,399,006 6% 0%
21220 Counseling Services $72,588,342 $95,084,259 $97,599,291 34% 3%
21230 Appraisal Services $345,079 $724,911 $796,730 131% 10%
21240 Information Services $410,669 $462,458 $362,353 -12% -22%
21250 Records Maintenance $307,546 $372,404 $387,819 26% 4%
21290 Other Guidance Services $501,364 $1,113,599 $1,102,275 120% -1%
21310 Service Area Direction $1,244,809 $1,241,657 $1,198,146 -4% -4%
21320 Medical Services $730,203 $5,818,800 $7,296,225 > 500% 25%
21330 Dental Services $8,878 $22,730 $23,892 169% 5%
21340 Nurse Services $21,931,917 $36,588,497 $36,641,590 67% 0%
21390 Other Health Services $1,728,112 $3,549,430 $3,754,873 117% 6%
21410 Service Area Direction $1,810,133 $2,994,714 $3,190,752 76% 7%
21420 Psychological Testing $6,914,469 $12,111,933 $12,540,067 81% 4%
21430 Psychological Counseling $1,544,759 $2,446,812 $2,653,107 72% 8%
21490 Other Psychological Services $679,985 $1,757,743 $1,804,807 165% 3%
21610 Service Area Direction $5,665,150 $14,734,425 $15,389,730 172% 4%
21690 Other Special Education Administration $2,456,091 $7,356,006 $8,044,905 228% 9%
21710 Service Area Direction $0 $426,547 $597,029 n/a 40%
21790 Other Student Services $0 $1,252,719 $1,190,392 n/a -5%
22110 Service Area Direction $20,317,931 $43,784,362 $42,345,760 108% -3%
22120 Instruction & Curriculum Development $18,113,411 $37,558,776 $39,055,164 116% 4%
22130 Instructional Staff Training Services $6,041,202 $18,497,252 $17,319,663 187% -6%
22190 Instructional Staff Training Services - Other $4,707,688 $9,409,838 $8,284,130 76% -12%
23110 Service Area Direction $4,823,426 $7,420,905 $7,182,304 49% -3%
23120 Service Area Assistants $4,534,177 $5,668,610 $5,617,480 24% -1%
23190 Other Governing Body Services $1,861,195 $4,106,100 $4,769,528 156% 16%
23210 Office of the Superintendent $50,222,402 $75,533,919 $79,203,502 58% 5%
23220 Community Relations $2,656,998 $3,382,002 $3,483,541 31% 3%
23290 Other Executive Administrative Services $7,882,837 $11,385,349 $12,801,386 62% 12%
24900 Other Support Services - School Admin. $8,872,575 $13,751,394 $14,030,220 58% 2%
26410 Service Area Direction $2,859,263 $4,696,797 $4,966,741 74% 6%
26420 Employment and Placement $1,999,188 $3,551,212 $3,565,816 78% 0%
26430 Staff Accounting Services $346,308 $391,223 $452,311 31% 16%
19Office of Management and Budget
June 3, 2008

School Corporation Expenditures by HB 1006 Expenditure Categories
Biannual Financial Report Data
Statewide
1006 Category Account FY 1997 FY 2006 FY 2007
10 Year
Increase
1 Year
Increase
26440 Inservice Training (Non-Instructional) $145,094 $672,326 $344,971 138% -49%
26450 Health Services $1,212,447 $2,455,453 $2,496,979 106% 2%
26700 Technology Coordinator $282,520 $7,149,853 $6,906,983 > 500% -3%
26710 Technology Support and Maintenance $0 $86,813,446 $94,405,526 n/a 9%
Student Instructional Support Total $284,551,414 $559,047,753 $578,374,848 103% 3%
Overhead and Operational
23150 Legal Services $6,712,950 $8,839,962 $9,507,899 42% 8%
23160 Promotion Expenses $788,075 $957,151 $1,072,304 36% 12%
23230 Staff Relations and Negotiations $2,342,211 $3,086,218 $3,129,479 34% 1%
25110 Office of the Business Manager $13,442,558 $21,568,669 $23,025,533 71% 7%
25210 Service Area Direction $3,416,324 $6,385,893 $6,062,407 77% -5%
25220 Budgeting $471,094 $536,423 $554,777 18% 3%
25230 Receiving and Disbursing Funds $1,782,278 $2,814,062 $2,609,113 46% -7%
25240 Payroll Services $3,190,371 $4,723,000 $4,890,018 53% 4%
25250 Financial Accounting $3,147,622 $5,070,007 $5,330,961 69% 5%
25260 Internal Auditing $174,407 $387,636 $371,310 113% -4%
25270 Property Accounting $224,881 $303,004 $412,926 84% 36%
25291 Refund of Revenue $4,499,884 $9,298,817 $15,008,673 234% 61%
25292 Petty Cash $31,906 $28,117 $32,763 3% 17%
25293 Printed Forms $491,112 $300,439 $255,796 -48% -15%
25295 Bank Service Charge $195,561 $370,343 $532,236 172% 44%
25296 Cash Change $61,355 $90,443 $82,916 35% -8%
25299 Other $867,494 $2,060,444 $1,554,977 79% -25%
25353 Skilled Craft Employees $4,810,841 $12,859,572 $11,456,061 138% -11%
25360 Rent of Buildings & Equipment $17,124,498 $40,926,637 $40,337,467 136% -1%
25410 Service Area Direction $11,142,744 $15,760,702 $16,202,015 45% 3%
25420 Maintenance of Buildings $435,991,006 $633,606,458 $651,089,004 49% 3%
25430 Maintenance of Grounds $10,594,118 $12,156,524 $12,686,128 20% 4%
25440 Maintenance of Equipment $58,321,082 $98,010,604 $107,115,753 84% 9%
25450 Vehicle Maintenance (other than buses) $3,061,615 $3,869,754 $3,791,713 24% -2%
25460 Security Services $8,074,735 $14,291,433 $14,458,079 79% 1%
25470 Insurance (other than buses) $26,050,457 $56,089,939 $49,360,316 89% -12%
25490 Other Operating/Maintenance of Plant $9,159,509 $10,216,492 $9,637,648 5% -6%
25510 Service Area Direction $22,023,740 $27,717,981 $28,629,030 30% 3%
25520 Vehicle Operation $105,976,777 $162,172,416 $167,504,851 58% 3%
25530 Monitoring Services $6,051,444 $10,843,230 $11,610,384 92% 7%
25540 Vehicle Servicing and Maintenance $51,268,786 $85,177,648 $89,333,167 74% 5%
25550 Purchase of School Buses $37,862,510 $76,918,438 $74,882,230 98% -3%
25560 Insurance on Buses $5,343,275 $12,159,721 $9,414,694 76% -23%
25570 Insurance on Pupils $84,986 $465,487 $462,523 444% -1%
25580 Contracted Transportation Services $72,595,805 $95,471,300 $96,093,606 32% 1%
20Office of Management and Budget
June 3, 2008
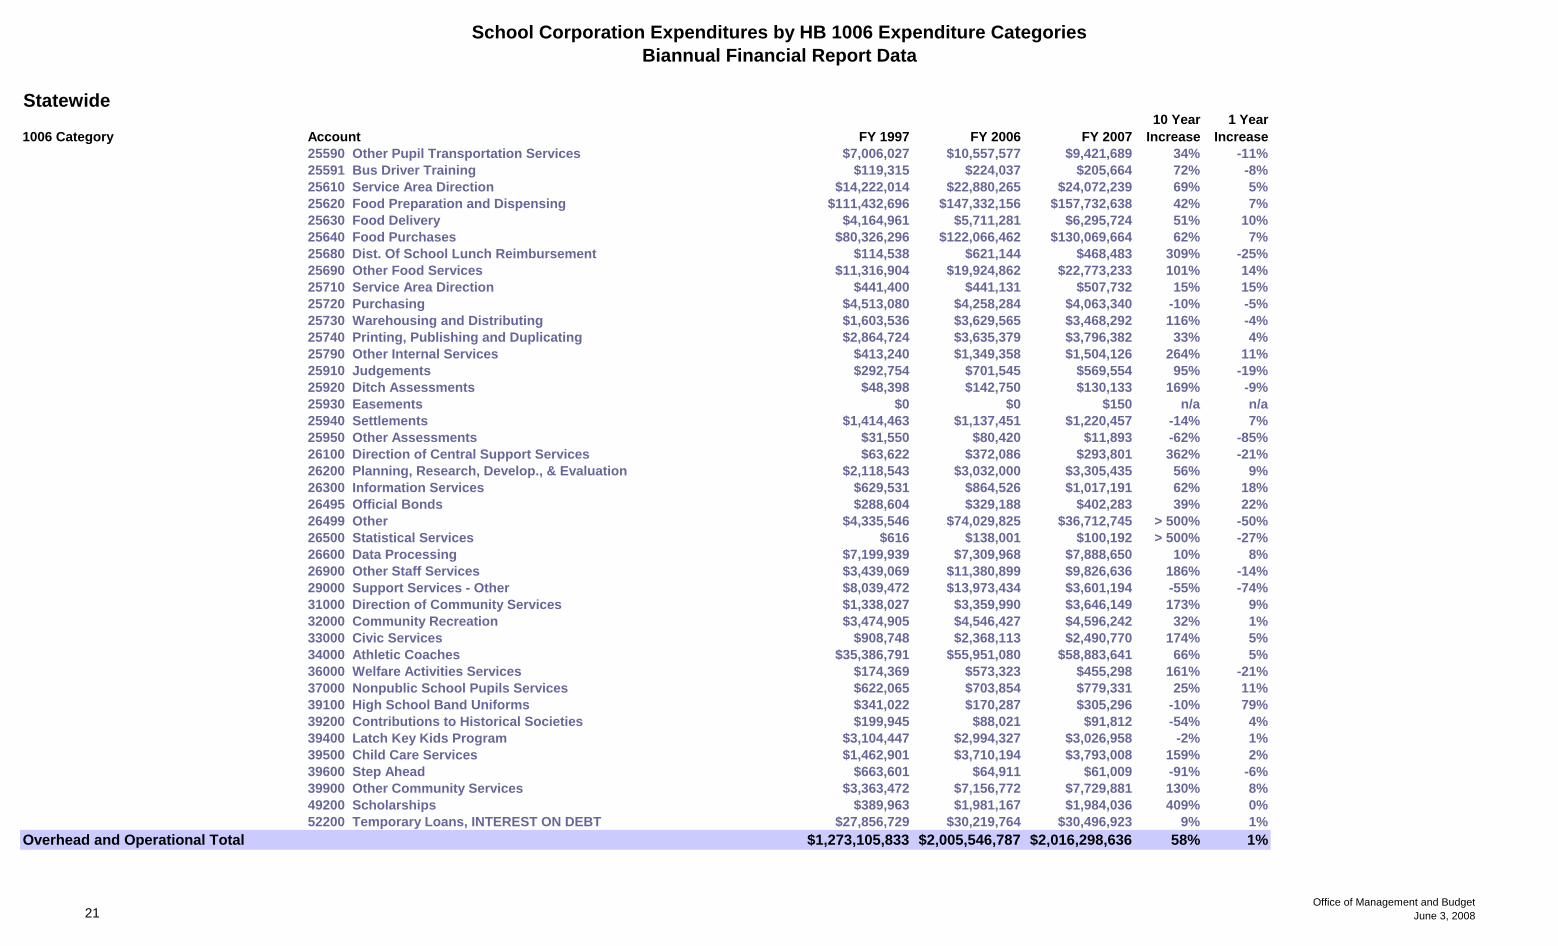
School Corporation Expenditures by HB 1006 Expenditure Categories
Biannual Financial Report Data
Statewide
1006 Category Account FY 1997 FY 2006 FY 2007
10 Year
Increase
1 Year
Increase
25590 Other Pupil Transportation Services $7,006,027 $10,557,577 $9,421,689 34% -11%
25591 Bus Driver Training $119,315 $224,037 $205,664 72% -8%
25610 Service Area Direction $14,222,014 $22,880,265 $24,072,239 69% 5%
25620 Food Preparation and Dispensing $111,432,696 $147,332,156 $157,732,638 42% 7%
25630 Food Delivery $4,164,961 $5,711,281 $6,295,724 51% 10%
25640 Food Purchases $80,326,296 $122,066,462 $130,069,664 62% 7%
25680 Dist. Of School Lunch Reimbursement $114,538 $621,144 $468,483 309% -25%
25690 Other Food Services $11,316,904 $19,924,862 $22,773,233 101% 14%
25710 Service Area Direction $441,400 $441,131 $507,732 15% 15%
25720 Purchasing $4,513,080 $4,258,284 $4,063,340 -10% -5%
25730 Warehousing and Distributing $1,603,536 $3,629,565 $3,468,292 116% -4%
25740 Printing, Publishing and Duplicating $2,864,724 $3,635,379 $3,796,382 33% 4%
25790 Other Internal Services $413,240 $1,349,358 $1,504,126 264% 11%
25910 Judgements $292,754 $701,545 $569,554 95% -19%
25920 Ditch Assessments $48,398 $142,750 $130,133 169% -9%
25930 Easements $0 $0 $150 n/a n/a
25940 Settlements $1,414,463 $1,137,451 $1,220,457 -14% 7%
25950 Other Assessments $31,550 $80,420 $11,893 -62% -85%
26100 Direction of Central Support Services $63,622 $372,086 $293,801 362% -21%
26200 Planning, Research, Develop., & Evaluation $2,118,543 $3,032,000 $3,305,435 56% 9%
26300 Information Services $629,531 $864,526 $1,017,191 62% 18%
26495 Official Bonds $288,604 $329,188 $402,283 39% 22%
26499 Other $4,335,546 $74,029,825 $36,712,745 > 500% -50%
26500 Statistical Services $616 $138,001 $100,192 > 500% -27%
26600 Data Processing $7,199,939 $7,309,968 $7,888,650 10% 8%
26900 Other Staff Services $3,439,069 $11,380,899 $9,826,636 186% -14%
29000 Support Services - Other $8,039,472 $13,973,434 $3,601,194 -55% -74%
31000 Direction of Community Services $1,338,027 $3,359,990 $3,646,149 173% 9%
32000 Community Recreation $3,474,905 $4,546,427 $4,596,242 32% 1%
33000 Civic Services $908,748 $2,368,113 $2,490,770 174% 5%
34000 Athletic Coaches $35,386,791 $55,951,080 $58,883,641 66% 5%
36000 Welfare Activities Services $174,369 $573,323 $455,298 161% -21%
37000 Nonpublic School Pupils Services $622,065 $703,854 $779,331 25% 11%
39100 High School Band Uniforms $341,022 $170,287 $305,296 -10% 79%
39200 Contributions to Historical Societies $199,945 $88,021 $91,812 -54% 4%
39400 Latch Key Kids Program $3,104,447 $2,994,327 $3,026,958 -2% 1%
39500 Child Care Services $1,462,901 $3,710,194 $3,793,008 159% 2%
39600 Step Ahead $663,601 $64,911 $61,009 -91% -6%
39900 Other Community Services $3,363,472 $7,156,772 $7,729,881 130% 8%
49200 Scholarships $389,963 $1,981,167 $1,984,036 409% 0%
52200 Temporary Loans, INTEREST ON DEBT $27,856,729 $30,219,764 $30,496,923 9% 1%
Overhead and Operational Total $1,273,105,833 $2,005,546,787 $2,016,298,636 58% 1%
21Office of Management and Budget
June 3, 2008

School Corporation Expenditures by HB 1006 Expenditure Categories
Biannual Financial Report Data
Statewide
1006 Category Account FY 1997 FY 2006 FY 2007
10 Year
Increase
1 Year
Increase
Nonoperational
25310 Service Area Direction $983,964 $2,067,540 $2,802,355 185% 36%
25320 Land Acquisition and Development $17,204,606 $27,992,529 $27,408,111 59% -2%
25330 Professional Services $37,826,764 $52,887,342 $47,433,514 25% -10%
25340 Educational Specifications Development $3,196,769 $383,131 $1,250,661 -61% 226%
25350 Building Acquisition/Construction/Improvement $233,233,077 $170,186,769 $124,763,782 -47% -27%
25351 Building Acquisition/Construction/Improvement $95,160,050 $328,800,265 $309,984,063 226% -6%
25352 Energy Savings Contracts $6,731,565 $34,207,342 $24,074,226 258% -30%
25355 Sports Facilities $0 $8,920,816 $12,541,618 n/a 41%
25370 Purchase of Moveable Equipment $10,121,195 $12,899,088 $8,490,919 -16% -34%
25380 Purchase of Mobile or Fixed Equipment $127,264,900 $136,374,016 $131,167,828 3% -4%
25390 Other Facilities Acquisition & Construction $14,041,319 $18,712,983 $15,761,679 12% -16%
51100 Bonds, PRINCIPAL OF DEBT $23,652,446 $105,918,621 $97,977,981 314% -7%
51300 Emergency Loans, PRINCIPAL OF DEBT $154,545 $517,984 $525,570 240% 1%
51400 School Bus Loans, PRINCIPAL OF DEBT $1,265,847 $111,422 $113,199 -91% 2%
51500 Bond Anticipation Loans, PRINCIPAL OF DEBT $3,960,805 $38,602,942 $2,045,339 -48% -95%
51600 Other Tax Board Approved Debt, PRINCIPAL OF DE $247,377 $9,137,773 $14,191,326 > 500% 55%
52100 Bonds, INTEREST ON DEBT $13,481,069 $53,274,322 $58,349,845 333% 10%
52300 Emergency Loans, INTEREST ON DEBT $35,965 $129,484 $32,800 -9% -75%
52400 School Bus Loans, INTEREST ON DEBT $228,247 $10,132 $14,214 -94% 40%
52500 Bond Anticipation Loans, INTEREST ON DEBT $349,551 $1,481,141 $513,145 47% -65%
52600 Other Tax Board Approved Debt, INTEREST ON DEB $64,448 $4,372,179 $3,964,800 > 500% -9%
53100 Buildings, LEASE RENTAL $410,659,656 $808,044,728 $850,554,726 107% 5%
53150 Buildings - Interest $0 $15,894,017 $40,073,842 n/a 152%
53200 Equipment, LEASE RENTAL $2,738,740 $3,085,311 $2,660,355 -3% -14%
53250 Equipment, LEASE RENTAL interest $0 $1,839 $4,575 n/a 149%
53300 School Buses, LEASE RENTAL $0 $569,184 $555,947 n/a -2%
53400 Other Lease Rental Interest Principal $0 $0 $19,712 n/a n/a
53450 Other Lease Rental $0 $0 $5,650 n/a n/a
54100 Veterans’ Memorial Loan, ADVANCEMENTS & OBLIGA $1,024,532 $2,519,167 $1,782,187 74% -29%
54200 Common School Fund, ADVANCEMENTS & OBLIGATIONS $39,231,687 $72,596,923 $84,723,657 116% 17%
54300 Civic Aid Bond Obligations, ADVANCEMENTS & OBL $29,736 $733,263 $495,732 > 500% -32%
59100 Bond Registrars Fee $71,829 $90,424 $379,359 428% 320%
59200 Bond Bank Fee $45,990 $658,637 $1,152,663 > 500% 75%
Nonoperational Total $1,043,006,678 $1,911,181,312 $1,865,815,379 79% -2%
prorated
26491 PERF $58,125,722 $79,215,411 $83,816,845 44% 6%
26492 Social Security $268,827,783 $361,638,737 $368,969,515 37% 2%
26493 Workmen’s Compensation $11,673,174 $28,645,604 $25,017,297 114% -13%
26494 Group Insurance $398,509,855 $995,047,696 $1,072,992,496 169% 8%
22Office of Management and Budget
June 3, 2008

School Corporation Expenditures by HB 1006 Expenditure Categories
Biannual Financial Report Data
Statewide
1006 Category Account FY 1997 FY 2006 FY 2007
10 Year
Increase
1 Year
Increase
26496 Unemployment Compensation $1,153,772 $5,824,414 $5,169,540 348% -11%
26498 Severance/Early Retirement Pay $19,697,181 $164,404,431 $160,855,369 > 500% -2%
prorated Total $757,987,488 $1,634,776,293 $1,716,821,061 126% 5%
Not Categorized
11990 $1,623,651 $880,167 $1,051,150 -35% 19%
25990 $1,343 $0 $0 -100% n/a
41200 $1,030,519 $15,407 $15,751 -98% 2%
12000 Special Programs $0 $205,264 $269,929 n/a 32%
14000 Summer School Programs $92,116 $0 $0 -100% n/a
23000 Support Services - General Administration $10,000 $0 $1,000 -90% n/a
26000 Support Services - Central $186 $0 $0 -100% n/a
39000 Other Community Services $377,431 $335,220 $299,703 -21% -11%
40000 Nonprogrammed Charges $942 $9,093 $2,567 172% -72%
59000 Other Debt Services $96,502 $11,045 $62,122 -36% 462%
Not Categorized Total $3,232,689 $1,456,197 $1,702,223 -47% 17%
1006 Category FY1997 FY2006 FY2007
10 Year
Increase
1 Year
Increase
FY97 %
of Total
Exp
FY06 %
of Total
Exp
FY07 %
of Total
Exp
Student Academic Achievement $3,864,113,198 $5,770,154,462 $5,915,971,483 53% 3% 58.0% 54.3% 54.9%
Student Instructional Support $343,538,973 $676,865,769 $707,894,173 106% 5% 5.2% 6.4% 6.6%
Overhead and Operational $1,401,666,825 $2,267,899,810 $2,290,724,496 63% 1% 21.1% 21.3% 21.2%
Nonoperational $1,044,720,104 $1,913,605,760 $1,868,806,840 79% -2% 15.7% 18.0% 17.3%
Not Categorized $3,232,689 $1,456,197 $1,702,223
Grand Total $6,657,271,790 $10,629,981,998 $10,785,099,214 62% 1%
FY1997 FY2006 FY2007
Student Instructional Expenditures (Academic Achievement plus Support) 63.2% 60.6% 61.4%
23Office of Management and Budget
June 3, 2008