state of hawaii department of labor & industrial relations research & statistics office...
TRANSCRIPT

State of Hawaii
Department of Labor & Industrial Relations
Research & Statistics Office
Melonie Ogata

What is LMI
• Data and Analyses that describes economic and regional local labor market conditions in a certain area

Labor Market Information Section
I. Labor Force Research Unit• Employment
• Unemployment
• Job count by Industry
• Hours & Earnings

Labor Market Information Section (continued)
II. Labor Market Research Unit• Prepares analyses on the economy
& local job market
• Conducts the Occupational Employment Statistics survey
• Develops industry & occupational projections

Labor Market Information
III. Career Kokua• Careers – Career Information
Delivery System
• Education
• Training

• Unemployment Rates
• Civilian Labor Force
• Number of Employed
• Number of Unemployed
Labor Force Statistics

AUG 2014 JUL 2014 AUG 2013Seasonally Adjusted
STATE 4.3 4.4 4.8U.S. 6.1 6.2 7.2
Not Seasonally Adjusted STATE 4.1 4.6 4.7HONOLULU 3.8 4.2 4.2
HAWAII COUNTY 5.3 6.1 6.4
KAUAI 4.7 5.1 5.4
MAUI COUNTY 4.2 4.7 5.0
Maui Island 4 4.5 4.8
Molokai 14.1 12 10.5
Lanai 2.4 2.7 3.2
U.S. 6.3 6.5 7.3
Aug 2014 Jul 2014 Aug 2013*
Labor Force 662,700 662,050 648,450
Employment 634,150 632,900 617,650
Unemployment 28,600 29,100 30,800
State of Hawaii Seasonally Adjusted Labor Force Data**
Unemployment Statistics – August 2014

Rank State Rate1 NORTH DAKOTA 2.82 NEBRASKA 3.62 SOUTH DAKOTA 3.62 UTAH 3.65 VERMONT 4.16 HAWAII 4.36 MINNESOTA 4.38 NEW HAMPSHIRE 4.49 IOWA 4.510 WYOMING 4.611 IDAHO 4.7
11 MONTANA 4.711 OKLAHOMA 4.714 KANSAS 4.915 COLORADO 5.116 TEXAS 5.3
Ranking of Unemployment Rates by States
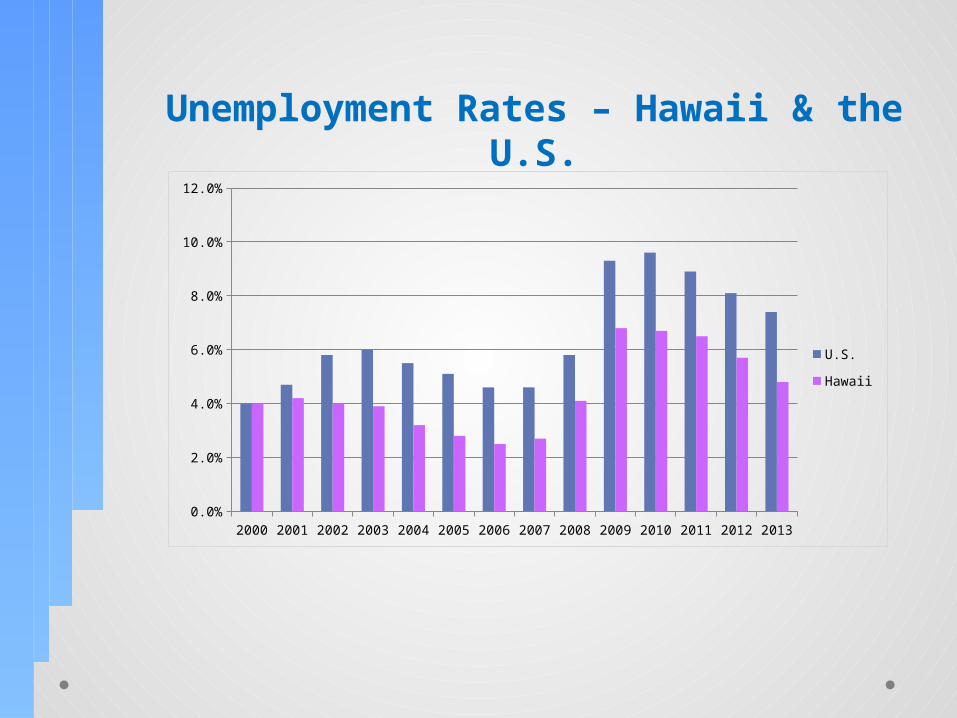
2000 2001 2002 2003 2004 2005 2006 2007 2008 2009 2010 2011 2012 20130.0%
2.0%
4.0%
6.0%
8.0%
10.0%
12.0%
U.S.
Hawaii
Unemployment Rates – Hawaii & the U.S.

Quarterly Census of Wages and Employment
• Formerly known as ES-202 Program
• Provides employment and wages of establishments reporting to UI programs
• Covers approximately 97% of wage and salary civilian employment

Government20% Agriculture,
Forestry, Fishing & Hunting
1%
Mining, Quarrying, & Oil & Gas
0.1%
Construction5%
Manufacturing2%
Utilities1%
Wholesale Trade3%
Retail Trade11%
Transportation &Warehousing4%Information
2%
Finance & Insurance2%
Real Estate & Rental & Leasing2%
Professional & Technical Services4%
Management of Companies & Enterprises
1%
Administrative & Waste Services8%
Educational Services2%
Health Care & Social Assistance
10%
Arts, Enter-tainment,
& Recreation2%
Accommodation & Food Services
16%
Other Services, Except Public 4%
4TH Quarter 2013 Distribution of Statewide Average Employment

Current Employment Statistics (CES)
• Produces monthly industry employment and hours and earnings data
• Data based on monthly survey of business establishments
• Benchmarked annually

2003 2004 2005 2006 2007 2008 2009 2010 2011 2012 2013530.0
540.0
550.0
560.0
570.0
580.0
590.0
600.0
610.0
620.0
630.0
567.7
583.4
601.7
617.1
624.9
619.2
591.5
586.9
593.4
606.3
617.6
Thousa
nds
of
Jobs
Nonagricultural Wage & Salary Jobcount, 2003-2013, State of Hawaii (CES Data)

Difference in Nonagricultural Wage & Salary Jobcount, 2007 to 2013, State of Hawaii
Education & Health Services
Professional & Business Services
Government
Leisure and Hospitality
Other Services
Manufacturing
Information
Financial Activities
Trade, Transportation & Utilities
Nat. Resources & Mining & Construction
6,000
3,050
2,700
850
100
-1,750
-2,100
-2,950
-4,850
-8,300

Occupational Employment Statistics
• Employment and wage data for approximately 800 occupations
• SOC codes
• Provides mean wages and median wages

SOC Median Mean Wage
Code Occupational Title Employment Wage Hourly Annual
41-2031 Retail Salespersons 24,370 $10.92 $12.31 $25,610
43-9061 Office Clerks, General 14,440 $14.39 $14.90 $30,980
41-2011 Cashiers 14,380 $10.41 $11.17 $23,240
35-3031 Waiters and Waitresses 13,800 $10.81 $13.91 $28,930
35-3021 Combined Food Preparation and Serving Workers, Including Fast Food 12,980 $8.97 $9.72 $20,220
37-2011 Janitors and Cleaners, Except Maids and Housekeeping Cleaners 12,710 $12.10 $12.59 $26,180
37-2012 Maids and Housekeeping Cleaners 12,420 $15.63 $15.26 $31,740
11-1021 General and Operations Managers 10,440 $39.47 $46.94 $97,630
29-1141 Registered Nurses 10,300 $41.32 $41.05 $85,380
33-9032 Security Guards 9,540 $11.50 $12.80 $26,620
43-6014 Secretaries and Administrative Assistants, Except Legal, Medical, and Executive 9,230 $17.64 $18.02 $37,480
37-3011 Landscaping and Groundskeeping Workers 8,730 $14.59 $14.65 $30,480
35-2014 Cooks, Restaurant 8,280 $12.75 $14.06 $29,250
35-2021 Food Preparation Workers 7,730 $10.71 $11.76 $24,460
43-5081 Stock Clerks and Order Fillers 7,530 $12.07 $12.97 $26,970
41-1011 First-Line Supervisors of Retail Sales Workers 7,340 $19.87 $22.74 $47,300
49-9071 Maintenance and Repair Workers, General 7,160 $19.96 $20.54 $42,730
43-3031 Bookkeeping, Accounting, and Auditing Clerks 7,120 $17.29 $17.68 $36,770
53-7062 Laborers and Freight, Stock, and Material Movers, Hand 7,110 $13.26 $14.76 $30,700
43-4051 Customer Service Representatives 6,770 $15.47 $16.58 $34,480
Wages of Hawaii's 20 Largest Occupations in 2013
Occupational Employment Statistics

Occupational Employment Statistics
SOC Code Occupational Title Hawaii U.S. Calif. Nevada Florida
41-2031 Retail Salespersons $25,610 $25,370 $26,740 $27,040 $24,200
43-9061 Office Clerks, General $30,980 $29,990 $32,930 $31,720 $27,450
41-2011 Cashiers $23,240 $20,420 $23,620 $22,060 $19,510
35-3031 Waiters and Waitresses $28,930 $20,880 $22,490 $22,270 $21,230
35-3021 Combined Food Preparation and Serving Workers, Incl. Fast Food $20,220 $18,880 $20,600 $19,790 $19,060
37-2011 Janitors and Cleaners, Exc. Maids and Housekeeping Cleaners $26,180 $25,140 $27,140 $27,630 $21,890
37-2012 Maids and Housekeeping Cleaners $31,740 $22,130 $25,200 $29,630 $20,160
11-1021 General and Operations Managers $97,630 $116,090 $125,250 $104,830 $117,340
29-1141 Registered Nurses $85,380 $68,910 $96,980 $78,800 $62,060
33-9032 Security Guards $26,620 $27,550 $27,600 $27,490 $22,940
43-6014 Secretaries and Administrative Assistants, Exc. Legal, Medical, and Executive $37,480 $34,000 $38,260 $38,020 $30,380
37-3011 Landscaping and Groundskeeping Workers $30,480 $26,300 $28,600 $27,100 $23,610
35-2014 Cooks, Restaurant $29,250 $23,440 $24,540 $27,450 $24,150
35-2021 Food Preparation Workers $24,460 $21,110 $21,290 $27,320 $21,320
43-5081 Stock Clerks and Order Fillers $26,970 $24,940 $26,650 $26,050 $23,600
41-1011 First-Line Supervisors of Retail Sales Workers $47,300 $41,450 $44,330 $42,430 $41,750
49-9071 Maintenance and Repair Workers, General $42,730 $37,710 $41,340 $44,570 $32,970
43-3031 Bookkeeping, Accounting, and Auditing Clerks $36,770 $37,250 $41,910 $37,010 $33,910
53-7062 Laborers and Freight, Stock, and Material Movers, Hand $30,700 $26,690 $27,270 $30,040 $25,030
43-4051 Customer Service Representatives $34,480 $33,370 $39,310 $32,460 $29,350
...Compared to U.S., California, Nevada, and Florida Wages in 2013

Industry and Employment Projections
• Both long-term and short-term industry and occupational projections generated
• QCEW data used to compile historical data
• OES statistics provide staffing patterns

2012 Projected 2022
53,540 56,150
562,410614,100
48,830
59,220
Total Industry Employment, 2012 and 2022
Goods ProducingServices ProvidingSelf Employed & Unpaid Family Workers
Industry Employment Projections, 2012-2022

Employment Distribution by Major Industry Sector, 2012
Natural Resources & Mining1%
Construction4% Manufacturing
2%
Trade, Transportation, & Utilities
17%
Information1%
Financial Activities4%
Professional & Business Services
12%Education & Health Services19%
Leisure & Hospitality16%
Other Services 4%
Government11%
Self Employed & Unpaid Family Workers8%
Goods-Producing Services-Providing Self Emp & Unpaid Workers

Numerical Change Percentage Increase
Education & Health Services
Professional & Business Services
Trade, Transportation, & Utilities
Leisure & Hospitality
Construction
Other Services
Self Employed & Unpaid Family Workers
Financial Activities
Manufacturing
Information
Natural Resources & Mining
Government
17,970
10,710
10,340
9,700
9,310
2,690
2,610
2,140
970
370
120
-2,220
Construction
Professional & Business Services
Education & Health Services
Other Services
Leisure & Hospitality
Trade, Transportation, & Utilities
Financial Activities
Manufacturing
Self Employed & Unpaid Family Workers
Information
Natural Resources & Mining
Government
32%
14%
14%
11%
9%
9%
8%
7%
5%
4%
2%
-3%
Industry Growth, State 2012-2022

Retail Salespersons
Comb Food Prep & Svng Wkrs, Inc Fast Food
Registered Nurses
Personal Care Aides
Carpenters
Maids & Housekeeping Cleaners
General & Operations Managers
Nursing Assistants
Janitors & Cleaners
Construction Laborers
Secretaries & Admin Assistants
2,530
2,400
1,800
1,700
1,640
1,500
1,270
1,260
1,240
1,160
1,160
$29,780
$26,180
$49,0200
Postsecondary Non-degree Award
< High School
<High School
$31,740
$97,630
<High School
Bachelor’s Degree
$23,440
$67,650 High School
< High School
Associate’s Degree$85,380
< High School$20,220
$25,610 < High School
Wages Education
$37,480 High School
Occupations with the Largest Job Growth, State of Hawaii, 2012-2022

Personal Care Aides
Information Security Analysts
Home Health Aides
Skincare Specialists
Helpers--Carpenters
Cost Estimators
Market Research Analysts & Mrktng Speclsts
Cement Masons & Concrete Finishers
Construction Laborers
Meeting, Convention, & Event Planners
Elevator Installers & Repairers
42%
40%
39%
34%
34%
33%
30%
29%
28%
28%
28%
$65,200
$49,020
$51,060
< High School
< High School
Bachelor’s Degree
$74,830
$57,260
Bachelor’s Degree
Bachelor’s Degree
$33,140
$47,150 <High School
Postsecondary Non-Degree Award
< High School$23,600
Bachelor’s Degree$80,930
$23,440 < High School
Wages Education
$95,580 High School
Fastest Growing Occupations, State of Hawaii, 2012-2022

GrowthAverage
Annual
Industry 2013 Q1 2015 Q1 Net Percent Growth
Construction 29,640 34,600 4,960 16.7% 8.4%
Prof essional and Business Services 78,640 83,100 4,460 5.7% 2.8%
Self Employed and Unpaid Family Workers 55,020 57,320 2,300 4.2% 2.1%
Total, All I ndustries 673,600 700,470 26,880 4.0% 2.0%
Leisure and Hospitality 109,220 113,380 4,160 3.8% 1.9%
Trade, Transportation, and Utilities 115,570 119,850 4,290 3.7% 1.9%
Education and Health Services* 132,000 136,300 4,300 3.3% 1.6%
I nf ormation 8,370 8,620 250 3.0% 1.5%
Financial Activities 26,640 27,410 770 2.9% 1.5%
Manuf acturing 13,360 13,640 290 2.1% 1.1%
Other Services 24,230 24,750 520 2.1% 1.1%
Government 74,500 75,070 570 0.8% 0.4%
Natural Resources and Mining 6,410 6,440 20 0.4% 0.2%
Employment
Industry Employment and Growth, 2013-2015, State of Hawaii
Short-Term Projections, 2013-2015

Occupational Employment and Growth, 2013-2015, State of Hawaii
Growth
Occupational Group 2013 Q1 2015 Q1 Net Percent Growth Replmt. Total
Construction and Extraction 32,070 35,740 3,670 11.5% 5.7% 1,840 510 2,350
Installation, Maintenance, and Repair 25,660 26,840 1,170 4.6% 2.3% 590 550 1,140
Transportation and Material Moving 39,890 41,680 1,800 4.5% 2.3% 910 960 1,860
Healthcare Practitioners and Technical 29,110 30,400 1,290 4.4% 2.2% 650 530 1,180
Service 179,410 186,980 7,560 4.2% 2.1% 3,780 5,700 9,480
Total, All Occupations 673,600 700,470 26,880 4.0% 2.0% 13,590 16,680 30,270
Management, Business & Financial Oper. 80,150 83,270 3,120 3.9% 2.0% 1,560 1,480 3,040
Sales and Related 68,220 70,560 2,340 3.4% 1.7% 1,170 2,320 3,490
Office and Administrative Support 94,460 97,140 2,680 2.8% 1.4% 1,450 2,040 3,490
Computer, Engineering, and Science 27,990 28,770 780 2.8% 1.4% 400 580 970
Production 15,920 16,350 430 2.7% 1.3% 220 350 580
Education, Legal, Comm. Svc., Arts, Media 73,850 75,760 1,910 2.6% 1.3% 950 1,460 2,410
Farming, Fishing, and Forestry 6,860 6,990 130 1.8% 0.9% 60 200 270
Employment AverageAnnualGrowth
Average Annual Openings
Short-Term Projections, 2013-2015
HIWI Website www.hiwi.org