state of florida department of natural...
TRANSCRIPT

STATE OF FLORIDADEPARTMENT OF NATURAL RESOURCES
Tom Gardner, Executive Director
DIVISION OF RESOURCE MANAGEMENTJeremy A. Craft, Director
FLORIDA GEOLOGICAL SURVEYWalter Schmidt, State Geologist and Chief
INFORMATION CIRCULAR NO. 107PART 1: 1988 AND 1989 FLORIDA PETROLEUM
PRODUCTION AND EXPLORATIONBy
Jacqueline M. Lloyd
INCLUDING FLORIDA PETROLEUM RESERVE ESTIMATESBy
Charles H. Tootle
PART II: PETROLEUM EXPLORATION AND DEVELOPMENT POLICIES IN FLORIDA:RESPONSE TO PUBLIC CONCERN FOR SENSITIVE ENVIRONMENTS
ByJacqueline M. Lloyd
andJoan M. Ragland UNIVERSITY OF FLORIDA LIDARI
PART III: PETROLOGY AND PROVENANCE OF THENORPHLET FORMATION, PANHANDLE, FLORIDA
ByGreg W. Scott
Published for theFLORIDA GEOLOGICAL SURVEY
Tallahassee1991
i

DEPARTMENTOF
NATURAL RESOURCES
DE"
LAWTON CHILESGovernor
JIM SMITH BOB BUTTERWORTHSecretary of State Attorney General
TOM GALLAGHER GERALD LEWISState Treasurer State Comptroller
BETTY CASTOR BOB CRAWFORDCommissioner of Education Commissioner of Agriculture
TOM GARDNERExecutive Director
ii

LETTER OF TRANSMITTAL
Florida Geological SurveyTallahasseeJune 1991
Governor Lawton Chiles, ChairmanFlorida Department of Natural ResourcesTallahassee, Florida 32301
Dear Governor Chiles:
The Florida Geological Survey, Division of Resource Management, Department of Natural Resources,is publishing three petroleum-related reports as its Information Circular 107. Part I is "1988 and 1989Florida Petroleum Production and Exploration;" Part II, "Petroleum Exploration and Development Policiesin Florida: Response to Public Concern for Sensitive Environments;" and Part III: "Petrology andProvenance of the Norphlet Formation, Panhandle, Florida." These reports discuss 1988 and 1989 oiland gas production and exploration, the history of Florida's petroleum policy and legislation, and thegeology of the gas-producing Norphlet Formation, respectively. This information is useful to the oil andgas industry and to the state in planning wise development of Florida's oil and gas resources.
Respectfully yours,
Walter Schmidt, Ph.D., P.G.State Geologist and ChiefFlorida Geological Survey
iii

Printed for theFlorida Geological Survey
Tallahassee1991
ISSN 0085-0616
iv

CONTENTS
PagePart I: 1988 and 1989 Florida Petroleum Production and Exploration.......................................... vi
Part II: Petroleum Exploration and Development Policies in Florida:Response to Public Concern for Sensitive Environments .................................................. 63
Part III: Petrology and Provenance of the Norphlet Formation, Panhandle, Florida....................... 83
v

PART I
1988 AND 1989 FLORIDA PETROLEUMPRODUCTION AND EXPLORATION
ByJacqueline M. Lloyd, P.G. #74
vi

TABLE OF CONTENTSPage
Abstract.................................................................................................................................................. xAcknowledgements................................................................................................................................ xIntroduction ............................................................................................................................................ 11988 and 1989 Production.................................................................................................................. 11988 and 1989 Onshore Drilling Activity.............................................................................................. 8Offshore Drilling Activity......................................................................................................................... 8
Exploratory Drilling in State W aters ............................................................................................... 81988 and 1989 Exploratory Drilling in Federal W aters,Offshore Florida........................................ 11
Geophysical Exploration Activity.......................................................................................................... 12Florida Oil Field Descriptions.............................................................................................................. 12
North Florida Oil Field Sum maries ................................................................................................. 15Introduction.................................................................................................................................... 15Bluff Springs Field ......................................................................................................................... 15McDavid Field................................................................................................................................ 17Jay Field ........................................................................................................................................ 19Coldwater Creek Field................................................................................................................ 19Blackjack Creek Field.............................................................................................................. 22Mt. Carmel Field ............................................................................................................................ 22McLellan Field ............................................................................................................................... 25Sweetwater Creek Field ............................................................................................................. 25
South Florida Oil Field Summaries ................................................................................................ 28Introduction.................................................................................................................................... 28Lehigh Park Field .......................................................................................................................... 28Townsend Canal Field................................................................................................................ 28W est Felda Field ........................................................................................................................... 30M id-Felda Field.............................................................................................................................. 30Sunoco Felda Field ....................................................................................................................... 30Corkscrew Field............................................................................................................................. 32Lake Trafford Field ........................................................................................................................ 32Sunniland Field.............................................................................................................................. 34Seminole Field............................................................................................................................... 34Bear Island Field ........................................................................................................................... 34Pepper Ham mock Field.............................................................................................................. 37Baxter Island Field......................................................................................................................... 37Raccoon Point Field ................................................................................................................ 37Forty Mile Bend Field ................................................................................................................. 37
Sum mary................................................................................................................................................ 39References............................................................................................................................................. 40
ILLUSTRATIONS
Figure Page
1. South Florida oil field location map.............................................................................................. 2
2. Stratigraphic nomenclature, Upper Jurassic to Lower Cretaceous, south Florida....................... 3
vii

3. Northwest Florida oil field location map....................................................................................... 4
4. Stratigraphic nomenclature, Middle Jurassic to Lower Cretaceous, northwest Florida............... 5
5. Oil production, 1970 through 1989 .............................................................................................. 6
6. 1987, 1988, and 1989 oil production comparison........................................................................ 7
7. Oil exploration wells, Florida state waters .................................................................................. . 9
8. Mesozoic structural features in Florida and offshore................................................................... 10
9. 1988 and 1989 oil exploration wells and active leases, federal waters, offshore Florida............ 13
10. 1988 and 1989 geophysical exploration activity .......................................................................... 14
11. Bluff Springs and McDavid fields structure map, top of Smackover Formation........................... 16
12. Geophysical log correlation, Bluff Springs and McDavid fields.................................................... 18
13. McDavid field production curve.................................................................................................... 20
14. Jay field structure map, top of Smackover Formation ................................................................ 21
15. Blackjack Creek structure map, top of Smackover Formation..................................................... 23
16. Mt. Carmel field structure map, top of Norphlet Sandstone......................................................... 24
17. McLellan and Sweetwater Creek fields well location map........................................................... 26
18. Geophysical log correlation, McLellan field ................................................................................. 27
19. Lehigh Park field structure map, top of Sunniland Formation...................................................... 29
20. Sunoco Felda, West Felda, and Mid-Felda fields structure map, top of Sunniland Formation....... 31
21. Corkscrew and Lake Trafford fields structure map, top of Sunniland Formation......................... 33
22. Sunniland field structure map, top of Sunniland Formation......................................................... 35
23. Bear Island field structure map, base of anhydrite in Upper Sunniland Formation...................... 36
24. Raccoon Point field preliminary structure map, top of Sunniland Formation............................... 38
viii

APPENDICES
Appendix Page
1. Florida oil field discovery well data .............................................................................................. 43
2. 1988, 1989 and cumulative production data................................................................................ 45
3. 1988 and 1989 field well statistics ............................................................................................... 47
4. 1988 and 1989 field wells drilled.................................................................................................. 49
5. 1988 and 1989 wildcat wells drilled ............................................................................................. 51
6. Oil exploration wells drilled in Florida state waters...................................................................... 54
7. 1988 and 1989 oil exploration wells drilled in federal waters, offshore Florida............................ 57
8. 1988 and 1989 geophysical exploration activity .......................................................................... 59
9. Florida oil and gas reserve estimates.......................................................................................... 61
ix

ABSTRACT
Florida oil production began to decline in 1979 and continued to do so during 1988 and 1989. Jayfield, as the leading producing field for Florida, controls the rate of decline.
Onshore exploratory drilling during 1988 and 1989 resulted in the discovery of McDavid field inEscambia County and Coldwater Creek field in Santa Rosa County. Offshore exploratory drillingincluded six wells which were completed in federal waters off Florida during 1988 and 1989; one of thesewas the second Norphlet discovery in the Destin Dome area and was classified by the federalgovernment as a producible field.
Geophysical exploration during 1988 and 1989 concentrated in the Florida panhandle and the southFlorida peninsula. The panhandle exploration included the known oil-producing Santa Rosa andEscambia Counties, an area offshore from Santa Rosa and Escambia Counties, and the ApalachicolaEmbayment area. South Florida seismic activity was east of the known Sunniland-producing trend inBroward, Dade, Hendry and Palm Beach Counties.
In addition to 1988 and 1989 data, a summary of offshore exploratory drilling in state waters, from 1947through 1983, is included in this report. This information may be useful in evaluating future offshore andonshore development and exploration. Of similar value are descriptions of each of Florida's 22 oil fields.Descriptions include discovery data, geologic information, and production totals.
ACKNOWLEDGEMENTS
Several Florida Geological Survey staff members contributed to this report. Charles Tootle compiledoil field data and production statistics. The Oil and Gas Section maintains files on permitted exploratoryand development drilling. Joan Ragland and Charles Tootle provided comments and assistance in usingthese files. Joan Ragland tabulated and assisted with the interpretation of the geophysical explorationpermit data. Joel Duncan assisted with the interpretation of geophysical logs from the recently-discovered McDavid field. Jim Jones and Ted Kiper drafted and photographed the figures. WaltSchmidt, Tom Scott, Ed Lane, Joan Ragland, and Joel Duncan edited the manuscript and suggestedimprovements.
x

Information Circular 107
1988 AND 1989 FLORIDA PETROLEUM PRODUCTION AND EXPLORATIONBy
Jacqueline M. Lloyd, P.G. #74
INTRODUCTION number of production, injection, shut-in, andtemporarily abandoned wells for each field.
There are two major oil producing areas in Jay field dominates Florida production. The
Florida. One is the Sunniland trend in South field was discovered in 1970 and reached peak
Florida, the other is in the western panhandle production in 1978. It accounts for about 61
area. The Sunniland trend includes 14 oil fields; percent of the 1988 oil production total, about 66
the western panhandle includes eight. Appendix percent of the 1989 total, and about 70 percent
1 lists the discovery well data for these fields. of the cumulative total. Figure 5 graphically
The Sunniland trend production began with illustrates both state wide annual oil production
Florida's first oil discovery at Sunniland field in and Jay field annual oil production for 1970
September, 1943. Of the 14 Sunniland trend oil through 1989, clearly showing Jay field's
fields, 10 are active, one is temporarily shut-in, dominance in Florida oil production trends. The
and three are plugged and abandoned. These Jay field production curve is typical of oil fields
fields are oriented along a northwest-southeast produced with tertiary recovery methods (David
trend through Lee, Hendry, Collier, and Dade Curry, Oil and Gas Section Administrator, Florida
Counties (Figure 1). Production is principally Geological Survey, personal communication,
from rudistid reefs found in the upper one 1990). Production has leveled off during the last
hundred feet of the Lower Cretaceous Sunniland three years (1987, 1988, and 1989, Figure 5).
Formation (Figure 2). This generally agrees with the projections made
Production in the western panhandle began by Christian, et al. (1981) in their discussion of
with the discovery of Jay field in June, 1970. The tertiary recovery estimates for Jay field. They
eight panhandle oil fields are located in predicted a production plateau of about 10,000
Escambia and Santa Rosa Counties, Florida barrels/day for about 12 years (1984 through
(Figure 3). Seven fields are active and one is 1996). They estimated that tertiary recovery
plugged and abandoned. Production is from would be terminated in 1996, followed by rapid
Upper Jurassic Smackover Formation decline to depletion in about 2004. Total
carbonates and Norphlet Sandstone sands production will be about 84.7 million barrels; 37.5
(Figure 4). million would have been produced throughwaterflood alone (Christian, et al., 1981).
Figure 6 is a histogram comparing 1987, 1988,1988 AND 1989 PRODUCTION and 1989 oil production for all Florida oil fields
except Jay field. Jay field data would obscurethe information for all other fields since its
Florida oil production began to decline in 1979 production for 1987 was five times greater thanand has continued to do so since then (Figure 5). that of West Felda field, the next most productiveTotal oil production for 1988 was 7,746,048 field in Florida during 1987. Northwest Floridabarrels, down 6% from 1987. Production production increased by one percent from 1987dropped another 6% during 1989 for a 1989 total to 1988 and by two percent from 1988 to 1989.of 7,289,390 barrels. Appendix 2 lists 1988, South Florida production decreased by 181989, and cumulative production statistics for percent from 1987 to 1988 and by 24 percenteach of Florida's oil fields including oil, gas, and from 1988 to 1989.water production data. Appendix 3 lists 1988and 1989 field well statistics including the
1

Florida Geological Survey
R24E _ R26E _ R28E_ ___R30E_ _ R32E_ ___ R34E R____B36E
.. .. .. i • .-•.. . - - i -- . . . ' --r--------------------------LEHIGH PARK ISo |TOWNSEO D CANAL" I '
MID- ELA HENDRCO.I8UNOCO-FELDA ILEE CO PALM
SWES LD -- --- -- BEACHrnORKSCREW1FIELDiCEI
SLAK T RAFF D -- - I -
) 8UNmLAND 0 8EMINOLE
EAR ISI NDI
T-- i----------------
PEPPER AMMOCK 1SBAXTER ISLAND
S I BROWARD
O .I 0 J
S( S PEPCOLLER C •.IRAC O POINT I
-g------- --- - -------
IDADE CO.
LORoA LANATION FORTY MILE BEND
MONROE CO.-----SACTIVE OIL FIELD
0 INACTIVE OIL FIELD
0 10 MILES
F0S050491
Figure 1. South Florida oil field location map.
2

Information Circular 107
2S STAGE GROUPS AND FORMATIONS LITHOLOGY
(/)
Cl)
RATTLESNAKE HAMMOCK _ _ _ _ _ .,.J FORMATION A A -A-A-,r
J ______ AAAAAAAAAAAAA_
n LAKE TRAFFORD5< FORMATION
0 SUNNILAND FORMATION I----------------------------- A'AAiAAAAA'AAAiA
PUNTA GORDA ANHYDRITE AAAAAAAAAAAA&AAAAAAAAAAAAA
S APTIANM ABLE MEMBER ,AAA, ,AA AAAA,
0 Il 0 TWELVE MILE BROWN:0 < MEMBER DOLOMITE
n0 3 ZONEIx L 00:
3 o -J WEST FELDA SHALE
PUMPKIN BAY FORMATION A'AA A A A
BARRIAMIAN A A A
HAUTERIVIAN .VALANGINIAN BONE ISLAND FORMATION
BERRIASIAN f
AAAAAAAAAAAAALAAAAAAAAAAAAAAAAAAAAAAAAAA
AAAAAAAAAAAAA
vi- WOOD RIVER FORMATION ^----AAA.I) i i I I I I I
=< TITHONIAN -, .. i. .
BASSHALE
CLASTICS A ANHYDRITE FGS060491
Figure 2. Stratigraphic nomenclature, Upper Jurassic to Lower Cretaceous, south Florida.
3

Florida Geological Survey
R33W R32W R31W R3" R2 W CR2E .R27W 2W1-3w - --- T.CARMEL FIELO( *
- -_ I- McLELLAN IIELD
BLUFF SPRINGS FID JAY FIED SWEETWATER
COLDWATERJ .o- .AD FIELD - - •REEIEL --.
! 1 dI LACKJACK I* CREEK FIELDO --
.. IK --- \ -.- x - ----- -4 --
EXPLANATION .
A ACTIVE OIL FIELDv, ,- -
( INACTIVE OIL FIELD 4^
5 0 5 KM "''MILTON5 0 5 MILES - --CANTONMENT0 i
SCALE iI
FLORIDA
LOCATIONX'.
ENSAAOLA
FGS010491
Figure 3. Northwest Florida oil field location map.
4

Information Circular 107
SYSTEM STAGE GROUPS AND FORMATIONS LITHOLOGY
LOW ER ................CRETACEOUS BERRIASIAN
TITHONIAN UNDIFFERENTIATED ::::::::
UPPER HAYNESVILLE .?:: . .:.:.KIMMERIDGIAN FORMATION .......
UPPER *.JURASSIC , AAAAAAAAA. -BUCKNER. A... ..... ...
AA AAAAAAAAA i
MEMBER "A""" """
LOWER (LOWER -"" 1KIMMERIDGIAN HAYNESVILLE S .. , ,
FORMATIO.N)
SMACKOVER . ,, , ,,•FORMATION . . ... . .
OXFORDIAN _____,__I,_I'_I'I
NORPHLET SANDSTONE f "- .
JURASC CALLOVIAN LOUANN SALT
: SANDSTONE ::::: : SILTSTONE SHALE
^ LIMESTONE DOLOMITE CONGLOMERATE
i CLASTICS A ANHYDRITE SALT
FGS070491
Figure 4. Stratigraphic nomenclature, Middle Jurassic to Lower Cretaceous, northwest Florida.
5

Florida Geological Survey
FLORIDA OIL PRODUCTION1970 THROUGH 1989
50
40
10
0 41970 1972 1974 1976 1978 1980 | 1982 1984 1986 1988 |
1971 1973 1975 1977 1979 1981 1983 1985 1987 1989YEAR
0 Joy Field + State Wide FGS080491
Figure 5. Oil production, 1970 through 1989.
6

Information Circular 107
1.1
0.9 -
V) 0.8 -w
0.7 -
2 0.6Oo
, I 0.5 -
0.4 --J0
0.3 -
0.2 -
1 2 3 4 5 6 7 8 9 10 11 12 13 14 15 16
ACTIVE FLORIDA OIL FIELDS EXCLUDING JAY1987 1988 1989 FGS90491
FGS090491
FIELD PLOT CODEWest Felda 1Raccoon Point 2Blackjack Creek 3Bear Island 4Corkscrew 5Lehigh Park 6Sunoco Felda 7Mid-Felda 8Townsend Canal 9Bluff Springs 10Mt. Carmel 11Sunni land 12McLellan 13Lake Trafford 14McDavid 15Coldwater Creek 16
Figure 6.1987,1988, and 1989 oil production comparison.
7

Florida Geological Survey
1988 and 1989 ONSHORE DRILLING Exploratory Drilling in State WatersACTIVITY
A total of 19 wells have been drilled in FloridaOnly three development wells were drilled state waters from 1947 through 1983 (Appendix
during 1988 and 1989. A description of these 6 and Figure 7). Effective July, 1990, all drillingwells is given in Appendix 4. One of these was activity was prohibited in Florida state watersan injection well drilled at Jay field in Santa Rosa (details are discussed in Part II of thisCounty. One was the first offset to the McDavid publication); however, the information obtainedfield discovery well in Escambia County and was from the wells that were drilled in state watersplugged and abandoned as a dry hole. The may be useful in future decisions concerningMcDavid field discovery and this offset are offshore exploration and development in federaldiscussed under the "Florida oil fields waters.descriptions" section of this report. The third The 19 offshore wells tested three differentdevelopment well was completed as a potential potential oil horizons. Ten of the wells are withinproducer at Raccoon Point field in Collier County. the South Florida Basin (off Charlotte and Lee
Sixteen exploratory wells were drilled during Counties and off the Florida Keys, Monroe1988 and 1989 (Appendix 5). Eleven of these County, Figure 8) and targeted the Lowerwere drilled in northwest Florida; the remaining Cretaceous. The six wells drilled off the Floridafive were drilled in south Florida. Only one well panhandle sought to extend the onshore (andwas completed as a potential producer. This offshore Alabama) Jurassic production (Figurewas the discovery well for McDavid field 4). The remaining three wells drilled off the(Escambia County). northern portion of the Gulf coast (Permits 304,
Coldwater Creek field was also discovered in 382 and 383) were Cretaceous or possibly1988 with the first production test of the Red Paleozoic tests (Applegate and Lloyd, 1985).Rock Oil and Minerals Corporation - Pittman As shown in Appendix 6, only one of the wellsEstate No. 26-2A in Santa Rosa County. Further drilled in state waters had a significant oil show.discussion of this field is in the "Florida oil field A drill stem test of the Gulf Oil-Florida Statedescriptions" section of this report. Lease 826-Y (permit 275), located near the
Marquesas Keys off Monroe County, recovered15 barrels of 220 A.P.I. gravity oil and 14.1
OFFSHORE DRILLING ACTIVITY barrels of saltwater from the Lake Trafford (?)Formation. Another well, which was drilled in
State ownership of the continental shelf off federal waters near the Marquesas, tested blackFlorida extends three miles into the Atlantic saltwater in the Lake Trafford and SunnilandOcean and about 10.5 miles (three marine Formations and in the Brown Dolomite intervalleagues) into the Gulf of Mexico. The federal (Applegate and Lloyd, 1985). Charles Tootlegovernment controls resources beyond these (1985, Florida Geological Survey, personalstate boundaries out to 200 miles. The Outer communication, in Applegate and Lloyd, 1985)Continental Shelf (OCS) is a jurisdictional term believed this well could be a low volume oilthat describes the offshore area which is under producer from the Lake Trafford and Sunnilandcontrol of the federal government. "Federal Formations.waters," in this context, does not refer to Applegate (1987) conducted an extensiveownership, but rather to responsibility (Johnson study of the Brown Dolomite Zone of the Lehighand Tucker, 1987). Acres Formation in the South Florida Basin. He
concluded that this zone could be a potentiallyprolific producing horizon offshore. He found that
8

Information Circular 107
P-251" 17,9817 ./ /7,479 198939
P2-281 10,526 P NMEP6-430PH O 7 7,004 1961 TF0E09 14,332 1959
1147 1968
1L4,710C1967
N - P-3821967
P-304 \10,563
LEGEND
* APPROXIMATE WELL LOCATION
P-280 FLORIDA PERMIT NUMBER
TOTAL DEPTH OF WELL, P36,009 P-37 1FEET BELOW MSL 1 910
1967 11959 WELL COMPLETION DATE P-297.-
1961 P-289 3 113,961 15431960
SCALE
0 50 100 150 MILES
0 80 160 240 KILOMETERS p-232 -',P-275 12,59915,422 1955 ,
FGS020491 P-292 4* P-16 1 097,686 P-298 6,077 \1961 1,793 1947 P-22
1962 15,4321947
Figure 7. Oil exploration wells, Florida state waters.
9

Florida Geological Survey
N/
I
o o SOUTH EAST00 GEORGIA EMBAYMENT
% BLAKE
SII PLATEAUS \1S '* BASIN
\ \ LAKE OKEECHOBEE
"/'•'•'• 300M \"') fT ^ j BAHAMAS300M SOUTH F ORIDA l BASIN
ORB A S IN DOT
I6. 4S,-- -CAY SAL ARCHMARQ ESAS /.
CAY SAL
do ,\ , IN, CAYO COCO
\ ^ CUBA
MESOZOIC/ STRUCTURAL FEATURES
YUCATAN PEN. IN FLORIDAAND OFFSHORE
// SCALE/ 100 0 100 200 300 400 500 mNls
* a A I I n a
FGS100491
Figure 8. Mesozoic structural features in Florida and offshore (after Applegate, 1987).
10

Information Circular 107
the best development of the Brown Dolomite County, Florida (Appendix 6, Figure 7). Twoonshore is in Charlotte and surrounding counties tests in the Smackover Formation produced onlyin the northern part of the South Florida Basin at saltwater. The Norphlet Sandstone anda depth of about 12,000 feet. Here, the Brown underlying Louann Salt, which together areDolomite Zone attains a maximum thickness of responsible for production in the Mobile Bay100 feet, of Which about one-half is porous and fields, were very thin in this well (Applegate andcapable of high volume fluid production. Lloyd, 1985).Offshore, the maximum thickness occurs near The three wells drilled off Levy, Citrus, andthe Marquesas Keys, where about 400 feet of Pinellas Counties do not fall within the obviousmostly porous dolostone has been found. Very target areas discussed above. None of theselittle oil staining has been found in the Charlotte wells had significant oil shows or porous zones.County area, but staining has been observed in Two of the three penetrated Paleozoic rocks; thethe Marquesas area, as discussed above, third bottomed in the Lower Cretaceous
Applegate (1987) concluded that the best (Appendix 6). These may have been drilled withpossibility for finding oil in the Brown Dolomite interest in both the Lower Cretaceous and theZone appears to be in the offshore portion of the Paleozoic potential. Amoco drilled five PaleozoicSouth Florida Basin. Brown Dolomite is present wildcat wells to the north of this area (Taylor,in at least three wells on the Sarasota Arch Madison, Lafayette, and Dixie Counties) in the(Figure 8) and probably continues around the rim early 1980's (Applegate and Lloyd, 1985). Allof the basin southeast to the Marquesas, where were dry holes and none had any shows of oil.thick porous dolostone is present. Applegate Paleozoics in Florida range from Devonian to(1987) believed that stratigraphic and structural Ordovician or Cambrian in age, and are faunallytraps associated with this dolostone, which is related to African rocks (Cramer, 1971, 1973).capped by dense limestone and anhydrite, may Production from the West African rocks spurredhave led to the formation of giant oil fields. interest in Florida; however, the Florida
In addition to this South Florida Basin Paleozoic sandstones are extremely induratedpotential, there has been interest in extending and have very little porosity or permeabilityJurassic production in the Florida panhandle (Applegate and Lloyd, 1985).area. Jurassic production occurs onshore in theJay trend area (Figure 3) from the SmackoverFormation and Norphlet Sandstone (Figure 4). 1988 and 1989 Exploratory Drilling in FederalThere is also Jurassic production twenty miles to Waters, Offshore Floridathe west of the Florida - Alabama boundarywhere several natural gas fields produce from The first federal oil and gas lease sale offthe Norphlet Sandstone in Alabama state waters Florida was conducted in May, 1959 off thein Mobile Bay. The Mary Ann gas field was the Florida Keys in what is now the Straits of Floridafirst of these to be discovered in 1979. An Planning Area. Ten additional OCS lease salesadditional six natural gas fields have been have occurred since then; seven in the Easternestablished in Alabama state waters since then Gulf of Mexico Planning Area and three in the(Masingill, 1989). Recoverable reserves have South Atlantic Planning Area. There have beenbeen estimated at 4.93 to 8.12 trillion cubic feet no sales in the Straits of Florida Planning Areaof natural gas (Mink, et al., 1987). off Florida since the 1959 sale. The last lease
A Jurassic test, the Getty Oil-Florida State sale in the South Atlantic Planning Area offLease 2338, Well No. 1 (permit 1097), was Florida was Sale 78 in July, 1983.drilled in 1983 to a total depth of 18,011 feet The two most recent lease sales off Florida(-17,981 feet MSL) in East Bay, Santa Rosa were in the Eastern Planning Area. They were
11

Florida Geological Survey
Sales 79 and 94, held in January, 1984 and five were withdrawn or canceled by theJanuary, 1985, respectively. Eastern Planning applicants, and four were placed on hold by theArea Sale 116, held in November 1988, excluded applicants. Appendix 8 summarizes the data forall areas originally proposed off the Florida coast these applications, including total survey mileage(see Part II of this publication for more details). by area (panhandle onshore, panhandleLease sales 79 and 94 are discussed in offshore, and south Florida) and by surveyApplegate and Lloyd (1985) and Lloyd and method (vibrator, airgun, and seismic gel).Applegate (1987). Historic leases in the Eastern Geophysical exploration was concentrated inPlanning Area are shown on Figure 9. the Florida panhandle and the south Florida
Six wells were completed off the Florida peninsula (Figure 10). The panhandlepanhandle during 1988 and 1989 (Figure 9). exploration included the known oil-producingAppendix 7 includes data on these wells (Gould, Santa Rosa and Escambia Counties, an area1989). Three of the wells were in the Pensacola offshore from Santa Rosa and Escambiaarea; three were in the Destin Dome area. The Counties, and an area east of the knownprincipal drilling targets in these areas are the production covering Okaloosa, Bay, Gadsden,Smackover Formation and the Norphlet Holmes, Jackson, Leon, Wakulla andSandstone (Figure 4); however, three of the Washington Counties. This activity indicateswells were drilled to less than 3,000 feet, which is interest in potential east of the known productiontoo shallow to have penetrated these potential including the Apalachicola Embayment area.targets. One of the Destin Dome area wells The Apalachicola Embayment area was(Chevron-6406, block 56, Figure 9) was a discussed by Applegate, et al. (1978) as an areaNorphlet discovery and is described as a with significant Smackover oil potential. Southproducible field by Gould (1989). The Amoco- Florida seismic activity was east of the known8338 well, which was completed in Destin Dome Sunniland-producing trend in Broward, Dade,block 111 in 1987, was also a Norphlet discovery Hendry and Palm Beach Counties.described by Gould (1989) as a producible field.This was the first commercial discovery in theEastern Gulf of Mexico Planning Area (Gould, FLORIDA OIL FIELD DESCRIPTIONS1989). The Oil and Gas Journal (1989)discusses the Chevron-6406 well and quotes Applegate and Lloyd (1985) provided a briefChevron USA Inc. as stating that "the well was history of each of Florida's oil fields includingnot tested due to safety and cost considerations, discovery data, geologic information, andHowever, analysis of cores and wireline logs production totals. Structure maps wereindicates the presence of gas in the Norphlet presented whenever possible. This publication issandstone." These two discoveries extend the now out-of-print; therefore, this information isoffshore Norphlet gas trend seaward and summarized again and presented in this report.eastward from the Mobile map area of the Somewhat more detailed information isCentral Gulf of Mexico Planning Area, offshore presented for the five oil fields discovered sinceAlabama, into the Florida offshore. 1985. These are Bluff Springs, McDavid,
Coldwater Creek, and McLellan fields in northFlorida and Corkscrew field in south Florida.
GEOPHYSICAL EXPLORATION ACTIVITY Fields are discussed in approximate geographicorder from north to south and west to east
Twenty-two geophysical permits applications (Figures 1 and 3).were received by the Florida Geological Surveyduring 1988; 15 were received during 1989. Ofthese 37 applications, 31 have been permitted,
12

Information Circular 107
PENSACOLA
GULI9STAR 6398
SOUTH ATLANTICPLANNING AREA
DESTIN DOME-APALACHICOLA GAINESVILLE
DE SOTO CANYON FLORIDA MIDDLE GROUND TARPON SPRINGS
LLOYD RIDGES THE ELBOW I SAINT PETERSBURG
EASTERN GULF OF MEXICO
PLANNING AREA
- -___VERNON BASIN-.
!_ CHARLOTTE HARBOR
HOWELL HOOK PULLEY RIDGE S O
EXPLANATION uNSOIL EXPLORATION RANKIN
WELL LOCATIONS
SHISTORIC LEASES
-- DISTRICT AREAS -N- TORTUGASPLANNING AREAS
0 25 50 MILES \
0 40 80 KILOMETERS STRAITS OF FLORIDAFGS110491 SCALE PLANNING AREA
Figure 9. 1988 and 1989 oil exploration wells and historic leases, federal waters, offshore Florida(Gould, 1989).
13

Florida Geological Survey
LEGEND
PERMITTED AND SURVEYED
PERMITTED) NOT SURVEYED
APPLICATION RECEIVED) NOT PERMITTED
SCALE
0 50 100 150 MILES
0 80 160 240 KILOMETERS ell
F08120491 ADD
Figure 10. 1988 and 1989 geophysical exploration activity.
14

Information Circular 107
North Florida Oil Field Summaries Petroleum Corp. St Regis Paper Co. number 29-INTRODUCTION ^4 (permit 1125), was a rank wildcat located in
Section 29, Township 5 North, Range 31 West,Escambia County (Appendix 1). It is
Production in north Florida began with the approximately 10 miles west-southwest of Jaydiscovery of Jay field in June, 1970. There are field and approximately four miles southeast ofnow eight panhandle oil fields located in the nearest previously drilled wildcat, permitEscambia and Santa Rosa Counties, Florida 1177 (Figures 3 and 11). This area, west and(Figure 3). Seven fields are active and one is southwest of Jay, is known to be underlain byplugged and abandoned. Production is from Louann Salt, with seismic studies indicating salt-Upper Jurassic Smackover Formation induced fault structures in the overlyingcarbonates and Norphlet Sandstone sands formations (Lloyd and Applegate, 1987). Seismic(Figure 4). data has been interpreted by Hughes Eastern
Jay field is located within a trend which Corporation (1988) (Figure 11) to indicateextends through Escambia and Santa Rosa several small structures in a northwest-to-Counties in Florida, and Escambia County, southeast trend in this specific area.Alabama. Other fields within the trend include The discovery well produced 477 barrels of oilMt. Carmel, Coldwater Creek, and Blackjack and 170 barrels of saltwater per day. Oil gravityCreek fields in Florida and Fanny Church, was 57.00 A.P.I.. Production is from Jurassic-Flomaton, and Big Escambia Creek fields in age Smackover Formation dolostones fromAlabama. The fields are located along a normal -16,154 to -16,161 feet MSL. These dolostonesfault complex which rims the Gulf Coast through are dark brownish-gray to brownish-black, fineAlabama, Mississippi, Louisiana, Arkansas, and grained, microcrystalline, and show evidence ofTexas (Moore, 1984). recrystallization from originally oolitic and
Bluff Springs and McDavid fields are located possibly pelletal facies (Lloyd, 1986; Lloyd andwest and southwest of the Jay trend in an area Applegate, 1987).known to be underlain by Louann Salt, with The first offset, permit 1136 (Stone Petroleumseismic studies indicating salt-induced fault Corporation - St. Regis Paper Company numberstructures in the overlying formations (Lloyd and 29-3) is located about one-half mile northwest ofApplegate, 1987). The remaining two north the discovery well (Figure 11). The SmackoverFlorida oil fields, McLellan and Sweetwater Formation was encountered at -16,171 feet MSL,Creek, are located east of the Jay trend, near the structurally 17 feet lower than in the discoveryapproximate updip limits of the Smackover well (Figure 12). The well produced onlyFormation (Lloyd, 1989; Applegate et al., 1978; saltwater from two thin zones (-16,182 to -16,185Ottman et al., 1973 and 1976) and could be the feet MSL and -16,192 to -16,195 feet MSL;result of stratigraphic pinchouts. They are also Figure 12) within the upper Smackover. Corelocated within the area known to be underlain by analysis by Location Sample Service, Inc. (LSS),the Louann Salt and may have salt-related trap Jackson, Mississippi, yielded mean porositystructures. Current data does not reveal which estimates for these zones of 11.4 and 8.4trapping mechanism produced the Smackover percent, respectively. LSS found a trace of oil inreservoirs for these fields. one sample at -16,185 feet MSL. This well may
be located too low on the structure. Alternatively,BLUFF SPRINGS FIELD as shown on the structure map (Figure 11) drawn
by Hughes Eastern Corporation (1988; based on
Bluff Springs field was discovered on March geophysical and well data), Hughes believes
25, 1984. The discovery well, the Stone there may be a permeability barrier between thediscovery well and this well.
15

BLUFF SPRINGS20 21 22 AND McDAVID FIELDS
ESCAMBIA COUNTY, FLORIDA
BLUFF SPRINGS FIELD STRUCTURE MAPB(L 29 I TOP OF SMACKOVER FORMATION roo PERMEAILITY BARRIER? (AFTER HUGHES EASTERN CORP., 1988)
S28 27(PIl36 2oo0:p 11 2 --.
6 1 7 6 1 -16075,P33 --1204•"• n-,' ,P12
POSSIBLE 1 2oo POSSIBLE 0 c
OIL/WATER \- 9 OCONTACT 0 .so
EXPLANATION ---- -- --- - T 5 N
P1136 PERMIT NUMBER T4<--N <
-16176 DEPTH
* PRODUCER , "
IDRY HOLE McDAVID FIELD
0 PERMITTED LOCATION (NOT DRILLED) 3 2
C.I. = 50 FEET0 rsGso34
Figure 11. Bluff Springs and McDavid fields structure map, top of Smackover Formation (after Hughes Eastern Corporation, 1988).

Information Circular 107
Ownership of the discovery well transferred to southeast trend in this specific area.Hughes Eastern Corporation in 1985. Permits The discovery well produced 235 barrels of oilwere issued to Hughes Eastern to drill two per day and no saltwater. Oil gravity was 53.80additional offsets, one east and one southeast of A.P.I.. Production is (as it is for Bluff Springsthe discovery well (permits 1204 and 1205, field) from Jurassic-age Smackover FormationFigure 11). Permit 1204 was completed in dolostones from -16,075 to -16,089 feet MSL.August 1986. The Smackover was again found These dolostones were described by LSS asat a structurally lower position (Figure 12), this gray to dark gray, sucrosic to granular, with poortime 44 feet lower. Two zones of saltwater to fair porosity and permeability. Examination ofproduction were also encountered (-16,208 to core chips with a binocular microscope concurs-16,211 feet MSL and -16,215 to -16,233 feet with this description. Core analysis by LSSMSL; Figure 12). LSS core analysis yielded yielded a mean porosity estimate of 15.9 percentmean porosity estimates of 23.9 and 13.6 for this zone. Geophysical log analyses bypercent, respectively, and no indications of oil. Charles Tootle (Appendix 9) yielded a meanAs interpreted by Hughes Eastern Corporation porosity estimate of 12.8 percent, an original oil(1988) (Figure 11), the Smackover in this well is in place estimate of 4,987,347 barrels, and abelow the probable oil-water contact. The third recoverable oil estimate of 498,736 barrels.offset, permit 1205, has not been drilled. This The first offset, permit 1234 (Hughes Easternwell is now actually closer to the more recently Corporation - Jones Estate number 34-1) isdiscovered McDavid field (discussed below) and located about one-half mile southeast of theis outside the potential productive limits drawn by discovery well (Figure 11, Appendix 4). TheHughes Eastern Corporation (1988) (Figure 11). offset was completed in June 1989. The
Production to date at Bluff Springs is solely Smackover Formation was encountered atfrom the discovery well. Total production for -16,099 feet MSL, structurally 24 feet lower thanBluff Springs field, as of the end of 1989, was in the discovery well (Figure 12). The structure220,000 barrels of oil (Appendix 2). map (Figure 11) was drawn prior to the time this
well was drilled. In fact, the map was submittedto the Florida Geological Survey in support of a
MCDAVID FIELD request for an non-regular location for this well.As shown on the map, Hughes Eastern
McDavid field was discovered on June 14, Corporation expected to encounter the
1988 with the first production test of the Smackover at about -16,050 feet MSL in this
discovery well, the Hughes Eastern Corp. well. Based on the actual depth (-16,099 feet
Walker-Baley number 34-2 (permit 1230). The MSL), the McDavid structure is probably smaller
well is located in Section 34, Township 5 North, than that shown. The productive limit expected
Range 31 West, Escambia County (Appendix 1). by Hughes is still below this depth (at about
It is about one and one-half miles southeast of -16,200 feet, Figure 11); however, analysis of
the Bluff Springs discovery well (Figures 3 and geophysical logs from this well indicate that the
11). As discussed above for Bluff Springs field, oil-water contact may actually be at about
this area, west and southwest of Jay, is known to -16,102 feet MSL (Joel Duncan, Florida
be underlain by Louann Salt, with seismic studies Geological Survey, personal communication,
indicating salt-induced fault structures in the 1991). In addition, production from the discovery
overlying formations (Lloyd and Applegate, well appears to have peaked around December
1987). Seismic data has been interpreted by 1988 and may have depleted this small structure
Hughes Petroleum Corp (1988) (Figure 11) to enough to move the potential productive limits
indicate several small structures in a northwest to above the level of the Smackover in the offset
17

BLUFF SPRINGS FIELD MCDAVID FIELD
.* *
.. .. . . 90 L
Figure 12. Geophysical log correlation, Bluff Springs and McDavid fields.

Information Circular 107
(Figure 13) (Joel Duncan, Florida Geological 1981; Vinet, 1984; Moore, 1984; Bradford, 1984;Survey, personal communication, 1991). Lloyd et al., 1986).
As with Bluff Springs field, production from Despite the complexity of the Jay fieldMcDavid field is solely from the discovery well. Smackover Formation reservoir, exploration andProduction from this one-well field, as of development of the field have been extremelyDecember 1989, totaled about 121,000 barrels of successful. Core analyses were combined withoil (Appendix 2). bottom hole pressure data, porosity log
information, and other geologic data to arrive at ahighly successful reservoir management program
JAY FIELD (Shirer et al., 1978; Langston et al., 1981;Langston and Shirer, 1985).
Jay field was discovered in June, 1970, by the As of December 1989, Jay field was producingdrilling of the Humble St. Regis number 1 (permit from a total of 44 wells, 43 wells were temporarily
417) in Section 43, Township 5 North, Range 29 shut-in, and there were 27 injection wells. One
West, Santa Rosa County (Figures 3 and 14 and of these injection wells was completed in 1989
Appendix 1). The well produced from the (Appendix 4). Total production for Jay field, as of
Smackover Formation from -15,264 to -15,318 the end of 1989, was 365,479,000 barrels of oil
feet MSL. The initial production test yielded (Appendix 2).
1712 barrels of 50.70 A.P.I. gravity oil and 23barrels of saltwater per day.
Jay field is located within the "Jay trend" of COLDWATER CREEK FIELDEscambia and Santa Rosa Counties, Florida andEscambia County, Alabama (discussed in north Coldwater Creek field was discovered on JuneFlorida oil fields introduction above). The 4, 1988. The discovery well was a reentry of anorthern extension of Jay, in Escambia County, Smackover wildcat. The original permit wasAlabama, is the Little Escambia Creek (LEC) issued to Inexco Oil Company (permit 1173).field. Oil accumulation at Jay is within an The location is about two miles east of theasymmetric anticline with the fault complex southern portion of Jay field in Section 26,forming the eastern barrier to oil migration Township 5 North, Range 29 West, Santa Rosa(Figure 14) (Applegate and Lloyd, 1985). County (Figure 3). Inexco began drilling in
The northern limit of Jay field is a porosity November, 1985. They drilled the well to a totalbarrier in Alabama where the lithology changes depth of -15,407 feet MSL, logged the well, andfrom porous dolostone to dense, micritic recommended plugging and abandonment.limestone. The porosity at Jay field is due to The top of the Smackover Formation haddolomitization of the pelletal grainstones in the been encountered at -14,969 feet MSL; theupper, regressive section of the Smackover Norphlet Sandstone at -15,331 feet MSL. SideFormation. Dolomitization, fresh water leaching, wall core analyses by Location Sample Service,and an anhydrite cap rock (Buckner Member of Inc. (Jackson, Mississippi) indicated a potentialthe Haynesville Formation, Figure 4) have oil productive zone from -14,985 to -15,016 feetformed a complex, extensive reservoir. MSL. Mean porosity of the zone was about 14.8Numerous analyses of the Jay area Smackover percent. Analysis of the same interval byFormation, including comparisons with modern Charles Tootle yielded a mean porosity of aboutcarbonate environments, have been made in 12 percent, an original oil in place estimate ofattempts to understand this complex reservoir 2,080,107 barrels, and a recoverable oil estimate(Ottman et al., 1973 and 1976; Sigsby, 1976; of 312,016 barrels (Appendix 9).Mancini and Benson, 1980; Lomando et al., Louisiana Land and Exploration Company
19

Florida Geological Survey
McDavid Field Production
11
10 -
9-
8 -
7 -
C° 6
21-
5/88 588 9/8811/88 1/89 3/89 5/89 7/89 9/8911/896/88 8/88 10/88 12/88 2/89 4/89 6/89 8/89 10/89 12/89
D Oil Production + Water Production FGS160491
Figure 13. McDavid field production curve.
2020

Information Circular 107
SJAY FIELD*" " I I •\\ I E.Mi tantma I Could , F ,
25 30 0 29 28 27 I
"--"'". V STRUCTURE MAP_I~ - -1- - -. -TOP OF SMACKOVER-NORPHLET~--- -' "...--• •^ i OL POOL
II•- o (JO y-LEC F ld n i Ut eooicma l Co ti , 1074)
/ 4 948T-O. N- i ... -4 93-
-- i A **" ' e . 474 463 450 493 01 '*-I16 4 1 6-UM 884A \ u7573 L 4
I , 3/ \5 9- 5 D.,s, / 27U * u ' G 0 96IA 36
- 172I 451 494 453
-- \^ 1 5 30 -1214 4 / -156
144 -1
0 **15845/ \7.... -6 1 47 15104
T5N- 492 . 57 ". . 49 / -883- 481 -, -- --167 -1 6 15 15 6 -15 1971 443 39
48496 , 4---16
\1I I \ \ 91 8 \ @4-9,. 5114 - 516.106 59"4 89 \ \ \\
\1 \ \' *- 13_ -15197 4Z9
7. - - - 1 68-4 5 1
S-1S147 i005 -4-1 5434 1161 1 'O3
i L2 6.5 8 ^\ 31 2\\ \94 11_I % I .708 11 I -1.-.1
+ DRY HOL \
E-.-.-.4 4 Wb/I"
^
-16976 - - -- - - - - - \ -4 17 52 1 5 50 r2 10 90_ 1
® WATWRHIECIMON WELL | \ * I
C.A2 50A FEET 2 1
444 * 478 -2 IIQ6 • 1 F7 5 3 qA02 4P1
,I -152 06 94 -15-15412 *-1l43 0-1... 1073 • 537 69. V •
iCommittee, 1974).
I114 91 1 1 1 *" 5469"I
I " - \1 5 I -1523I, 967 0 5 611\
14 21 1
-I '- -- --- - - - 525 -- - - -
KIN
+WDRYnHOwE - -- - -- -
-... OL/WAIECONTACT, 1074 525 PNM
C.L 0 FEET
F68650491
Figure 14. Jay field structure map, top of Smackover Formation (after Jay-LEC Fields Unit GeologicalCommittee, 1974).
21

Florida Geological Survey
(LL&E) took over operations on January 10, 1986 water production from the Norphlet Sandstone,and plugged and abandoned the well. Bruxoil, the well was recompleted as a SmackoverInc. then took over responsibility for the well. Formation producer from -15,633 to -15,743They conducted a geophysical survey across the feet MSL. The initial production test from thearea (geophysical permit G-70-86; see Lloyd, Smackover, on January 22, 1975, yielded 1,4281989). The stated purpose was to determine barrels of 51.2° A.P.I. gravity oil and nowhether to reenter the existing well or drill at a saltwater.new location. They decided not to reenter the Blackjack Creek field now produces primarilywell and have not submitted any permit from oolitic dolostones of the Smackoverapplications to drill in the vicinity. Formation (Applegate and Lloyd, 1985). The
In 1987, Red Rock Oil and Minerals trapping structure is an anticline located on theCorporation, received permit 1220 (Appendix 1) downthrown, southwest side of the regionalto reenter the well. They completed redrilling on Foshee Fault System (Figure 15). Similar to JayMay 24, 1987 and ran the first production test on field, Blackjack Creek has been carefully coredJune 4, 1988. This test yielded 152 barrels per and analyzed to achieve a successful reservoirday of 46.5° A.P.I. gravity oil and 280 barrels per management and development program.day of saltwater. In a retest on December 27, About 160,000 barrels of oil have been1988, the well flowed 259 barrels per day of produced from the Norphlet Sandstone at46.5' A.P.I. gravity oil with no saltwater Blackjack Creek field. The remaining production,production. Production is from the zone 54,322,000 barrels through December 1989discussed above, from -14,984 to -15,006 feet (Appendix 2), is from the Smackover. ThroughMSL in the Smackover Formation. Judging from January 1990, 20 producing wells had beenthe field's location within the Jay trend, it appears drilled at Blackjack Creek; only five dry holes hadthat reservoir formation may have been been drilled. Nine wells were actively beingstructurally related to the Foshee Fault System; produced as of December 1989 (Appendix 3).however, a single well does not yield sufficientinformation to test this hypothesis.
No additional wells have been drilled at MT. CARMEL FIELDColdwater Creek field. Total production, as ofDecember 1989, from Coldwater Creek field was Mt. Carmel field was discovered in December9,000 barrels of oil from this single well 1971 by LL&E. The discovery well was the LL&E(Appendix 2). - Finley Heirs number 39-3 (permit 504), located
about one mile east of Jay field in Section 39,Township 5 North, Range 29 West, Santa Rosa
BLACKJACK CREEK FIELD County (Figures 3 and 16). Initial production was1,440 barrels of 470 A.P.I. gravity oil per day with
The Blackjack Creek field discovery well was no saltwater.the Humble Oil and Refining Company - St. Mt. Carmel field is separated from Jay field byRegis Paper Company number 13-3 well (permit the Foshee Fault System (Figure 16). Mt.523) drilled in Section 13, Township 4 North, Carmel field produces both oil and gas from theRange 29 West, Santa Rosa County, about eight Smackover Formation and the Norphletmiles southeast of Jay field. The well was Sandstone. Complex reservoir geometry hascompleted February 14, 1972, as a producer in apparently made development of this field morethe Norphlet Sandstone from -15,965 to -15,975 difficult. As of January 1990, three producingfeet MSL. Initial production was 371 barrels of wells and 10 dry holes had been drilled at Mt.51.30 A.P.I. gravity oil and 4.5 barrels of Carmel field.saltwater per day. Due to limited productivity and
22

Information Circular 107
\\ BLACKJACK CREEK FIELDSSanta Rosa County, Florida
D STRUCTURE MAPS .I. TOP OF SMACKOVER FORMATION
------ I -
. 0 | 1 0 4000 FEET10 %729 12 \
* -1568 0 1200 METERS-15721 ,- 687
S-15646\ 581
' / I\ - 15760 N
6 2 -1560 D4 U
678I * . I , 2
14 W T-156,04N 63-15S W L \ 1
815 ~ 1*886 \01
988A -15585 17
-15824 ,-15S70 "1 52\*-15572 \-1561
S-157 78-15701 -015714
* PRODUCER \\ \-1563 \.IBOTTOM HOLE LOCATION 5 .4
\ \JUNKED HOLE24 -1
SOIL/WATER CONTACT 578 PERMIT NUMBER ----
15714 DEPTH I-15714
C. I. 50 FEET
| | I 32
ST4N 4
FGS170491 I I
Figure 15. Blackjack Creek structure map, top of Smackover Formation (after Blackjack Creek Geological
Committee, 1974).
23

Florida Geological Survey
MOUNT CARMEL FIELD4 35 Santa Rosa County, Florida
U D i STRUCTURE MAP TOPD OF NORPHLET SANDSTONE
\\1 (Jim MIler, 1974)
ESCAMBIA COUNTY ALABAMA-" ATTA ROSA COUNTY FLORIDA I TON----
i2 28 0 2000 FEET
- - 20 600 METERS\\ t -14930 - /
* I N
UU 1219 660 116\ 4 I\ , \\o+ ** \'- \ ' \\
S--18410 \ \
S-14770
0 27 /
6 I II\ I
77
533
-141+0 DEPTH 0 5000
* PRODUCERBOTTOM HOLE LOCATION / 6 ~ oo
-DRY HOLE N 1^ |
SABANDONED LOCATION -2
-*..- OIL/WATER CONTACT, 1974 \ uI
C.I. 100 FEET 1
7 3
IFQ8tl0411
Figure 16. Mt. Carmel field structure map, top of Norphlet Sandstone (after Miller, 1974).
2424

Information Circular 107
There is currently one* producing well in the Mt. barrels of saltwater per day. The SmackoverCarmel field. As of the end of 1989, the field had Formation was encountered at -13,788 feet MSL,produced 4,666,000 barrels of oil (Appendix 2). 27 feet higher than in the discovery well (Figure
18). Production is from the SmackoverFormation from -13,797 to -13,847 feet MSL.
MCLELLAN FIELD Core analysis by All Points, Inc. (Houston,Texas) yielded a mean porosity of 11.5 percent
McLellan field was discovered on February 15, for the productive zone.
1986, with the initial testing of the Exxon A second offset to the discovery well, Exxon
Corporation - State of Florida number 33-1 Corporation - State of Florida number 28-4
(permit 1194, Appendix 1, Figures 3 and 17). (permit 1226) was drilled about one-half mile
The well is located about 3.25 miles north of the north of the discovery well (Figure 17). During
abandoned Sweetwater Creek field in Section initial production tests, in February 1988, the well
33, Township 6 North, Range 26 West, Santa flowed 154 barrels of oil (gravity not reported)
Rosa County. and 171 barrels of saltwater per day. The
An initial flowing test of the discovery well Smackover was encountered 42 feet higher in
produced 152 barrels of 410 A.P.I. gravity oil per this well than in the discovery well (Figure 17),
day and no saltwater. Production is from indicating a fairly steep gradient between these
Smackover Formation dolostones from -13,827 wells.to -13,845 feet MSL (Figure 18). Core analysis Operations at the second offset well were
of a potential oil and gas productive zone from suspended in March 1988 and the well has since
-13,819 to -13,845 feet MSL by Core been temporarily abandoned. As of December
Laboratories, Inc. (Dallas, Texas) indicated a 1989, production for McLellan field was from the
mean porosity of 12.3 percent. The analysis two remaining wells and totaled 174,000 barrels
showed additional oil and gas production of oil (Appendix 2).
potential between -13,854 and -13,863 feet MSL.Mean porosity is about 15 percent for this zone.Both of the analyzed zones contained dark, fine SWEETWATER CREEK FIELDgrained, microcrystalline dolostones with vuggyporosity. Sweetwater Creek field was discovered on
McLellan field is located within the area known April 22, 1977, with the successful flow test of theto be underlain by the Louann Salt and may have Houston Oil and Minerals Corporation - W. M.a salt-related trap structure. It is also located Stokes number 15-2 well (permit 881, Appendixwithin a few miles of the approximate updip limits 1, Figures 3 and 17). The well is located inof the Smackover Formation (Lloyd, 1989; Section 15, Township 5 North, Range 26 West,Applegate et al., 1978; Ottman et al., 1973, Santa Rosa County. In the initial test the well1976); thus, the trap could be a stratigraphic produced 624 barrels of 43.50 A.P.I. gravity oilpinchout. Current data does not reveal which and only a trace of saltwater from a Smackovertrap mechanism produced the Smackover limestone interval from -14,044 to -14,085 feetreservoir for this field. MSL. This test data spurred rumors that a "new
The first offset and confirmation well for the Jay" field had been discovered. Rumors provedfield was the Exxon Corporation - State of Florida to be false and an offset drilled in 1978 to thenumber 34-2 (permit 1206). It is located about south of the discovery well was dry (permit 890,one-half mile east of the discovery well (Figure Figure 17). Core analyses of the Smackover17). It was tested on March 9, 1987 and flowed Formation in the offset well by Core Laboratories,641 barrels of 43.40 A.P.I. gravity oil and 24 Inc. (Dallas, Texas) indicated very fine
25

Florida Geological Survey
ALABAMA-. - ,. ,- g mm-
FLORIDA R26W R25W
30 29 P1226 27 26 25-13773
P 15 3 --------------P153 P4 P1194 0 P1206
31 32 P1194 -13788
35 36
McLELLAN FIELD T 6 N
6 5 4 3 2
P1758 10 SWEETWATER 12
I I1 0 1 Ml CREEK FIELD1.6 0 1.6 KM P881
SCALE -14045 1 O
13-N- EXPLANATION o P890 <-14071 Ol 0
P1136 PERMIT NUMBER - -1-4071
-16176 DEPTH TO TOP OF SMACKOVER <FORMATION (FEET BELOW MSL) <
0 PRODUCER 22 23 24 <
4 DRY HOLE G s2oo491
Figure 17. McLellan and Sweetwater Creek fields well location map.
26

SP-1194 |P:1206
.* . .. ::::: : :.L ANHYDRITE
MEAN^ .... // %.12.3% POROSTY 11.5% 5
- :: L SMACKOVER"E-:'. :V ~FORMATION
Dual Inductlon-SFL/Gamma Ray Dual Induction-SFL/Gamma Ray
FGS220491
Figure 18. Geophysical log correlation, McLellan field.

Florida Geological Survey
crystalline, gray brown limestone and dolostone, 22-4 (permit 712) drilled in Section 22, Townshipwith low porosity and permeability, and potential 44 South, Range 26 East, Lee County. This isfor only saltwater production. The field produced the most northwesterly field in the Sunnilanda total of 13,695 barrels of oil during its entire trend (Figure 1). The discovery well waslifetime (Appendix 2). The discovery well was completed on July 30, 1974, in the -11,349 tothe only producer at Sweetwater Creek field and -11,354 foot MSL interval of the Sunnilandwas plugged and abandoned in December 1980, Formation. Initial production was 490 barrels ofafter it began producing 100 percent saltwater. 27.60 A.P.I. gravity oil and 48 barrels of saltwater
per day. This well was later abandoned and adeviated well (permit 712A) was drilled at the
South Florida Oil Field Summaries same surface location to produce higher on the
INTRODUCTION structure. A total of nine dry holes were drilled todelineate this field. All of the producing wells
South Florida oil production began with were directionally drilled because bottom holeFlorida's first oil discovery at Sunniland field in locations are beneath the town of Lehigh Acres.September, 1943. There are now a total of 14 oil Figure 19 is a structure map on the top of thefields in South Florida, oriented in a northwest- Sunniland Formation (Ferber, 1985) at Lehighsoutheast trend through Lee, Hendry, Collier and Park field. The reservoir appears to be typical ofDade Counties (Figure 1). Of these 14 the south Florida Sunniland trend fields -aSunniland trend oil fields, 10 are active, one is leached limestone bioherm. Core analysis by R.temporarily shut-in, and three are plugged and E. Laboratories, Inc. (Dallas, Texas) yielded anabandoned. average porosity of 19.7 percent for the
Reservoirs found along the Sunniland trend Sunniland Formation from -11,337 to -11,364are composed of localized buildups of organic feet MSL. They described this interval as a tandebris into mounds or pods which formed porous to brown, fossiliferous, partially dolomitizedgrainstones within the upper Sunniland limestone.Formation (Figure 2). The fauna which make up Two wells were actively producing andthese bioherms include rudistids, algal plates, production totaled 5,165,000 barrels of oil at thegastropods, and foraminifera. Dolomitization has end of December 1989 for this field (Appendicesenhanced the porosity of these grainstones. The 2 and 3).grainstones grade laterally into nonporous,miliolid-rich mudstones (Means, 1977, Mitchell-Tapping, 1984, 1985, and 1986). These miliolid TOWNSEND CANAL FIELDmudstones often provide the trappingmechanism for these reservoirs. Townsend Canal field is located in Section 2,
The exception to the above general description Township 45 South, Range 28 East, Hendryof south Florida oil fields is Lake Trafford field. approximately three miles north of Mid-Lake Trafford produces oil from a fractured Felda field, within the Sunniland trend (Figure 3).limestone in the lower Sunniland Formationlimestone in the lower Sunniland Formation It was discovered on June 27, 1982, with the first(Means, 1977). production test of the Natural Resources
Management Corporation - A. Duda & Sons
LEHIGH PARK FIELD number 2-3 well (permit 1070). The testproduced 160 barrels of 28.40 A.P.I. gravity oiland 42 barrels of saltwater per day. Production is
The discovery well for the Lehigh Park field from the Sunniland Formation between -11,363was the Exxon Consolidated - Tomoka number and -11,368 feet MSL (Appendix 1).
28

Information Circular 107
LEHIGH PARK FIELDS3 Lee County, FloridaT 44 S
SSTRUCTURE MAPTOP OF SUNNILAND
6 5 4(Robin Ferber, 1985)
*_5 4000 FEETS 11259 \ I
cIc cc 0 1200 METERS
7 * 1 9 10
I II"
I -11295 -11303 -1202 959
A --11297 1
S 0 / *
6 HI
-\_, _ _ _ •-"-_- - - - ---- - - - -I\- - -- [-
I g0 I- 1 \ I "-11319"
'- !1 1 20 1 21 12 : ..,o \
+ PERM1T 804 841
- 16 I D P-1H'- "-- 0 - 1 B '
BOTTOM HOLE LOCATION -(-r ,--,-
+ DRY HOLE ISSALT WATER DISPOSAL \ T44 S
T45SC.I . 10 FEET
FGS210491
Figure 19. Lehigh Park field structure map, top of Sunniland Formation (after Ferber, 1985).
29

Florida Geological Survey
Two wells were producing at Townsend Canal MID-FELDA FIELDfield at the end of 1989 (Appendix 3). Productiontotaled 406,000 barrels of oil at the end of 1989 The Mid-Felda field discovery well was the R.(Appendix 2). L. Burns - Red Cattle number 27-4 (permit 904)
in Section 27, Township 45 South, Range 28WESCT FELDA FIELD East in Hendry County, Florida. The well was
completed in the -11,433 to -11,437 foot MSLinterval of the Sunniland Formation on October
West Felda field was discovered on August 2, 13, 1977. An initial production test on October1966, with the drilling of the Sun - Red Cattle 24, 1977 yielded 281 barrels of 260 A.P.I. gravitynumber 21-3 well (permit 371) in Section 21, oil and 53.6 barrels of saltwater per dayTownship 45 South, Range 28 East, Hendry (Appendix 1).County (Appendix 1, Figures 1 and 20). The first The well is located on a small subsurfaceproduction test yielded 56 barrels of 24.60 A.P.I. feature between West Felda field and Sunocogravity oil and 148 barrels of saltwater per day Felda field (Figure 20). Samples from thefrom the -11,437 to -11,440 foot MSL interval of producing zone show a partially dolomitizedthe Sunniland Formation. fossil hash with about ten feet of oil staining.
The field is mainly a stratigraphic trap; Geophysical log analysis indicated approximatelyhowever, structural closure is more evident than 20 percent porosity for an eight-foot intervalat Sunoco Felda field (Figure 20). The main (Applegate and Lloyd, 1985).producing unit has a composition typical of the At the end of 1989, two wells were activelysouth Florida Sunniland trend fields (Means, producing (Appendix 3). Cumulative production,1977, Mitchell-Tapping, 1986). Means (1977) as of the end of December, 1989 was 1,239,000summarized the reservoir characteristics for barrels of oil (Appendix 2).West Felda field as follows: average paythickness of 17 feet, average porosity of 20percent, average water saturation of 35 percent, SUNOCO FELDA FIELDA.P.I. oil gravity of 260, and average daily oilproduction of 4,600 barrels. Values indicate The Sunoco Felda field, located in Hendry andimproved reservoir quality over Sunoco Felda Collier Counties, was discovered in July 1964 byfield. Sunoco, when they drilled the discovery well
Means (1977) believed that the reservoir (Appendix 1). The well (the Sun - Red Cattlequality was improved because West Felda field number 32-1; permit 315) is located in Section"experienced higher energy and more-normal 32, Township 45 South, Range 29 East. Sunocomarine conditions" than did Sunoco Felda field. Felda was the second commercial oil fieldAlternatively, Mitchell-Tapping (1986) considered discovered in Florida and was discovered 21the energy levels about the same for both fields years after the first commercial discoveryand believed that the improved quality is "due to (Sunniland field). Forty Mile Bend field wasgreater sub-aerial exposure as the mound discovered in 1954 but turned out to be non-structure is larger and topographically higher" at commercial and was abandoned in 1956. TheWest Felda field. Sunoco Felda discovery well location was based
At the end of December 1989, eleven wells on a combination of subsurface and seismic datawere producing at West Felda field and (Tyler and Erwin, 1976).cumulative production totaled 41,226 barrels of In an initial pumping test in November 1964,oil (Appendices 2 and 3). the discovery well produced 427 barrels of 25.40
A.P.I. gravity oil and 11 barrels of saltwater per
30

U I I N ct SUNOCO FELDA, WEST FELDA, AND MID-FELDA FIELDSI I \ I '1\ 1 1\ \ I-- I I'1 - ".aay~n, aaaL, m aaanrot~kFl'
W EST FELDA - - - . - -4. _. .---. ~ .-- -- --------- -- - M I r ^ \ \ 1\ \ \ ^ Y.l \SMRCTUM MAP
, \.,\ I TOP OF SUNNLANDS\ -
,..^lC .'^r^ ," ,. •. . "I ."• ",
10 I ii I s 8 I I0
s .' , b ,, •,. • _ "-,.. I _ _- , _ , ... _ ___ ._.. , ---
,I, ...... 113. , ;, ', ", 1 ,,"i f3 i iP 35isI3
7 iwIs1 735 Is+Itr
* ' 51.... " - "
. .. -"-- - -- -. -"1 +-"211,01174 343
740 .153 .'f-i .n SUNOCO ELDA- 3 1111 TOI Il i Its
Figure 20. 1 West and 39 3ed scu m tp o F143,' HA , an" ++1 . 117 3401 1 --i,
..-. . ....1-- ~ 59 + "l *111" 0 33".3 -112I -1 , 1 34 i t
's
*-11:5 38,1 3N"601lr 35 -18+.422 -'5? \rl4l5-7bnJ-'-471-1, •331 I 431 so--.... ..
2
. . . .. . . .- - l ia-1 . . . .e' ' • ,s l I . . . . * .' C )4326
as- n.-, so 3*9.. . t -28 \i3
I4 to55 I 9. ) 1 .1
"" .i4! 98? 36 I V
- I"'a•' -'" I I t9137
F ig u re9 3 * 4 - 11n o 1 -11d a , -est 355 a nd M id d I ? II a 3
PROUE 352 -iu Its T419~~I~
-too8 ? .14 MI ED 1 "'a 3-t *13U 0 4-
55 41--NS -. i s-1
--------------------------- ----------------------------------------I1 3I3s Iý I p
Figure~~~ ~~ 20. SuooFla etFla n MdFlafed3tutr ap ofSniadFrain

Florida Geological Survey
day. Production is from the Sunniland Formation 21), are again consistent with a biohermfrom -11,417 to -11,430 feet MSL from a leached formation for the reservoir.limestone bioherm. The faunal composition of Two successful offsets have been drilled atthe bioherm is somewhat typical of the Sunniland Corkscrew field (Figure 21, permits 1199 andreservoirs (as described in the south Florida oil 1201A) (Lloyd, 1989). These two wells and thefields introduction above) (Means, 1977, Mitchell- discovery well were all producing at the end ofTapping, 1986). Mitchell-Tapping (1986) 1989 (Appendix 3). Total oil production as ofobserved faunal differences at Sunoco Felda January 1, 1990 was 524,000 barrels (Appendixfield which indicated formation in "the shallow 2).lagoonal zone of the back-reef environment."The reservoir has a permeability barrier to thenortheast which prevents migration of the oil up- LAKE TRAFFORD FIELDdip (Tyler and Erwin, 1977).
Means (1977) summarized the reservoir Lake Trafford field was discovered by Mobil Oilcharacteristics of Sunoco Felda field. These Corporation on the Baron Collier Jr. lease ininclude an average pay zone thickness of 11 Section 9, Township 47 South, Range 28 East infeet, average porosity of 18 percent, average Collier County (Figures 1 and 21). The discoverywater saturation of 50 percent, A.P.I. oil gravity of well (permit 401) was completed on March 30,25', and average daily oil production of 1,700 1969 (Appendix 1). During initial production testsbarrels. the well pumped 118 barrels of 25.60 A.P.I.
As of December 1989, Sunoco Felda field was gravity oil and 78 barrels of saltwater per day.producing from 18 wells (Appendix 3). Total Production was from the Sunniland Formationproduction was 11,529,000 barrels of oil from -11,830 to -11,892 feet MSL. The well was(Appendix 2). later squeeze cemented to shut off water from
above the perforations. The well is unique in^CORKSCREW FIELD south Florida in that it has not produced water
CORKSCREW FIELDthat time.Lake Trafford field is also unique in south
Corkscrew field was discovered on November Florida as the only field which produces oil from10, 1985 with an initial swab test of the R. K. a fractured limestone in the lower SunnilandPetroleum - Rex Properties number 33-2 (permit Formation (Means, 1977). Core material from1170). Corkscrew field is located about two and the discovery well has been described as anone-half miles north and slightly west of the one- argillaceous, burrowed, limestone "rubble." Thewell Lake Trafford field in Collier County, Florida combination of burrowing and fracturing was(Figures 1 and 21). In its initial test, the believed to be responsible for the development ofdiscovery well produced 435 barrels of 250 A.P.I. producible permeability and porosity (Jimgravity oil per day with no saltwater. Production Richter, Mobil Oil Corporation, personalwas from open hole in the Sunniland at -11,502 communication, in Applegate and Lloyd, 1985).to -11,520 feet MSL. Offsets drilled northwest and south of the
Core analysis by Analytical Logging, Inc. (Ft. discovery well were dry holes. The discoveryMyers, Florida) indicated an oil producing zone well remains the single producing well for Lakefrom -11,506 to -11,515 feet MSL. The zone was Trafford field. The well was shut-in in Marchdescribed as a "fossil-hash" of dolomitic 1988 and remained shut-in for the rest of 1988limestone with an average porosity of 15.25 and all of 1989. Total oil production for this field,percent. This description, and the small closed as of the end of 1989 was 278,000 barrelsstructure drawn by Cheeseman (1988) (Figure (Appendix 2).
32

Information Circular 107
CORKSCREW ANDLAKE TRAFFORD FIELDS
COLLIER COUNTY, FLORIDA
STRUCTURE MAPTOP OF SUNNILAND FORMATION
u |U (O (CHEESMAN,1988)
I-
\-- 9 t7--- - --3 1 9 2 2 21 1 27 26
1201 I -11516_- 4. -_1.A8 -- -'..... _ -
\,,48 10-1OOl 1 CORKSCR V FIELDF1573. 36. -1153 1 9_114 / 72199 -11492
TI 0 T46S
l-11565 I j 1208 I T4\S
2 W1 6 4 3 2
SLAKE TRAFFORD FIELD408 PERMIT NUMBER 0 ^^b v u • I \ -S 75841 \_ ss^
SBOTTODM HOLE LOCATION 1->DRY HOLE I /-0
6CI. 20 FEET "-"l .428 7 2/6
0 1200 2400 METERS I I I
FGS230491
Figure 21. Corkscrew and Lake Trafford fields structure map, top of Sunniland Formation (after M.Cheeseman, independent petroleum geologist, Pensacola, Florida, 1988, personalcommunication).
33

Florida Geological Survey
SUNNILAND FIELD production totaled 18,445,000 barrels at the endof December 1989 (Appendix 2).
In September 1943, Humble Oil and RefiningCompany discovered Sunniland field in Collier SEMINOLE FIELDCounty, Florida (Figure 1); this was the firstcommercial oil discovered in Florida. Thediscovery well was the Humble Oil and Refining The discovery well for the Seminole field wasCompany - Gulf Coast Realties number 1 (permit the Weiner-Oleum Corporation well number 12-142) located in Section 29, Township 48 South, (permit 662) in Section 12, Township 48 South,Range 30 East. The well was completed in an Range 32 East, Hendry County (Figure 1). Theopen hole interval between -11,568 and well was completed in the -11,379 to -11,384 foot-11,592 feet MSL. Initial production was 97 MSL interval of the Sunniland Formation onbarrels of 260 A.P.I. gravity oil and 425 barrels of November 14, 1973. Initial production was 26saltwater per day by pumping. barrels of 25.40 A.P.I. gravity oil and eight barrels
The well was drilled on a prospect outlined by of saltwater per day. This three-well oil field wasmagnetic, gravity, seismic, and core data. abandoned in 1978 after producing a total ofProduction in the field is from various porous 85,000 barrels of oil (Appendix 2).zones in rudistid mounds in the upper 60 feet ofthe formation. Mitchell-Tapping (1985) describedthe producing horizon as consisting of leached BEAR ISLAND FIELDrudist and algal particles together with pelletsand foraminifers. Mitchell-Tapping's (1985) Bear Island field was discovered on Decemberstudy of Sunniland, Bear Island, and Forty Mile 5, 1972, with the completion of the Exxon - GulfBend fields concluded that the depositional Coast Realties number 2-4 well (permit 563) inenvironment of these fields was that of a tidal Section 2, Township 49 South, Range 30 Eastshoal with a landward (east-northeast) mud-flat (Figure 23). The field is located about two milesarea and a seaward (west-southwest) shallow- southeast of Sunniland field (Figure 1). Thewater back-reef area. The structure map (Figure discovery well pumped 132 barrels of 260 A.P.I.22) for the Sunniland field shows a northwest- gravity oil and 545 barrels of saltwater per daysoutheast trending dome that formed as these from perforations between -11,558 and -11,564rudistid beds grew with slowly-rising sea level feet MSL in Sunniland carbonates.during the Lower Cretaceous. The dome is The structure map of Bear Island field (Figureabout four miles long and two miles wide with 23) indicates a northwest-southeast trendingclosure of about 40 feet. dome about 4.5 miles long and 2.5 miles wide
Twenty-six producing wells and ten dry holes with a closure of about 55 feet. Mitchell-Tappinghave been drilled at Sunniland field. Sunniland (1985) found this field to have the same faunalfield has been producing oil for almost 50 years; assemblage as Sunniland field; his conclusionincreased saltwater production has forced concerning the general depositional environmentabandonment of many of the old Sunniland wells. is listed above in the description of SunnilandEighteen of the producers had been abandoned field. Despite the generally similar origin,by the end of 1989. Of the remaining eight Mitchell-Tapping (1985) found Bear Island field toproducers, five were shut-in during 1988 and be lithologically different than Sunniland field.1989. The other three produced intermittently Most of the Sunniland Formation at Bear Islandduring 1988 and 1989 and were all also shut-in field is dolomitized and is more leached than atas of December 1989 (Appendix 3). Oil Sunniland field. Anhydrite and some secondary
dolomitization has reduced the effective
34

Information Circular 107
R26W R25W
SUNNILAND FIELDICOLLIER COUNTY, FLORIDA
- p2 1 STRUCTURE MAP11 - 11630 7 8 TO P O F SUNNILAND
P106 P23P25
p99 -11515O '1655
14 11548-11519 16
31151400 -11531 \ P18 P82 P2 PI( 02
S11513 -11514 0"P -- 1 5 0 5-
\ 115\1-115Q.0. 3 P1142CONF.
\ P \ 406 -11500 P384R11517 50 1 2P
P345\ P3601 P2718 r-11504 P312 P35I23 N \ -11510
1•
0 1 P3 -11498 -11507
\1-151493 \ P65 1 . 28\1P400 p15 \1 5 0 ' -11511 1
1 1 -11510 "Ti I' 00ORIGIONAL OIL P" , P106 0 - 1 1 _ 1496
P76
-/WATER CONTACT - N 1515 - 1 15 0-11563'
0 SCALE 1 MI3 r.
0 . KM 25 N- , 28EXPLANATION // P31
P1136 PERMIT NUMBER l ~ P42-16176 DEPTH W961 &-1155
0 PRODUCER -11570
"9 DRY HOLE -SALT WATER DISPOSAL " -- ^
6 JUNKED HOLE 31 32 33--- OIL/WATER CONTACT
FGS240491
Figure 22. Sunniland field structure map, top of Sunniland Formation.
35

Florida Geological Survey
I -BEAR ISLAND FIELDColr County, Florid
2a 27 STRUCTURE MAPBASE OF ANHYDRITE IN UPPER SUNNILAND FORMATION
Son (From Beer t1e"nd Geoolownl Conmtee,1978)
0 4000 FEET
I902 1 ; " I '1907 -11i43 0 1200 METERS
0115 4020 -113
33 3 N
/-11847 8273 t 981 1 I- 003--11524 15 36
4 56 -11543
I802 80003 .115823 -11525 -11534
C. I.'- --5L FEET
79 733 8385--11529 * -11542
36
4824 727-11543 -11-524 1
BOTTOM HOLE LOCATION 11562 no+ DRY HOLE Sa....m1
@ WATER INJECTION WELL-..... OIL/WATER CONTACT, 1978 733 PERMIT NUMBER
C. I. 8 FEET 1 D
FGS250491
Figure 23. Bear Island field structure map, base of anhydrite in Upper Sunniland Formation (after BearIsland Geological Committee, 1978).
36

Information Circular 107
permeability in some sections. Dolomitization in RACCOON POINT FIELDthe lower units of the upper Sunniland, however,enhanced both porosity and permeability Raccoon Point field is the southeastern-most(Mitchell-Tapping, 1985). active field in the Sunniland trend (Figure 1). Its
A total of 25 producing wells have been drilled discovery well was the Exxon -Oleumat Bear Island field; seven of these were active at Corporation number 33-4 (permit 829) drilled inthe end of 1989 (Appendix 3). Total oil Section 33, Township 51 South, Range 43 East,production, through December 1989, was Collier County (Figure 24). Initial production was10,575,000 barrels (Appendix 2). from the -11,371 to -11,375 foot MSL interval of
the Sunniland Formation. In a production test onJune 20, 1978, the well pumped 57 barrels of23.30 A.P.I. gravity oil and 845 barrels ofsaltwater per day.
Pepper Hammock field was discovered on Figure 24 is a preliminary structure map forSeptember 28, 1978. The discovery well, the Raccoon Point field. The map indicates anExxon Corporation - Collier Company number elongated series of small highs trending north-23-1 well (permit 897) is located in Section 23, south. The limits of the field are still notTownship 29 South, Range 30 East, completely defined since no dry holes have beenapproximately one and one-half miles south of drilled at Raccoon Point to date. A total of 15Bear Island field (Figure 1). The initial production producing wells have been drilled, one duringtest yielded 20 barrels of 270 A.P.I. gravity oil and 1989 (Appendix 4).206 barrels of saltwater per day. Production was At the end of 1989, 12 of the 15 wells werefrom Sunniland limestones between -11,586 and active (Appendix 3). Oil production totaled-11,590 feet MSL. The discovery well is the only 4,444,000 barrels at the end of December 1989well at Pepper Hammock and is shut-in. A total (Appendix 2).of 323 barrels of oil were produced before thewell was shut-in in October 1978 (Appendix 2).
FORTY MILE BEND FIELD
BAXTER ISLAND FIELD Commonwealth Oil Company drilled theWiseheart - State Board of Education number 1
Baxter Island field is a one-well, abandoned wildcat (permit 167) in Section 16, Township 45field located approximately eight miles southeast South, Range 35 East, Dade County. It wasof Bear Island field (Figure 1). The single located 50 miles southeast of Sunniland fieldproducer and discovery well was the Diamond (Figure 1). The well was completed in theShamrock - Gerry Brothers Ltd. number 31-3 well -11,298 to -11,315 foot MSL interval of the(permit 865) located in Section 31, Township 49 Sunniland Formation and was initially tested onSouth, Range 32 East, Collier County. In its February 5, 1954. In this initial test, the wellinitial production test on August 11, 1977, the pumped an estimated 76 barrels of 21.30 A.P.I.well pumped 35 barrels of 22.4° A.P.I. gravity oil gravity oil and 96 barrels of saltwater per day.and 220 barrels of saltwater per day. Production Core examination (Applegate and Lloyd, 1985) inwas from the Sunniland Formation from -11,482 the open interval showed a partially to fully oil-to -11,485 feet MSL. The field produced a total saturated, finely crystalline dolostone andof 1,859 barrels of oil before the well was shut-in limestone with pin-point porosity, which did notin 1978 (Appendix 2). The well was plugged and appear to be commercial.abandoned on January 12,1980. The second well in the Forty Mile Bend field,
37

Florida Geological Survey
0I21 22 RACCOON POINT FIELD
o 1 ' P167 COLLIER COUNTY, FLORIDAS -11320 STRUCTURE MAP
- P'- ? 2- TOP OF SUNNILAND
\ P1162 1 1 1 1, Ml
28 -11334 -I I- I |
P1150 0 SCALE 1.6 KM - -
-11347 P1149 P1215 26
P1 130P915 -11314 ' & 35-11360 P1031
3-1133033 -11310 I 92 36NUBEP829 BLWM -11352 26
-11357 -113 O
T51S P106 HL LO-A M
T52S 1 2 5 P1082 P1121\-11298 !(% --"J |*
P\- 997
4 3 - 11352 P 1 1 O31
P998 P1190 Q- 11360
EXPLANATIONP1136 PERMIT NUMBER
-16176 DEPTH TO TOP OF SUNNILANDFEET BELOW MSL 11 12 " .
* BOTTOM HOLE LOCATION t'
A SALT WATER DISPOSALFGS280491
Figure 24. Raccoon Point field preliminary structure map, top of Sunniland Formation.
38

Information Circular 107
the Gulf Oil - State of Florida number 1 well producer and was the discovery well for McDavid(permit 182), was completed in 1954. The well is field (Escambia County). Coldwater Creek fieldlocated about three and one-quarter miles east of was also discovered in 1988 with the firstthe discovery well (Figure 1). It was completed production test of the Red Rock Oil and Mineralsas a pumping well in the -11,309 to -11,316 foot Corporation - Pittman Estate No. 26-2A in SantaMSL interval of the Sunniland Formation. Initial Rosa County.production was 112 barrels of 21.70 A.P.I. gravity Six wells were completed in federal waters offoil per day. Water production was not tabulated. Florida during 1988 and 1989. Three of the wells
The distance between the two wells were in the Pensacola area; three were in thecomprising Forty Mile Bend field indicate that Destin Dome area. The principal drilling targetsthey probably did not produce from the same in these areas are the Smackover Formation andreservoir. Mitchell-Tapping (1985) studied the the Norphlet Sandstone (Figure 4). One of thefauna and lithology of Sunniland, Bear Island, Destin Dome area wells (Chevron-6406) is theand Forty Mile Bend fields. His description of the second offshore Norphlet discovery in this area.depositional environment for these fields is Geophysical exploration during 1988 and 1989discussed above in the Sunniland field concentrated in the Florida panhandle and thedescription. He found the lithology and fauna at south Florida peninsula. The panhandleForty Mile Bend to be similar to that of Sunniland exploration included the known oil-producingfield, except for the presence of anhydrite in the Santa Rosa and Escambia Counties, an areapore space and an increase in the dolomite offshore from Santa Rosa and Escambiacontent. Counties, and the Apalachicola Embayment
Low oil gravity and low porosity and area. South Florida seismic activity was east ofpermeability in the Sunniland at both well the known Sunniland producing trend in Broward,locations made this field non-commercial. In Dade, Hendry and Palm Beach Counties.addition, a half-inch hole was found in the casingof the Gulf well (permit 182) at -10,027 feet MSL.This could have caused excessive water flow,and thus shortened the productive life of thiswell. Both of the Forty Mile Bend wells wereabandoned in 1956, after producing only 32,888barrels of oil in about 17 months in 1954 and1955 (Appendix 2) (Gunter, 1955 and 1956).
SUMMARY
Florida oil production continued to declineduring 1988 and 1989. Jay field, as the leadingproducing field for Florida, controls the rate ofdecline. The field appears to be following theproduction curve predicted by Christian, et al.(1981) in their discussion of tertiary recoveryestimates for Jay field.
Three development wells and sixteenexploratory wells were drilled during 1988 and1989. One exploratory well was completed as a
39

Florida Geological Survey
REFERENCES
Applegate, A. V., 1987, The Brown Dolomite Zone of the Lehigh Acres Formation (Aptian) in the SouthFlorida Basin - A potentially prolific producing horizon offshore: Florida Geological Survey InformationCircular no. 104, Part II, p. 46-66.
, and Lloyd, J. M., 1985, Summary of Florida petroleum production and exploration,onshoreand offshore, through 1984: Florida Geological Survey Information Circular no. 101, 69 p.
, Pontigo, F. A., Jr., and Rooke, J. H., 1978, Jurassic Smackover oil prospects in theApalachicola embayment: Oil a*id Gas Journal, January 23, 1978, p. 80-84.
Bear Island Geological Committee, 1978, Bear Island field structure map, Exxon Corporation Sunnilandoil pool report: Florida Department of Natural Resources Hearing no. 40.
Blackjack Creek Geological Committee, 1974, Blackjack Creek field unit, Exhibit M-1: FloridaDepartment of Natural Resources Hearing no. 38.
Bradford, C. A., 1984, Transgressive-regressive carbonate of the Smackover Formation, EscambiaCounty, Alabama: in Ventress, W. P. S., Bebout, D. G., Perkins, B. F., and Moore, C. H. (editors), TheJurassic of the Gulf Rim: Proceedings of the third annual research conference, Gulf Coast Section,Society of Economic Paleontologists and Mineralogists Foundation, p. 27-39.
Christian, L. D., Shirer, J. A., Kimbel, E. L., and Blackwell, R. J., 1981, Planning a tertiary oil-recoveryproject for Jay/LEC fields unit: Journal of Petroleum Technology, v. 33, p. 1535-1544.
Cramer, F. H., 1971, Position of the north Florida Lower Paleozoic block in Silurian time; phytoplanktonevidence: Journal of Geophysical Research, v. 76, no. 20, p. 4754-4757.
, 1973, Middle and Upper Silurian chitinozoan succession in Florida subsurface: Journal ofPaleontology, v. 47, no. 2, p. 279-288.
Ferber, R., 1985, Depositional and diagenetic history of the Sunniland Formation, Lower Cretaceous,Lehigh Park field, Lee County, Florida: Master's thesis, University of Southwestern Louisiana,Lafayette, Louisiana.
Gould, G. J., 1989, Gulf of Mexico Update: May 1988 - July 1989, U. S. Department of the InteriorMinerals Management Service: OCS Information Report, MMS 89-0079, 51 p.
Gunter, H., 1955, Exploration for oil and gas in Florida, Florida Geological Survey, 1954 Supplement toInformation Circular no. 1, 35 p.
, 1956, Exploration for oil and gas in Florida, Florida Geological Survey, 1955 Supplement toInformation Circular no. 1, 31 p.
40

Information Circular 107
Hughes Eastern Corporation, 1988, McDavid Prospect, Escambia County, Florida, top Smackover,Geophysical Map: Florida Department of Natural Resources Hearing no. 42.
Jay-LEC Fields Unit Geological Committee, 1974, Structure map-top of Smackover-Norphlet oil pool,Exhibit no. G-1: Florida Department of Natural Resources Hearing no. 36.
Johnson, P. G. and Tucker, D. L., 1987, The federal Outer Continental Shelf oil and gas leasing program;a Florida perspective, February, 1987: Office of the Governor, Office of Planning and Budgeting,Intergovernmental Unit, 16 p.
Langston, E. P., and Shirer, J. A., 1985, Performance of the Jay-LEC field unit under mature waterfloodand early tertiary operations: Journal of Petroleum Technology, v. 37, p. 261-268.
, Shirer, J. A., and Nelson, D. E., 1981, Innovative reservoir management - key to highlysuccessful Jay-LEC waterflood: Journal of Petroleum Technology, v. 33, p. 783-791.
Lloyd, J. M., 1986, Bluff Springs field discovery renews interest in Florida's western panhandle: Oil andGas Journal, June 30, 1986, p. 105-108.
, 1989, 1986 and 1987 Florida petroleum production and exploration: Florida GeologicalSurvey Information Circular no. 106, 39 p.
, and Applegate, A. V., 1987, 1985 Florida petroleum production and exploration: FloridaGeological Survey Information Circular no. 104, Part I, p. 1-42.
, Ragland, P. C., Ragland, J. M., and Parker, W. C., 1986, Diagenesis of the JurassicSmackover Formation, Jay field, Florida: Gulf Coast Association of Geological Societies Transactions,v. 36, p. 201-211.
Lomando, A. J., Jr., Schreiber, C., and Nurmi, R. D., 1981, Sedimentation and diagenesis of UpperSmackover grainstone, Jay-field area, west Florida (abstract): American Association of PetroleumGeologists Bulletin, v. 65, no. 5, p. 950.
Mancini, E. A., and Benson, D. J., 1980, Regional stratigraphy of Upper Jurassic Smackover carbonatesof southwest Alabama: Gulf Coast Association of Geological Societies Transactions, v. 30, p. 151-165.
Masingill, J. H., 1989, The petroleum industry in Alabama, 1988: Alabama State Oil and Gas Board, Oiland Gas Report 3-L, 100 p.
Means, J. A., 1977, Southern Florida needs another look: The Oil and Gas Journal, v. 75, no. 5, p. 212-225.
Miller, J., 1974, Mount Carmel field structure map: Florida Department of Natural Resources Hearing no.27.
41

Florida Geological Survey
Mink, R. M., Hamilton, R. P., Bearden, B. L., and Mancini, E. A., 1987, Determination of recoverablenatural gas reserves for the Alabama coastal waters area: Alabama State Oil and Gas Board, Oil andGas Report 13, 74 p.
Mitchell-Tapping, H., 1984, Petrology and depositional environment of the Sunniland producing fields ofsouth Florida: Gulf Coast Association of Geological Societies Transactions, v. 34, p. 157-173.
, 1985, Petrology of the Sunniland, Forty Mile Bend, and Bear Island fields of south Florida:Gulf Coast Association of Geological Societies Transactions, v. 35, p. 233-242.
, 1986, Exploration petrology of the Sunoco Felda trend of south Florida: Gulf CoastAssociation of Geological Societies Transactions, v. 36, p. 241-256.
Moore, C. H., 1984, The Upper Smackover of the Gulf Rim: depositional systems, diagenesis, porosityevolution and hydrocarbon development: in Ventress, W. P. S., Bebout, D. G., Perkins, B. F., andMoore, C. H. (editors), The Jurassic of the Gulf Rim: Proceedings of the third annual researchconference, Gulf Coast Section, Society of Economic Paleontologists and Mineralogists Foundation, p.283-307.
Ottman, R. D., Keyes, P. L., and Ziegler, M. A., 1973, Jay field - a Jurassic stratigraphic trap: Gulf CoastAssociation of Geological Societies Transactions, v. 23, p. 146-157.
, 1976, Jay field - a Jurassic stratigraphic trap: in Braunstein, J. (editor), North American oiland gas fields: American Association of Petroleum Geologists Memoir 24, p. 276-286.
Shirer, J. A., Langston, E. P., and Strong, R. B., 1978, Application of field-wide conventional coring in theJay-Little Escambia Creek Unit: Journal of Petroleum Technology, v. 30, p. 1774-1780.
Sigsby, R. J., 1976, Paleoenvironmental analysis of the Big Escambia Creek-Jay-Blackjack Creek fieldarea: Gulf Coast Association of Geological Societies Transactions, v. 26, p. 258-278.
Tyler, A. N. and Erwin, W. L., 1976, Sunoco-Felda field, Hendry and Collier Counties, Florida: inBraunstein, J. (editor), North American oil and gas fields: American Association of PetroleumGeologists Memoir 24, p. 287-299.
Vinet, M. J., 1984, Geochemistry and origin of Smackover and Buckner dolomites (Upper Jurassic), Jayfield area, Alabama-Florida: in Ventress, W. P. S., Bebout, D. G., Perkins, B. F., and Moore, C. H.(editors), The Jurassic of the Gulf Rim: Proceedings of the third annual research conference, GulfCoast Section, Society of Economic Paleontologists and Mineralogists Foundation, p. 365-374.
42

Information Circular 107
APPENDIX 1
FLORIDA OIL FIELD DISCOVERY WELL DATA
43

Florida Geological Survey
FLORIDA OIL FIELD DISCOVERY WELL DATA
PERFORATIONSDATUM FOR DEPTH OR OPEN HOLE TOTAL DEPTH
DISCOVERY PERMIT MEASUREMENTS, DEPTH BELOW BELOW DATUM,NAME OF PROOU- DISCOVERY OIL GRAVITY,
DATE NO. FIELD COUNTY FT. MSL (1) DATUM, FT. FT. CING FORMATION STATUS DEGREES API
9-26- 43 42 Sunnitand Collier 34 (OF) 11,602-11,626 11,626 Sunniland Pumping 26
2-5-54 167 Forty Mile Bend Oade 24 (DF) 11,322-11,339 11,557 Sunniland Pumping 21
7-22-64 315 Sunoco Felds Hendry 55 11,472-11,485 11,485 Sunnitand Pumping 25
8-2-66 371 West Felda Hendry 49 11,486-11,489 11,675 Sunniland Pumping 26
3-30-69 401 Lake Trafford Collier 40 11,870-11,892 11,987 Sunniland Pumping 26
6-15-70 417 Jay Santa Rosa 206 15,470-15,524 15,984 Smackover Flowing 51
12-19-71 504 Mt. Carmel Santa Rosa 274 15,260-15,280 15,399 Snackover Flowing 47& Norphtet
2- 14-72 523 Blackjack Creek Santa Rosa 157 15,790-15,900 16,235 Smackover Flowing 51
12-5-72 563 Bear Island Collier 31 11,589-11,595 11,817 SunniLand Pumping 26
11-14-73 662 Seminole Hendry 36 11,415-11,420 11,651 Sunnitand Pumping 25
7-30-74 712 Lehigh Park Lee 40 11,389-11,394 11,630 Sunniland Pumping 28
4-22-77 881 Sweetwater Creek Santa Rosa 255 14,299-14,340 14,611 Smackover Pumping 45
8-11-77 865 Baxter Island Collier 30 11,512-11,515 11,823 Sunniland Pumping 22
10-13-77 904 Mid-Felda Hendry 59 11,492-11,496 11,686 Sunnitand Pumping 26
6-20-78 829 Raccoon Point Collier 39 11,410-11,414 11,658 Sunniland Pumping 23
9-28-78 897 Pepper Hammock Collier 43 11,629-11,633 11,897 Sunnitand Pumping 27
6-27-82 1070 Townsend Canal Hendry 53 11,416-11,421 11,462 Sunniland Pumping 28
3-25-84 1125 Bluff Springs Escambia 178 16,332-16,339 16,800 Smackover Flowing 57
11-10-85 1170 Corkscrew Collier 45 11,547-11,565 11,565 Sunnitand Pumping 26
2-19-86 1194 McLellan Santa Rosa 245 14,072-14,090 14,475 Snmackover Flowing 41
6-4-88 1220 Coldwater Creek Santa Rosa 166 15,150-15,170 15,407 Smackover Flowing 47
6-14-88 1230 McDavid Escambia 271 16,346-16,360 16,800 Smackover Flowing 54
1. This is usually the kelly bushing elevation; where this was unavailable, drill floor (DF) elevation is given.
44

Information Circular 107
APPENDIX 2
1988,1989 AND CUMULATIVE PRODUCTION DATA
45

Florida Geological Survey
1988, 1989 AND CUMULATIVE PRODUCTION DATA (1)
FIELD (2) 1988 PRODUCTION 1989 PRODUCTION CUMULATIVE PRODUCTIONOil Gas Water Oil Gas Water Oil Gas
(Bbts) (MCF) (Bbts) (Bbts) (MCF) (Bbts) (MBbts) (MMCF)
NORTHWEST FLORIDA
Bluff Springs 26,737 13,993 171,510 15,889 5,369 158,041 220 122McDavid 38,417 12,478 7,536 82,789 35,886 33,566 121 48Jay 4,729,067 7,443,364 46,050,785 4,814,354 7,595,813 51,452,328 365,479 466,858Coldwater Creek 5,759 238 11,485 1,766 203 700 9 0Blackjack Creek 462,464 740,047 6,252,039 517,142 1,016,557 9,581,475 54,482 51,989Mt. Carmel 63,081 17,138 483,995 12,520 0 55,147 4,666 4,797HcLet tan 64,107 29,549 17,981 44,541 20,302 15,313 174 77Sweetwater Creek (3) 0 0 0 0 0 0 14 15
Subtotal 5,389,632 8,256,807 52,995,331 5,489,001 8,674,130 61,296,570 425,165 523,906
SOUTH FLORIDA
Lehigh Park 168,605 16,493 1,297,670 104,109 8,956 1,510,456 5,165 519Townsend Canal 30,283 0 156,898 46,590 0 216,085 406 0West Felds 634,923 44,879 4,954,270 494,652 34,818 3,404,318 41,226 3,427Mid-Felda 79,221 0 222,258 77,195 0 243,795 1,239 10Sunoco Felds 82,636 4,513 1,046,974 36,591 1,308 404,823 11,529 980Corkscrew 159,838 0 5,505 108,037 0 33,616 524 0Lake Trafford 1,790 0 0 0 0 0 278 0Seminote (3) 0 0 0 0 0 0 85 0Sunniland 30,459 2,629 726,203 5,325 482 124,390 18,445 1,824Bear Island 337,823 27,815 2,450,255 245,024 19,609 2,443,173 10,575 837Pepper Hammock 0 0 0 0 0 0 0 0Baxter Island (3) 0 0 0 0 0 0 2 0Raccoon Point 830,838 99,863 643,621 682,866 81,989 626,993 4,444 529Forty Mile Bend (3) 0 0 0 0 0 0 33 2
Subtotal 2,356,416 196,192 11,503,654 1,800,389 147,162 9,007,649 93,951 8,128
STATEWIDE TOTAL 7,746,048 8,452,999 64,498,985 7,289,390 8,821,292 70,304,219 519,116 532,034
1. Statistics compiled by Charles Tootle, Florida Geological Survey, Oil and Gas Section.2. Fields are listed in approximate order from north to south and west to east.3. Plugged and abandoned oil fields.
Abbreviations: Bbts - Barrels (42 US Gallons)NBbts - Thousand BarrelsMCF - Thousand Cubic FeetMMCF - Million Cubic Feet
46

Information Circular 107
APPENDIX 3
1988 AND 1989 FIELD WELL STATISTICS
47
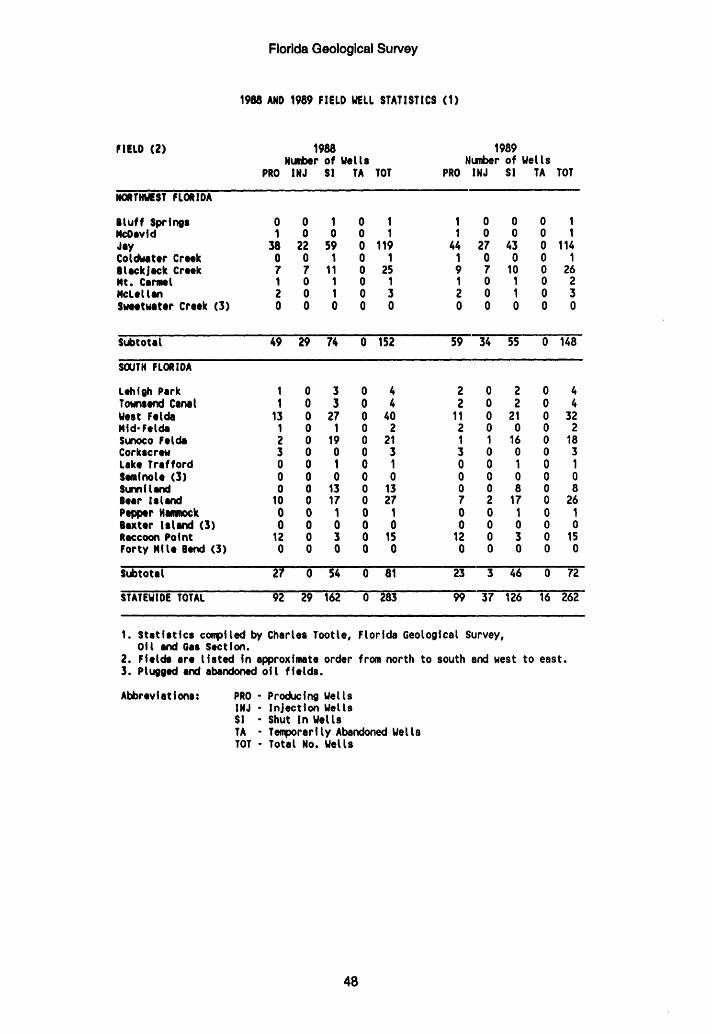
Florida Geological Survey
1988 AND 1989 FIELD WELL STATISTICS (1)
FIELD (2) 1988 1989Number of Wells Number of Wells
PRO INJ SI TA TOT PRO INJ SI TA TOT
NORTHWEST FLORIDA
Bluff Springs 0 0 1 0 1 1 0 0 0 1McDOvid 1 0 0 0 1 1 0 0 0 1Jay 38 22 59 0 119 44 27 43 0 114Coldwater Creek 0 0 1 0 1 1 0 0 0 1Blackjack Creek 7 7 11 0 25 9 7 10 0 26Mt. Carme 1 0 1 0 1 1 0 1 0 2McLellan 2 0 1 0 3 2 0 1 0 3Sweetwater Creek (3) 0 0 0 0 0 0 0 0 0 0
Subtotal 49 29 74 0 152 59 34 55 0 148
SOUTH FLORIDA
Lehigh Park 1 0 3 0 4 2 0 2 0 4Townsend Canal 1 0 3 0 4 2 0 2 0 4West Felda 13 0 27 0 40 11 0 21 0 32Mid-Felda 1 0 1 0 2 2 0 0 0 2Sunoco Fetda 2 0 19 0 21 1 1 16 0 18Corkscrew 3 0 0 0 3 3 0 0 0 3Lake Trafford 0 0 1 0 1 0 0 1 0 1Seminole (3) 0 0 0 0 0 0 0 0 0 0Sunni land 0 0 13 0 13 0 0 8 0 8Bear Island 10 0 17 0 27 7 2 17 0 26Pepper Hamock 0 0 1 0 1 0 0 1 0 1Baxter lsland (3) 0 0 0 0 0 0 0 0 0 0Raccoon Point 12 0 3 0 15 12 0 3 0 15Forty Mlle lend (3) 0 0 0 0 0 0 0 0 0 0
Subtotal 27 0 54 0 81 23 3 46 0 72
STATEWIDE TOTAL 92 29 162 0 283 99 37 126 16 262
1. Statistics compiled by Charles Tootle, Florida Geological Survey,Oil and Gas Section.
2. Fields are listed in approximate order from north to south and west to east.3. Plugged and abandoned oil fields.
Abbreviations: PRO - Producing WellsINJ - Injection WellsSI - Shut In WeltsTA - Temporarilty Abandoned WellsTOT - Total No. Wells
48

Information Circular 107
APPENDIX 4
1988 AND 1989 FIELD WELLS DRILLED
49

Florida Geological Survey
1988 AND 1989 FIELD WELLS DRILLED
Drill Floor TotalFIELD Well (1) and Operator-Well Completion Elev., Ft. Depth,County Permit No. Name & No. Location (2) Date Above MSL Ft. (3) Status
MC DAVID FIELD
Escantia W-16368 Hughes Eastern 2420' FNL & 6/13/89 20 16,750 Plugged and abandonedP-1234 Corp.-Jones Estate 1637' FEL as a dry hole, 6/16/88.
No. 34-1 Sec. 34,T5N, R31U
JAY FIELD
Santa Rosa W-16369 Exxon Corp.- Jones 2,337.66' FSL & 8/04/89 235 15,735 Injection well.P-1249 McDavid No. 7-8 3,381.86' FEL
Sec. 7,T5N, R29U
RACCOON POINT FIELD
Collier W-16121 Exxon Corp.- SHL: 1/07/89 34 MD: 11,796 Completed as a potentialP-1215 Collier Land £ 2,651' FNL & TVD: 11,542 producer.
Cattle Corp. 1,738' FELNo. 27-4 BHL:
1,320' FSL &1,320' FEL
Sec. 27,T51S, R34E
1. Florida Geological Survey well number for samples (cuttings or core chips).2. For directionally drilled wells, SHL is surface hole location, BHL is bottom hole location.3. For directionally drilled wells, MD: measured depth; TVD: true vertical depth.
50

Information Circular 107
APPENDIX 5
1988 AND 1989 WILDCAT WELLS DRILLED
51

Florida Geological Survey
1988 AND 1989 WILDCAT WELLS DRILLED
Drill Floor TotalWell (1) and Operator-Well Completion Etev., Ft. Depth
County Permit No. Name & No. Location (2) Date Above MSL Ft. (3) Status
4ORTHMEST FLORIDA
Calhoun U-16298 Zilkha Energy Co.- 1049' FSL & 08/26/88 141 9,758 Plugged & abandonedP-1235 Donald Leonard 1330' FUL as a dry hole, 10/24/88.
No. 15-3 Sec. 15,T2S, R8W
Escambia U-16126 ARCO Oil & Gas 1029' FSL & 03/17/88 193 17,262 Plugged & abandonedP-1228 Co.- R. H. Sherritt 1050' FUL as a dry hole, 3/17/88.
No. 34-3 Sec. 34,TSN, R33U
Escambia W-16406 Hughes Eastern 1500' FNL & 07/14/88 269 16,800 Completed as a potentialP-1230 Corp.-Walker-lotey 1050' FWL producer, 7/14/88.
No. 34-2 Sec. 34, (McDavld Field)T5N, R31W
Escanbisa U-16506 ARCO Oil & Gas 977' FSL & 08/11/89 30 17,500 Plugged and abandonedP-1250 Co.- A. Grimes 976' FEL as a dry hole, 8/11/89.
No. 8-4 Sec. 8,T4N, R32W
Okatoosa W-16503 Hardy Oil & Gas 1320' FSL & 10/12/89 22 14,105 Plugged & abandonedP-1253 U.S.A., Inc.- 1650' FEL as a dry hole, 10/12/89.
State of Florida Sec. 30,No. 30-4 T6N, R25W
Santa Rosa W-16180 Louisiana Land & 1600' FNL & 06/24/88 182 16,080 Plugged & abandonedP-1232 Exploration Co.- 1100' FEL as a dry hole, 6/24/88.
Jeffreys No. 20-1 Sec. 20,T4N, R28W
Santa Rosa U-16244 Exxon Corp.- 1330.75' FNL & 01/28/89 25 17,400 Plugged & abandonedP-1244 Exxon-Chapion 923.22' FEL as a dry hole, 1/28/89.
International Sec. 5,No. 5-1 T2N, R29U
Santa Rosa U-16301 Harkins & Co.- SHL: 03/20/89 76 MD: 16,236 Plugged & abandonedP-1245 Champion No. 16-2 1988.7' FSL & TVD: 16,123 as a dry hole, 3/20/89.
186.7' FWLSec. 15,
BHL:2220' FSL &660' FELSec. 16,T5N, R30W
Santa Rosa U-16302 Exxon Corp.- 1600' FNL & 04/26/89 25 15,589 Plugged & abandonedP-1246 Shriners Hospital 1100' FEL as a dry hole, 4/26/89.
et al. No. 28-1 Sec. 28,T4N, R26W
Santa Rose No WU (4) Hardy Ofil Gas 1200' FSL & 10/12/89 25 14,970 Plugged & abandonedP-1252 U.S.A., Inc.- 1200' FEL as a dry hole, 10/12/89.
T.R. Miller Mill Sec. 13,Co. No. 13-4 T5N, R27W
Santa Rosa U-16498 Cation Petrol. 859' FSL & 12/21/89 191 6,600 Plugged & abandonedP-1257 Co.-S. Decker 1783' FEL as a dry hole, 12/21/89.
Ellis No. 18-4-3 Sec. 18,T4N, R28W
52

Information Circular 107
1988 AND 1989 WILDCAT WELLS DRILLED
Drill Floor TotalWell (1) and Operator-Well Completion Elev., Ft. Depth
County Permit No. Name & No. Location (2) Date Above MSL Ft. (3) Status
SOUTH FLORIDA
Collier W-16122 Sabine Corp.- 1320' FNL & 01/28/88 43 11,850 Plugged & abandonedP-1208 Collier Co. 1600' FWL as a dry hole, 2/1/88.
No. 4-2 Sec. 4,T47S, R28E
Collier W-16165 Sabine Corp.- 1042.81' FNL & 05/27/88 36 11,750 Plugged & abandonedP-1216 Collier Co. 1027.51' FWL as a dry hole, 6/13/88.
No. 18-2 Sec. 18,T50S, R33E
Collier W-16195 Sabine Corp.- 1584.97' FNL & 07/09/88 46 12,000 Plugged & abandonedP-1217 Collier Co. 1644.89' FWL as a dry hole, 7/9/88.
No. 29-2 Sec. 29,T47S, R29E
Collier W-16457 Sabine Corp.- 1081.92' FNL & 11/13/89 51 11,620 Plugged & abandonedP-1238 Alico Land 1398.02' FEL as a dry hole, 11/13/89.
Development Sec. 3,No. 3-1 T46S, R28E
Collier W-16243 Sabine Corp.- SHL: 12/10/88 38 MD: 12,345 Plugged & abandonedP-1240 Collier Co. 656' FNL & TVD: 11,879 as a dry hole, 12/10/88.
No. 5-5 868' FWLSec. 9,BHL:967' FSL &967' FELSec. 5,T49S, R30E
1. Florida Geological Survey well number for samples (cuttings or core chips).2. For directionally drilled wells, SHL is surface hole location; BHL is bottom hole location.3. MD: measured depth; TVD: true vertical depth (determined by directional survey).4. Well samples have not been submitted yet.
53

Florida Geological Survey
APPENDIX 6
OIL EXPLORATION WELLS DRILLED IN FLORIDA STATE WATERS
54

Information Circular 107
OIL EXPLORATION WELLS DRILLED IN STATE WATERS
RotaryWellt (1) and Lease No. Table Elev. Total Geological
Year Permit No. Operator and Area County Ft. above MSL Depth, Ft. Significance
1947 P-16 Gulf Oil State of Florida offshore 23 6,100 Bottomed in Upper Cretaceous(?).W-1413 Corp. Lease 374 No. 1 Monroe
Sugarloaf Key Area
1947 P-22 Gulf Oil State of Florida offshore 23 15,455 No porosity in Sunnitand Fm.W-972 Corp. Lease 373 No. 1 Monroe Wellt bottomed in Pumpkin Bay
Big Pine Key Area (Late Coahuilan). Very difficultto correlate this well because ofanhydrite development. Structur-ally very low.
1947 P-43 Magnolia State of Florida offshore 10 7,019 Bottomed in Lower Cretaceous.W-1502 Petroleum Block 5-B No. 1-A Franklin
Co. St. Vincent Sound
1955 P-232 Gulf Oil State of Florida offshore 32 12,631 Well cored from 11,661-12,544'W-3510C Corp. Lease 826-G No. 1 Monroe in Sunni and and Punta Gorda.
Florida Bay Encountered some salt stringersin Punta Gorda. Only 60' of dark,dense calcitutite in Sunnitand.
1956 P-251 HORC State of Florida offshore 26 7,505 Bottomed in Lower Cretaceous.W-4122 Lease 833 No. 1 Santa Rosa
Pensacola Bay
1959 P-275 Gulf Oit State of Florida offshore 56 15,478 Four drill stem tests:W-5094 Corp. Lease 826-Y No. 1 Monroe 12,474-12,533'(Lake Trafford?)
Marquesas 12,534-12,544'(Sunnitand)12,582-12,822'(Sunni and)14,642-14,702'(Brown Dolomite)The 12,474-12,533' test recovered15 barrels of 22 degree APIgravity oil and 14.1 barrels ofsaltwater. Brown Dolomite from14,650-15,036' was somewhat vuggy.This may be the principal targetin this area. Net dolomite esti-mated at 400'.
1959 P-280 California State of Florida offshore 21 6,030 Bottomed in Lower Cretaceous.W-5152 Coastal Lease 1011 No. 1 Monroe
Big Pine Key Area
1959 P-281 California State of FLorida offshore 26 7,030 Bottomed in Lower Cretaceous.W-5103 Coastal Lease 224-A No. 1 Franklin
St. George IslandArea
1960 P-289 California State of Florida offshore 39 14,000 Brown Dolomite: 12,485-12,589'.W-5574 Coastal Lease 224-B No. 1 Lee Estimated net dolomite: 103'.
Boca Grande Area
1961 P-292 California State of Florida offshore 36 7,722 Bottomed in Lower Cretaceous.W-5713 Coastal Lease 1011 No. 2 Monroe
Marquesas
1961 P-293 California State of Florida offshore 34 10,560 Did not encounter Smackover Fm.W-5654 Coastal Lease 224-A No. 2 Franklin Bottomed in Eagle Mills Fm. of
South of Alligator Triassic Age. Diabase found inPoint Eagle Mills.
1961 P-297 California State of Florida offshore 40 12,600 There is an estimated 40' of dolo-W-5785 Coastal Lease 224-B No. 2 Lee mite in the 12,445-12,560' Brown
Boca Grande Area Dolomite interval. No evidence ofoil staining. Dolomite microcrys-talline to finely crystalline.Core analysis from 11,255-11,625'Sunnitand interval showed nopermeability, extremely low por-osity, and no oil.
55

Florida Geological Survey
OIL EXPLORATION WELLS DRILLED IN STATE WATERS
RotaryWell (1) and Lease No. Table Etev. Total Geological
Year Permit No. Operator and Area County Ft. above MSL Depth, Ft. Significance
1962 P-29i California State of Florida offshore 57 12,850 Bottomed in Punta Gorda. No showsW-5970 Coastal Lease 1011 No. 3 Monroe of oil and no porosity reported.
Marquesas Dritt stem test of the 12,521-12,600, interval tested saltwater.Rebecca Shoals Reef (Paleoceneand Upper Cretaceous) present.
1963 P-304 California State of Florida offshore 37 10,600 Bottomed in Lower Cretaceous.w-6278 Coastal Lease 224-8 No. 3 Pinellas Very poor samples. No oil shows.
Honeymoon Island Carbonates-clastics below 7,000'.Area
1967 P-375 Nobit Oil State of Florida offshore 21 12,931 This well drilled into Pumpkinw-8139 Corp. Lease 224-B No. 1 Charlotte Bay Fm. (Upper Coahultan) at
Boca Grande Area 12,230'. Drilled into basement(rhyotite porphyry) at 12,830'.No shows in Sunni and Fm. BrownDolomite Zone: 11,920-12,000'.Estimated net dolomite: 70'. Poorsamples.
1967 P-382 Mobilt Oil State of Florida offshore 22 6,041 Mixed facies (carbonates, sand-w-8304 Corp. Lease 224-A No. 1-A Citrus stones, and shales) at 4,325';
W-SU of Crystal Triassic, Eagle Mitlls at 5,625';River Paleozoic at 5,920'. Very indur-
ated shale and sittstone. Somequartzite. Bedding planes verti-cal in this core. No shows and noporosity.
1967 P-383 Mobil Oil State of Florida offshore 25 4,735 Mixed facies (carbonates, sand-W-8305 Corp. Lease 224-A No. 1-8 Levy stones, and shales) at 2,882' in
Cedar Key Area Cretaceous. Predominantly vari-colored unconsolidated sandstonebelow 4,180'. Highty induratedquartzites and interbedded shalesin core (Paleozoic) from 4,720-4,735'.
1968 P-387 Nobit Oil State of Florida offshore 37 14,369 This well encountered JurassicU-8487 Corp. Lease 224-A No. 1-C Franklin limestone. First indication of
Little St. George possible Smackover in Apalachi-Island Area cola area.
1983 P-1097 Getty Oil State of Florida offshore 30 18,011 Smackover tests at 17,405-17,411'u-15391 Coopany Lease 2338 No. 1 Santa Rosa and 17,328-17,411' produced only
East Bay saltwater. Norphlet Ss. and LouannSalt were very thin.
1. Florida Geological Survey well number for samples (cuttings or core chips).
56

Information Circular 107
APPENDIX 7
1988 AND 1989 OIL EXPLORATION WELLS DRILLED
IN FEDERAL WATERS, OFFSHORE FLORIDA
57

Florida Geological Survey
1968 AND 1989 OIL EXPLORATION WELLS DRILLED IN FEDERAL WATERS, OFFSHORE FLORIDA
PLUGGED &WELL DEPTH, FT. SPUD ABANDONED
AREA NO. OPERATOR LOCATION BELOW MSL DATE DATE COMMENTS
Oestin Dome OCS-0-6406 Chevron Block 56 22,572 06/12/87 01/26/88 Tenporarfty abandonedProducible Norphlet discovery.
Peneacolt OCS-0-6391 Tenneco Block 948 19,200 10/14/87 01/19/88 Tefrporarfly abandoned.
Pensacola OCS-0-6396 Texaco, Inc. Block 996 17,910 04/08/88 09/07/88
Destin Dame OCS-0-6397 Gulfetar Block 1 2,000 01/09/89 01/18/89 Tecporarfty abandoned.
Destin Dome OCS-G-6398 Gulfstar Block 2 1,800 01/21/89 01/27/89 Tefrporarity abandoned.No. 2
Pensacola OCS-G-6390 Gulfstar Block 881 2,700 01/29/89 02/07/89 Temporarily abandoned.
Date from Gould, 1989.
58

Information Circular 107
APPENDIX 8
1988 AND 1989 GEOPHYSICAL EXPLORATION ACTIVITY
59

198 AND 1989 GEOPHYSICAL EXPLORATION ACTIVITY
GEOPMYSICAL SURVEYED PWMIT EXPIRATION ENERGY DEPTN, CIARGE SNOT NOLE SURVEYPERMIT COMPANY FOR COUNTY APPMOVED DATE STATUS SOURCE FEET SIZE, LBS SPACING LENGTM,NI
6-96-M Shell Western UEP Shell Western E&P DD,CL N/A N/A Withdraim Seismic Gel 27 3 ISO 133.2-99-88 GFS Markins & Co. SR.ES 14-mar-8 14-Mar-89 Copleted Seismic Gel 100 20 440 6.3
G-100-88 Teledyne First Seismic SROK 27-May-88 27-May-89 Copleted Seis/Airgun 7.5 .5 110 113.8a-101-88 astern Western SR.OK 20-Apr-M 20-Apr-9 Co4pleted Vibroseis I/A N/A N/A 45.06-102-88 GFS Davis Petroleum SR 08-Apr-88 08-Apr-89 Completed Seimic Gel 100 15 220 4.7G-103-88 GFS Union TX SR 11-Ar-88 11-Apr-89 Completed Seimic Get <10 .33 10 28.3G-104-8 Dee Exploration Exxon ES 11-Apr-8 11-Apr-89 Completed Seimic Gel 100 15 220 5.06-105-88 GFS Pruat Oil SR 27-ay-88 27-May-89 Completed Seimic Gel 100 5 330 1.66-106-88 IGC Coastal 011 & Gas SR 17-Aug-88 17-Aua-89 Co•tted Seismic Ge 5 .33 220 9.4G-107-88 Conaco Conoco TY,GA,NO.,J, 21-Jun-86 21-Jun-89 Completed Vibrosels N/A N/A N/A 140.0
LN,WK,US6-108-8 GFS Exxon SR,ES 17-AuD-88 17-Aug-89 Completed Seismic Gel 80 10 440 149.06-109-88 Teledyne First Seimic SR,OK 17-Au-8B 17-Aug-89 Copleted Seis/Airgui 7.5 .5 110 46.0G-110-88 Teledyne First Seismic SR,OK,ES 30-Jun-88 30-Jun-89 Completed Seis/Airgun 7.5 .5 110 18.0G-111-88 Shetl Western SP Shet IWtern E&P DD 19-Sep-M 19-Sp-89 Completed Vibrator N/A N/A N/A 35.0G-112-88 Shell Ustrn WP Shell Western E&P DO 19-Oct-8U 19-Oct-90 Pending Vibrator N/A N/A N/A 90.56-113-88 Shell Mastern EP Shellt Western EUP DO,R 02-Dec-88 02-Dec-89 Coipleted Vibrator N/A N/A N/A 55.5G-114-88 Conoco Conoo NO 07-Sep-88 07-Sp-89 Cancelled Vibroseis N/A N/A N/A 19.2 116-115-88 Petty Ray ARJ ES 19-Sp-UM 19-Sep-89 Copleted Seismic Get 150 6 440 65.0 56-116-88 ShelL Western .P Shell Western E&P DO 02-Dec-88 02-Dec-89 Copleted Vibrator N/A N/A N/A 24.1G-117-88 ShelL Western EP Shell Western EUP DO,BR,HE 19-Dec-88 19-Dec-a89 Completed Vibrator N/A N/A N/A 37.7 1D6-118-88 Shell Western EP Shell Western EUP BR,HE,CL 27-Jan-89 27-Jan-90 Pending Vibrator N/A N/A N/A 26.06-119-88 Shell Western UP Shell Western E&P DO 27-Jan-89 27-Jan-90 Completed Vibrator N/A N/A N/A 2.5
6-120-89 IGC Coastal OiL & Gas SR,OK N/A N/A Cancelled Seismic Get 5 .33 220 46.06-121-89 Coastal Petroleu Coastal Petroleum GL,HE,NT,OE,PB N/A N/A Withdrsam Air/Watergup N/A N/A N/A 225.06-122-89 GFS Paramount OK 13-Jul-89 13-Jul-90 Completed Seismic Gel 60 15 165 4.30-123-89 GFS First Seismic SR 13-Jul-89 13-Jul-90 Coapleted Seismic Gel 0.33 5 110 8.00-124-89 Shell Western EP SheLL Western EUP BR,PB Pending Seismic Gel 27 3 150 27.9 D6-125-89 Halliburton ARCO ES 11-Aug-89 11-Aug-90 Expired Seismic GeL 150 6 440 7.06-126-89 Malliburton Exxon ES 11-Aug-89 11-Aug-90 Completed Seismic Get 80-90 6 352 11.06-127-89 Shell Western EP SheLl Western EUP D,BR Pending Seis/Vib 27 3 150 25.8 0G-128-89 atlliburton Exxon SR,ES 26-Sep-89 26-Sep-90 Completed Seismic Gel 30-90 .3-5 352 31.5G-129-89 Digicon Nobil Offshore 09-Nov-89 09-Nov-90 Completed Airgun N/A N/A N/A 185.06-130-89 Halliburton Chevron ES 11-Oct-89 11-Oct-90 Completed Seismic GeL 30-90 1-20 660 12.56-131-89 Shell Western EP Shell Western EUP DO 05-Dec-89 05-Dec-90 Pending Vibrator N/A N/A M/A 70.8G-132-89 GFS Paramount OK Cancelled Seismic GeL 60 15 165 4.66-133-89 Shell Western UEP Shell Western E&P DO 05-Dec-89 05-Dec-90 Pending Vibrator N/A N/A N/A 50.0G-134-89 Shetll eestern ENP Shet Western E&P DO Pending Vibrator N/A N/A N/A 8.5
County Abbreviations: 1988 1989 TOTALTotal Miles in Applications: 1,055.8 717.8 1,773.6
BR-Brouard GL-Glades OE-Okeechobee Total Surveyed: 786.9 252.3 1,039.2BY-Bay HE-Hendry OK-Okaloosa Surveyed Mites by Area:CL-Colltier HO-Holmes PB-Palm Beach Panhandle Onshore: 632.1 67.3 699.4
Panhandle offshore: 0.0 185.0 185.0DD-Dade JK-Jackson SR-Santa Rosa South Florida: 154.8 0.0 154.8ES-Escambia LN-Leon WK-Wakulta Surveyed Mi tes by Method:GA-Gadsden MT-Martin WS-Washington Vibrator: 339.8 0.0 339.8
Airgun: 0.0 185.0 185.0Seismic Gel: 269.3 67.3 336.6Seis.Gel/Airgun: 177.8 0.0 177.8
Total Pending: 116.5 183.0 299.5Total Withdrawn, Cancelled, Expired: 152.4 282.6 435.0

Information Circular 107
APPENDIX 9
FLORIDA OIL AND GAS RESERVE ESTIMATES
ByCharles H. Tootle, P.E. #40,500
61

FLORIDA OIL AMD GAS RESERVE ESTIMATES
ORIGINAL OIL REMAINING ORIGINAL GAS REMAIINGAVERAGE ORIGINAL ESTIMATED RECOMER- PODUCED RECOVERABLE RECOVER- PRODUCED RECOERALE
OIL AVERAGE P "DUC- GAS-OIL OIL IN RECOVERT ABLE OIL TMROU OIL RESERVES ABLE GAS TMIOUGM GAS RESERVSGRAVITY, PAI TY, TIVE RATIO, PLACE, FACTOR, IN PLACE, 1-1-90, AS OF 1-1-90. IN PLACE, 1-1-90, AS OF 1-1-90,
FIELD (1) A.P.I. PERCENT ACRES SCF/STB BARRELS FRACTION ARRELS BARRELS BAELS NCF NCF NCF
NORTW.ST FLORIDABluff Springs 53 19.6 160.00 550 1,300,'40 0.19 247,066 220,111 26,973 135,795 120,791 15,004Ncogwid 53 12.8 160.00 400 4,967,347 0.10 496,736 121,206 377,530 199,494 48,364 151,130Jay (FL & AL) 51 14.0 14,414.50 1,277 820,569,503 0.60 492,341,702 395,356,327 96,95,375 626,720,354 505,466,642 123,251,712Jay (FL anly) 51 14.0 13,021.14 1,277 763,129,636 0.60 457,677,783 365,479,210 92,398,573 584,709.929 466,58,558 117,851,371Coldster Creek 47 12.1 160.00 500 2,060,107 0.15 312,016 8,802 303,214 156,006 537 155,471Blackjack Creek 48 16.5 5,719.96 954 100,500,000 0.60 60,300,000 54,482,137 5,817,863 57,526,200 51,909,890 5,536,310Mt. Caretl 43 9.1 481.28 1,028 17,500,000 0.29 5,075,000 4,665,696 409,304 5,218,140 4,797,292 420,848NcLtllan 43 9.0 480.00 430 2,915,540 0.14 412,686 174,289 238,397 177,455 74,905 102,550Swetwater Creek (2) 44 11.0 160.00 1,070 624,000 0.10 62,400 13,695 48,705 66,768 14,655 52,113
Subtotal (3) 20,342.40 893,037,072 524,785,705 425,165,146 99,620,559 648,189,789 523,904,992 124,284,797
SOUTN FLORIDALehigh Park 28 17.7 800.00 100 8,211,707 0.65 5,337,609 5,164,594 173,015 533,761 518,448 15,313 --Tiesend Canal 28 13.7 640.00 0 4,504,699 0.20 900,940 406,117 494,823 0 0 0Mest Felds 26 15.0 7,500.00 80 125,802,366 0.35 44,030,828 41,225,828 2,805,000 3,522,466 3,221,145 301,321 0.NId-Felda 26 11.9 480.00 10 5,090,419 0.30 1,527,126 1,239,166 287,960 12,726 10,094 2,632Sunoco Folds 25 15.0 3,840.00 85 28,946,578 0.40 11,578,631 11,528,631 50,000 964,184 981,329 2,855 )Corkscrew 26 6.9 480.00 0 1,667,806 0.40 667,122 524,462 142,660 0 0 0Lake Trafford 26 7.9 160.00 0 7,690,293 0.04 307,612 277,746 29,866 0 0 00 SeminoLe (2) 25 14.1 480.00 0 2,366,565 0.10 236,657 84,755 151,902 0 0 0Sumi tand 26 15.0 2,080.00 100 37,685,118 0.50 18,842,559 18,444,812 397,747 1,884,256 1,824,628 59,628Bear Island 26 11.9 2,880.00 80 42,811,959 0.35 14,984,184 10,575,398 4,408,786 1,198,735 836,093 362,642 0Peppe Hamock 27 15.3 160.00 0 976,713 0.10 97,671 323 97,348 0 0 0Baxter Island (2) 22 19.6 160.00 0 1,276,617 0.10 127,662 1,859 125,803 0 0 0 CORaccoon Point 23 13.9 2,400.00 120 42,437,790 0.25 10,609,448 4,443,959 6,165,489 1,273,134 530,070 743,064Forty Mile Bend (2) 21 10.0 320.00 50 1,112,701 0.07 77,889 32,888 45,001 3,894 1,656 2,238
Subtotal 22,380.00 310,581.331 109,325,938 93,950,538 15,375,400 9,413,156 7,923,463 1,489,693
STATEWIDE TOTAL 42,722.40 1,203,618,403 634,111,643 519,115,684 114,995,959 657,602,945 531,828,455 125,774,490
1. Fields are Listed in approximite order from northwest to southeast. UNITS: MCF - Thousand Cubic Feet2. Plugged and abandoned oil fields. SCF - Standard Cubic Feet3. Northwest Florida subtotals use Jay (FL only) data. STB - Stock Tank Barrels
METHODS USED TO DETERMINE RESERVE ESTIMATES:Archie's Equation was used to estimate the oil saturation in two feet increments. The formation water resistivities used were 0.018 ohm-meters for the Smack-over Fi. (northwest Florida) and 0.022 ohm-meters for the Sunni Land Fm. (south Florida). Formation temperatures were estimated SST * 76 + depth/80 for north-west Florida and SST a 76 * depth/100 for south Florida. SST is subsurface formation temperature in degrees Fahrenheit, and the depth is the distance in feetbelow ground surface. The volumetric calculation procedure was used to estimate the reserves for aLL of the oil fields except SunniLand, Sunoco Felda, andWest Felda fields. Decline curve analysis was used to estimate the reserves for these three oil fields. This type of analysis will give credible results forthese fields because they are well into the decline part of their production curves. In addition, few porosity Logs were available for these three fields andresistivity Logs yield anomalous values because the wells were drilled with water.DISCLAIMER:An attempt was made to present realistic estimates; however, no guarantee or warranty is expressed or implied. Anyone who uses this information does so attheir own risk.

Information Circular 107
PART II
PETROLEUM EXPLORATION AND DEVELOPMENT POLICIES IN FLORIDA:RESPONSE TO PUBLIC CONCERN FOR SENSITIVE ENVIRONMENTS
ByJacqueline M. Lloyd, P.G. 74
andJoan M. Ragland, P.G. 298
63

Florida Geological Survey
64

TABLE OF CONTENTS
PageAbstract.................................................................................................................................................. 66Acknowledgem ents................................................................................................................................ 66Introduction ............................................................................................................................................ 67Phase I: Encouraging Exploration and Petroleum Legislation............................................................ 67
Early Exploration ............................................................................................................................... 67Early Legislation ................................................................................................................................ 67
Phase II: Econom ic Concerns and Petroleum Legislation.................................................................. 70Early Rules and Regulations .......................................................................................................... 71Early Offshore Geophysical Perm itting........................................................................................... 71
Phase III: Petroleum Policy Development in Response to Environmental Concern........................... 72South Florida Developm ent History................................................................................................ 72Policy Development in Response to South Florida's Sensitive Environments ............................... 72Current Regulation of Geophysical Exploration.............................................................................. 73Offshore Activity and Policy Developm ent...................................................................................... 73
Jurisdictional Boundaries ........................................................................................................... 73Offshore - State W aters ............................................................................................................ 73Offshore - Federal W aters......................................................................................................... 75
Activity....................................................................................................................................... 75Policy ........................................................................................................................................ 75
Sum m ary................................................................................................................................................ 80References............................................................................................................................................. 81
ILLUSTRATIONS
Figure Page
1. South Florida oil field location map showing boundaries of the Big Cypress Swampdrainage area, the Big Cypress Swamp Area of Critical State Concern, and theBig Cypress Swam p National Preserve......................................................................................... 68
2. Northwest Florida oil field location m ap......................................................................................... 69
3. Florida portion of the 1987-1992 federal Outer Continental Shelf oil andgas leasing program . ........................................................................................................................ 74
4. O il exploration wells, Florida state waters ..................................................................................... 76
5. O il exploration wells, federal waters, offshore Florida................................................................... 78
65

ABSTRACT
Florida's oil and gas policies have evolved in response to its increased awareness of the economic andaesthetic value of its other natural resources. The history of state oil and gas regulations and policy inFlorida can be divided into three phases. The first phase encouraged exploration with no stated concernfor other natural resources. This phase culminated in the legislative offer of an award for petroleumdiscovery. The second phase began in 1945 with the passage of the conservation law and spanned themid-1940's to -60's. This period was characterized by economic concern for tourist trade and commercialfisheries. Finally, environmental concerns became an issue in the early 1970's. The effects of theseconcerns are especially apparent in the development of recent offshore policies and regulations. Thefollowing text describes the history of oil and gas development and regulation in Florida as it relates toconcerns for the economic and aesthetic value of Florida's other (non-petroleum) natural resources.
ACKNOWLEDGEMENTS
Walt Schmidt, Tom Scott, Steve Spencer, David Curry, Ed Lane, and Frank Rupert, all staff membersof the Florida Geological Survey, reviewed this report and suggested improvements. Debbie Tucker(Office of the Governor, Environmental Policy, Community and Economic Development Unit,Tallahassee, Florida) reviewed the section on offshore activity and policy development and suggestedclarifications. Jim Jones and Ted Kiper drafted and photographed the figures.
66

Information Circular 107
PETROLEUM EXPLORATION AND DEVELOPMENT POLICIES IN FLORIDA:RESPONSE TO PUBLIC CONCERN FOR SENSITIVE ENVIRONMENTS
By Jacqueline M. Lloyd, P.G. 74and
Joan M. Ragland, P.G. 298
INTRODUCTION was on encouraging exploration. The onlypetroleum legislation passed prior to this
Florida currently produces oil from two areas discovery was the reward bill, which was passed
(Figures 1 and 2). One is in south Florida, the in 1941. Attempts to pass petroleumother is in the western panhandle area. The conservation legislation began after the state's
south Florida area includes 14 oil fields; the first deep oil test was drilled in 1939. These
western panhandle area includes seven, attempts were not successful until 1945. The
South Florida production began with Florida's attempt to pass this legislation and the history
first oil discovery at Sunniland field in September, leading up to the passage of the conservation1943 (Gunter, 1949) (Figure 1). The south law in 1945 are described in detail by FieldsFlorida fields are oriented along a northwest- (1959). The following discussion of this history is
southeast trend through Lee, Hendry, Collier, summarized from his report.
and Dade counties (Figure 1). The trend is the The first test for oil in Florida was in 1900 at
Sunniland trend and is approximately 12-miles Pensacola in Escambia County (Gunter, 1949).
wide by 145-miles long and happens to lie within This well was drilled to only 1320 feet. An
some of south Florida's most sensitive wetland additional 79 exploratory wells were drilled
environments, between 1900 and 1939; however, many of
Production in the western panhandle began these were very shallow and may have been
with the discovery of Jay field in June, 1970 more "promotional" than serious oil tests (Gunter,
(Babcock, 1972). Although Jay field straddles the 1949). In 1939, the first significant deep oil test
Escambia River, most of the field is within less was completed near Pinecrest, in Monroe
sensitive upland environments (Figure 2). Even County, at a depth of 10,006 feet (Gunter, 1949).
though ecological and environmental concerns Information yielded by this deep test drew the
affected development at Jay field (Oil and Gas attention of major oil companies to Florida and
Journal, 1972), most of Florida's environmental marked the beginning of more "serious" oil
regulations have evolved in response to exploration in Florida.
development in south Florida.
Early Legislation
PHASE I: ENCOURAGING EXPLORATIONAND PETROLEUM LEGISLATION The interest shown by these major oil
Early Exploration companies prompted the first attempt to passconservation legislation in Florida in 1939. Thebill was supported by the petroleum industry and
The years 1900 to 1939 were characterized by proposed to make "waste" in production, storage,sporadic, shallow wildcat exploration in Florida. and transportation of oil or gas unlawful. The billFlorida's "first phase" (1900 to 1945) policies briefly:concerning petroleum exploration somewhat 1. Prohibited waste of oil and gas.parallels this same period. Until Florida's first 2. Defined waste.commercial oil field discovery in 1943, emphasis 3. Set up the State Board of Conservation.
67

Florida Geological Survey
SOUTH FLORIDA OIL FIELD LOCATION MAP
A249 R26 _R2E_ R3E _ R32E __%_3E ___
LEHIH ARKI I_I _ K kOWNSEhID ANAL
MID- EIlA HENDRY CO.SUNOCO-FELDA HENDR)' CO
IEE CO. PALMI .. BEACH -EVWEST LOA
COCOaKSC1E0W Knn C
I ~ ----------- 4----4AN ND I
FOS 130868 MlD O . ..-
EEINVISED AUGUST 19
..... . .- .•...
l FORIOA ORTY MILE BENDEXPLANATION
CRITICAL CONCE RN
CAIQ BIG CYPRESS I0 ----.
INACTIVE OIL FIELD
IIB CYPRESS
o 10 MI SWAMP BOUNDARY
Figure 1. South Florida oil field location map showing boundaries of Big Cypress Swamp drainage area,Big Cypress Swamp Area of Critical State Concern, and Big Cypress Swamp National Preserve.
68

Information Circular 107
R33W R32W R3IW RQW R29W R28W-- R27W R26W
•- -- - I -,•.^,--r--- ---- McLELLAN IELD
BLUFF SPRINGS FIED AY FIE4D SWEETWATER iM I - -D- CR E CGREEK FIELD
MAI D 1EDLACKJACK
SCREEK FIELD--
\------.-- --------------.------------------ 4-- - -
EXPLANATION I
P ACTIVE OIL FIELDQ INACTIVE OIL FIELD 4%t \ .. 4
5 0 5 KM5 0 MILES MILTON
CANTONMENT IVSCALE
FLORIDA
LOCATION
SWE1 3T• NA4NENACOLA
( 1FGS010491
Figure 2. Northwest Florida oil field location map.
69

Florida Geological Survey
4. Required notice of intention to drill, deepen avoid the alteration by the opposition that hador plug a well. occurred in 1941. The bill had stronger backing
5. Required that log and plugging records be but failed to be voted on during this session. Thefiled with the State Board of Conservation. session closed with the bill on the calendar. A
6. Authorized the State Board of Conser- separate bill, which sought to protect groundvation to promulgate and enforce rules and water by regulating drilling practices, was alsoregulations and prescribe necessary forms. introduced in 1943. This bill passed the Senate,
7. Prescribed penalties for violations, but died in the House, primarily due to a lack ofOpponents to the legislation argued that such Interest by its sponsors.
a law would doter rather than encourage The 1943 legislature adjourned in June; justexploration. A quote from one of the opposition three months before the first oil discovery. If theleaders states: " ... as long as the state has no discovery had been made before the end of theproduction . .. there is about as much necessity session, the conservation law may have passed.for legislation to regulate or control production as By the end of 1943, more than 15 major oilthere would be to require paupers to rent lock companies and numerous independents wereboxes in banking institutions." This first effort to buying leases in the state. Major newspaperspass legislation failed, began publishing oil news and discussing
Florida's leqislature only met every two years conservation issues.so the next attempt to pass a conservation bill The September 1943 discovery, named thewas not made until 1941. The proponents had Sunniland field, was made by Humble Oil andenlisted petroleum industry lawyers to prepare a Refining Company (HORC) in Collier County,much more detailed bill than the previous one. Florida (Figure 1). In 1944, after provenThe opposition revised the bill to the extent that it commercial production, HORC was awarded thedealt more with ground-water pollution concerns $50,000 for finding the first oil production inthan with conservation of oil and gas. The Florida. HORC donated the award to theoriginal proponents, therefore, fought the University of Florida and Florida State College forpassage of the bill in the House of Women (now Florida State University) and addedRepresentatives after it passed the Senate. It $10,000 as a gift (Elliot, 1945).died on the House calendar at the end of thesession. Efforts to pass a conservation law wereagain delayed by two years. PHASE II: ECONOMIC CONCERNS AND
1941 was also the year that the discovery PETROLEUM LEGISLATIONaward bill (Chapter 20667-No. 459, Laws ofFlorida, 1941) was passed to encourage The second phase of Florida's petroleumexploration for oil and gas. The bill offered an legislative history began in 1945 with theaward to the explorer and operator of the first passage of the conservation law and spannedcommercial oil or gas discovery. The award the mid-1940's to -60's. The public began toincluded $50,000 and a five-year oil and gas show concern for the value of Florida's otherlease covering four tracts of land up to 10,000 natural resources. This concern was promptedacres each "free of any bonus, rental or lease primarily by potential economic impact on touristcharges except the reservation of one-eighth trade and commercial fisheries.royalty usually retained in such leases." This act In 1945, due to the Sunniland discovery andbecame law without the Governor's approval and the resulting increase in exploration, Governorwas filed in the Office of Secretary on June 4, Millard F. Caldwell appointed an Oil Advisory1941. Committee to study the petroleum laws and
In 1943, the conservation bill was introduced practices of other states. The State Baragain. A briefer, simpler version was proposed to Association also appointed an oil and gas
70

Information Circular 107
committee to study legislation of other states. c. establish drilling units, andThe two committees worked together, with d. regulate production procedures as nec-advice from the Interstate Oil Compact essary to prevent waste.Commission, to prepare what was to become the 3. Set penalties for violations.first conservation law. The 1945 legislature saw 4. Restricted drilling on or near improvedthe introduction of this conservation law and beaches or municipalities.several other related oil bills. The bills included: A taxation law was not passed until the next
1. The conservation law. legislative session. The oil and gas taxation act2. A bill to ratify the Interstate Oil Compact (Chapter 22784-No. 270, Laws of Florida, 1947)
and to make Florida a member of the Inter- became law without the Governor's approval andstate Oil Compact Commission. was filed in the Secretary of State's office June 3,
3. A bill for taxation of oil and gas produced 1947.in Florida.
4. A state lease law.Unexpected opposition arose to all of the oil
bills; this time from the cities along the westcoast of Florida. They were not opposed to the The first rules regulating oil and gassubject matter of the oil legislation, but wanted exploration and production were adopted in 1946provisions to be inserted in all the proposed bills (Section 115-B-2.05, Florida Administrative Codethat would ensure protection of the Florida west (F.A.C.)). There was no mention in the rules ofcoast beaches from pollution and "unsightly environmental concerns. As discussedoperations." Their concerns were not previously, the statutory protection for improvedenvironmental but rather economic. They beaches was enacted in response to ancontended that oil operations might "destroy the economic issue. Primarily, the rules were writtenbeauty of the west coast and do irreparable to "... prevent waste of oil or gas ... "damage to the tourist trade." Rule revisions in 1949 (Gunter, 1950), 1962
Newspapers of these cities "clamored" for and 1963 (Babcock, 1964) were procedural inbeach protection. Amendments were adopted nature and did not include environmentalwhich addressed this issue and were made a concerns. The 1949 and 1962 revisions addedpart of Florida's conservation bill. After six years provisions for the temporary abandonment ofof effort, a law providing for the conservation of wells and defined an abandoned well. The 1963oil and gas in Florida was finally passed and revision changed the time for supplying the Oilsigned by the Governor on June 5, 1945 and Gas Section of the Division of Geology with(Chapter 22819-No. 305, Laws of Florida, 1945). electrical logs and other surveys made in theThe bill to ratify the Interstate Oil Compact and drilling of a well from six months to ninety days. Itmake Florida a member of the Interstate Oil also provided that the State Board ofCompact Commission (Chapter 22823-No. 270, Conservation would keep information confidentialLaws of Florida, 1945) and the state lease law for a period not exceeding one year from the(Chapter 22824-No. 310, Law of Florida, 1945) date the information is filed, unless exceptionalwere also passed by the 1945 legislature. hardship was proven.
The conservation law:1. Prohibited the waste of oil or gas.2. Set up the State Board of Conservation and Early Offshore Geophysical Permitting
gave them the authority to:a. administer and enforce the Conservation In 1963, the first five offshore geophysical
Act, permits were granted by the State Board ofb. adopt necessary rules and regulations, Conservation (Babcock, 1964). In 1965, a
71

Florida Geological Survey
statement of policy outlining rules and Florida following the opening of the Sunnilandregulations to be observed in performing offshore field. During the years between Sunniland fieldgeological and/or geophysical work was discovery (1943) and the first rule revision toprepared by the State Board of Conservation include extensive environmental concerns(Babcock, 1966). These covered "submerged (1972), only 92 exploratory wells were drilled inlands, other than inland waters of Florida and south Florida. The Sunniland discovery was notapplicable to federal lands seaward of Florida's followed by the usually rapid successes seenboundary." The rules were supposedly "pursuant when new production areas are opened. Fortyto authorization of the Department of the Interior Mile Bend field was discovered in 1954, butof the United States dated April 3, 1965, and showed disappointing production from only twopublished in the federal register (Federal wells and was abandoned in 1955 (Gunter, 1955Register Document 56-2450, Volume 21, No. and 1956). The second really successful oil field64)." was not discovered until 1964, 21 years after the
Approximately 100 offshore geophysical Sunniland discovery. This was the Sunoco Feldapermits were issued. In the early 1970's, it was field (Babcock, 1966). Discoveries of West Feldadetermined that there was no statutory authority field in 1966 (Babcock, 1968), Lake Trafford fieldto issue these permits and geophysical in 1969 (Applegate and Lloyd, 1985), and Bearpermitting was discontinued (David Curry, Florida Island in 1972 (Applegate and Lloyd, 1985)Geological Survey Oil and Gas Section followed.Administrator, personal communication, 1989).
These rules expressed concern for naturalresources other than oil and gas, primarily for Policy Development In Response to Southcommercial fisheries; thus, the concern was Florida's Sensitive Environmentsagain prompted by economics. They included;however, a brief reference which indicates an The rule revision of 1972 included the firstaesthetic or environmental concern (Babcock, statutory evidence of serious environmental1966): concerns and the first mention of concern for
"All operators conducting seismic operations onshore native and sensitive environmentalshall use reasonable precaution in resources. These rules incorporated theaccordance with approved and accepted concerns that developed through the years withmethods to prevent destruction of, or injury the recognition of the importance of wetlandto, fish, oyster, shrimp and other aquatic life, environments, especially as it related to oilwildlife, or other natural resources." exploration and development in south Florida.
South Florida oil production is partially withinthe Big Cypress Swamp and is adjacent to the
PHASE V ll: PETROLEUM POLICY Everglades (Figure 1). The wetlands of theseEVEOPMENTA SONSE areas provide important feeding, nesting, and
wintering grounds for migrating and severalendangered and threatened species. are
South Florida Development History dependent upon the wetland ecosystem forsubsistence (Big Cypress Area Management
The minimal legislative activity and apparent Task Force, 1984).
lack of environmental concern between the time The Big Cypress Swamp Advisory Committee
of the passage of the conservation law and the was created by the Governor and Cabinet in
early 1970's may have been partly due to the 1971 in response to pressures exerted on the Big
slow development and limited success in south Cypress ecosystem by many external factors, not
72

Information Circular 107
solely by oil and gas exploration. This Committee Florida."provides a forum for industry, various regulatory There were major revisions to the geophysicalagencies, and environmental groups to allow oil rules in 1985 and 1986 that resulted from safetyexploration and development while ensuring the violations by some geophysical companies andprotection of sensitive environmental and wildlife from additional concerns about wildlife habitatresources (Big Cypress Area Management Task and sensitive environments.Force, 1984).
In 1974, Congress set aside about 40 percentof the Big Cypress Swamp (570,000 acres) as Offshore Activity and Policy Developmentthe Big Cypress National Preserve (Figure 1). In JURISDICTIONAL BOUNDARIESthe legislation creating the Preserve, the NationalPark Service acquired the surface land rights,but, in most cases, not the mineral rights. This State ownership of the continental shelf off
legislation (Public Law 93-440) allows oil and gas Florida extends three miles into the Atlantic
exploration as long as it is not detrimental to the Ocean and about 10.5 miles (three marine
purpose of the preserve, which is to: "... ensure leagues) into the Gulf of Mexico. The federal
the preservation, conservation and protection of government controls resources beyond these
the natural, scenic, hydrologic, floral, faunal and state boundaries out to 200 miles. The Outer
recreational values of the Big Cypress Continental Shelf (OCS) is a jurisdictional term
watershed, and to provide the enhancement and that describes the offshore area that is under the
public enjoyment thereof." control of the federal government. The federal
The rule revisions of 1981 through 1986 government divides the OCS into planning areas.
incorporated additional environmental concerns. Three federal OCS planning areas surround
These rules and the interagency cooperation of Florida: the Eastern Planning Area, the Straits of
the Big Cypress Swamp Advisory Committee Florida Planning Area, and the South Atlantic
allow oil production and exploration to take place Planning area (Figure 3) (Johnson and Tucker,while minimizing damage to the environment. 1987).
Current Regulation of OFFSHORE - STATE WATERS
Geophysical Exploration
There has been no leasing of tracts withinAn amendment in 1980 gave the Florida Florida state waters since the early 1980's. At
Geological Survey the statutory authority to this time, the only known active leases withinregulate geophysical activity, both onshore and Florida state waters are held by Coastaloffshore in state waters (Chapter 377, Part 1, Petroleum Company. Three leases wereFlorida Statutes). Rules were adopted in 1984 obtained by Coastal Petroleum in the late 1940's.(Chapter 16C-26.07, F.A.C.) to implement this Two of these leases cover state land in the Gulfauthority and legitimate permitting began in July of Mexico, from the coastline to about 10 miles1984. The rules state: offshore, between Apalachicola and Naples,
"It is the intent of the department to permit Florida and the submerged land of rivers andgeophysical operations . . . in Florida lakes that feed this area. A third lease coversprovided that this activity is conducted in a Lake Okeechobee.manner which minimizes or prevents the Between 1947 and 1983, a total of 19 wellsdestruction of or injury to the environment were drilled in Florida state waters (Figure 4).and the natural resources of the State of
73

Florida Geological Survey
I I I I I880 86° 840 82 80
30
SOUTH ATLANTIC• :'- .PLANNING AREA
- 28
EASTERN GULF OF MEXICO
PLANNINGPLANNING AREAAREA26 ..... .. * , , 1
ECIAL CCE APLANNING AREAREA
EXISTING LEASESNATION
I IJP[CI AKA IICvIfUL¥ ROOVCD rROM LgASING
Figure 3. Florida portion of the 1987-1992 federal Outer Continental Shelf oil and gas leasing program
after the year 2SN M 100 10. LL ACRES)
November 1988 lease sale. President Bush later canceled Sale 116+ Part II in this area until
74

Information Circular 107
Detailed information on these wells is tabulated Gas Journal (1989) discusses the Chevron-6406in Part I, Appendix 6, of this publication. One of well and quotes Chevron USA Inc. as stating thatthese wells, .drilled in 1959 in the Marquesas "the well was not tested due to safety and costKeys area (Florida permit 275, Figure 4), had a considerations. However, analysis of cores andsignificant oil show in the Lake Trafford (?) wireline logs indicates the presence of gas in theFormation (Applegate and Lloyd, 1985; also Part Norphlet sandstone." These two discoveriesI, Appendix 6 of this publication), extend the offshore Norphlet gas trend seaward
Recognition of environmental sensitivity, as and eastward from the Mobile map area of thewell as dependence of many commercial Central Gulf of Mexico Planning Area, offshoreenterprises on the vitality of these areas, has led Alabama, into the Eastern Gulf of Mexicostate government to place all state waters under Planning Area, offshore Florida.a no-lease protection policy. This policy was In addition to the potential indicated by theseenacted by the legislature in two steps: effective Destin Dome discoveries, an offshore southJuly 1, 1989, drilling was prohibited in Florida Florida well (Florida permit 284, Figure 5), drilledstate waters south of 260 north latitude off the in the Marquesas Keys area in 1960, hadwest coast and south of 270 north latitude off the potential for low volume oil production from theeast coast; effective July 31, 1990, drilling was Lake Trafford and Sunniland Formationsprohibited in the remainder of Florida's territorial (Applegate and Lloyd, 1985).seas, i.e., north of 260 north latitude off Florida'swest coast to the western boundary of the statebordering Alabama and north of 270 north Policylatitude off Florida's east coast to the northernboundary of the state bordering Georgia (Section Former Florida Governor Bob Martinez377.242, Florida Statutes). negotiated with the federal government
concerning the current five-year (1987-1992)federal OCS Oil and Gas Leasing program
OFFSHORE - FEDERAL WATERS (Figure 3). His negotiations reflected his beliefActivity that "oil and gas activities must not be allowed at
the expense of our unique and sensitive
A total of 53 wells have been drilled in federal resources" (Governor Martinez, March 3,1987waters offshore Florida; 43 wells in the Eastern letter to Secretary of the Interior, Donald Hodel).waters offshore Florida; 43 wells in the Eastern
Planning Area, 3 in the Straits of Florida Planning w he the Sve-year oil and gas leasing planAa nr te M a , ad 7 was first proposed by the Secretary of theArea near the Marquesas Keys, and 7 in the Ir , Hd, Mr
South Atlantic Planning Area off northern Florida Interior, Donald Hodel, Governor Martinez
and southern Georgia (through February, 1989) expressed his concerns to both Secretary Hodeland to President Reagan. He requested that(Figure 5). This relatively small number of . q
offshore wells has not resulted in any sensitive areas off Apalachicola Bay in northwestdevelopment in Florida's offshore to date. Florida, Florida Bay and the Florida Keys bedevelopment in Florida's offshore to date. ro f th plan. I Ags19, the
removed from the plan. In August 1987, theHowever, two Destin Dome area wells (Amoco- removed. .. .p I AHowever, two Destin Dome area wells (Amoco- Governor filed a petition for judicial review in8338 and Chevron-6406, Figure 5) off Florida are federal court of the Department of the Interior'sSdiscoverie and a desfederal court of the Department of the Interior'sNorphlet discoveries and are described as fproducible fields by Gould (1989). five-year leasing plan because these areas were
producible fields by Gould (1989). y g aThe Amoco-8338 well, completed in Destin not removed (Press Release, Office of the
S. Governor, August 14, 1987).Dome block 111 in 1987, was the first Governor, August 14,1987).commercial discovery in the Eastern Gulf of In January 1988, Secretary HodelMexico Planning Area (Gould, 1989). The Oil and accompanied Governor Martinez on a snorkeling
75

Florida Geological Survey
P- 31 17,9t17,479 19831956
P-881 10526 %P y43 7,004 19617.009 14,338 19591947 1968
P-3834,710196 7
9N - P-38a
1967
P-304 •105631963
LEGEND
S APPROXIMATE WELL LOCATION
P -80 FLORIDA PERMIT NUMBER -
TOTAL DEPTH OF WELL, P-375 ----.0 FEET BELOW MSL oV-91o1967 __
19.59 WELL COMPLETION DATE Pe97 116060091961 P- 2e69 1 -
13,961 5"31960
SCALE
0 50 100 150 MILES
0 80 160 240 KILOMETERS P-eM 1.P-275 1599 .1t422 1955 ,
FOS02 0491 P-M P 1 19 09
1961 1M,793 1947 P-221962 15,432
1947
Figure 4. Oil exploration wells, Florida state waters.
76

Information Circular 107
trip to the Florida Keys. The Governor was able task forces to assess the environmental impactto show Secretary Hodel "exactly what it is that of proposed drilling in previously leased areas.we in Florida are fighting to protect." The One task force assessed the risk posed by oilfollowing March, the Secretary of the Interior spills and the directions spilled oil would beagreed to remove 11 million acres of sensitive carried by winds and currents. The second taskhabitat around Florida Bay and the Keys from force assessed the impact of drilling on marinefurther consideration for leasing under the five- and coastal resources (Press Release, Office ofyear plan (Figure 3). The Secretary further the Governor, June 16, 1988). President Georgeagreed to require a one-year study before any Bush established an additional federal task forcedrilling could take place in an area of "special to review drilling and leasing in this area. As aconcern" off northwest Florida (Figure 3). The result of this task force, President Bushstudy would verify that the exploration would be canceled, until after the year 2000, Gulf offor gas and not oil. The Department of the Mexico Sale 116, Part II, which covered thisInterior would also establish an emergency area. He also ordered the Minerals Managementresponse team to deal with possible accidents. Service to begin procedures to cancel the leasesAs a result of this agreement, the petition for that oil companies hold in this sale area andjudicial review of the five-year plan was dropped begin discussions with Florida on a joint federal-(Press Release, Office of the Governor, March state repurchase of the leases costing $100-24, 1988). $200 million (Oil and Gas Journal, 1990).
In May, 1988, the Governor requested that the The House Appropriations Committee voted infederal government delay exploratory drilling for June 1990 to delay lease sale 137 (scheduled foroil and gas off southwest Florida. The request November 1991), which includes the area fromspecifically referred to leases which were sold off Naples to Pensacola. Also in June 1990,southwest Florida during 1984 and 1985. The President Bush proposed a 12-year moratoriumleases are in an area south of Naples to just on drilling off the southwest coast near thenorth of the Dry Tortugas, Marquesas Islands, Florida Keys, but this was not supported by theand the Florida Keys (south of 260 north latitude, same House panel that delayed lease sale 137.Figure 3). Congress had required a three-year The panel said they did not want to lock up theenvironmental study before exploratory drilling area for that long a time.would be permitted in this area. A panel of Florida's current Governor Lawton Chiles hasscientists was assembled by Governor Martinez begun discussion with President George Bushto review the federal environmental study. The concerning the draft proposed 5-year OCS oilpanel concluded that the federal study was not and gas leasing program for mid-1992 throughextensive enough to ensure protection of mid-1997. The 5-year program includes oil andsensitive environmental resources. Specifically, gas lease sales off Florida's panhandle in 1994there was not enough information to determine and 1997. In a letter to the president datedthe potential effects of an oil spill. Subsequently, February 18, 1991, the governor stated that:the Governor supported and Congress imposed "The west Florida coast contains manya one-year drilling moratorium on the area south sensitive marine and coastal resourcesof 260 north latitude (Press Releases, Office of which are vital to our State's well-being. Thethe Governor, May 26, 1988, and June 16, economy of Florida is directly tied to these1988). resources through such industries as
In June 1988, Hodel agreed to remove 14 tourism and recreational and commercialmillion acres in the same area (south of 260 north fishing. We cannot afford to place theselatitude) from the November 1988 lease sale marine and coastal resources at(Figure 3). Martinez and Hodel appointed two unnecessary risk, simply because this
77

Florida Geological Survey
S PENSACOLA 6i
S - NSOUTH ATLANTICSCAE PLANNING AREA
o e S eFN DOtEAPA----LACHICOLA GAINESVILLE
38
Of itOD CANYON FLORIDA MIDODL GROUND TARPON SPRINGS
* 10tLOYD RIDGE
._ .. TH I
E.LB._ OW
_ *1 SAINT PETERSBURG
EASTERN GULF OF MEXICO , 21
1 21
PLANNING AREA
-VERNON BASIN CHARLOTTE HARBOR
EXPLANATIONHO LL HOOK " PULLEY RIDGE 1tMY ,5-XP-ANATION - ------ 2
* OIL. XPLORATIONWILL LOCAItONS
), MAP LOCATION CODEOt RANKIN * , .
HISTORic LEASIS \- DISTICT ARIAS
11111115 0"RKIG WASI• TORTUGAS
FS08040491 0 29 sO MUl \
4o io Kmomuns STRAITS OF FLORIDA
SCALE PLANNING AREA
Figure 5. Oil exploration wells, federal waters, offshore Florida. Well locations are plotted at the center
of their three-square mile lease block. If two or more wells have been drilled in the same
lease block, they are represented by the same location point and code on the map and In the
map location code and well data table.
78

Information Circular 107
MAP LOCATION CODES AND WELL DATA
LEASE NO.MAP OR FLORIDA PLUGGED & TOTAL
PLANNING LOCATION MAP BLOCK PERMIT WELL ABANDONED DEPTHAREA CODE AREA NUMBER NO. (P-) OPERATOR NO. (1) DATE (FT.)
EASTERN 1 Destin Dome 162 2486 Exxon 1 1974 10,930GULF OF 2 Destin Dome 118 2492 Exxon 1 1974 7,075MEXICO 3 Florida Middle Ground 252 2516 Texaco 1 1975 15,663PLANNING 4 Destin Dome 166 2490 Fina 1 1975 17,608AREA (2) 5 St. Petersburg 7 2527 SheLl 1 1975 18,443
1 Destin Dome 162 2486 Exxon 2 1975 10,4182 Destin Dome 118 2492 Exxon 2 1975 7,5076 St. Petersburg 100 2523 Texaco 1 1975 17,3887 Destin Dome 250 2472 Exxon 1 1975 6,6348 Destin Dome 207 2480 Exxon 1 1975 4,8001 Destin Dome 162 2486 Exxon 3 1975 17,9389 Destin Dome 360 2468 Gulf 1 1975 20,988
10 The ELbow 566 3344 Mobil 1 1977 15,86511 Destin Dome 617 2463 Chevron 1 1977 10,51312 Destin Dome 31 2502 Amoco 1 1977 18,33813 Destin Dome 529 3888 SheLl 1 1980 20,450.14 Charlotte Harbor 144 3906 Gulf 1 1981 11,36215 Charlotte Harbor 672 3917 Tenneco 1 1981 11,30216 Charlotte Harbor 265 3912 Shell 1 1981 12,36217 The Elbow 915 3341 Mobil 1 1981 18,12818 Vernon Basin 654 3903 Moblt 1 1981 10,76819 Charlotte Harbor 628 3915 Mobil 1 1981 1,27020 Pensacola 973 3886 Mobil 1 1981 23,26421 Charlotte Harbor 188 3909 Odeco 1 1981 11,36022 Destin Dome 563 3890 Sohio 1 1982 21,06823 Destin Dome 160 6417 Shell 1 TA 1985 7,76424 Pensacola 948 6391 Sohio 1 1985 18,95823 Destin Dome 160 6417 Shell 2 1985 16,95325 Gainseville 707 6456 Sohio 1 1985 15,94126 Deatin Dome 284 6428 Exxon 1 1985 17,50027 Destin Dome 422 6438 Chevron 1 1985 22,22228 DeSoto Canyon 512 6472 SheLl 1 1986 12,30029 Charlotte Harbor 622 4950 Shell 1 1986 10,55030 Florida Middle Ground 455 8363 Tenneco 1 1986 12,40124 Pensacola 948 6391 Tenneco 2 ST 1987 19,20031 Destin Dome 111 8338 Amoco 1 1987 19,24032 Destin Dome 56 6406 Chevron I TA 1988 22,57224 Pensacola 948 6391 Tenneco 2 TA 1988 19,20033 Pensacola 996 6396 Texaco 1 1988 17,91034 Destin Dome 1 6397 Gulfstar 1 TA 1989 2,00035 Destin Dome 2 6398 Gulfstar 2 TA 1989 1,80036 Pensacola 881 6390 Gulfstar I TA 1989 2,70037 Destin Dome 167 6420 Chevron I Drilling 17,259
SOUTH I NH 17-5 208 3686 Tenneco 1 1979 7,754ATLANTIC 2 NH 17-5 427 3695 Tenneco 1 1979 7,472PLANNING 3 NH 17-2 913 3664 Getty 1 1979 7,000AREA (3) 4 NH 17-2 1005 3671 Transco 1 1979 11,635
5 NH 17-5 472 3699 Exxon 1 1979 7,5786 NH 17-5 564 3705 Exxon 1 1980 12,8637 NH 17-5 387 Ocean GE-1 1977 13,254
Production
STRAITS OF 1 NG 17-10 44 P-296 Gulf 1 1961 4,686FLORIDA 2 NG 17-10 46 P-290 Gulf 1 1961 7,871PLANNING 3 NG 17-10 28 P-284 Gulf 1 1960 15,294AREA (3)
1. TA = Temporarily Abandoned; ST = Sidetrack Well.2. Data from Gould, 1989.3. Data from Karpas and Gould, 1990.
79

Florida Geological Survey
Nation continues its strong dependence on the only living coral reef in the conterminousfossil fuels and fails to implement a United States. This juxtaposition of potentialcomprehensive energy policy. Therefore, it petroleum resources and existing naturalis in the national, as well as the State's best resources has yielded strong state environmentalinterest to ban all oil and gas activities within policies. Florida's concerns influenced the federal100 miles of Florida's coast." 1987-1992 OCS oil and gas leasing program.The governor feels that a comprehensive, Florida's Governor Chiles has begun discussion
national energy policy is essential. Only within with the President which may influence the nextsuch a policy can the risks associated with 5-year OCS oil and gas leasing program as well.coastal oil and gas development be wiselyassessed. He concluded his letter to thepresident with:
"This Nation, with your leadership, shoulddevelop a strong national energy programwhich includes the development ofalternative energy sources, fuel efficiency,conservation and the rapid decrease in thedependency on fossil fuels. Without such aprogram, interest in oil and gas drillingoffshore Florida and the associated risks tothe resources of our State will remain; and Iwill continue to oppose short-sightedapproaches to such monumental and long-term problems."
SUMMARY
Florida petroleum regulations have evolvedfrom simple to the complex, from encouragementfor exploration to concern for economic and thenaesthetic value of Florida's other naturalresources. There were no laws regulating oil andgas activities before 1945. Early legislationresponded to the need for petroleum resourceconservation and to the need to protect theeconomic value of other resources. Laterlegislation responded to environmental concerns,especially due to development within the wetlandenvironments of south Florida.
Petroleum exploration eventually extended intoareas offshore from the panhandle andsouthwest Florida. Other natural and economicresources in these areas include commercial andrecreational fisheries, coastal and barrier islandenvironments, Florida Bay, the Florida Keys, and
80

Information Circular 107
REFERENCES
Applegate, A.V., and Lloyd, J. M., 1985, Summary of Florida petroleum production and exploration,onshore and offshore, through 1984, Florida Geological Survey, Information Circular no. 101, 69 p.
Babcock, C., 1964, Summary of Florida petroleum production and exploration in 1962, Florida GeologicalSurvey, Information Circular no. 45, 63 p.
, 1966, Florida petroleum exploration, production, and prospects, 1964, Florida GeologicalSurvey, Information Circular no. 49, 117 p.
, 1968, Oil and gas activities in Florida, 1966, Florida Geological Survey, Information Circularno. 55, 35 p.
____ 1972, Oil and gas activities in Florida, 1970, Florida Geological Survey, Information Circularno. 80, 82 p.
Big Cypress Area Management Task Force, 1984, Sensitive natural resources of the Big Cypress Area ofCritical State Concern, a report to the governor and members of the cabinet, February 21, 1984, 69 p.
Elliot, F. C., 1945, Minutes of the Trustees of the Internal Improvement Fund, State of Florida, July 11,1944, vol. 24, p. 732-733.
Fields, D. W., 1959, A legal history of conservation of oil and gas in Florida, unpublished report, FloridaGeological Survey Petroleum PAM file, 34 p.
Gould, G. J., 1989, Gulf of Mexico update: May 1988 - July 1989, Outer Continental Shelf oil and gasactivities, U.S. Department of the Interior Minerals Management Service: OCS Information Report,MMS 89-0079, 51 p.
Gunter, H., 1949, Exploration for oil and gas in Florida, Florida Geological Survey, Information Circularno. 1, 106 p.
_, 1950, Exploration for oil and gas in Florida, Florida Geological Survey, 1949 Supplement toInformation Circular no. 1, 38 p.
, 1955, Exploration for oil and gas in Florida, Florida Geological Survey, 1954 Supplement toInformation Circular no. 1, 35 p.
, 1956, Exploration for oil and gas in Florida, Florida Geological Survey, 1955 Supplement toInformation Circular no. 1, 31 p.
Johnson, P. G., and Tucker, D. L., 1987, The federal Outer Continental Shelf oil and gas leasingprogram; a Florida perspective: February, 1987: Office of the Governor, Office of Planning andBudgeting, Intergovernmental Coordination Unit, 16 p.
81

Florida Geological Survey
Karpas, R. M., and Gould, G. J., 1990, Atlantic update: July 1986-June 1990, Outer Continental Shelf oiland gas activities, U.S. Department of the Interior Minerals Management Service: OCS InformationReport, MMS 90-0060, 57 p.
Oil and Gas Journal, 1972, Jay field development tied to ecology, Oil and Gas Journal, February 14,1972, p. 58-59.
, 1989, Norphlet gas find indicated off Pensacola, Oil and Gas Journal, February 6, 1989,p. 18.
, 1990, Bush orders cancellation of eight controversial offshore lease sales, Oil and GasJournal, July 2, 1990, p. 26-27.
82

Information Circular 107
PART III
PETROLOGY AND PROVENANCE OF THENORPHLET FORMATIONPANHANDLE, FLORIDA
ByGreg W. Scott
83

Florida Geological Survey
84

CONTENTS
Page
Abstract.................................................................................................................................................. 87Acknowledgm ents.................................................................................................................................. 87Introduction ............................................................................................................................................ 89Norphlet Form ation of Panhandle Florida .......................................................................................... 89
Denkm an M em ber ............................................................................................................................. 97Fram ework G rains......................................................................................................................... 97M atrix and Cem ents...................................................................................................................... 103
Red Bed Lithofacies .......................................................................................................................... 103Fram ework Grains......................................................................................................................... 107Cem ents...........................................................:............................................................................ 109
Conglom eratic Lithofacies ........................................................................................................... 109Provenance of Norphlet Sedim ents .................................................................................................... 113Conclusions ........................................................................................................................................... 118References ............................................................................................................................................. 119
ILLUSTRATIONS
Figure Page
1. Area of study and location of core, chip,and log data ................................................................ 90
2. Stratigraphic column, of Mesozoic and older units of the North Central Gulf Coast .................. 95
3. Tectonic m ap of South Central G ulf Coast................................................................................. 96
4. Isopach m ap, Norphlet Form ation, panhandle Florida ............................................................... 98
5. Monocrystalline quartz grain, exhibiting subrounded shape and hematite coating.................... 100
6. Potassium feldspar overgrowth on m icrocline............................................................................ 101
7. Dissolution of feldspars .............................................................................................................. 102
8. Low-rank m etam orphic rock fragm ent........................................................................................ 104
9. Volcanic rock fragm ent ............................................................................................................ 105
10. High-rank m etam orphic rock fragm ent ....................................................................................... 106
11. Induction log and spontaneous potential curve illustrating serrate patternassociated with red beds............................................................................................................ 108
85

Florida Geological Survey
12. Volcanic rock fragment............................................................................................................ 110
13. Scanning electron micrograph of secondary quartz overgrowths and clay coatings.................. 111
14. Scanning electron micrograph of chloritic clay coatings............................................................. 112
15. Norphlet Formation-Werner Anhydrite ....................................................................................... 114
16. North-south stratigraphic cross section, Panhandle, Florida...................................................... 116
17. West-east stratigraphic cross section, Panhandle, Florida ........................................................ 117
TABLES
Table Page
1. Well names, locations, and permit numbers for all wells used in this study ............................... 91
86

ABSTRACT
The Norphlet Formation of the Florida Panhandle is primarily a sandstone that underlies theSmackover Formation and overlies the Louann and Werner Formations. Three lithofacies of Norphletstrata have been identified in the Florida Panhandle: an updip conglomerate, red beds, and an upperquartzose sandstone (Denkman Member).
The Denkman Member consists of an upper gray and a lower brown to reddish-brown quartzosesandstone. Generally, these sandstones are fine- to medium-grained and well sorted with rounded tosubrounded grains. The upper Denkman is massively bedded to faintly horizontally or wavy laminated;the lower Denkman is either horizontally laminated or has low to high-angle cross- stratification. Theaverage composition of the member is 62 percent quartz, 26 percent feldspar, and 12 percent rockfragments.
The red bed lithofacies has fine- to coarse-grained, moderately sorted sandstones with subrounded torounded grains. The most distinctive feature of the lithofacies is its closely spaced horizontal to slightlyinclined (10 - 50) laminae. The average composition of the facies is 35 percent quartz, 16 percentfeldspar, and 49 percent rock fragments.
The conglomeratic lithofacies is a multilayered section of gray conglomerates and red, coarse-grainedsandstones. The conglomerate consists of poorly sorted, subangular to subrounded, cobble- to pebble-size plutonic and metamorphic rock fragments.
Principal source areas for Norphlet sediments in the Florida Panhandle were the basement rock of theConecuh Ridge (Talledega Slate Belt) to the north and the Pensacola Arch (Piedmont Belt) to the southand east. Additionally, contributions from the Eagle Mills, Werner, and Louann Formations probably weresignificant.
ACKNOWLEDGMENTS
This study was originally completed in 1986 as part of the author's master's degree requirements atNortheast Louisiana University. Thanks to Jacqueline M. Lloyd and the Florida Geological Survey forencouragement and editing of the manuscript. Financial support for the project was provided by theSociety of Economic Paleontologists and Mineralogists and Geraghty & Miller, Inc. I express my sinceregratitude to Leonard M. Young, Professor, Department of Geosciences, Northeast Louisiana University,for his professional guidance, constructive criticism, and encouragement in pursuing this project. Thanksto Frank H. Guinn for his editing expertise. Finally, thanks to Sally Easterwood and Geeta Modha, fordrafting support and Alice Wingerter, Carol Ratcliff, Ileana Kiefer, and Shelly Hargrave of Geraghty &Miller for word processing and document preparation.
87

Florida Geological Survey
88

Information Circular 107
PETROLOGY AND PROVENANCE OF THE NORPHLET FORMATION,PANHANDLE, FLORIDA
ByGreg W. Scott
INTRODUCTION sandstones (Tyrrell, 1973). Core materialavailable for this study is concentrated within this
Several authors have published data on the quartzose lithofacies because the member liespetrologic character of the Upper Jurassic just below the more productive SmackoverNorphlet Formation in Mississippi and Alabama Formation and therefore is more frequently cored
(Hartman, 1968; Badon, 1975; McBride, 1981; than other lithofacies.
Mancini et al, 1984). This study is primarily The Pensacola Arch trends southwest throughconfined to areas of Norphlet deposition Okaloosa County and across southern Santa
previously undocumented, namely Escambia, Rosa and Escambia Counties (Figure 3).Santa Rosa, and Okaloosa Counties, Florida Placement of the arch this far west is based upon
(Figure 1, Table 1). Throughout panhandle the overall subsurface trend of structural features
Florida, the Norphlet Formation is encountered at and stratigraphic sequences and geophysical
depths usually greater than 13,000 feet below well logs interpreted for this project. It is against
mean sea level. The formation underlies most of this arch that the relatively clean sandstones of
the study area except eastern-most Okaloosa the Denkman Member thin and grade into
County, where it wedges out. The Norphlet medium- to coarse-grained and gravelly
unconformably overlies the Louann, Werner, or sandstones.
Eagle Mills Formations (Oxley et al, 1967; In southern Santa Rosa County, the formation
Mancini et al, 1984). Lying above the Norphlet is represented by a 14.6-foot section of
Formation sandstones and making an abrupt conglomerates and coarse grained sandstones
lithologic break are carbonates of the Smackover (Getty Oil Company, Florida permit 1097),
Formation (Sigsby, 1976) (Figure 2). interpreted to lie on top of or adjacent to the
Most of panhandle Florida is located within the Pensacola Arch. The conglomeratic sands
Conecuh Embayment which, in turn, is situated contain granule- to cobble-sized igneous and
within the Alabama Interior Salt Basin. The metamorphic clasts. Mancini et al, (1985)
Conecuh Embayment, as defined by Sigsby identified chert, granite, rhyolite, quartzite, and
(1976), lies between the pre-Jurassic Conecuh shale pebbles within this conglomerate
Ridge to the north and the Pensacola Arch to the lithofacies in southern Alabama.
southeast, both of which probably served as In western Okaloosa County (Champlin
source areas for Norphlet sediments (Figure 3). Petroleum Company well, Florida permit 518),the Norphlet Formation is characterized bycoarse, red, lithic sandstones (red beds), which
NORPHLET FORMATION OF probably represent a transition from the
PANHANDLE FLORIDA conglomerate deposits over the Pensacola Arch.The formation thins dramatically east of this welland wedges out completely within approximately
The Norphlet Formation varies considerably in 16 miles. In southern Santa Rosa County, thelithologic character across pananndle Florida. In Norphlet Formation represented within the Belcocentral Escambia and Santa Rosa Counties, the Petroleum Corporation well core (Florida permitupper Norphlet Denkman Member (informally 692) exhibits a red bed lithofacies at its base.subdivided into upper and lower units) is A discontinuous basal shale sequence hascharacterized by relatively clean, light-colored been identified within Norphlet cored sections in
89
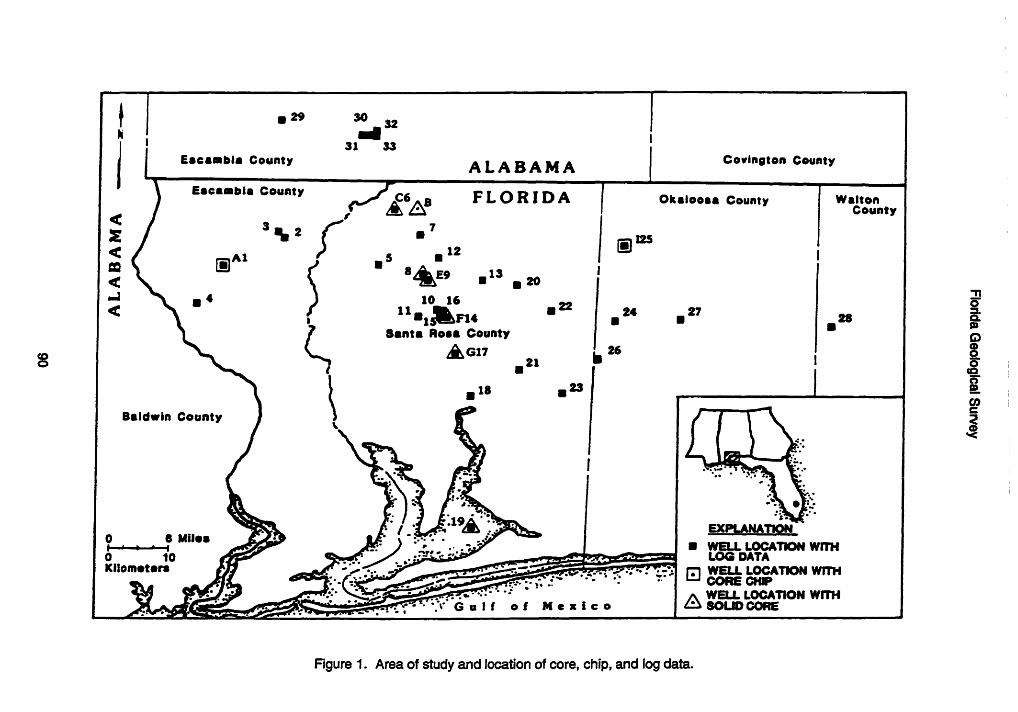
31 33Eacambla County ALABAMA Covington County
Escambla County 6.A FLORIDA Okaloosa County Walton
m 9 * E9 *13
0 e 101 .. 16 22S11 4 3 24 27Santa Rosa County
&G17 26
21 a0
w18 a23
Baldwin County
CL / ". ^A .. a EXPLANATION0 A Miles * *f- '. . **
0.: E' Mie WELL LOCATION WITH0 10 .. *p .g -LOG DATAKilomet*r -. .. . WELL LOCATION WITH,E. ..- -. COE CHIP
SWE -L " W LOCATION WITH. .". G ul f of Me x ic o SOLID CORE
Figure 1. Area of study and location of core, chip, and log data.

Information Circular 107
Table 1. Well Names, Locations, and PermitNumbers for all Wells Used in this Study (1 )
Florida CoreState Interval (2)
Well/Name/Location Permit Data ft blkb
Escambia County, Florida
A. 1. Shell Oil Company 647 Core Chip, 17132 - 17331No. 1 Schneider LogSection 18, T4N, R32W
2. Stone Petroleum Corporation 1125 Log NoneNo. 1 St. Regis Paper Co. 29-4
3. Stone Petroleum Corporation 1136 Log NoneSt. Regis Paper Co. 29-3Section 29, T3N, R33W
4. Chevron USA, Inc. 1027 Log NoneNo. 1 Lafloresta 2-1Section 2, T3N, R33W
Santa Rosa County, Florida
B. Smackco Ltd. 1096 Solid Core, 15220 - 15257No. 13-4 L.W. Roberts] LogSection 13, T5N, R29W
5. Miami Oil Products, Inc., 497 Log NonePennzoil United Inc., andSignal Oil & Gas CompanyNo. 1 Ethel Shivers, et alSection 7, T4N, R29N
C. 6. Exxon Corporation 1004 Solid Core, 15766 - 15787Martha Murphy, 10-6 LogSection 10, T5N, R29W
7. Southeastern Exploration, Ltd., 476 Log NoneRudman Resources and Co.,No. 1 St. Regis Paper CompanySection 28, T5N, R29W
D. 8. Exxon Corporation 1080 Solid Core, 16100 - 16153.5St. Regis Paper Company 13-S LogSection 13, T4N, R29W
91

Florida Geological Survey
Table 1. (Continued)
Florida CoreState Interval (2 )
Well/Name/Location Permit Data ft blkb
8. 9. Exxon Corporation 1110 Solid Core, 16098 - 16125St. Regis Paper Company 24-5 LogSection 24, T4N, R29W
10. Conoco, Inc. 1123 Log NoneNo. 1 Charlie Windhorst 12-3Section 12, T3N, R29W
11. C & K Petroleum and 657 Log NoneFlorida Gas Exploration Co.No. I I.L. Ward 6-2Section 6, T3N, R28W
12. Pranks Petroleum, Inc. 1045 Log NoneNo. I Donald BoutwellSection 7, T4N, R28W
11. Samedan Oil Corporation 929 Log NoneNo. I W.S. RosascoSection 24, T4N, R28W
r. 14. Jenkins Oil & Gas, Inc. 1128 Solid Core, 16596 - 16619No. I Haynes 8-1 LogSection 8, T3N, R28W
15. Jenkins Oil & Gas, Inc. 1148 Log NoneNo. 1 Jenkins-Lee 8-2Section 8, T3N, R28W
16. Spooner Petroleum Co. 1178 Log NoneNo. I Champion International5-4 Section 5, T3N, R28W
G. 17 Mesa Petroleum Company 551 Solid Core, 16806 - 16879
Rolin D. Davis LogT.R. Miller Mill 33-1Section 33, T3N, R28W
18. Belco Petroleum Corporation 692 Log NoneNo. 1 W.S. Mitchum Unit 23-4Section 23, T2N, R28W
H. 19 Getty Oil Company 1097 Solid Core, 17657 - 17749Florida State Lease 2338 LogEast Bay Location
92

Information Circular 107
Table 1. (Continued)
Florida CoreState Interval (2)
Well/Name/Location Permit Data ft blkb
20. Tenneco Oil Company 1114 Log None16-4 USA-FL State Lease 3128-FSection 16, T4N, R27W
21. Conoco, Inc. 610 Log NoneNo. 1 Estes Timber CompanyUnit 11-2 Section 11, T2NR27W
22. Pennzoil Production Company 911 Log NoneNo. 1 USA State Forest, No 5-2Section 5, T3N, R26W
23. Phillips Petroleum Company 534 Log NoneNo. 1 St. Regis Paper Company"B" Section 21, T2N, R26W
Okaloosa County, Florida
24. Cabot Corporation 731 Log NoneNo. 1-9 USASection 9, T3N, R25W
I. 25 Champlin Petroleum Company 518 Core Chip, 14549No. 1 USA & State of Florida LogSection 28, T5N, R25W
26. Tenneco Oil Company 1105 Log NoneUSA-FL State Lease 3229Unit 31-3 Section 31, T3N,R25W
27. Sonat Exploration Company 590 Log NoneNo. 1 James G. Moore Unit 3-11Section 3, T3N, R24W
28. Coastal Production Company 519 Log NoneNo. 1 Brady BelcherSection 9, T3N, R21W
93

Florida Geological Survey
Table 1. (Continued)
Florida CoreState Interval (2)
Well/Name/Location Permit Data ft blkb
AlabamaState
Escambia County, Alabama Permit
29. Hughes Eastern Petroleum, Ltd. 4299 Log NoneNo. I A.T.I.C. 33-2Section 33, T2N, R7E
JO. Inexco Oil Company 3895 Log NoneNo. I Cogel 1-8Section 1, TIN, R8E
31. Inexco Oil Company 4060 Log NoneNo. I Tocumen et al Unit 1-3Section 1, TIN, R8B
32. Pruet & Hughes Company 1902 Log NoneSt. Regis Paper Co. Unit 6-3No. I Section 6, TIN, R9E
33. Inexco Oil Company 4347 Log NoneNo. I Steward Estates 6-5Section 6, TIN, R9E
Notes: (1) - Refer to Figure 1.(2) - To convert feet to meters: ft x 0.3048 * metersA-I - Refers to wells whether either solid core or core chips were analyzed.1-33 - Refers to wells of which geophysical well logs were analyzed.None - No core or chip material was analyzed.ft blkb - Feet below kelly bushing.Log - Geophysical well log.Solid Core - Solid core material.Core Chip - Solid core chip material.
94

Information Circular 107
GROUP GENERALIZED
ERA SYSTEM SERIES STAGE FORMATION LITHOLOGYMEMBER
Tithonian Cotton Valley Gp . . .'
Haynesvllle Fmo Upper Kimmeridgan - - -
- ei lnBuckner Mbr
Smackover Fm IO <-
0 Denkman MbrN Oxfordian - - - - --
• N Norphleit Fm ]:M l
CO Pine Hill Mbr
Louann Fm .: flMiddle Callovian
Werner Fm
Rhaetian
acl Upper Norlan Eagle Mills Fm '
Karn an so
I-+ + + +++ + . ++ +,
0o +O - Underlying Basement Rock + + +
Figure 2. Stratigraphic column, of Mesozoic and older units of the North Central Gulf Coast.
95

Florida Geological Survey
Louann InlandDepositiona Limit Valley ft Ridge Blue Ridge
Werner Inland 0 Province . . Provinoe* ODepositional Limit * * ,* /*
.• *** " .'
G uf' .'M Manila 0' x; Embayment * *
s is i pPeriphera* .* " . . * .* * *
Sl Conecuh Embayment
" "0.*". ..
S 20 40 KILOMETER
Gulf of Mexico
0 32 84 MILES
0 20 40 KILOMETER
Figure 3. Tectonic map of South Central Gulf Coast.
96

Information Circular 107
southern Escambia County, Alabama (Hughes overlying quartzose sandstone of the upperEastern, Alabama permit 4299). Portions of the Denkman member. The upper and lowershale sequence most likely occur in parts of Denkman cannot be distinguished from oneFlorida as well. However, due to the limited another by geophysical log characteristics, duescope of this project, a thorough study of the to gross lithologic and sedimentary similaritiesshale lithofacies was not undertaken. (Wilkerson, 1981). However, the two units can
The most complete section of Norphlet readily be distinguished in hand specimensexamined for this study is found in the core from where color and sedimentary characteristicsthe Mesa Petroleum well (Florida permit 551) differ. Generally, the Denkman Member is light-where 73 feet of continuous Norphlet strata were to medium-gray in color at the top and becomesexamined. The core contains the entire Denkman brown at depth.Member and a portion of the underlying red bed Overall, the upper Denkman is slightly coarser-sequence. With the exception of a slight grained than the lower Denkman. However, theincrease in volcanic rock fragments with depth, average grain size (0.21 mm) of the Denkmanthe core does not show much vertical variation in Member is finer than the red bed lithofacies.composition. The core consists of interbedded Framework packing densities average 79.0fine- to medium-grained sandstones in which the percent. This value indicates a relatively highbedding dips range from horizontal to 5°, with 10 framework packing density for panhandle Florida.to 40 dips common. Honda (1981) reported an average packing
At the top of the Mesa core (-16806.5 feet density of 81.3 percent from the Hatters Pondbelow kelly bushing (ft blkb)) is an interval of 7.8 Area, Alabama, an abnormally high value.feet of light-gray, massively bedded, and well- Extensive pressure solution and graincemented sandstone (upper Denkman). Below rearrangement characterize this high packingthe upper Denkman, the unit changes to a light- density in Alabama (Honda, 1981), but are notbrown sandstone (lower Denkman) with widely found extensively in Florida sediments.spaced, wavy to slightly inclined (10 to 50) The Denkman Member of panhandle Florida islaminae. At approximately -16837 ft bikb, the a lithic arkose (Folk, 1980). The averageDenkman grades into red beds. composition of framework grains is 61.5 percent
An isopach map across panhandle Florida quartz, 26.3 percent feldspar, and 12.2 percentshows the variable thicknesses of the formation rock fragments. This average composition differs(Figure 4). The average thickness of the unit in slightly from that cited in other studies of thepanhandle Florida is 122.9 feet. However, this region, presumably because all samples used infigure may be misleading since most completely this study are closer to their source areas andpenetrated Norphlet sections are believed to lie thus richer in feldspars and lithic grains.on structural highs (J. Files, Inexco Oil Company,1986, personal communication). The ChamplinPetroleum well (Florida permit 518) exhibits a FRAMEWORK GRAINSthick section of Norphlet of 410 feet, asdetermined by geophysical log data, whereas the Quartz is the most abundant detrital mineral in
Getty Petroleum Company well (Florida permit the Denkman Member. Quartz content1097) exhibits an abnormally thin section of only throughout the Denkman Member ranges from
14.6 feet. 50.5 percent to 75.2 percent, averaging 61.7percent of framework grains. The most commonquartz type present, making up 47.5 percent of
Denkman Memberthe total quartz population, is monocrystalline
In all cores examined, the Smackover-Norphlet quartz with little to no undulatory extinction
contact is relatively sharp, with dense dolomite (Figure 5). Some of these grains have mineral
97

a ( I• 29 30
Escambba ount ovAngon county
Escambia County OtSn WaltonFL' IDA OkLoos 'ounty Walton
aCounty
%9 3
4 FER TO TABLE 1 FOR WEL
SSanta NUMBER AND LOCATINounty
Baldwin County
: WELL LOCATION WITH
REFER TO TABLE I FOR WELLNUMBER AND LOCATIONINFORMATION
.. . .""" "" G u I f of Me x ic o CONTOUR INTERVAL= 50 FT.
Figure 4. Isopach map, Norphiet Formation, panhandle Florida.

Information Circular 107
Inclusions and small vacuole trains which Overgrowths are common on both potassiumsuggest a plutonic origin, whereas others exhibit and plagloclase feldspars.abundant vacuoles and have vermicular Feldspar grains have been subjected to ainclusions of chlorite suggesting a hydrothermal variety of weathering processes, with manyorigin (Folk, 1980). showing signs of multiple processes. Most
The second most abundant quartz type appear to be related to dissolution andpresent is monocrystalline, undulose quartz, replacement of grains (Figure 7). The mostmaking up 42.8 percent of the total, followed by common form of weathering is vacuolization, ofsemi-composite, 5.6 percent, and fully-composite which the magnitude ranges from slight tograins, 3.6 percent. Semi-composite grains are extreme. About 45.0 percent of all feldsparscomposed of two or more suborystals having show some sign of vacuolization. The authorvery close optical orientation with a distinct break makes a distinction between degrees ofbetween subcrystals; however, the extinction weathering. In the case of "slight" vacuolization,shadow is not observed to sweep smoothly weathered grains appear cloudy due to pin-pointacross the grain during petrographic analysis. dissolution. Severely weathered grains on theFully-composite grains have two or more other hand, are seen as partially or totallysubcrystals with strongly undulose extinction and dissolved grains and make up about 8.0 percentdistinct crenulate boundaries (Young, 1976; Folk, of the total feldspar population. A few grains,1980). Semi-composite grains are more generally less than 2.0 percent of the totalnumerous than fully-composite grains in all core feldspar population, appear unaltered.material examined, except the Shell Oil Other forms of feldspar alteration wereCompany core (Florida permit 647) where a observed, but all were secondary to vacuolizationslight reversal in frequency occurs. Small, in frequency of occurrence. Limonitization wasneedle-like inclusions of rutile are seen in all the next most abundant form observed in alltypes of quartz. samples followed by phyllosilicate replacement.
Most of the quartz grains examined in this The dominant form of phyllosilicate replacementstudy are subrounded to rounded. Additionally, is chloritization, but kaolinitization and illitizationmany grains have overgrowths, some being also occur. In the Smackco Ltd. well (Floridaabraded Indicating recycling, permit 1096), considerable chloritization of
The second most abundant detrital mineral of feldspars is present of which the magnitudethe Denkman Member is feldspar, which ranges appears to increase with depth. Dolomitization offrom 15.9 percent to 46.5 percent and averages feldspars was the next most often observed form26.3 percent throughout the study area. of feldspar weathering followed by calcitization,Potassium feldspars (orthoclase and minor anhydritization, and pyritization.amounts of microcline) are the most abundant, Rock fragments within the Denkman rangeranging from 55.0 percent to 100 percent and from 3.0 percent to 26.0 percent, averaging 12.2averaging 87 percent of the feldspar fraction percent. Metamorphic rock fragments (MRFs)(Figure 6). Plagioclase feldspar ranges from 0 are the most abundant averaging 80.0 percent ofpercent to 32.0 percent, averaging 13.0 percent the total rock fragment population. The nextof the total feldspar population. In order of abundant fragments are volcanic rock fragmentsdecreasing abundance, the feldspars are (VRFs), 15.0 percent, followed by sedimentaryorthoclase, plagioclase, and microcline, with rock fragments (SRFs) at 5.0 percent.untwinned orthoclase making up the largest An aphanitic grain type of varying compositionfraction. Most grains appear similar to quartz in and texture is the most abundant rock fragmentsize and rounding. Many feldspars are present (Figure 8). Initially, some difficultysericitized, possess mineral inclusions, and have developed in identifying these grains because ofquartz intergrowths in graphic patterns, their resemblance to chert. The grains were
99

Florida Geological Survey
Figure 5. The most abundant detrital grains present within both the Denkman Member and red bedlithofacies are monocrystalline quartz grains (Q), which can exhibit a rounded to subroundedshape, hematite coatings (H) and secondary overgrowths (0). Crossed-nicols; upperDenkman Member; 16617.0 feet; Jenkins Oil & Gas Inc., No. 1 Haynes 8-1; Florida permit1128; Bar scale = 0.1 mm.
100

Information Circular 107
Figure 6. Potassium feldspar grain (microcline) (M) exhibiting authigenic overgrowth (0). Crossed-nicols; upper Denkman Member; 17297.0 feet; Shell Oil Company, Schneider No. 1; Floridapermit 647; Bar scale = 0.05 mm.
101

Florida Geological Survey
Figure 7. Dissolution of feldspars. (A) advanced stage of dissolution, all that remains is probableresidual clay skeleton and (B) central part remaining of grain dissolved from margin to center.Plane-polarized light; upper Denkman Member; 16121.0 feet; Exxon Corporation, St. RegisPaper Company, No. 13-S; Florida permit 1080; Bar scale = 0.1 mm.
102

Information Circular 107
grouped together as low-rank MRFs on the basis phyllosilicate cements follow in abundanceof their unifying characteristics. The grains consisting of pore-lining chlorite, illite, andusually appear dark-colored, resistant to kaolinite. Clay content increases with depth anddeformation, and silicified. A possible clue to is most abundant in the Smackco Ltd. welltheir origin is suggested by some of these grains (Florida permit 1096).possessing small, highly birefringent, phyllosi- Carbonate cement occurs most often at the toplicate inclusions and microlayers, which may of the section, just below the Smackover-suggest an originally argillaceous texture. Norphlet contact. Calcite occurs 15.0 percent ofAnother possible source is indicated by several the time as opposed to dolomite occurring 11.0grains examined from the Mesa Petroleum percent of the time. Locally, dolomite may beCompany core (Florida permit 551). Within the more abundant than calcite. Calcite is usuallyMesa core, many silicified VRFs closely seen as a pore-filling cement surroundingresemble some of the low-rank metamorphic framework grains. Calcite also occurs asgrains. This resemblance is increased where no poikilotopic patches where framework grainsphenocrysts appear within the VRFs (Figure 9). appear to float within the cement crystal.However, because of the pervasive alteration of Dolomite is usually seen as isolated ororiginal grain fabrics, the author prefers to group interlocked mosaics of euhedral rhombs.these aphanitic grains as low-rank MRFs. Anhydrite cement is minor throughout the
The second most abundant type of rock section and usually seen as poikilotopic massesfragment present is high-rank metamorphic which may form visible spots in the sandstone.grains with a fabric of stretched and sutured In at least one sample from the Smackco Ltd.quartz subcrystals separated by thin mica plates well, doubly terminated quartz crystals occur[Folk's (1980) schistose metamorphic] (Figure within an anhydrite nodule. Hematite and10). The remaining rock fragments (in pyrite are both minor constituents of the cementdecreasing order of abundance) are: VRFs, fraction, with hematite occurring as coatings onslate/phyllite, another type of high-rank some grains (Figure 10). Pyrite occurs as blebs,metamorphic rock fragment [Folk's (1980) euhedral crystals, and rosettas of probablestretched metamorphic], and traces of chert, replacement origin within many frameworkdolomite, and shale. grains. The presence of pyrite within tightly
cemented quartz sandstones suggests that sour
MATRIX AND CEMENTS gas (H2S-saturated gas) invaded the capillarypores of the sandstone, converting the hematite
As a whole, the Denkman Member of grain coatings to pyrite (McBride, 1981).panhandle Florida is virtually matrix-free exceptas observed in the Smackco Ltd. well core Red Bed Lithofacies(Florida permit 1096). X-ray diffraction data fromsamples of this core indicates that chlorite and The relatively clean sandstones of theillite comprise the majority of the matrix. Minor Denkman Member become reddish-brown withamounts of euhedral dolomite are also present depth and grade into underlying red beds. Thesewithin the matrix. red beds which include sandstones, siltstones,
Quartz overgrowths are the most abundant and shales, become the dominant Norphletcement type present within the Denkman. The lithology in parts of Alabama (Mancini et al,overgrowths can be subhedral to euhedral, 1985).multiple in occurrence, with some being abraded Two wells containing red bed lithofacies wereand recycled (Figure 5). examined for this study: the Champlin Petroleum
The second most abundant cement present is well (Florida permit 518) and the Mesafeldspar, occurring as overgrowths. Authigenic Petroleum Company well (Florida permit 551).
103

Florida Geological Survey
Figure 8. The most abundant rock fragments present within both the Denkman Member and red bedlithofacies are low-rank metamorphic grains (LR) possibly having several different origins.Crossed-nicols; upper Denkman Member; 16617.0 feet; Jenkins Oil & Gas Inc., Haynes 8-1;Florida permit 1128; Bar scale = 0.1 mm.
104

Information Circular 107
lithofacies; 15549.0 feet; Champlin Petroleum Company, USA & State of Florida, No. 1;Florida permit 518; Bar scale = 0.1 mm.
105105

Florida Geological Survey
Figure 10. High-rank metamorphic rock fragment (MRF) with a fabric of stretched and sutured quartzsubcrystals separated by thin mica plates. A euhedral pyrite crystal (P) appears in the centerof the grain. Crossed-nicols; lower Denkman Member; 16145.5 feet; Exxon Corporation,Martha Murphy 10-6; Florida permit 1004; Bar scale = 0.1 mm.
106

Information Circular 107
The Champlin Petroleum well (Florida permit sizes. The coarse layers contain more rounded518) is located in extreme northwest Okaloosa grains and more feldspars and rock fragmentsCounty. This well lies adjacent to the Pensacola than the finer-sized layers.Arch, which accounts for the coarser and more Framework packing densities of the red bedlithic nature of its red beds. Fourteen and one- lithofacies average 81.4 percent. Packinghalf feet of Norphlet material were cored within densities within the red bed lithofacies werethis well (-14403.6 to -14481.3 ft blkb), of which found to be higher than those within theonly the upper three feet were recovered. From quartzose lithofacies (79.0 percent average).this three-foot interval, a single chip of red, Red bed packing densities are very similar tocoarse-grained sandstone was analyzed for this Norphlet packing densities reported from theproject. This would place the sample Hatters Pond Area, Alabama (81.4 percentapproximately 4.9 feet below the Smackover- average (Honda, 1981)). However, grainNorphlet contact as determined by geophysical rearrangement and extensive pressure solutionlogs. This stratigraphic relationship would reported by Honda (1981) for the Hatters Pondeffectively limit the Denkman Member to the Area do not occur extensively within the red bedoverlying 4.9 feet interval, if present at all. A lithofacies in panhandle Florida.geophysical well log from Champlin Petroleum The red bed lithofacies is a feldspathicCorporation well (Florida permit 518) shows a litharenite (Folk, 1980). The averageserrated spontaneous potential (SP) pattern composition of framework grains is 61.3 percent(Figure 11) believed to be representative of the quartz, 23.1 percent rock fragments, and 15.6red bed lithofacies (Wilkerson, 1981). In the percent feldspars.author's opinion, the Norphlet section within thiswell is comprised almost entirely of red bedsperhaps formed by stacking of wadi-type FRAMEWORK GRAINSdeposits on the flanks of the Pensacola Arch(Mancini et al, 1985). If the sequence in this well The most abundant detrital grain found in theis typical of the Norphlet, a conglomeratic red bed lithofacies is quartz. Quartz contentlithofacies may be expected in the lower part of averages 61.3 percent of framework grains. Thisthis well. However, at the present time, the value is similar to those from Denkman samples,author is not able to recognize a conglomeratic thus reflecting the consistent lithology of thelithofacies from the geophysical log data. formation. In a sample from the Champlin well
The Mesa Petroleum Company well is located (Florida permit 518), rock fragments are morein south-central Santa Rosa County, farther out abundant than quartz, possibly due to the relativein the Conecuh Embayment than the Champlin closeness of the sample to its source areas. Thewell. Within this well, the transition from most common quartz type present, making up toDenkman to red beds is subtle and cannot be 48.0 percent of the total quartz population, isidentified on geophysical logs. The lower portion monocrystalline quartz with little to no undulatoryof the core from this well exhibits a red bed extinction. Approximately 16.0 percent of allsection approximately 33-feet thick. The red bed quartz grains contain mineral inclusions and/orportion of the core consists of a red, poorly- to small vacuole trains, suggesting a plutonic originmoderately well-sorted, fine- to medium-grained (Folk, 1980).sandstone with subrounded to subangular grains. The second most abundant quartz type isThe most distinctive feature of this lithofacies is monocrystalline, undulose quartz, making upthe closely spaced horizontal to slightly inclined 44.5 percent of the total quartz fraction. Semi-(1° to 5°) laminae. These laminae are composed composite quartz grains average 5.6 percent,of alternating fine and medium- to coarse- grain while fully-composite quartz grains average 2.0
107

Florida Geological Survey
4400
W*1k% Induction Log, Deep
SpontaneouePotential Curve Ia(Serrate Trace) •
14800
M Ft
Champlin Petroleum Company, No. 1 .- 0
Seao 28 TSN R28W . 2Santa Ross County, Florida 10
20 76
0- 100
Figure 11. Induction log and spontaneous potential curve illustrating serrate pattern associated with redbeds.
108

Information Circular 107
percent of all quartz examined. The quartz pyritization. Approximately 18.0 percent of allgrains of the red bed lithofacies are very similar feldspars show no signs of alteration. However,to those seen in the Denkman Member. numerous grains show seritization, mineral
The second most abundant detrital framework inclusions, and quartz intergrowths.grainr of the red bed lithofacies are rockfragments. Their abundance is the majordifference between red bed and quartzose CEMENTSlithofacies. Rock fragments average 23.1percent of all framework grains within this The most abundant type of cement present islithofacies. Metamorphic rock fragments are the quartz overgrowths (Figures 4 and 13).most abundant of these, averaging 74.2 percent Phyllosilicate grain coatings are the second mostof the total rock fragment population. Like those common cement type seen in the red bedin Denkman Member samples, these MRFs lithology (Figure 14). Chlorite, illite, and kaolinitemostly consist of the same low-rank were all identified by x-ray diffraction. Scanningmetamorphic grains of various compositions and electron microscopy shows that an irregular,microtextures. Similarities do exist between platy, chlorite rim cement dominates. Insome silicified VRFs and SRFs and these decreasing order of abundance, feldspar, calcite,abundant low-rank MRFs; however, their anhydrite, and dolomite cements also occuralteration prevents any clear determination of an throughout the lithofacies.original volcanic or sedimentary texture for thesegrains.
Volcanic rock fragments are second only to Conglomeratic LithofaciesMRFs in abundance within the red bed lithofaciesand average 24.9 percent of all rock fragments. Wilkerson (1981) and Pepper (1982) identifiedThese VRFs show two types of texture: a dark, a conglomeratic lithofacies in several wells alongfine-grained matrix enclosing feldspar laths and a a conglomeratic litofacies in several wells alonmostly silicified grain with relict phenocrysts the updp lt of the Norphle Formation inFigures 9 andsouthern Alabama. Geophysical logs from the
Other than being coarser, feldspars of the red Getty Oil Company well (Florida permit 1097)
bed lithofacies are very similar in appearance, located in East (southern S ta Rosacomposition, and roundness to the feldspars of County) indicatea Norphlet section up to 14.6-the Denkman Member. Feldspars within the red feet thick probably lying on top of Werner and
bed lithofacies average 15.6 percent of all Eagle Mills sediments (Figure 15).framework grains. Potassium feldspars Approximately 7.9 feet of cored conglomeratic(untwinned orthoclase and minor amounts of (Norphlet Formation conglomeratic lithofacies)
microcline) are more abundant than plagioclase and anhydritic material (Werner Formation) from
feldspars, averaging 85.4 percent compared with theGetty well were examned or this project.The examined core consists of three feet of
15 percent of all feldspars in the red bed15 percent of all feldspars in the red bed conglomeratic material lying above a 4.9-feetlithofacies. Several lath clusters and individual cnglomerval of "dirty," whiterial lying above a 4.9-feetfeldspar laths were observed within the samples. thick inte. T he ontact between tedSuch clusterings probably are deformed and anhydriite. The contact between thedeteriorated VRFs. conglomerate and the anhydrite is gradational
Vacuolization is the dominant diagenetic over a one to twinch section The upperalteration affecting red bed feldspars. Norphlet part of the core, along with the
Chloritization, kaolinitization, and illitization are Norphlet-Smackover contact, is missing.the second most abundant diagenetic alterations, Geopetal infilling of cavities wthin the Wernerfollowed by hematization, anhydritization, and Formaton anhydrite by coarse-grained Norphlet
sediments can be seen in the Getty well core
109

Florida Geological Survey
Figure 12. Volcanic rock fragment (VRF) in the red bed lithofacies exhibiting a dark, fine-grained matrix(M) enclosing probable plagioclase phenocrysts (P). Plane-polarized light; red bed lithofacies;15549.0 feet; Champlin Petroleum Company, USA & State of Florida, No. 1; Florida permit518; Bar scale = 0.1 mm.
110

Information Circular 107
Figure 13. Scanning electron micrograph of red bed lithofacies pore, exhibiting euhedral quartz over-growths (Q) and chloritic clay coatings (C). Red bed lithofacies; 16847.5 feet; MesaPetroleum Company, T.R. Miller Mill Company, No. 1; Florida permit 551; Bar scale = 0.1 mm.
111

Florida Geological Survey
Figure 14. Scanning electron micrograph of red bed lithofacies exhibiting porosity reducing chloritic claycoats (C). Red bed lithofacies; 16847.5 feet; Mesa Petroleum Company, T.R. Miller MillCompany, No. 1; Florida permit 551; Bar scale = 0.1 mm.
112

Information Circular 107
(Figure 15). Geopetal infilling by Norphlet the same constituents are present throughout allsediments probably occurred after meteoric cores, including quartz, feldspars, andleaching of the then-exposed anhydrite. Finally, sedimentary, igneous, and metamorphic rockcalcite-saturated waters infiltrated the cavities fragments. The similarity in mineralogy in alland precipitated the calcite caps. lithofacies of the formation indicates that the
The preserved lower Norphlet portion of the source areas remained constant throughoutcore is an interlayered section of conglomeratic Norphlet deposition (Wilkerson, 1981).and coarse-grained sandstones. At the top of Walls (1985) used locations of samples whichthe core is a two-inch zone of coarse-grained had the highest amount of labile grains tosandstone overlying approximately three feet of indicate source areas of the Norphlet Formationconglomerate. The sandstones are red and the of southern Alabama. He noted that MRFsgrains are moderately sorted and subangular to dominate updip Alabama Norphlet sediments,subrounded. The conglomeratic material is dark but diminish to the south. The labile nature ofgray in color, poorly sorted, with angular to the fragments suggests that the nearby southernrounded grain shapes. Large rock fragments Appalachian uplands served as a source area forwithin the conglomerate consist of pebble- to these MRFs. Compositional variation maps,cobble-sized grains, some up to three inches constructed by Walls (1985), indicate aacross. These large rock fragments are dark southwesterly dispersal pattern for thesegreen, white, and dark gray, subangular to sediments. This direction would imply significantsubrounded, and appear to be plutonic and deposition of MRFs in the Manila Embayment,metamorphic in origin. Mancini et al, (1984) separated from panhandle Florida by theidentified pebbles of shale, chert, quartzite, Conecuh Ridge (Figure 3). Both the Manilagranite, and rhyolite in conglomerates from Embayment and the Conecuh Ridge probablyEscambia County, Alabama, farther to the north restricted much of this debris from panhandlethan these Florida conglomerates. Differences in Florida. Additionally, Walls (1985) noted acomposition between these Pensacola Arch significant compositional difference betweenconglomerates and their northern counterparts samples from northern counties and samplesare believed to be due to the proximity and type from Mobile, Escambia, and Conecuh Counties,of source materials available to each. Lying Alabama. Samples from the southern countiesdirectly below the three-foot zone of gray have a higher lithic content, higher feldsparconglomerate is another interval of coarse, red concentration, and appear to have accumulatedsandstone about one- to two-inches thick. Below from several directions, indicating at the verythis sand the lithology again changes to a 2.0- to least a southern source (Walls, 1985).2.5-inch thick conglomerate lying on a "dirty" Ottman et al, (1973) and Sigsby (1976)white, crystalline, coarse-grained, wavy- suggested that the Conecuh Ridge andlaminated anhydrite. Pensacola Arch were topographic highs during
much of Norphlet deposition, outlining theConecuh Embayment. All Norphlet sediments of
PROVENANCE OF NORPHLET SEDIMENTS panhandle Florida are located within this basin,which is bordered to the north by the Conecuh
Interpretation of petrographic and stratigraphic Ridge, to the east and south by the Pensacoladata can give a general indication of source Arch, and to the southwest by the Wiggins Arch.areas for Norphlet sediments. Mineral The Conecuh Ridge and Pensacola Arch
composition of Norphlet sediments varies probably served as source areas for Floridamoderately across panhandle Florida. Although Norphlet sediments (Sigsby, 1976). It is thecompositional differences do exist, essentially author's opinion that sediments derived from the
113

Florida Geological Survey
Figure 15. Norphlet Formation-Werner Formation contact exhibiting Norphlet conglomeratic lithofacies,red, coarse-grained sandstone (S), conglomerate (C), Werner anhydrite (A), and geopetalsediment infilling of cavities within the upper Werner Formation (G). 17739.9 feet; Getty OilCompany; Florida permit 1097, East Bay location.
114

Information Circular 107
Wiggins Arch probably did not contribute deposited in deep, relatively narrow troughs,significantly to deposits in Florida, primarily due bounded by steep faults and cut by volcanicto the downdip location of the arch. intrusives. The Conecuh Embayment apparently
Neathery and Thomas (1975; Figure 1) lies within one of these troughs (Woods andsuggested that basement rocks of panhandle Addington, 1973; Figure 3).Florida probably are southern extensions of the After initial deposition of continental-derivedSouthern Appalachian Piedmont Belt. Dominant Eagle Mills sediments within the trough, therock types of the Piedmont are mica schist, formation was subjected to an extended period ofgranite gneiss, and granite. Evidence for a subaerial weathering (Anderson, 1979).Pensacola Arch (Piedmont Belt) source for Following this weathering and subsequentNorphlet sediments in panhandle Florida is erosion of some of the Eagle Mills, deposition ofprovided by the presence of conglomeratic and Werner Formation sediments began with thesered bed lithofacies. Pebble- to cobble-size, beds eventually onlapping the paleo-Gulf Coastmatrix-supported conglomerates are similar to (Imlay, 1980). The Werner Formation covered allupdip Norphlet conglomerates observed in of the embayment and apparently much of thesouthern Alabama wells (Wilkerson, 1981; southern end of the Pensacola Arch. The authorPepper, 1982; Walls, 1985). The restricted updip believes that the Getty Oil Company well (Floridadistribution of these conglomerates apparently permit 1097) lies near the crest of the arch.reflects proximity to, as well as the composition Whether the Conecuh Ridge was completelyof, the Pensacola Arch. These conglomerates buried or not by the Werner Formation is unclear.are composed dominantly of plutonic and However, during Werner deposition, updip Eaglemetamorphic rock fragments. Mills sediments were probably still being shed
Southwestern Alabama red bed lithofacies and deposited from surrounding highlands. Thisprobably represent distal portions of can be interpreted from the cross-sections whichconglomeratic sequences (Mancini et al, 1984). shows Eagle Mills sediments capped by lowerThe locations of Florida red beds, which all lie Haynesville sediments, indicating exposure offurther out into the basin than the conglomerates, the Eagle Mills during much of the Jurassic.suggest a Pensacola Arch source for Norphlet Consequently, Eagle Mills sediments weresediments of panhandle Florida. Supporting probably incorporated into lower Wernerevidence for this claim is a pronounced fining of sediments (Figures 16 and 17).grain sizes within the quartzose and red bed Following Werner Formation deposition,lithofacies toward the center of the Conecuh deposition of the Louann Formation began withinEmbayment. the Conecuh Embayment. The Louann
Evidence for a Conecuh Ridge (Talledega Formation does not now lie as far inland as theSlate Belt) source is less dramatic (Neathery and Werner Formation, apparently due to post-Thomas, 1975; Figure 1). However, higher depositional dissolution and erosion of the saltfeldspar and sedimentary rock fragment during Norphlet deposition. Perhaps the Louannconcentrations in samples from wells located in originally did overlap the Werner, but it has sincenorthern Santa Rosa County may indicate that been eroded back to a more basinward positionthe Conecuh Ridge was a supplier of sediments (Anderson, 1979).to panhandle Florida. Following the retreat of the Louann Sea from
Sediments that originated from the Eagle Mills, the Conecuh Embayment, stream gradients wereWerner, and Louann Formations also are again increased to the point where continentalindicated by stratigraphic location and erosion could take place (Pepper, 1982). It wascomposition (Figures 16 and 17). Scott et al, during this time that Norphlet deposition began.(1961) believed the Eagle Mills was initially Norphlet sediments thus began burying Louann
115
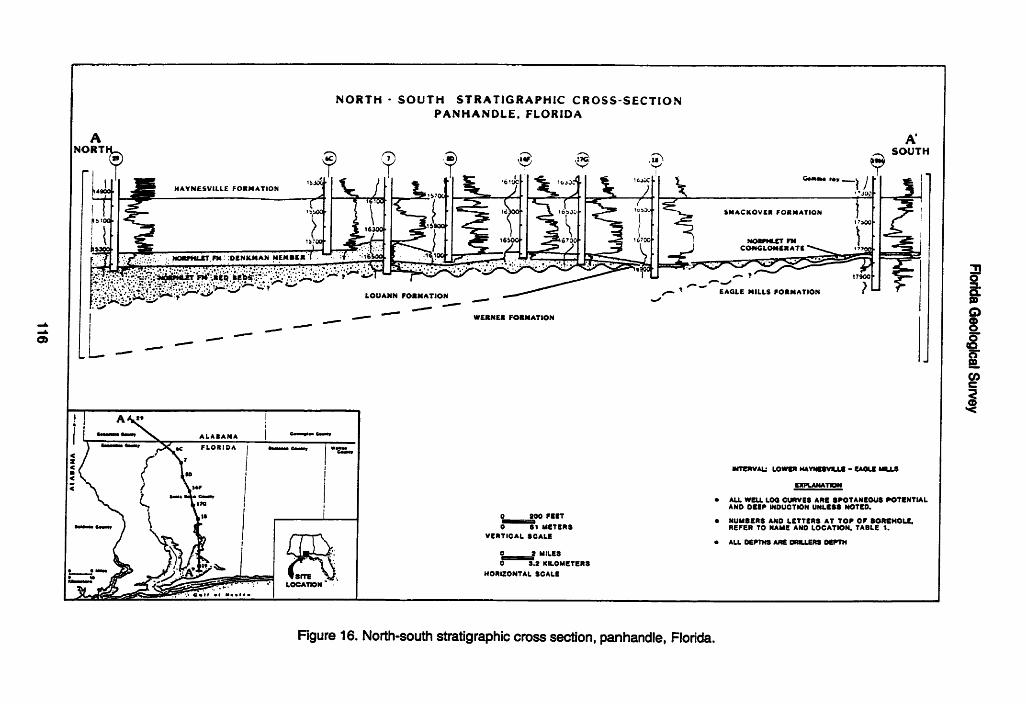
NORTH - SOUTH STRATIGRAPHIC CROSS-SECTIONPANHANDLE. FLORIDA
A A'NORTHr_ý SOUTH
HAVNESVILLE FORMATION R1 *F A
4 ' 16d SMACKOVER FORMATION
• .•:,•,,m.-• • LOUANN FORNATION 1
' EAGLE MILLS FORMATION
WERNER FORMATION t,
-e
SM .- - -ALABAMA __ IS*-, e,,6, FLORIDA J7mm0 sam r_ M *«
SINTERVAl.: LOWER MAYNESVU&. - EAOLE M.LS
S"0PLAMTO 7
S/" ~* ALL WELL LOG CURVES ARE SPOTANBOUS POTENTIAL
AND DEEP INDUCTION UNLESS NOTED.
-0 00 FEET * NUMSERS AND LETTERS AT TOP OF BOREHOLE.oe 0 1 METERS REFER TO NAME AND LOCATION. TABLE 1.VERTICAL SCALE
S* ALL DEPTNS ARE DRILLERS DEPTH2 MILES
S/0 32. KILOMETERSINTEV.L as HEHORIZONTAL SCALE
Figure 16. North-south stratigraphic cross section, panhandle, Florida.

WEST - EAST STRATIGRAPHIC CROSS-SECTIONPANHANDLE, FLORIDA
B B'WEST EAST
G'.. .r Gamms 6 .r;HAYNESVILLE FORMATION. .IO 701 1 1
EAGLE MILLS FORMATION
"DIABASE INTRUSIVE
LOUANN FORMATION " 16 00
k / .--- -"-'" WERNER FORMATION ,,... '
- -- - '-'" '"^' ^, -^ «.< -^>
"
--
* ALL WELL LOG CURVES ARE SPOTANEOUS POTENTIAL1AND DEEP INDUCTION UNLESS NOTED.
O 200 FEET * NUMBERS AND LETTERS AT TOP OF BOREHOLE.e,- ce, o et1 METERS REFER TO NAME AND LOCATION. TABLE 1.
VERTICAL SCALE * ALL DEPTHS ARE DRILLERS DEPTH
r 32 KILOMETERSSSITE' HORIZONTAL SCALE
Figure 17. West-east stratigraphic cross section, panhandle, Florida.

Florida Geological Survey
sediments, overstepping both the Louann and most abundant in central Santa Rosa County,Werner Formations. Examination of the cross- nearest the Conecuh Arch.section shows that outside the embayment, the 3. Panhandle Florida Norphlet sediments wereEagle Mills Formation was never completely derived from the basement rock of theburied by Norphlet sediments (Figure 17). Since Conecuh Ridge (Talledega Slate Belt) to thethe Eagle Mills apparently was exposed north and the Pensacola Arch (Piedmont Belt)throughout Norphlet deposition in panhandle to the south and east. Additionally, sedimentFlorida, the author assumes it was a source for contribution from the Eagle Mills, Werner, andNorphlet sediments. The Eagle Mills in Louann Formations probably was significant.panhandle Florida was not completely covereduntil middle Kimmeridgian time, when anhydriteof the lower Haynesville Formation completelycovered the embayment.
Diabase dikes and sills are known to cut EagleMills sediments throughout the Gulf Coast andare believed to be present in the bottom of theSonat Exploration well (Florida permit 590) Scottet al, 1961; A. Applegate, Florida GeologicalSurvey, 1986, personal communication). SomeVRFs in the quartzose and red bed Norphletfacies appear to be diabase. Thus, acontribution to Norphlet sediments from erosionof the Eagle Mills appears very likely.
CONCLUSIONS
1. Three distinct lithofacies of the NorphletFormation have been identified in panhandleFlorida: an updip conglomerate, red beds,and an uppermost quartzose lithofacies(Denkman Sandstone Member).
2. This study demonstrates that panhandleFlorida Norphlet sediments are more lithic incomposition than are Norphlet sediments fromsouthern Alabama. Metamorphic rockfragments are the most abundant rockfragments present within the lithic suite. Apartially silicified low-rank type ofmetamorphic rock fragment of possibleargillaceous and/or volcanic origin dominatesthe suite. Volcanic rock fragments arepresent in all samples and are most abundantin the south and east, nearest the PensacolaArch. Sedimentary rock fragments account foronly 4.7 percent of the lithic fraction and are
118

Information Circular 107
REFERENCES
Anderson, E. G., 1979, Basic Mesozoic study in Louisiana, the northern coastal region, and the GulfBasin Province: Baton Rouge, Department of Natural Resources, Louisiana Geological Survey, Folioseries, 58 p.
Badon, C. L., 1975, Stratigraphy and petrology of Jurassic Norphlet Formation, Clark County, Mississippi:American Association of Petroleum Geologists Bulletin, v. 59, p. 377-392.
Folk, R. L., 1980, Petrology of sedimentary rocks: Austin, Hemphill Publishing Company, 184 p.
Hartman, J. A., 1968, The Norphlet sandstone, Pelahatchie Field, Rankin County, Mississippi: GulfCoast Association of Geological Societies Transactions, v. 18, p. 2-11.
Honda, H., 1981, Diagenesis and reservoir quality of the Norphlet sandstone (Upper Jurassic), theHatters Pond area, Mobile County, Alabama [M.S. thesis]: The University of Texas at Austin, 213 p.
Imlay, R. W., 1980, Jurassic paleobiogeography of the conterminous United States in its continentalsetting: Government Printing Office, United States Department of the Interior, Geological Survey,Professional Paper 1062, 130 p.
Mancini, E. A., Mink, R. M., and Bearden, B. L., 1984, Paleo-environments and hydrocarbon potential ofthe Upper Jurassic Norphlet Formation of southwestern and offshore Alabama: Gulf Cost Associationof Geological Societies Transactions, v. 34, p. 131-135.
Mancini, E. A., Mink, R. M., Bearden, B. L., and Wilkerson, R. P., 1985, Norphlet Formation (UpperJurassic) of southwestern and offshore Alabama: Environments of Deposition and Petroleum Geology:American Association of Petroleum Geologists Bulletin, v. 69, p. 881-898.
McBride, E. F., 1981, Diagenetic history of Norphlet Formation (Upper Jurassic), Rankin County,Mississippi: Gulf Coast Association of Geological Societies Transactions, v. 31, p. 347-351.
Neathery, T. L. and Thomas, W. A., 1975, Pre-Mesozoic basement rocks of the Alabama coastal plain:Gulf Coast Association of Geological Societies Transactions, v. 25, p. 86-99.
Ottman, R. D., Keyes, P. L. and Ziegler, M. A., 1973, Jay Field-a Jurassic stratigraphic trap: Gulf CoastAssociation of Geological Societies Transactions, v. 23, p.146-157.
Oxley, M. L., Minihan, E., and Ridgeway, J. M., 1967, A study of the Jurassic sediments in portions ofMississippi and Alabama: Gulf Coast Association of Geological Societies Transactions, v. 17, p. 24-48.
Pepper, C. F., 1982, Depositional environments of the upper Jurassic Norphlet Formation ofsouthwestern Alabama [M.S. thesis]: Northeast Louisiana University, 102 p.
Scott, K. R., Hayes, W. E. and Fietz, R. P., 1961, Geology of the Eagle Mills Formation: Gulf CoastAssociation of Geological Societies Transactions, v. 11, p. 1-14.
119

Florida Geological Survey
Sigsby, R. J., 1976, Paleoenvironmental analysis of the Big Escambia Creek-Jay-Blackjack Creek Fieldarea: Gulf Coast Association of Geological Societies Transactions, v. 26, p. 258-278.
Tyrrell, W. W., 1973, Denkman Sandstone Member-an important Jurassic reservoir in Mississippi,Alabama, and Florida [abs.]: Gulf Coast Association of Geological Societies Transactions, v. 23, p. 32.
Walls, I. A., 1985, Provenance of the Jurassic Norphlet Formation in southwest Alabama [M.S. thesis]:University of Alabama at Tuscaloosa, 193 p.
Wilkerson, R. P., 1981, Environments of deposition of the Norphlet Formation (Jurassic) in southAlabama [M.S. thesis]: University of Alabama at Tuscaloosa, 141 p.
Woods, R. D. and Addington, J. W., 1973, Pre-Jurassic geological framework northern Gulf Basin: GulfCoast Association of Geological Societies Transactions, v. 23, p. 92-107.
Young, S. W., 1976, Petrographic textures of detrital polycrystalline quartz as an aid to interpretingcrystalline source rocks: Journal of Sedimentary Petrology, v. 46, p. 595-603.
120

Inrformation Circular 107
121

-FLORIDA-GEOLOGICAL-SURVEY
COPYRIGHT NOTICE© [year of publication as printed] Florida Geological Survey [source text]
The Florida Geological Survey holds all rights to the source text ofthis electronic resource on behalf of the State of Florida. TheFlorida Geological Survey shall be considered the copyright holderfor the text of this publication.
Under the Statutes of the State of Florida (FS 257.05; 257.105, and377.075), the Florida Geologic Survey (Tallahassee, FL), publisher ofthe Florida Geologic Survey, as a division of state government,makes its documents public (i.e., published) and extends to thestate's official agencies and libraries, including the University ofFlorida's Smathers Libraries, rights of reproduction.
The Florida Geological Survey has made its publications available tothe University of Florida, on behalf of the State University System ofFlorida, for the purpose of digitization and Internet distribution.
The Florida Geological Survey reserves all rights to its publications.All uses, excluding those made under "fair use" provisions of U.S.copyright legislation (U.S. Code, Title 17, Section 107), arerestricted. Contact the Florida Geological Survey for additionalinformation and permissions.