state of environment
TRANSCRIPT

State of EnvironmentReport, Bihar
Bihar State Pollution Control Board, Patna&
Department of Environment & ForestGovt. of Bihar


CONTENTSPAGE NO.
1. INTRODUCTION : 01
2. BIHAR : AN OVERVIEW 06
3. ENVIRONMENTAL APPRAISAL STUDIES (EAS) 10
3.1 Environmental Parameters (S = State) 10
3.2 Environmental Resources (P = Pressure) 65
3.3 Activities (D = Driving Force) : 93
4. ENVIRONMENTAL IMPACT ASSESSMENT (EIA) (I = IMPACT) 124
5. ENVIRONMENTAL MANAGEMENT PLAN (R = RESPONSE)
5.1 Disaster 129
5.2. Land Degradation 132
5.3. Bio-diversity Loss 135
5.4. Water Imbalance 137
5.5. Urbanisation 138
5.6 Mining 139
5.7. Awareness 139
6. CONCLUSIONS AND RECOMMENDATIONS 141
7. REFERENCES 143
Bihar State Pollution Control Board
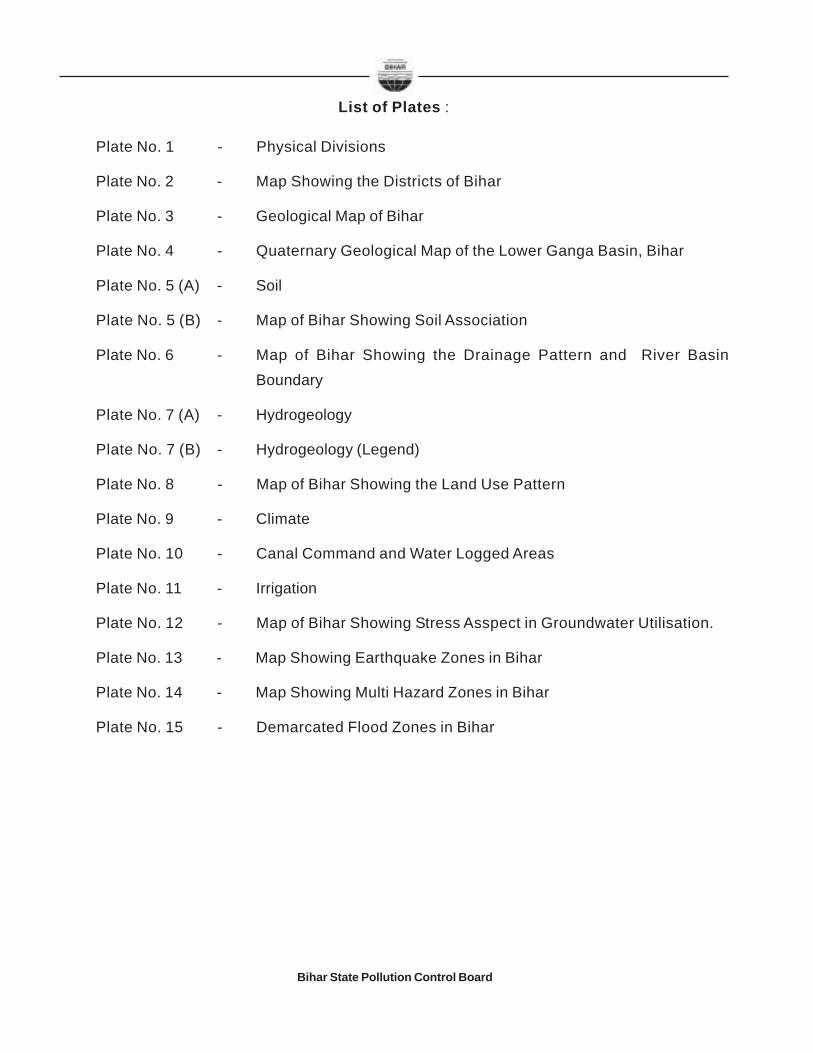
List of Plates :
Plate No. 1 - Physical Divisions
Plate No. 2 - Map Showing the Districts of Bihar
Plate No. 3 - Geological Map of Bihar
Plate No. 4 - Quaternary Geological Map of the Lower Ganga Basin, Bihar
Plate No. 5 (A) - Soil
Plate No. 5 (B) - Map of Bihar Showing Soil Association
Plate No. 6 - Map of Bihar Showing the Drainage Pattern and River BasinBoundary
Plate No. 7 (A) - Hydrogeology
Plate No. 7 (B) - Hydrogeology (Legend)
Plate No. 8 - Map of Bihar Showing the Land Use Pattern
Plate No. 9 - Climate
Plate No. 10 - Canal Command and Water Logged Areas
Plate No. 11 - Irrigation
Plate No. 12 - Map of Bihar Showing Stress Asspect in Groundwater Utilisation.
Plate No. 13 - Map Showing Earthquake Zones in Bihar
Plate No. 14 - Map Showing Multi Hazard Zones in Bihar
Plate No. 15 - Demarcated Flood Zones in Bihar
Bihar State Pollution Control Board
Bihar State Pollution Control Board [ 13 ]
INTRODUCTION
1.1 Background
In pursuance of the Ministry of Environment and Forests, Government of India decisionto introduce a scheme during the 10th five year plan for assisting the State Governments tobring about the ‘State of Environment (SoE) Report for representative states on triennialbasis, the state of Bihar has also to prepare the said report, which will provide an overviewof the prevailing bio-physical and socio economic conditions of the state.
For successfully brining out this report, Ministry of Environment and Forests,Government of India has designated Development Alternatives, New Delhi as National HostInstitute for the State of Bihar. Department of Environment and Forest, Government of Biharhas been designated as ‘State Nodal Agency’ whereas, Bihar State Pollution Control Boardhas been designated as ‘State Host Institute’ for the purpose. A series of meetings for thepurpose were organized represented by different Government Organizations, Stake Holdersand NGOs. In the deliberations several environmental issues were unanimously conceived,which were finally categorized into 6 classes to be addressed and evaluated under theexisting conditions. The 6 categories, so classified are:
(i) Disaster
(ii) Land Degradation
(iii) Bio-Diversity
(iv) Water Imbalance
(v) Industrialization, and
(vi) Awareness.
Bihar State Pollution Control Board as the ‘State Host Institute’ (SHI) solicitedGeological Survey of India for the preparation of geo-environmental data.
1.2 Objective of the Scheme
The objectives of the scheme, as envisaged by the Government of India, behindpreparing the State of Environment Report are:
• To provide the public, government, non-government organizations and decisionmakers with accurate, timely and accessible information on the state of currentenvironment and future outlook for a region’s environment;
Bihar State Pollution Control Board[ 14 ]
• To report on the effectiveness of the policies and programmes that have beendesigned to respond to environmental changes, including progress towards achievingenvironmental standards and targets;
• To create a mechanism for the integration of environmental, social and economicinformation with the goal of providing a clear picture of the condition of the states;
• To provide early warning of the potential problems as well as allowing for the evaluationof possible scenario for the future;
• To assess the nation’s progress towards achieving ecological sustainability;
• To identify gaps in the state of nation’s knowledge of environmental conditions andtrends and recommend strategies for research and monitoring to fill these gaps; and
• To help making judgment regarding the broad environmental consequences of social,economic and environmental policies and plans.
1.3. METHODOLOGY :
The methodology adopted in SoE reporting process envisages two parallel flow routeof the reporting system coming together at critical junctures. One branch of the systemfocuses on perception based participatory approach and the other system adopts a databased approach (Fig. 1). Thus the system conjugates both participatory and analytical angleto ensure scientific robustness coupled with awareness and ownership building amongstakeholders.
The SoE reporting is carried out in three compartments :-
(i) Environmental Appraisal Studies (EAS)EAS describes the status and cause effect relationship of the givenenvironmental issues.
(ii) Environmental Impact Assessment (EIA) andEIA forecasts and assess the impact on environment.
(iii) Environmental Management Plan (EMP)EMP describes the response strategies and mitigation measures forprotection of environment.

Bihar State Pollution Control Board [ 15 ]
SYSTEM DESIGN
(Data Based)
EnvironmentalAppraisal Studies
(S)
State of Parameters :(i) Geoenironmental(ii) Non-Geoenvironmental(iii) Biotic
Environmental Resources(i) Brown agenda(ii) Green agenda(iii) Blue agenda
Activities(i) Geogenic(ii) Anthropogenic
Field vailidation &Data Gap Filling
(Perception Based)
Issue Identification &Prioritization
(I)
Environmental ImpactAssessment
Response Identification
Environmental Management Plan
Verification with Experts
Synthesis & Consultation- Gaps- Possible Response
(P)
(D)
Dat
a C
olle
ctio
n an
d C
olla
tion
Field vailidation &Data Gap Filling
Report Finalisation
Action Limit
(R)
Fig.1
Bihar State Pollution Control Board[ 16 ]
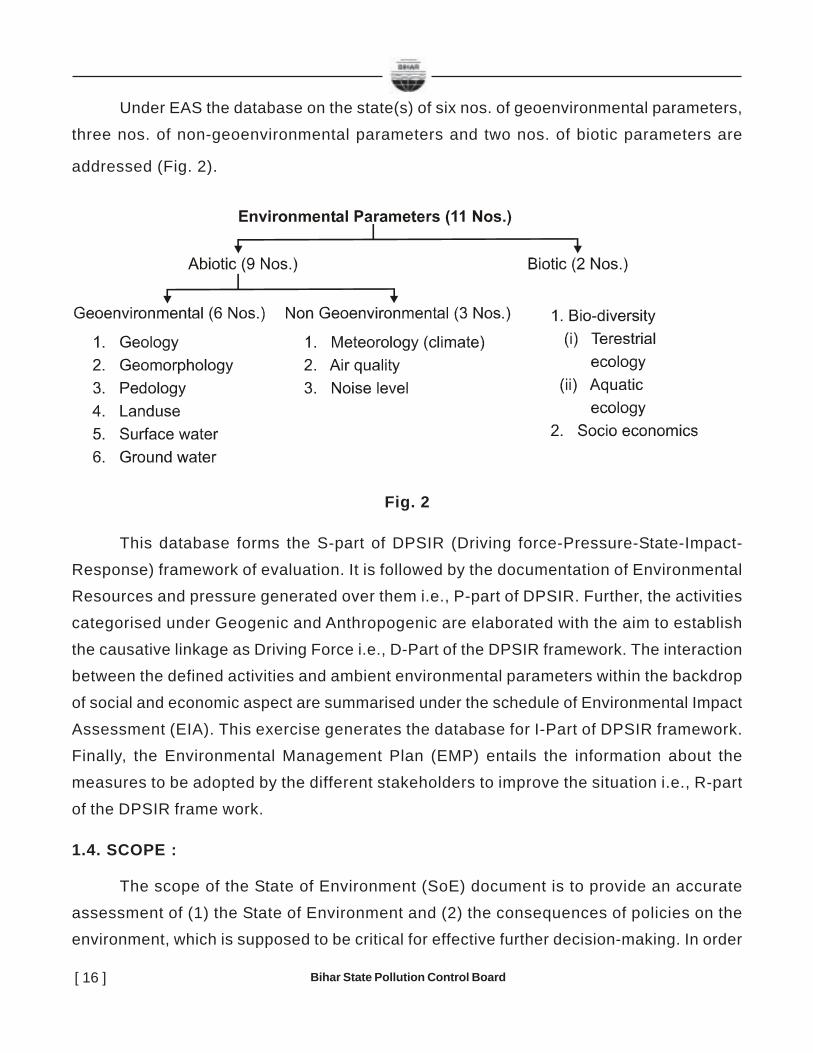
Under EAS the database on the state(s) of six nos. of geoenvironmental parameters,
three nos. of non-geoenvironmental parameters and two nos. of biotic parameters are
addressed (Fig. 2).
Fig. 2
This database forms the S-part of DPSIR (Driving force-Pressure-State-Impact-
Response) framework of evaluation. It is followed by the documentation of EnvironmentalResources and pressure generated over them i.e., P-part of DPSIR. Further, the activities
categorised under Geogenic and Anthropogenic are elaborated with the aim to establish
the causative linkage as Driving Force i.e., D-Part of the DPSIR framework. The interactionbetween the defined activities and ambient environmental parameters within the backdrop
of social and economic aspect are summarised under the schedule of Environmental Impact
Assessment (EIA). This exercise generates the database for I-Part of DPSIR framework.Finally, the Environmental Management Plan (EMP) entails the information about the
measures to be adopted by the different stakeholders to improve the situation i.e., R-part
of the DPSIR frame work.
1.4. SCOPE :
The scope of the State of Environment (SoE) document is to provide an accurate
assessment of (1) the State of Environment and (2) the consequences of policies on theenvironment, which is supposed to be critical for effective further decision-making. In order

Bihar State Pollution Control Board [ 17 ]
to fulfill this need, it has been decided to bring out such document on triennial basis for the
State of Bihar. The preparation of database, their synthesis and consultation with
stakeholders leading to assessment of policies and emerging issues would be integratedfor their ground applicability within the frame work of sustainable development decision-
making cycle.
Further, the ground evaluation of the environmental trends and conditions of thecommunity will have to be assessed the relative importance of different environmental issues
and set priorities.
1.5 ACKNOWLEDGEMENT :
The Present publication is the outcome of the joint effort by Bihar State Pollution
Control Board (BSPCB), Patna with the Geological survey of India, Ministry of Mines, Go I
for the preparation of “State of Environment (SoE) Report” for Bihar. The database for thisreport comprises of geoenvironmental, non-geoenvironmental and biotic parameters. The
geoenvironmental database is based on published reports of GSI and C.G.W.B. the non-
geoenvironmental database was provided by Bihar state Pollution control Board, IndianMeteorology Dept. central water commission, GOI Water Resources department. GOB,
Directorate of Industries; GoB, P.H.E.D, GoB, state Transport Dept., GoB, Directorate of
soil conservation; GoB, Bihar state Electricity Board, Patna, Department of mines andgeology, GoB and various other central and state govt. depts. While preparation of this
report the valuable suggestions made and the supporting database as provided by them
are thankfully acknowledged.
Further, the participating representatives from the water Resources Dept.; GoB,
Health Dept; GoB. Directorate of Survey; GoB, Directorate of Agriculture, GoB, Dept. of
Revenue and Land Reforms, GoB, S.F. Env. S & P.E. Directorate, Urban DevelopmentDept; GoB deserve special thanks for taking keen interest by way of attending meeting on
18-3-2006 and discussing the subject matter, at length, of this report. The support given by
Ministry of Environment and Forests, Government of India and Development Alternatives,the National Host Institute is also duly acknowledged.

Bihar State Pollution Control Board[ 18 ]
BIHAR : OVERVIEW
Bihar is located in the eastern part of the country.
It is an entirely land locked state, although the outlet to
the Sea through the port of Kolkata is not far away.
Bihar lies midway between the humid West Bengal, in
the east and the sub humid Uttar Pradesh, in the west
which provides it with a transitional position in respect
of climate and economic activities. It is bounded by
Nepal in the north, Jharkhand in the South. The Bihar
plain is divided into two unequal halves by the river
Ganga which flows through the middle from west to
east. The physical divisions based on bio-physical and
historical antecedence are depicted in Plate No. 1.
The state of Bihar has always been in the centrestage
of the country’s economic, cultural, historical and
political activities. It has acquired a new identity on
15th November 2000 after the
creation of the State of
Jharkhand out of it. It occupies a
total geographical area of 94,163
sq. km and is extended for 483
km from east to west and 345
km from north to south. The
physical feautures of the State
and its administrative units are
presented in table 1.
Bihar State Pollution Control Board [ 19 ]
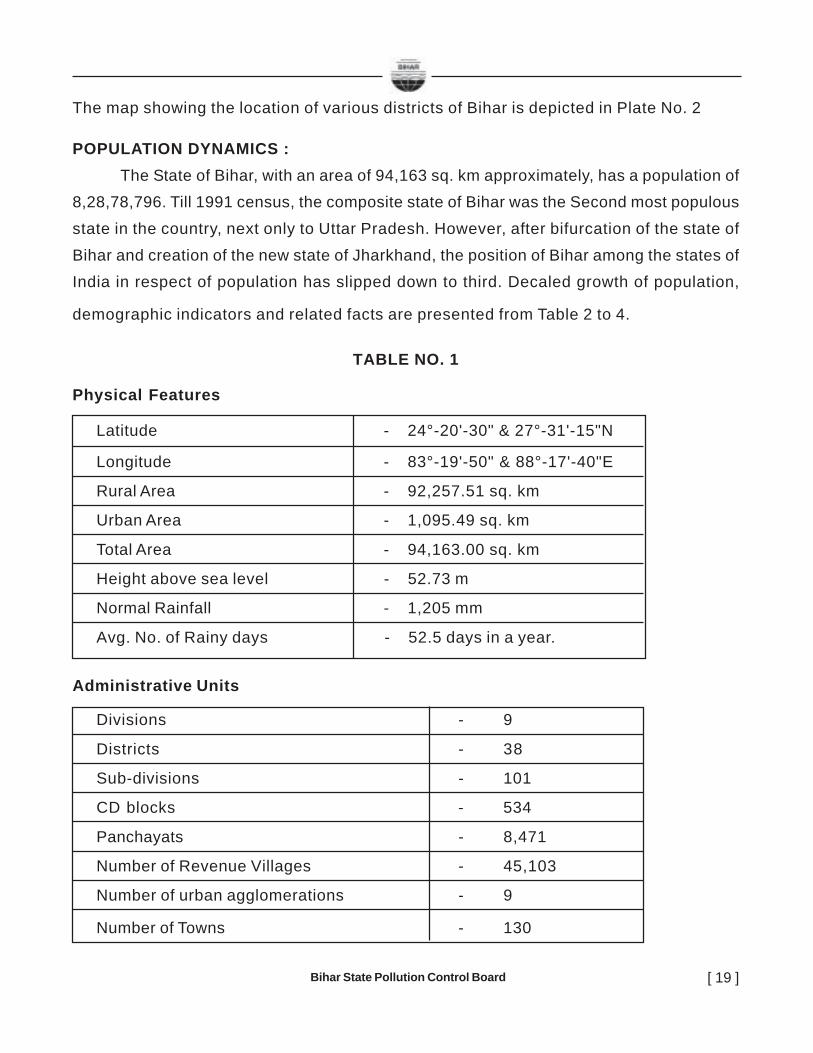
The map showing the location of various districts of Bihar is depicted in Plate No. 2
POPULATION DYNAMICS :The State of Bihar, with an area of 94,163 sq. km approximately, has a population of
8,28,78,796. Till 1991 census, the composite state of Bihar was the Second most populous
state in the country, next only to Uttar Pradesh. However, after bifurcation of the state of
Bihar and creation of the new state of Jharkhand, the position of Bihar among the states ofIndia in respect of population has slipped down to third. Decaled growth of population,
demographic indicators and related facts are presented from Table 2 to 4.
TABLE NO. 1
Physical Features
Latitude - 24°-20'-30" & 27°-31'-15"N
Longitude - 83°-19'-50" & 88°-17'-40"E
Rural Area - 92,257.51 sq. km
Urban Area - 1,095.49 sq. km
Total Area - 94,163.00 sq. km
Height above sea level - 52.73 m
Normal Rainfall - 1,205 mm
Avg. No. of Rainy days - 52.5 days in a year.
Administrative Units
Divisions - 9
Districts - 38
Sub-divisions - 101
CD blocks - 534
Panchayats - 8,471
Number of Revenue Villages - 45,103
Number of urban agglomerations - 9
Number of Towns - 130

Bihar State Pollution Control Board[ 20 ]
TABLE - 2 : GROWTH OF POPULATION IN BIHAR/INDIA
Population Decadal variation Decadal variation
in % (Bihar) in % (India)1901 27,311,8651911 28,314,281 + 3.67 + 5.75
1921 28,126,675 – 0.66 – 0.31
1931 31,347m108 + 11.45 + 11.001941 35,170,840 + 12.20 +14.22
1951 38,782,721 + 10.27 + 13.31
1961 46,447,457 + 19.76 + 21.511971 56,353,369 + 21.33 + 24.80
1981 69,914,734 + 24.06 + 24.06
1991 89,374,465 + 23.54 + 23.85
2001 8,28,78,796 (Bihar) + 28.43 +21.34
TABLE - 3 : SOCIO - DEMOGRAPHIC INDICATORS OFTHE NEW “BIHAR” STATE
Indicators Bihar India
'91 '01 '91 01
Percentage decadal 23.36 28.43 23.86 21.34growth rate
Sex ratio 907 921 927 933
Population Density 685 880 267 324(Population per sq. km)
Population '01 82,878,796 1,027,015,247
Literacy rate (%)(+7 years Population) Male 60.32 75.82
Female 33.57 54.16
Total 47.53 65.38
Bihar State Pollution Control Board [ 21 ]
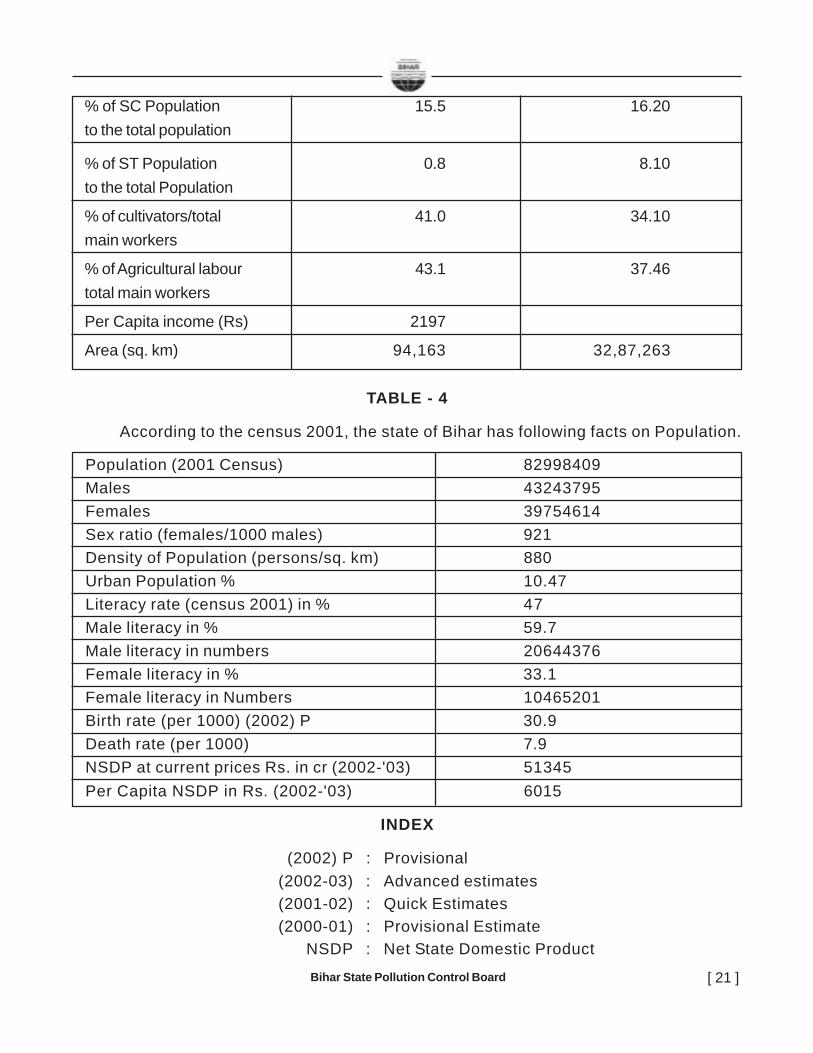
% of SC Population 15.5 16.20to the total population
% of ST Population 0.8 8.10to the total Population
% of cultivators/total 41.0 34.10main workers
% of Agricultural labour 43.1 37.46total main workers
Per Capita income (Rs) 2197
Area (sq. km) 94,163 32,87,263
TABLE - 4
According to the census 2001, the state of Bihar has following facts on Population.
Population (2001 Census) 82998409Males 43243795Females 39754614Sex ratio (females/1000 males) 921Density of Population (persons/sq. km) 880Urban Population % 10.47Literacy rate (census 2001) in % 47Male literacy in % 59.7Male literacy in numbers 20644376Female literacy in % 33.1Female literacy in Numbers 10465201Birth rate (per 1000) (2002) P 30.9Death rate (per 1000) 7.9NSDP at current prices Rs. in cr (2002-'03) 51345Per Capita NSDP in Rs. (2002-'03) 6015
INDEX
(2002) P : Provisional(2002-03) : Advanced estimates(2001-02) : Quick Estimates(2000-01) : Provisional Estimate
NSDP : Net State Domestic Product
Bihar State Pollution Control Board[ 22 ]
ENVIRONMENTAL APPRAISAL STUDIES (EAS)
Environmental Appraisal Studies (EAS) have been carried out to decipher and
document the overall environmental scenario of the State of Bihar. The overall environmental
scenario is mainly controlled by three factors (i) Environmental resources (ii) Environmental
constraints and (iii) Level of degradation (anthropogenic / geogenic). Depending on the
relative predominance of these factors, the inherent strength or fragility of the environment
is determined. This characterisation is important as it leads to the calculation of ”Bearing
Capacity” of an environment, which in turn, dictates the level of developmental activities
which can be taken up with minimum damage to the environment.
In general, EAS covers 11 Standard Environmental Parameters. These are shown in
Fig. 2.
3.1 ENVIRONMENTAL PARAMETERS :
3.1.1.1. Geology :
Geologically, it represents the extreme northern front of Indian sub-continent. These include
(i) the belt of Himalayan foothills in the northern fringe of Paschim Champaran (ii) the vast
Ganga Plains, (iii) the Vindhyan (Kaimur) Plateau extending into Rohtas region, (iv) the
sporadic and small Gondwana basin outliers in Banka district, (v) the Satpura Range
extending into large part of the area North of Chotanagpur Plateau, (vi) the parts of Bihar
Mica belt in Nawada, Jamui and Banka districts and (vii) the Granite Gneissic complex of
Chotanagpur plateau. Nearly two third of Bihar is under cover of Ganga basin composed of
alluvium and masks the nature of basement rocks. The geological map of Bihar is presented
at Plate 3.

Bihar State Pollution Control Board [ 23 ]
Table - 5 : Showing the Geological Succession and their
geographic distribution
Age Geology Geography Text Index
Quaternary Alluvial deposits North Bihar Plain
(Sand, Clay, Silt, & Central Bihar Plain
fragments)
Tertiary Sandstones and North Champaran Hills
Clay Stones
Gondwana Coal Measures, Banka district
Forming a series of
small outlier basins
Incr
easi
ng a
ntiq
uity
2
1
4
3
5
Age Geology Geography Text Index
Vindhyans Sandstones, Shales, Parts of Bhabhua
Limestones etc. and Rohtas dist.
Satpura Schist, Phyllite, Part of Aurangabad,
Quartzite Gaya, Nawada, Nalanda,
Sheikhpura and
Munger Dist.
Incr
easi
ng a
ntiq
uity
Proterozoic Mica Schist, amphi- Nawada, Jamui
bolite, quartzite, & Bankagranite, dolerite andpegmatite
Archaean Gneisses, Granites, Parts of Aurangabad,Schists, Phyllites, Gaya, Nawada, Jamui,Quartzites, amphibolites Banka and Bhagalpur& intrusives allmetamorphosed
sedimentary and
igneous rocks
Bihar State Pollution Control Board[ 24 ]
1. The Tertiaries are exposed in Masan area of North Champaran District, as a series
of low hillocks. They represent Upper Siwaliks of the Sub-Himalayas and consist of
sandstone and claystone, disturbed by folding and thrust faulting. The entire sequence
here occurs as an inlier in the alluvial terrain.
2. The Quaternary of North Bihar Plains, between the tortuous course of Ganga and
Himalayan foothills, are represented by Older Alluvium Group (OAG) (Bhangar) and
Newer Alluvium Group (NAG) (Khader). The OAG is represented by Mirganj
Formation, Khajauli Formation and Madhubani Formation in Gandak basin, Gandak-
Kosi interfluve and Kosi basin, respectively. The NAG includes the Vaishali Formation,
the Jainagar Formation and Purnea Formation in Gandak basin, Gandak-Kosi
interfluve and Ganga-Kosi-Mahananda interfluve. In the whole region the uppermost
formation is the Present Flood Plains, Diara formation, Channel Bars and Sand
Dunnes.
In central Bihar Plains the OAG forming the highest terrace, in the Son-Ganga alluvial
tract, and NAG forming younger terraces, as Older Flood Plains, are exposed all
along the Alluvial Upland. The Present Flood Plain deposits are confined with the
channels.
3. The Vindhyans, in Bihar, are exposed in Rohtas and Bhabhua districts as scarps
and plateau. They comprises gritty to fine cemented sandstones, shales, flagstones,
quartzites, sandy siltstones, limestone breccias and porcellanites, the shales often
being pyritiferous.
4. The Gondwana rocks occur as sporadic outlier basins, in the parts of Banka district.
The main rock types are sandstones, fine to coarse or gritty sandstone, ironstone,
shales, Carbonaceous shales, coal seams and boulder beds. They are largely
cemented, jointed, fractured, faulted and intruded by dykes and sills.

Bihar State Pollution Control Board [ 25 ]
5. Along the northern fringe of the Chotanagpur Granite Gneiss Complex are low-grade
supracrustals covering the Kharagpur hills, Rajgir hills and Gaya hills referred to as
the Satpura Range, comprises schists, ferruginous phyllite, quartzite and phyllitic
shales.
6. The Bihar Mica belt comprises a sequence of folded hornblende schists, amphibolite,
mica-schist, quartzite and calc-silicates intruded by circular to oval shaped granitic
plutons, dolerites, pegmatites and quartz veins. There are may old mines of mica in
this belt.
7. The Archaeans are the oldest rock formation in the state. The most predominant rock
type is mainly of gneisses and granitic rocks with lesser amount of schists, quartzites,
basic intrusives and pegmatoides. They are exposed in Aurangabad, Gaya, Nawada,
Jamui, Bhagalpur and Banka districts.
For the purpose of Geoenvironmental Appraisal Studies the rock types are
characterised in terms of following elements :–
(a) Fragility :
7 3 5 4 6 1 2Increasing fragility
(b) Proneness to Mass - movement :
3 5 7 4 6 1 2Increasing Proneness to mass movement
(c) Engineering Suitability :
(i) Foundation material :
(ii) Construction Material :
Bihar State Pollution Control Board[ 26 ]
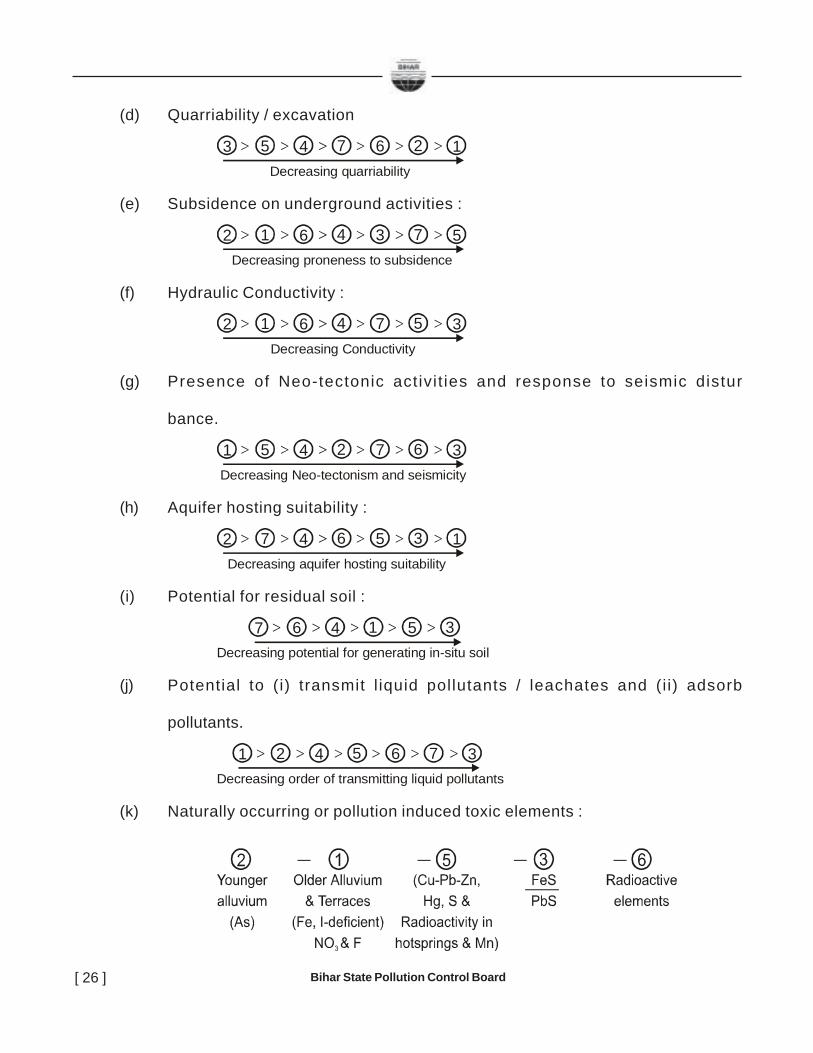
(d) Quarriability / excavation
3 5 4 7 6 2 1Decreasing quarriability
(e) Subsidence on underground activities :
2 1 6 4 3 7 5Decreasing proneness to subsidence
(f) Hydraulic Conductivity :
2 1 6 4 7 5 3Decreasing Conductivity
(g) Presence of Neo-tectonic activi t ies and response to seismic distur
bance.
1 5 4 2 7 6 3Decreasing Neo-tectonism and seismicity
(h) Aquifer hosting suitability :
2 7 4 6 5 3 1Decreasing aquifer hosting suitability
(i) Potential for residual soil :
7 6 4 1 5 3Decreasing potential for generating in-situ soil
(j) Potential to (i) transmit l iquid pollutants / leachates and (i i) adsorb
pollutants.
1 2 4 5 6 7 3Decreasing order of transmitting liquid pollutants
(k) Naturally occurring or pollution induced toxic elements :
Bihar State Pollution Control Board [ 27 ]
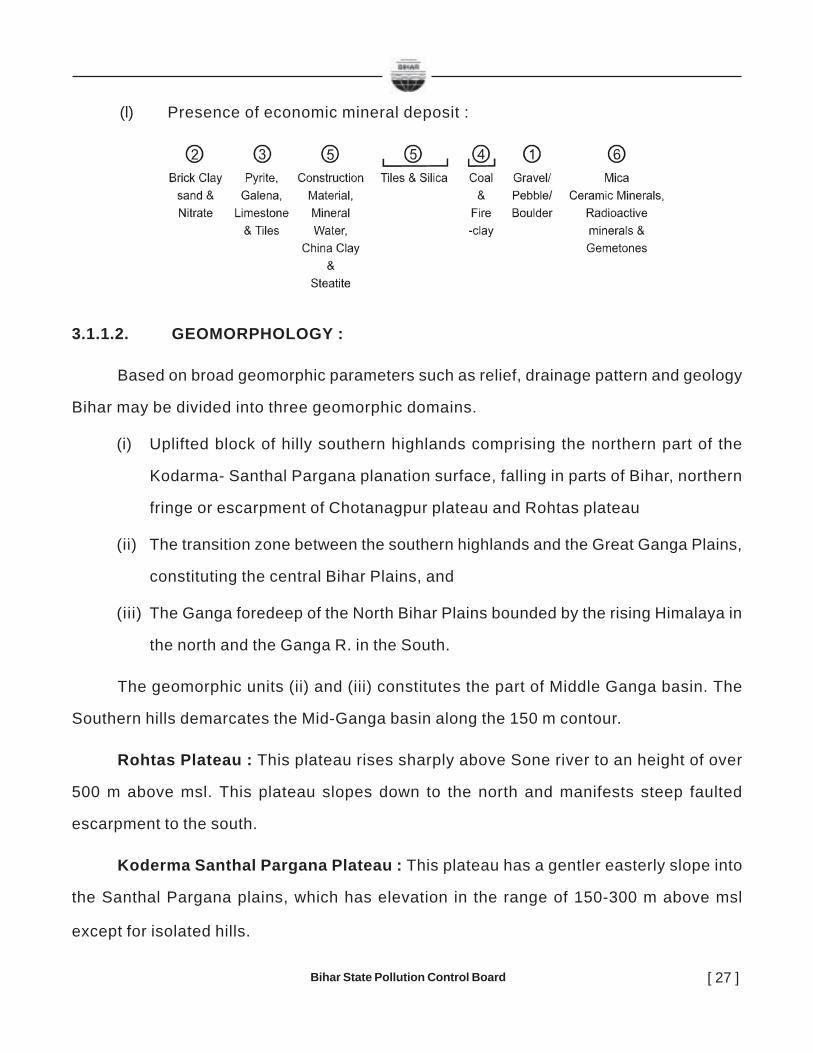
(l) Presence of economic mineral deposit :
3.1.1.2. GEOMORPHOLOGY :
Based on broad geomorphic parameters such as relief, drainage pattern and geology
Bihar may be divided into three geomorphic domains.
(i) Uplifted block of hilly southern highlands comprising the northern part of the
Kodarma- Santhal Pargana planation surface, falling in parts of Bihar, northern
fringe or escarpment of Chotanagpur plateau and Rohtas plateau
(ii) The transition zone between the southern highlands and the Great Ganga Plains,
constituting the central Bihar Plains, and
(iii) The Ganga foredeep of the North Bihar Plains bounded by the rising Himalaya in
the north and the Ganga R. in the South.
The geomorphic units (ii) and (iii) constitutes the part of Middle Ganga basin. The
Southern hills demarcates the Mid-Ganga basin along the 150 m contour.
Rohtas Plateau : This plateau rises sharply above Sone river to an height of over
500 m above msl. This plateau slopes down to the north and manifests steep faulted
escarpment to the south.
Koderma Santhal Pargana Plateau : This plateau has a gentler easterly slope into
the Santhal Pargana plains, which has elevation in the range of 150-300 m above msl
except for isolated hills.
Bihar State Pollution Control Board[ 28 ]
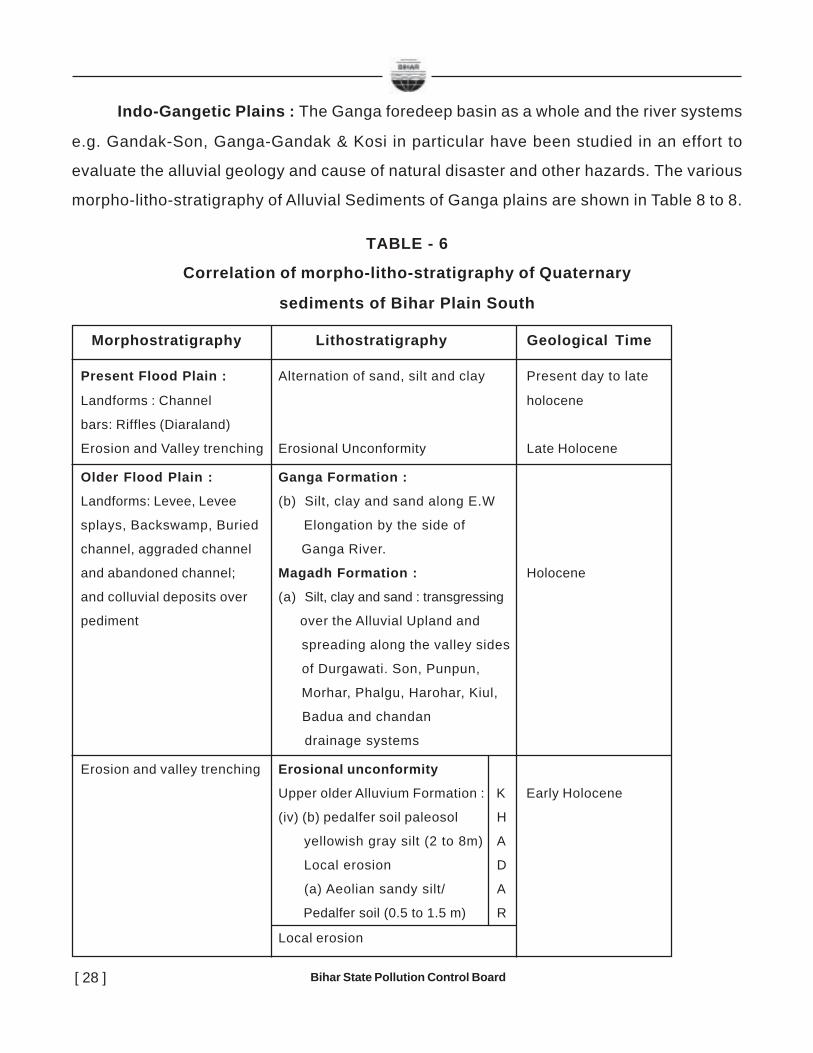
Indo-Gangetic Plains : The Ganga foredeep basin as a whole and the river systems
e.g. Gandak-Son, Ganga-Gandak & Kosi in particular have been studied in an effort to
evaluate the alluvial geology and cause of natural disaster and other hazards. The various
morpho-litho-stratigraphy of Alluvial Sediments of Ganga plains are shown in Table 8 to 8.
TABLE - 6
Correlation of morpho-litho-stratigraphy of Quaternary
sediments of Bihar Plain South
Morphostratigraphy Lithostratigraphy Geological Time
Present Flood Plain : Alternation of sand, silt and clay Present day to late
Landforms : Channel holocene
bars: Riffles (Diaraland)
Erosion and Valley trenching Erosional Unconformity Late Holocene
Older Flood Plain : Ganga Formation :
Landforms: Levee, Levee (b) Silt, clay and sand along E.W
splays, Backswamp, Buried Elongation by the side of
channel, aggraded channel Ganga River.
and abandoned channel; Magadh Formation : Holocene
and colluvial deposits over (a) Silt, clay and sand : transgressing
pediment over the Alluvial Upland and
spreading along the valley sides
of Durgawati. Son, Punpun,
Morhar, Phalgu, Harohar, Kiul,
Badua and chandan
drainage systems
Erosion and valley trenching Erosional unconformity
Upper older Alluvium Formation : K Early Holocene
(iv) (b) pedalfer soil paleosol H
yellowish gray silt (2 to 8m) A
Local erosion D
(a) Aeolian sandy silt/ A
Pedalfer soil (0.5 to 1.5 m) R
Local erosion

Bihar State Pollution Control Board [ 29 ]
Alluvial Upland : Occurring (iii) Pedocal soil Palaeosolas terraces and colluvium Yellow silt & clay (10 to 40 m)deposit over pediment brown sand (10 to 20 m)
Erosional UnconformityLower Older Alluvium Formation :(ii) Pedalfer soil Paleosol B yellow reddish brown silt H and clay (15 to 35 m) A Brown sand with gravel N (35 to 50 m) G Upper Pleistocene Local erosion A(i) Yellow to reddish brown R Silt and clay (5 to 18 m) Pebble and boulder bearing gritty-sandy bed (local) (local) (5 to 15 m)
Pediplain Residual Soild Pre-Quatenary& Quaternary
TABLE - 7Correlation of Morpho-lithostratigraphy
of Gandak-Kosi interfluve.
Lithostratigraphy Morphostratigraphy Lithology Thickness (m)Present Flood Plain :
Gandak/Burhi Gandak/Kosirecent alluvium (channel bars Grey micaceous sand 5.0 to 8.0and point bars)
Newer Alluvium : Older Flood Plain :KHADAR Gandak / Burhi Gandak / (b) Interbedded grey to(Up. pleistocene to Kosi-Terrace : Upper Vaishali yellowish grey silt-clay, 0.50 to 4.0recent) member (b) rich in shells, unoxidised
Upper Jainagar Member soid at places. bog soil at(a) (levee, flood basins) bottom
DisconformityOlder Alluvium : Gandak basin : Lower / Vaishali (a) Dissected, irregular 2.0 m to 4.0BHANGAR member (b) (exposed at Hazipur) outcrop of unxidised to(Mid. - Up. Pleistocene) Kosi basin : Lower Jainagar feebly oxidised grey to
Member (a) (exposed at Khajauli) pale yellowish grey siltyclay. Soft ferruginousconcretions and rareKankars (Kosi) and pedocalPalaeosol (Gandak.)
Bihar State Pollution Control Board[ 30 ]
Unconformity
Madhubani Formation (Kosi) Patchy and irregular occur- > 200
Mirganj Formation (Gandak) rence of deep yellow to
brownish yellow clay with
pedocal palacosol lower
part arenaceous
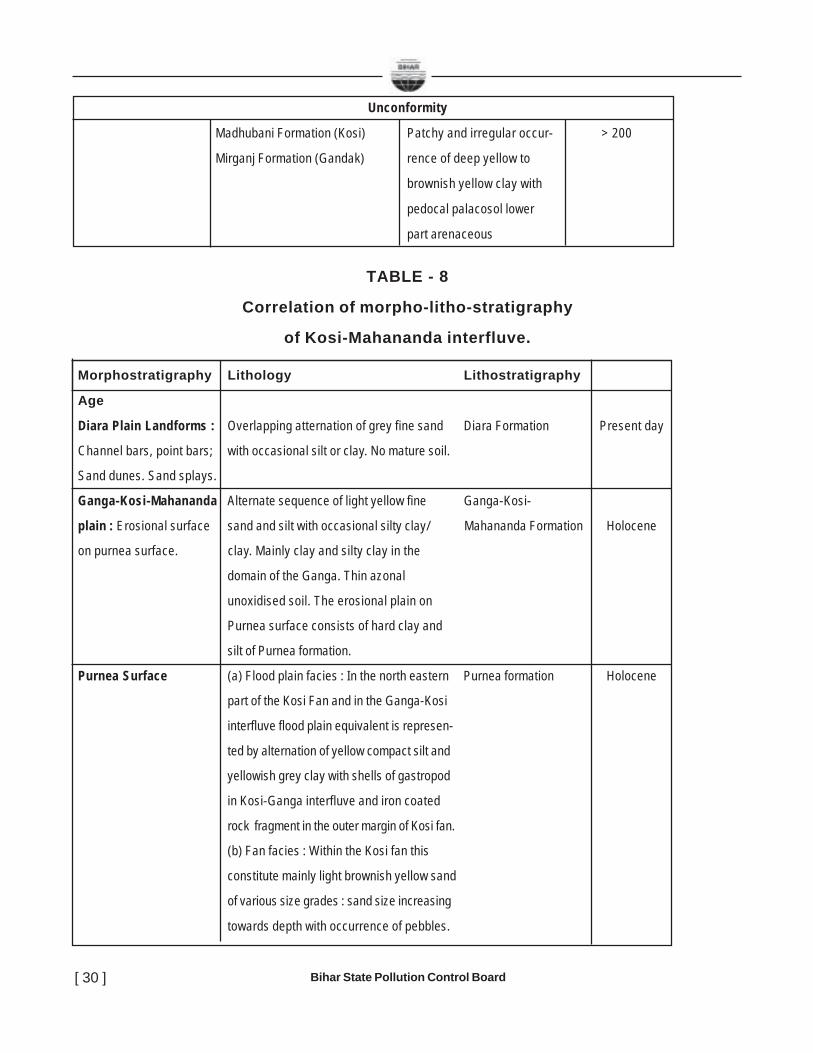
TABLE - 8
Correlation of morpho-litho-stratigraphy
of Kosi-Mahananda interfluve.
Morphostratigraphy Lithology Lithostratigraphy
Age
Diara Plain Landforms : Overlapping atternation of grey fine sand Diara Formation Present day
Channel bars, point bars; with occasional silt or clay. No mature soil.
Sand dunes. Sand splays.
Ganga-Kosi-Mahananda Alternate sequence of light yellow fine Ganga-Kosi-
plain : Erosional surface sand and silt with occasional silty clay/ Mahananda Formation Holocene
on purnea surface. clay. Mainly clay and silty clay in the
domain of the Ganga. Thin azonal
unoxidised soil. The erosional plain on
Purnea surface consists of hard clay and
silt of Purnea formation.
Purnea Surface (a) Flood plain facies : In the north eastern Purnea formation Holocene
part of the Kosi Fan and in the Ganga-Kosi
interfluve flood plain equivalent is represen-
ted by alternation of yellow compact silt and
yellowish grey clay with shells of gastropod
in Kosi-Ganga interfluve and iron coated
rock fragment in the outer margin of Kosi fan.
(b) Fan facies : Within the Kosi fan this
constitute mainly light brownish yellow sand
of various size grades : sand size increasing
towards depth with occurrence of pebbles.
Bihar State Pollution Control Board [ 31 ]
In absence of any data on absolute age of lithostrata, it has always remained a
handicap to correlate the formations occurring on either side of Ganga river. On the basis
of the occupation level in basin, Sediment characteristic, degree of oxidation and palaeosol
nature the various formations are grouped in the category of Older Alluvium (Bhangar) of
Middle to upper Pleistocene age and Newer Alluvium (Khadar) of Upper Pleistocene to
Recent age (Pascoe, 1964). Apart from the presence or absence of calcareous nodules
within the Bhangar and Khadar soil profile respectively, the neotectonic framework has
also helped in the construction of chrono-stratigraphy. It is worthwhile to mention here that
NE-SW lineament recorded in Son basin continues in the Western Kosi basin and again
NW-SE lineament of Kiul-Kharagpur hill re-emerges in the Gandak-Burhi Gandak Basins.
These two lineaments are the connecting links between north and south morphotectonic
set-up. This signature has been further modified by E-W cross faults along Ganga channel
as evident by swelling of channel and their southeast drag under the influence of NW-SE
cross faults, recorded by pinching of channel, occurring in en-echelon manner. Thus the
vertical and lateral movement of rivers, and consequent pilling up of alluvium, are due to
various reasons, e.g., subsidence, over-sedimentat ion, cl imate, neotectonics,
hydrodynamics of river basin and advance or retreat of glaciers. The geological and
geographical distribution of various formations are shown in Plate No. 4
Central Bihar Plains : Three land systems have been identified e.g.
(i) The Alluvial upland (ii) the Older Flood Plain and (iii) the Present Flood Plains
– the domain of deposition during the Quaternary period.
The Alluvial upland constitute the Oldest and highest terrace, traceable from Kaimur
Plateau north margin to Bhagalpur and dissected by the northerly flowing parallel drainage
systems. The Older Flood Plain constitutes the intermediate terrace and comprises of two
land systems (1) a narrow linear east-west arrangement of levee and backswamps (Tal),
and palaeodrainage imprints in the area from Patna to Sahibganj, parallel to the course of
Bihar State Pollution Control Board[ 32 ]
Ganga and (2) interfluvial land form morphology evolved in response to Durgawati, Son,
Punpun, Morhar and Kiul river systems impressed upon the eroded basement of Older
Alluvium, in segments. The Present Flood Plain Constitutes the present oscillatory limit of
the Ganga and within channel deposits of northerly flowing channels.
It covers an area of 42,000 sq. km. of flat alluvial plain with a number of isolated hills
e.g., Rajgir hills of Nalanda, Kharagpur hills of Munger and Barabar Hills of Gaya. This
plain is divided into three interfluvial domains.
(i) Ganga-Son interf luve of Rohtas-Bhojpur & Arwal-Jehanabad-Patna
Plains.
(ii) Son-Kiul interfluve of the middle block of Magadh Plains, and
(iii) Chandan-Badua interfluve of the eastern block of the Kiul -Rajmahal
Ganga Plains.
The gradient of the central Bihar plains sloping down from the Chotanagpur Plateau
to the Ganga are steeper than the Himalayan foothills down to the Ganga in the North.
North Bihar plains : It extends from the course of Ganga in the south to Himalayan foothills
in the north. The ‘tarai’ belt in the north forms the northern part of the Paschim Champaran
District and is about 32 km long and 6-8 km wide, rising above plains sharply along the
150 contour, are composed of poorly consolidated boulders, pebbles, and gravels. South
of the tarai belt is the North Bihar plains of riverine cones and intercones. Further, the North
Bihar Plains can be divided into (i) Gandak-Kosi interfluve and (ii) Kosi-Mahananda
interfluve. The Gandak-Kosi-Mahananda interfluve manifests numerons oxbow lakes, tals,
abandoned channels and meander scrolls. In the extreme north the tarai (wet land) is
followed by subtarai belt of marshy land with intervening patchy occurrence of upland, which
is again followed in the south by another marshy low lands, devoid of uplands. Further,
towards the South lies the upland till Ganga levee or flood plain is reached.
Bihar State Pollution Control Board [ 33 ]
3.1.1.3. PEDOLOGY :
The role of soil as natural asset of ecosystem is viewed through three angles (i)supporting agriculture & forest (ii) Supporting engineering installation and (iii) Constitutingthe medium to regulate the storage and accumulation of subsurface water.
For agricultural input the top soils of North and central Bihar are continuously underalluviation along flood plains through annual flooding and deposition. Thus the top soilcharacteristics perpetually changes and descriptions have to be viewed through temporalchange.
The Govt. of Bihar has carried out the systematic Survey of Soils of Bihar as part oftheir Five year Plan since 1954. More than 3 million hectares have been surveyed in detail,mainly to meet the needs of the irrigational Command Area Development Agencies andthe Advance planning wing of the Irrigation department, Government of Bihar.
Soils of Bihar have been grouped into 24 soil associations - combination of Taxonomytypes. These are summarised in the detail index to the soil association map presented inPlate No. 5(B). These soils are covered by seven orders, viz affisols, entisols, inceptisols,ultisols, aridisols, mollisols and histosols [Plate 5(A)]. The detailed surveys are confined tothe command areas of major river system, viz. Son. Gandak and Kosi and the informationpresented are skewed in favour of local ground setting.
Soil of Central Bihar
Soil of central Bihar have evolved largely on the alluvium of the Son and the severalsmaller river systems, namely the Karmanasa, Punpun, Phalgu, Panchane, Sakri, Harohar,Badua and Chandan draining the northern slopes of the Chotanagpur Plateau. The soilsare basically an outcome of landform, climate, landuse, topography, time and parentmaterial, which have been well considered during the pedological investigation. The varioussoils of the area are summarized below.
Colluvial Soil : To the immediately north of the Rohtas and Chotanagpur plateaumargin, the colluvial soil occur in a narrow belt with light texture and poor fertility, highslope and undulating topography. They comprises angular gravelliferrous, silty and loamyclay.
Sedentary Soil : They have been studied in detail in Nawada district and are reddish
Bihar State Pollution Control Board[ 34 ]
brown to pale yellow in colour and light to medium texture. They are slightly acidic to neutral(pH = 6.1-7.8), low in soluble salts, low to medium in organic carbon (0.02-1.2%), low tohigh in available P2O5 (7-86.5 kg/ha) and high in available K2O (105-440 kg/ha). Theycomprise an association of vertisols, entisols, alffisols and ultisols.
Alluvial Soils : These are prominently developed in the mid - plains in parts ofSasaram and Bhojpur districts west of Son, North of Rajgir hills in parts of Patna, Jehanabadand Gaya districts and along an east-west belt fringing the Tal belts of Soils in parts ofMunger-Bhagalpur districts, on the Southern bank of Ganga. These are light coloured poorlyfertile soils, that develop cracks on drying. They are mainly an association of vertisols (SoilAssnl. 11) and rest of the plain is covered by soil association (Soil Assn. 12) [Refer MapPlate No. 5(B)]. They are mildly acidic to neutral in reactivity but locally mildly alkaline (pH= 6.8-8.4). They are low in free CaCO3 (0.59-5.30%), poor in soluble salts, low to high inavailable P2O5 (18-65 kg/ha) and available K2O (15-744 kg/ha). The soils are oftencharacterized by ferruginous and calcium carbonate concretions, either throughout the profileor confined to the lower layers. Along the foothills of Adhaura range the soils are yellowishred to yellow alfisols (soil Assn. 14). The Tal belt South of Ganga is some 8 to 15 km wide.The soils are dark coloured and heavy textured and are alkaline (pH-7.0-0.8). The soilscomprise variants of Vertisols (Soil Assn. 10). In the topographic low micro-watershed areasheavy textured soils comparable to black cotton soils or vertisoils.
Diara Soil : Soils developed along the Ganga river banks are whitish to light grey incolour and alkaline with pH of around 8.0 and moderately fertile (Soil Assn. 8).Noncalcareous levee soils are found along the banks of the Son, the Phalgu, Kiul, Chandanand other rivers. They are light in texture and poor in fertility. (Soil Assn. 7).
Soils of North Bihar Plains
The soils largely falls under entisols with several variations brought about due tovagaries of highly mobile fluvial sedimentation. Soils of older landform have developedferruginous and calcareous concretions and an pedalfar horizon.
Sedentary Soil : These soils are sandy to loamy in texture and are brown to yellowand grey in colour. Generally of a meter-scale thickness, the soils support forest and tallgrases and are rich in organic matter. They are developed over the Siwalik sediments ofwest Champaran districts.
Bihar State Pollution Control Board [ 35 ]
Tarai Soil : Along the border of Nepal and South of the Siwalik Hills are the taraisoils, occuring over a belt 3 to 8 km. wide. In the western parts these soils are unusuallyheavy in texture and have neutral to moderately acidic reactions. Towards the SE lighttextured soils are present due to the influence of the Kosi and Mahananda rivers.
Soils in Megafans and Interfluve
The Kosi megafans supports soils that are light coloured, coarse to medium texturedand notably micaceous. The soils are moderetely acidic to lightly alkaline (pH - 5.8-8.1)with low free CaCO3 content and low free P2O5 (4.6-24.8 kg/ha), low soluble salts and lowto occasionally high organic carbon. These soils often poses problems of acidity. However,some of the low lying areas, as for example SE of Saharsa, (The Babhangaon-Nawabganjassociation) support soils with olive-green colour, sandy-loam texture, high alkalinity (pH -7.7-8.2) with problems of water logging and alkalinity.
The Gandak fluvial regime is generally characterised by light to dark-grey soils inthe uplands and olive-grey to olive-green soils in the low lying areas. They have medium toheavy texture, low permeability, moderate to strong alkaline reactivity (pH - 6.8-8.4, risingto > 10% in places) and low to high free CaCO3 (to 15%). Free P2O5 Content is variable(14-396 kg/ha), variable organic carbon (0.17-0.81%) and generally high free K2O (14-396kg/ha). Potash content in the Paharpur-Harsih area of East Champaran is as high as 1320kg/ha. CaCO3 content in these soils is also high (10.1-58-6%). In several areas, as forexample in the Barharia-Panchrukhi-Manjhi area of Siwan and Gopalganj districts, saltaffected soils cover large areas.
Another distinctive belt of soils extend from Motihari, Sitamarhi, Madhubani andDarbhanga and ends upto where it abuts the curvilinear course of the Kosi. This belt istraceable further and abruptly ends against the western limits of the Kosi Megafan. Soilsalong this belt are non-calcareous and non-saline. They are characterised by light grey togrey and olive-grey colour, medium to heavy texture, moderate to slow permeability, highalkalinity (pH - 8.2-8.5) and high free CaCo3 Content (>15%).
3.1.1.4. SURFACE WATER
The hydro-morphometric parameters of the various river basins of North Bihar Plain
are summarised in table 9 and also represented at plate no. 6

Bihar State Pollution Control Board[ 36 ]
TABLE - 9
Characteristics of river classes (Sinha & Friend, 1994)
Parameter Mountain Foothill Plain Mixed Order of
Fed (Mt) Fed Fed Fed Magnitude
(Gandak & (Ft.) (Pl.) (MX)
Kosi) (Bagmati) (Burhi (Kamla-
Gandak) Balan)
1 2 3 4 5 6
1. Catchment Very large Moderate Moderate Small Mt>Ft>Pl>Mx
Area
2. Total length Very large Moderate Moderate Small Mt>Ft>Pl>Mx
3. W/D ratio High Low Low Low Mt>Ft>Mx>Pl
(u/s) (u/s<d/s) (u/s<d/s)
4. Channel Braided Braided (u/s) Meander Braided (u/s)
Pattern throughout Meander (d/s) Meander (d/s)
5. Sinuosity Low Moderate High High Mx>Pl>Ft>Mt
6. Discharge Peak Moderate Very Very Mx>Ft>Mx>Pl
Peak Moderate Moderate
Peak Peak
Very high Low Very Low Very Low
Early rise Monsoonal Monsoonal Monsoonal
(u/s<d/s) (u/s<d/s) (u/s<d/s) (Ft<Pl)
7. Sediment Very Low High Fairly High High Mx>Pl>Ft>Mt
Concen-
tration
8. C/F Vs. Stable Decreasing Decreasing
discharge
9. Sediment Very High Low Fairly high High Mt>Pl>Mx>Ft
Yield
u/s, m/s and d/s distinguish stations that are upstream, middle and downstream relative
to each other.
C/F = Critical Flow

Bihar State Pollution Control Board [ 37 ]
TABLE - 10
Catchment characteristics of North Bihar Plains (Sinha & Jain, 1998)
River Total lenth Total Catchment Upland/Plains
(km) (km) area ratio
1 2 3 4
Gandak 625 260 45035 4188 3.33
Kosi 736 260 59503 11410 5.31
Burhi Gandak 431 320 13191 9601 0.00
Bagmati 330 394 8439 6500 0.68
Kamla-Balan 226 120 11347 4488 0.19
Total Catchment area The area of the catchment measured from the source of
the river to the confluence of the mouth with the Ganga.
Length Total river length from the source to the site or to the
confluence with the Ganga.
Upland / Plains area ratio Ratio of the catchment area above the mountains from
to that below this.
The Water Sediment Flux as measured at different stations have estimated that the
water transferred is of the order of 1298×1011 kg/yr. and the sediment transferred is of the
tune of 161×109 kg/yr.
The central Bihar rivers e.g. Karmnasa, Durgawati and Dhamauti take their rise at
Rohtasgarh Plateau with NE trending lineament. They drain down the Ganga-Son interfluve.
The other important river Son flows along the faulted southern margin of the Rohtasgarh
plateau. It takes turn, around the eastern edge of Rohtasgarh plateau, towards NE and
drains into Ganga near Maner.
The other rivers are Punpun-Morhar group, which merges and flows into Ganga.
Several other streams e.g., Dardha, Phalgu, Paimar, Dhadhar and Sakri emerge from
Chotanagpur Plateau. These rivers have tendency, along Jehanabad-Munger axis to split
Bihar State Pollution Control Board[ 38 ]
into number of small distributory streams and rejoins to finally form a stream that runs
close to and parallel to Ganga and joins Ganga near Surajgarha. The Barnar and Kiul rivers
draining the NE extremities of Bihar Mica belt also meet this stream before merging with
Ganga. The stream e.g., Badua and Chandan, draining the southern upland, flows directly
into the Ganga. Catchment characteristics of north Bihar plains are shown in Table 10.
The Waterlogging in the Bihar State is mainly due to surface ponding of water during
rainy season. The riverbeds in the state are full of silt and there are poor drainage
conditions, which result in accumulation of water in Kharif season and subsequently in rabi
and summer seaon depending upon water volume. Erratic rainfall and poor sub surface
drainage area also cause for waterlogging in the state. Exessive canal irrigation in rabi
season is also cause for waterlogging of seasonal nature in many commands of Bihar. In
many command areas falling in North Bihar, rice is cultivated in most of the chaur or
depression areas where standing water can be seen in rainy season and even in winter.
Farmers throw seeds in the chaur during May-June. During rainy season when the water
gets accumulated in the depression or chaur, height of rice plant increases. The crop is
ready to harvest after water recession. Sometimes if the water remains in the chaur, then
the rice crop will remain as it is. Harvesting mainly depends upon rainfall and amount of
water in the chaur. Total waterlogged area in Bihar is 627.888 thousand ha. The twin problem
of waterlogging and soil salinity caused by natural or anothropogenic processes is a
majorenvironmental hazard and threat to agricultural production. Crop growth reduction
due to salinity is generally related with higher osmotic potential of soil solution in the root
zone. As salinity levels increase, the plant must spend more energy to take up water from
the same soil water pool. high soil salinity can also cause nutrient imbalances, result in the
accumulation of toxic elements. Besides, salinization causes loss of large areas of formerly
productive lands. In fact, the irrigation development in the arid zone usually has to deal with
secondary as well as with primary and fossil salinity. This primary and fossil salt mobilization
Bihar State Pollution Control Board [ 39 ]
has been found to be one of the principal causes of the river's salinization in irrigated basins in
the arid zone. Waterlogging has very bad effect on the ecosystem like temperature stratification,
variation in nutrient contents and dissolved oxygen at different level. Reduced dissloved oxygen
affects the aquatic and riparian lives. The methane gas released by waterlogged area is an
element of green house effect. Due to waterlogging, major diseases as malaria, polio, foot rot,
liver fluke infestation and other diseases of animals and plants (as root-rots) also occurs. So
there is an urgent need to remove the congestion of drainage and to reclaim these areas for
better environmental condition.
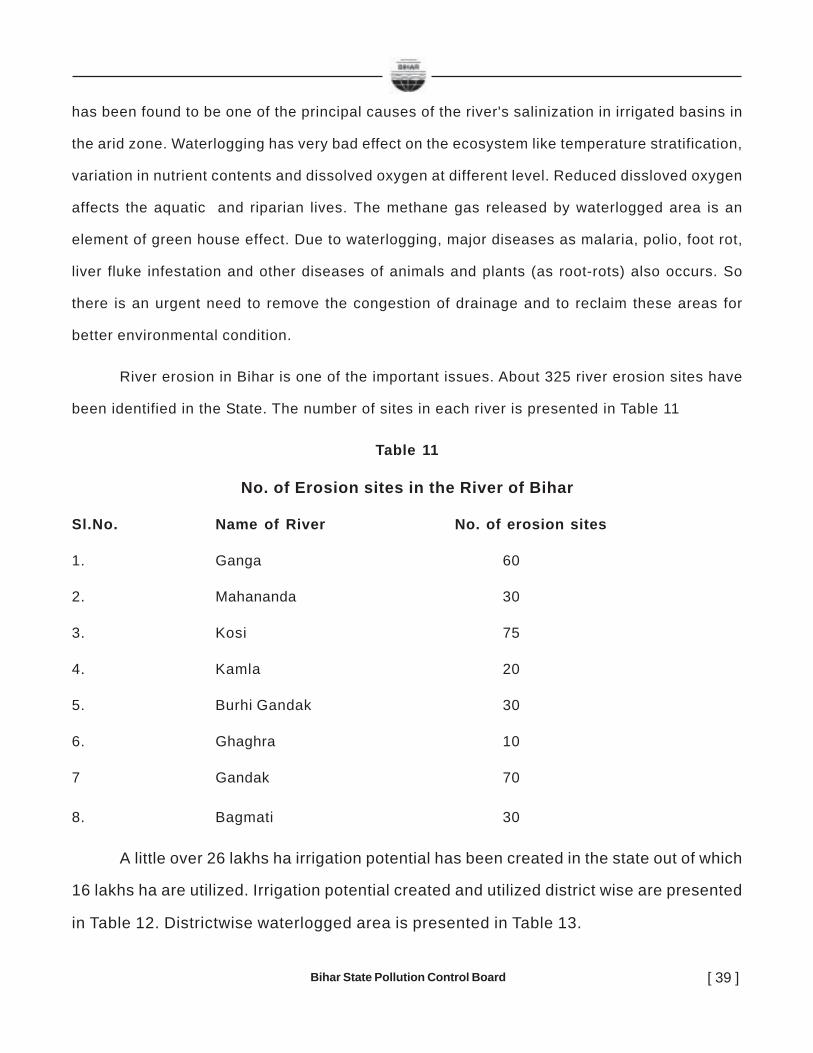
River erosion in Bihar is one of the important issues. About 325 river erosion sites have
been identified in the State. The number of sites in each river is presented in Table 11
Table 11
No. of Erosion sites in the River of Bihar
Sl.No. Name of River No. of erosion sites
1. Ganga 60
2. Mahananda 30
3. Kosi 75
4. Kamla 20
5. Burhi Gandak 30
6. Ghaghra 10
7 Gandak 70
8. Bagmati 30
A little over 26 lakhs ha irrigation potential has been created in the state out of which
16 lakhs ha are utilized. Irrigation potential created and utilized district wise are presented
in Table 12. Districtwise waterlogged area is presented in Table 13.

Bihar State Pollution Control Board[ 40 ]
IRR
IGA
TIO
N P
OTE
NTI
AL
CR
EATE
D A
ND
UTL
ISED
, DIS
TRIC
T W
ISE
(in
lakh
ha.
)
Irrig
atio
n Po
tent
ial C
reat
ed
Irrig
atio
n Po
tent
ial U
tilis
ed
Sl.
No.
D
istr
ict
Kha
rif
Rab
bi
Gar
ma
Tota
l K
harif
R
abbi
G
arm
a To
tal
1 2
3 4
5 6
7 8
9 10
1.
A
uran
gaba
d 1.
508
0.22
7 0.
000
1.73
5 1.
261
0.24
5 0.
000
1.50
6 2.
G
aya
0.40
5 0.
080
0.00
0 0.
485
0.14
9 0.
029
0.00
0 0.
178
3.
Arw
al
0.32
2 0.
049
0.00
0 0.
371
0.22
6 0.
031
0.00
0 0.
257
4.
Bho
jpur
0.
907
0.56
7 0.
000
1.47
4 0.
736
0.38
1 0.
000
1.11
7 5.
B
uxar
0.
655
0.45
9 0.
000
1.11
4 0.
523
0.32
1 0.
000
0.84
4 6.
R
ohta
s 2.
521
1.13
4 0.
000
3.65
5 2.
043
0.71
8 0.
000
2.76
1 7.
K
aim
ur
0.95
9 0.
540
0.00
0 1.
499
0.81
7 0.
350
0.00
0 1.
167
8.
Pat
na
0.02
0 0.
082
0.00
0 0.
102
0.30
7 0.
018
0.00
0 0.
325
9.
Nal
anda
0.
310
0.05
3 0.
000
0.36
3 0.
147
0.01
2 0.
000
0.15
9 10
. N
awad
a 0.
350
0.04
3 0.
000
0.39
5 0.
158
0.01
0 0.
000
0.16
8 11
. S
hekh
pura
0.
139
0.02
5 0.
000
0.16
4 0.
091
0.00
6 0.
000
0.09
7 12
. Je
hana
bad
0.36
0 0.
060
0.00
0 0.
420
0.16
7 0.
014
0.00
0 0.
181
13.
Lakh
isar
ai
0.37
6 0.
060
0.00
0 0.
436
0.26
3 0.
044
0.00
0 0.
307
14.
Bha
galp
ur
0.15
5 0.
029
0.00
0 0.
184
0.11
5 0.
022
0.00
0 0.
137
15.
Mun
ger
0.28
8 0.
053
0.00
0 0.
341
0.21
3 0.
041
0.00
0 0.
254
16.
Jam
ui
0.28
9 0.
057
0.00
0 0.
346
0.22
8 0.
044
0.00
0 0.
272
17.
Ban
ka
1.01
8 0.
211
0.00
0 1.
229
0.76
2 0.
162
0.00
0 0.
924
Tota
l (C
entr
al B
ihar
) 10
.584
3.
729
0.00
0 14
.313
8.
205
2.44
8 0.
000
10.6
53
18.
Wes
t Cha
mpa
ran
1.39
5 0.
775
0.15
8 2.
328
0.77
25
0.33
6 0.
081
1.18
95
19.
Eas
t Cha
mpa
ran
0.66
5 0.
338
0.06
9 1.
072
0.34
0.
145
0.03
5 0.
52
20.
Sar
an (C
hhap
ra)
0.52
1 0.
400
0.01
9 0.
940
0.39
9 0.
179
0.00
0 0.
578
21.
Siw
an
0.83
3 0.
451
0.02
2 1.
306
0.64
1 0.
203
0.00
0 0.
844
22.
Gop
alga
nj
0.72
9 0.
474
0.02
5 1.
228
0.55
3 0.
215
0.00
0 0.
768
23.
Muz
affa
rpur
0.
255
0.11
8 0.
021
0.39
4 0.
098
0.01
4 0.
000
0.11
2 24
. V
aish
ali
0.01
3 0.
024
0.00
4 0.
041
0.02
4 0.
003
0.00
0 0.
027
25.
Sup
aul
0.84
9 0.
295
0.20
7 1.
351
0.41
4 0.
000
0.00
0 0.
414
26.
Mad
hepu
ra
0.40
0 0.
085
0.05
8 0.
543
0.20
5 0.
000
0.00
0 0.
205
27.
Pur
nia
0.39
0 0.
182
0.10
3 0.
675
0.19
3 0.
000
0.00
1 0.
194
28.
Ara
ria
0.31
6 0.
185
0.10
8 0.
609
0.14
6 0.
000
0.00
1 0.
147
29.
Kat
ihar
0.
044
0.04
4 0.
024
0.11
2 0.
017
0.00
0 0.
000
0.01
7 30
. S
ahar
sa
0.10
9 0.
060
0.04
2 0.
211
0.06
2 0.
000
0.00
0 0.
062
31.
Mad
huba
ni
0.78
0.
137
0.07
9 0.
996
0.41
3 0.
007
0.00
0 0.
420
Tota
l (N
orth
Bih
ar)
7.29
9 3.
568
0.93
9 11
.806
4.
277
1.10
2 0.
118
5.49
7 G
rand
Tot
al
17.8
83
7.29
7 0.
939
26.1
19
12.4
82
3.55
0 0.
118
16.1
50
Tabl
e - 1
2
Bihar State Pollution Control Board [ 41 ]
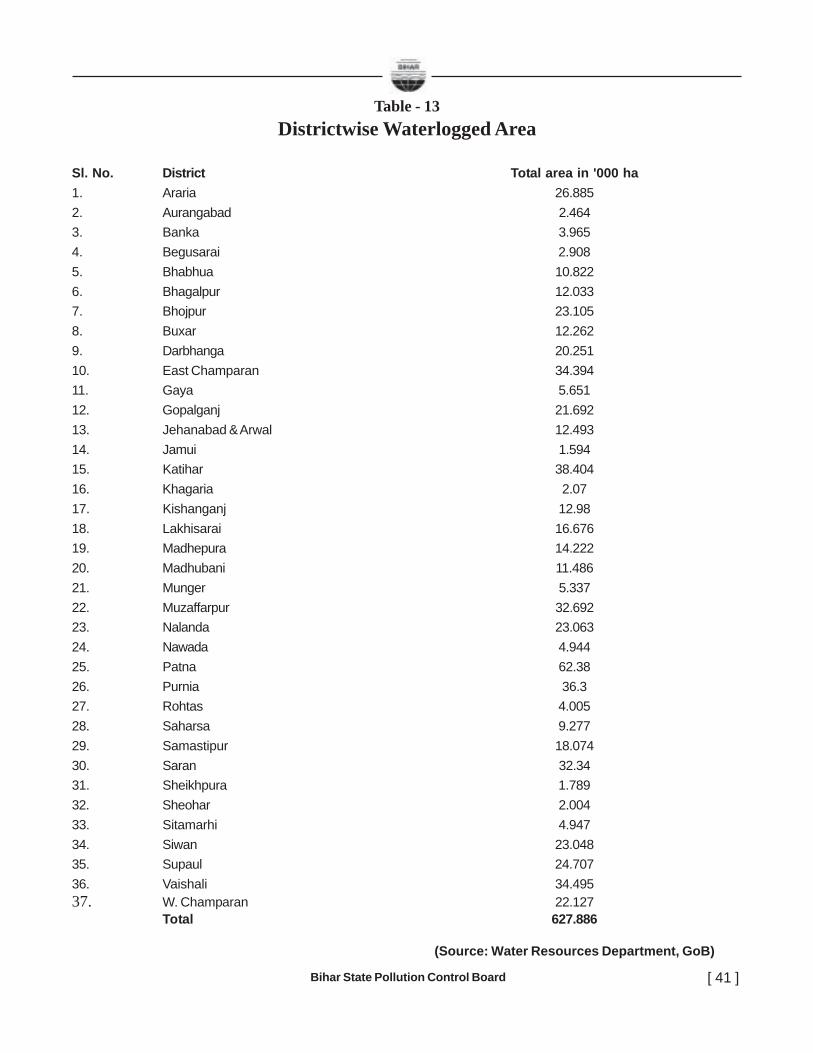
Table - 13Districtwise Waterlogged Area
Sl. No. District Total area in '000 ha1. Araria 26.8852. Aurangabad 2.4643. Banka 3.9654. Begusarai 2.9085. Bhabhua 10.8226. Bhagalpur 12.0337. Bhojpur 23.1058. Buxar 12.2629. Darbhanga 20.25110. East Champaran 34.39411. Gaya 5.65112. Gopalganj 21.69213. Jehanabad & Arwal 12.49314. Jamui 1.59415. Katihar 38.40416. Khagaria 2.0717. Kishanganj 12.9818. Lakhisarai 16.67619. Madhepura 14.22220. Madhubani 11.48621. Munger 5.33722. Muzaffarpur 32.69223. Nalanda 23.06324. Nawada 4.94425. Patna 62.3826. Purnia 36.327. Rohtas 4.00528. Saharsa 9.27729. Samastipur 18.07430. Saran 32.3431. Sheikhpura 1.78932. Sheohar 2.00433. Sitamarhi 4.94734. Siwan 23.04835. Supaul 24.70736. Vaishali 34.49537. W. Champaran 22.127
Total 627.886
(Source: Water Resources Department, GoB)
Bihar State Pollution Control Board[ 42 ]
3.1.1.5. GROUND WATER :
The water bearing properties are the main guiding lines for grouping the geological
formations of Bihar. On this basis, four main subdivisions are made;
A Main alluvial basin with good ground water potentialities having considerable
granulose zone with effective porosity.
B. Marginal alluvial terrain which forms a part of the alluvial tract, but is dominated by
finer clastics or inadequate alluvial thickness and granular horizons fringing the hard
rock terrain and the localised alluvial pockets in the rocky terrain, viz; near rivers and
in valleys (20-30 m of alluvium).
C. Hard rock terrain, comprising the entire Archaean terrain and Vindhyan hill areas with
very little groundwater potentialities.
D. Soft rock areas, viz; Gondwana and Tertiary areas.
Hydrogeological parameters of the state has been depicted in the [Plate No. 7 (A &
B)]. On the basis of geological and geomorphological set up and characteristics of aquifers,
Bihar can be divided into two broad hydrogelogical units, (1) fissured formations and (2)
porous formations. The details of the characterisation of consolidated/ semi-consoliated /
unconsolidated formations in terms of age group, lithology, hydrogeological conditions and
ground water potential are summarised in the Plate No. 7 (A) & 7 (B).
3.1.1.6. LAND USE
The land use parameter plays an important role in agricultural economics. In Bihar
more than 80% of the area is cultivable land out of which 60% is under net sown area
(Refer Plate 8). The forest land constitutes 7% of the total area. More than 80% of the
population depends on agricultural activity and the average holding is less than 0.4 ha.
One of the leading problems of Bihar is to find how best the land use is made effective in
Bihar State Pollution Control Board [ 43 ]
order to have intensive agricultural output.
In the districts of Patna, Nalanda, Bhojpur, Rohtas, Buxar, Kaimur and Jehanabad all
the aerable lands are under cultivation because of the availability of assured irrigation
either through tube-wells or canals. The area under more than one crop yield is variable in
different districts. In Patna and Nalanda districts it covers very close to cent per cent. The
net area sown in Saran, Gopalganj and Siwan comes to 98%, in Muzaffarpur, Sitamarhi,
Seohar and Vaishali districts it is 95%, in Madhubani, Darbhanga and Samastipur it is
87% in Gaya, Aurangabad and Jehanabad it is 86.7% and in Purbi and Paschim Champaran
it is 84%. The existing land use pattern could be grouped under following nine classes :
(i) Pure agricultural area (61%)
(ii) Culturable wastelands (10.7%)
(iii) Barren and inculturable land (2.1%)
(iv) Orchards (1.7%)
(v) Aerable waste land (1.1%)
(vi) Non-aerable land (13%) under other than agriculture
(vii) Pasteures (0.4%)
(viii) Forest (7%)
(ix) Rock & Reh land (3%)
Bihar State Pollution Control Board[ 44 ]
3.1.2.1. Meteorology
The state has a tropical monsoon climate with three distinct seasons-winter, summer
and rainy. The climatic conditions of state vary with its physiographic set-up. Broadly the
state can be divided into three climate zones.
(a) The Sub-Himalayan zone (b) The Ganga plains zone and (c) The parts of
Chotanagpur plateau zones of South Bihar.
(a) The Sub-Himalayan zone : The Sub-Himalayan zone in the northern part ofthe state receives high incidence of rainfall over 1400 mm, bulk of which is found to occur
during the monsoon season from June to September. The mean maximum temprature is
43°C and the mean minimum temperature is 4°C.
(b) The Ganga plains : The Ganga plains zone forms an excessive bowl of warm
air, especially during day time. The mean maximum daily temperature even the coldest
month (January) nowhere falls below 21°C. Hot season in the zone covers the period fromApril to June, May being the hottest month in the greater part of the area. West of Gaya the
daily mean maximum temperature in May rises to 40°c and above, the mean daily maximum
air temperature being as high as 41.3°C at Gaya. The cold weather period extends fromDecember to February, January being the coldest month when temperature falls below 10°C,
especially in the valley west of Gaya where daily maximum temperature for the month of January
touches 10.1°C. In lower Ganga plain, the minimum temperature is somewhat higher being11°C at Patna. The onset of monsoon normally occurs in early June in the Lower Bengal and by
the end of July, the monson establishes itself over the entire Gang Plain and results in heavy
downpour and triggered off everywhere till the end of September. The geographic distributionof the mean annual rainfall is shown by contours in the Plate No. 9.
(c) The parts of Chotanagpur plateau: The maximum summer temperature
ranges from 46°C in the western part to 42°C in the east, the annual rainfall ranges from800 mm in the western part to 600 m in the eastern part.
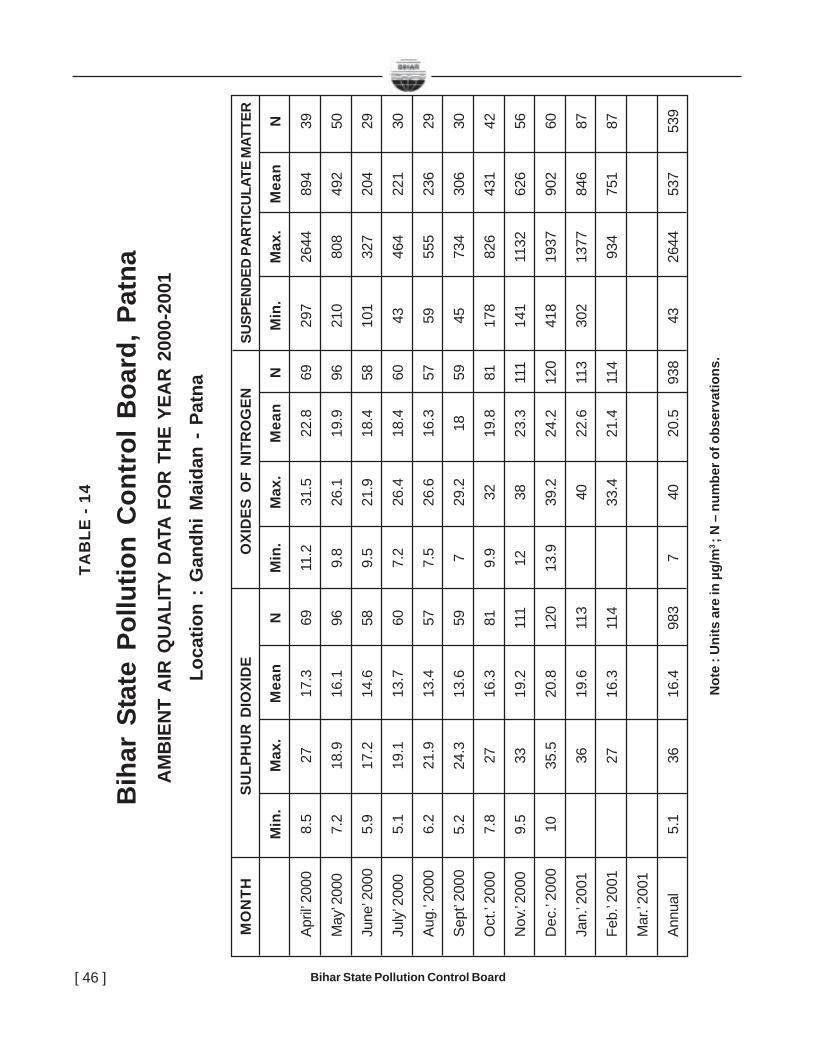
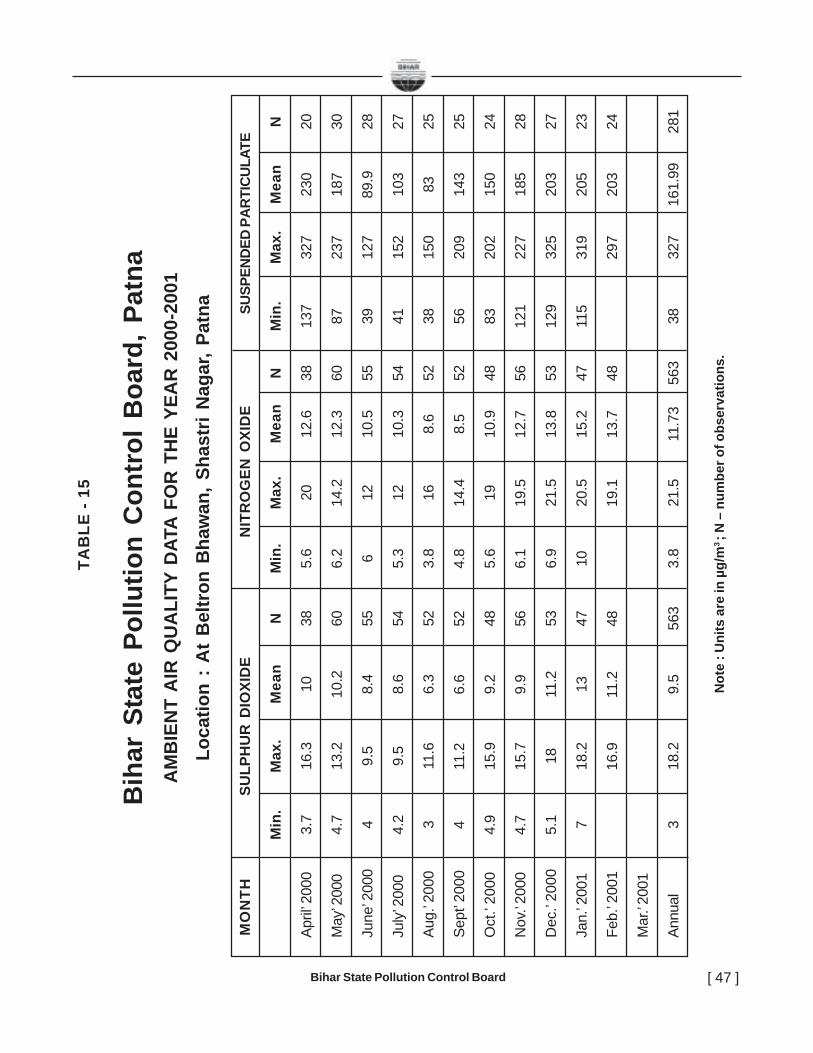
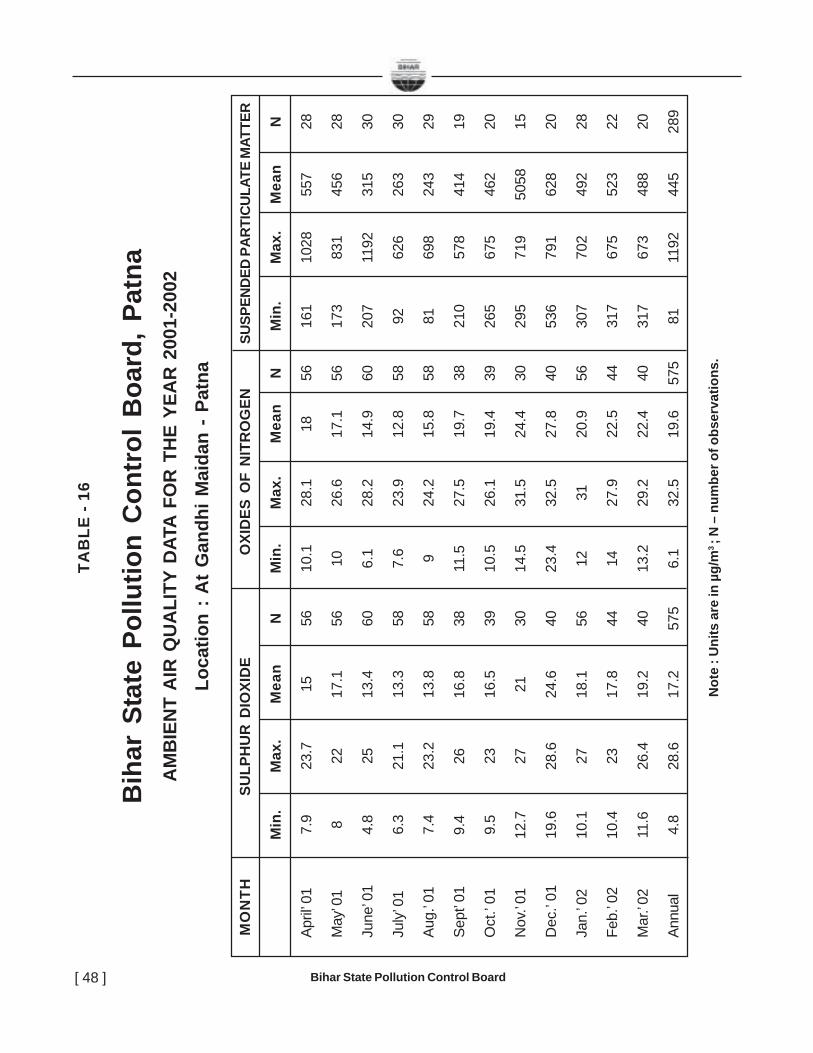
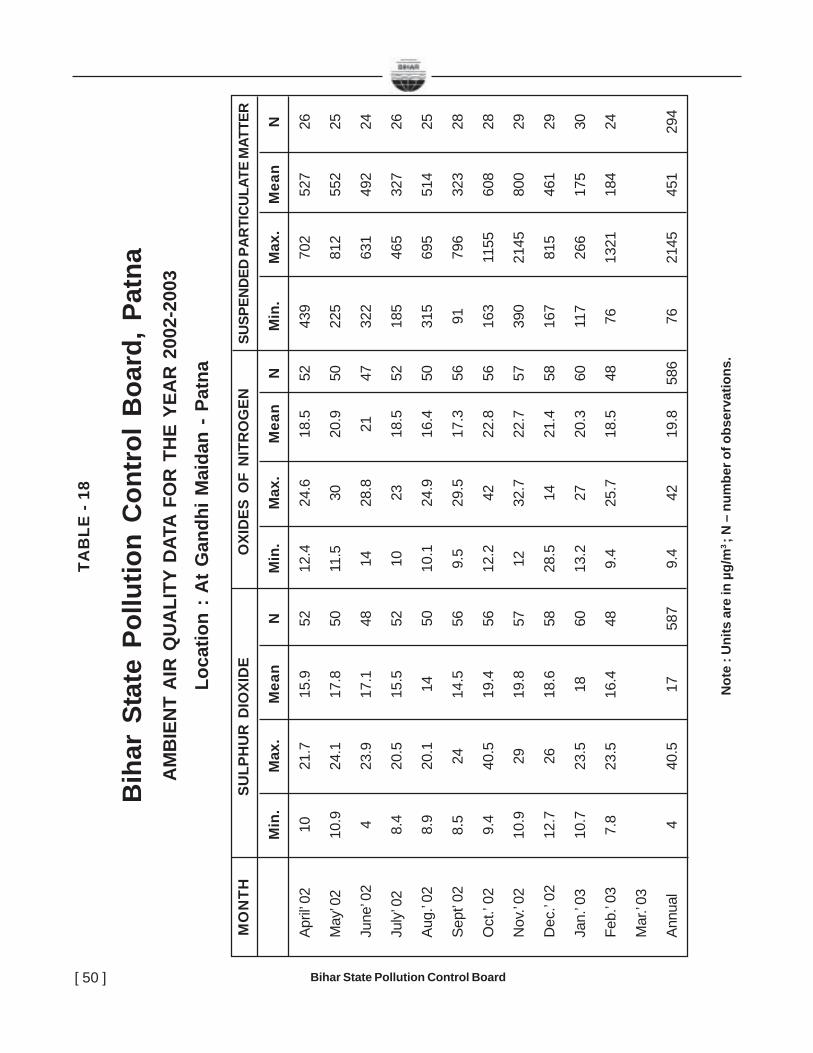
3.1.2.2. Air quality
The raw data on Air quality for Shastri Nagar and Gandhi Maidan, Patna for the period2000-01 to 2004-05 are presented in Table No.14 to 23.
Bihar State Pollution Control Board [ 45 ]
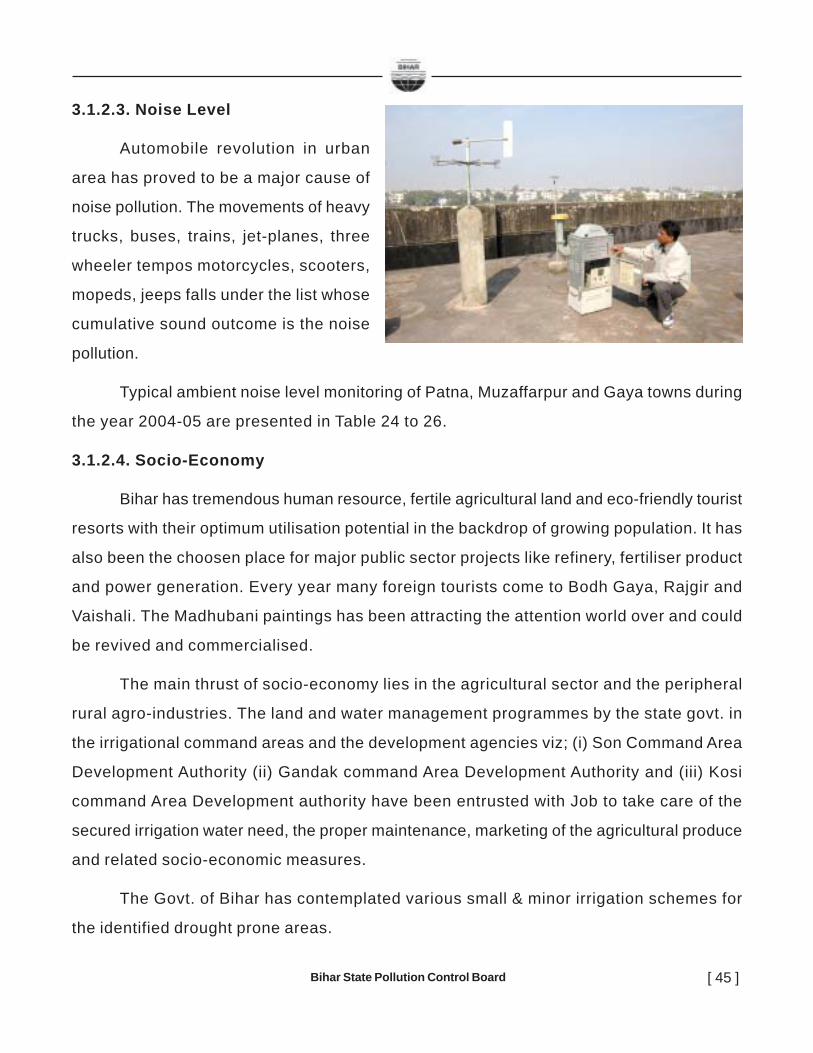
3.1.2.3. Noise Level
Automobile revolution in urban
area has proved to be a major cause of
noise pollution. The movements of heavy
trucks, buses, trains, jet-planes, three
wheeler tempos motorcycles, scooters,
mopeds, jeeps falls under the list whose
cumulative sound outcome is the noise
pollution.
Typical ambient noise level monitoring of Patna, Muzaffarpur and Gaya towns during
the year 2004-05 are presented in Table 24 to 26.
3.1.2.4. Socio-Economy
Bihar has tremendous human resource, fertile agricultural land and eco-friendly tourist
resorts with their optimum utilisation potential in the backdrop of growing population. It has
also been the choosen place for major public sector projects like refinery, fertiliser product
and power generation. Every year many foreign tourists come to Bodh Gaya, Rajgir and
Vaishali. The Madhubani paintings has been attracting the attention world over and could
be revived and commercialised.
The main thrust of socio-economy lies in the agricultural sector and the peripheral
rural agro-industries. The land and water management programmes by the state govt. in
the irrigational command areas and the development agencies viz; (i) Son Command Area
Development Authority (ii) Gandak command Area Development Authority and (iii) Kosi
command Area Development authority have been entrusted with Job to take care of the
secured irrigation water need, the proper maintenance, marketing of the agricultural produce
and related socio-economic measures.
The Govt. of Bihar has contemplated various small & minor irrigation schemes for
the identified drought prone areas.
Bihar State Pollution Control Board[ 46 ]
Bih
ar S
tate
Pol
lutio
n C
ontr
ol B
oard
, Pa
tna
AM
BIE
NT
AIR
QU
ALI
TY D
ATA
FOR
TH
E YE
AR
200
0-20
01Lo
catio
n :
Gan
dhi M
aida
n -
Patn
a
Not
e : U
nits
are
in µ
g/m
3 ; N
– n
umbe
r of o
bser
vatio
ns.
TAB
LE -
14
MO
NTH
SULP
HU
R D
IOXI
DE
OXI
DES
OF
NIT
RO
GEN
SUSP
END
ED P
AR
TIC
ULA
TE M
ATTE
R
Min
.M
ax.
Mea
nN
Min
.M
ax.
Mea
nN
Min
.M
ax.
Mea
nN
April
’ 200
08.
527
17.3
6911
.231
.522
.869
297
2644
894
39
May
’ 200
07.
218
.916
.196
9.8
26.1
19.9
9621
080
849
250
June
’ 200
05.
917
.214
.658
9.5
21.9
18.4
5810
132
720
429
July
’ 200
05.
119
.113
.760
7.2
26.4
18.4
6043
464
221
30
Aug.
’ 200
06.
221
.913
.457
7.5
26.6
16.3
5759
555
236
29
Sept
’ 200
05.
224
.313
.659
729
.218
5945
734
306
30
Oct
.’ 20
007.
827
16.3
819.
932
19.8
8117
882
643
142
Nov
.’ 200
09.
533
19.2
111
1238
23.3
111
141
1132
626
56
Dec
.’ 20
0010
35.5
20.8
120
13.9
39.2
24.2
120
418
1937
902
60
Jan.
’ 200
136
19.6
113
4022
.611
330
213
7784
687
Feb.
’ 200
127
16.3
114
33.4
21.4
114
934
751
87
Mar
.’ 200
1
Annu
al5.
136
16.4
983
740
20.5
938
4326
4453
753
9
Bihar State Pollution Control Board [ 47 ]
Bih
ar S
tate
Pol
lutio
n C
ontr
ol B
oard
, Pa
tna
AM
BIE
NT
AIR
QU
ALI
TY D
ATA
FOR
TH
E YE
AR
200
0-20
01Lo
catio
n :
At
Bel
tron
Bha
wan
, Sha
stri
Nag
ar, P
atna
Not
e : U
nits
are
in µ
g/m
3 ; N
– n
umbe
r of o
bser
vatio
ns.
TAB
LE -
15
MO
NTH
SULP
HU
R D
IOXI
DE
NIT
RO
GEN
OXI
DE
SUSP
END
ED P
AR
TIC
ULA
TE
Min
.M
ax.
Mea
nN
Min
.M
ax.
Mea
nN
Min
.M
ax.
Mea
nN
April
’ 200
03.
716
.310
385.
620
12.6
3813
732
723
020
May
’ 200
04.
713
.210
.260
6.2
14.2
12.3
6087
237
187
30
June
’ 200
04
9.5
8.4
556
1210
.555
3912
789
.928
July
’ 200
04.
29.
58.
654
5.3
1210
.354
4115
210
327
Aug.
’ 200
03
11.6
6.3
523.
816
8.6
5238
150
8325
Sept
’ 200
04
11.2
6.6
524.
814
.48.
552
5620
914
325
Oct
.’ 20
004.
915
.99.
248
5.6
1910
.948
8320
215
024
Nov
.’ 200
04.
715
.79.
956
6.1
19.5
12.7
5612
122
718
528
Dec
.’ 20
005.
118
11.2
536.
921
.513
.853
129
325
203
27
Jan.
’ 200
17
18.2
1347
1020
.515
.247
115
319
205
23
Feb.
’ 200
116
.911
.248
19.1
13.7
4829
720
324
Mar
.’ 200
1
Annu
al3
18.2
9.5
563
3.8
21.5
11.7
356
338
327
161.
9928
1
Bihar State Pollution Control Board[ 48 ]
Bih
ar S
tate
Pol
lutio
n C
ontr
ol B
oard
, Pa
tna
AM
BIE
NT
AIR
QU
ALI
TY D
ATA
FOR
TH
E YE
AR
200
1-20
02Lo
catio
n : A
t G
andh
i Mai
dan
- Pa
tna
Not
e : U
nits
are
in µ
g/m
3 ; N
– n
umbe
r of o
bser
vatio
ns.
TAB
LE -
16
MO
NTH
SULP
HU
R D
IOXI
DE
OXI
DES
OF
NIT
RO
GEN
SUSP
END
ED P
AR
TIC
ULA
TE M
ATTE
R
Min
.M
ax.
Mea
nN
Min
.M
ax.
Mea
nN
Min
.M
ax.
Mea
nN
April
’ 01
7.9
23.7
1556
10.1
28.1
1856
161
1028
557
28
May
’ 01
822
17.1
5610
26.6
17.1
5617
383
145
628
June
’ 01
4.8
2513
.460
6.1
28.2
14.9
6020
711
9231
530
July
’ 01
6.3
21.1
13.3
587.
623
.912
.858
9262
626
330
Aug.
’ 01
7.4
23.2
13.8
589
24.2
15.8
5881
698
243
29
Sept
’ 01
9.4
2616
.838
11.5
27.5
19.7
3821
057
841
419
Oct
.’ 01
9.5
2316
.539
10.5
26.1
19.4
3926
567
546
220
Nov
.’ 01
12.7
2721
3014
.531
.524
.430
295
719
5058
15
Dec
.’ 01
19.6
28.6
24.6
4023
.432
.527
.840
536
791
628
20
Jan.
’ 02
10.1
2718
.156
1231
20.9
5630
770
249
228
Feb.
’ 02
10.4
2317
.844
1427
.922
.544
317
675
523
22
Mar
.’ 02
11.6
26.4
19.2
4013
.229
.222
.440
317
673
488
20
Annu
al4.
828
.617
.257
56.
132
.519
.657
581
1192
445
289

Bihar State Pollution Control Board [ 49 ]
Bih
ar S
tate
Pol
lutio
n C
ontr
ol B
oard
, Pa
tna
AM
BIE
NT
AIR
QU
ALI
TY D
ATA
FOR
TH
E YE
AR
200
1-20
02Lo
catio
n :
At
Bel
tron
Bha
wan
, Sha
stri
Nag
ar, P
atna
Not
e : U
nits
are
in µ
g/m
3 ; N
– n
umbe
r of o
bser
vatio
ns.
TAB
LE -
17
MO
NTH
SULP
HU
R D
IOXI
DE
NIT
RO
GEN
OXI
DE
SUSP
END
ED P
AR
TIC
ULA
TE M
ATTE
R
Min
.M
ax.
Mea
nN
Min
.M
ax.
Mea
nN
Min
.M
ax.
Mea
nN
April
’ 01
4.6
15.4
9.3
485.
715
.411
.148
163
292
220
24
May
’ 01
4.9
169.
752
5.8
21.9
1352
162
682
364
26
June
’ 01
4.9
12.9
8.9
465.
815
.810
.746
4936
327
423
July
’ 01
412
7.7
595.
214
9.4
5941
225
137
30
Aug.
’ 01
4.2
14.7
8.2
605
17.8
10.7
6065
189
126
30
Sept
’ 01
4.5
13.1
7.7
605.
114
.49.
260
6115
110
230
Oct
.’ 01
4.4
15.3
7.2
595.
617
9.3
5953
181
112
30
Nov
.’ 01
4.1
13.3
8.7
545.
318
.110
.854
8919
315
327
Dec
.’ 01
515
.410
.160
5.6
19.2
12.3
6011
326
620
430
Jan.
’ 02
4.5
158.
657
5.6
2113
.257
7727
717
729
Feb.
’ 02
4.2
12.8
8.5
606.
122
13.9
6010
936
023
930
Mar
.’ 02
512
8.9
607.
220
.713
.160
144
295
225
30
Annu
al4
168.
667
55
2211
.467
541
682
194
339
Bihar State Pollution Control Board[ 50 ]
Bih
ar S
tate
Pol
lutio
n C
ontr
ol B
oard
, Pa
tna
AM
BIE
NT
AIR
QU
ALI
TY D
ATA
FOR
TH
E YE
AR
200
2-20
03Lo
catio
n : A
t G
andh
i Mai
dan
- Pa
tna
Not
e : U
nits
are
in µ
g/m
3 ; N
– n
umbe
r of o
bser
vatio
ns.
TAB
LE -
18
MO
NTH
SULP
HU
R D
IOXI
DE
OXI
DES
OF
NIT
RO
GEN
SUSP
END
ED P
AR
TIC
ULA
TE M
ATTE
R
Min
.M
ax.
Mea
nN
Min
.M
ax.
Mea
nN
Min
.M
ax.
Mea
nN
April
’ 02
1021
.715
.952
12.4
24.6
18.5
5243
970
252
726
May
’ 02
10.9
24.1
17.8
5011
.530
20.9
5022
581
255
225
June
’ 02
423
.917
.148
1428
.821
4732
263
149
224
July
’ 02
8.4
20.5
15.5
5210
2318
.552
185
465
327
26
Aug.
’ 02
8.9
20.1
1450
10.1
24.9
16.4
5031
569
551
425
Sept
’ 02
8.5
2414
.556
9.5
29.5
17.3
5691
796
323
28
Oct
.’ 02
9.4
40.5
19.4
5612
.242
22.8
5616
311
5560
828
Nov
.’ 02
10.9
2919
.857
1232
.722
.757
390
2145
800
29
Dec
.’ 02
12.7
2618
.658
28.5
1421
.458
167
815
461
29
Jan.
’ 03
10.7
23.5
1860
13.2
2720
.360
117
266
175
30
Feb.
’ 03
7.8
23.5
16.4
489.
425
.718
.548
7613
2118
424
Mar
.’ 03
Annu
al4
40.5
1758
79.
442
19.8
586
7621
4545
129
4

Bihar State Pollution Control Board [ 51 ]
Bih
ar S
tate
Pol
lutio
n C
ontr
ol B
oard
, Pa
tna
AM
BIE
NT
AIR
QU
ALI
TY D
ATA
FOR
TH
E YE
AR
200
2-20
03Lo
catio
n :
At
Bel
tron
Bha
wan
, Sha
stri
Nag
ar, P
atna
Not
e : U
nits
are
in µ
g/m
3 ; N
– n
umbe
r of o
bser
vatio
ns.
TAB
LE -
19
MO
NTH
SULP
HU
R D
IOXI
DE
NIT
RO
GEN
OXI
DE
SUSP
END
ED P
AR
TIC
ULA
TE M
ATTE
R
Min
.M
ax.
Mea
nN
Min
.M
ax.
Mea
nN
Min
.M
ax.
Mea
nN
April
’ 02
4.2
268.
660
5.7
2011
.959
200
304
261
30
May
’ 02
4.5
12.5
8.1
595.
218
.211
.259
138
287
215
30
June
’ 02
413
8.3
534.
917
11.3
5310
227
118
327
July
’ 02
412
.87.
759
4.8
15.9
9.7
5951
334
144
30
Aug.
’ 02
4.6
10.8
7.5
595.
613
.99.
359
4120
893
30
Sept
’ 02
4.7
127.
560
3.9
15.2
9.1
6040
211
9630
Oct
.’ 02
4.5
13.1
8.6
595
17.7
10.5
5945
198
125
30
Nov
.’ 02
518
.59.
360
620
.811
.360
9922
714
130
Dec
.’ 02
5.2
40.5
9.1
606.
416
.710
.960
3576
515
230
Jan.
’ 03
511
.87.
959
6.1
14.1
9.7
6037
107
6830
Feb.
’ 03
4.7
13.5
8.1
605.
417
10.1
6024
277
113
30
Mar
.’ 03
Annu
al4
40.5
8.2
648
3.9
20.8
10.5
648
2476
514
4.6
327

Bihar State Pollution Control Board[ 52 ]
Bih
ar S
tate
Pol
lutio
n C
ontr
ol B
oard
, Pa
tna
AM
BIE
NT
AIR
QU
ALI
TY D
ATA
FOR
TH
E YE
AR
200
3-20
04Lo
catio
n : A
t G
andh
i Mad
an -
Pat
na
TAB
LE -
20
MO
NTH
SULP
HU
R D
IOXI
DE
OXI
DES
OF
NIT
RO
GEN
SUSP
END
ED P
AR
TIC
ULA
TE M
ATTE
R
Min
.M
ax.
Mea
nN
Min
.M
ax.
Mea
nN
Min
.M
ax.
Mea
nN
Dec
.’ 03
8.1
36.4
15.4
484.
514
6.9
62.2
4813
763
436
224
Jan.
’ 04
8.1
2313
.462
4.5
121.
252
.466
146
327
236
32
Feb.
’ 04
8.9
125.
321
.340
4.5
122
68.6
4221
052
332
720
Mar
.’ 04
Annu
al8.
112
5.3
16.7
150
4.5
146.
961
.115
613
763
430
876
Not
e : U
nits
are
in µ
g/m
3 ; N
– n
umbe
r of o
bser
vatio
ns.
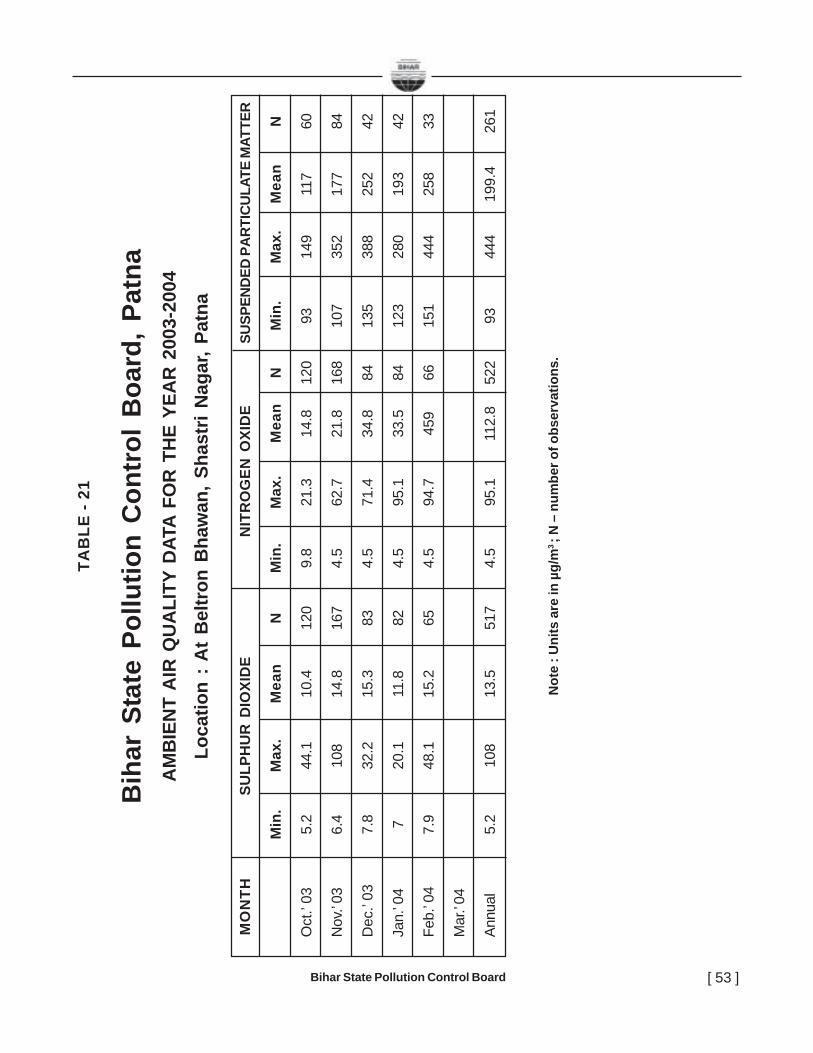
Bihar State Pollution Control Board [ 53 ]
Bih
ar S
tate
Pol
lutio
n C
ontr
ol B
oard
, Pa
tna
AM
BIE
NT
AIR
QU
ALI
TY D
ATA
FOR
TH
E YE
AR
200
3-20
04Lo
catio
n :
At
Bel
tron
Bha
wan
, Sha
stri
Nag
ar, P
atna
TAB
LE -
21
MO
NTH
SULP
HU
R D
IOXI
DE
NIT
RO
GEN
OXI
DE
SUSP
END
ED P
AR
TIC
ULA
TE M
ATTE
R
Min
.M
ax.
Mea
nN
Min
.M
ax.
Mea
nN
Min
.M
ax.
Mea
nN
Oct
.’ 03
5.2
44.1
10.4
120
9.8
21.3
14.8
120
9314
911
760
Nov
.’ 03
6.4
108
14.8
167
4.5
62.7
21.8
168
107
352
177
84
Dec
.’ 03
7.8
32.2
15.3
834.
571
.434
.884
135
388
252
42
Jan.
’ 04
720
.111
.882
4.5
95.1
33.5
8412
328
019
342
Feb.
’ 04
7.9
48.1
15.2
654.
594
.745
966
151
444
258
33
Mar
.’ 04
Annu
al5.
210
813
.551
74.
595
.111
2.8
522
9344
419
9.4
261
Not
e : U
nits
are
in µ
g/m
3 ; N
– n
umbe
r of o
bser
vatio
ns.
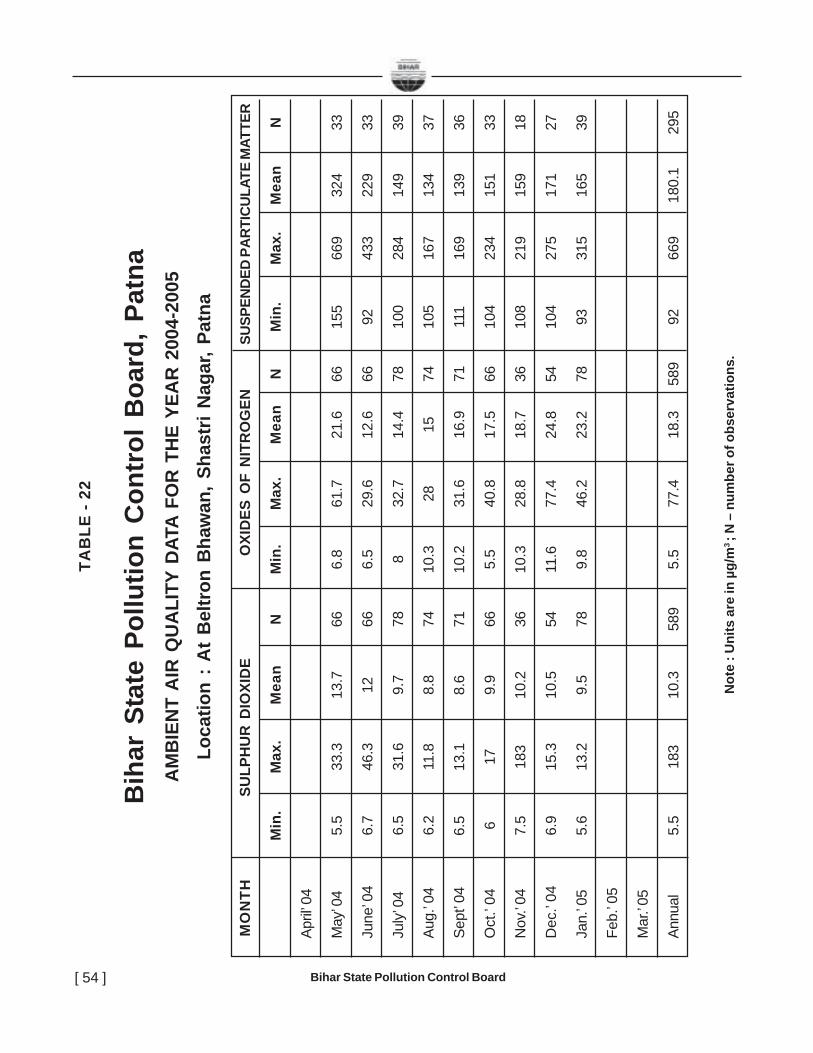
Bihar State Pollution Control Board[ 54 ]
Bih
ar S
tate
Pol
lutio
n C
ontr
ol B
oard
, Pa
tna
AM
BIE
NT
AIR
QU
ALI
TY D
ATA
FOR
TH
E YE
AR
200
4-20
05Lo
catio
n :
At
Bel
tron
Bha
wan
, Sha
stri
Nag
ar, P
atna
Not
e : U
nits
are
in µ
g/m
3 ; N
– n
umbe
r of o
bser
vatio
ns.
TAB
LE -
22
MO
NTH
SULP
HU
R D
IOXI
DE
OXI
DES
OF
NIT
RO
GEN
SUSP
END
ED P
AR
TIC
ULA
TE M
ATTE
R
Min
.M
ax.
Mea
nN
Min
.M
ax.
Mea
nN
Min
.M
ax.
Mea
nN
April
’ 04
May
’ 04
5.5
33.3
13.7
666.
861
.721
.666
155
669
324
33
June
’ 04
6.7
46.3
1266
6.5
29.6
12.6
6692
433
229
33
July
’ 04
6.5
31.6
9.7
788
32.7
14.4
7810
028
414
939
Aug.
’ 04
6.2
11.8
8.8
7410
.328
1574
105
167
134
37
Sept
’ 04
6.5
13.1
8.6
7110
.231
.616
.971
111
169
139
36
Oct
.’ 04
617
9.9
665.
540
.817
.566
104
234
151
33
Nov
.’ 04
7.5
183
10.2
3610
.328
.818
.736
108
219
159
18
Dec
.’ 04
6.9
15.3
10.5
5411
.677
.424
.854
104
275
171
27
Jan.
’ 05
5.6
13.2
9.5
789.
846
.223
.278
9331
516
539
Feb.
’ 05
Mar
.’ 05
Annu
al5.
518
310
.358
95.
577
.418
.358
992
669
180.
129
5
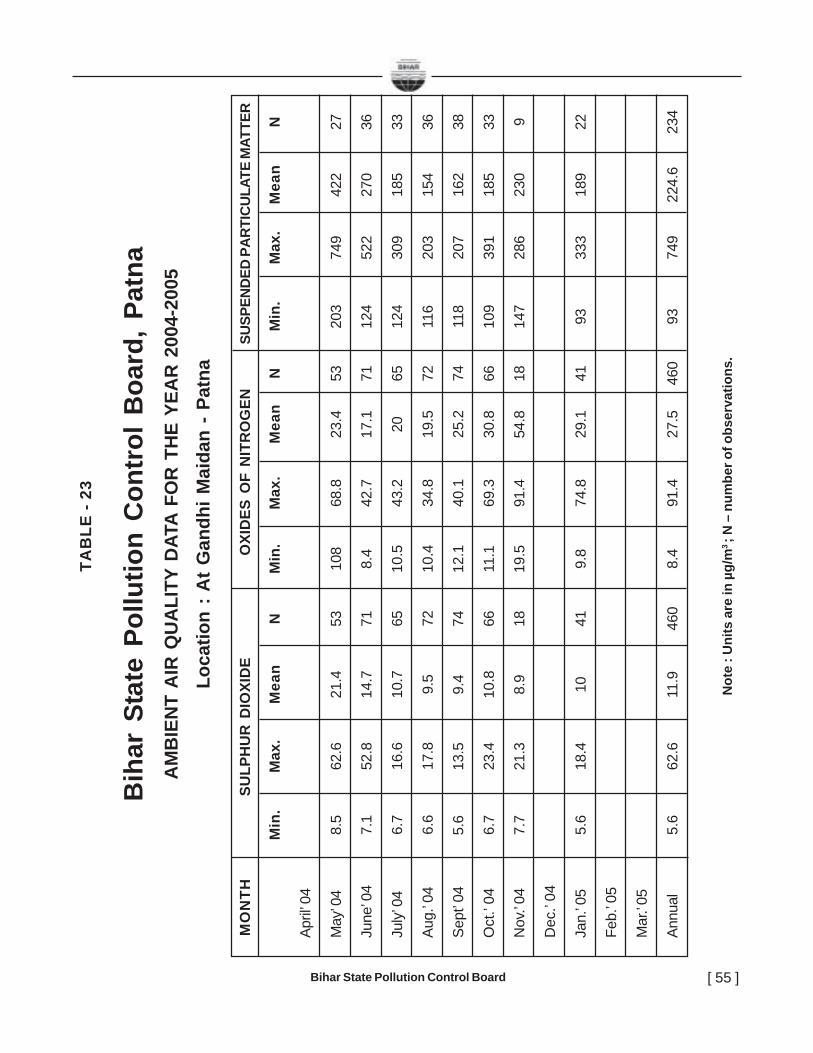
Bihar State Pollution Control Board [ 55 ]
Bih
ar S
tate
Pol
lutio
n C
ontr
ol B
oard
, Pa
tna
AM
BIE
NT
AIR
QU
ALI
TY D
ATA
FOR
TH
E YE
AR
200
4-20
05Lo
catio
n : A
t G
andh
i Mai
dan
- Pa
tna
Not
e : U
nits
are
in µ
g/m
3 ; N
– n
umbe
r of o
bser
vatio
ns.
TAB
LE -
23
MO
NTH
SULP
HU
R D
IOXI
DE
OXI
DES
OF
NIT
RO
GEN
SUSP
END
ED P
AR
TIC
ULA
TE M
ATTE
R
Min
.M
ax.
Mea
nN
Min
.M
ax.
Mea
nN
Min
.M
ax.
Mea
nN
April
’ 04
May
’ 04
8.5
62.6
21.4
5310
868
.823
.453
203
749
422
27
June
’ 04
7.1
52.8
14.7
718.
442
.717
.171
124
522
270
36
July
’ 04
6.7
16.6
10.7
6510
.543
.220
6512
430
918
533
Aug.
’ 04
6.6
17.8
9.5
7210
.434
.819
.572
116
203
154
36
Sept
’ 04
5.6
13.5
9.4
7412
.140
.125
.274
118
207
162
38
Oct
.’ 04
6.7
23.4
10.8
6611
.169
.330
.866
109
391
185
33
Nov
.’ 04
7.7
21.3
8.9
1819
.591
.454
.818
147
286
230
9
Dec
.’ 04
Jan.
’ 05
5.6
18.4
1041
9.8
74.8
29.1
4193
333
189
22
Feb.
’ 05
Mar
.’ 05
Annu
al5.
662
.611
.946
08.
491
.427
.546
093
749
224.
623
4
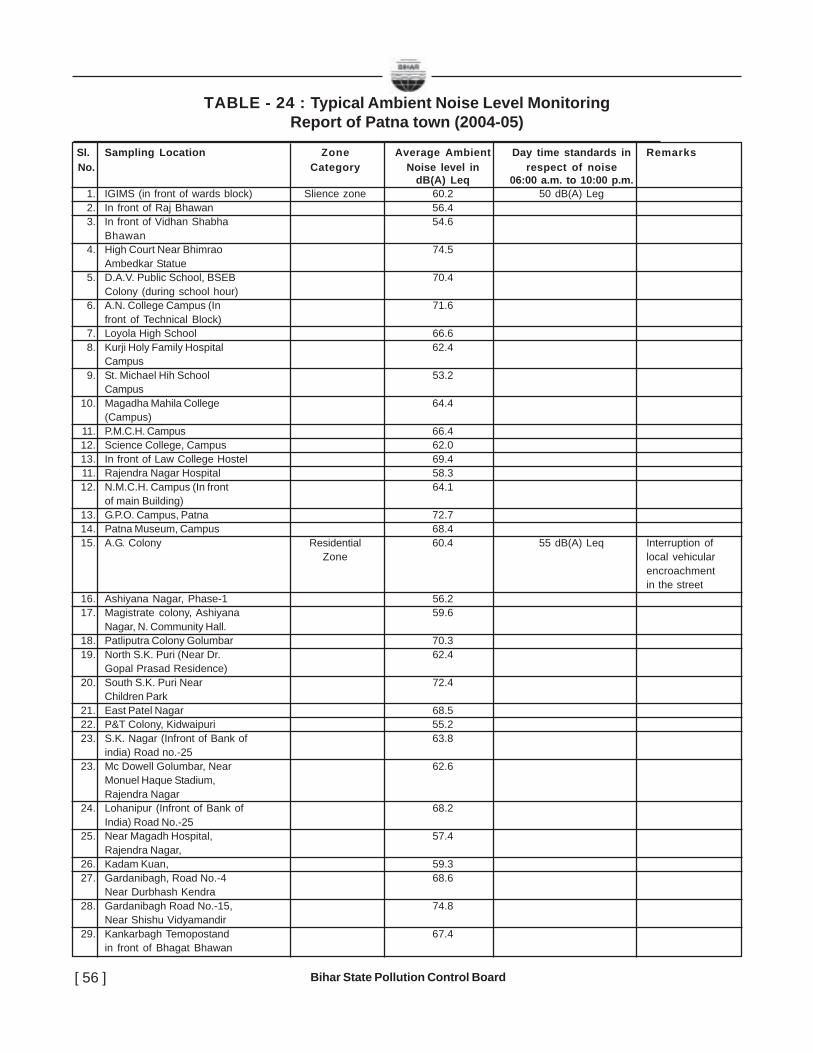
Bihar State Pollution Control Board[ 56 ]
TABLE - 24 : Typical Ambient Noise Level MonitoringReport of Patna town (2004-05)
Sl. Sampling Location Zone Average Ambient Day time standards in Remarks No. Category Noise level in respect of noise
dB(A) Leq 06:00 a.m. to 10:00 p.m.1. IGIMS (in front of wards block) Slience zone 60.2 50 dB(A) Leg2. In front of Raj Bhawan 56.43. In front of Vidhan Shabha 54.6
Bhawan4. High Court Near Bhimrao 74.5
Ambedkar Statue5. D.A.V. Public School, BSEB 70.4
Colony (during school hour)6. A.N. College Campus (In 71.6
front of Technical Block)7. Loyola High School 66.68. Kurji Holy Family Hospital 62.4
Campus9. St. Michael Hih School 53.2
Campus10. Magadha Mahila College 64.4
(Campus)11. P.M.C.H. Campus 66.412. Science College, Campus 62.013. In front of Law College Hostel 69.411. Rajendra Nagar Hospital 58.312. N.M.C.H. Campus (In front 64.1
of main Building)13. G.P.O. Campus, Patna 72.714. Patna Museum, Campus 68.415. A.G. Colony Residential 60.4 55 dB(A) Leq Interruption of
Zone local vehicularencroachmentin the street
16. Ashiyana Nagar, Phase-1 56.217. Magistrate colony, Ashiyana 59.6
Nagar, N. Community Hall.18. Patliputra Colony Golumbar 70.319. North S.K. Puri (Near Dr. 62.4
Gopal Prasad Residence)20. South S.K. Puri Near 72.4
Children Park21. East Patel Nagar 68.522. P&T Colony, Kidwaipuri 55.223. S.K. Nagar (Infront of Bank of 63.8
india) Road no.-2523. Mc Dowell Golumbar, Near 62.6
Monuel Haque Stadium,Rajendra Nagar
24. Lohanipur (Infront of Bank of 68.2India) Road No.-25
25. Near Magadh Hospital, 57.4Rajendra Nagar,
26. Kadam Kuan, 59.327. Gardanibagh, Road No.-4 68.6
Near Durbhash Kendra28. Gardanibagh Road No.-15, 74.8
Near Shishu Vidyamandir29. Kankarbagh Temopostand 67.4
in front of Bhagat Bhawan
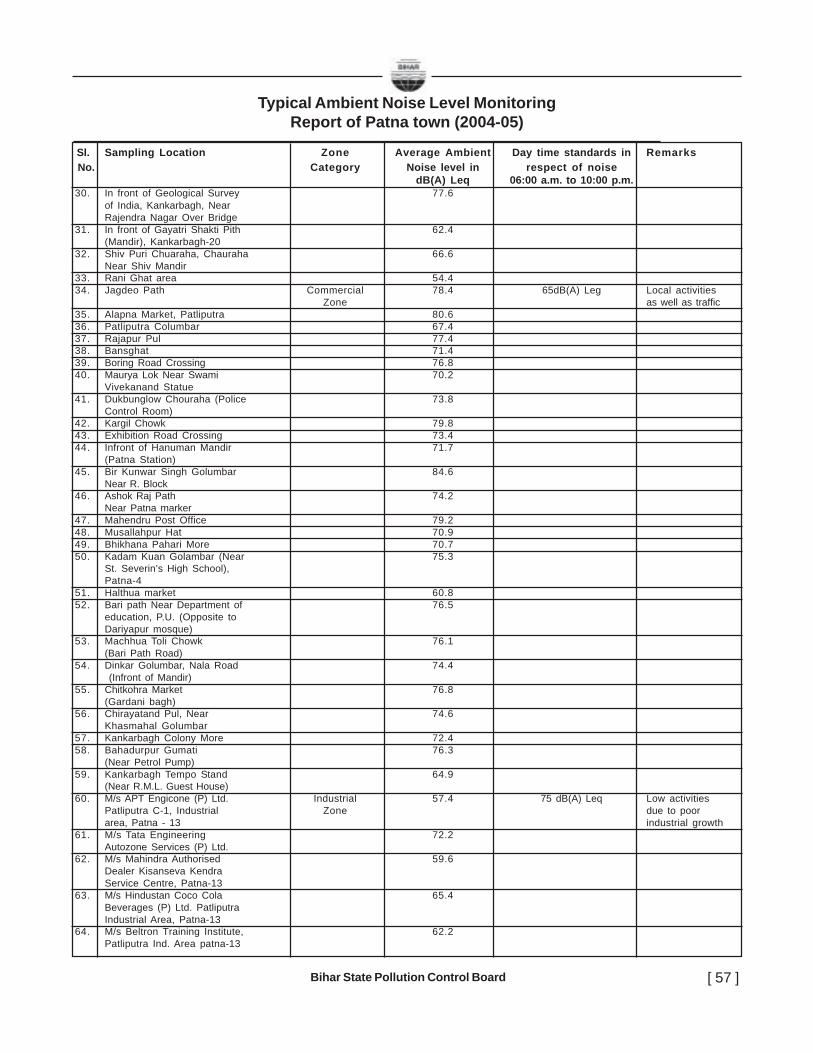
Bihar State Pollution Control Board [ 57 ]
Typical Ambient Noise Level MonitoringReport of Patna town (2004-05)
Sl. Sampling Location Zone Average Ambient Day time standards in Remarks No. Category Noise level in respect of noise
dB(A) Leq 06:00 a.m. to 10:00 p.m.30. In front of Geological Survey 77.6
of India, Kankarbagh, NearRajendra Nagar Over Bridge
31. In front of Gayatri Shakti Pith 62.4(Mandir), Kankarbagh-20
32. Shiv Puri Chuaraha, Chauraha 66.6Near Shiv Mandir
33. Rani Ghat area 54.434. Jagdeo Path Commercial 78.4 65dB(A) Leg Local activities
Zone as well as traffic35. Alapna Market, Patliputra 80.636. Patliputra Columbar 67.437. Rajapur Pul 77.438. Bansghat 71.439. Boring Road Crossing 76.840. Maurya Lok Near Swami 70.2
Vivekanand Statue41. Dukbunglow Chouraha (Police 73.8
Control Room)42. Kargil Chowk 79.843. Exhibition Road Crossing 73.444. Infront of Hanuman Mandir 71.7
(Patna Station)45. Bir Kunwar Singh Golumbar 84.6
Near R. Block46. Ashok Raj Path 74.2
Near Patna marker47. Mahendru Post Office 79.248. Musallahpur Hat 70.949. Bhikhana Pahari More 70.750. Kadam Kuan Golambar (Near 75.3
St. Severin’s High School),Patna-4
51. Halthua market 60.852. Bari path Near Department of 76.5
education, P.U. (Opposite toDariyapur mosque)
53. Machhua Toli Chowk 76.1(Bari Path Road)
54. Dinkar Golumbar, Nala Road 74.4 (Infront of Mandir)
55. Chitkohra Market 76.8(Gardani bagh)
56. Chirayatand Pul, Near 74.6Khasmahal Golumbar
57. Kankarbagh Colony More 72.458. Bahadurpur Gumati 76.3
(Near Petrol Pump)59. Kankarbagh Tempo Stand 64.9
(Near R.M.L. Guest House)60. M/s APT Engicone (P) Ltd. Industrial 57.4 75 dB(A) Leq Low activities
Patliputra C-1, Industrial Zone due to poorarea, Patna - 13 industrial growth
61. M/s Tata Engineering 72.2Autozone Services (P) Ltd.
62. M/s Mahindra Authorised 59.6Dealer Kisanseva KendraService Centre, Patna-13
63. M/s Hindustan Coco Cola 65.4Beverages (P) Ltd. PatliputraIndustrial Area, Patna-13
64. M/s Beltron Training Institute, 62.2Patliputra Ind. Area patna-13
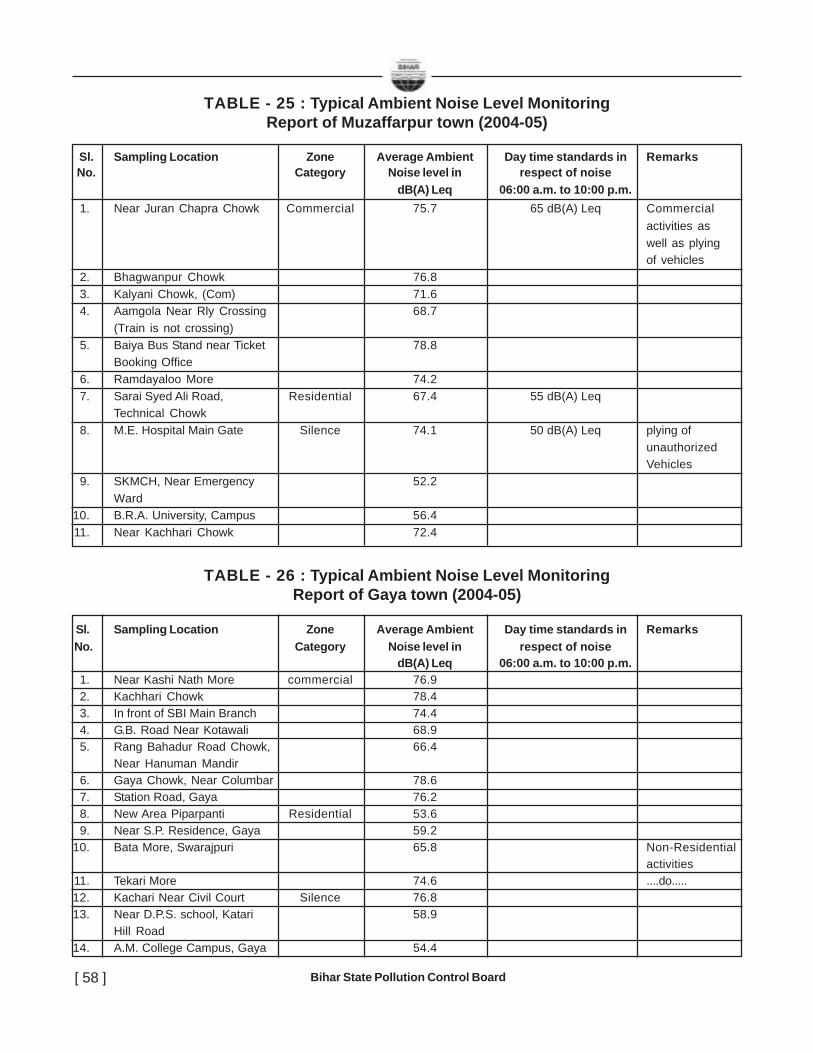
Bihar State Pollution Control Board[ 58 ]
TABLE - 26 : Typical Ambient Noise Level MonitoringReport of Gaya town (2004-05)
Sl. Sampling Location Zone Average Ambient Day time standards in Remarks No. Category Noise level in respect of noise
dB(A) Leq 06:00 a.m. to 10:00 p.m.1. Near Kashi Nath More commercial 76.92. Kachhari Chowk 78.43. In front of SBI Main Branch 74.44. G.B. Road Near Kotawali 68.95. Rang Bahadur Road Chowk, 66.4
Near Hanuman Mandir6. Gaya Chowk, Near Columbar 78.67. Station Road, Gaya 76.28. New Area Piparpanti Residential 53.69. Near S.P. Residence, Gaya 59.2
10. Bata More, Swarajpuri 65.8 Non-Residentialactivities
11. Tekari More 74.6 ....do.....12. Kachari Near Civil Court Silence 76.813. Near D.P.S. school, Katari 58.9
Hill Road14. A.M. College Campus, Gaya 54.4
TABLE - 25 : Typical Ambient Noise Level MonitoringReport of Muzaffarpur town (2004-05)
Sl. Sampling Location Zone Average Ambient Day time standards in Remarks No. Category Noise level in respect of noise
dB(A) Leq 06:00 a.m. to 10:00 p.m.1. Near Juran Chapra Chowk Commercial 75.7 65 dB(A) Leq Commercial
activities aswell as plyingof vehicles
2. Bhagwanpur Chowk 76.83. Kalyani Chowk, (Com) 71.64. Aamgola Near Rly Crossing 68.7
(Train is not crossing)5. Baiya Bus Stand near Ticket 78.8
Booking Office6. Ramdayaloo More 74.27. Sarai Syed Ali Road, Residential 67.4 55 dB(A) Leq
Technical Chowk8. M.E. Hospital Main Gate Silence 74.1 50 dB(A) Leq plying of
unauthorizedVehicles
9. SKMCH, Near Emergency 52.2Ward
10. B.R.A. University, Campus 56.411. Near Kachhari Chowk 72.4

Bihar State Pollution Control Board [ 59 ]
3.1.3 BIOTIC PARAMETERS
3.1.3.1 Biodiversity
In an ecosystem there is diversity of species which attracts attention of the evolutionary
and ecological factors that had been responsible for such diversification. The species
diversity is not so uniform, as the value represented is, unless compared with speciesdiversity in another community. It is the geographical pattern in species diversity that tells
us about the factors contributing to diversity. In case of Bihar, the diversity of fauna and
flora is noticeable in the backdrop of changing physiographic and climatic zonations andits remarkable longitudinal changes across the Ganga basin.
A rich variety of flora and fauna,
we had around the westernChotanagpur plateau where thick
forest, sufficient hydrological input,
natural abode and food were theessential components of ecosystem,
available. What is to be monitored for
the b iod ivers i ty o f preva i l ingecosystem, which have been subjected
to ravages of human influence, such as
pollution and deforestation, is measure of their health and well being. The relative abundanceof species is an important component of the measure in a particular landsystem or
ecosystem. The concept of species or biodiversity is actually linked wih their actual number
and also with the commonness and rarity of species in a particular system. Further, north ofthis hill-system, occupies the actual Ganga basin, the Tarai and sub-Himalayan tracts. The
actual Ganga basin, area where the agroclimatic zonation and land system zonation are
the two background layers over which the biodiversity could be well accessed andaccounted.
Considering the persistent threat to the survival of many ecosystems on the earth as a
consequence of human activities, one would indeed like to find out about the factors thatcontribute to the stability of a biological community. Stability has been interpreted in different
ways. Three concepts of stability may be seen, as indicated below:

Bihar State Pollution Control Board[ 60 ]
(i) the population densities of species remain fairly constant through time
- constancy of numbers;
(ii) the community as a whole remians unchanged in the face of any majordisturbance, i.e., resistance to perturbation; and
(iii) the community has the ability to return to normal state or equilibrium
sooner or later if disrupted by a major disturbance.
3.1.3.2. SOCIO ECONOMIC FACTS ABOUT BIHAR
Population
TABLE - 27 : Decadal Population growth rate (%) 1991-2001
State Rural Urban Total
Bihar 28.3 29.3 28.4
Jharkhand 21.6 29.0 23.2
Chattisgarh 14.2 36.2 18.1
Uttaranchal 15.2 32.8 19.2
Punjab 12.3 37.6 19.8
Maharastra 15.2 34.3 22.6
Tamil Nadu -5.2 42.8 11.2
W. Bengal 16.9 20.2 17.8
Orissa 13.8 29.8 15.9
India 17.9 31.2 21.3
Source: Jagaran Report, 2001
• Decadal population growth rate for 1991-2001 are given above.
• The above facts give the picture that the population growth of Bihar was more
than that of the other states as well as more than the national average.• There was increase in the urban population growth of the state. In comparison
to other states there was less increase in the urban population this is due to
low to medium migration of the population from rural to urban.
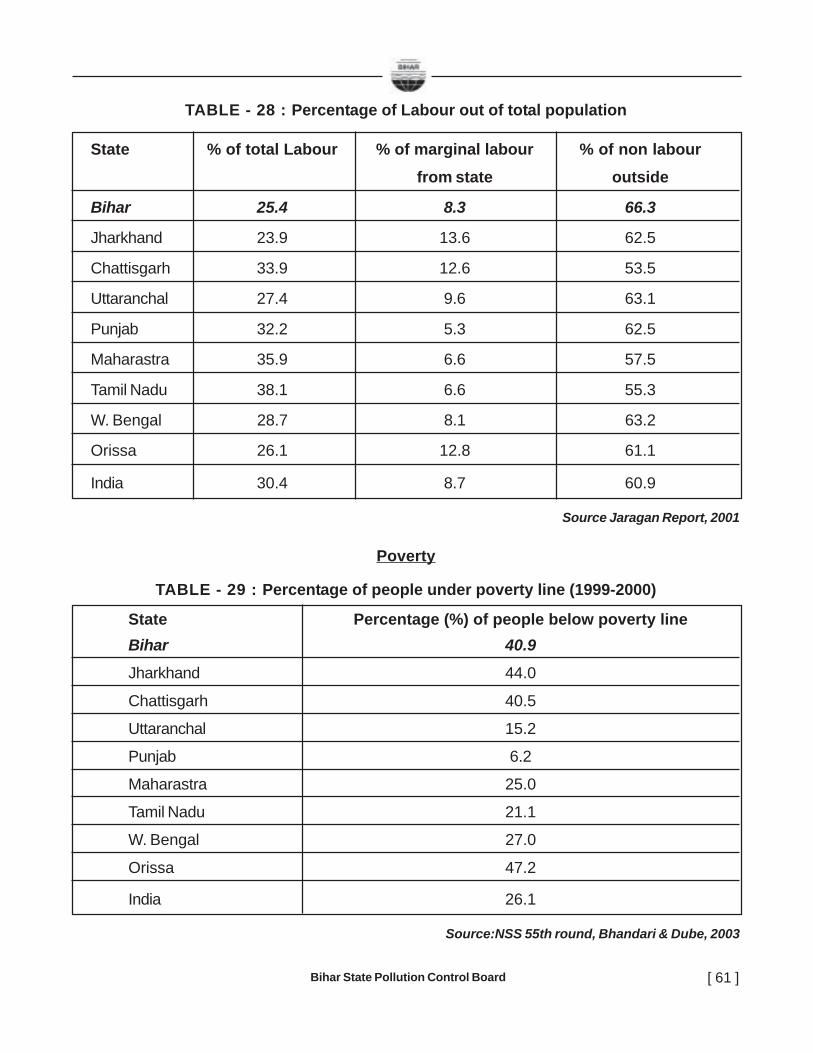
Bihar State Pollution Control Board [ 61 ]
TABLE - 28 : Percentage of Labour out of total population
State % of total Labour % of marginal labour % of non labour
from state outside
Bihar 25.4 8.3 66.3
Jharkhand 23.9 13.6 62.5
Chattisgarh 33.9 12.6 53.5
Uttaranchal 27.4 9.6 63.1
Punjab 32.2 5.3 62.5
Maharastra 35.9 6.6 57.5
Tamil Nadu 38.1 6.6 55.3
W. Bengal 28.7 8.1 63.2
Orissa 26.1 12.8 61.1
India 30.4 8.7 60.9
Source Jaragan Report, 2001
Poverty
TABLE - 29 : Percentage of people under poverty line (1999-2000)
State Percentage (%) of people below poverty lineBihar 40.9
Jharkhand 44.0
Chattisgarh 40.5
Uttaranchal 15.2
Punjab 6.2
Maharastra 25.0
Tamil Nadu 21.1
W. Bengal 27.0
Orissa 47.2
India 26.1
Source:NSS 55th round, Bhandari & Dube, 2003

Bihar State Pollution Control Board[ 62 ]
Sanitation
TABLE - 30 : Percentage of families with sanitation facilities, 2001
State Percentage of families with sanitation facilities
Bihar 7.9
Jharkhand 10.7
Chattisgarh 8.9
Uttaranchal 15.4
Punjab 20.4
Maharastra 21.9
Tamil Nadu 23.2
India 18.0
Source: Cencus of India, 2001
Food Security
TABLE - 31 : Percentage (%) of families without food security (1999-2000)
State Percentage (%) of families without food Security
Bihar 3.5
Jharkhand 12.5
Chattisgargh 5.8
Uttaranchal 2.5
Punjab 0.2
Maharastra 1.2
Tamil Nadu 0.7
W. Bengal 8.6
Orissa 7.0
India 2.3
Source: NSS 55th Round
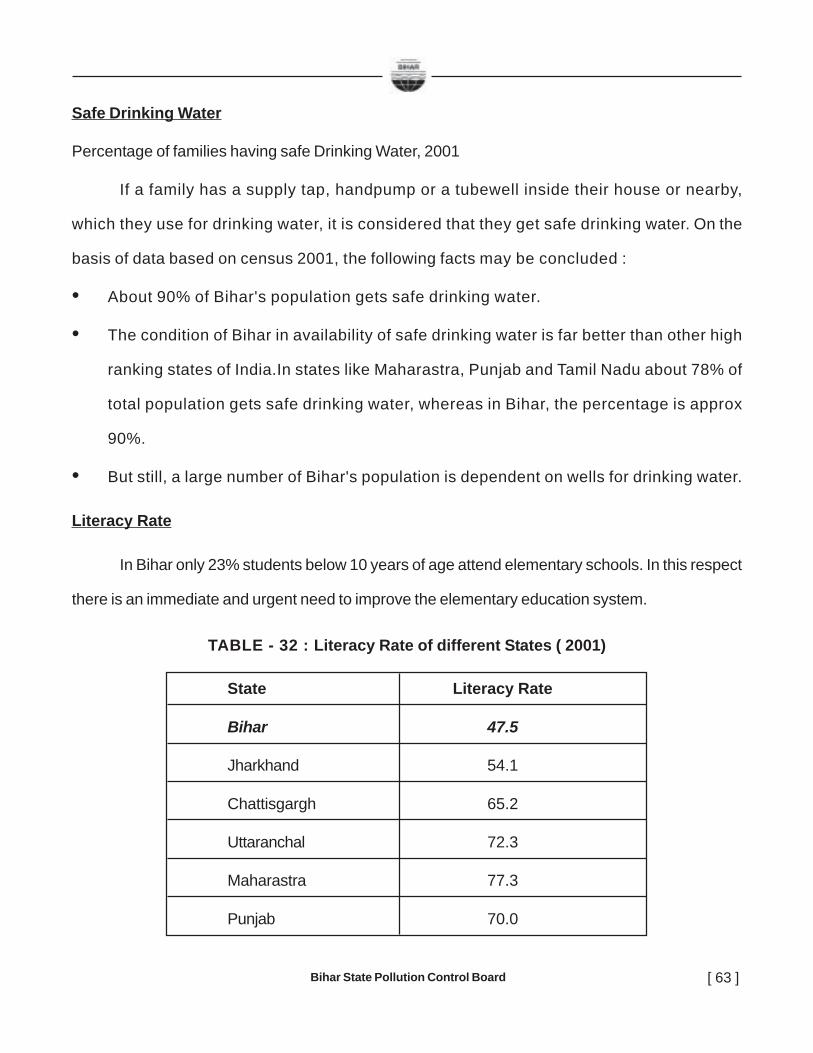
Bihar State Pollution Control Board [ 63 ]
Safe Drinking Water
Percentage of families having safe Drinking Water, 2001
If a family has a supply tap, handpump or a tubewell inside their house or nearby,
which they use for drinking water, it is considered that they get safe drinking water. On the
basis of data based on census 2001, the following facts may be concluded :
• About 90% of Bihar's population gets safe drinking water.
• The condition of Bihar in availability of safe drinking water is far better than other high
ranking states of India.In states like Maharastra, Punjab and Tamil Nadu about 78% of
total population gets safe drinking water, whereas in Bihar, the percentage is approx
90%.
• But still, a large number of Bihar's population is dependent on wells for drinking water.
Literacy Rate
In Bihar only 23% students below 10 years of age attend elementary schools. In this respect
there is an immediate and urgent need to improve the elementary education system.
TABLE - 32 : Literacy Rate of different States ( 2001)
State Literacy Rate
Bihar 47.5
Jharkhand 54.1
Chattisgargh 65.2
Uttaranchal 72.3
Maharastra 77.3
Punjab 70.0
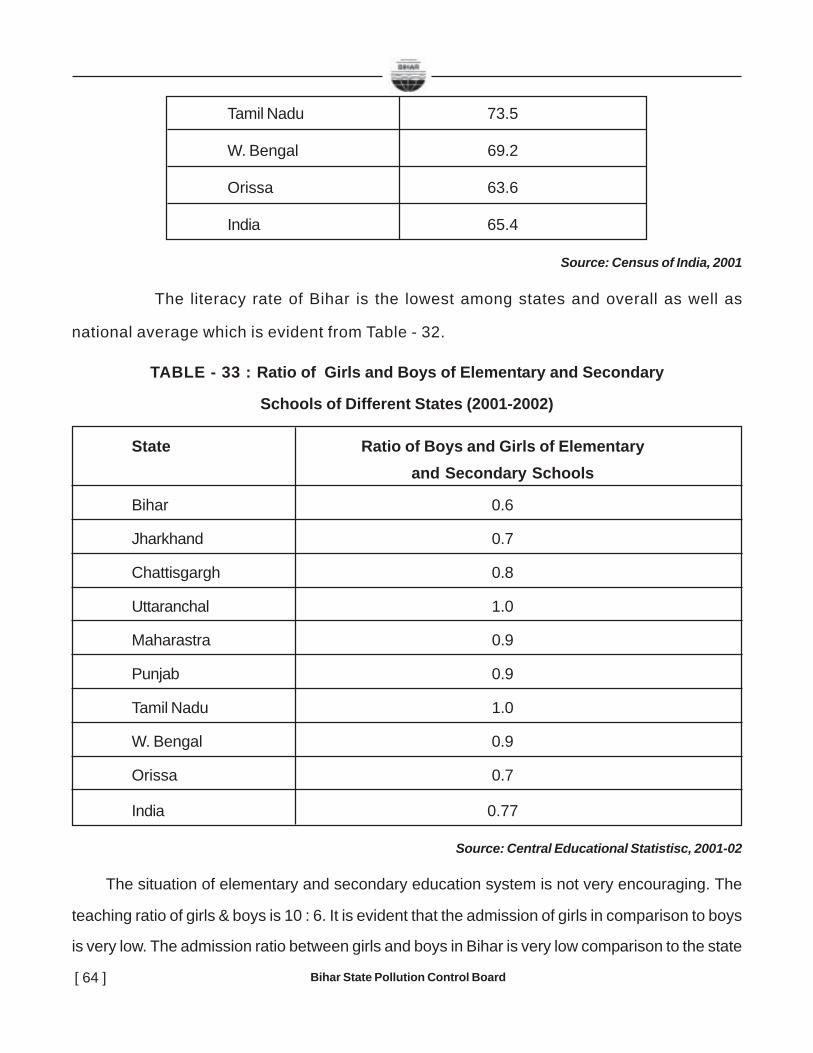
Bihar State Pollution Control Board[ 64 ]
Tamil Nadu 73.5
W. Bengal 69.2
Orissa 63.6
India 65.4
Source: Census of India, 2001
The literacy rate of Bihar is the lowest among states and overall as well as
national average which is evident from Table - 32.
TABLE - 33 : Ratio of Girls and Boys of Elementary and Secondary
Schools of Different States (2001-2002)
State Ratio of Boys and Girls of Elementaryand Secondary Schools
Bihar 0.6
Jharkhand 0.7
Chattisgargh 0.8
Uttaranchal 1.0
Maharastra 0.9
Punjab 0.9
Tamil Nadu 1.0
W. Bengal 0.9
Orissa 0.7
India 0.77
Source: Central Educational Statistisc, 2001-02
The situation of elementary and secondary education system is not very encouraging. The
teaching ratio of girls & boys is 10 : 6. It is evident that the admission of girls in comparison to boys
is very low. The admission ratio between girls and boys in Bihar is very low comparison to the state

Bihar State Pollution Control Board [ 65 ]
of Jharkhand. In developed states Maharashtra, Punjab and Tamilnadu the ratio of boys and girls is
significantly high. Even that in the state of West Bangal ratio is same as that in those of the developed
states. On the basis of the facts stated above, the disparity in the gender ratio is evident. Studies
have revealed that the admission of large number of girls is reflective of the better quality of education,
health and family welfare in future generations.
TABLE - 34 : Ratio (in %) of Student-Teacher in different states
State Ratio of Student -Teacher
Bihar 18
Jharkhand 24
Chattisgargh 31
Uttaranchal 35
Maharastra 22
Punjab 22
Tamil Nadu 15
W. Bengal 31
Orissa 18
India 21
Source: Selected Education Statistic, 2001-02
The low student-teacher ratio is suggestive of the better education imparted to the
students, the lesser the number of students attached to a teacher, the better will be the
quality of education. While this ratio is 21 at the National level, in Bihar the ratio is that of
18. Here, overall situation of Bihar is better not only in respect of Jharkhand, Punjab,
Maharashtra and Tamilnadu but at the National level too.
The data mentioned above indicates quantative education but lacks qualitatively.
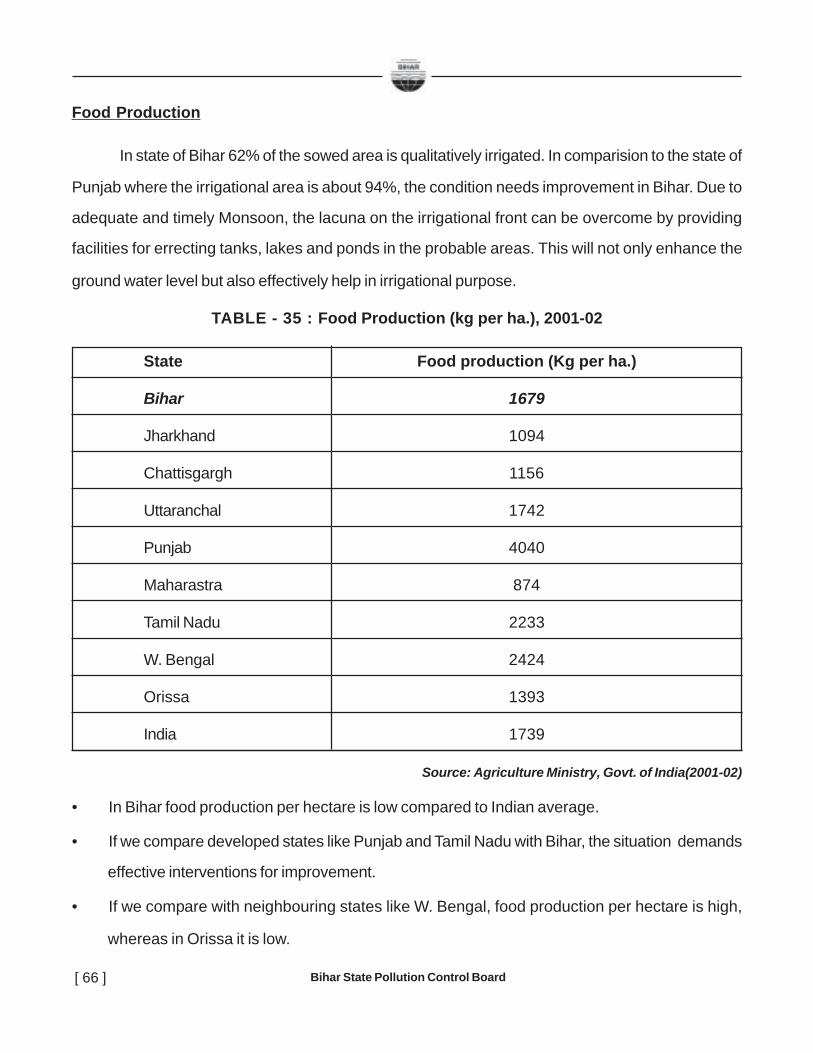
Bihar State Pollution Control Board[ 66 ]
Food Production
In state of Bihar 62% of the sowed area is qualitatively irrigated. In comparision to the state of
Punjab where the irrigational area is about 94%, the condition needs improvement in Bihar. Due to
adequate and timely Monsoon, the lacuna on the irrigational front can be overcome by providing
facilities for errecting tanks, lakes and ponds in the probable areas. This will not only enhance the
ground water level but also effectively help in irrigational purpose.
TABLE - 35 : Food Production (kg per ha.), 2001-02
State Food production (Kg per ha.)
Bihar 1679
Jharkhand 1094
Chattisgargh 1156
Uttaranchal 1742
Punjab 4040
Maharastra 874
Tamil Nadu 2233
W. Bengal 2424
Orissa 1393
India 1739
Source: Agriculture Ministry, Govt. of India(2001-02)
• In Bihar food production per hectare is low compared to Indian average.
• If we compare developed states like Punjab and Tamil Nadu with Bihar, the situation demands
effective interventions for improvement.
• If we compare with neighbouring states like W. Bengal, food production per hectare is high,
whereas in Orissa it is low.

Bihar State Pollution Control Board [ 67 ]
TABLE - 36 : Children of 10 yrs who have received
Primary education in different states (1999-2000)
State Children of 10 yrs who have received
Primary education (%)
Bihar 22.9
Jharkhand 34.2
Chattisgargh 25.6
Uttaranchal 44.4
Maharastra 46.7
Punjab 38.9
Orissa 31.4
Tamil Nadu 65.4
Source: NSSO, 55th Round
TABLE - 37 : Gross Price
Gross Price (Rs. per person), 2000-01
State Gross Price (Rs. per person), 2000-01
Jharkhand 1296
Bihar 63
Chattisgargh 396
Uttaranchal 301
Maharastra 1273
Punjab 560
Tamil Nadu 1145
Orissa 246
W. Bengal 296
Source: Annual survey of Industries, 2000-01
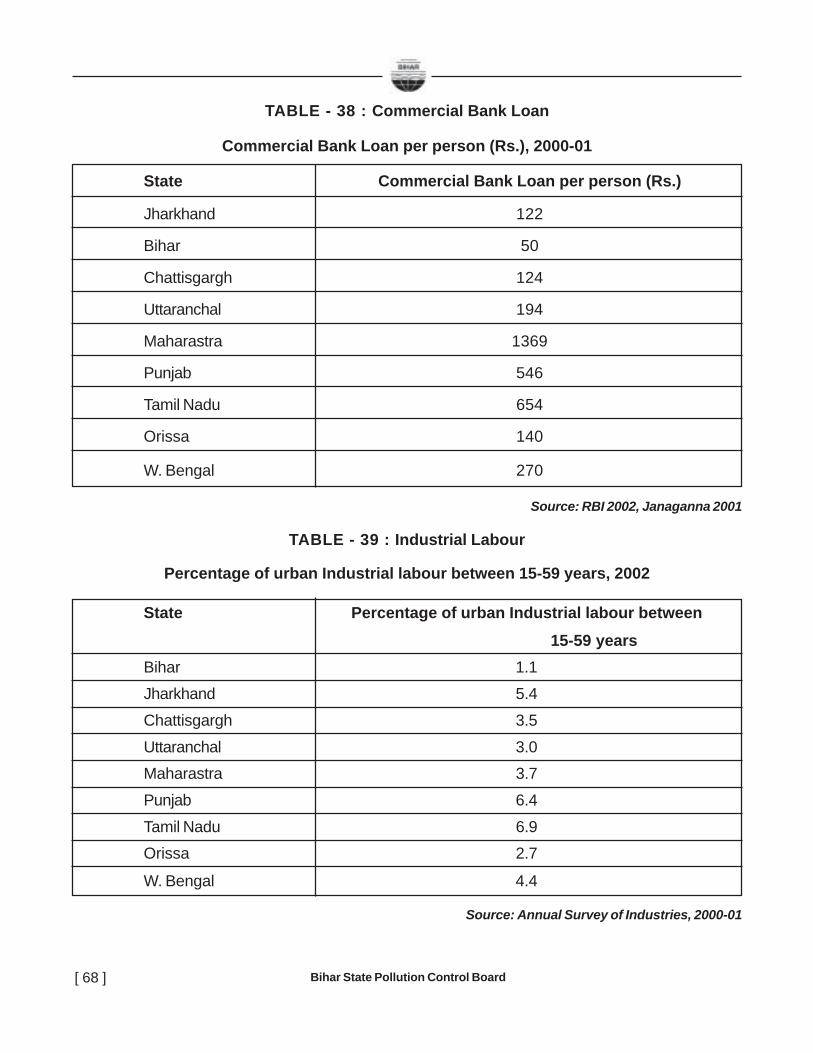
Bihar State Pollution Control Board[ 68 ]
TABLE - 38 : Commercial Bank Loan
Commercial Bank Loan per person (Rs.), 2000-01
State Commercial Bank Loan per person (Rs.)
Jharkhand 122
Bihar 50
Chattisgargh 124
Uttaranchal 194
Maharastra 1369
Punjab 546
Tamil Nadu 654
Orissa 140
W. Bengal 270
Source: RBI 2002, Janaganna 2001
TABLE - 39 : Industrial Labour
Percentage of urban Industrial labour between 15-59 years, 2002
State Percentage of urban Industrial labour between
15-59 yearsBihar 1.1Jharkhand 5.4
Chattisgargh 3.5
Uttaranchal 3.0Maharastra 3.7
Punjab 6.4
Tamil Nadu 6.9Orissa 2.7
W. Bengal 4.4
Source: Annual Survey of Industries, 2000-01
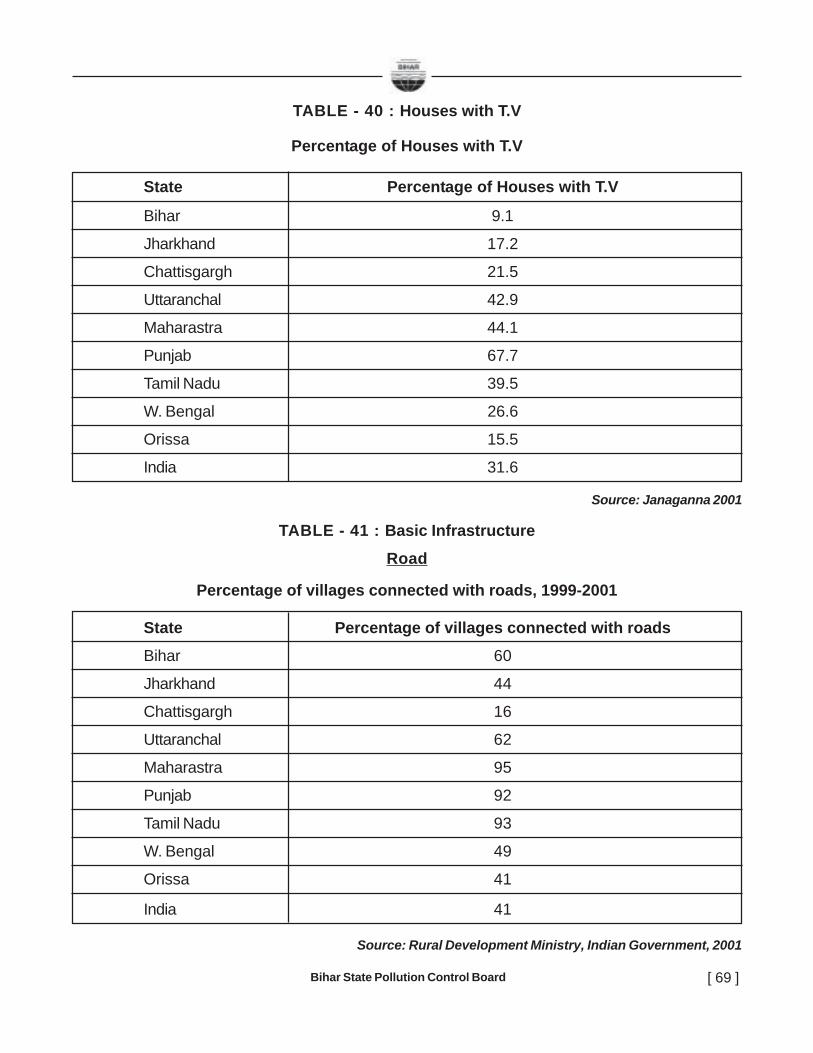
Bihar State Pollution Control Board [ 69 ]
TABLE - 40 : Houses with T.V
Percentage of Houses with T.V
State Percentage of Houses with T.V
Bihar 9.1
Jharkhand 17.2
Chattisgargh 21.5
Uttaranchal 42.9
Maharastra 44.1
Punjab 67.7
Tamil Nadu 39.5
W. Bengal 26.6
Orissa 15.5
India 31.6
Source: Janaganna 2001
TABLE - 41 : Basic Infrastructure
Road
Percentage of villages connected with roads, 1999-2001
State Percentage of villages connected with roads
Bihar 60
Jharkhand 44
Chattisgargh 16
Uttaranchal 62
Maharastra 95
Punjab 92
Tamil Nadu 93
W. Bengal 49
Orissa 41
India 41
Source: Rural Development Ministry, Indian Government, 2001

Bihar State Pollution Control Board[ 70 ]
TABLE - 42 : Length of road per lakh of population in different states, 1999
State Length of road per lakh of population (km)
Bihar + Jharkhand 81
M.P + Chattisgargh 251
Maharastra 163
Punjab 39.5
Tamil Nadu 266
W. Bengal 246
Orissa 99
India 715
Source : Motor Transport Statistic of India, 1999-2000,Ministry of Road transport and Highways, Indian Government
TABLE - 43 : Density of Post Office
No. of Post Offices per lakh of population in different states, 2000-01
State No. of P.O. per lakh
Bihar 10.8
Jharkhand 11.3
Chattisgargh 27.8
Uttaranchal 31.8
Maharastra 12.9
Punjab 16.1
Tamil Nadu 19.5
W. Bengal 22.2
Orissa 10.8
India 15.1
Source : Book of Information 200-01, Department of Posters, Ministry of communication,Janaganna, 2001
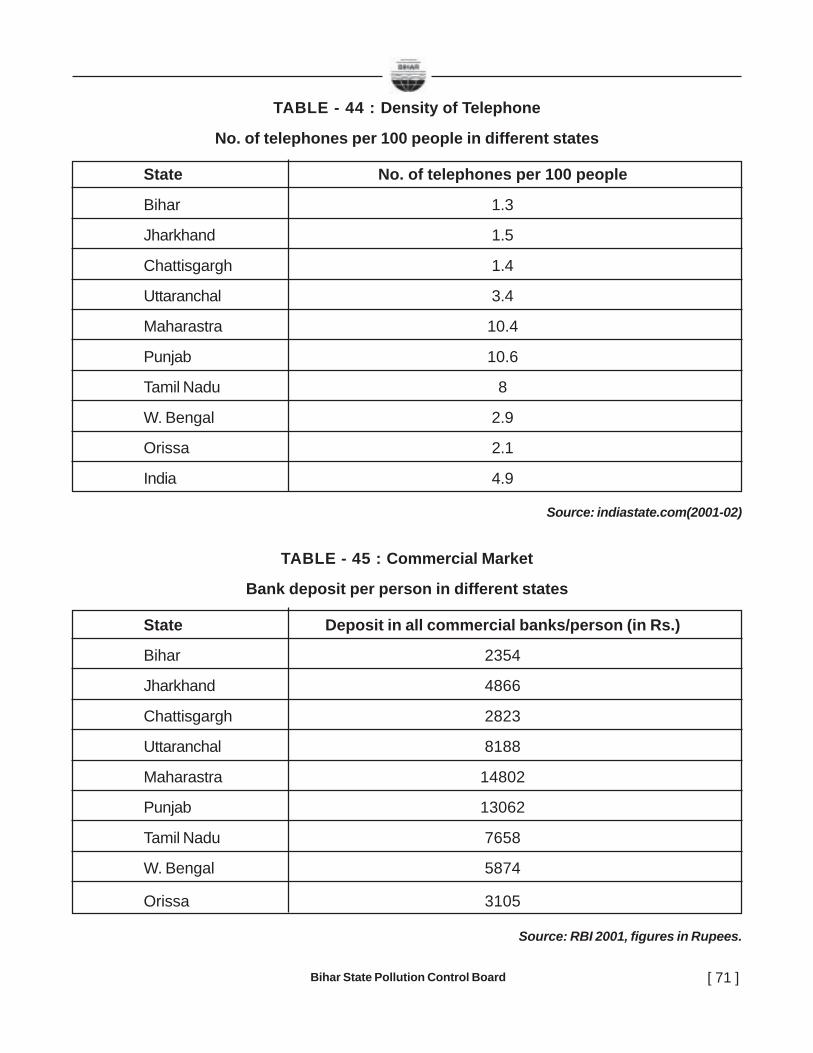
Bihar State Pollution Control Board [ 71 ]
TABLE - 44 : Density of Telephone
No. of telephones per 100 people in different states
State No. of telephones per 100 people
Bihar 1.3
Jharkhand 1.5
Chattisgargh 1.4
Uttaranchal 3.4
Maharastra 10.4
Punjab 10.6
Tamil Nadu 8
W. Bengal 2.9
Orissa 2.1
India 4.9
Source: indiastate.com(2001-02)
TABLE - 45 : Commercial Market
Bank deposit per person in different states
State Deposit in all commercial banks/person (in Rs.)
Bihar 2354
Jharkhand 4866
Chattisgargh 2823
Uttaranchal 8188
Maharastra 14802
Punjab 13062
Tamil Nadu 7658
W. Bengal 5874
Orissa 3105
Source: RBI 2001, figures in Rupees.
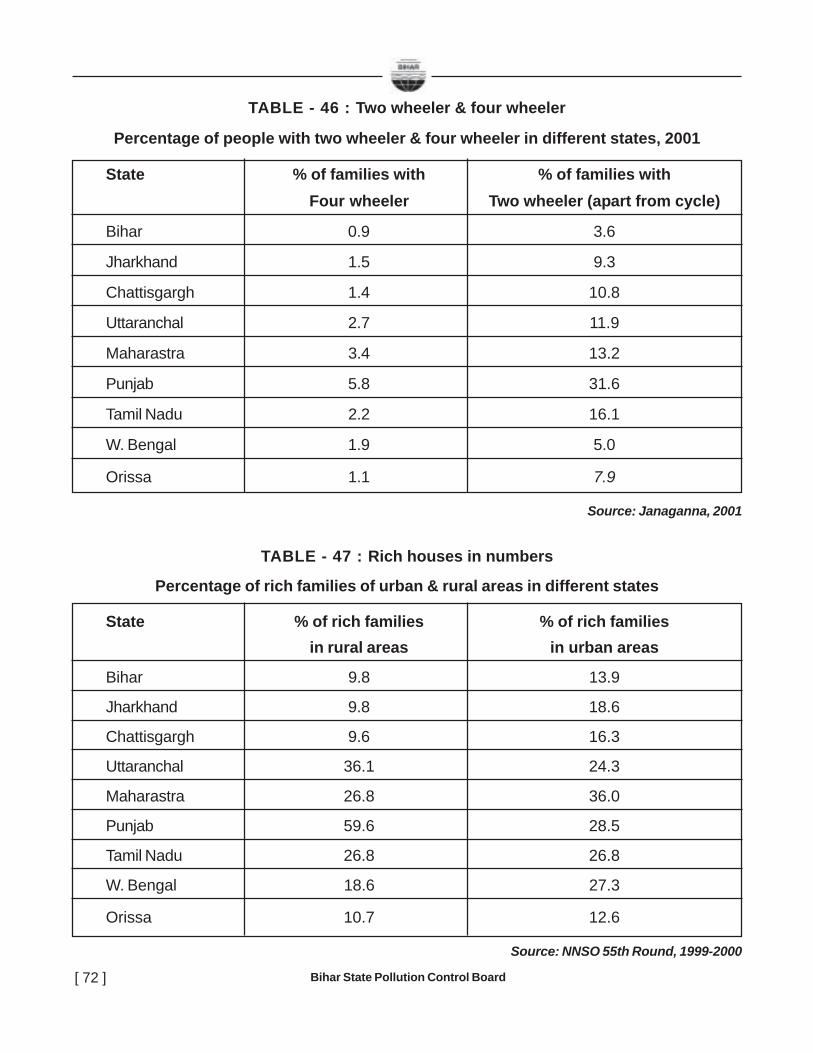
Bihar State Pollution Control Board[ 72 ]
TABLE - 46 : Two wheeler & four wheeler
Percentage of people with two wheeler & four wheeler in different states, 2001
State % of families with % of families withFour wheeler Two wheeler (apart from cycle)
Bihar 0.9 3.6
Jharkhand 1.5 9.3
Chattisgargh 1.4 10.8
Uttaranchal 2.7 11.9
Maharastra 3.4 13.2
Punjab 5.8 31.6
Tamil Nadu 2.2 16.1
W. Bengal 1.9 5.0
Orissa 1.1 7.9
Source: Janaganna, 2001
TABLE - 47 : Rich houses in numbers
Percentage of rich families of urban & rural areas in different states
State % of rich families % of rich familiesin rural areas in urban areas
Bihar 9.8 13.9
Jharkhand 9.8 18.6
Chattisgargh 9.6 16.3
Uttaranchal 36.1 24.3
Maharastra 26.8 36.0
Punjab 59.6 28.5
Tamil Nadu 26.8 26.8
W. Bengal 18.6 27.3
Orissa 10.7 12.6
Source: NNSO 55th Round, 1999-2000

Bihar State Pollution Control Board [ 73 ]
TABLE - 48 : Health
Infant Mortality Rate per thousand live births
State Infant Mortality Male to female death ratio
Bihar 62 0.8
Jharkhand 62 0.7
Chattisgargh 77 0.9
Uttaranchal 48 1.0
Maharastra 45 0.9
Punjab 52 0.7
Tamil Nadu 49 0.8
W. Bengal 51 1.1
Orissa 91 1.0
India 66 0.9
Source: NRS Bulletin, 2003
TABLE - 49 : Delivery through trained person
Percentage of delivery through trained person(1998-99)
State Percentage of delivery through trained person
Bihar 25.1
Jharkhand 17.8
Chattisgargh 32.4
Uttaranchal 35.1
Maharastra 59.4
Punjab 62.6
Tamil Nadu 83.8
W. Bengal 44.4
Orissa 33.5
India 42.3
Source: National Family Health service, 1998-99

Bihar State Pollution Control Board[ 74 ]
TABLE - 50 : Expected Mortality ratePercentage of expected mortality rate in different states, 2002
State Mortality rateBihar 7.9
Jharkhand 7.9
Chattisgargh 8.7Uttaranchal 6.4
Maharastra 7.3
Punjab 7.1Tamil Nadu 7.7
W. Bengal 6.6
Orissa 9.8India 8.1
Source: SRS, Bulletin 2003 Registrar general of India
TABLE - 51 : Commercial LoansRevenue receipt per person
Revenue receipt per person (In Rs.) in different statesState 1990-91 1995-96 2000-01 2001-02Bihar 500 793 1139 1231
Jharkhand - - - 2264
U.P 597 971 1454 1540Tamil Nadu 911 1783 2965 3015
Source: Handbook of Statistic on State Government Finance, 2004
TABLE - 52 : Revenue expenditure per personRevenue expenditure per person (In Rs.) in different states
State 1990-91 1995-96 2000-01 2001-02Bihar 566 909 1435 1516Jharkhand - - - 2229
U.P 686 1120 1823 1914
Tamil Nadu 1010 1835 3521 3471Source: Handbook of Statistic on State Government Finance, 2004

Bihar State Pollution Control Board [ 75 ]
TABLE - 53 : Financial Investment of State Governments
Financial Investment of State Governments per person (In Rs.) in different states.
State 1990-91 1995-96 2000-01 2001-02
Bihar 154 103 260 279
Jharkhand - - - 719
U.P 194 206 332 381
Tamil Nadu 175 273 435 525
Source: Handbook of Statistic on State Government Finance, 2004
TABLE - 54 : Expenditure on Social Services
Expenditure on Social Services (In %)
State 1990-91 1995-96 2000-01 2001-02
Bihar 39.3 38.4 40.6 35.3
Jharkhand - - - 40.9
U.P 35.6 31.3 29.7 29.4
Tamil Nadu 44.2 39.7 35.8 35.6
Source: Handbook of Statistic on State Government Finance, 2004
TABLE - 55 : Transfer of resource from Central Government
Support from Central Government (per 10 lakh person)
State 1990-91 1995-96 2000-01 2001-02
Bihar 9.3 10.8 10.7 15.0
Jharkhand - - - 32.3
U.P 14.8 14.8 16.3 19.8
Tamil Nadu 10.4 13.2 13.2 22.1
Source: Handbook of Statistic on State Government Finance, 2004

Bihar State Pollution Control Board[ 76 ]
TABLE - 56 : Per person gross financial loss
Financial loss (Rs. per person) 2001-02
State Financial loss (Rs. per person)
Bihar 484
Jharkhand 610
Chattisgargh 510
Uttaranchal 500
Maharastra 1126
Punjab 2041
Tamil Nadu 763
Orissa 1080
W. Bengal 1471
India 940
Source: Handbook of Statistic on State Government Finance, 2004
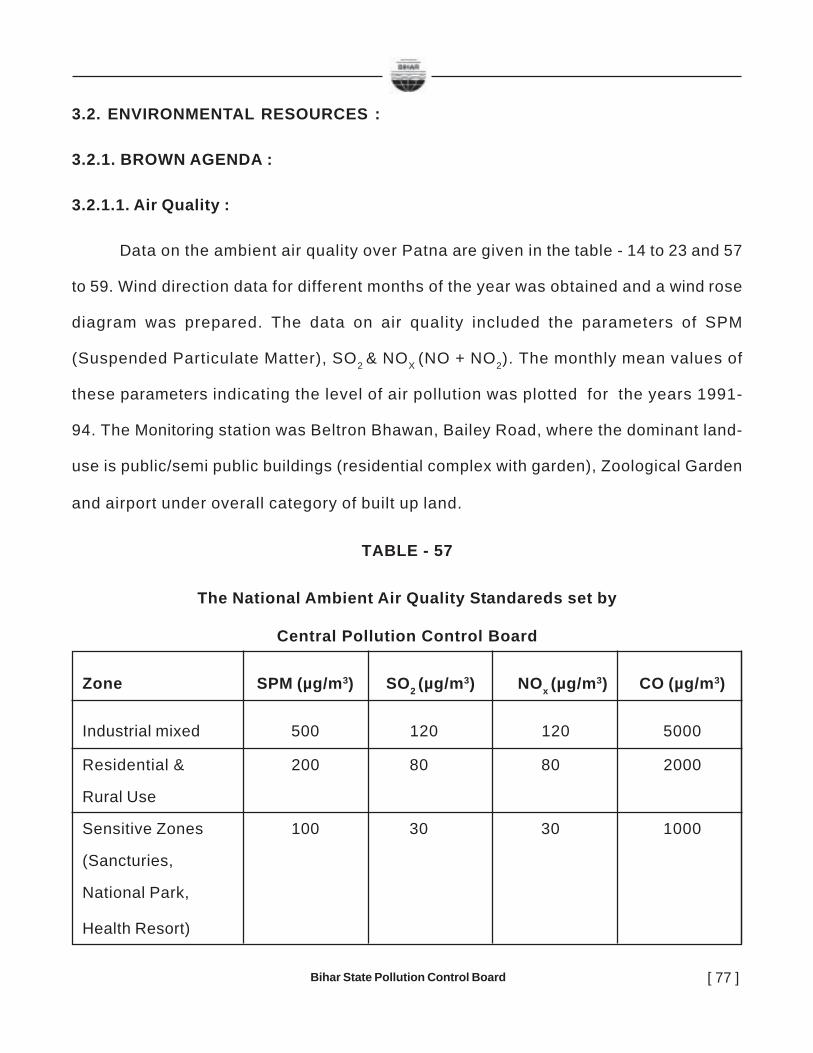
Bihar State Pollution Control Board [ 77 ]
3.2. ENVIRONMENTAL RESOURCES :
3.2.1. BROWN AGENDA :
3.2.1.1. Air Quality :
Data on the ambient air quality over Patna are given in the table - 14 to 23 and 57
to 59. Wind direction data for different months of the year was obtained and a wind rose
diagram was prepared. The data on air quality included the parameters of SPM
(Suspended Particulate Matter), SO2 & NOX (NO + NO2). The monthly mean values of
these parameters indicating the level of air pollution was plotted for the years 1991-
94. The Monitoring station was Beltron Bhawan, Bailey Road, where the dominant land-
use is public/semi public buildings (residential complex with garden), Zoological Garden
and airport under overall category of built up land.
TABLE - 57
The National Ambient Air Quality Standareds set by
Central Pollution Control Board
Zone SPM (µg/m3) SO2 (µg/m3) NOx (µg/m3) CO (µg/m3)
Industrial mixed 500 120 120 5000
Residential & 200 80 80 2000
Rural Use
Sensitive Zones 100 30 30 1000
(Sancturies,
National Park,
Health Resort)
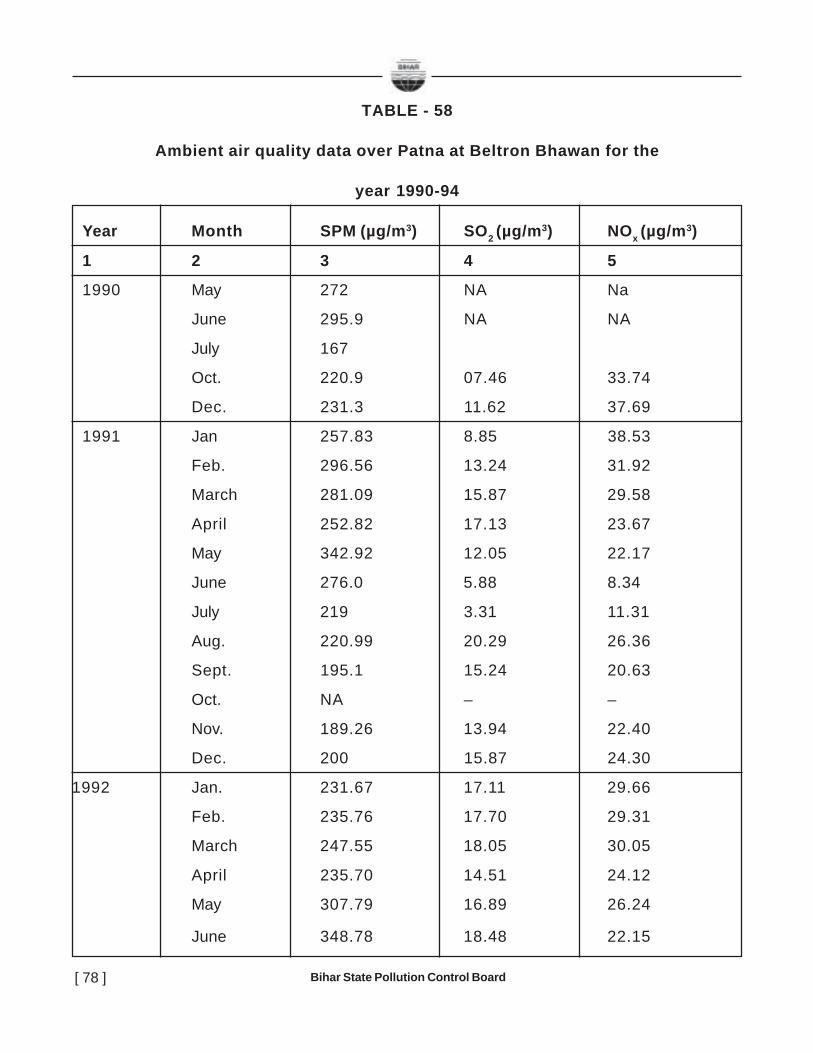
Bihar State Pollution Control Board[ 78 ]
TABLE - 58
Ambient air quality data over Patna at Beltron Bhawan for the
year 1990-94
Year Month SPM (µg/m3) SO2 (µg/m3) NOx (µg/m3)
1 2 3 4 5
1990 May 272 NA Na
June 295.9 NA NA
July 167
Oct. 220.9 07.46 33.74
Dec. 231.3 11.62 37.69
1991 Jan 257.83 8.85 38.53
Feb. 296.56 13.24 31.92
March 281.09 15.87 29.58
April 252.82 17.13 23.67
May 342.92 12.05 22.17
June 276.0 5.88 8.34
July 219 3.31 11.31
Aug. 220.99 20.29 26.36
Sept. 195.1 15.24 20.63
Oct. NA – –
Nov. 189.26 13.94 22.40
Dec. 200 15.87 24.30
1992 Jan. 231.67 17.11 29.66
Feb. 235.76 17.70 29.31
March 247.55 18.05 30.05
April 235.70 14.51 24.12
May 307.79 16.89 26.24
June 348.78 18.48 22.15
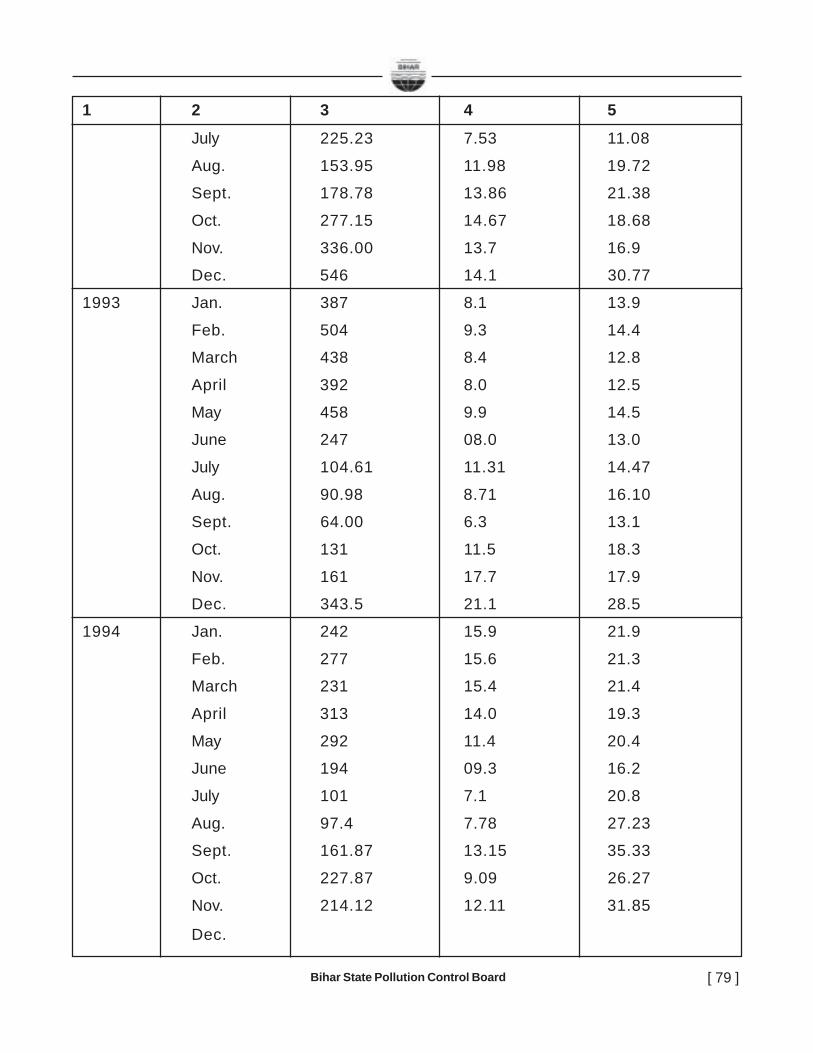
Bihar State Pollution Control Board [ 79 ]
1 2 3 4 5
July 225.23 7.53 11.08
Aug. 153.95 11.98 19.72
Sept. 178.78 13.86 21.38
Oct. 277.15 14.67 18.68
Nov. 336.00 13.7 16.9
Dec. 546 14.1 30.77
1993 Jan. 387 8.1 13.9
Feb. 504 9.3 14.4
March 438 8.4 12.8
April 392 8.0 12.5
May 458 9.9 14.5
June 247 08.0 13.0
July 104.61 11.31 14.47
Aug. 90.98 8.71 16.10
Sept. 64.00 6.3 13.1
Oct. 131 11.5 18.3
Nov. 161 17.7 17.9
Dec. 343.5 21.1 28.5
1994 Jan. 242 15.9 21.9
Feb. 277 15.6 21.3
March 231 15.4 21.4
April 313 14.0 19.3
May 292 11.4 20.4
June 194 09.3 16.2
July 101 7.1 20.8
Aug. 97.4 7.78 27.23
Sept. 161.87 13.15 35.33
Oct. 227.87 9.09 26.27
Nov. 214.12 12.11 31.85
Dec.
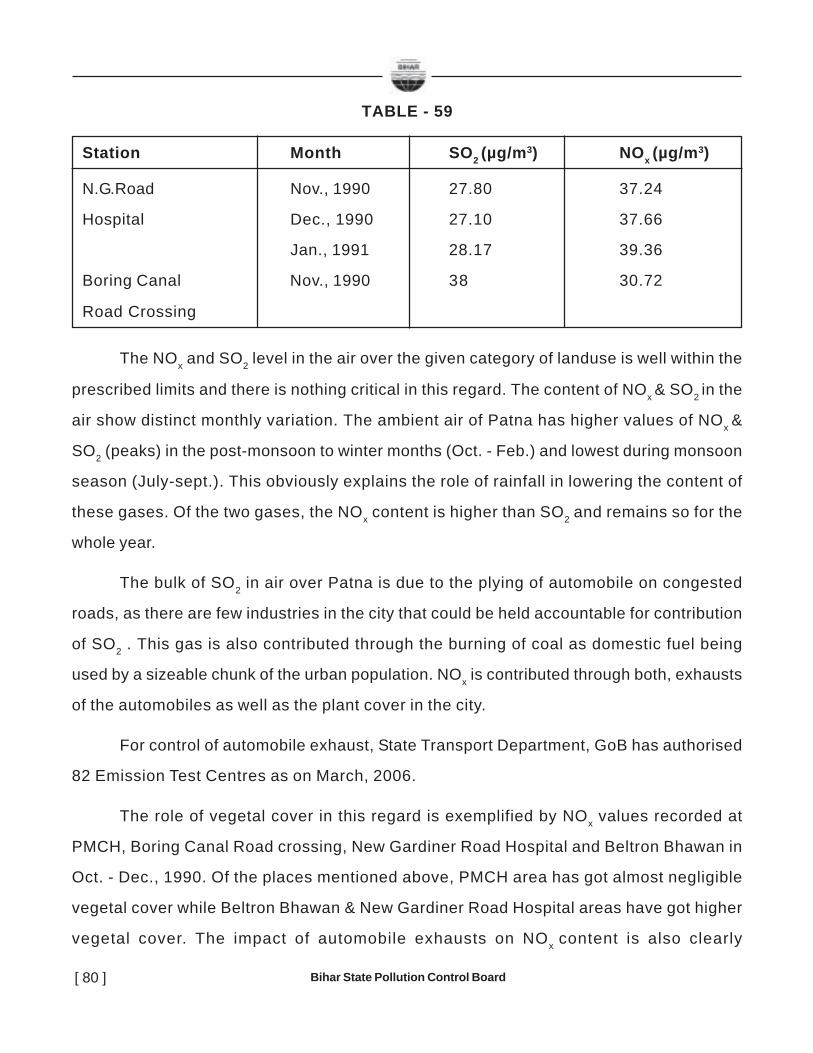
Bihar State Pollution Control Board[ 80 ]
TABLE - 59
Station Month SO2 (µg/m3) NOx (µg/m3)
N.G.Road Nov., 1990 27.80 37.24
Hospital Dec., 1990 27.10 37.66
Jan., 1991 28.17 39.36
Boring Canal Nov., 1990 38 30.72
Road Crossing
The NOx and SO2 level in the air over the given category of landuse is well within the
prescribed limits and there is nothing critical in this regard. The content of NOx & SO2 in the
air show distinct monthly variation. The ambient air of Patna has higher values of NOx &
SO2 (peaks) in the post-monsoon to winter months (Oct. - Feb.) and lowest during monsoon
season (July-sept.). This obviously explains the role of rainfall in lowering the content of
these gases. Of the two gases, the NOx content is higher than SO2 and remains so for the
whole year.
The bulk of SO2 in air over Patna is due to the plying of automobile on congested
roads, as there are few industries in the city that could be held accountable for contribution
of SO2 . This gas is also contributed through the burning of coal as domestic fuel being
used by a sizeable chunk of the urban population. NOx is contributed through both, exhausts
of the automobiles as well as the plant cover in the city.
For control of automobile exhaust, State Transport Department, GoB has authorised
82 Emission Test Centres as on March, 2006.
The role of vegetal cover in this regard is exemplified by NOx values recorded at
PMCH, Boring Canal Road crossing, New Gardiner Road Hospital and Beltron Bhawan in
Oct. - Dec., 1990. Of the places mentioned above, PMCH area has got almost negligible
vegetal cover while Beltron Bhawan & New Gardiner Road Hospital areas have got higher
vegetal cover. The impact of automobile exhausts on NOx content is also clearly

Bihar State Pollution Control Board [ 81 ]
demonstrated by the comparison of air data recorded at aforesaid stations. The traffic
density at Boring Canal Road crossing & N.G. Road Hospital is higher than that at Beltron
Bhawan. One month observation (Oct., 1990) at PMCH is available. This hospital is located
in the dense built up land category of the land use of Patna where the traffic density is high
and traffic congestion is also high. At this place the value of SO2 is higher than the other
observation stations referred above for the same month of the same year. Though the
average SO2 & NOx content at PMCH is below the tolerance limit, its maximum values exceed
the specified tolerance limits (30 µg/m3) and hence the traffic congestion is hazardous for
the hospital patients.
The SPM value is by and large above the tolerance limits for a very large part of the
city. The principal sources of SPM are the automobile exhausts, road dust, exhausts of
D.G. sets, industrial units at patliputra & the large channel/sandbars of the Ganga & the
Sone, burning of coal by roadside tea shops and hotels, and burning of dry leaves garbage
etc. The SPM value remain high (over 230 µg/m3) between January to June and fall below
200/µg/m3 range between July to September and again start rising from October onward.
A perusal of rose diagrams showing monthly wind direction pattern & calm days with
the monthly variation Graph (Fig. 3, 4, 5 & 6)enclosed herewith distinctly establishes one
of the principal sources for SPM to be the sands from the river Ganga & Son which are to
the north, west & southwest of the city. During the rainy months of July, August and Sept. the
dominant wind direction is from east, northeast & southeast and the river channels during
this period have by and large submerged channel bars. The dominant prevailing wind
direction in the months are from west, northwest, southwest, northeast & east. The dry river
beds thus become source of SPM during these months. Boring Canal Road crossing in
November, 1990 showed an abnormal high of 1213 µg/m3 SPM and this certainly can be
attributed to high automobile traffic density along with contributions from channel bars of
the Son and the Ganga. The SPM value in PMCH is well above the tolerance limit. The air
quality observations at three localities in the campus of PMCH is given in Table - 52

Bihar State Pollution Control Board[ 82 ]
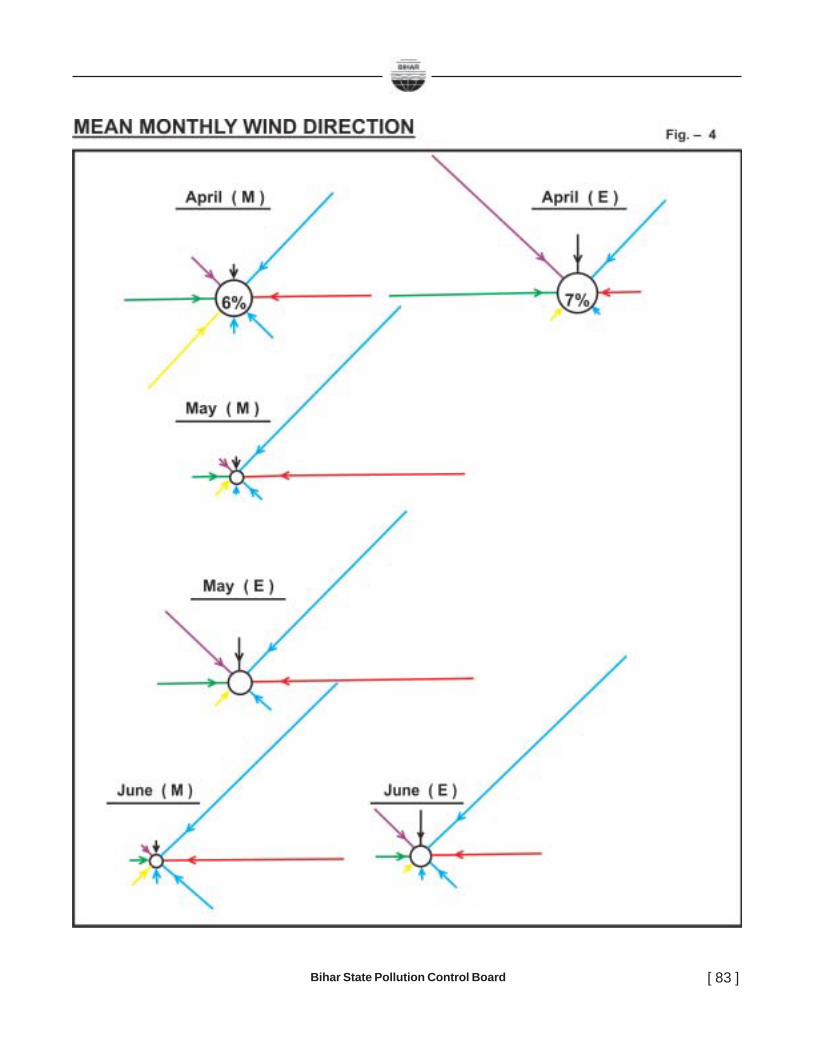
Bihar State Pollution Control Board [ 83 ]
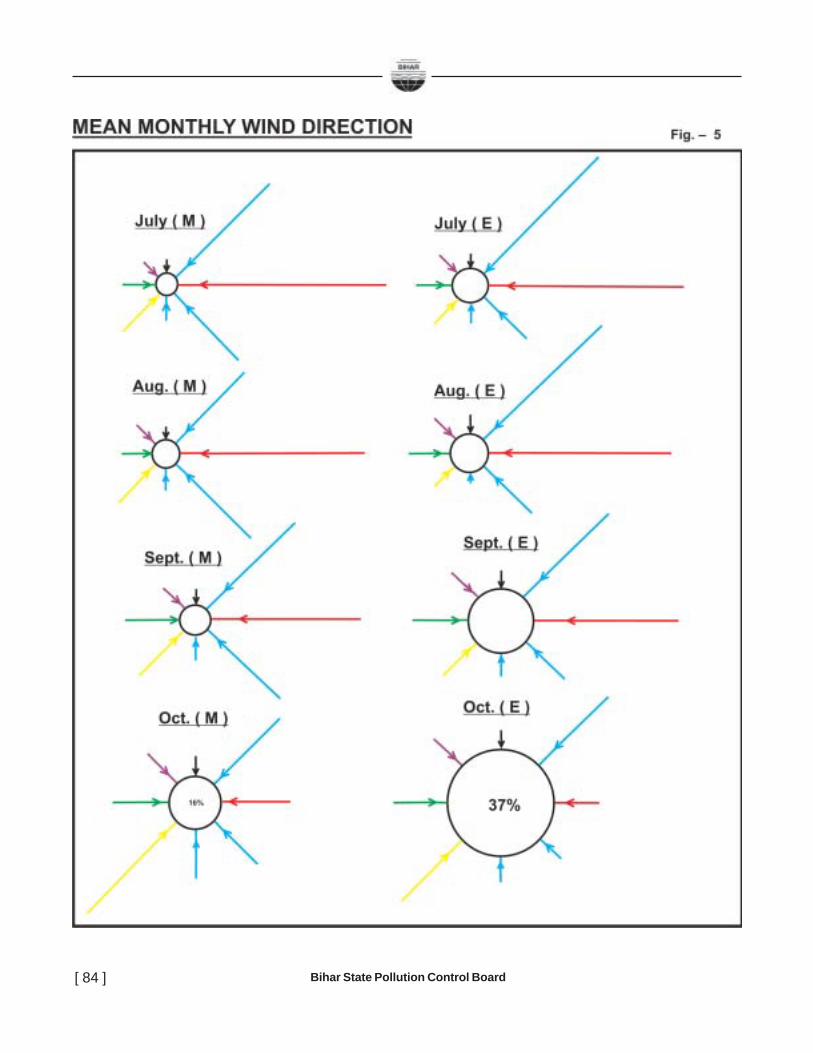
Bihar State Pollution Control Board[ 84 ]

Bihar State Pollution Control Board [ 85 ]

Bihar State Pollution Control Board[ 86 ]
TABLE - 60
Air quality data in PMCH campus
Sampling Point SMP (µg/m3) SO2 (µg/m3) NOx (µg/m3)
Nearly 33 m from 24 hourly values 24 hourly Min. 1.32
the southern bank are 399.53 min. 21.93 Max. 12.64of the Ganga & Min. 324.5 Max. 34.76 Tolerance limit
33 m north of Ashok max 547.8 Tolerance 30
Raj Path, 3 m a.g.l. Tolerance limit 30limit 100
Administrative Block Min. 250.75 Min. 0.86 Min. 6.35
in the middle of Max. 24.32 Max. 22.86campus. Max. 406.6 Ave. 9.11 Ave. 12.31
Eastern part of Max. 581.63 Max. 30.34 Max. 30.34PMCH Min. 221.14 Min. 0.88 Min. 17.36
campus, Ave. 455.10 Ave. 13.34 Ave. 24.23
25 m south ofsouthern bank of
the Ganga
3.2.1.2. SEWAGE
Urbanisation is inherently linked with consumption of natural and manmade resources
and hence generation of solid, liquid and gaseous waste is a continuous and increasing
process. The discussion is confined to liquid and solid waste generation and a brief account
of its management.
Solid waste can be categorised into the following three types- (1) Municipal solid
waste, (2) commercial, industrial and construction demolition waste and (3) Street refuge.
The average solid waste generated in an Indian city is 0.33 kg/capita/day while the range
in Patna is 0.15 kg/capita/day to 0.38 kg/capita day. Assuming a popoulation of 15,00,000

Bihar State Pollution Control Board [ 87 ]
this city generates about 0.33 × 15,00,000 = 4,95,000 Kg solid waste per day. Atleast
50% of this is arenaceous and argillaceous material and rest are decomposable vegetable
matter, papers, metal pieces, glass and human and animal excreta etc. The waste is dumped
at various topographic low sites in the city, particularly in the southern and eastern part
characterised by wet land.
The liquid waste is sewage and sullage
which flows through a network of open and
underground sewer lines into the Ganga
and the Punpun. Prior to 1936 the liquid
waste of the city used to flow directly into
the Ganga through open drains (Out falls)
at Kurj i , Rajapur, Mandir i , Antaghat,
Krishnaghat & Mote. But in 1936 a sew-
age treatment plant at Saidpur in Central
Zone was built with a capacity to treat 2
MLD sewage and a small STP at Beur (Western Zone) was built in 1975 to treat the liquid
waste before releasing the same into the Ganga.
With the growth of urban area and consequent activities there was a need to
strengthen the existing STPs, increase the network of soil sewage lines and storm water
drains. By late 80s, three STPs came into existence to treat the sewage and use of treated
sewage in irrigation.
The following information is available about various STPs.
1. Central Zone with STP at Saidpur has present capacity to handle 45 MLD raw
sewage by Activated Sludge Process. The treated sewage flows through Rampur
drains into Barmutta Nala and finally may lead to the Punpun.
2. Western Zone with STP at Beur has present capacity of 35 MLD raw sewage to be
treated by Activated Sludge Process.
3. Southern Zone with STP at Pahari has an installed capacity to handle 25 MLD raw
sewage by Activated Lagoon System. The treated sewage flows into the Punpun
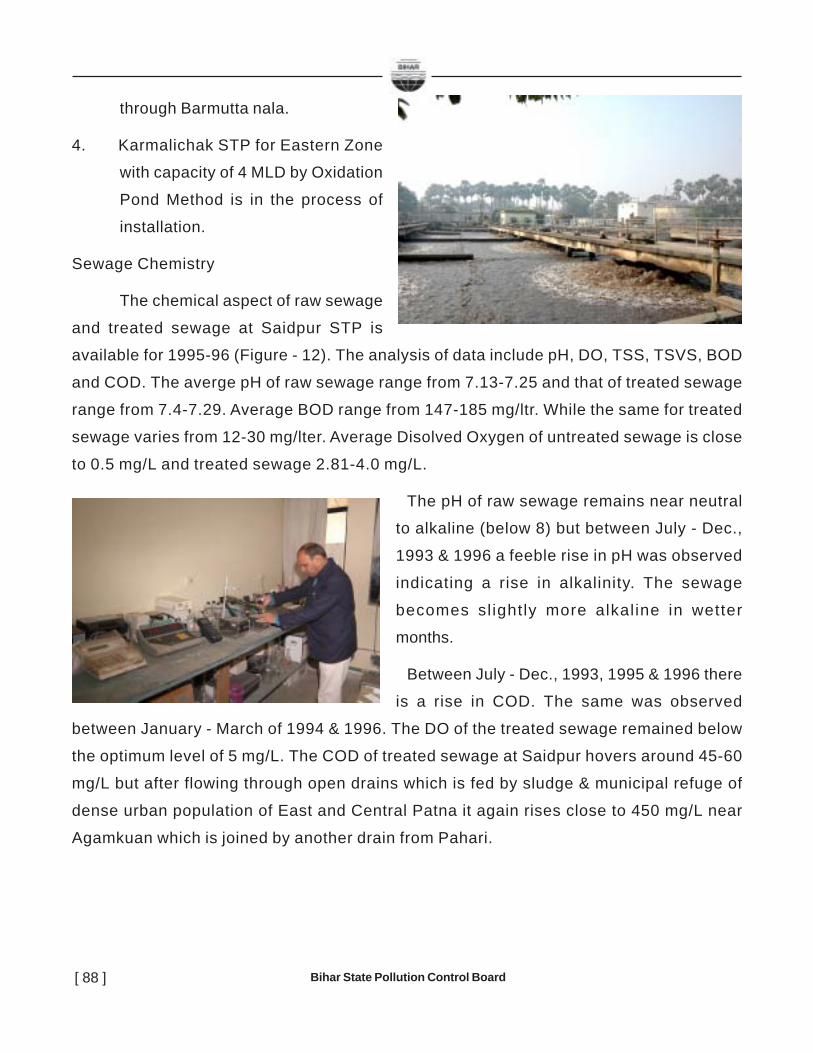
Bihar State Pollution Control Board[ 88 ]
through Barmutta nala.
4. Karmalichak STP for Eastern Zone
with capacity of 4 MLD by Oxidation
Pond Method is in the process of
installation.
Sewage Chemistry
The chemical aspect of raw sewage
and treated sewage at Saidpur STP is
available for 1995-96 (Figure - 12). The analysis of data include pH, DO, TSS, TSVS, BOD
and COD. The averge pH of raw sewage range from 7.13-7.25 and that of treated sewage
range from 7.4-7.29. Average BOD range from 147-185 mg/ltr. While the same for treated
sewage varies from 12-30 mg/lter. Average Disolved Oxygen of untreated sewage is close
to 0.5 mg/L and treated sewage 2.81-4.0 mg/L.
The pH of raw sewage remains near neutral
to alkaline (below 8) but between July - Dec.,
1993 & 1996 a feeble rise in pH was observed
indicating a rise in alkalinity. The sewage
becomes sl ightly more alkaline in wetter
months.
Between July - Dec., 1993, 1995 & 1996 there
is a rise in COD. The same was observed
between January - March of 1994 & 1996. The DO of the treated sewage remained below
the optimum level of 5 mg/L. The COD of treated sewage at Saidpur hovers around 45-60
mg/L but after flowing through open drains which is fed by sludge & municipal refuge of
dense urban population of East and Central Patna it again rises close to 450 mg/L near
Agamkuan which is joined by another drain from Pahari.
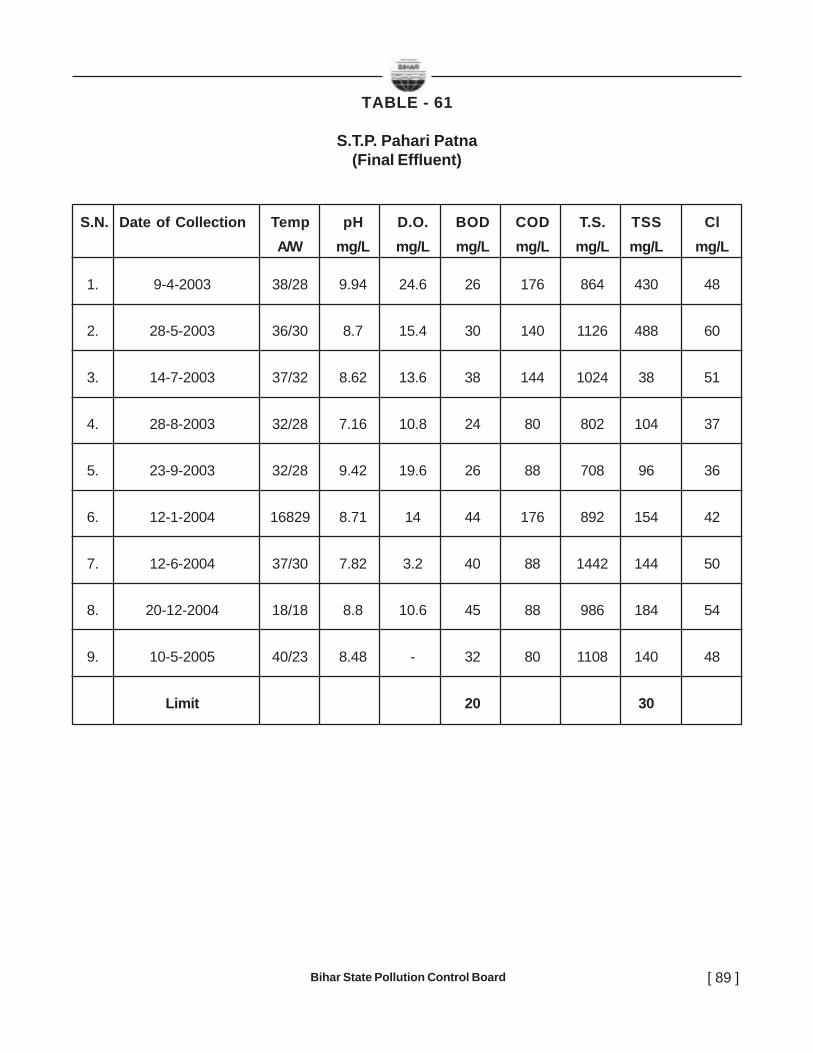
Bihar State Pollution Control Board [ 89 ]
TABLE - 61
S.T.P. Pahari Patna(Final Effluent)
S.N. Date of Collection Temp pH D.O. BOD COD T.S. TSS ClA/W mg/L mg/L mg/L mg/L mg/L mg/L mg/L
1. 9-4-2003 38/28 9.94 24.6 26 176 864 430 48
2. 28-5-2003 36/30 8.7 15.4 30 140 1126 488 60
3. 14-7-2003 37/32 8.62 13.6 38 144 1024 38 51
4. 28-8-2003 32/28 7.16 10.8 24 80 802 104 37
5. 23-9-2003 32/28 9.42 19.6 26 88 708 96 36
6. 12-1-2004 16829 8.71 14 44 176 892 154 42
7. 12-6-2004 37/30 7.82 3.2 40 88 1442 144 50
8. 20-12-2004 18/18 8.8 10.6 45 88 986 184 54
9. 10-5-2005 40/23 8.48 - 32 80 1108 140 48
Limit 20 30

Bihar State Pollution Control Board[ 90 ]
TABLE - 62
S.T.P. Saidpur Patna( Final Effluent)
S.N. Date of Collection Temp pH D.O. BOD COD T.S. TSS Cl
A/W mg/L mg/L mg/L mg/L mg/L mg/L mg/L
1. 9-4-2003 35/30 8.7 2.6 5.0 48.0 722 130 54
2. 28-5-2003 39/30 8.0 3.1 42 160 8.32 124 60
3. 14-7-2003 32/31 7.8 2.5 35 140 826 84 56
4. 28-8-2003 32/26 7.41 2.8 12 60 906 130 54
5. 23-9-2003 30/29 7.5 3.8 15 56 1934 84 54
6. 12-1-2004 14/21 7.46 2.8 32 180 1016 108 50
7. 10-2-2004 23/22 7.53 3.1 15 56 986 92 61
8. 12-6-2004 40/32 8.21 2.4 56 108 748 44 59
9. 10-7-2004 31/3 7.64 3.2 8.8 28 720 176 59
10. 20-12-2004 20/22 7.9 3.8 25.0 48 1126 1230 58
11. 10-5-2005 37/25 7.84 - 20 52 1010 130 56
Limit 20 30

Bihar State Pollution Control Board [ 91 ]
TABLE - 63
S.T.P. Beur Patna(Final Effluent)
S.N. Date of Collection Temp pH D.O. BOD COD T.S. TSS ClA/W mg/L mg/L mg/L mg/L mg/L mg/L mg/L
1. 9-4-2003 38/28 9.94 1.0 4.5 40 1304 266 54
2. 28-5-2003 42/32 7.8 2.8 20 80 1296 218 60
3. 14-7-2003 33/30 7.38 2.0 14 60 928 56 49
4. 28-8-2003 34/29 7.42 0.8 18 80 838 236 40
5. 23-9-2003 33/28 7.6 2.8 12 52 1068 72 44
6. 12-1-2004 15/20 7.48 3.0 48 188 846 1444 50
7. 10-2-2004 19/18 7.43 - 25 80 918 126 53
8. 25-6-2004 37/30 7.54 2.0 26 64 968 116 56
9. 20-12-2004 17/18 7.7 3.4 42 84 1028 158 56
10. 10-5-2005 40/23 7.71 - 32 84 936 134 58
Limit 20 30
TABLE - 64
S.T.P. Bhagalpur(Final Effluent)
S.N. Date of Collection Temp pH D.O. BOD COD T.S. TSS ClA/W mg/L mg/L mg/L mg/L mg/L mg/L mg/L
1. 17-6-2003 32/28 8.5 - 6.0 24 1346 140 230
2. 27-4-2005 37/26 7.61 - 35 112 1046 134 278
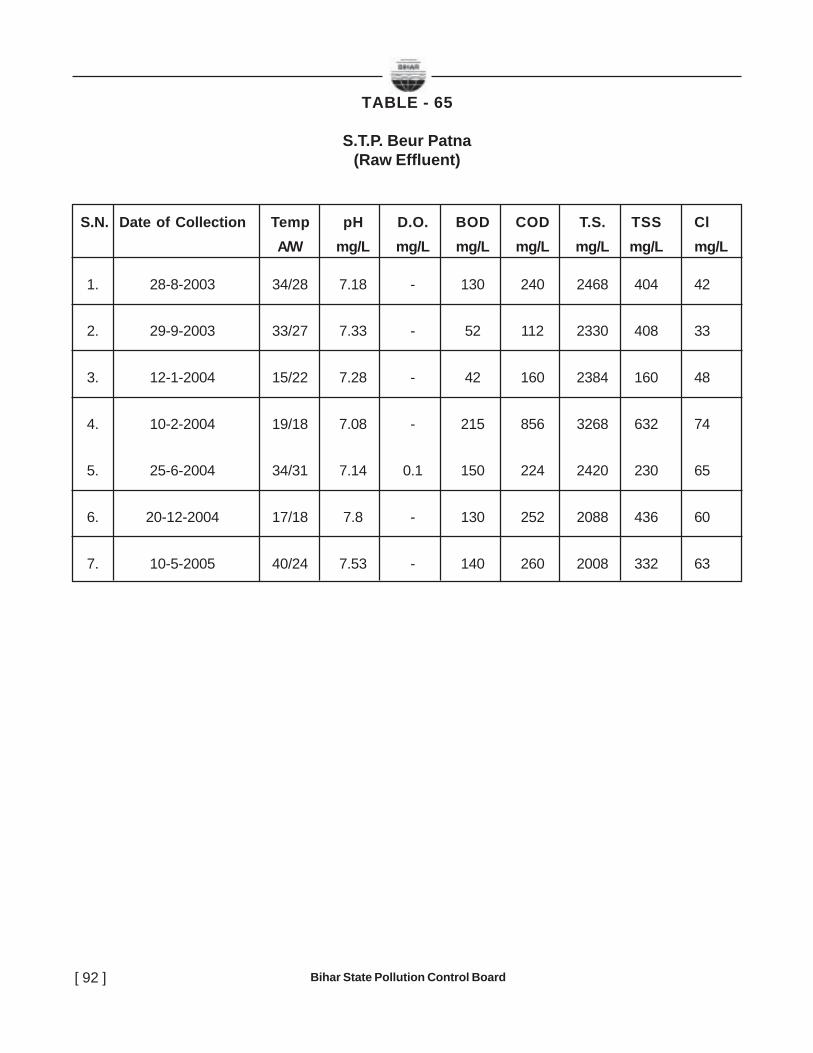
Bihar State Pollution Control Board[ 92 ]
TABLE - 65
S.T.P. Beur Patna(Raw Effluent)
S.N. Date of Collection Temp pH D.O. BOD COD T.S. TSS ClA/W mg/L mg/L mg/L mg/L mg/L mg/L mg/L
1. 28-8-2003 34/28 7.18 - 130 240 2468 404 42
2. 29-9-2003 33/27 7.33 - 52 112 2330 408 33
3. 12-1-2004 15/22 7.28 - 42 160 2384 160 48
4. 10-2-2004 19/18 7.08 - 215 856 3268 632 74
5. 25-6-2004 34/31 7.14 0.1 150 224 2420 230 65
6. 20-12-2004 17/18 7.8 - 130 252 2088 436 60
7. 10-5-2005 40/24 7.53 - 140 260 2008 332 63

Bihar State Pollution Control Board [ 93 ]
TABLE - 66
S.T.P. Pahari Patna(Raw Effluent)
S.N. Date of Collection Temp pH D.O. BOD COD T.S. TSS ClA/W mg/L mg/L mg/L mg/L mg/L mg/L mg/L
1. 28-8-2003 33/29 7.52 - 65 120 1086 282 12
2. 23-9-2003 32/27 7.4 - 75 136 1324 82 27
3. 12-1-2004 16/20 7.41 - 74 284 1894 204 35
4. 12-6-2004 36/32 7.52 1.0 90 192 486 102 20
5. 20-12-2004 18/19 7.83 - 115 224 1734 226 50
6. 10-5-2005 39/24 7.42 - 46 116 1684 202 50
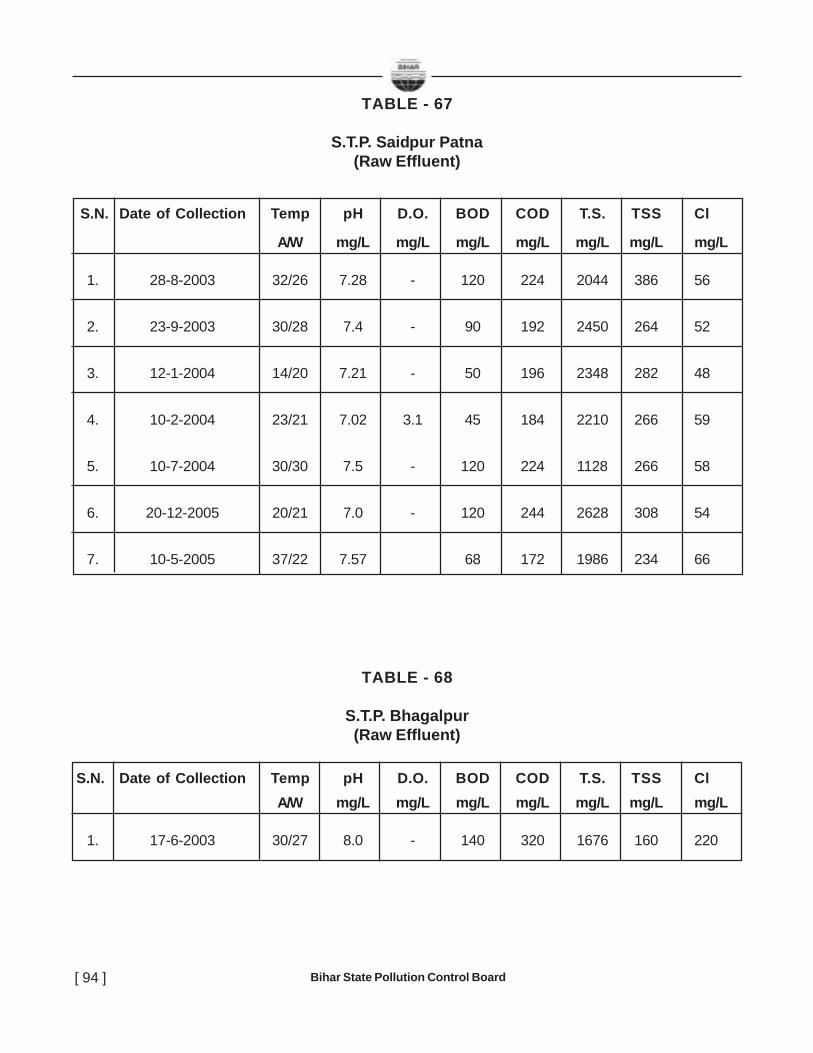
Bihar State Pollution Control Board[ 94 ]
TABLE - 67
S.T.P. Saidpur Patna(Raw Effluent)
S.N. Date of Collection Temp pH D.O. BOD COD T.S. TSS Cl
A/W mg/L mg/L mg/L mg/L mg/L mg/L mg/L
1. 28-8-2003 32/26 7.28 - 120 224 2044 386 56
2. 23-9-2003 30/28 7.4 - 90 192 2450 264 52
3. 12-1-2004 14/20 7.21 - 50 196 2348 282 48
4. 10-2-2004 23/21 7.02 3.1 45 184 2210 266 59
5. 10-7-2004 30/30 7.5 - 120 224 1128 266 58
6. 20-12-2005 20/21 7.0 - 120 244 2628 308 54
7. 10-5-2005 37/22 7.57 68 172 1986 234 66
TABLE - 68
S.T.P. Bhagalpur(Raw Effluent)
S.N. Date of Collection Temp pH D.O. BOD COD T.S. TSS ClA/W mg/L mg/L mg/L mg/L mg/L mg/L mg/L
1. 17-6-2003 30/27 8.0 - 140 320 1676 160 220
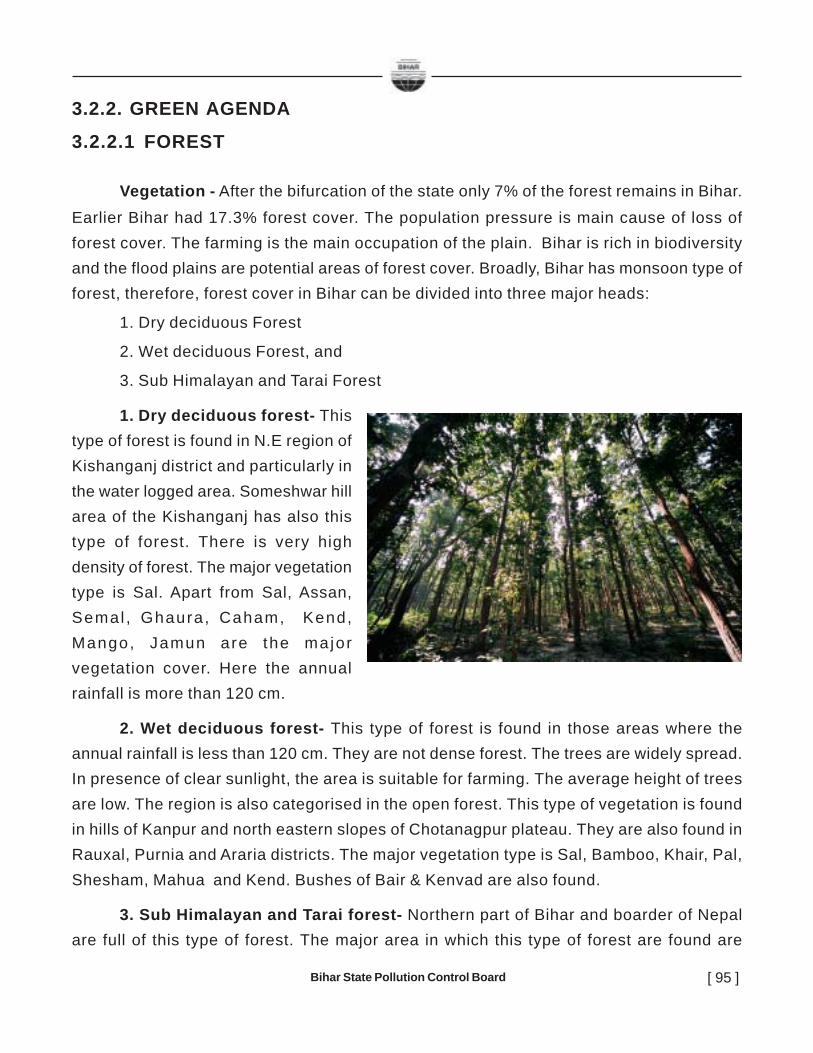
Bihar State Pollution Control Board [ 95 ]
3.2.2. GREEN AGENDA
3.2.2.1 FOREST
Vegetation - After the bifurcation of the state only 7% of the forest remains in Bihar.Earlier Bihar had 17.3% forest cover. The population pressure is main cause of loss offorest cover. The farming is the main occupation of the plain. Bihar is rich in biodiversityand the flood plains are potential areas of forest cover. Broadly, Bihar has monsoon type offorest, therefore, forest cover in Bihar can be divided into three major heads:
1. Dry deciduous Forest
2. Wet deciduous Forest, and
3. Sub Himalayan and Tarai Forest
1. Dry deciduous forest- Thistype of forest is found in N.E region ofKishanganj district and particularly inthe water logged area. Someshwar hillarea of the Kishanganj has also thistype of forest. There is very highdensity of forest. The major vegetationtype is Sal. Apart from Sal, Assan,Semal , Ghaura, Caham, Kend,Mango, Jamun are the majorvegetation cover. Here the annualrainfall is more than 120 cm.
2. Wet deciduous forest- This type of forest is found in those areas where theannual rainfall is less than 120 cm. They are not dense forest. The trees are widely spread.In presence of clear sunlight, the area is suitable for farming. The average height of treesare low. The region is also categorised in the open forest. This type of vegetation is foundin hills of Kanpur and north eastern slopes of Chotanagpur plateau. They are also found inRauxal, Purnia and Araria districts. The major vegetation type is Sal, Bamboo, Khair, Pal,Shesham, Mahua and Kend. Bushes of Bair & Kenvad are also found.
3. Sub Himalayan and Tarai forest- Northern part of Bihar and boarder of Nepalare full of this type of forest. The major area in which this type of forest are found are

Bihar State Pollution Control Board[ 96 ]
western Champaran (Showmeshwar), Purnia and Araria. Here there are high humidity andlow temperature due to height. The major vegetation type are sal, Tun, Oak, Pinl. This areais sample evidence of the type of vegetation found in Sub Himalayan forest. Small busheslike Sawana grass, bamboo, Merkat and Jhau are found in the southern part.
The growing demand of wood in the day-today life and in paper industries, thegovernment has launched comprehensive plan for plantation. Plantation of Bamboo,Eucalyptus and Teak are top in the agenda. In order to protect wild life, the government hasnotified reserved area. They are as follows:
1. Bhimbhand, Munger (Tiger, Tendua, Chital, Banaur saver, Nilgai)
2. Rajgir, Rajgir (Kokar, Langoor, Deer, Nilgai, Cheeta)
3. Valimikinagar Project Tiger, Champaran (water birds, Cheetal, Tiger, Tendua,Crochodile, Para, Mrig, Baneur saver)
4. Gautam Budh, Gaya (Tiger, Cheeta, Samber, Cheetal, Nilgaya, Beneur saver)
5. Kaiwar Jheel bird, Begusarai (various types Indian and migratory birds)
6. Kusesar, Darbhanga (Siberian birds)
7. Gogavilla, Katihar
8. Perman Dolphin
Bihar needs 33% forest cover. Tarai belt, Southern plateau and river banks arepotential areas of forest. But the major problem in Bihar is river erosion. The social forestryhas also wider scope in Bihar. Large area of the flood plain is ideally suitable for forest.Therefore, these area may be utilized for forest. The government has launched a programmeto plant trees along the roadside, open railway land and on barren land. The scope of theseforest is to meet the requirement of fossil fuel, fodder etc. Forest farming is also beingpractised in Bihar. Farmers are encouraged to plant trees of Sal, Shesam, etc. in theirrepective barren land.
Due to low forest cover, the state is facing acute problem of rainfall, soil erosion, lowsize of pure sowing land and above all decreasing wild life animals. The population of wildlife animal is shrinking at a phenomenal rate. Earlier, Gaya, Nawada, Munger, Jamui,Sasaram, Kaimur, Purnia, Araria, Champaran, Darbhanga districts were having sufficientforest cover but at present these districts are almost devoid of forest cover. Districtwiseforest cover is shown in Table- 69. This has also resulted in air pollution. Therefore, there isan immediate and urgent need to check deforestation and give thrust on plantation.

Bihar State Pollution Control Board [ 97 ]
TABLE - 69
Districtwise Forest Cover (Area in Sq.km)
Forest CoverDistrict Geographic Very Moderately Open Total Percent
Area Dense Dense Forest ForestAraria 2830 0 14 14 28 0.99Aurangabad 3305 0 46 100 146 4.42Banka 3022 0 120 91 211 6.98Begusarai 1918 0 3 3 6 0.31Bhabhua 3381 0 544 550 1094 32.36Bhagalpur 2567 0 12 7 19 0.74Bhojpur 2390 0 7 1 8 0.33Buxar 1708 0 8 4 12 0.70Darbhanga 2279 0 5 6 11 0.48Gaya 4976 0 119 463 582 11.70Gopalganj 2033 0 0 0 0 0.00Jamui 3107 9 392 256 657 21.15Jehanabad& Arwal 1569 0 2 1 3 0.19Katihar 3057 0 1 4 5 0.16Khagaria 1486 0 2 1 3 0.20Kishanganj 1884 0 1 8 9 0.48Lakhisarai 1356 0 176 18 194 14.31Madhepura 1788 0 6 4 10 0.56Madhubani 3501 0 10 4 14 0.40Munger 1347 43 201 18 262 19.45Muzaffarpur 3172 0 2 2 4 0.13Nalanda 2367 0 16 47 63 2.66Nawada 2494 0 191 316 507 20.33PashchimiChamparan 5228 24 694 201 919 17.58Patna 3202 0 7 8 15 0.47PurviChamparan 3968 0 9 1 10 0.25Purnia 3229 0 4 11 15 0.46Rohtas 3832 0 310 374 684 17.85Saharsa 1680 0 5 1 6 0.36Samastipur 2904 0 9 3 12 0.41Saran 2641 0 7 4 11 0.42Sheikhpura 612 0 1 0 1 0.16Sheohar 572 0 1 0 1 0.17Sitamarhi 2071 0 4 1 5 0.24Siwan 2219 0 1 3 4 0.18Supaul 2432 0 9 6 15 0.62Vaishali 2036 0 12 0 12 0.59Total 94,163 76 2,951 2,531 5,558 5.90
(Source: State of Forest Report, 2003)

Bihar State Pollution Control Board[ 98 ]
3.2.2.2. BIODIVERSITY
Flora of Bihar
Erstwhile Bihar, lying close to the foot hills of Nepal and covering an area of 1,73,877 sq km, harboursa very rich and diverse flora. Its unique phytogeographical position, topography and good precipitationare some of the important factors which are mainly responsible for high degree of plant diversity. Theoccurrence of different types of forests, ranging from subtropical to tropical and consequently theestablishment of three National Parks and twenty Wildlife sanctuaries in the state, which constitutean important source of germplasm, are of considerable interest. Although the state has beenbotanically surveyed since 1848 and the Flora was published during 1921-1925 which includedBihar, Orissa and parts of West Bengal, but the complete Flora of Bihar itself is not in hand.Simultaneously, the natural vegetation since Haines’ publication has been continuously andincreasingly under pressure owing to developmental projects including mining activities and non-judicious exploitation of plant resources. These reasons coupled with the publication of a number ofnew plant records for the state warrant the need of fresh estimation of current status of floristicaccount of the state.
The major families found in the areas are as follows:
1. Ranunculaceae. 2. Dilleniaceae. 3. Magnoliaceae. 4. Annonaceae. 5. Menispermaceae.6. Berberidaceae. 7. Nymphaeaceae. 8. Nelumbonaceae. 9. Papaveraceae.10. Fumariaceae.11.Brassicaceae. 12. Capparaceae. 13. Violaceae. 14. Bixaceae.15. Cochlospermaceae. 16. Flacourtiaceae. 17. Pittosporaceae. 18. Polygalaceae.19. Caryophyllaceae. 20. Portulacaceae. 21. Tamaricaceae. 22. Elatinaceae. 23. Hypericaceae.24. Clusiaceae. 25. Theaceae. 26. Dipterocarpaceae. 27. Malvaceae. 28. Bombacaceae.29. Sterculiaceae. 30. Tiliaceae. 31. Elaeocarpaceae. 32. Linaceae. 33. Erythroxylaceae.34. Malpighiaceae. 35. Zygophyllaceae. 36. Geraniaceae. 37. Tropaeolaceae. 38. Oxalidaceae.39. Averrhoaceae. 40. Balsaminaceae. 41. Rutaceae. 42. Simaroubaceae. 43. Balanitaceae.44. Ochnaceae. 45. Burseraceae. 46. Meliaceae. 47. Olacaceae. 48. Opiliaceae. 49. Icacinaceae.50. Aquifoliaceae. 51. Celastraceae. 52. Siphonodontaceae. 53. Hippocrateaceae. 54. Rhamnaceae.55. Vitaceae. 56. Leeaceae. 57. Sapindaceae. 58. Sabiaceae. 59. Anacardiaceae. 60. Moringaceae.61. Fabaceae. 62. Caesalpiniaceae. 63. Mimosaceae. 64. Rosaceae. 65. Vahliaceae.66. Crassulaceae. 67. Droseraceae. 68. Haloragidaceae. 69. Callitrichaceae. 70. Rhizophoraceae.71. Combretaceae. 72. Myrtaceae. 73. Lecythidaceae. 74. Melastomataceae. 75. Lythraceae.76. Punicaceae. 77. Onagraceae. 78. Trapaceae. 79. Turneraceae. 80. Passifloraceae.81. Caricaceae. 82. Cucurbitaceae. 83. Begoniaceae. 84. Cactaceae. 85. Aizoaceae.
Bihar State Pollution Control Board [ 99 ]
86. Molluginaceae. 87. Apiaceae. 88. Araliaceae. 89. Alangiaceae. 90. Rubiaceae. 91. Asteraceae.92. Stylidiaceae. 93. Campanulaceae. 94. Lobeliaceae. 95. Sphenocleaceae. 96. Vacciniaceae.97. Plumbaginaceae. 98. Primulaceae. 99. Myrsinaceae. 100. Theophrastaceae. 101. Sapotaceae.102. Ebenaceae. 103. Symplocaceae. 104. Oleaceae. 105. Salvadoraceae. 106. Apocynaceae.107. Asclepiadaceae. 108. Loganiaceae. 109. Buddlejaceae. 110. Gentianaceae.111. Menyanthaceae. 112. Polemoniaceae. 113. Hydrophyllaceae. 114. Boraginaceae.115. Convolvulaceae. 116. Cuscutaceae. 117. Solanaceae. 118. Scrophulariaceae.119. Orobanchaceae. 120. Lentibulariaceae. 121. Gesneriaceae. 122. Bignoniaceae.123. Pedaliaceae. 124. Acanthaceae. 125. Verbenaceae. 126. Lamiaceae. 127. Plantaginaceae.128. Nyctaginaceae. 129. Amaranthaceae. 130. Chenopodiaceae. 131. Basellaceae.132. Phytolaccaceae. 133. Polygonaceae. 134. Aristolochiaceae. 135. Piperaceae.136. Lauraceae. 137. Proteaceae. 138. Loranthaceae. 139. Santa laceae.140. Balanophoraceae. 141. Euphorbiaceae. 142. Urt icaceae. 143. Ulmaceae.144. Cannabaceae. 145. Moraceae. 146. Casuar inaceae. 147. Sa l icaceae.148. Ceratophyllaceae. 149. Hydrocharitaceae. 150. Burmanniaceae. 151. Orchidaceae.152. Z ing iberaceae. 153. Costaceae. 154. Marantaceae. 155. Musaceae.156. St re l i tz iaceae. 157. Cannaceae. 158. Bromel iaceae. 159. I r idaceae.160. Amaryl l idaceae. 161. Hypoxidaceae. 162. Agavaceae. 163. Taccaceae.164. Dioscoreaceae. 165. L i l iaceae. 166. Ponteder iaceae. 167. Xyr idaceae.168. Commelinaceae. 169. Flagel lar iaceae. 170. Juncaceae. 171. Arecaceae.172. Pandanaceae. 173. Cyclanthaceae. 174. Typhaceae. 175. Araceae. 176. Lemnaceae.177. Alismataceae. 178. Limnocharitaceae. 179. Najadaceae. 180. Aponogetonaceae.181. Potamogetonaceae. 182. Ruppiaceae. 183. Zannichelliaceae. 184. Eriocaulaceae.185. Cyperaceae. 186. Poaceae.
Fauna of Bihar
The jungles of Bihar abound in wildlife, though some of the notable game animals andbirds like tiger, deer, buffalo, duck etc., are fast disappearing. In order to prevent theextinction of any species and to preserve them and maintain their balance with nature,thirteen wildlife sanctuaries have been set up. Three sanctuaries are in northern fringe ofwest Champaran district. As a result of strict management and proper protection given towildlife, the present form has become much richer than the past and the difficult task ofwildlife resusciation and conservation has been greatly acheived, so that some of the rareanimals on the verge of extinction, such as elephant, gaur, etc., have considerably multiplied.

Bihar State Pollution Control Board[ 100 ]
3.2.3. BLUE AGENDA
3.2.3.1. WATER AVAILABILITY & WATER STRESS
The water resources of the state is monitored through major, medium and minor irrigation
schemes. The surface water is managed through major and medium irrigation projects governed
with a network of canal system Viz; Son, Kosi, Gandak and Chandan-Badua river irrigation project,
whereas the minor irrigation is managed by river lift irrigation, deep tubewells, shallow tubewells,
dug wells, tanks and bamboo boring schemes. The irrigation potential created through these
sources till 1991 was 35.6 lakh hectares of which surface water irrigation was 26 lakh hectares
and ground water irrigation was 9.6 lakh hectares against the irrigation potential of about 122
lakh hectares so far estimated (65 lakh hectares
through surface water and 57 lakh hectares through
ground water).
The water quality of major rivers of the state such
as Ganga, Ghaghra, Sone and Gandak are being
monitored. Annual average of some of the important
parameters for the years 2003-04 to 2005-06 of
these rivers are presented in Table-70 to 72. It is
evident from these results that parameters like pH,
DO and BOD are within the acceptable limits whereas, coliform countes exceeds prescribed
limits even for bathing purposes.
As reported by Public Health Engineering Department, Government of Bihar nine north
easter districts viz; kishanganj, Purnea, Katihar, Madhepura, Araria, Saharsa, Supaul, Khagaria
& Begusarai are affected by excessive Iron while some of the districts nomely Gaya, Nawada,
Jamui & Munger are affected by excessive flouride. The 11 districts bordering Ganga are affected
by excess Arsenic content in drinking water sources. Excess nitrate in few habitations has also
been noticed, and (ii) ground water is used for drinking purposes and water is mainly drawn
through hand pumps.
The Plate No. 11 exhibits sourcewise irrigation through canal, deep tubewell, shallow
tubewells and bamboo borings on district base alongwith the command area of canal systems.
Distribution different types of wells in districts of Bihar is also presented at Table - 73.

Bihar State Pollution Control Board [ 101 ]
TABLE - 70Year 2003-2004
SamplingStations
RiverSl. Annual Average Values of ParameterspH
ValueD.O.mg/L
BODmg/L
T.C.MPN/100
mL
FCMPN/100
mL1. Ganga (i) Baxur 8.18 8.19 1.96 4240 1360
(ii) Patna U/S 7.97 8.05 1.72 1890 920(iii) Patna D/S 7.9 8.06 1.96 4870 1100(iv) Mokama U/S 7.6 7.78 2.06 4300 1225(v) Mokama D/S 7.59 7.58 5.32 11600 2500
2. Ghaghra Chapra 8.15 8.1 1.64 1911 8503. Sone Koelwar 7.94 8.17 1.62 2420 7724. Gandak Sonepur 8.06 8.05 1.51 1055 480
TABLE - 71Year 2004-2005
SamplingStations
RiverSl. Annual Average Values of ParameterspH
ValueD.O.mg/L
BODmg/L
T.C.MPN/100
mL
FCMPN/100
mL1. Ganga (i) Baxur 8.17 7.24 2.02 12022 2911
(ii) Patna U/S 8.06 8.27 1.87 6475 1544(iii) Patna D/S 8.09 8.25 2.05 13066 5100(iv) Mokama U/S 8.13 8.21 1.78 1900 1039(v) Mokama D/S 8.16 8.1 2.11 5916 1550
2. Ghaghra Chapra 7.9 8.2 1.58 1236 6873. Sone Koelwar 7.9 8.01 1.6 1044 5234. Gandak Sonepur 8.0 8.13 1.54 1038 532
TABLE - 72Year 2005-2006
SamplingStations
RiverSl. Annual Average Values of ParameterspH
ValueD.O.mg/L
BODmg/L
T.C.MPN/100
mL
FCMPN/100
mL1. Ganga (i) Baxur 8.14 8.04 2.13 18133 7883
(ii) Patna U/S 8.04 8.30 2.04 19892 7517(iii) Patna D/S 8.08 8.25 2.20 38292 10458(iv) Mokama U/S 7.95 8.00 2.06 14540 7310(v) Mokama D/S 8.02 7.90 2.30 45000 15900(vi) Munger 8.03 8.20 1.90 10133 5400(vii) Bhagalpur 7.83 8.20 2.06 15900 7700(viii) Kahalgaon 7.92 8.08 2.14 22875 9733
2. Ghaghra Chapra 7.96 8.02 1.83 3708 18673. Sone Koelwar 7.90 7.90 1.80 7542 35254. Gandak Sonepur 7.94 8.01 1.70 4100 1948
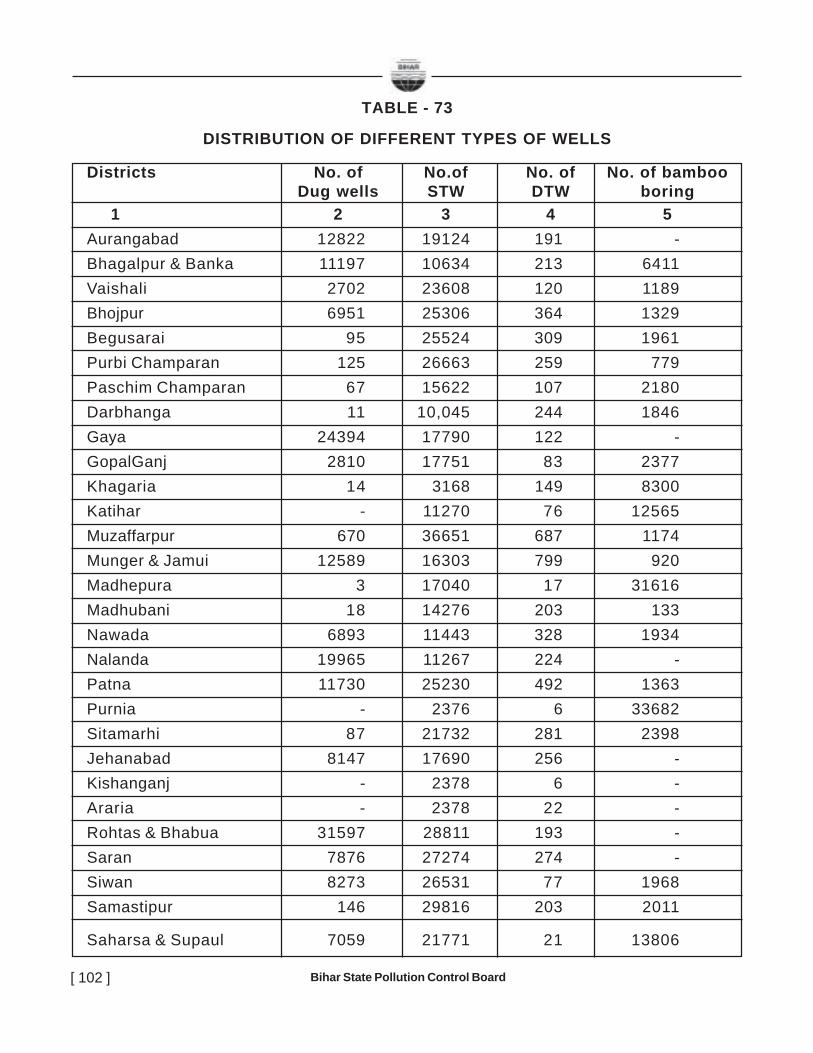
Bihar State Pollution Control Board[ 102 ]
TABLE - 73
DISTRIBUTION OF DIFFERENT TYPES OF WELLS
Districts No. of No.of No. of No. of bambooDug wells STW DTW boring
1 2 3 4 5Aurangabad 12822 19124 191 -Bhagalpur & Banka 11197 10634 213 6411Vaishali 2702 23608 120 1189Bhojpur 6951 25306 364 1329Begusarai 95 25524 309 1961Purbi Champaran 125 26663 259 779Paschim Champaran 67 15622 107 2180Darbhanga 11 10,045 244 1846Gaya 24394 17790 122 -GopalGanj 2810 17751 83 2377Khagaria 14 3168 149 8300Katihar - 11270 76 12565Muzaffarpur 670 36651 687 1174Munger & Jamui 12589 16303 799 920Madhepura 3 17040 17 31616Madhubani 18 14276 203 133Nawada 6893 11443 328 1934Nalanda 19965 11267 224 -Patna 11730 25230 492 1363Purnia - 2376 6 33682Sitamarhi 87 21732 281 2398Jehanabad 8147 17690 256 -Kishanganj - 2378 6 -Araria - 2378 22 -Rohtas & Bhabua 31597 28811 193 -Saran 7876 27274 274 -Siwan 8273 26531 77 1968Samastipur 146 29816 203 2011
Saharsa & Supaul 7059 21771 21 13806
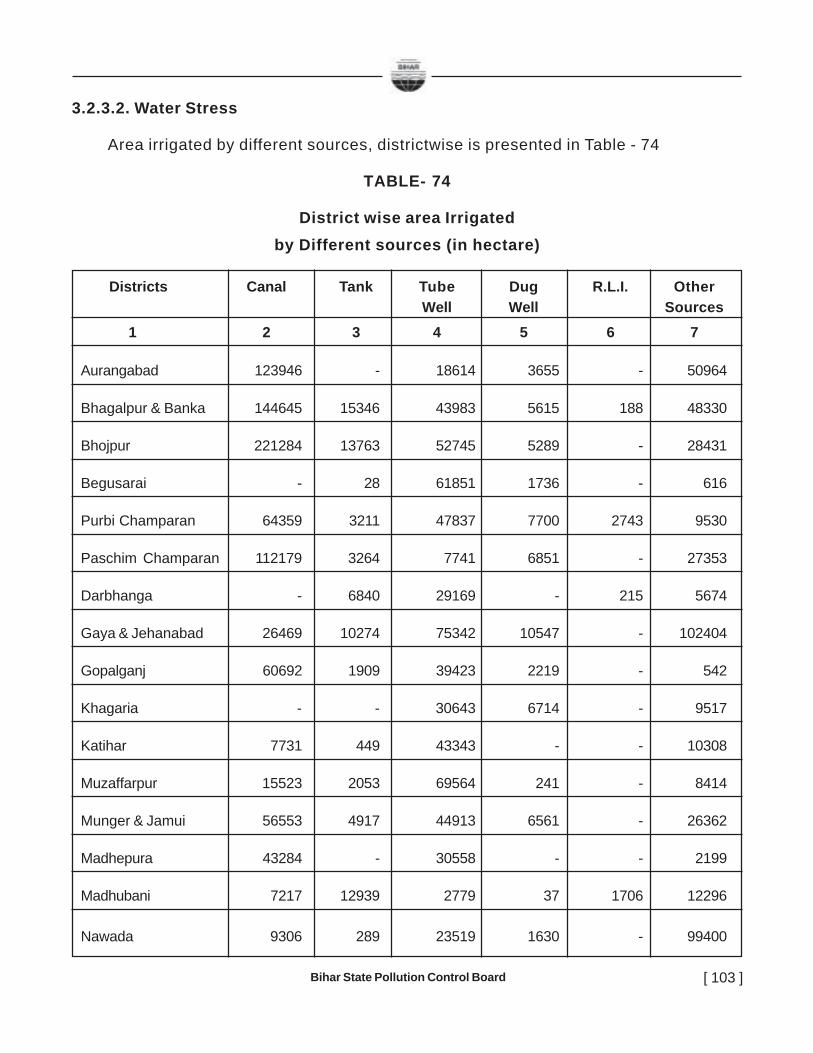
Bihar State Pollution Control Board [ 103 ]
3.2.3.2. Water Stress
Area irrigated by different sources, districtwise is presented in Table - 74
TABLE- 74
District wise area Irrigatedby Different sources (in hectare)
Districts Canal Tank Tube Dug R.L.I. OtherWell Well Sources
1 2 3 4 5 6 7
Aurangabad 123946 - 18614 3655 - 50964
Bhagalpur & Banka 144645 15346 43983 5615 188 48330
Bhojpur 221284 13763 52745 5289 - 28431
Begusarai - 28 61851 1736 - 616
Purbi Champaran 64359 3211 47837 7700 2743 9530
Paschim Champaran 112179 3264 7741 6851 - 27353
Darbhanga - 6840 29169 - 215 5674
Gaya & Jehanabad 26469 10274 75342 10547 - 102404
Gopalganj 60692 1909 39423 2219 - 542
Khagaria - - 30643 6714 - 9517
Katihar 7731 449 43343 - - 10308
Muzaffarpur 15523 2053 69564 241 - 8414
Munger & Jamui 56553 4917 44913 6561 - 26362
Madhepura 43284 - 30558 - - 2199
Madhubani 7217 12939 2779 37 1706 12296
Nawada 9306 289 23519 1630 - 99400
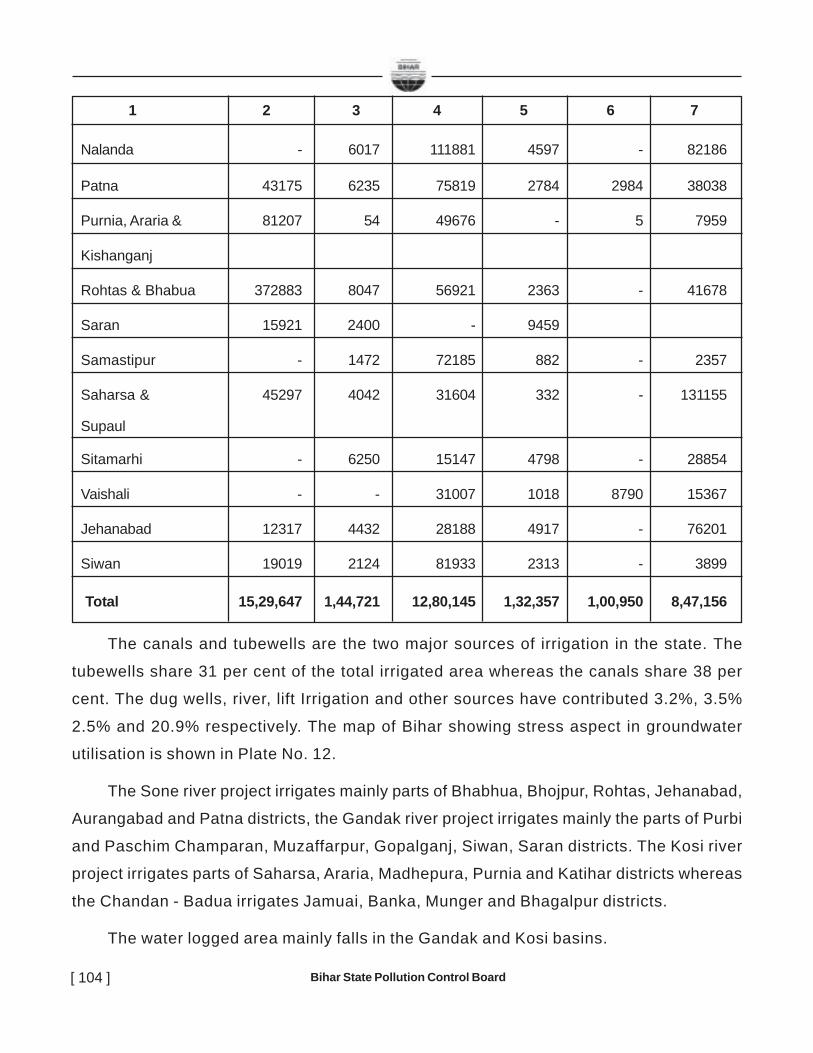
Bihar State Pollution Control Board[ 104 ]
1 2 3 4 5 6 7
Nalanda - 6017 111881 4597 - 82186
Patna 43175 6235 75819 2784 2984 38038
Purnia, Araria & 81207 54 49676 - 5 7959
Kishanganj
Rohtas & Bhabua 372883 8047 56921 2363 - 41678
Saran 15921 2400 - 9459
Samastipur - 1472 72185 882 - 2357
Saharsa & 45297 4042 31604 332 - 131155
Supaul
Sitamarhi - 6250 15147 4798 - 28854
Vaishali - - 31007 1018 8790 15367
Jehanabad 12317 4432 28188 4917 - 76201
Siwan 19019 2124 81933 2313 - 3899
Total 15,29,647 1,44,721 12,80,145 1,32,357 1,00,950 8,47,156
The canals and tubewells are the two major sources of irrigation in the state. The
tubewells share 31 per cent of the total irrigated area whereas the canals share 38 per
cent. The dug wells, river, lift Irrigation and other sources have contributed 3.2%, 3.5%
2.5% and 20.9% respectively. The map of Bihar showing stress aspect in groundwater
utilisation is shown in Plate No. 12.
The Sone river project irrigates mainly parts of Bhabhua, Bhojpur, Rohtas, Jehanabad,
Aurangabad and Patna districts, the Gandak river project irrigates mainly the parts of Purbi
and Paschim Champaran, Muzaffarpur, Gopalganj, Siwan, Saran districts. The Kosi river
project irrigates parts of Saharsa, Araria, Madhepura, Purnia and Katihar districts whereas
the Chandan - Badua irrigates Jamuai, Banka, Munger and Bhagalpur districts.
The water logged area mainly falls in the Gandak and Kosi basins.
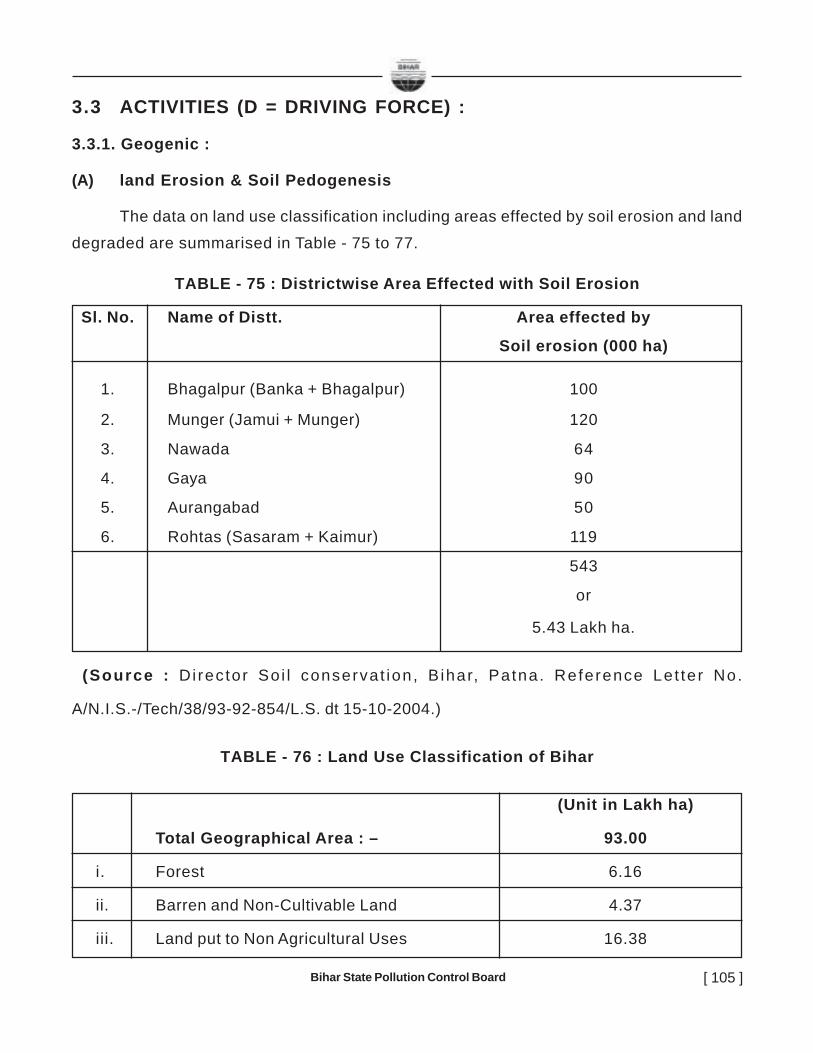
Bihar State Pollution Control Board [ 105 ]
3.3 ACTIVITIES (D = DRIVING FORCE) :
3.3.1. Geogenic :
(A) land Erosion & Soil Pedogenesis
The data on land use classification including areas effected by soil erosion and land
degraded are summarised in Table - 75 to 77.
TABLE - 75 : Districtwise Area Effected with Soil Erosion
Sl. No. Name of Distt. Area effected by
Soil erosion (000 ha)
1. Bhagalpur (Banka + Bhagalpur) 100
2. Munger (Jamui + Munger) 120
3. Nawada 64
4. Gaya 90
5. Aurangabad 50
6. Rohtas (Sasaram + Kaimur) 119
543
or
5.43 Lakh ha.
(Source : Director So i l conservat ion, B ihar, Patna. Reference Let ter No.
A/N.I.S.-/Tech/38/93-92-854/L.S. dt 15-10-2004.)
TABLE - 76 : Land Use Classification of Bihar
(Unit in Lakh ha)
Total Geographical Area : – 93.00
i. Forest 6.16
ii. Barren and Non-Cultivable Land 4.37
iii. Land put to Non Agricultural Uses 16.38
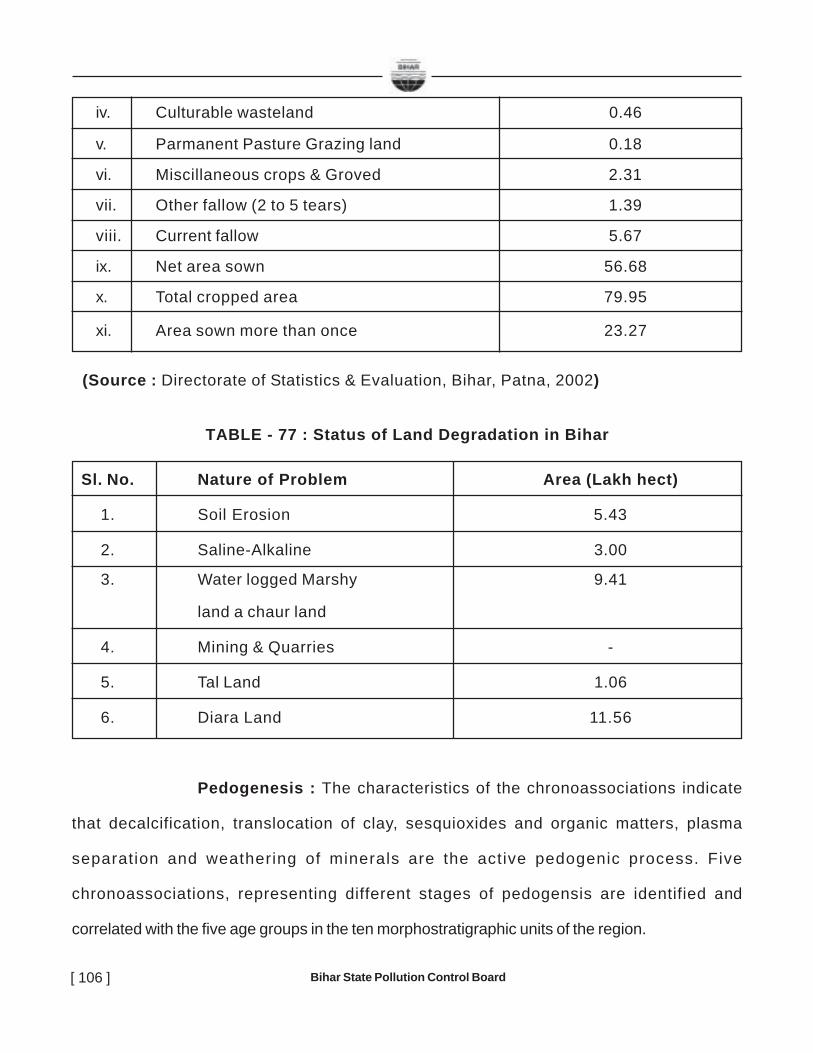
Bihar State Pollution Control Board[ 106 ]
iv. Culturable wasteland 0.46
v. Parmanent Pasture Grazing land 0.18
vi. Miscillaneous crops & Groved 2.31
vii. Other fallow (2 to 5 tears) 1.39
viii. Current fallow 5.67
ix. Net area sown 56.68
x. Total cropped area 79.95
xi. Area sown more than once 23.27
(Source : Directorate of Statistics & Evaluation, Bihar, Patna, 2002)
TABLE - 77 : Status of Land Degradation in Bihar
Sl. No. Nature of Problem Area (Lakh hect)
1. Soil Erosion 5.43
2. Saline-Alkaline 3.00
3. Water logged Marshy 9.41
land a chaur land
4. Mining & Quarries -
5. Tal Land 1.06
6. Diara Land 11.56
Pedogenesis : The characteristics of the chronoassociations indicate
that decalcification, translocation of clay, sesquioxides and organic matters, plasma
separation and weathering of minerals are the active pedogenic process. Five
chronoassociations, representing different stages of pedogensis are identified and
correlated with the five age groups in the ten morphostratigraphic units of the region.
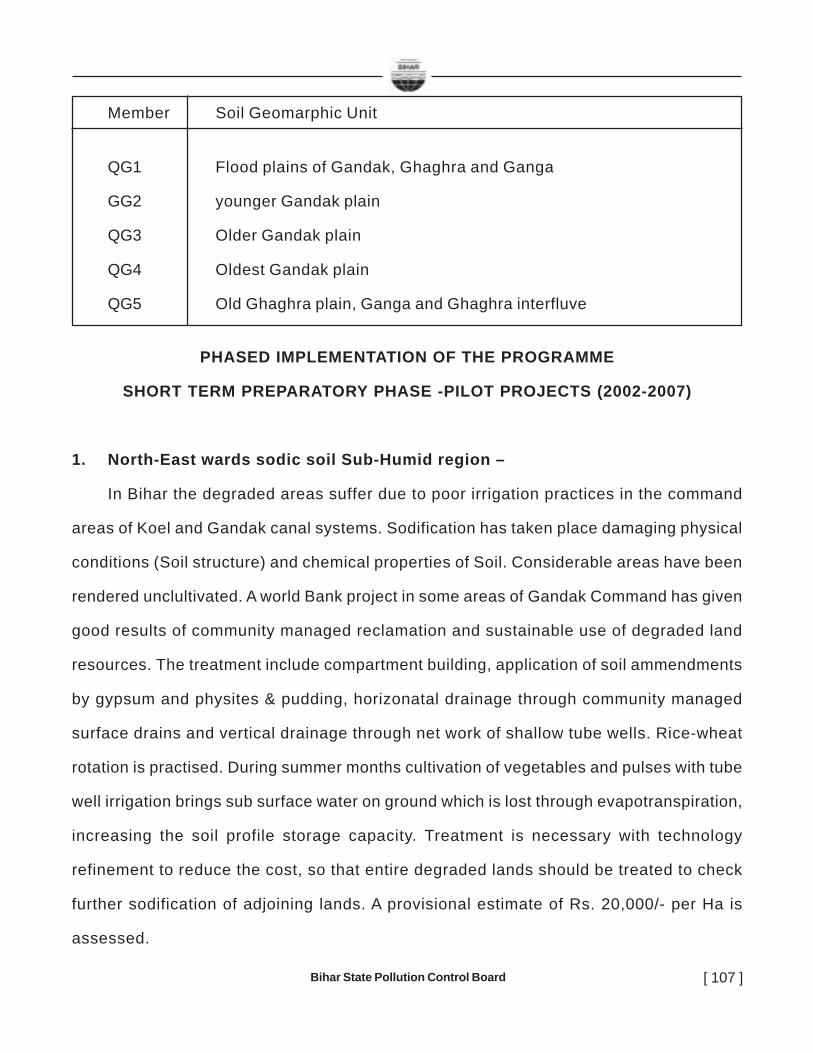
Bihar State Pollution Control Board [ 107 ]
Member Soil Geomarphic Unit
QG1 Flood plains of Gandak, Ghaghra and Ganga
GG2 younger Gandak plain
QG3 Older Gandak plain
QG4 Oldest Gandak plain
QG5 Old Ghaghra plain, Ganga and Ghaghra interfluve
PHASED IMPLEMENTATION OF THE PROGRAMME
SHORT TERM PREPARATORY PHASE -PILOT PROJECTS (2002-2007)
1. North-East wards sodic soil Sub-Humid region –
In Bihar the degraded areas suffer due to poor irrigation practices in the command
areas of Koel and Gandak canal systems. Sodification has taken place damaging physical
conditions (Soil structure) and chemical properties of Soil. Considerable areas have been
rendered unclultivated. A world Bank project in some areas of Gandak Command has given
good results of community managed reclamation and sustainable use of degraded land
resources. The treatment include compartment building, application of soil ammendments
by gypsum and physites & pudding, horizonatal drainage through community managed
surface drains and vertical drainage through net work of shallow tube wells. Rice-wheat
rotation is practised. During summer months cultivation of vegetables and pulses with tube
well irrigation brings sub surface water on ground which is lost through evapotranspiration,
increasing the soil profile storage capacity. Treatment is necessary with technology
refinement to reduce the cost, so that entire degraded lands should be treated to check
further sodification of adjoining lands. A provisional estimate of Rs. 20,000/- per Ha is
assessed.

Bihar State Pollution Control Board[ 108 ]
2. Drainage congestion water logged sub Humid region
There is considerable drainage congestion areas in the Himalayan foot hills regions
in the Canal systems of Kosi & Gandak. Due to drainage congestion, there is water logging.
This area can not be drained because of non-availability of out fall due to sand casting and
silt deposits. Water logging is a great health hazard like malaria in human beings and liver
fluke and foot & mouth diseases in live stock. Movebility & transport are also adversely
affected. The combined effect is, shortage of food, malnutrion, health hazards and
environmental degradation. Technology like desilting and construction of village ponds with
fish culture are being introduced.
A. Flood :
Bihar has always been a worst victim of flood, particularly the areas north of Ganga.
Though some mesores to check the menance through Bandh & channels dames have been
taken but they are still proving for less than adequate. If properly addressed, the tract of
Bihar is full of econmomic possibilities.
B. Seismicity :
Bihar being close to sesmically active Himalayas is prone to sesmic hazards which
have in past caused immense loss of lives and property mainly due to damage of structures.
If due care of earthquake proof designs are practised, this would, to a large extent, mitigate
this hazard.
Various thematic maps showing the earthquake zones, multihazard zonation and flood
zone demarcation are listed as Plate No. 13, 14 & 15. The damages caused due to floods
in terms of crop damage, public property damage and houses and infrastructural damage
are shown in the following Fig. 8, 9, 10.
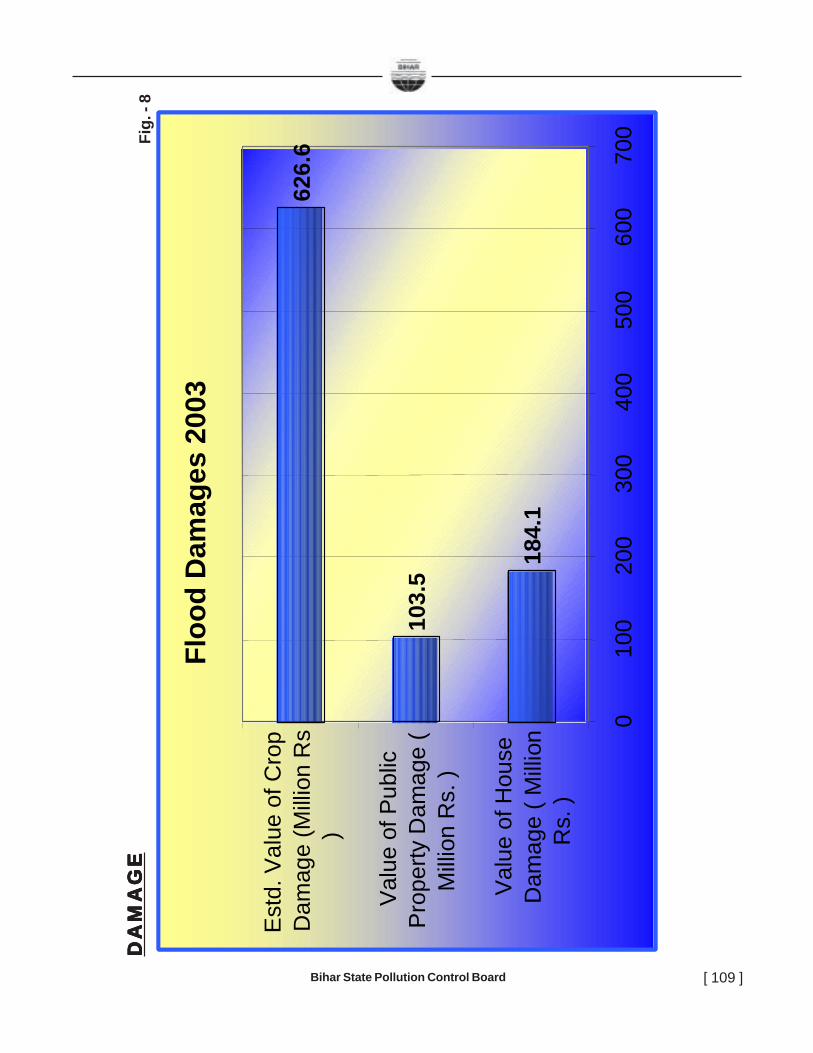
Bihar State Pollution Control Board [ 109 ]
Floo
d D
amag
es 2
003
184.
1
103.
5
626.
6
010
020
030
040
050
060
070
0
Val
ue o
f Hou
seD
amag
e ( M
illion
Rs.
)
Val
ue o
f Pub
licP
rope
rty D
amag
e (
Milli
on R
s. )
Est
d. V
alue
of C
rop
Dam
age
(Milli
on R
s)
Floo
d D
amag
es 2
003
184.
1
103.
5
626.
6
010
020
030
040
050
060
070
0
Val
ue o
f Hou
seD
amag
e ( M
illion
Rs.
)
Val
ue o
f Pub
licP
rope
rty D
amag
e (
Milli
on R
s. )
Est
d. V
alue
of C
rop
Dam
age
(Milli
on R
s)
DA
MA
GE
DA
MA
GE
DA
MA
GE
DA
MA
GE
DA
MA
GE
Fig.
- 8
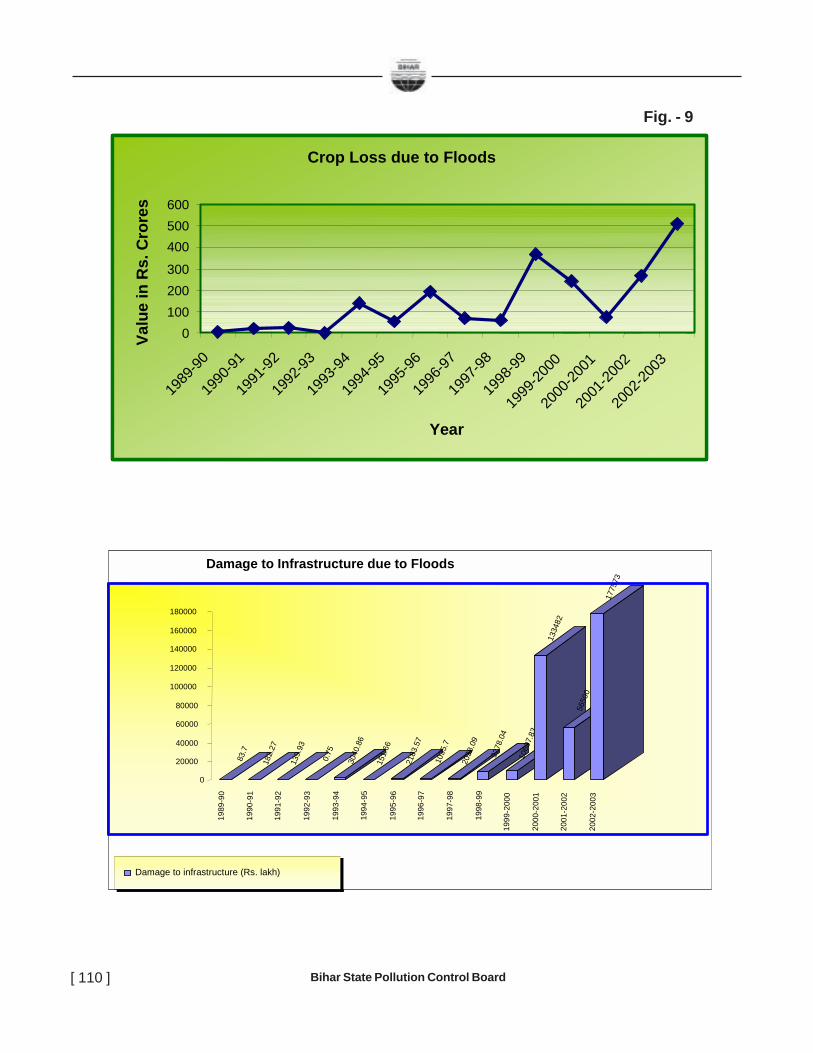
Bihar State Pollution Control Board[ 110 ]
Crop Loss due to Floods
0100200300
400500600
1989
-90
1990
-91
1991
-92
1992
-93
1993
-94
1994
-95
1995
-96
1996
-97
1997
-98
1998
-99
1999
-2000
2000
-2001
2001
-2002
2002
-2003
Year
Valu
e in
Rs.
Cro
res
Crop Loss due to Floods
0100200300
400500600
1989
-90
1990
-91
1991
-92
1992
-93
1993
-94
1994
-95
1995
-96
1996
-97
1997
-98
1998
-99
1999
-2000
2000
-2001
2001
-2002
2002
-2003
Year
Valu
e in
Rs.
Cro
res
83.7
182.
27
139.
93
0.75
3040
.86
151.
66
2183
.57
1035
.7
2038
.09
9278
.04
1060
7.83
1334
82
5650
0
1775
73
0
20000
40000
60000
80000
100000
120000
140000
160000
180000
1989
- 90
1990
- 91
1 99 1
- 92
1 99 2
- 93
1 99 3
- 94
1 99 4
- 95
1 99 5
- 96
1 996
- 97
1997
- 98
1998
- 99
1999
-20 0
0
2000
-20 0
1
2001
-20 0
2
2 00 2
-200
3
Damage to Infrastructure due to Floods
Damage to infrastructure (Rs. lakh)
Fig. - 9
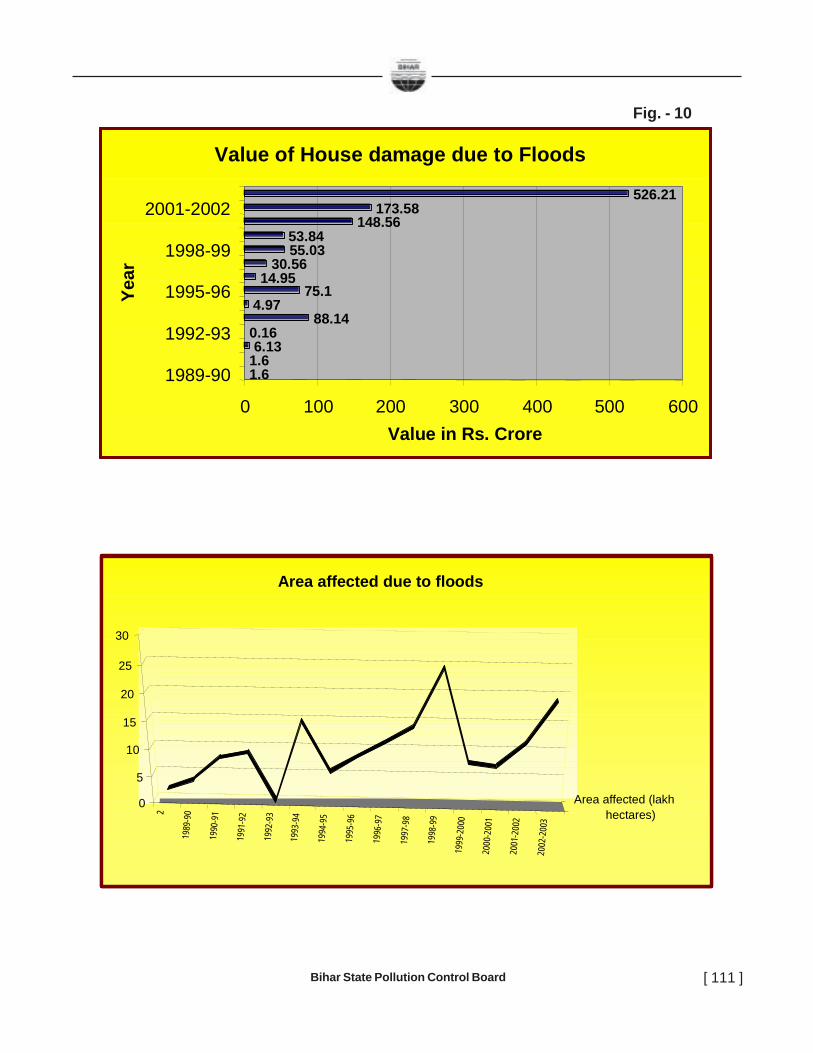
Bihar State Pollution Control Board [ 111 ]
2
1989
-90
1990
-91
1991
-92
199 2
-93
199 3
-94
199 4
-95
199 5
-96
199 6
-97
199 7
-98
199 8
-99
1 99 9
-200
0
2 000
-200
1
2 001
-200
2
2 002
-200
3
Area affected (lakhhectares)
0
5
10
15
20
25
30
Area affected due to floods
2
1989
-90
1990
-91
1991
-92
199 2
-93
199 3
-94
199 4
-95
199 5
-96
199 6
-97
199 7
-98
199 8
-99
1 99 9
-200
0
2 000
-200
1
2 001
-200
2
2 002
-200
3
Area affected (lakhhectares)
0
5
10
15
20
25
30
Area affected due to floods
Value of House damage due to Floods
1.61.66.13
0.1688.14
4.9775.1
14.9530.56
55.0353.84
148.56173.58
526.21
0 100 200 300 400 500 600
1989-90
1992-93
1995-96
1998-99
2001-2002
Year
Value in Rs. Crore
Value of House damage due to Floods
1.61.66.13
0.1688.14
4.9775.1
14.9530.56
55.0353.84
148.56173.58
526.21
0 100 200 300 400 500 600
1989-90
1992-93
1995-96
1998-99
2001-2002
Year
Value in Rs. Crore
Fig. - 10
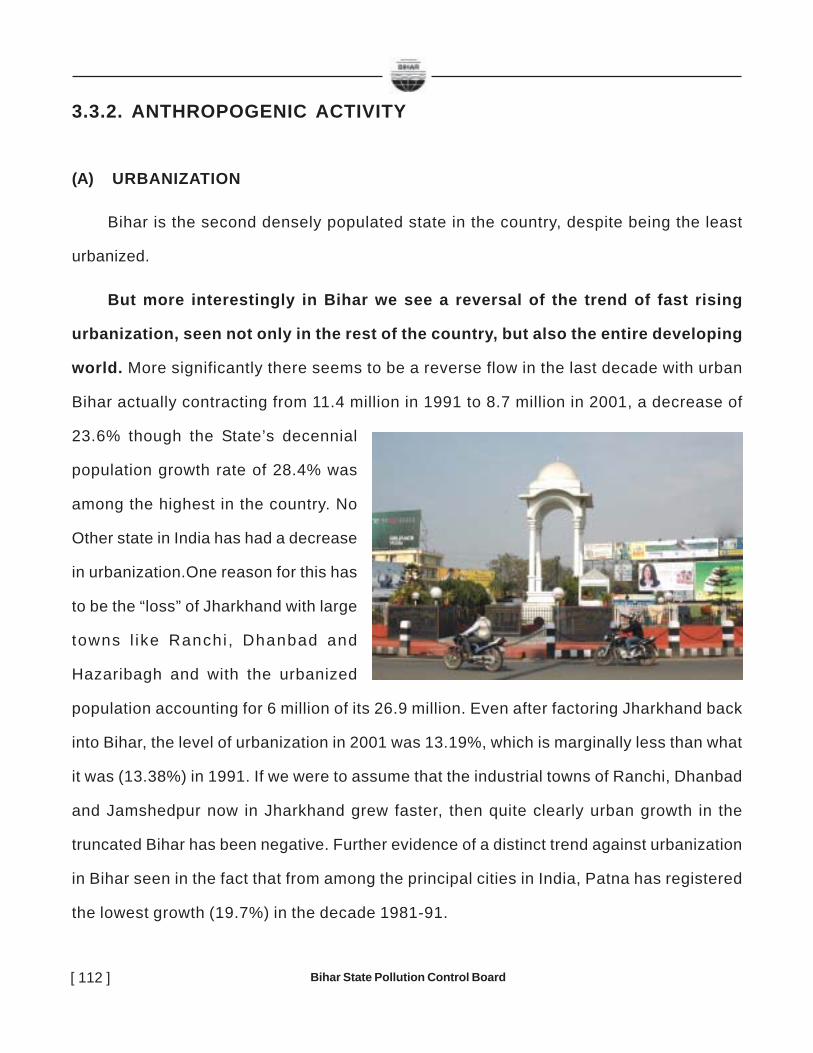
Bihar State Pollution Control Board[ 112 ]
3.3.2. ANTHROPOGENIC ACTIVITY
(A) URBANIZATION
Bihar is the second densely populated state in the country, despite being the least
urbanized.
But more interestingly in Bihar we see a reversal of the trend of fast rising
urbanization, seen not only in the rest of the country, but also the entire developing
world. More significantly there seems to be a reverse flow in the last decade with urban
Bihar actually contracting from 11.4 million in 1991 to 8.7 million in 2001, a decrease of
23.6% though the State’s decennial
population growth rate of 28.4% was
among the highest in the country. No
Other state in India has had a decrease
in urbanization.One reason for this has
to be the “loss” of Jharkhand with large
towns l ike Ranchi , Dhanbad and
Hazaribagh and with the urbanized
population accounting for 6 million of its 26.9 million. Even after factoring Jharkhand back
into Bihar, the level of urbanization in 2001 was 13.19%, which is marginally less than what
it was (13.38%) in 1991. If we were to assume that the industrial towns of Ranchi, Dhanbad
and Jamshedpur now in Jharkhand grew faster, then quite clearly urban growth in the
truncated Bihar has been negative. Further evidence of a distinct trend against urbanization
in Bihar seen in the fact that from among the principal cities in India, Patna has registered
the lowest growth (19.7%) in the decade 1981-91.

Bihar State Pollution Control Board [ 113 ]
It is generally well known that the sections most likely to migrate from rural areas are
the economically weakest sections, mostly landless labour, and educated youth. The first
find employment mostly in the construction sector, which largely requires unskilled labour.
The educated youth particularly those with vocational training and technical education
gravitate towards industrial centers.
In addition to the low industrialization of truncated Bihar, there is little by way of urban
construction or renewal in Bihar.
THE BIHAR URBAN SCENARIO
The density of population in Bihar is 880 per square km, whereas the corresponding
All-India figure is 324 per square km, yet in terms of
urbanization Bihar has the least number of people
living in towns with just 15.2% residing there as
compared to 28.8% in the rest of the country even
than Bihar does not find better education and health
facilities in the urban areas. This is seen from the
fact that Bihari students migrate in large numbers to
other states for education. It would be pertinent to
note that the per capita investment in education in
Bihar is only Rs. 484.1 and per capita investment in
health is only Rs. 86.2, whereas the corresponding
All-India per capita figures for education is Rs. 586.8 and health is Rs. 157.2.
Till 1991 in terms of basic urban facilities like safe drinking water and electricity
availability Bihar was the worst off among all states.
Bihar State Pollution Control Board[ 114 ]
B. INDUSTRIALISATION
Industrial Incentive Policy, Bihar - 2006
Under the State Reorganisation Act, the bifurcation of the State of Bihar became
effective from the 15th of November, 2000. A large number of medium/ large industries,
minerals as well as mineral based units and important forest produce have gone to the
newly created Jharkhand State. However, the large and medium sector of industries
comprises suger mills, distilleries, oil refinery, thermal power plant, cigarette manufacturing,
cement, tannery, foundries etc., are located in the state.
There are nine suger mills presently under operation and located in north Bihar area.
All the sugar mills have proper arrangement to treat their waste. All the distillaries of the
state are having effective effluent treatment plants and generating methane gas by
anaerobic treatment of the waste. The methane gas so produced is used as fuel in their
boilers conserving fossil fuels. The other major units of the state like Barauni refinery,
thermal power plant at Kahalgaon, cigarette manufacturing unit at Munger etc., are also
equipped with pollution control devices.
For sustainable industrial state it is imperative that truncated Bihar adopts a resurgent
industrial policy. Based upon the raw materials and resources available in Bihar, a renewed
effort has to be made to establish small/medium and large industries as well as to
rehabilitate the sick and ailing industries of the State.As a result the State of Bihar has reviewed
its earlier industrial policy of 2003 and came up with Industrial Incentive Policy 2006 with an objective for a
balanced industrial growth in the state. The Industrial Incentive Policy, 2006 is reproduced below:
Resolution
SUBJECT: INCENTIVE POLICY-2006 FOR ACCELERATED
INDUSTRIAL GROWTH OF THE STATE.
Today there is a requirement to provide a new industrialized shape full of industries
to Bihar State. There is a need to establish new industries and to revive the sick and closed
units of the state. For this purpose favorable environment should be created to attract the
investors of state and from abroad. In this connection the Industrial Policy - 2003 has been

Bihar State Pollution Control Board [ 115 ]
reviewed. After reviewing the policy, a decision has been taken to prepare a new industrial
policy in the present circumstances so that there may be a balanced industrial growth in
the state.
In the light of the aforesaid facts a new Industrial Incentive Policy - 2006 has been
prepared in consultation with Bihar Industries Association, Bihar Chamber of Commerce,
Confederation of Indian Industry and all concerned Government Departments. In the
preparation of this policy the Industrial policies of different states have been kept in view.
Under this Industrial Incentive Policy- 2006 there are provisions for granting
preproduction incentive of subsidy/exemption from stamp duty and registration fee and
post production incentive of grant/exemption for preparation of project reports, purchase
of land/shed, technical know-how, captive power generation/diesel generating set, quality
certificate. Vat, luxury tax, electricity duty, conversion fee, market fee etc.
With the implementation of this Industrial Incentive Policy- 2006, it is expected that there
will be growth in the per capita income of the state and industrial growth as well as
accelerated employment opportunities.
1.2 STRATEGY
(i) To create favorable circumstances in order to establish industries in the State
so that among the investors, there may be positive communication.
(ii) Bihar Single Window Clearance Act - 2006 -
To promote all round development of the state and industrial growth rapid
clearance procedures for establishing industries, to issue license and
certificates, to provide a congenial atmosphere to the investors of Bihar state
and in this regard and for other concerned subjects Bihar Single Window
Clearance Act - 2006 has been enacted.
(iii) Bihar Infrastructure Development Enabling Act- 2006 –
To provide for rapid development of physical and social infrastructure in the
State and to attract private sector participation and to provide for a
comprehensive legislation for designing, financing, construction, operation,
maintenance of infrastructure projects, so that administrative and procedural
delays are reduced, for identifying generic project risks, Bihar Infrastructure

Bihar State Pollution Control Board[ 116 ]
Development Enabling Act, 2006 has been enacted.
(iv) In order to simplify the inspection of factories, provision of self-certification
will be made.
(v) Industrial growth is adversely affected due to the complicated labour laws.Such
labour laws will be made simple and development oriented.
(vi) Human resources will be developed in such a way, which can promote and
create industrialization of high degree. Besides existing different institutions
will be strengthened to improve skill.
(vii) Land Bank- To meet the requirement of land for industries and development
schemes, Land Bank will be established in the state. By this Bank, Land will
be made available according to the requirements to different industries and
for development schemes.
(viii) Marketing arrangements will be made for small, tiny, cottage industries,
handloom and handicraft.
(ix) For the creation of the basic facilities of international level, to enhance capital
investment in the industrial areas and invite the private sector for investment
and to encourage public private partnership for this purpose.
(x) Development of Infrastructure.
(xi) In order to revive sick units, to identify such units and to suggest necessary
remedial measures and to prevent sickness by developing a district level
monitoring system.
(xii) To develop handicraft, handloom, khadi, silk and village industries.
Incentives/exemption facilities for Industries in Bihar to accelerateIndustrial development and to attract investments.
1. PRE - PRODUCTION INCENTIVES
Stamp duty and Registration fee:
Tiny, small, medium and large scale industries which are to be established in the
industrial area / shed and outside the area of the Authority will enjoy the full (100%)
exemption in stamp duty and registration fee in lease / sale / transfer. This facility
will be granted only for the first time and thereafter will not be granted.
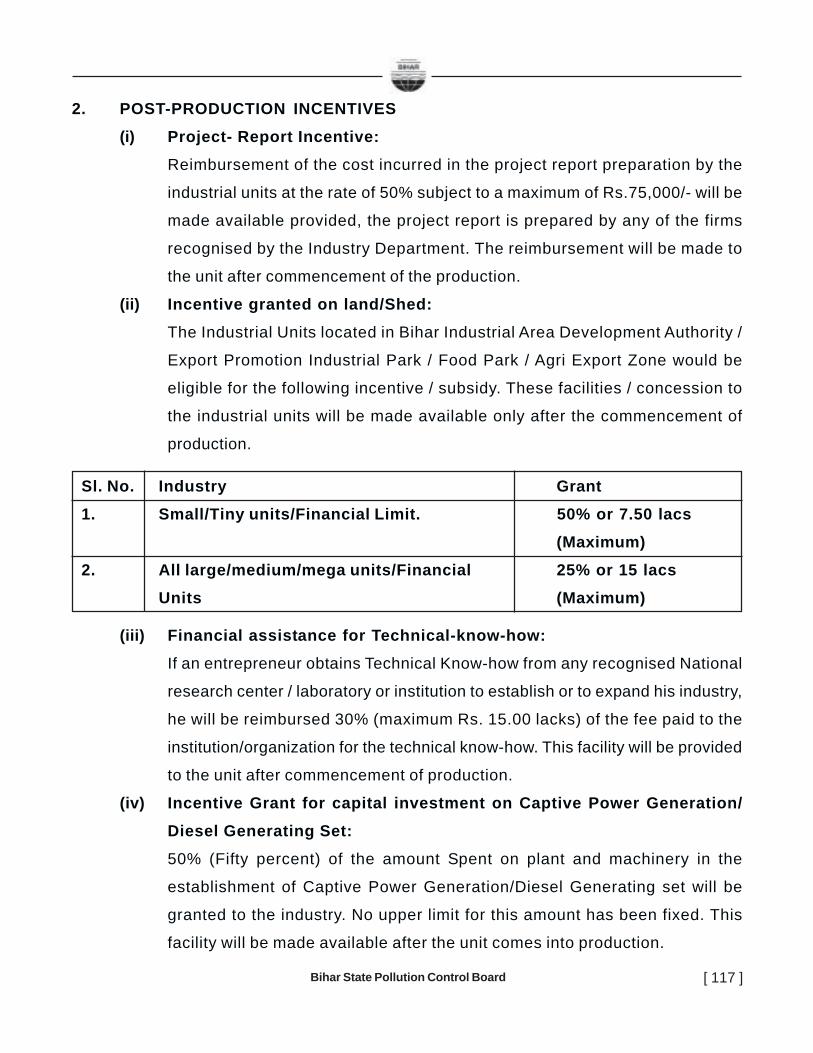
Bihar State Pollution Control Board [ 117 ]
2. POST-PRODUCTION INCENTIVES
(i) Project- Report Incentive:
Reimbursement of the cost incurred in the project report preparation by the
industrial units at the rate of 50% subject to a maximum of Rs.75,000/- will be
made available provided, the project report is prepared by any of the firms
recognised by the Industry Department. The reimbursement will be made to
the unit after commencement of the production.
(ii) Incentive granted on land/Shed:
The Industrial Units located in Bihar Industrial Area Development Authority /
Export Promotion Industrial Park / Food Park / Agri Export Zone would be
eligible for the following incentive / subsidy. These facilities / concession to
the industrial units will be made available only after the commencement of
production.
Sl. No. Industry Grant
1. Small/Tiny units/Financial Limit. 50% or 7.50 lacs
(Maximum)
2. All large/medium/mega units/Financial 25% or 15 lacs
Units (Maximum)
(iii) Financial assistance for Technical-know-how:
If an entrepreneur obtains Technical Know-how from any recognised National
research center / laboratory or institution to establish or to expand his industry,
he will be reimbursed 30% (maximum Rs. 15.00 lacks) of the fee paid to the
institution/organization for the technical know-how. This facility will be provided
to the unit after commencement of production.
(iv) Incentive Grant for capital investment on Captive Power Generation/
Diesel Generating Set:
50% (Fifty percent) of the amount Spent on plant and machinery in the
establishment of Captive Power Generation/Diesel Generating set will be
granted to the industry. No upper limit for this amount has been fixed. This
facility will be made available after the unit comes into production.
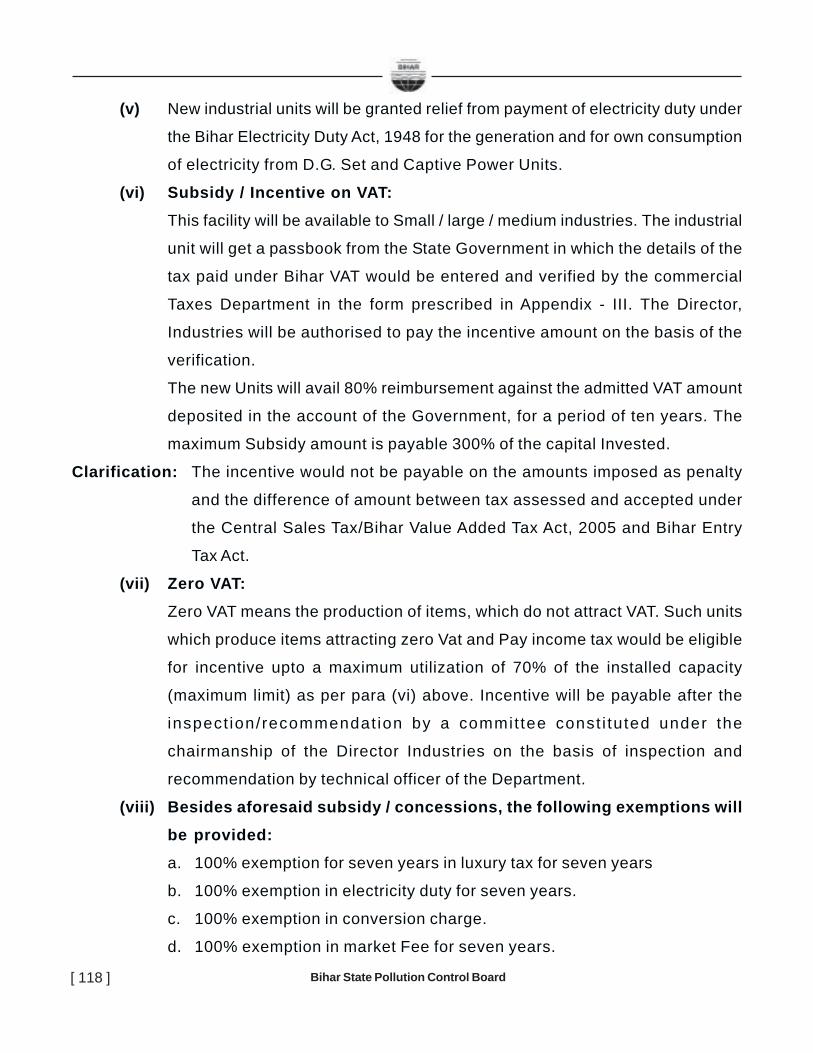
Bihar State Pollution Control Board[ 118 ]
(v) New industrial units will be granted relief from payment of electricity duty under
the Bihar Electricity Duty Act, 1948 for the generation and for own consumption
of electricity from D.G. Set and Captive Power Units.
(vi) Subsidy / Incentive on VAT:
This facility will be available to Small / large / medium industries. The industrial
unit will get a passbook from the State Government in which the details of the
tax paid under Bihar VAT would be entered and verified by the commercial
Taxes Department in the form prescribed in Appendix - III. The Director,
Industries will be authorised to pay the incentive amount on the basis of the
verification.
The new Units will avail 80% reimbursement against the admitted VAT amount
deposited in the account of the Government, for a period of ten years. The
maximum Subsidy amount is payable 300% of the capital Invested.
Clarification: The incentive would not be payable on the amounts imposed as penalty
and the difference of amount between tax assessed and accepted under
the Central Sales Tax/Bihar Value Added Tax Act, 2005 and Bihar Entry
Tax Act.
(vii) Zero VAT:
Zero VAT means the production of items, which do not attract VAT. Such units
which produce items attracting zero Vat and Pay income tax would be eligible
for incentive upto a maximum utilization of 70% of the installed capacity
(maximum limit) as per para (vi) above. Incentive will be payable after the
inspect ion/recommendat ion by a commit tee const i tuted under the
chairmanship of the Director Industries on the basis of inspection and
recommendation by technical officer of the Department.
(viii) Besides aforesaid subsidy / concessions, the following exemptions will
be provided:
a. 100% exemption for seven years in luxury tax for seven years
b. 100% exemption in electricity duty for seven years.
c. 100% exemption in conversion charge.
d. 100% exemption in market Fee for seven years.

Bihar State Pollution Control Board [ 119 ]
(ix) Facilities granted for the units working under adverse situation:
Such working units which have been working under adverse situation for years
will be reimbursed 25 percent of the deposited VAT amount in the account of
state government against admitted VAT amount. This reimbursement will be
admissible for five years continuously.
(x) Industrial Rehabilitation Fund:
In order to revive the sick and closed industry, with the co-operation of the
Commercial Banks, the State Government and Bihar Industry Association, a
corpus fund will be created.
(xi) S.C / S.T / Women / Handicapped:
a. Under this category, entrepreneurs will avail 5% additional grant/exemption/
subsidy than the limit fixed under this policy.
b. Up to a turnover limit of Rs.30 lakhs per annum S.C / S.T. / Women /
Handicapped category entrepreneurs who run small and tiny industries will
avail 100% subsidy of the deposited amount in the account of Government
in the form of VAT for a period of ten years.
(xii) Exemption from AMG / MMG:
Working units at present and new units will avail exemption from AMG / MMG
from the date of declaration of the New Industrial Policy. This facility will be
granted for five years.
(xiii) Central Sales Tax (CST):
Only 1% CST will be payable on the items produced by the registered small
and medium units in Bihar.
3. INDUSTRIAL SICKNESS:
3.1 Rehabilitation of Sick Units
Industrial sickness is a part of the process of industrialization. It leads to
unemployment, blockage of capital, loss of state revenue and non-utilisation of assets.
Hence it is necessary to take proper steps in order to rehabilitate the sick industries.
As such govt. is concerned about this and would take the following steps to stem
sickness and revive sick industries.
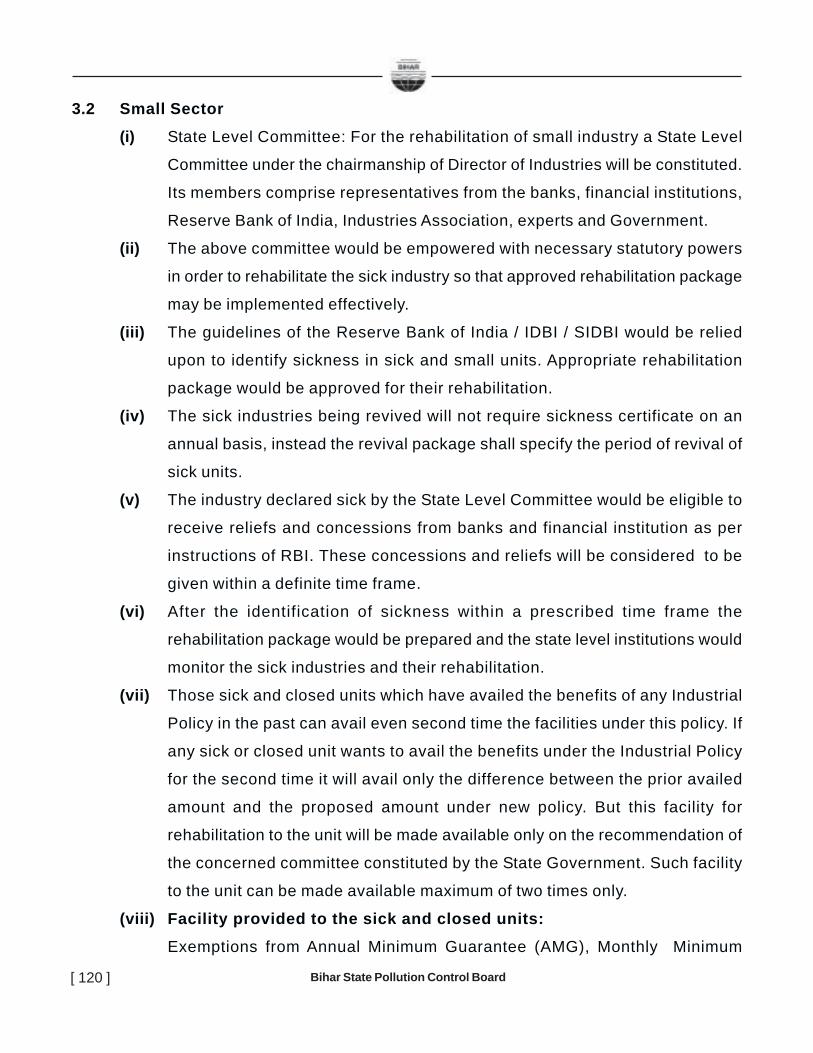
Bihar State Pollution Control Board[ 120 ]
3.2 Small Sector
(i) State Level Committee: For the rehabilitation of small industry a State Level
Committee under the chairmanship of Director of Industries will be constituted.
Its members comprise representatives from the banks, financial institutions,
Reserve Bank of India, Industries Association, experts and Government.
(ii) The above committee would be empowered with necessary statutory powers
in order to rehabilitate the sick industry so that approved rehabilitation package
may be implemented effectively.
(iii) The guidelines of the Reserve Bank of India / IDBI / SIDBI would be relied
upon to identify sickness in sick and small units. Appropriate rehabilitation
package would be approved for their rehabilitation.
(iv) The sick industries being revived will not require sickness certificate on an
annual basis, instead the revival package shall specify the period of revival of
sick units.
(v) The industry declared sick by the State Level Committee would be eligible to
receive reliefs and concessions from banks and financial institution as per
instructions of RBI. These concessions and reliefs will be considered to be
given within a definite time frame.
(vi) After the identification of sickness within a prescribed time frame the
rehabilitation package would be prepared and the state level institutions would
monitor the sick industries and their rehabilitation.
(vii) Those sick and closed units which have availed the benefits of any Industrial
Policy in the past can avail even second time the facilities under this policy. If
any sick or closed unit wants to avail the benefits under the Industrial Policy
for the second time it will avail only the difference between the prior availed
amount and the proposed amount under new policy. But this facility for
rehabilitation to the unit will be made available only on the recommendation of
the concerned committee constituted by the State Government. Such facility
to the unit can be made available maximum of two times only.
(viii) Facility provided to the sick and closed units:
Exemptions from Annual Minimum Guarantee (AMG), Monthly Minimum
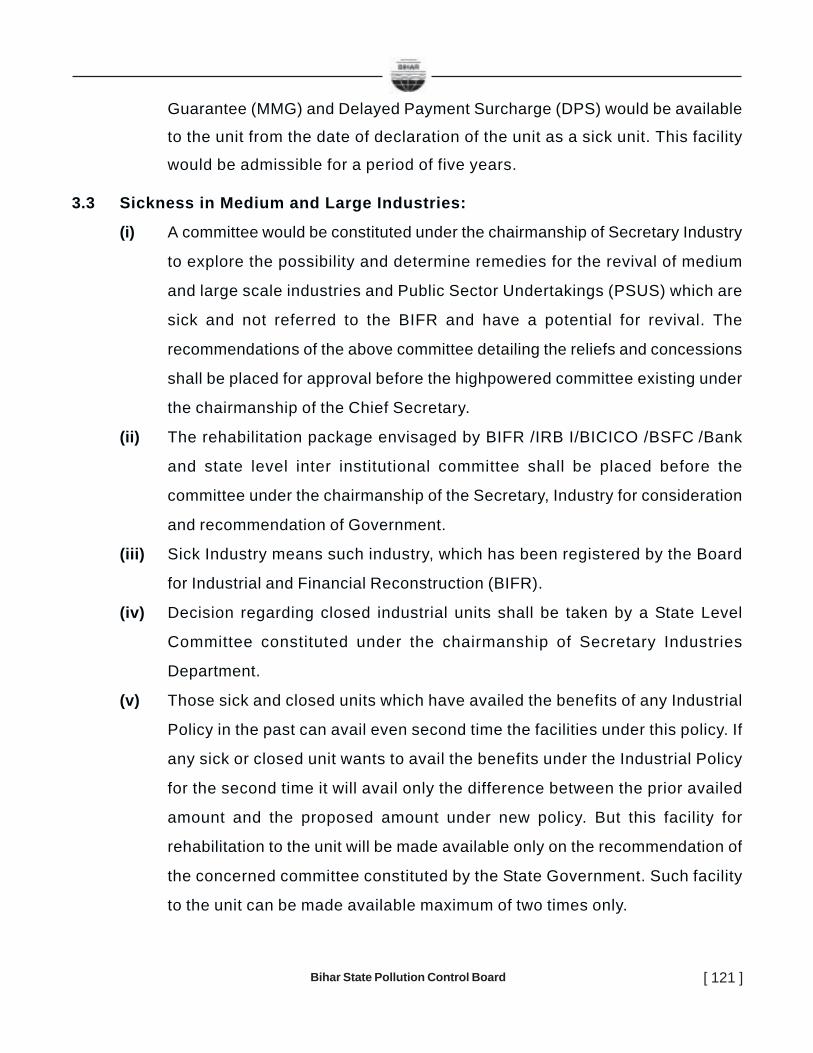
Bihar State Pollution Control Board [ 121 ]
Guarantee (MMG) and Delayed Payment Surcharge (DPS) would be available
to the unit from the date of declaration of the unit as a sick unit. This facility
would be admissible for a period of five years.
3.3 Sickness in Medium and Large Industries:
(i) A committee would be constituted under the chairmanship of Secretary Industry
to explore the possibility and determine remedies for the revival of medium
and large scale industries and Public Sector Undertakings (PSUS) which are
sick and not referred to the BIFR and have a potential for revival. The
recommendations of the above committee detailing the reliefs and concessions
shall be placed for approval before the highpowered committee existing under
the chairmanship of the Chief Secretary.
(ii) The rehabilitation package envisaged by BIFR /IRB I/BICICO /BSFC /Bank
and state level inter institutional committee shall be placed before the
committee under the chairmanship of the Secretary, Industry for consideration
and recommendation of Government.
(iii) Sick Industry means such industry, which has been registered by the Board
for Industrial and Financial Reconstruction (BIFR).
(iv) Decision regarding closed industrial units shall be taken by a State Level
Committee constituted under the chairmanship of Secretary Industries
Department.
(v) Those sick and closed units which have availed the benefits of any Industrial
Policy in the past can avail even second time the facilities under this policy. If
any sick or closed unit wants to avail the benefits under the Industrial Policy
for the second time it will avail only the difference between the prior availed
amount and the proposed amount under new policy. But this facility for
rehabilitation to the unit will be made available only on the recommendation of
the concerned committee constituted by the State Government. Such facility
to the unit can be made available maximum of two times only.
Bihar State Pollution Control Board[ 122 ]
(vi) Facilities to sick and closed units:
Exemption of Annual Minimum Guarantee (AMG), Monthly Minimum Guarantee
(MMG) and delayed payment surcharge to the unit will be granted from the
date of declaration of unit as a sick unit. This facility will be available for five
years.
4. FACILITIES FOR EXPANSION-DIVERSIFICATION AND MODERNISATION OFUNIT:Those units undergoing Expansion/Diversification/Modernisation will be eligible for
incentives, upon their incremental production as described in Para 2.
5. INCENTIVE ON QUALITY CERTIFICATION:75% of cost incurred in obtaining certificate of I.S.O. standard (or equivalent) from
reputed national/international level organizations, would be reimbursed by the State
Government.
6. INFORMATION TECHNOLOGY MISSION:6.1 The State Government would launch an I.T Mission for the development of Information
Technology Industries with the following objectives:
(i) Economic Development.
(ii) Human Resource Development
(iii) To provide simple, effective and transparent administration.
(iv) State of the Art Communication System
6.2 The State Government will provide the following relief / incentive to the Information
Technology Sector for its rapid development.
It has been observed that several rules and regulations applicable to industry need
not be required for the I.T. industry. As such, there would be a provision of
selfcertification and software units would be exempted from the following:
(i) Pollution Control Act to be effective only as per Govt. of India guidelines.
(ii) Legal Power Cuts.
(iii) Zoning Regulations in respect of location.
Bihar State Pollution Control Board [ 123 ]
The following exemptions under the relevant Acts will be applicable to the
I.T industries:(i) The I.T. Industry will be added in schedule-1 of the Bihar Shops and
Establishment Act 1953 and concessions under sections 7,8 and 12 (I) shall
be extended to it. By this the industry would be given exemption from the
provisions relating to the hours of business and weekly closure.
(ii) The hours of work for women employees would be relaxed under section 66 of
the factories Act, 1948. Accordingly for I.T. establishments, Women would be
able to work between 5 Am and 10 Pm instead of 6Am to 7 Pm in such
establishments.
(iii) I.T industry will be provided with exemptions under section 87 of the Employees
State Insurance Act 1948.
(iv) The information Technology industry will be added as an independent
employment in the schedule of minimum wages Act 1948 so that the workers
may be classified separately.
6.3 Information Technology and Biotechnology industries established in the state would
qualify for the incentives under para-2 of the policy. All incentives applicable to
industries would also be automatically available to I.T. and Biotechnology Industry.
6.4 The Industry Department will promote Biotechnology and Information Technology on
priority basis in industrial areas.
7. HANDLOOM SECTOR:(i) Electricity Tariff- In view of the state powerloom to be competitive with the
power loom sector of other states, there will be a provision of electricity grant
of 75 paise per unit of in electricity tariff.
(ii) Quality power supply will be made available for powerlooms.
(iii) Workshop-cum-residence scheme for weavers- In weavers dominated area,
scheme of construction of common facility centre and in case weavers do not
have the room, land, construction of Government shed would be implemented.
All the facilities available under Cluster Development Programme would be
available to weavers. Arrangements for training under the scheme would be
made.
Bihar State Pollution Control Board[ 124 ]
(iv) Establishment of Integrated Textile Park- Textile Park will be established inthe State. By this improvement and design, quality up-gradation and assistancein marketing would be available to the weavers.
(v) Establishment of Urban Haat (market)- An Urban Haat will be established inPatna where there will be provision for sale of the handloom and handicraftproducts.
(vi) Revival of Central Processing Plants -State Government will revive the centralprocessing plant Biharsharif and Dye and Finishing plant, Darbhanga. In these,the weavers may avail the facilities of dying, finishing and processing of theirproducts.
(vii) Reimbursement of loan due of the weavers- Scheme of reimbursement of oldloan dues and interest from weavers in the State would be implemented.
8. IMPLEMENTATION OF RESERVATION POLICY:Those units which comply with the Reservation Policy of the Govt. of Bihar will begiven an additional 10% over and above the fiscal incentives for which they are eligibleunder this Policy.
9. MONITORING AND REVIEW:All concerned departments and organizations would issue necessary follow upnotifications within a month to give effect to the provisions of this Policy. This will beduly monitored by Government so that the State Government may carry out a mid -term review of this Policy.
10. The incentives / subsidies / relief’s outlined in this policy shall be available to onlysuch new industrial units which commence commercial production within five yearsfrom 01.04.2006.
11. Industries mentioned in the negative list in Annexure - II would not be eligible for anyincentive / subsidy.
12. For incentives contained in this Policy a committee would be constituted under theChairmanship of Secretary Industries with the Director of Industries, DirectorTechnical Development, a representative each of the Commercial Taxes Department,and Bihar State Electricity Board (wherever necessary) as well as the concernedM.D of the Industrial Area Development Authority as its Members. This Committeewould decide on post-production incentives to be given to new units.
Bihar State Pollution Control Board [ 125 ]
13. The definitions given in the Annexure to this policy shall be treated as part of thispolicy.
Order: It is ordered that a copy of the resolution should be sent for publication in the specialedition of the Bihar Gazette, Reputed Journals and Newspapers and be circulatedamong all the Departments / Departmental heads and Subordinates officials of theGovernment.
By the Order of the Governor of Bihar
(S. Vijayaraghavan)Industrial Dev. Commissioner, Bihar, Patna.
Memo No: 1162, Patna, Dated 15 / 07 / 06Copy with enclosure forwarded to the Superintendent, Government Press, Gulzarbagh,Patna for its publication in the special edition of Bihar Gazette.
By the Order of the Governor of Bihar
(S. Vijayaraghavan)Industrial Dev. Commissioner, Bihar, Patna.
Memo No: 1162, Patna, Dated 15 / 07 / 06Copy with enclosure forwarded to all Departments / Departmental Heads / Commissioner,Commercial Taxes, Department of Commercial Taxes / Managing Director, All Corporationsunder Department of Industry / Bihar Industrial Development Authority/ Chief ExecutiveOfficer, Bihar Khadi Village Industries Board Patna / Chairman, Bihar State Electricity Board,Patna / Al l Commissioners/ Al l Distr ict Magistrates / Al l Deputy DevelopmentCommissioners / All General Managers, District Industry Office / Director, TechnicalDevelopment / Director, Industry / Resident Commissioner, Bihar Bhavan, New Delhi /Director, Small Scale Industries Service Organization, Patliputra Colony, Patna / Muzaffarpurfor information and needful action.
By the Order of the Governorof Bihar
(S. Vijayaraghavan)
Industrial Dev. Commissioner, Bihar, Patna.
Bihar State Pollution Control Board[ 126 ]
ANNEXURE-IDefinitions:1. Effective date: “Effective date” means the date on which the provisions of this Policy
come into force i.e. 01.04.2006. This Policy will remain in force for 5 years from thedate of issue of orders.
2. Industrial Unit/Industrial concern: ‘Industrial unit / concern’ means any unit / concern
engaged or to be engaged in manufacturing / processing / servicing industry underthe following categories:
a) Industries listed under the First Schedule of the Industries (Development and
Regulation) Act 1951 as amended from time to time.b) Industries falling within the purview of the following Boards / Agencies:
(1) Small Industries Board
(2) Coir Board(3) Silk Board
(4) All India Handloom and Handicrafts Board.
(5) Khadi and Village Industries Commission.(6) Any other agency constituted by the Government of India or Government of
Bihar for industrial development.
c) Other categories:(1) Mining or development of mines
(2) The maintenance, repair, inspection or servicing of machinery of any
description or vehicles or vessels or motorboats or trailers of tractors.(3) The setting up or development of an Industrial Area, Industrial Estate,
Integrated Infrastructure Development Export Promotion Industrial Park,
Export Promotion Zone or Growth Centre.(4) Providing special or technical knowledge or other services for the promotion
of industrial growth.
(5) Providing Engineering, Technical, Financial, Managerial, Marketing or otherservices or facilities for industry.
(6) Providing services relating to Information Technology, Telecommunication
or electronics including satell i te l inkage and audio or visual cablecommunication.
Bihar State Pollution Control Board [ 127 ]
(7) Tourism.3. Existing Industrial Unit:
“Existing Industrial Unit” means an industrial unit which is in commercial production.
4. New Industrial Unit:“New Industrial Unit” means an industrial unit in which commercial production hascommenced within five years from 01.04.2006.
5. Transferred Unit:“Transferred unit” means an industrial unit whose ownership / management has beentransferred as per the provisions of the State Financial Corporation Act, 1951 or hasbeen transferred with the approval of Financial Institutions / Banks.
6. Sick Unit:“Sick unit” means an industrial unit declared sick by the Board for Industrial andFinancial Reconstruction under the Sick Industries Companies (Special Provision)Act, 1985 or by the State Apex Committee for SSI headed by the Director of Industriesor the High Level Empowered Committee headed by the Chief Secretary for large andmedium sector.
7. Closed Unit:“Closed unit” means an industrial unit which has been continuously closed since thelast five (5) years from the date of eligibility for applying for incentive under this Policy.Closed means that there should have been no commercial production. The declarationof the unit being “closed” shall be certified as mentioned in Para 3 of this policy.
8. Expansion/Modernisation/Diversification:“Expansion/Modernisation/ Diversification of an existing unit’ would mean additionalfixed capital investment in plant and machinery to the extent of 50% or more of theundepreciated value of fixed capital investment in the existing unit leading toincremental production capacity which would not be less than 50% of the initial installedcapacity. In order to qualify a unit undertaking expansion/modernisation/ diversificationshould send prior intimation to the General Manager, District Industries Centers or theManaging Director, Bihar Industrial Area Development Authorities & DeputyCommissioner Commercial Taxes, as the case may be in respect of Small ScaleIndustry or the Director of Industries/Director, Technical Development and
Bihar State Pollution Control Board[ 128 ]
Commissioner, Commercial Taxes in case of medium and large industries beforeundertaking such expansion/modernisation/diversification Programme. Such intimationshould be accompanied by detailed expansion/modernisation/diversification proposalgiving the specific period of proposed additional investment.
9. Fixed Capital Investment:The ‘Fixed capital investment’ means an investment made in land, building, plant andmachinery as well as productive assets of permanent nature.
10. Small Scale Industry:A “Small Scale Industrial Unit” is an Industrial unit in which capital investment has beenmade upto the limit specified by the Government of India time to time.
11. Ancillary Industrial Unit:An “Ancillary Industrial Unit” is an industrial unit in which capital investment has beenmade upto the limit specified by the Government of India time to time.
12. Date of Production:The “date of production” of an industrial unit shall mean the date on which the unitactually commences commercial production of the item for which the unit has beenregistered.As regards the date of production of a SSI unit, the certificate issued by the respectiveGeneral Manager, District Industries Centre of Managing Director, Industrial AreaDevelopment Authority would be valid. In case of any dispute regarding the date ofproduction, the decision of the Director on Industries shall be final. In case of largeand medium industries the certificate issued by the Director Technical Developmentwould be valid. In case of any dispute regarding the date of production, the decisionof the Industrial Development Commissioner/Secretary Industries shall be final.Those industrial units which commence in production on 01.04.2006 or thereafter, butwhose capital investment is prior to 01.04.2006 would be eligible under IndustrialIncentive Policy, 2003 (in case they qualify) or under the New Policy as alternative.The units will not be entitled to part benefits of both the policies. Three months fromthe date of publication of the notification in the Bihar Gazette of this Policy, the unitswill have to give in writing to Director Industries or Director, Technical Development
indicating the preferred alternative.
Bihar State Pollution Control Board [ 129 ]
ANNEXURE-II
List of Industries Not Eligible For Incentives:1. Rice Huller
2. Flour Mills (Including Besan, Dal & Chura Mills) of less than 50 TPD Capacity.
3. Condiments (Masala & Papad) Mills
4. Confectionery (Excluding Mechanised Confectionery)
5. Preparation of Sweetmeat & Salted Snacks.
6. Bread Manufacturing (Except Mechanized Bakery)
7. Production of Ice Candy and Ice Food.
8. Manufacturing and Processing of Betel Nut.
9. Fireworks and Crackers Units
10. Coal / Coke Screening
11. Firewood and Charcoal Manufacture
12. Painting and Spray Painting Units
13. Fertilizer Mixing Plants.
14. Brick Manufacturing Units (Except Units Engaged in Manufacturing Refractory Bricks
and Bricks from Fly Ash, Red Earth, Raw Industrial Waste Material).
15. Manufacture of Tarpaulins Made of Canvas
16. Saw Mills and Wood Sawing
17. Furniture and Wood Sawing.
18. Drilling Rings, Bore Well and Tube Well Establishing Units.
19. Tea Blending/Mixing Units.
20. Units Connected with Cutting of Raw Tobacco and Gul Related Products and Guraku
21. Bottling and Repackaging of Drugs/Pharmaceuticals/Chemicals without Processing
and value addition (Excluding formulation and manufacturing units)
22. Book Binding
23. Rubber Stamp Making
24. Notebook and Envelope Making.
25. Photo Copying

Bihar State Pollution Control Board[ 130 ]
26. Stenciling Units
27. Processing of Stencil Papers.
28. Distilled Water Manufacturing Units.
29. Tailoring (Except Readymade Garment Manufacturing Units)
30. Sewing of Socks with Woven Cloth and their Repacking.
31. Laundry/Dry Cleaning.
32. Photography/Studio Labs.
33. Clinical/Pathological Laboratories/Nursing Homes/Clinics
34. Beauty Parlours.
35. Video Parlours
36. Goods Transport.
37. Video/Audio Cassette Recording/Watch Repairing / Vehicle Workshop and Service
Stations.
38. Lime Kilns.
39. Petrol Pumps.
40. Narcotic Drugs.
Note:1. Government reserve the right to make any changes in the above negative list.
2. The decision of Government whether a unit falls in the Negative list or not, shall be
final and binding.

Bihar State Pollution Control Board [ 131 ]
ANNEXURE – III
FORMAT OF PASSBOOK AS DETAILED IN PARA 2(VI)OF THE INDUSTRIAL INCENTIVE POLICY 2006.
1 2 3 4 5 6 7 8Sl. Month Amount of Tax Amount paid Main/ Challan Name & SignatNo. admitted against the Subsidiary no. & Designati ure
under amount headings date with on of withBVATA*/ admitted under which Name of certifying date
CSTA*/BETA* under admitted Treasury officer & sealBVATA*/ amount
CSTA*/BETA* deposited
*BVATA = Bihar Value Added Tax Act 2005
*CSTA = Central Sales Tax Act
*BETA = Bihar Entry Tax Act.
Note: The passbook entries must be certified by the concerned Commercial Taxes
Officer in charge of the circle.
v v v
TOTA
L

Bihar State Pollution Control Board[ 132 ]
C. AGRICULTURE
1. Agricultural Resource :
Bihar is one of the states where agriculture is considered as the backbone ofeconomic activity. About 80% of the land area is arable and supported with good monsoonrainfall. Though the agricultural practices are not well developed, but somehow supportsthe life line through its products.
There are four classes of crop period in Bihar, e.g,. (1) Bhadai (2) Aghani (3) Rabicrop (4) Summer crop.
i. Bhadai : This crop is sown in the month of May-June i.e., in pre-monsoon periodand harvested during post monsoon period. It includes the crops such as rice, maize andjute and in some patches pulses and vegetables are also grown.
The districts of Purnia, Saharsa, Madhepura, Supaul, Kishanganj, Katihar are themain areas where such crops yield. Marua is grown in the districts of Muzaffarpur, Vaishali,Saharsa, Samastipur and Sitamarhi.
In the diara lands of Ganga and Kosi belt maize are grown.
ii. Aghani : This is the main crop in Bihar. It contains all the crops which is sown duringrainy season immediate after the on-set of monsoon. The main paddy crop is sown tillAugust and harvested in the month of Nov.-Dec. That is why Bihar has its own well establishedrice culture.
The main rice producing districts are Purnia, Madhubani, Darbhanga, Sitamarhi,Saharsa, Rohtas, etc. Two crops yield of paddy is usually practised because of the factthat a monsoon period prolongs over a wide range.
iii. Rabi Crop : This is the winter crop usually sown in the month of Oct-Nov andharvested in the month of March-April. Wheat is the main product of this period along withother minor pulses and oil seeds.
iv. Summer Crop : During this period summer paddy, vegetables oil seed, maize andpulses are grown.
Main crops yields –
i. Paddy : Paddy is grown about a tune of 65.5 lakh. MT each year. Three types ofpaddy are produced
Bihar State Pollution Control Board [ 133 ]
(a) Aghani Paddy (80% of the area)(b) Boro Paddy (2% of the area)(c) Summer Paddy (3% of the area)
ii. Wheat : Wheat is the second most predominant product. It is produced in about26.5 lakh. hec land and the yield is of a tune of 35.7 lakh. ton every year. In the past twodecades the production in Bihar has increased many fold and it has attained the sixthposition in the list of states producing wheat.
The main wheat producing area is Ganga-Diara, Kosi basin, Begusarai district,area falling west of river Bagmati and in the districts of Buxar, Rohtas, Gaya, Jehanabad,Patna, Munger and Bhagalpur.
iii. Maize : Maize is the third main crop of Bihar and is sown in 8% of the cultivablearea. It is mainly grown in the area SW of Burhi Gandak River and in the districts of Saran,Gopalganj, Siwan, Samastipur and Purbi and Pashcim Champaran. Approximately 18 lakhmetric ton is produced every year.
iv. Barley : Barley is grown in almost similar ground situation as that of maize. It issown as mixed crop. Purbi and Paschim Champaran are the lead districts in its production.
v. Marua (Ragi) : It is grown in the less fertile sandy soil and needs little water that iswhy its seed is sown in the month of June and transplanted after rainfall. It is the main foodof labour and down trodden class of population. It is grown in the districts of Saharsa,Supaul, Madhepura and Darbhanga, etc.
vi. Pulses : About 12-13 lakh hec. land is used for growing such type of crops. Theannual production is of to a tune of 10 lakh MT.
vii. Main Cash Crop : It includes Sugarcane, Tabacco, Potato, Jute and Chilli.
Sugarcane is grown in alluvial soil having lime as main ingrediant. It is noted thatarea lying east of Bagmati is not suitable for sugarcane cultivation. Broadly, it is the arealying NE of Bagmati river which is considered most suitable for sugarcane cultivation.
Tabacco is grown in 14000 ha. land and the production is of a tune of 17000 tonevery year. It is grown mainly on the margin of river banks almost extending from Gandakriver in the west to eastern boarder of Bihar.
Potato is the main cash crop and is grown almost in every districts. Nalanda districtis considered as the leading producer of Potato.

Bihar State Pollution Control Board[ 134 ]
Jute is produced in the high rainfall and humid area of Bihar. It is grown at the marginof water bodies where pure water is vailable for washing. It is mainly grown in the districtsof Purnia, Kishanganj, Katihar Saharsa, etc.
Chilli is a product grown through out the year in about 75,000 ha land.
2. AGRICULTURAL ZONES OF BIHAR :
The state of Bihar has been divided into five zones for agricultural utility which ispresented in Table - 78.
TABLE - 78
Agricultural zones Main Crops Geographical Characterestic
(i) NE Plain Paddy & Jute Flood Plain, adequate ferti l ity, sufficient
humidity & more than 125 cm rainfall, silty
clay to silty loam soil.
(ii) NW Plain Paddy & Falls under Gandak command area &
Sugarcane groundwater irrigation, older alluvium soils
with domi nance of lime & < 125 cm. rainfall.
(iii) Mid-North Plain Paddy, Maize Area between Gandak & Kosi, flood
& wheat affected light silty clay soil, favour rainfall,
canal & tubewell irrigation
(iv) SW Plain Paddy & Area lying west of kharagpur hill upto Son
Sugarcane river, rice & wheat in wheat selected areas,
Son Command area.
(v) SE Plain Paddy main East of Karagpur hill, rainfall
crop & maize > 125 cm. drought prone area. in irrigated
area, wheat & sugarcane in Diara area.
3. REASONS FOR AGRICULTURAL BACKWARDNESS :
1. The social and political reasons never remain friendly and congenial with thefactors governing the Geo-economic aspect of the state. Initially, many pilot projects, e.g.,IADP were undertaken in the state but the result was a not satisfactory. The eradication ofregional imbalance and personal bias couldn’t build the atmosphere for the properdevelopment of the state. Lack of political will, education, inadequacy of information system,social tensions and population explosion are the main reasons for under exploitation of
Bihar State Pollution Control Board [ 135 ]
agricultural land.
2. The other reasons i.e., economics reasons includes, lack of implementationof land & water management, mordernization & industrialisation of agriculture and otherinfrastructural support for agriculture.
3. The other major reasons for the agricultural backwardness is the extremepopulation pressure on agricultural land. The various land reforms acts were not effectivelyexecuted on ground.
The land & water management, ie, the terms of water imbalance has affected thestate perpetually in the form of flood and drought. This remains the major challenge for thedevelopment of the state.
4. GREEN REVOLUTION :
The Bihar has failed to get the yield of green revolutions because of the factssummarized below :
A. Due to non-implementation of land reforms 77% of the holding is with themarginal farmers, which comprises 30% of the agricultural land. Persons holding morethan 5 hectare land comprises 4% and the total land area under such sector are 30% of theavailable agricultural land. The increased population of marginal farmers are the main hurdlein the economic development based on agricultural yield.
B. Due to poor purchasing capacity of farmer HYV seeds and improved chemicalfertilizers were not utilised.
C. A total of 28 districts of the state are flood affected. During the same span ofweather condition some area is affected with flood while the other with drought. The Sone-Ganga river system irrigates about 73% of its command area and the remaining mid-centralsouth Bihar dose not have proper irrigation facility.
D. The seed and insectisides used are not commensurate with the bio-technological consideration.
E. The agricultural activity of the state has never been linked with industry orpara industry there by the farmers are deprived of getting assured financial support andencouragement.
Bihar State Pollution Control Board[ 136 ]
CHAPTER- 4
ENVIRONMENTAL IMPACT ASSESSMENT (EIA)
The concept of EIA was pioneered in U.S.A. in 1969 with the formulation of National
Environmental Policy. The EIA may be defined as –
(a) “A study of probable change in various socioeconomic and bio-physical
characteristics of the environment which may result from a proposed or impending action”
– Jain et al (1977)
(b) “It is an activity that aims at establishing quantitative values for selected
parameters which indicate quality of environment, before, during and after an action – Heer
& Hagarty (1977)
EIA is carried out for assessing the requirements of economic growth and
preservation of environment. Consequent to the promulgation of Environmental (Protection)
Act, 1986, environmental clearance for all new projects and expansion of existing projects
have become mandatory. This clearance is given by the Dept. of Environment (DoEn),
Ministry of Environment & Forest, Govt. of India or the concerned State Pollution Control
Board on the basis of EIA and environmental management plan (EMP) documents.
In order to decide the environmental hotspots and priority issues on the basis of
number and extent of problems in each district, the quantitative hierarchy of environmental
degradation has been worked out. The quantitative value of problems warrants cost effective
action to address these issues with the understanding of its everity and priority.
It is understood that there are some pervasive nature of problems, in all the districts
e.g.; drinking water, sewage and sanitation facilities and indoor air pollution which are not
taken into account while deciding the hotspot.
The cut-off score for environmental hotspot is taken in any four of the seven
environmental problems viz; (1) Disaster (2) Land degradation (3) Bio-diversity loss

Bihar State Pollution Control Board [ 137 ]
(4) Water imbalance (5) Unorganised Urbanisation (6) Industrialisation and (7) Awareness,
alongwith their inherent attributes listed in Table - 79.
TABLE - 79
Env. problems Attributes
1. Disaster (a) Flood (b) Seismicity and (c) Drought
2. Land Degradation (a) Soil alkalinity (b) Wet land (c) River erosion
(d) siltation and (e) Irrigational Command Area
problems.
3. Bio-diversity loss (a) Deforestation (b) Non-residency of run-off (c)
Siltation of wet land (d) Subsidence of wet-land
and (e) River aggradation (Ganga)
4. Water imbalance (a) Over exploitation of ground water in selected
area (b) Chemical anomoly
5. Urbanisation (a) Vehicle pollution (b) Solid waste (c) Sewage
and (d) Air pollution
6. Industrialisation (a) Mining :
(b) Industries
7. Awareness (a) Population
(b) Health determinants e.g. unsafe water, poor
sonitation practices, malnutrition, behavioural
attitudes, i l l iteracy, climatic conditions and
poverty.
Thus on the basis of number of problems in each district the quantitative hierarchy of
environmental degradation has been brought out in Table No. 80.
The approach for prioritisation is a process whereby the ranking of future action
Bihar State Pollution Control Board[ 138 ]
could be decided so that the issues of greatest impact attract the highest investment relative
to the available resources. Therefore, to be able to determine the path by which
improvements in environmental management interventions could be effected in the
background of politicl commitment, resource availability, administrative capability and public
participation through participatory processes, it needs to be placed on record that the
outcome should be taken as indicative, requiring further verification by secondary micro-
level exercises.
The prioritisation methodology is aimed to derive weightings which are then applied
to get scores for the range of seven identified problems. Taking into consideration of primary
and secondary source of information to provide guidance on the importance of the different
environmental issues in Bihar, an assessment of the magnitude of economic, social and
ecological impacts of each problem has been carried out. A score of 1 to 3 has been
assigned to low impact, 4 to 6 to medium impact and 7 to 9 for high impacts. Based on the
economic, social and ecological factors an impact matrix for the environmental hotspot
districts developed, which is presented in Table 80.
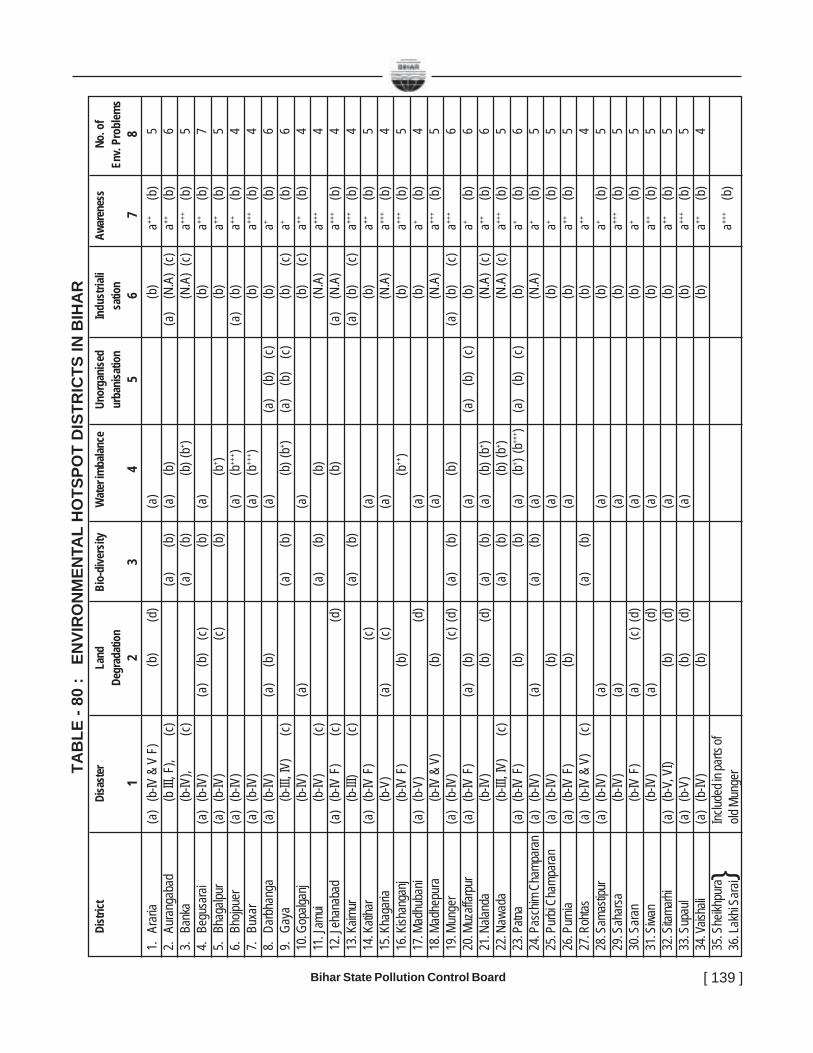
Bihar State Pollution Control Board [ 139 ]
TAB
LE -
80 :
EN
VIR
ON
MEN
TAL
HO
TSPO
T D
ISTR
ICTS
IN B
IHA
RDi
strict
Disa
ster
Land
Bio-
dive
rsity
Wat
er im
balan
ceUn
orga
nise
dIn
dust
riali
Awar
enes
sNo
. of
Degr
adat
ion
urba
nisa
tion
satio
nEn
v. Pr
oblem
s1
23
45
67
81.
Arar
ia(a
)(b
-IV &
V F
)(b
)(d
)(a
)(b
)a++
(b)
52.
Aura
ngab
ad(b
III,
F),
(c)
(a)
(b)
(a)
(b)
(a)
(N.A
)(c
)a++
(b)
63.
Bank
a(b
-IV),
(c)
(a)
(b)
(b) (
b+ )(N
.A)
(c)
a+++
(b)
54.
Begu
sara
i(a
)(b
-IV)
(a)
(b)
(c)
(b)
(a)
(b)
a++(b
)7
5.Bh
agalp
ur(a
)(b
-IV)
(c)
(b)
(b+ )
(b)
a++(b
)5
6.Bh
ojpue
r(a
)(b
-IV)
(a)
(b++
+ )(a
)(b
)a++
(b)
47.
Buxa
r(a
)(b
-IV)
(a)
(b++
+ )(b
)a++
+(b
)4
8.Da
rbha
nga
(a)
(b-IV
)(a
)(b
)(a
)(a
)(b
)(c
)(b
)a+
(b)
69.
Gaya
(b-II
I, IV
)(c
)(a
)(b
)(b
) (b+ )
(a)
(b)
(c)
(b)
(c)
a+(b
)6
10.G
opalg
anj
(b-IV
)(a
)(a
)(b
)(c
)a++
(b)
411
.Jam
ui(b
-IV)
(c)
(a)
(b)
(b)
(N.A
)a++
+4
12.J
ehan
abad
(a)
(b-IV
F)
(c)
(d)
(b)
(a)
(N.A
)a++
+(b
)4
13.K
aimur
(b-II
I)(c
)(a
)(b
)(a
)(b
)(c
)a++
+(b
)4
14.K
atiha
r(a
)(b
-IV F
)(c
)(a
)(b
)a++
(b)
515
.Kha
garia
(b-V
)(a
)(c
)(a
)(N
.A)
a+++
(b)
416
.Kish
anga
nj(b
-IV F
)(b
)(b
++)
(b)
a+++
(b)
517
.Mad
huba
ni(a
)(b
-V)
(d)
(a)
(b)
a+(b
)4
18.M
adhe
pura
(b-IV
& V
)(b
)(a
)(N
.A)
a+++
(b)
519
.Mun
ger
(a)
(b-IV
)(c
)(d)
(a)
(b)
(b)
(a)
(b)
(c)
a+++
620
.Muz
affarp
ur(a
)(b
-IV F
)(a
)(b
)(a
)(a
)(b
)(c
)(b
)a+
(b)
621
.Nala
nda
(b-IV
)(b
)(d
)(a
)(b
)(a
)(b
) (b+ )
(N.A
)(c
)a++
(b)
622
.Naw
ada
(b-II
I, IV
)(c
)(a
)(b
)(b
) (b+ )
(N.A
)(c
)a++
+(b
)5
23.P
atna
(a)
(b-IV
F)
(b)
(b)
(a)
(b+ ) (
b+++ )
(a)
(b)
(c)
(b)
a+(b
)6
24.P
asch
im C
hamp
aran
(a)
(b-IV
)(a
)(a
)(b
)(a
)(N
.A)
a+(b
)5
25.P
urbi
Cham
para
n(a
)(b
-IV)
(b)
(a)
(b)
a+(b
)5
26.P
urnia
(a)
(b-IV
F)
(b)
(a)
(b)
a++(b
)5
27.R
ohtas
(a)
(b-IV
& V
)(c
)(a
)(b
)(b
)a++
428
.Sam
astip
ur(a
)(b
-IV)
(a)
(a)
(b)
a+(b
)5
29.S
ahar
sa(b
-IV)
(a)
(a)
(b)
a+++
(b)
530
.Sar
an(b
-IV F
)(a
)(c
)(d)
(a)
(b)
a+(b
)5
31.S
iwan
(b-IV
)(a
)(d
)(a
)(b
)a++
(b)
532
.Sita
marhi
(a)
(b-V
, VI)
(b)
(d)
(a)
(b)
a++(b
)5
33.S
upau
l(a
)(b
-V)
(b)
(d)
(a)
(b)
a+++
(b)
534
.Vais
hali
(a)
(b-IV
)(b
)(b
)a++
(b)
435
.She
ikhpu
raInc
luded
in pa
rts of
a+++
(b)
36.L
akhi
Sara
iold
Mun
ger
}

Bihar State Pollution Control Board[ 140 ]
TAB
LE -
81 :
IMPA
CT
MAT
RIX
FO
R E
NVI
RO
NM
ENTA
L IS
SUES
IN B
IHA
R
Im
pact
fact
ors
Ecol
ogica
l Im
pact
TSo
cial I
mpa
ctT
Econ
omic
Tota
lAb
iotic
B
iotic
OO
Impa
ctSc
ore
Env.
Prob
lems
Geo-
Geom
or-
Pedo
-Su
rface
Grou
ndLa
ndCl
imat
eLa
ndAq
uatic
TNo
iseAi
rLa
ndT
logy
phol
ogy
logy
water
water
use
ecol
ogy
Ecol
ogy
AQu
ality
Quali
tyus
eA
LL
12
34
56
78
9(1
-9)
1011
12(1
0-12
)13
1.Di
sast
er(a
) Floo
d(b)
Seism
icity
11
11
12
29
––
88
724
(c) D
roug
ht2.
Land
Deg
rada
tion
(a) S
oil Al
kalin
ity(b
) Wet
land
(c) R
ivere
rosio
n1
21
22
8–
–6
64
18(d
) Silta
tion
(e) I
rrig.
Comm
. are
a3.
Bio-
Dive
rsity
(a) D
efore
statio
n(b
) Non
resid
ency
o
f run
off
(c) Si
ttatio
n of
12
13
29
58
22
wet
land
(d) S
ubsid
ence
of
of w
et lan
d(e
) Rive
r agg
rada
tion
4.W
ater
Imba
lance
(a) g
roun
dwate
r9
99
99
27
ove
r exp
loitat
ion(b
) che
mica
l haz
ard
5.Ur
bani
satio
n(a
) Veh
. Poll
ution
(b) S
olid w
aste
11
15
19
34
29
523
(c) S
ewag
e(d
) Air p
olluti
on6.
Indu
stria
lisat
ion
(a) M
ining
52
71
34
415
(b) In
dustr
ies7.
Awar
enes
s(a
) Pop
ulatio
n1
32
39
88
926
(b) H
ealth
Indic
ators

Bihar State Pollution Control Board [ 141 ]
ENVIRONMENTAL MANAGEMENT PLAN
5.1 DISASTER :
Drought : Lack or insufficiency of rain for an extended period that severely disturbs
the hydrologic cycle in an area is called drought. Droughts involve water shortage, crop
damage, stream flow reduction and depletion of ground water and soil moisture. They occur
when evaporation and transpiration exceeds precipitation for a considerable period.
Drought is the most serious hazard to agriculture in nearly every part of the world.
In Bihar the districts usually affected under this disaster are Kaimur, Rohtas,
Aurangabad, Jehanabad, Gaya, Nawada, Jamui and Banka.
Measure of mitigation plan :
(i) Update the data, observations and interpretation with respect to parameters e.g;
deficiency in rainfall and run-off, decline in soil moisture, reduction in groundwater
levels and the storage required to meet prescribed drafts or demands.
(ii) The drainage basins e.g; Lower reaches of Sone, Punpun, Morhar, Phalgu,
Dhadhar, Sakri, Kiul, Chandan and Baudna should be subjected for water balance
studies.
(iii) The topographically friendly drainage routes should be examined and considered
for diverting the flows successively from Punpun to Kiul, through intermittent
channels, from West to East, in the plateau marginal area.
(iv) The geological and geohydrogical region of surface water storage site and
groundwater recharge zones are to be identified and equitably distributed as
per the need and water holding capacity.
(v) Rain water harvesting should be promoted.
FLOOD AND SHIFTING OF RIVERS :
As a part of river prone disaster the two elements i.e. flood and shifting of rivers are
intimately related consequential fluvial phenomena. The most dynamic among rivers is the
Kosi, which has avulsed over 120 km of lateral width, from east to west, in about 220 years.
Bihar State Pollution Control Board[ 142 ]
The Gandak has migrated over a distance of 105 km. from west to east. The Sone river
has shifted westward since the Epic period, through Budha, Gupta and medieval time.
These shifting is concomittent with flood disaster and deluge.
The role of neotectonic changes (Seismic behaviour) has been attributed as the cause
for tilting of megafans towards east, leading to shifting of Gandak. The gradual shifting of
Kosi towards west may be correlated with the influence of Patna – Muzaffarpur crustal
fracture. Though there is no positive correlation with many severe earthquake and floods.
The shifting of Sone river is assumed to be an outcome of superimposition of Patna –
Muzaffarpur fault over the pre-existent Sone-Narmada basement fracture system.
The hydro-meteorological parameters, morphology of river systems, neo-tectonism
(Seismictly), over siltation and deforestation of the source area constitute the major factors
influencing the floods of North Bihar. The channel pattern related to flooding are
characterised as (i) increasing width-depth ratio (ii) increasing stream power, and (iii)
increasing sediment load. In an attempt to control the flood the construction of embankments
on both banks of North Bihar rivers have remained a major part of environmental
expenditure. this has changed the natural morphological setting of rivers and thereby curb
the translatory tendency of rivers. Spilling through gaps in the embankments enhanced with
synchronisation of floods within adjacent basins magnifies the problems. The embankments
have interferred with the natural processes of rivers and even in areas protected from spilling
by them, there is waterlogging and salinity.
CONTROL MEASURES :
Alternative to construction of embankments include :–
(i) Upstream storage and construction of detention basins within the flood plains.
(ii) Artificial draw down of ground water.
(iii) Afforestation in the catchment area to be able to hold more run-off and check on
dislodging of silt.
(iv) Flood proof planning with the support of preparation of Flood Risk Map,
constituting the data on synthesis of rainfall, run-off, flood boundaries and
Bihar State Pollution Control Board [ 143 ]
rehabilitation plan for different storming period over the base map of satellite
image.
(v) Extending guidelines for flood control measures, based on above excersise, for
minimising flood damage.
SEISMICITY :
Earthquakes of Bihar may be placed in two categories, one related to the earth
movements of Himalayan frontal region and the other originating from stress fields built up
in the northern front of Chotanagpur plateau. In recent past the Bihar-Nepal earthquake on
15-1-1934 of magnitude 8.1 continued through 19-1-1934 and with lower frequency till 13-
4-1934. The main shock was felt over a large area of 4.72 million sq. km with a death toll of
7253. A prominent effect of the earthquake was a creation of major slump in the central
part of the Ganga basin in which the tilting of houses and subsidence of ground was marked.
The belt runs WNW-ESE for some 300 km from the Champaran district in the west through
Muzaffarpur and Darbhanga districts to as far as Purnea in the east. The isoseismal X and
IX (Mercalli) define two distinct tracks of the greatest damage : (i) a belt of 32 km wide
trending ESE-WWW for some 128 km from east of Motihari through Sitamarhi to Madhubani
(isoscismal X) and (ii) a narrow linear belt extending from Munger to Patna towns covering
some 1300 sq. km (isoscismal X and IX).
Two other events i.e., on 16-8-1833 and on 31-8-1988 of high intensity have shaken
the same geographical extent as the 1934 event. The former is assigned a magnitude of
7.5 < to < 7.9 and an epicentre close to Kathmandu within or close to the infered rupture
zone of the 1934 event. The latter has an instrumentally determined magnitude of 6.4 and a
depth of focus of 17 km. The damage areas of the earthquake are more or less same as
that of for the 1934 event, the maximum intensity of IX and VIII was recorded in the northern
part of the Madhubani and Darbhanga districts. A narrow E-W belt around Munger recorded
damages of an intensity of 8 and 7.
The knowledge of the physical nature of earthquakes and their influences on
engineering structure is essential for working in the zones where the occurrence of
earthquake is probable. As a part of minimisation of damages and protection of life and
property in the area already discussed, the following two management plans are suggestsed :

Bihar State Pollution Control Board[ 144 ]
(i) to establish the nature of risk that would be if the planned structure is built in the
given area. It further incorporates two considerations (a) seismicity of the region
in terms of their intensity and magnitude and (b) the possible nature and
consequences of earthquake damage to the particular structure.
(ii) to establish certain bases of structural design in seismic regions. These result
from theoretical studies and actual observations of the ground motion and damage
during an earthquake.
5.2 LAND DEGRADATION :
Soil Alkalinity : Salinity problem usually arise from (i) either through the use of saline
waters for irrigation or (ii) through over irrigation and a consequent rise of a saline water
table to the root, the irrigation of level lands which may be initially non-saline and well
drained under natural conditions, but may have drainage facilities inadequate to take care
of the additional groundwater resulting from irrigation practices may lead to develop alkaline
soil. In such situations the grounwater level may be raised to the root in a relatively short
time. Water then moves to the soil surface s a result of evaporation, increasing the salt
content of the surface soil and of the soil water and causing the development of saline and
alkaline soil conditions.
In north Bihar there is a zone of alkaline soil about 40 km wide, North-South, covering
Gopalganj, southern part of East champaran, northern part of Siwan, southern part of
Sitamarhi, northern part of Muzaffarpur, parts of Samastipur, Begusarai, Darbanga and
Saharsa districts. About 80% of the affected area falls under the irrigational command
area of Gandak and Kosi canals where the depth to water level varies from 2 to 5 m. below
ground level during post monsoon and from 2 to 5 metre below ground level in selected
patches and in eastern part and in general 5 to 10 below ground level during pre-monsoon
period.
There are slected rich patches where (i) Salt peter (Sodium Nitrate and Potassium
Nilrate) and (ii) ‘Reh’ (sodium carbonate, Sodium Sulphate and Sodium chloride) are found
to occur. It has been usually found that in the dense populous area combined with warm-
humid climate provides the favourable ground for formation of saltpeter. In the area near to
village generates ammonia and nitrogenous substances. Bacteria comes into play and
Bihar State Pollution Control Board [ 145 ]
transforms the decomposed substances into nitric acid. It reacts with the potassium salt of
the soil and produces potassium nitrate.
In area north of Begusarai, near Majhaul, the aquifer lying at > 170 metre below
ground level contains chloride value > 500 mg/L and the irrigational water utilised from this
depth range increases the soil alkalinity.
The concept of total soil-moisture stress – a summation of osmotic pressure of the
soil solution and the soil moisture tension, has since been used extensively and provided a
firm basis for irrigation technology for handling the salinity problem.
WET LANDS :
The floodplain areas of Gandak, Burhi Gandak and Kosi rivers bear the record of
various kinds of lakes, swamps and bogs. One of the common type is the oxbow lake,
which is an abandoned meander loop of a river. Another type is produced during flood
stage when natural levee form a dam between the main channel and the floodplain, creating
a very shallow saucer-shaped basin. Other elongate lakes on flood plains are merely
channels of master stream which are abandoned as it shifts its course in any manner. Such
lakes are common along meandering rivers and are known as meander scrolls. In course
of dynamic system of life history of a lake a bog is the end stage. It is characterised with a
floating vegetal mat attached to shore. A swamp, on the other hand, is a vegetated land
area saturated with water.
The lakes of north Bihar have provided food, primary water supply, fisheries, bird
sanctuary for birds and supported base for aquatic bio-diversity. They have potential for
recreational activities and tourism also. The Baraila Tal and Kanwar Tal are of prime
importance. The wet-land zones are spread in north Bihar plains in sporadic patches and
covers the parts of Paschim Champaran, Purbi Champaran, Sitamarhi, Muzaffarpur,
Vaishali, Begusarai, Darbhanga, Supaul, Madhepura, Purnia, Kishanganj and Araria and
in south Bihar the Mokamah Tal and Surajgarha Tal are worth mentioning.
Significance of Wetlands :
(a) According to Hollies et al 1988, wetland represents the transition from upland to
deep water aquatic system and so they are actually ecotones having conditions

Bihar State Pollution Control Board[ 146 ]
suitable for high diversity and productivity.
(b) Wetlands regulate the hydrological cycle by regulating the recharging and
discharging of ground water.
(c) The help to maintain the quality and quantity of water by utilising the water purifying
efficiency of plants and animals i.e. they serve as waste water treatment and
oxidation ponds.
(d) Wetlands are the natural habitat for many fresh water and endangered species
of plants and animals i.e., they serve as a valuable biogenetic pool.
(d) Wetlands are the natural habitat for many fresh water and endangered species
of plants and animals i.e., they serve as a valuable biogenetic pool.
(e) They check the movement of nutrient and thereby ensure the efficient functioning
of the physical, chemical and biological cycles of nature.
(f) Wetlands serve as storage reservoir of energy and carbondioxide.
RIVER EROSION :
River bank erosion under the influence of Ganga channel warrants serious attention
as many times it remains the cause of concern for life and property. At all points enumerated
below Ganga river by constant land erosion through breaking away and detachment of bank
by the river waves or toe-erosion, are actively operative.
Sl. No. Location of the Site1. Near Dighwara
2. South of Bachwara
3. South east of Begusarai
4. South of Sahebpur Kamal
5. South of Bihpur
6. South east of Kursela
7. West of Manihari

Bihar State Pollution Control Board [ 147 ]
SILTATION:
The Gandak-Kosi interfan has been divided into an upper area of gently converging
rivers that flow SE or south, perpendicular to the mountain front and a down stream area
where the more sinuous channels of Burhi Gandak, Bagmati, kamla and Balan system flows
gently to SE. The upper area surfaces composed of Gandak and Kosi megafans are yielding
over the time the silt as reworked sediments as fine silt and causing enormous siltation in
river channels and floodplains. Similarly, in the central Bihar Plain the sector between
Jehanabad and Munger is having subsidence activity thereby the phenomenon of siltation
is more pronounced.
The sediment yield can be reduced in the channel load and floodplain by some
effective scientific and hydrological land treatment measures.
1. Vegetative system : Vegetation cover around the yield area exposed for
erosion may reduce the inflow velocity of run-off and carrying capacity. The deposition of
sediments can be enhanced in the upstream area by construction of diversions in the delta
areas to develop better distribution of incoming floodwaters and deposition in the backwater
areas.
2. Watershed structures : Several types of structures may be built in the
watershed for the specific purpose of reducing sediment yield in the floodplain. These
include such structures as sedimentation basins to trap sediment below eroding areas and
erosion control structures to halt the production of sediment.
3. Watershed Land Treatment Measures : In case of primary source of
sedimentation i.e. sheet erosion, land treatment measures provide an effective and
economical means of reducing erosion and sediment yield.
4. Site specific measures : In case of low yield small dams may be placed
across the yield area and the same may be excavated, mechanically, from time to time.
5.3 BIO-DIVERSITY LOSS :
The rich variety of flora and fauna we have around us is part of our natural heritage,

Bihar State Pollution Control Board[ 148 ]
and we have to ensure that human activities do not spoil this great diversity and leave a
poorer biosphere for the next generation. One way is to monitor the species diversity of
ecosystems that are subjected to the ravages of human influences such as pollution and
deforestation. An important feature of the ecosystem is the diversity of organisms within it,
under stress, natural or man made, the species diversity decreases. Greater diversity and
abundance indicates the well being of an ecosystem.
In Bihar only 7% of the area is under forest cover. Due to lack of density of forest the
bio-diversity has tremendously reduced. Mainly, two variety of monsoon dependent forest
viz; Humid deciduous forest and dry forest and one related to sub Himalayan and Tarai
affinity forest are found in Bihar. The first type is found in and around Kishanganj district,
the second type is prevalent in the Kaimur district and others sporadic spread sporadially
along the northern slope of Chotanagpur plateau. The third type is found around the
Someshwar hills in Paschim Champaran district.
For the purpose of wild life protection following sanctuaries, national parks and
protected areas have been identified:
1. Bhim Bandh Wildlife Sanctuary, Munger;
2. Gautam Budha Wildlife Sanctuary, Gaya;
3. Kaimur Wildlife Sanctuary, Kaimur;
4. Pant Wildlife Sanctuary, Nalanda;
5. Valmiki Wildlife Sanctuary, West Champaran;
6. Kanwar Lake Bird Sanctuary, Begusarai;
7. Kushewhwar Sthan Bird Sanctuary, Darbhanga;
8. Salim Ali Jubba Sahni Bariela Jheel Bird Sanctuary, Vaishali;
9. Vikramshila Gangetic Dolphin Sanctuary, Bhagalpur;
10. Nagi Bird Sanctuary, Jamui;
11. Nakti Bird Sanctuary, Jamui;
12. Udaipur Wildlife Sanctuary, West Champaran;
13. Valmiki National Park, West Champaran; and
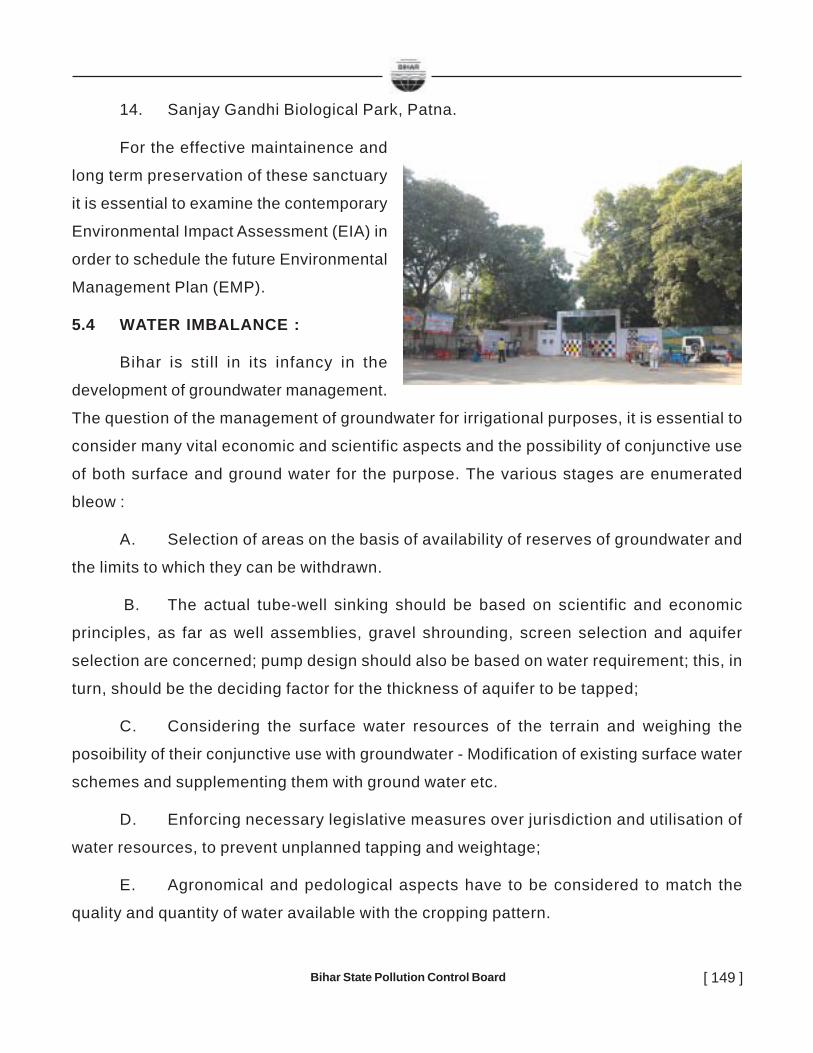
Bihar State Pollution Control Board [ 149 ]
14. Sanjay Gandhi Biological Park, Patna.
For the effective maintainence and
long term preservation of these sanctuary
it is essential to examine the contemporary
Environmental Impact Assessment (EIA) in
order to schedule the future Environmental
Management Plan (EMP).
5.4 WATER IMBALANCE :
Bihar is still in its infancy in the
development of groundwater management.
The question of the management of groundwater for irrigational purposes, it is essential to
consider many vital economic and scientific aspects and the possibility of conjunctive use
of both surface and ground water for the purpose. The various stages are enumerated
bleow :
A. Selection of areas on the basis of availability of reserves of groundwater and
the limits to which they can be withdrawn.
B. The actual tube-well sinking should be based on scientific and economic
principles, as far as well assemblies, gravel shrounding, screen selection and aquifer
selection are concerned; pump design should also be based on water requirement; this, in
turn, should be the deciding factor for the thickness of aquifer to be tapped;
C. Considering the surface water resources of the terrain and weighing the
posoibility of their conjunctive use with groundwater - Modification of existing surface water
schemes and supplementing them with ground water etc.
D. Enforcing necessary legislative measures over jurisdiction and utilisation of
water resources, to prevent unplanned tapping and weightage;
E. Agronomical and pedological aspects have to be considered to match the
quality and quantity of water available with the cropping pattern.

Bihar State Pollution Control Board[ 150 ]
5.5 URBANISATION :
The continuing growth and concentration of population and industry in urban and
sub-urban areas in recent decades have caused a complex merging of social, economic
and physical problems. The urban environment is one that requires an special planning
and management, because once the development has been effected, roads laid, pipes
installed, buildings in plac turning back would be a difficult proposition. Therefore, room
for error cannot be afforded.
In the background of Bihar, majority of
the township have come-up as agglomeration
around the pre-existing nucleus without
considerating the town planning measures
and land-use patterns. To some extent the
wastern part of New capital city of Patna has
witnessed the town planning regulations.
Some effective schemes with respect to
sewage management, traffic and transport
management have been made-effective.
As a first stage of amelioration of the process the concept of open space has become
associated with the deliberate maintenance of natural area with and surrounding an urban
area could be applied in the pre text of Bihar township. The open should be characterised
with natural scenic beauty, or places necessary to help maintain the natural systems. It is
on the opposite side of the spectrum where urban sprawl resides - the rampant and
unrestricted growth of developed area. It can take several forms and is embraced under
such related planing conditions as the green belt, new town, satellite township or garden
city. Thus it serves a diversity of functions such as :
(i) Providing for resources production in forestry agriculture, natural resources and
water supply;
(ii) Preservation of natural and human resources;
(iii) Provision for water and air quality and visual and recreational amenities;

Bihar State Pollution Control Board [ 151 ]
(iv) Protection of public safety in hazard prone area ;
(v) Filteration of air-borne pollutants by vegetation;
(vi) helping to compensate for the heat island effect and micro-climate disturbances
caused by the city ;
(v) For laying out the above proposal it is essential to plan the new township after
the proper EIA and EMP survey.
5.6 MINING :
The far reaching effect of mining on physical as well as biological resource base are
defacing landscapes, hydrological deterioration and air pollution.
(i) Defacing landcapes : The process of mining are of two types (i) Surface or
open casting e.g., linestone, rock chips, tiles etc; and (ii) underground mining e.g., pyrite
(Rohtas) and Mica (Nawada & Jamui districts). in both the cases, vegetation and top soil
have to be removed to get access to the deposit. The area thus lost is increasing day by
day. Dump disposal is another problem.
(ii) Hydrological deterioration : One of the most pronounce and long lasting effects
of mining is qualitative and quantitative deterioration of water resources. Mining disturbs
natural hydrological process and disrupts flow lines and utlimate storage of ground water.
(iii) Air Pollution : The SPM is increased in ambient atmosphere. In the area around
Amjhor (Rohtas) sulphuric acid leachets have chances of getting mixed with groundwater.
The discharges coming out of mining to be monitored, treated and disposed
at suitable site.
5.7 AWARENESS :
Awarness has a great role in the protetion of environment and conservation of natural
resources. Ignorance and misconceptions among the large section of population also cause
of environmental damage and pollution. Posistent and sustained efforts for creation of
awarness on environment and ecology is need of the hour. The sunmmarised reasons,
status and treatment aspect of awaraness is presented in Table 82.

Bihar State Pollution Control Board[ 152 ]
(BY
PROD
UCT
OF R
APID
INDU
STRI
ALIS
ATIO
N DE
VELO
PMEN
T PR
OJEC
TS)
CAUS
E OF
IGNO
RANC
EMI
SCON
CEPT
IONS
NECE
SSIT
YEN
VIRO
NMEN
TAL
INFO
RMAT
ION
DESS
EMIN
ATIO
NNG
O'S
ROLE
1.Th
e cu
rricu
lum fo
r med
icine
, en
gine
erin
g, t
echn
olog
y, ag
ricult
ure,
eco
nom
ics o
r de
velop
ment
has n
o blen
ding
comp
onen
t of e
nviro
nmen
tal
matte
rs2.
Plan
ner o
r poli
cy m
aker
s are
no
t tra
ined
to for
esee
the
en
viron
menta
l con
sequ
ence
s of
their d
ecisi
ons.
3.O
pini
on l
eade
rs,
ofte
n,
conc
eal
info
rmat
ion
from
pu
blic
or m
islea
d the
m for
the
ir own
reas
ons
4.Bu
sines
s or
indu
stry
owne
rs ar
e gu
ided
ent
irely
by
cons
idera
tions
of
econ
omic
gains
to th
emse
lves
(i)Di
seas
es ca
used
by de
mons
or
Gods
.(ii)
Fami
es,
drou
ght
or f
loods
-pu
nishm
ent b
y God
.(iii
)Ra
infall
-God
s gra
ce(iv
)Ci
ties
are
pollu
ted w
here
as
villag
es ar
e not
.(v)
Autom
obile
exha
ust in
citie
s are
no
t poll
uted
(vi)
Fore
sts ar
e disa
ppea
ring d
ue to
in
dust
rial
isat
ion
and
urba
nisati
on bu
t not
due t
o fue
l wo
od cu
tting
(vii)
Lack
in
hier
achy
of
resp
onsib
ility o
wner
ship.
For e
nviro
nmen
tal in
forma
tion a
rising
out o
f :(i)
Food
Prod
uctio
n,(ii)
Enha
nced
way
s of e
arnin
g live
lihoo
d,(iii
)Ef
fect o
f tech
nolog
y,(iv
)Im
pact
of all
dov
elopm
ental
acti
vities
on
healt
h.e.g
.; (a) A
gricu
lture
: La
nd u
se p
atter
n, wa
ter
reso
urce
s irri
gatio
n patt
ern &
issu
e of s
ocial
aw
aren
ess
(b) I
ndus
try :
Incre
ased
was
te &
pollu
tion,
cost
of po
llutio
n(c)
Hea
lth : U
rban
isatio
n, hig
h inc
idenc
e of
disea
ses d
ue to
lack
is h
ealth
dete
rmina
nt fac
tors,
malnu
trition
(v)Di
scipl
ined
huma
n de
cision
i.e.;
gen
eral
welfa
re,
fixat
ion o
f re
spon
sibilit
y fo
r de
grad
atio
n an
d am
elio
ratio
n,
cons
cious
ness
abou
t una
dable
effec
ts du
e to
env
ironm
enta
l en
croa
chme
nt a
nd
envir
onm
ental
law
imple
menta
tion.
A.Am
ong S
tuden
ts thr
ough
educ
ation
:B.
Amon
g Ge
nera
l pop
ulatio
n thr
ough
var
ious
med
ia :
(i) I
ncor
pora
tion
of t
opic
s in
reg
iona
l lan
guag
es-a
dult e
duca
tion p
rogr
amme
.(ii)
Infor
matio
n pa
cks
like
poste
rs, s
lides
and
au
dio vi
sual
mate
rial
(iii) S
pecia
l exh
ibitio
n is r
ural
area
s at t
he tim
e of
fairs
and f
estiv
als.
C.Am
ong
opini
on le
ader
s : e
.g., G
ovt.
office
rs,
volun
tary
orga
nisati
ons,
politi
cians
& s
ocial
wo
rkers
and
fun
ction
aries
con
cern
ed w
ith
critic
al de
cision
s sho
uld h
ave
orien
tation
and
tra
ining
.
Role
:
Actio
n :
(i)to
aid an
d adv
ice th
e gov
ernm
ent
(ii)to
act a
s the
eyes
and e
ars o
f the G
ovt. a
nd
(iii)
to ed
ucate
the p
eople
at la
rge a
nd to
crea
t ge
nera
l aw
aren
ess
in f
avou
r of
co
nser
vatio
n.
(i)Pr
epar
ation
of da
tabas
e,(ii)
Form
ation
of ac
tion g
roup
(iii)
Act a
s pre
ssur
e gro
up,
(iv)
Advis
e the
govt.
on le
gislat
ion,
(v)Un
derta
ke ed
ucati
on ac
tiviity
,(vi
)Re
sear
ch on
spec
ialise
d iss
ue an
d(vi
i)Br
ing ou
t use
ful pu
blica
tions
.
Stag
eOb
jectiv
eCo
nten
tTe
achin
g Stra
tegy
Prim
ary
Awar
enes
sSu
rroun
ding f
rom
home
Audio
-visu
al an
d fiel
d visi
tsto
outdo
or si
tuatio
nLo
wer S
econ
dary
Real
life ex
perie
nces
,As
abov
e and
gene
ral s
cienc
eCl
assro
om te
achin
g,aw
aren
ess a
nd pr
oblem
prac
ticals
and f
ield v
isits
inden
tifica
tion
High
er Se
cond
ary
Cons
erva
tion,
assim
ilatio
nSc
ience
base
d and
Cl
assro
om te
achin
g, pr
actic
als
of kn
owled
ge, p
roble
mAc
tion o
riente
d wor
kan
d fiel
d wor
kide
ntific
ation
and a
ction
Tertia
ry / C
olleg
eSu
staina
ble de
velop
ment
Colle
ge/U
niver
sity
Clas
sroom
teac
hing,
prac
ticals
base
d on e
xper
ience
with
ba
sed o
n scie
nce
and a
ction
orien
ted fie
ld wo
rkCo
nser
vatio
nan
d tec
hnolo
gy
AB
TAB
LE -
82
: AW
AR
ENES
S A
BO
UT
ENVI
RO
NM
ENT
[152]
Bihar State Pollution Control Board [ 153 ]
CONCLUSION AND RECOMMENDATIONS
1. The state of Bihar may be broadly divided, on macro scale, into northern and centralGanga plains and the southern most part of plateau region of which the Chotanagpurplateau is most prominent alongwith minor Kaimur plateau. The north-western partis covered with Himalayan foothills. Any step to revive the economy of the statewarrants interlinkages between environment and development issues within theframework of macroscale zonation, as outlined above.
2. Environment being a cross sectoral issue, concerning many departments, agenciesand public participation it becomes mandatory to capture and elicit view points of allconcerned government agencies and NGO’s engaged in this sector.
3. The consultative process covering NGO’s, civil society representatives and generalpublic to express their environmental concerns and priorities needs to be adequatelyattended to be able to refine this report into an Environment Monitor, highlighting thekey issues, hotspots and priorities.
4. A data-bank system needs to be created to systematically collect, collate andsynthesise information from various sources, on Geographical Information System(GIS), to assess the incidence and magnitute of environmental degradation on multi-temporal, multi sectoral and multi bio-physical facies. This Monitor system could beutilised as a basis for further stakeholder consultations to develop an EnvironmentalAction Plan for Bihar. A cell equipped with hardware & software relating to GIS /Remote sensing technology should be setup with a view to updating various data onregular basis.
5. The Monitor’s Primary target is to create awareness among the NGO’s, general publicand other concerned stakeholders, who may utilise the information generated out ofdata-bank system to initiate appropriate actions in their region of concern throughinter and intra sectoral co-ordination.
6. The State Government should prioritise in its agenda training programmes for raising trainedmanpower for environmental protection including Wild Life Management and ForestProtection.
7. A survey of ecological habitat, including collection of information relating to wetlands of theState for the protection of Environment and Conservation of Medicinal and Herbal Plants,which are in the process of being extinct in the State of Bihar, should be initiated on prioritybasis.
8. Ex-situ protection methods of conservation like Tissue Culture and Bio-technology should bebrought into the State’s agenda, so as to preserve the endangered species of flora andfauna.
Bihar State Pollution Control Board[ 154 ]
9. Public participation should also be encouraged in the forest protection and its management,so as to develop and maintain a complementary relationship with forests.
10. Grazing by domestic animals inside forest should not be allowed, so as to protect wild animalsfrom diseases and other related problems.
11. Botanical Gardens with special reference to medicinal plants should be developed in differentareas of the state.
12. To conserve water resources, effort under National River Conservation Plan, to study theeffects of pollution on surface water, including changes in the technology for recycling domesticwastes should be taken up. Interlinking of various rivers of Bihar should be planned to usejudiciously, the available water in various basins. This will further help in controlling floods andwater logging.
13. Steps should be taken, if possible by special legislation, for Rain Water Harvesting, so as toconserve water resources.
14. Non-conventional and renewable sources of energy like Hydro, Wind, Biomass and Solarenergy should be encouraged.
15. Approach of public-private-partnership should be adopted by the State towards environmentalprotection with special reference to industrial planning and development.
16. State should ensure installation of Common Effluent Treatment Plants (CETPs) for theindustrial growth centers.
17. Common Bio-Medical Waste treatment facilities should be developed at least in each districtheadquarter of the State for the proper management of Bio-Medical Wastes generated in thedistrict.
18. Bottlenecks at the main traffic intersections and roundabouts should be cleared.
19. Only light motor vehicles should be allowed to ply on the trunk road at peak hours. Publictransport system should be planned for various towns in the State.
20. No drive days should be encouraged to reduce air pollution and energy conservation.
21. Indoor air pollution and health impact should also be assessed.
22. Studies on environmental degradation of hillocks due to stone mining in the state should becarried out. Environmental Management Plan should be prepared for stone and sand miningbefore the process of auction for grant of lease.
23. Possibilities for providing drinking water from surface water resources after treatment in placeof underground water should be explored.
24. Urban Solid Waste Treatment Facilities should be developed in each municipal area for propermanagement of solid wastes. Urban Development Department should plan for Integratedsolid waste management policy and programme on public - private partnership basis.

Bihar State Pollution Control Board [ 155 ]
REFERENCES
Abbas, N. and subramaniyan, V., 1964, Erosion and sediment transport in the Ganga River
Basin. Indian Jour. Hydrology, 69.
Abhasi, S.A., Environment Everyone, Discovery Publishing House, New Delhi
Base, P.K., Saikia, B.C. and Mukherjee, B.B., 1966, Refraction seismic survey for
groundwater in Patna and Gaya districts, Bihar. Unpub. Rep., Geol. Surv. Ind,
calcutta
Bandhu, Destri Environmental Management, Indian Environmental Society, New Delhi
Coleman, J.M., 1969, Estimates of annual sediment transport by the Ganga/Brahamaputra.
Sediment. Geol. 3
Central Statistical organisation (1991 & 2001). Census of India, Govt. of India, New-Delhi
Handbook of statistics on State Government finances, 2001 Valdiya, K.S., 1987,
Environmental Gelogy - India context.
Kumar, N., 1970, Bihar District Gazetters, Govt. of Bihar, Patna, Gazetters Branch, Revenue
Deptt., Patna
Planning Commission (1997). Ninth Five Year Plan Document, Planning commission, Govt.
of India, New-Delhi
Peavy, Howard S., etal; Environmental Engineering, Mc graw - Hill International Edition
(Civil Engg. series), New york.
Roy, A.K. and Sinha, S., 1968, Groundwater resources of Bihar with special reference to
the problems of planning and development for irrigation purposes. Unpub. Rep.,
Geog. Surv. Ind.
Reserve Bank of India 2001.
Rural Development Ministry Report, Govt. of India, 2001.

Bihar State Pollution Control Board[ 156 ]

Bihar State Pollution Control Board [ 157 ]
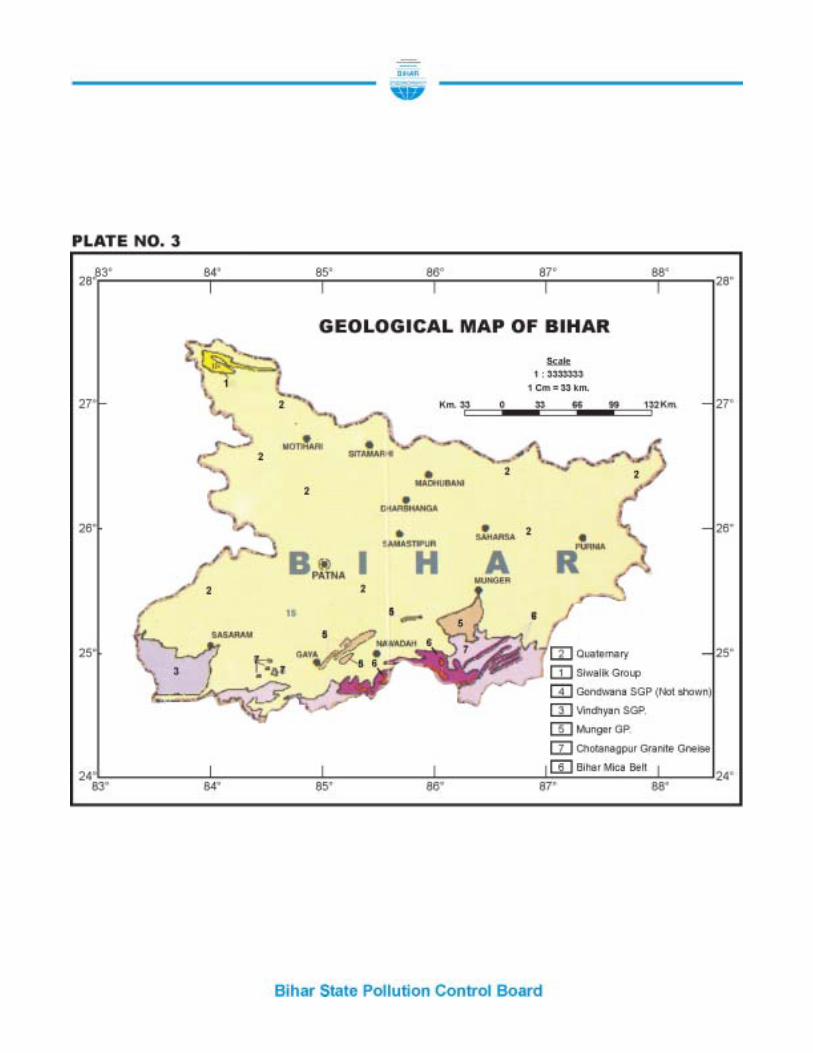
Bihar State Pollution Control Board[ 158 ]
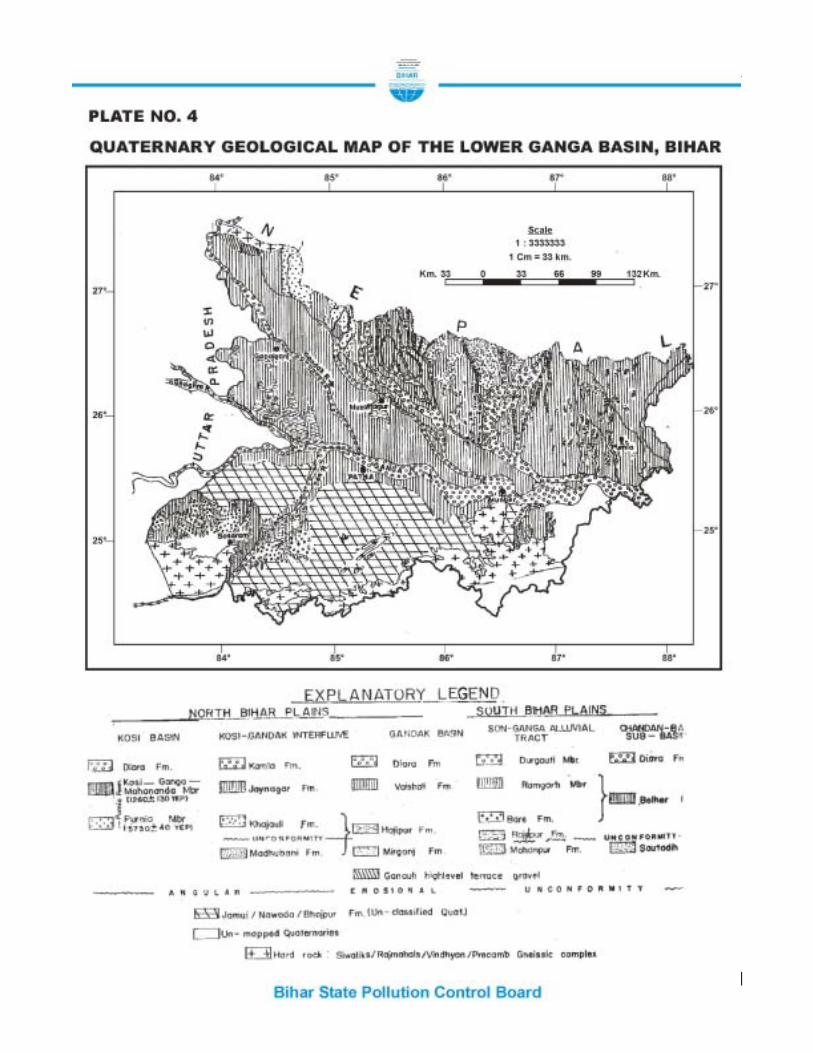
Bihar State Pollution Control Board [ 159 ]
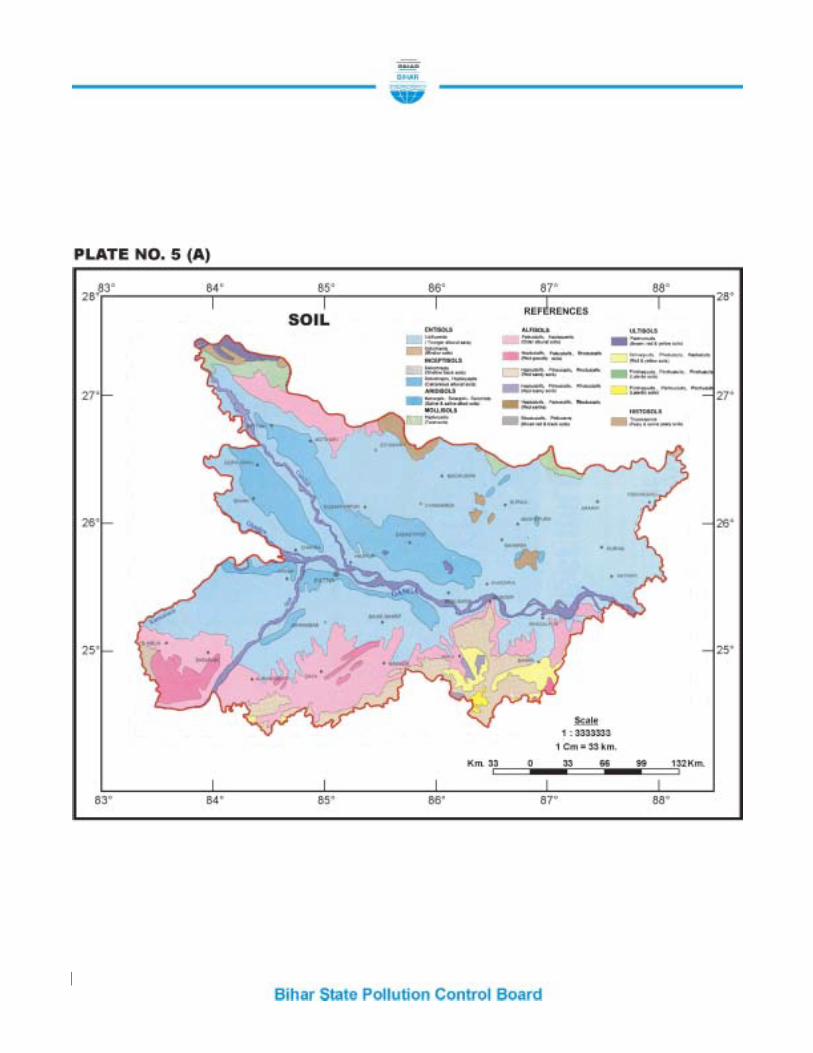
Bihar State Pollution Control Board[ 160 ]

Bihar State Pollution Control Board [ 161 ]

Bihar State Pollution Control Board[ 162 ]
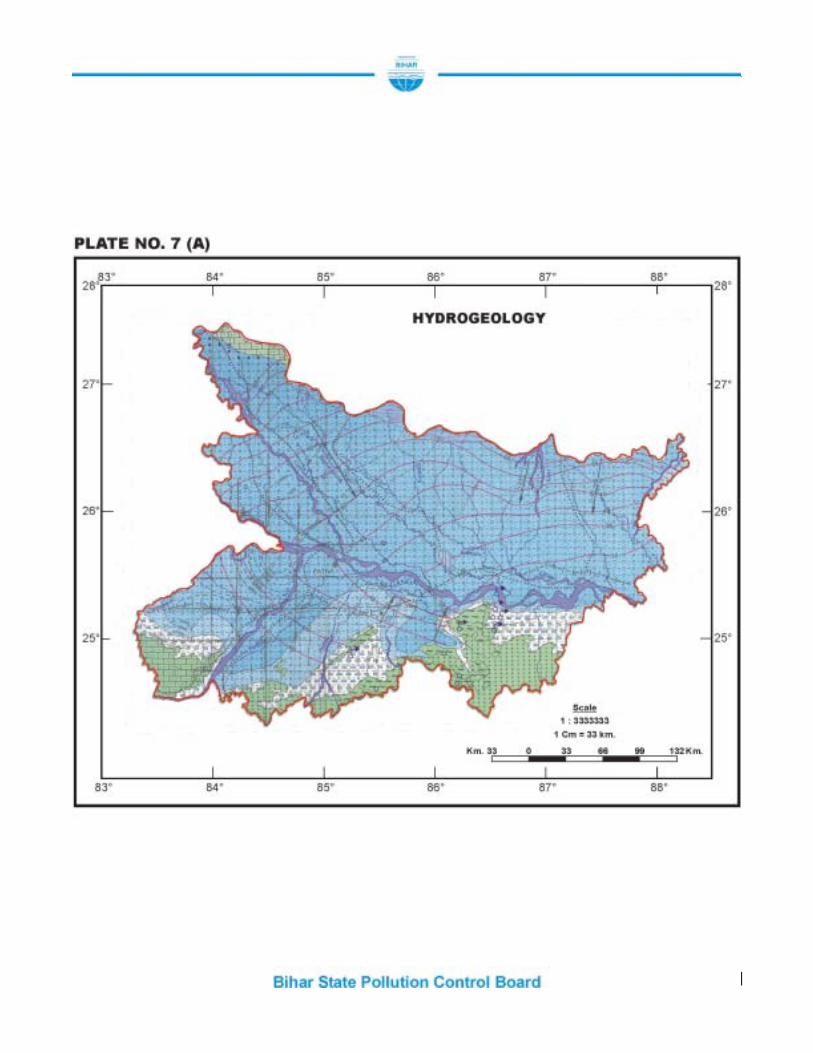
Bihar State Pollution Control Board [ 163 ]

Bihar State Pollution Control Board[ 164 ]

Bihar State Pollution Control Board [ 165 ]

Bihar State Pollution Control Board[ 166 ]
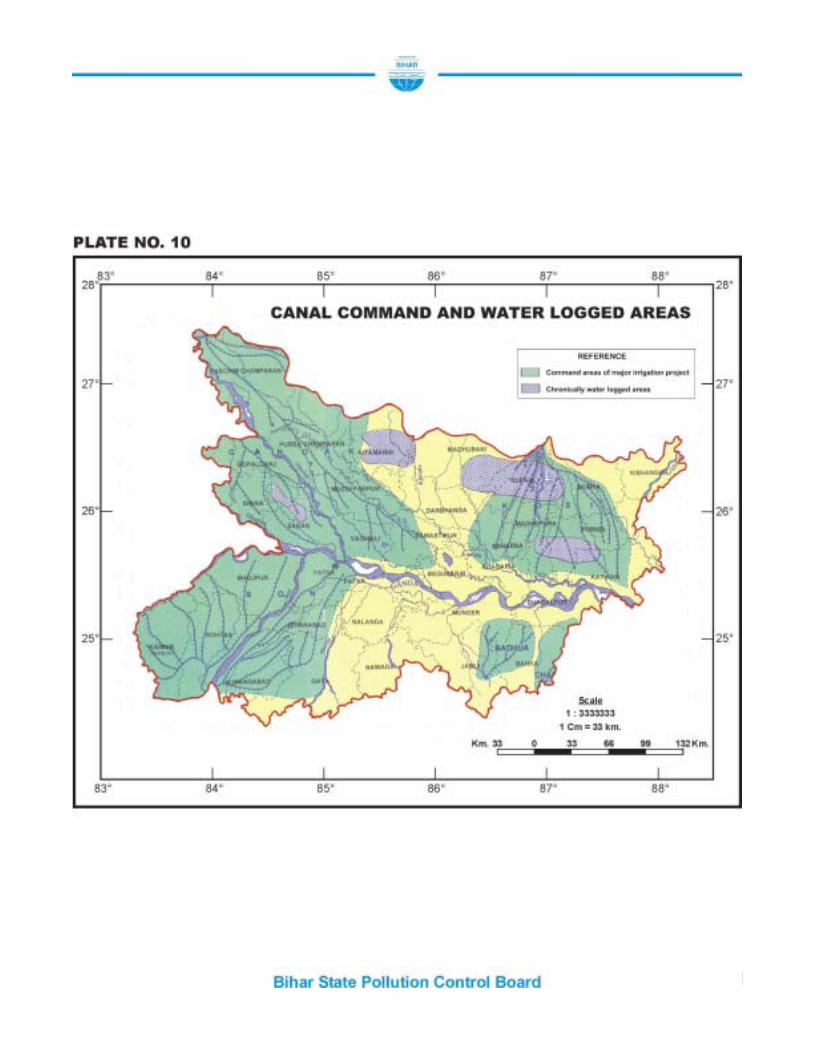
Bihar State Pollution Control Board [ 167 ]

Bihar State Pollution Control Board[ 168 ]
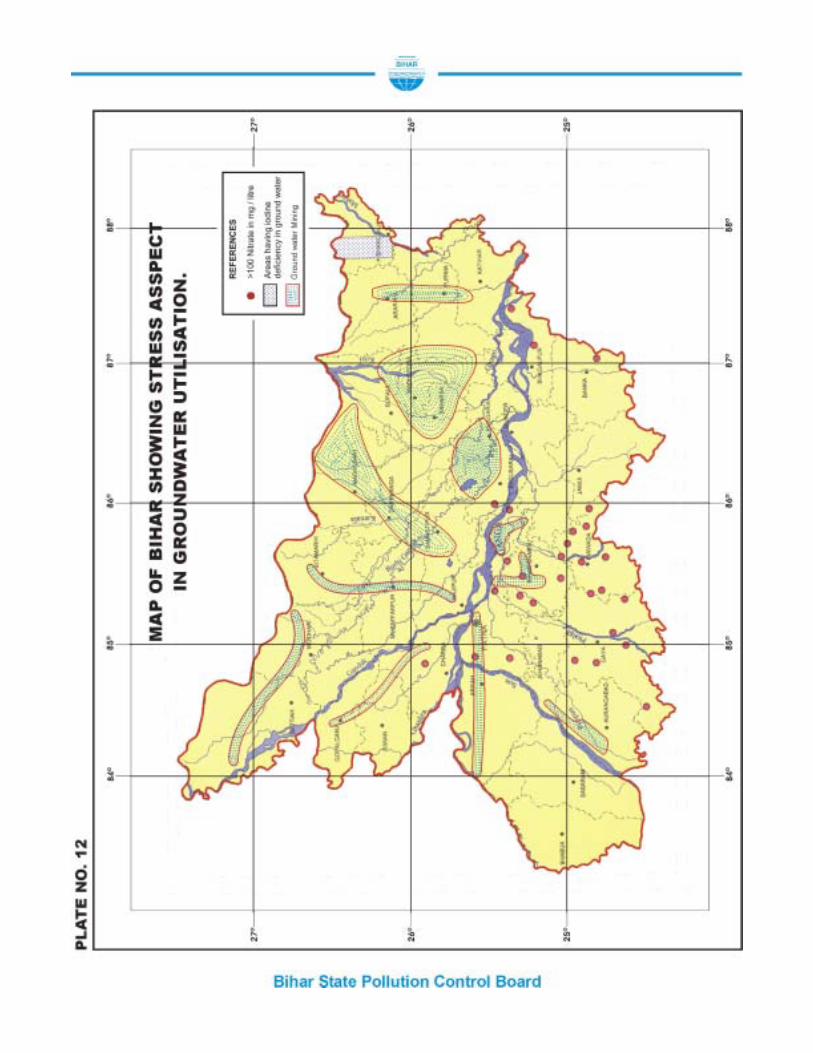
Bihar State Pollution Control Board [ 169 ]
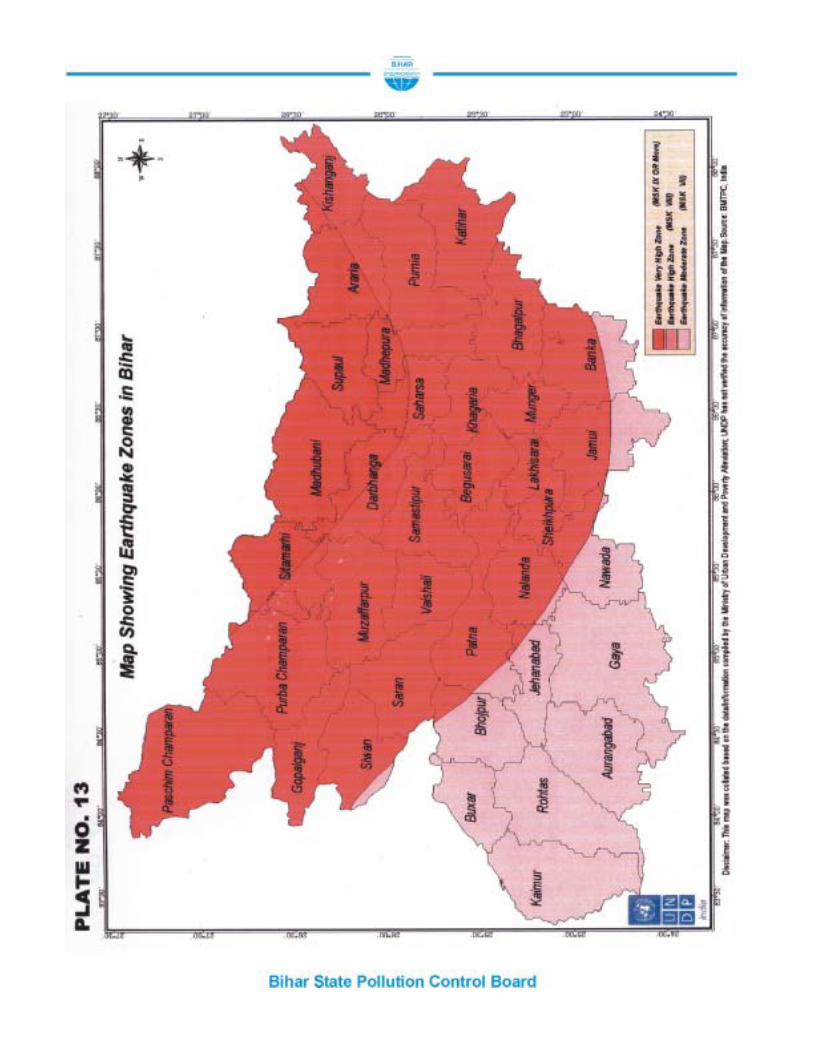
Bihar State Pollution Control Board[ 170 ]

Bihar State Pollution Control Board [ 171 ]

Bihar State Pollution Control Board[ 172 ]
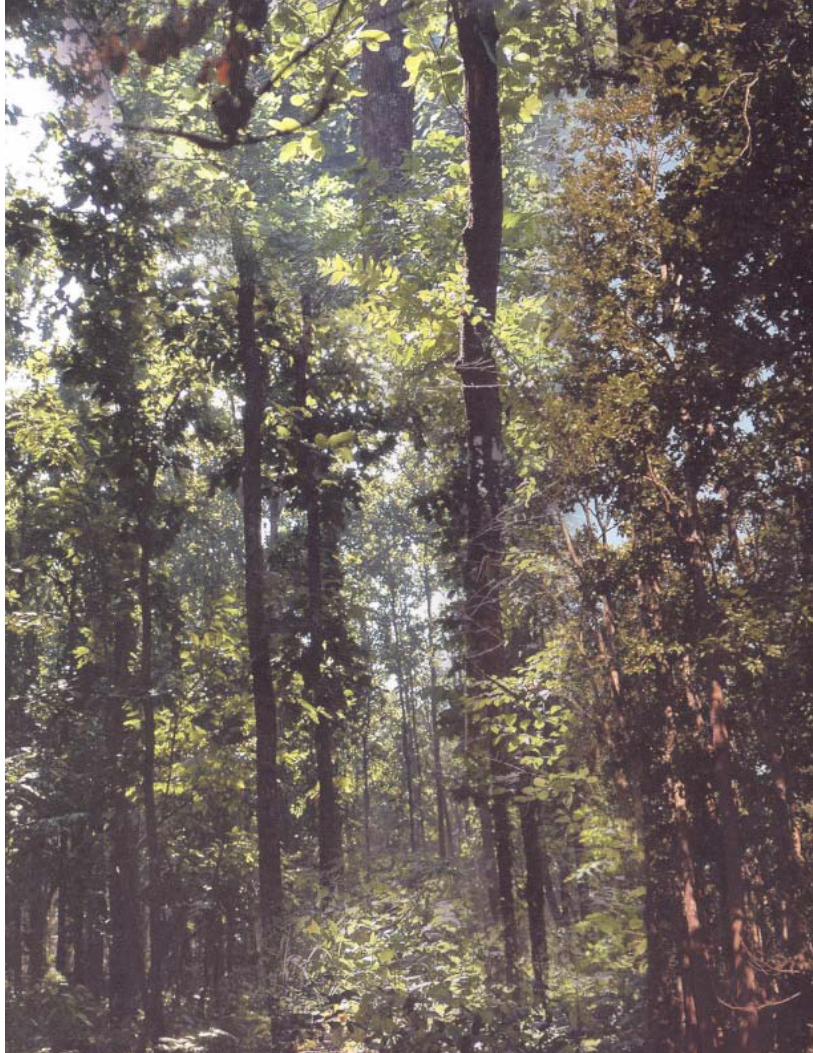
Bihar State Pollution Control Board [ 173 ]
Bihar State Pollution Control Board[ 174 ]