state of environment report - sea.org.sz · 2 chapter 1 national circumstances geography the...
TRANSCRIPT

STATE OF ENVIRONMENT REPORT
FOR
SWAZILAND
March 2001

2
Chapter 1 NATIONAL CIRCUMSTANCES Geography The Kingdom of Swaziland is situated in South Eastern Africa between latitude 25° and 28° South and longitudes 31° and 32° East. It lies some 48 to 225 kilometers inland of the Indian Ocean littoral and hence physically landlocked. The country has a total surface of 17,360 sq km. It is bounded by the Republic of South Africa in the north, west and south and Mozambique in the east. Although small in size Swaziland is characterized by a great variation in landscape, geology and climate that make up the four physiographic regions. Climate Swaziland has a subtropical climate, with warm wet summers and cool dry winters. Climatic conditions vary from region to region. Mean annual rainfall ranges from 1500 mm in the highveld to 500mm in the lowveld. In the highveld temperatures vary between a maximum of 33°C in mid summer and 0°C at night in mid winter. In the lowveld diurnal temperature may rise to 39° C. Population Swaziland’s population is estimated at 965 000 with an annual growth rate of 2.7%. The population of Swaziland may be divided into 76%rural and 24% urban. The high incidence of HIV could an impact on future population projections and socio-economic performances. Economy Swaziland has a small, but strongly export oriented economy. Over the years since 1968 when the country obtained its independence the country has experienced remarkable economic growth, social progress and human development The historical economic environment of the country up to the 1980s was charecterised by positive growth and a notable surplus position. This trend reversed in the 1980s, impacting amongst others, the per capita income growth. The major causes of economic decline were the decline in foreign investments inflow, recurring drought, high population growth rates, also overall poor performances of economies in the region.

3
Table 1.0 below summarizes Swaziland’s National Circumstances Criteria 1981 1986 1990 1994 1999 GDP – Purchasers value (E) 497.8 1026.3 2224.0 3.787 2330.6GDP per capita (E) 3002 4241 7900.0Source: Central Statistics Office Country Development Strategies Through the National Development Strategy the Government of Swaziland addresses three main areas, i.e. good governance, a vibrant economy and human and social development. Table 1.1 below shows the projections for average growth rates of GDP by sector for 1994 to 2030. GDP per sector 1994-2000
(%) 2001-2010 (%)
2011-2020 (%)
2021-2030 (%)
Agriculture 11 15.2 14.9 13.7 Forestry 1.3 1.4 1.3 1.3 Mining 1.7 2.3 2.29 2.12 Industry/Manufacturing 37.57 29.28 29.6 32.15 Construction 3.7 3.6 3.8 3.7 Transport and Communication
6.5 6.3 6.4 6.4
Government Services 17.7 17.5 17.5 17.6 Overall GDP as well 3.2 4.66 5.29 5.0 Source: Ministry of Economic Planning

4
Chapter 2
LAND INTRODUCTION Swaziland is one of Africa’s smallest states and has a landmass covering an area of 17,364 sq km. Land is often regarded as the most valuable resources a country has in terms of the other associated resources that are found in association with it e.g. soils, flora, fauna, surface water and minerals. The country has six physiographic regions with their unique climate, geological, and associated soil characteristics, which determine the land-use and development patterns. The major economic activities include mining, forestry, agriculture (livestock and crop farming) and manufacturing. Environmental issues associated with the land in Swaziland include land degradation, biodiversity loss, and unsustainable land-use and land management. LAND DEGRADATION Land degradation can be described as the decline or loss of productive capacity of a piece of land due to human activities and habitational patterns. This process often manifests itself in reduced vegetation cover, soil erosion and reduced soil fertility1. The magnitude of land degradation in Swaziland varies with he different land tenure types. There are three main categories of land tenure. These are: - Swazi Nation Land (SNL) Communal Land 75% - Crown Land (Government holds title) 1% - Private Freehold or Title Deed Land 24% Swazi Nation Land occupies 75% of the total land area and this category suffers most degradation. Land Degradation on Grazing Lands

5
The predominant land-use of the country is grazing land and this covers 11,630 sq km. Seventy one percent of this land is communal grazing and studies have already indicated that more than half of communal grazing suffers serious or very serious soil erosion2. Serious land degradation in rangelands manifests itself in the form of gully erosion. WMS and Associates(1988) 3 mapped a total of 2, 500 gullies of varying sizes and morphology. Osunande (1994)4 indicated that some gullies in Central Middleveld cover areas up to 5 ha and are more than 25m deep and that in terms of total loss of land to the Nation these gullies account for a total loss of 2, 000 to 3, 000 ha annually. Factors causing land degradation are numerous and they do not operate in isolation. However, in the Communal Swazi National Land (SNL) the increased livestock population can be said to contribute largely to the problem 5. Cattle populations alone have been growing at a rate of 2.5% per annum whilst the land they graze on has been gradually decreasing due to the competing land-use such as crop production and forestation (Table 2.2). This has resulted in stocking rates above the carrying capacity of the grazing lands, which is estimated at 3.0ha/LSU6. Table 2.1 Livestock Units and Stocking Rates 1972-1996 YEAR LIVESTOCK UNITS1 STOKING RATE2
1972 507 451 2.6 1982 551 672 2.3 1992 651 321 2.0 1993 537 263 2.4 1994 555 743 2.3 1995 564 850 2.3 1996 585 484 2.2 Source: MOAC Livestock Statistics.
1. Livestock units based on: cattle = 0.8 equines = 0.4 Sheep and goats = 0.1
2. Based on constant total grazing area for the country = 1,295 744 ha. Table 2.1 shows that the stocking rate was on the increase since 1972 until the livestock population was drastically cut down by the 1992 drought which hit the Southern African region. The 1993 figures dropped by 20% which was a severe blow to the farmers whose livelihood largely depends on the livestock and the resultant flow products of milk, kraal manure and draught power.
6
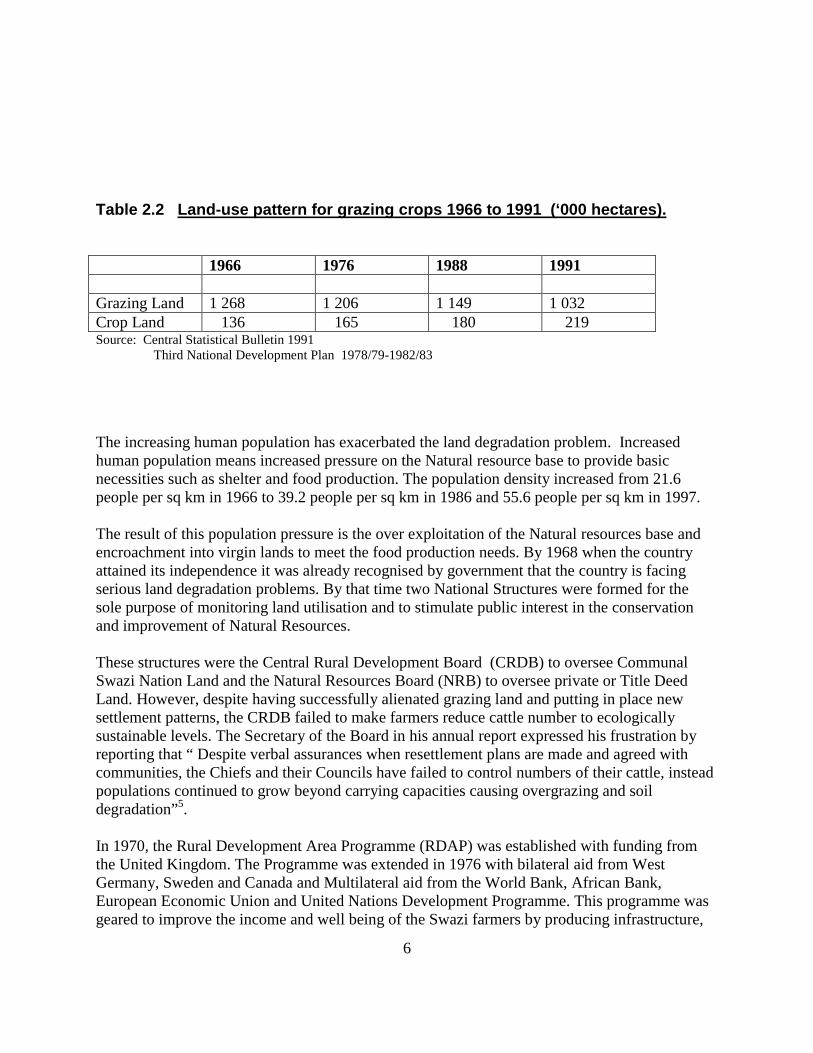
Table 2.2 Land-use pattern for grazing crops 1966 to 1991 (‘000 hectares). 1966 1976 1988 1991 Grazing Land 1 268 1 206 1 149 1 032 Crop Land 136 165 180 219 Source: Central Statistical Bulletin 1991 Third National Development Plan 1978/79-1982/83 The increasing human population has exacerbated the land degradation problem. Increased human population means increased pressure on the Natural resource base to provide basic necessities such as shelter and food production. The population density increased from 21.6 people per sq km in 1966 to 39.2 people per sq km in 1986 and 55.6 people per sq km in 1997. The result of this population pressure is the over exploitation of the Natural resources base and encroachment into virgin lands to meet the food production needs. By 1968 when the country attained its independence it was already recognised by government that the country is facing serious land degradation problems. By that time two National Structures were formed for the sole purpose of monitoring land utilisation and to stimulate public interest in the conservation and improvement of Natural Resources. These structures were the Central Rural Development Board (CRDB) to oversee Communal Swazi Nation Land and the Natural Resources Board (NRB) to oversee private or Title Deed Land. However, despite having successfully alienated grazing land and putting in place new settlement patterns, the CRDB failed to make farmers reduce cattle number to ecologically sustainable levels. The Secretary of the Board in his annual report expressed his frustration by reporting that “ Despite verbal assurances when resettlement plans are made and agreed with communities, the Chiefs and their Councils have failed to control numbers of their cattle, instead populations continued to grow beyond carrying capacities causing overgrazing and soil degradation”5. In 1970, the Rural Development Area Programme (RDAP) was established with funding from the United Kingdom. The Programme was extended in 1976 with bilateral aid from West Germany, Sweden and Canada and Multilateral aid from the World Bank, African Bank, European Economic Union and United Nations Development Programme. This programme was geared to improve the income and well being of the Swazi farmers by producing infrastructure,

7
fencing grazing areas, improving livestock management and land consolidation among other things. Soil conservation became prominent in the RDAP with the introduction of terraces to replace grass strips. According to Osunade only 20% of the planned conservation measures were achieved in the RDAP4. In spite of these noble investments and noble objectives, very little seems to have been achieved with regards the reduction of stocking rates, protection of Natural resources and self-reliance of livestock producers7. A new Agricultural Development Strategy was formulated in 1986, which focused on alleviating major constraints to agricultural development. Low livestock off-take was recognised as one of the major constraints. However, there were very few activities that appeared to have been put on the ground to address the low off-take problem. A Livestock Development Policy was formulated as a follow up to the agricultural Strategy with clear objectives and activities to increase off-take from the overgrazed Swazi Nation Land and to institute cost recovery and instil a commercial attitude to farmers. It is sad to note that despite all these efforts society has shown a strong resistance towards commercialising cattle rearing and maintaining sustainable herds. The strong cultural attachment of the Swazi people to cattle in particular and the long history of Government’s subsidy on the cattle industry has worked negatively against ecological sustainability which is a key guiding principle in the Livestock Development Policy. The subsidisation Policy of Government on dipping chemicals places a considerable burden on Government recurrent budget (E4.5 million annually) and exacerbates the deficit forecasted by the Ministry of Economic Planning and Development since 19948. A renewed vigour to push forward the principle of Sound Environmental Management has been necessitated through the implementation of Multilateral Environmental Agreements. The Government of Swaziland as an obligation to the Convention to Combat Desertification and mitigating the effects of drought has prepared a National Action Programme (NAP) which was endorsed by government in 1998. The NAP outlines clearly what actions government need to take to arrest the problems of Desertification and Land Degradation. The activities range from putting in place the proper institutional setting, awareness and capacity building strategies, technological support for reclamation and rehabilitation, and also putting in place appropriate policies for land utilisation, population growth and poverty alleviation. A new Environment Management Policy is also in progress which will instil environmental responsibility, sustainable use, environmental rights and will further be supported by enhanced public awareness and participation, adopting precautionary and preventative approach and the polluter pays principle. A Comprehensive Environmental Act is also being formulated which seeks to provide an integrated framework for environmental management with an opportunity for establishing a National Environment Fund with a window for supporting activities that prevent land degradation in drought and poverty stricken areas of the country.

8
Land Degradation on Arable Land Cropland in Swaziland covers a total area of 219 463 ha which is 12% of the total land area9. According to the 1997 Statistical Bulletin 91 268 ha(42%) was farmed on various crops in Swazi Nation land while 68 077 ha (31%) was cropped under individual tenure land. The rest (27%) was fallow Land. In Swazi Nation Land (SNL) a majority of rural Swazis are subsistence farmers, with comparatively small land holdings. There is low technological and capital input into farming yet the continuous cultivation of the soil restricts the regeneration of nutrients and structure. Incidents of inappropriate cropping and farming practices as well as poor soil/land management system are prevalent. Likewise, problems of land degradation have been recorded among farming communities on Title Deed Land (TDL), whereby incidents of improper application of fertiliser, herbicides and insecticides have been documented in all farming systems in the country together with their adverse effects on the soil nutrient composition and structure 1. Soil Conservation Measures Measures to control soil erosion within arable areas have a long and rich history in Swaziland. The control of soil erosion within arable lands started in the 1940s with the introduction of grass strips by extension workers. A grass strip is an unploughed 2-5metre piece of land at the down slope hedge of a ploughed field or between two or more ploughed fields created on contours and covered with propagated plants, or naturally grown grasses or any other plant covers. The critical design factor is the grass strip spacing which is computed the same way as terrace construction. A total of 113 780 KM of grass strips were laid out by extension workers between 1940 and 1960. This system of soil conservation enjoyed over a decade of active promotion by the government, between 1944 and 1960 and thereafter, it has survived expanded and has become “a way” of Swazi farming culture4. Another method which was also chiefly motivated by government through the RDAP was the introduction of terraces to replace grass strips. Unlike the grass strips, these terraces did not last very long as they were poorly maintained by communities thereafter. According to Osunade, only 2003ha was covered by the terracing method. The failure of the terracing initiative demonstrates the need for education and participation of affected communities right at the planning stage. Irrigated Agriculture and its impacts
9
Irrigation was the foundation on which many civilisation were built. In the world today it is the chief support of agricultural activities. It is also destined to be the important factor in future development 10. This is the most likely trend in a semi-arid country like Swaziland . The dry Middleveld and Lowveld of Swaziland have very erratic rainfalls. Therefore crop production in these areas needs irrigation. Irrigation issues in Swaziland were reviewed by Carr11. Large-scale irrigation in the country began in the late 1950s in the Lowveld. The total irrigated area is estimated to have risen from about 38, 434 ha in 1988 to about 43, 846ha in 1996. This is about 19% the cultivated land area and the major crops grown in this sub-sector are sugarcane and citrus9. There is evidence of improved crop production in Swaziland as a consequence of irrigation. However, there are harmful side effects that come with it due to incorrect practices (Nkambule and Ndlovu, 1988). Soil degradation is probably the most serious negative effect of irrigation. “Irrigation with poor quality water, over irrigation of soils ill-adapted to these methods and irrigation accompanied by insufficient drainage to leach out salts or to prevent their surfacing along with rising water tables has often led to salinisation of the soil and/or water lodging”10. Such problems resulting from incorrect irrigation schemes have been reported in the country. It is reported that within ten years of the start of the irrigation schemes in the Lowveld, large areas have become water logged and saline11. At Mhlume Sugar Estate alone more than 2, 500 hectares have been abandoned due to the problem (Nkambule and Ndlovu, 1988).
Fertilisation and Ameliorants Fertiliser use and improvement of agriculture’s production are inseparable entities. The trend in the usage of fertilisers in Swaziland is however not clear. In 1972/73 the bulk weight of fertiliser sold in the country was just above 29, 000 tons (CSO, 1975). The figure increased to about 47 500 tons in 1980/81 (CSO,1982). After this the figure began to fluctuate such that in 1984/85 it was 24 000 tons and then 34 532 tones and 23 537 tons in 1986/87 and 1987/88 respectively (CSO, 1984 and 1997). However the fourth National Development Plan implies an increase in the usage of fertilisers. Nevertheless it goes without say that commercialisation of Agriculture will demand an increase in the usage of fertilisers. Even soils which are high in “natural” fertility will be exhausted and there is going to be a need to use substantial amounts of inorganic fertilisers12.

10
The main positive effect of fertiliser use is increased crop and animal production per unit area of land. However, the usage of fertiliser has its drawback to the environment. The importance of the fate of fertilisers after application to the soil is two fold. Firstly, it relates to the efficiency with which it is used by crops. Secondly, it is in relation to possible contamination of streams and rivers. The continued use of nitrogen fertilisers without lime may lead to soil acidity. Nevertheless the problem of soil acidity is easy to solve. One can apply Lime Ammonium Nitrate (LAN) or apply lime which is readily available in Swaziland. The abundance of heavy metals in the soil may pose serious health hazard. Fortunately, the fertilisers in common use in Swaziland do not contain alarming amounts of heavy metals with the exception of Zinc which constitute 1% of some compound fertilisers. Therefore contamination with heavy metals from fertilizer application in Swaziland may be insignificant. Nitrogen, Phosphorus, potassium, magnesium, calcium and sulphur are the nutrients applied in large quantities. The first three are applied as fertilisers. Magnesium and Calcium are applied in ameliorants such as dolomitic limestone and gypsum. Sulphur is applied in either ammonium sulphate or gypsum. According to Greenland and Hayes (1981) the amounts of nitrogen and phosphorus added to the soil which are removed by crops are estimated to be in the region of 30% and that of potassium is even less. Most of the nitrogen not taken up by crops and some of the potassium and very little of the phosphorus is lost in drainage water. Irrigation water can also remove fertilisers from the soil. The removal of nitrogen and phosphorus from the soil by water can lead to eutrophication of streams and rivers13. Problems arising from this activity in Swaziland have not yet reached alarming proportions. However signs are there to point out that the situation might get worse unless appropriate measures are taken to protect the environment and mankind. Pesticides and Herbicides Chemicals that directly contribute to the problem of land degradation in Swaziland are herbicides. In Swaziland most of the weed control is done manually. However in the large-scale plantations the cost effective method to use would be the use of herbicides to control weeds. The use of herbicides has the advantage of making possible practices of minimal or no tillage. The use of herbicides like ‘paraquat’ followed by direct drilling of the seed would not only save fuel but it would reduce the severity of erosion and conserve soil moisture. According to Nkambule and Ndlovu (1988) some herbicides that contain a chemical called ‘hyva’ such as that used by pineapple growers in Swaziland may pose danger of desertification. Where the herbicide has been used it is difficult to grow other crops such as maize and cabbages. The chemical is also suspected to be very persistent in the soil. Pineapple growing in Swaziland happens to be on one of the best soils in the middleveld covering a total area of 1,480 ha (3%) of

11
the plantations area (CSO, 1986). This may appear insignificant but if such class 1 arable land is lost for good it may be ditrimental to attainment of food security. BIODIVERSITY LOSS The international Convention on Biological Diversity (article 2) defines biodiversity as the variability amongst living organisms from all sources including inter alia, terristinal marine and other aquatic ecosystems and the ecological complexes of which they are part14. Swaziland, despite her small size supports a rich and diverse assemblance of habitats which are home to a wide range of organisms. The information base on Swaziland's biodiversity is still incomplete, however survey work has shown that a significant portion of Southern African plant and animal species occur here. The eastern region of Swaziland for example forms part of the Maputo land centre of plant diversity (one of the world's "hotspots" of floral as well as faunal, species richness and endemism), while the western region falls within another area of global significance, the Drakensburg Escarpment Endemic Bird Area15. Documented studies reveal that Swaziland has over 820 species of vertebrates. (day, 1976; Hyslop, 1994; Boycott, 1992a ; Parker, 1994; Monadjem 1997b, 1998a). Although the country's higher plants have been collected and studied since the 1950's (Compton, 1996; Kemp 1983.) the distribution of most species are poorly known and new records are constantly being added. To date 2, 414 species of plants have been recorded within Swaziland, (L. Dobson in Lit), In addition to harbouring a high species richness, Swaziland also supports 18 endemic species of plants and one endemic vertebrate. Considering, the country's small size, these figures suggest that Swaziland's biodiversity may be of global significance15. Historical perspective of biodiversity conservation Biological diversity is best conserved in areas that are less distributed or areas with little influence by humans16. Areas exhibiting rich biodiversity will therefore include protected Nature Reserves, well managed cattle ranches, prestine inaccessible areas and Royal Burial Grounds. Swaziland initiated the establishment of Parks and Nature Reserves in 1972, through

12
the establishment of the National Trust Commission Act of 1972. The objectives of these parks and nature reserves included among other things, the promotion and conservation of indigenous plants and animals and the protection of the natural ecology and environment of the park or Nature Reserve. However a failure of the SNTC Act is that it does not call for thr establishment of a network of protected areas that covers all ecosystems. There are six game parks that were established under this act covering a total area of 60,800 hectares. A total of 11 game parks and Nature Reseves have no legal status and cover the remaining 15,300 ha of the protected areas network. These ungazetted areas are limited in their security as conservation areas as many are being threatened by competition with conflicting with land users. The total area covered under gazzetted protected areas is only 4% of the total land area of Swaziland and this is still below what the IUCN and CBD standards. Ecosystems There are four biodiversity ecosytems recognised in Swaziland. These are Montane grassland, Savanna-woodland mosaic, forests and aquatic ecosystems. The status of each ecosystem in terms of its species richness is outlined in Table 2.3 The grassland and Savanna ecosystems comprise 94% of the country, while the forest and aquatic ecosystems are highly restricted in distribution. The savanna ecosystem is currently the best conserved (5%) while the remaining ecosystems have only 2% of their areas formally protected. Approximately 25% of each of the terrestrial ecosystem has been converted to some form of other land use. (Table2.4) Table 2.3 Status of biodiversity by ecosystem.
Grassland
Savanna
Forest
Aquatic
Total
Flora:1
Trees
78 (19%)
261 (63%)
115 (28%)
4 (1%)
412
Grasses
130 (60%)
103 (47%)
3 (1%)
4 (2%)
218
Plant resource species
158 (41%)
256 (66%)
55 (14%)
11 (3%)
387
Exotics
32 (44%)
30 (41%)
2 (3%)
9 (12%)
73
Total
1225 (51%)
1136 (47%)
238 (10%)
98 (4%)
2418
Fauna (vertebrates):2
Fish
0
0
0
51 (100%)
51
Amphibians
9 (21%)
10 (24%)
1 (2%)
37 (88%)
42
Reptiles
51 (46%)
76 (69%)
12 (11%)
7 (6%)
110
Birds
138 (28%)
290 (58%)
91 (18%)
97 (19%)
500

13
Mammals
49 (39%)
95 (75%)
13 (10%)
1(1%)
127
Total
247 (30%)
471 (57%)
117 (14%)
192 (23%)
821
Threatened:
Flora3
161 (70%)
71 (31%)
53 (23%)
6 (3%)
231
Fauna (vertebrates)4
44 (38%)
51 (44%)
15 (13%)
27 (23%)
116
Endemics:
Flora5
13 (72%)
2 (11%)
3 (17%)
0
18
Fauna (vertebrates)4
1 (100%)
0
0
0
1
Southern African endemics (birds)6
26 (50%)
13 (25%)
12 (23%)
1 (2%)
52
1 L. Dobson (in lit.) 2 Monadjem (1997b) 3 from Flora Protection Bill (2000) 4 Monadjem & Boycott (in preparation) 5 from SNTC website 6 Clancey (1986) Factors contributing to the decline of biological diversity The 1992 Government of Swaziland Report to UNCED notes two groups where decline in biological diversity is most evident. These are the large mammals and the indigenous flora, and both cases being a product of visibility. However , more studies are needed to provide concrete data on the more subtle aspects of affected biological diversity in Swaziland. Factors which one can identify in the broad context as being responsible for decline in biodiversity in Swazilannd are common to most countries in the world. The widest impacts are due to agro-industry, such as sugar cane and timber plantations, and dense subsistance farming and settlements. The former results in monotypic "green deserts," unfavourable to most local species of fauna, and usually annihilating indigenous flora.The latter results in the distruction of most larger mammals, either for human consumption or due to percieved competition, and the eradication of the more specialised or sensitive species of animal due to habitat distruction and alteration. Threats to flora occur through clearing of fields, cutting for building and fuel wood and selective pressures on species used for traditional medicine. Table 2.4 shows that a total of 4.280 sq km of biodiversity rich ecosystems have been converted to plantation forestry, sugar cane, urbanisation and others. From 1985 to 2000 a total of 435 sq km has been converted representing a conversion rate of 29 sq km per year. By year 2030 it can be estimated that a total of 870 sq km would have been converted. This reduces by 50% the potential protection worthy ecosystems of the country. The pollution of the aquatic ecosystem by persistent organic pollutants and other agro chemicals continues to be a major threat to the aquatic biodiversity. Use of chemicals such as Lindane, Dieldrin, DDT, Gramoxane, Parathion and Malathion has been evident through out the country.

14
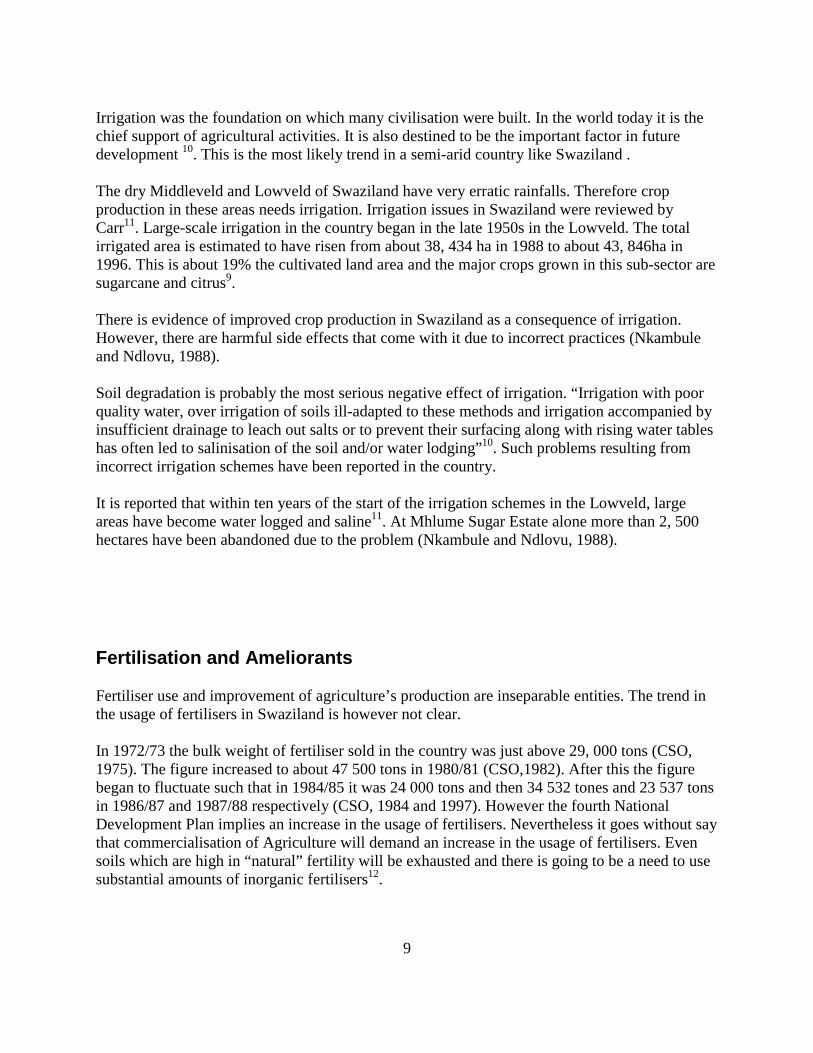
The adverse long-term effects of most of these have been demonstrated else where, but there is little information on the results of their continued use in Swaziland. Tons of obsolete pesticide have been sealed and stored in a shed in Matsapha by the Ministry of Agriculture until such time that a suitable disposal method is found. The Kingdom of Swaziland has not yet ratified the Basel convention, which currently makes it difficult for the country to take advantage of advanced hazardous waste facilities in neighbouring South Africa. The main area of pollution that can be identified in Swaziland other than that caused by pesticides is river pollution. As a consequence of major industrial expansion, the rivers of Swaziland are increasingly susceptible to occasional accidental release of chemical pollutants. Nutrient enrichment with accompanying eutrophication is liable to occur as a result of run-off effluent from agro-industry fields and also inadequate sewage facilities in human settlement. Adequate controls are currently lacking here. Furthermore, since not all of Swaziland main rivers originate within the country, pollution may occur outside of the country's borders. For an example a pulp factory in Piet Retief in South Africa is continuously polluting the Ndlotane River in the South of the country. One of the prime pollutants affecting the country's rivers is increased sediment load resulting from soil erosion. This has the dual effect of smothering plants and invertebrates and markedly changing the nature of the fish species to those adapted to sediment feeding. Certain rare fish species occurring in Swaziland such as Opsaridium zambezense and various Chologlanis spp. are likely to be eliminated by increased sediment loading. The increase in the human population (currently growing at 2.7% per annum), has exerted pressure on the use of biological resources. The livelihood of the rural Swazis is highly dependent on the usage of biological resources. Certain species are already being threatened by over harvesting. For example Breonadia microcephala and Bolusanthus specious, two species of indigenous trees are threatened due to their use for building material in rural areas. Most species of indigenous trees are at risk due to heavy utilisation of living trees for fire wood in the absence of dry material. Commercialisation of traditional medicine and fuel wood as a means of fighting poverty has lead to the over utilisation of a variety of plants. For example Eucomis automnalis and Kniphofia tysonii lebomboensis, which occur in one highly restricted area in Swaziland has suffered over exploitation and may soon run extinct. Commercial exploitation of plants and animals for export is also a major problem. For example birds, reptiles and amphibians for the pet trade, rhino horn for traditional medicine in Asia and cycads and garden plants. The last may have resulted in the extinction of Encephalastos heenanii in Swaziland. The traditional practice of accumulating livestock as social security has meant that livestock densities throughout Swaziland are high. Overgrazing is thus a major problem with resultant bush encroachment in the Savannah woodland ecosystem and soil erosion in the montane grassland and aquatic ecosystems. Furthermore overgrazing in combination with extensive tree
15
cutting for fuel wood has led to a proliferation of alien invaders such as guava (Psidium guavaja) syringia (Melia azedorach) , Sesbania punicea and Lantana spp. This is particularly evident in the middleveld and lowveld area where the savannah-woodland mosaic and aquatic ecosystems are prevalent. Table 2. 4 Status of ecosystems of Swaziland. Figures are in sq km.
Grassland
Savanna
Forest
Aquatic
Total
Extent of coverage1
7990 (46%)
8327 (48%)
870 (5%)
213 (1%)
17 400 (100%)
Coverage in South Africa2
336 544 (26%)
426 216 (34%)
7265 (1%)
10 427 (1%)
780 452 (62%)
Area formally protected3
190 (2%)
426 (5%)
20 (2%)
4 (2%)
640 (4%)
Area informally protected3
4 (0%)
164 (2%)
3 (0%)
3 (1%)
174 (1%)
Area converted:3
Forestry
1400
120
210
0
1730
Sugar cane
0
520
0
0
520
Urbanisation
145
205
2
0
352
Other
435
1215
14
14
1678
Total
1980 (25%)
2060 (25%)
226 (26%)
14 (7%)
4280 (25%)
Converted post-1985:3
Forestry
27
0
3
0
30
Sugar cane
0
100
0
0
100
Urbanisation
129
60
1
0
190
Other
100
15
0
0
115

16
Total
256 (3%)
175 (2%)
4 (0%)
0
435 (3%)
1 Source Roques & Dobson (in lit.) 2 Source Low & Rebelo (1998), but for aquatic ecosystem Fairbanks et al. (2000) 3 Source Deal et al. (2000) ENERGY The energy sector comprises four major categories namely, electricity, petroleum products, wood fuel and new and renewable energy sources. Final energy consumption includes all energy end-use sectors such as industry, transport, households, agriculture, commerce and services and non-energy use of the resource21 . Primary Resources, Issues and pressures Coal : Coal is the only naturally occurring fossil in the country. Coal and renewable energy resources are the only local sources for primary energy production. Swaziland possesses large reserves of low volatile and low sulphur anthracite of medium to high quality. This coal is relatively smokeless and thus environmentally less harmful but does not ignite easily and is more expensive. So, it is less used than the more volatile form in industry. Substantial reserves have been determined as shown below. Table 2.5: Coal Reserves Area Total probable reserves
(million tones) Run off Mine (million tones)
Lower Coal Zone Upper Coal Zone
485 82
143.5 64.1
Total Reserves Additional Potential Reserves
567 450
207.6
Total probable and potential reserves
1.017
Source: GSMD (Geological Surveys and Mines Department) 1998 Production gradually declined from 1990 to 1992 by almost 20% and increased in 1994 by 64% and again in 1995 it declined by 19.8%. The 1995-drop was caused by a change in open cast mining to underground mining. Bagasse and Forestry waste

17
Bagasse from sugar cane leaves and tops and fibrous residue after extraction of cane juice is used in boilers for energy or returned to the field as fertilizer. In 1995 818543 tonnes were produced. 85% were used for industrial process heat and the balance for electricity generation21 . The forestry industry also produces a lot of bagasse from pruning trees, sawdust, sweepings, knots, dregs and grits that are usually land filled. Bagasse from the sugar and forestry industries is by far the most important source of renewable sources of primary energy. Unfortunately the use of these by products is not maximized through fuel Woodfuel The amount of wood fuel available has not been adequately studied. The best estimates were deduced from a study carried out in 1994 and 1995. Non-commercial forests are not managed sustainably and this has resulted in a decrease in wood fuel available. For example in 1995 the annual forest deficit was estimated at 158000 tonnes. It is estimated that woodfuel demand constitutes 80% of the total wood demand. The problem of deforestation has, as a result of unsustainable harvesting, continued at an alarming rate. The consequences are increased rates of erosion, gulley formation and land degradation as a whole. The strategy being promoted by the Ministry of Natural Resources & Energy is 1) establishment of community woodlots, 2) that of fuel substitution from fuel wood to commercial fuels such as electricity, paraffin and LPG21. Hydro – electricity Swaziland Electricity Board operates four small hydro plants that contribute 23% (1999) of the total energy supplied by the utility. Electricity is generated by hydro or electricity within SEB and 69% of the electricity is imported from South Africa, (ESCOM). The amount of electricity generated has increased from 40.5MW in 1993 to 42 MW in 1998. Imported electricity has decreased from 96MW in 1993 to 90 MW in 1998. Table 4.1 below shows the generating capacity in mega watts. Table 2.6 Generating Capacity in Mega Watts. Agency
1993/94
Generating 1994/95
Capacity 1995/96
MW 1996/97
1997/98
Swaziland Electricity Board Hydro 40.5 40.5 40.5 41.0 42 Diesel 9.5 9.5 9.5 9.5 9.5 ESCOM (import) 96.0 96.0 96 96 90.0 Source: The National Statistical Bulletin, Swaziland, 1998

18
Electricity in Swaziland is not only generated by hydro, but also by diesel and steam. A bulk of the electricity is imported from South Africa. The pie chart below illustrates electricity generation by type in Swaziland. Transformers are an issue. Transformers that may be containing PCBs are left in the open and many a times leak releasing persistent organic pollutants in their locality and storage areas. This problem remains unattended but now that SEB has employed an environmental officer this issue will be cleared out. Figure 2.0 Generating Capacity by Type in Swaziland
Diesel5% Hydro
22%
Steam29%
Import44%
Solar and Wind Energy Swaziland’s solar and wind regimes are not well documented and only limited data is available. For solar energy indications are that the annual averages are between 4 to 6 kWh/m2 per day. In 1992 the Government established an extensive solar pilot project mainly to electrify clinics and schools. Several street lighting, solar water heating and vaccine refrigeration systems were also deployed through the project. Four solar water-pumping schemes were also installed. The project results indicated that the residential uses have been increasing over the past decade. Indications are that the wind regime in the country could be sufficient for micro wind turbines for e.g. battery charging less than 100kW. The energy sector in Swaziland is heavily reliant on biomass fuels namely bagasse and fuel wood. Higher-grade fuels such as electricity and petroleum products that are mainly used are imported from South Africa. Petroleum Products Petroleum products are used in the form of petrol, diesel, paraffin, wax oil and it is transport sector is their biggest consumer. At a small scale they are used for domestic and industrial energy. According to a study carried out by the National Meteorological department, virtually all CO2 emissions emanate from fuel combustion (energy), characterised by household,

19
manufacturing, commercial and transport. The single largest source of CO2 in Swaziland is the transport sector, which accounted for 50% of energy CO2 emissions in 1994. This is a serious issue. Fortunately, Swaziland sinks in all the CO2. Total energy supply by fuel and energy demand by sector in 1995* are shown in figure 2.1 Figure 2.1 Total energy supply by fuel and energy demand by sector
0
5000
10000
15000
20000
3-D Column 1 17047 10500 5742 601 230 200
Industry Househ Transpo Agricult Comme Mining
Source: Ministry of Natural Resources and Energy, Energy Sector, 2001 *The latest comprehensive energy data analysis was performed on 1995 data. A new energy balance for 1999 is almost complete. Increase in industrial activities and ability of locals to afford electricity has led to a rise in energy demand. Energy Bulletin 1997 presents scenarios for future growth. These are treated as depictions of likely evolutions of the energy systems for Swaziland for future growth22. A synopsis of the scenario results is shown in Table 2.6 Table 2.6 Energy Scenarios for Future Growth Actual
1995 Trend 2000
Growth 2000
Growth 2010
Growth 2010
Trend 2020
Growth 2020
(TJ) (TJ) (TJ) (TJ) (TJ) (TJ) (TJ) Agriculture 601 690 690 870 970 960 1120 Mining 200 140 140 90 100 120 160 Industry 17047 18270 18270 21380 22560 25390 29380 Transport 5742 6570 6570 12920 1730 22710 39240 Commerce & Industry
230 250 250 430 980 630 980
Households 10500 11420 11190 13310 15320 15320 1383 Total 34320 37350 37120 49000 53560 65130 84700

20
Source:, Energy Bulletin 1997 In the short to medium term the country will continue to rely on the Republic of South Africa for electricity and petroleum product supplies. However, there could be growth in the medium term, of the share of local coal used in the countries industries due to environmental and strategic reasons23. Reference
1. Ministry of Agriculture & Cooperatives, Swaziland National Action programme to combat desertification, Mbabane 1998
2. Downing B. & Zuke S. Review of Drought and desertification in Swaziland: A
Background for the first National Forum, on the convention to combat desertification,, Mbabane 1996.
3. WMS Associates. Gully Erosion in Swaziland. MOAC, Mbabane 1988.
4. Osunade. M. A. Indigenous Soil and Water Conservation in Swaziland: The state of
Grass Strip As an Erosion Control Measure. Report prepared for CDCS and IIED, Kwaluseni 1994
5. Sibandze B.M. Annual Report of the Central Rural Development Board, Mbabane 1987.
6. Sweet R.J. & Khumalo, Range Resources and Grazing Potential in Swaziland, Mbabane 1994.
7. Ministry of Agriculture & Cooperatives, Livestock Development Policy, Mbabane 1995 page. 6-9.
8. Ministry Of Agriculture & Coops/FAO, Livestock Subsector Review, Mbabane 1994
9. Central Statistical Office: Annual Statistical Bulletin. Swaziland Government Mbabane
1997.
10. F.A.O Environment Impact Assessment and Agricultural Development: Environment Paper No. 2 Rome, 1982.
11. Carr, M.K.V. Irrigation Small-Scale Projects. Outlook on Agriculture16. 1987b.
12. Nkambule S. V. & Ndlovu L.S. , The Impact of Agriculture on the Environment: The
case of Swaziland. Environment Issues paper for UNEP, Luyengo, 1998.

21
13. Greenland D.J. and Hayes M.H.S. The Chemistry of Soil processes. John Wiley & Sons, Chichester 1981
14. Convention on Biological Diversity, Text and Annexes ,Geneva 1994. .
15. Ministry of Tourism, Environment & Communication, Swaziland National Biodiversity strategy and Action Plan (Draft), Mbabane 2001.
Government of Swaziland National Report to UNICED, Ensuring Our Future,
16. Mbabane, 1991 pages 32-,34.
17. Ministry of Agriculture & Cooperatives, Rural Development Areas Annual Report, Mbabane 1981
18. Government of Swaziland, Report of the mission of developing profile, stakeholders roles
and disaster management policy in Swaziland, Mbabane 1999 page 8 & page 11.
19. Central Statistical Office: Annual Statistical Bulletin. Swaziland Government, Mbabane 1985.
20. Ministry of Tourism, Environment & Communication, Swaziland Environment Action
Plan, Mbabane, 1997
21. Swaziland National Energy Policy, Energy Sector Review, Mbabane 2000.
22. Swaziland Energy Section Annual Report, Mbabane 2001
22
Chapter 3
WATER RESOURCES
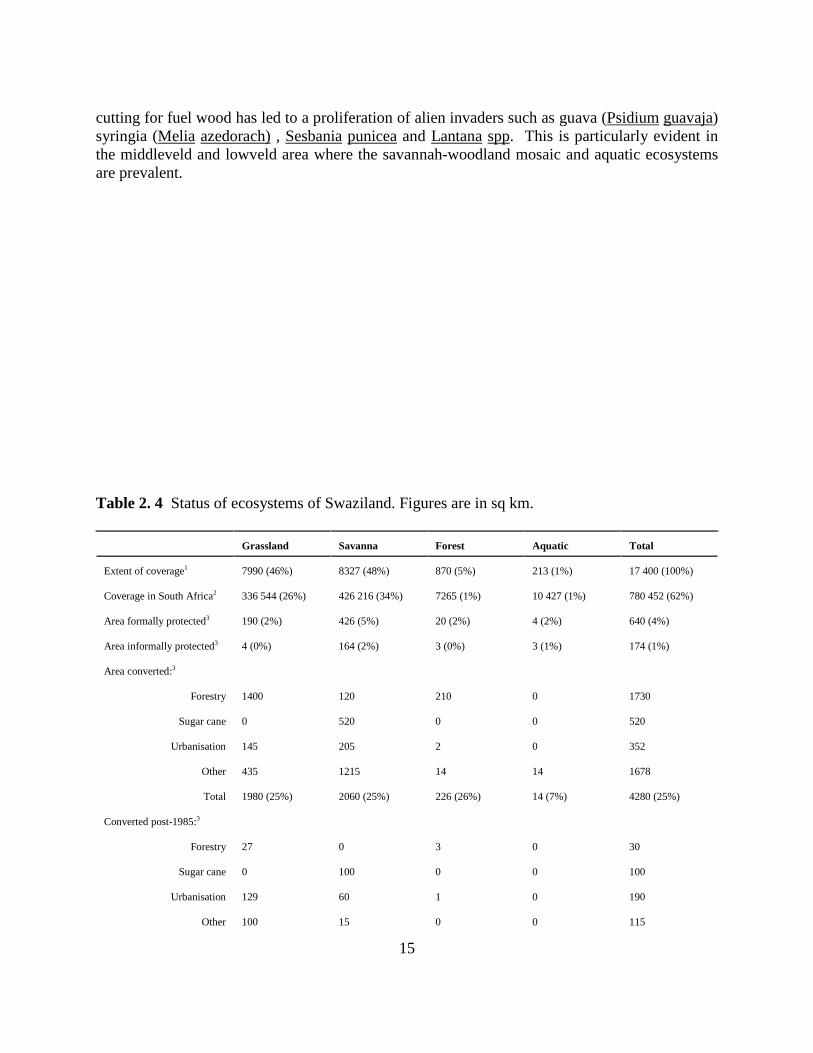
Swaziland is a relatively well-watered country with vast arable land. Several rivers making five major river basins i.e. Lomati, Komati, Mbuluzi, Usuthu and Ngwavuma traverse the country. All these rivers are international and therefore surface water development is done in collaboration with the riparian states namely South Africa and Mozambique. Dams contribute to freshwater resources. Most dams were constructed for irrigation or hydropower generation but are used for domestic purposes, agriculture, fishing and ecotourism as well. The major source of water to rivers is atmospheric moisture through precipitation. The five river basins have 36 gauging stations that use weirs as measuring hydraulic structures. Simulated naturalized flows presents water flowing in and out of Swaziland presenting a good environmental blanket and no abstractions in the catchments. Table 3.0 below presents river flows for the river basins: Table 3 River Flows For Five River basins River system
Area km* Rainfall (mm) Inflow (x106Cu m/a)
Outflow x106Cu m/a)
Appr share for Swaziland
+Pongola 400-600 Nil 59 51 Ngwavuma 1305 600-900 Nil 156 129 Usutu 12903 600-1000 896(386) 2357(1356) 1886(1178) Mbuluzi 3065 700-1200 Nil 460(208) 372 Lomati* 931 900-1400 74(40) 249(118) 7.7 Komati* 7423 800-1400 688(515) 1239(520) 253 (170) +Lubombo 800-900 Nil 31 25 Total MAP=850 1809 4551(2448) 2724(1933) Notes: *Komati and Lomati Basin data is based on Gibb study, 1992 and Water Resources Branch for the stream
actual flow +The Pongola and Lubombo are minor river basins that are under-utilized and their water allocation has
not yet been gazetted to be apportioned by the Water Apportionment Board hence there are no gauging stations in these two basins.
Run off generated within Swaziland is about 2706 million cubic meters of water per annum while the mean annual precipitation is 14800 million cubic meters of water per annum. This means only 18% of rainwater is transformed to run off. The water share for Swaziland is based on treaties signed and water resources basin studies on some major river basin. Where water-sharing agreements do not exist, 20% of the total runoff is left for sustaining the environment.
23
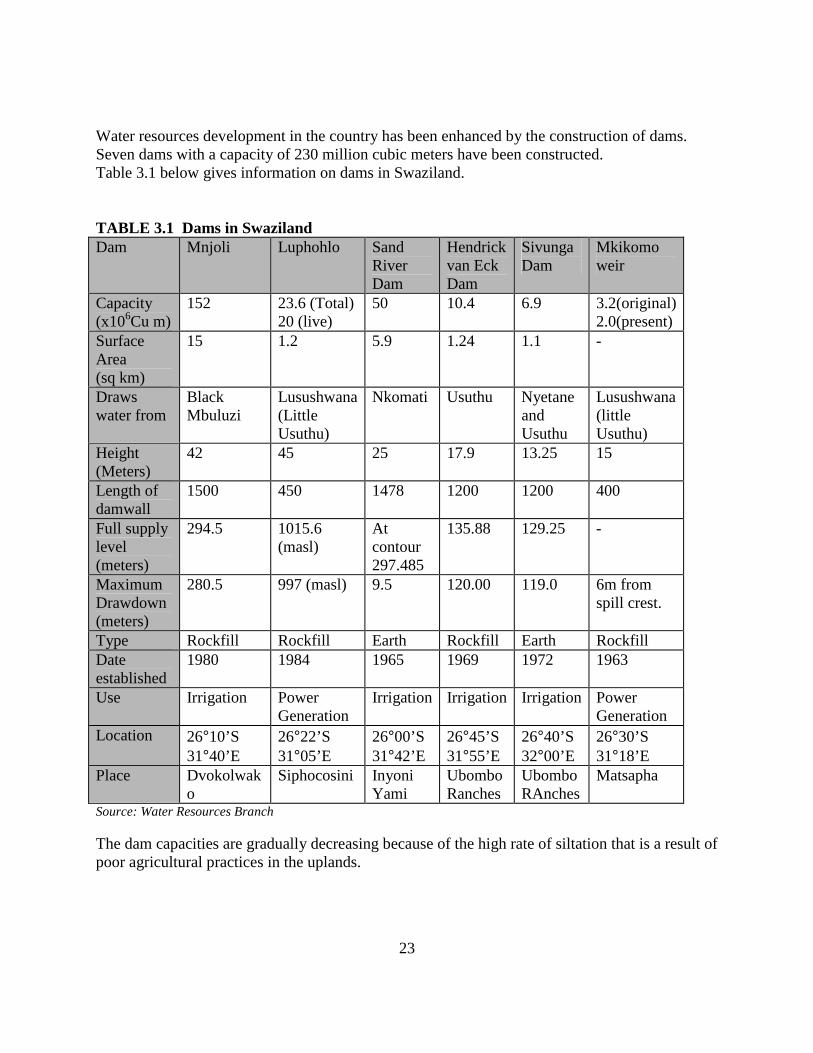
Water resources development in the country has been enhanced by the construction of dams. Seven dams with a capacity of 230 million cubic meters have been constructed. Table 3.1 below gives information on dams in Swaziland. TABLE 3.1 Dams in Swaziland Dam Mnjoli Luphohlo Sand
River Dam
Hendrick van Eck Dam
Sivunga Dam
Mkikomo weir
Capacity (x106Cu m)
152 23.6 (Total) 20 (live)
50 10.4 6.9 3.2(original)2.0(present)
Surface Area (sq km)
15 1.2 5.9 1.24 1.1 -
Draws water from
Black Mbuluzi
Lusushwana (Little Usuthu)
Nkomati Usuthu Nyetane and Usuthu
Lusushwana (little Usuthu)
Height (Meters)
42 45 25 17.9 13.25 15
Length of damwall
1500 450 1478 1200 1200 400
Full supply level (meters)
294.5 1015.6 (masl)
At contour 297.485
135.88 129.25 -
Maximum Drawdown (meters)
280.5 997 (masl) 9.5 120.00 119.0 6m from spill crest.
Type Rockfill Rockfill Earth Rockfill Earth Rockfill Date established
1980 1984 1965 1969 1972 1963
Use Irrigation Power Generation
Irrigation Irrigation Irrigation Power Generation
Location 26°10’S 31°40’E
26°22’S 31°05’E
26°00’S 31°42’E
26°45’S 31°55’E
26°40’S 32°00’E
26°30’S 31°18’E
Place Dvokolwako
Siphocosini Inyoni Yami
Ubombo Ranches
Ubombo RAnches
Matsapha
Source: Water Resources Branch The dam capacities are gradually decreasing because of the high rate of siltation that is a result of poor agricultural practices in the uplands.

24
The Ministry of Agriculture and Cooperative is educating the farmers through extension officers on sustainable crop and livestock farming. The latter has not been successful because overstocking is widely practiced. The Land Policy is still under review. Ground Water Ground water is fed by infiltration of rainfall and seepage from streams and rivers 5-20% of the average rainfall accounts for groundwater recharge. Groundwater resources are substantial and are a potential for rural water supplies particularly in the middleveld and highveld region. The ground water survey (GWS) undertaken between 1986 and 1991 by the Department of Geological Surveys and Mines with the assistance of Piteau Associates Engeneering Ltd., Cananda and Swaziland concluded that the resource potential was equivalent to sustained flow of 21m3/s of which so far only 6% of this has been tapped by the existing 1400 boreholes2. Water supply in Swaziland fall under 2 holdings: rural and urban. 76% of the Swazi population live in rural areas. These people solely relied on surface water and rainwater up to 1976 when the Rural Water Supply Board (RWSB) was set up. RWSB became a government branch in 1995. RWSB is strongly supported by the Ground Water Research Unit (Geological Survey and Mines). Access to clean water has gradually increased over the years. About 43% of the rural population has success to clean water. Figure 3.1 below illustrates progress in rural water supply and sanitation from 1979 to 1996 According to Knight Piesold 1997, about 85% of the urban population are served by reticulation systems
Source: G. Murdoch, 1997
0
10
20
30
40
50
1979 1986 1991 1996
water supplysanitation

25
The Rural settlements are very dispersed making it difficult to provide piped water system and water borne sanitation. According to a demographic and housing survey 1991 Rural areas depend on taps (within or outside homesteads) rivers or canals, wells springs, tanks or other sources of water supply. Sixteen Non-governmental Organizations are involved in operating the water sector. Most of these aim at providing clean water and sanitation to local people. Water Demand The demand for water in Swaziland is mainly for domestic, industrial and agricultural activities. Since most of irrigated agriculture is located in the lowveld where rainfalls are low it is expected that the water requirement are high during the winter months. Domestic and industrial water demand does not vary much with season. Table 3.1 Current Sectoral Water Demand in Swaziland. Purpose Demand x 106 Cu m/a Percentage of Total
Demand 1. Domestic 2. Stock farming 3. Industrial 4. Irrigation
TOTAL
30 14 17 1734 1795
1.7 0.8 0.9 96.6 100
Source: Water Resources Branch • Irrigation
Crops that are grown under irrigation are sugar cane, citrus fruits, pineapple and corn. 70 000 ha of land is under irrigation in the country is estimated that irrigation water demand is 1734 x 106 Cu m/year. While it should be observed that the water leaving Swaziland is 4270 x 106 Cu m/year could be stored in storage facilities to meet current and future irrigation water demand (Water Resources Branch, 2000).
• Industrial
Rapid urbanization and industrialization mainly in Matsapha and Mbabane has exerted extra pressure on water use and quality.
• Forestry
Forest plantations in Swaziland started in the 1930’s when wattle was introduced for the wattle bark from which vegetable tannin is extracted. To date, 130 000 ha is covered by forest plantations and this constitute 8.1% of the land of Swaziland6. Forestry plantations in Swaziland solely depend on rainwater. Exotic species are a big problem along river courses as they over utilise the water and change the natural vegetation.
26
• Non – consumptive
Hydro power generation: There are The 22 mega watt (MW) Ezulwini station draws water from the Luphohlo dam in Usushwana further downstream 14 MW are generated from the Mbabane River. The water is returned to the Great Usuthu River with losses registered as evaporation in dams and canals. Hydro power generation alters the water temperature, which is harmful to animal life in the river.
Water Quality Progressive industrialization has led to gradual deterioration of the quality of water resources in Swaziland. Manufacturing companies that adversely impact on the water quality of receiving water bodies are mainly situated in the Usuthu Basin, a corridor of heavy industrial activity. The Mbuluzi River is affected by irrigated plantations in the area. Industries that have contributed to water quality deterioration are the Usutu Pulp Company at Bhunya, the Swazi Paper Mills, National Textile Cooperation, Beverages industries, Meat, Dairy, Canning and Milling industries on the Matsapha industrial Complex. Water quality is monitored by the Water Resource Branch, Ministry of Natural Resources and Energy in industrial and rural areas, Swaziland Water Services Corporation in urban areas and Geological Survey for ground water/boreholes. • In the Matsapha industrial complex are the Swazi Paper Mills (SPM) and the National
Textile Corperation (Natex) and other smaller companies whose final effluents are directly discharged into the Usushwana River. These companies have a notorious history of persistantly polluting as charaterised by exceptionally high-suspended solids, COD and phenolic compounds values
• Textile industry water demand was 190000 cubic meters in 1997 and 1350 000 cubic meters
in 1998. Natex converted to a dry industry in 1999 and finally closed down in 2000. • Sappi – Usutu
This is located up stream of the Usuthu basin. The feature of accidental spillage of the bye product fall oit into the Usuthu River resulting in fish kills as far as Mozambique was reported in 1971. Effluent spillage have confirmed and in 1993 up to 1998 the macro invertebrate life was found to be nil at the point of affluent discharge.
• A closed system has since been developed with an incinerator to burn the phenol and
installation of tall oil plant to recover useable properties to use for soap manufacturing5. Figure 3.1 shows the COD levels at major rivers

27
Figure 3.1 COD Levels at Major Rivers
Av era ge a nnu al CO D c on ce ntra tio ns at se le cte d rive r s ites, 19 80 to 19 97
0
20
40
60
80
100
120
198 0 1 981 1982 198 3 1 984 1985 19 86 1987 1988 198 9 1 990 1991 19 92 1993 1994 19 95 1996 199 7
CO
D p
pm
Ko ma ti
Lum at i
Usuthu (at rive rbank )
Usuthu (at Big-Ben d)
Nyetane
Po ponyane
M zim nene
Dud usi
Stan dard
Response Presently, water is a free resource, so it is very easily mismanaged. It is hoped that the Water Act will be passed and therefore aid in sustainable utilization and management of water resources in Swaziland. • Water Bill 2001.- The Water Bill 2001 establishes a bottom- up type of water resources
management, and purposes public-private sector involvement in water resources management, at the river basin level, through the establishment of River Basin Authorities. It also attaches an economic value to water a concept that is believed to compel water users

28
to conserve water and its quality. The Bill introduces penalties for discharging effluent exceeding regulatory limits into rivers and other water bodies.
• The National Water Bill is about to be concluded. As the Bill, it elaborates on issues
sustainable water management and introduces the “Water Pricing Policy”. • As a means to protect watercourses alien plant control programmes have been initiated in
protected and catchment areas. • The SEA has prepared Waste and Pollution Standards and Regulations to control pollution
in the country. • The Environmental Audit, Assessment and Review Regulations make a provision of
proper waste disposal at the project planning phse. • The Environment Management Bill, 2000 makes an emphasis on the “Polluter Pays
Principle” The Bill may come to force by June 2001. Reference:
1. Swaziland Environment Authority, Swaziland Environment Action Plan, Webster Print, 1996, p24-27
2. G. Murdoch, Estimated 1997 Maximum Water Demand in Swaziland, April,1997 Solami Mavimbela, Overview of Water Use and Water Demand in Swaziland, Swaziland, October 1999 - unpublished
3. L. Gumbi, J.O. Tetteh, Determining the Status of the Usuthu River Using Macro invertebrates, July 2000 – unpublished
4. Dumisani Mavimbela, Water Resources Branch, Ministry of Natural Resources, Swaziland, 2001
5. National Environment Management Authority, State of environment Report for Uganda, 1998, National Environment Management Authority, Kampala, Uganda
6. A National Green Paper – Forestry Policy, September 2000

29
Chapter 4
ATMOSPHERE AND CLIMATE Complex and highly interactive processes involving the atmosphere, geosphere, hydrosphere and the crysosphere control the climate of the world. Certain gasses such as carbon dioxide play a crucial role in determining the earth’s climate. Swaziland enjoys a climate, which is generally sub-tropical, with summer rains. Further variations in climatic conditions occur within the different physiographic regions. Mean annual rainfall ranges from about 1500 millimeters in the highveld to a little less than 500millimeters in the southern lowveld. Figure 4.0 below shows that precipitation from January to December, years 1961 to 1991 forms a concave curve. Figure 4.0 Swazialnd’s Average Monthly Rainfall totals for years 1961 to 1991
Source: National Meteorological Services Department,2000 Precipitation data from 1961 to 1990 shows cycles of high and low rainfall amounts. These are five to seven year cycles and they coincide with the wettest and driest years. In later years the cycle seems to be getting shorter with an increased frequency of occurrence of extreme events. Figure 4.1 below illustrates the rainfall totals from 1961 to 1990.
0.020.040.060.080.0
100.0120.0140.0160.0180.0
prec
ipita
tion
(mm
)
Jan Feb Mar Apr May Jun Jul Aug Sep Oct Nov DecMonth
Swaziland's Average Monthly Rainfall Totals

30
Figure 4.1 Rainfall Totals From 1961 to 1990
Source: National Meteorological Services Department,2000 From Figure4.1 the rainfall totals over the years show cycles of high rainfall and low rainfall years or drought. These cycles indicate definite climate variability. The rainfall totals from 1900 and first ten years of the graph show the occurrence of drought with a quasi-periodicity of nine to ten years. Later, after 1978 the cycles get shorter, with the frequency of occurrence of extreme events going up. Temperature Temperature is highly variable on diurnal, monthly and annual time scales varying from 0°C to a maximum of 39°C. Figure 4.2 below shows average minimum temperatures and maximum temperature from 1961 to 1990.
0
200
400
600
800
1000
1200
1400
prec
ipat
atio
n (m
m)
1 3 5 7 9 11 13 15 17 19 21 23 25 27 29Year
Swaziland's anuual rainfall totals (1961 - 1990)

31
Figure 4.2 Average Minimum Temperatures and Maximum Temperature From 1961 to 1990.
Source: National Meteorological Services Department,2000 Temperature series are less erratic compared to rainfall. In general, however, over a longer time span there is on average a 7 to 10 year cycles of hot spells and cold spells. This cycle in latter years is observed to be somewhat on an increase in frequency of occurrence, a feature that could be possibly linked with to a changing climate. The lowest rainfall years or drought years coincide with the highest temperature years. Drought is a situation of protracted departure from normal water availability; a water deficit long enough to cause discomfort or harmful effects (State Of Environment Report for Uganda, 1998). Although during drought years the whole country is affected, the lowveld is the hardest hit because it already experiences higher temperatures and lower rainfall than the other regions.
Swaziland's temperature variations
0
5
10
15
20
25
30
1961
1964
1967
1970
1973
1976
1979
1982
1985
1988
Time (years)
Tem
p (d
eg C
.)
Max. T.Min. T.

32
During the years 1991 to 1992 Swaziland experienced a very serious drought that left scars on the national economy and social well being. During drought years, livestock and crop production, rangelands, protected areas and biodiversity therein and general livelihood of people suffer because of the water deficit and unavailability of food to maintain life and vitality. During the 1991/2 drought a National Disaster Task Force was established. Its objectives are to foster sustainable development through poverty reduction, build capacity and resilience to withstand the impact of disaster, to save lives and reduce damage to property and infrastructure, ensure effective, efficient and timely assistance to affected groups, among others. Climate Change Human activities over the years have contributed to changing atmospheric conditions by emission of certain gases that contribute to global warming. The gases are carbon dioxide (CO2), methane (CH4), dinitrogen oxide (N2O), nitrogen oxides (N0x), carbon monoxide (CO), non-methane volatile (NMVOCs), sulpher oxides (SOx) and hydrogen fluorides (HF). Energy activities that result in the emission of these gases are industry, agriculture, land-use and forestry and waste. A green house gas inventory study was carried out in 1998 to assess the country’s contribution to global green house gas (GHG) emissions, as an indicator to the country’s overall contribution to global climate change. An overall picture of Swaziland’s contribution to radioactive forcing from greenhouse gas emissions is given using Global Warming Potentials (GWP) from Table x. The GWPs are circulated for a time horizon of 100 years are direct and indirect for gases and for methane respectively. Table 4.0 Global Warming Potentials GAS CO2 CF4 C2F6 SF6 HFC-
125 HFC-134a
HFC-143a
HFC-152a
CH4 N2O
GWP 1 6500 9200 23900 28000 1300 3800 140 21 310 Source: IPCC Emissions of CO2, CH4, and N2O Emissions of CO2 Swaziland’s contribution of CO2 amounted to 873,870 tonnes in the year 1994, (representing 0.873 tonnes per capita). Virtually all CO2 emissions emanate from fuel combustion (energy) characterised by household, manufacturing, commercial and transport. There were no CO2

33
emissions from industrial processes. The largest single source of CO2 in Swaziland is the transport sector, which accounted for 50% of energy CO2 emissions in 1994. Manufacturing, household, residential and commercial accounted for 32.0%, 15.0% and 3.0% respectively. The relatively high contribution of CO2 from the residential sector is due to use of coal, liquefied petroleum gas (LPG) and to some extent kerosene for heating purposes in households. The largest contribution of CO2 (98%) from the manufacturing sector comes from the use of coal for steam generation in the pulp paper, and food processing and beverages industries. Ozone Condition Globally the rates of ozone depletion seem to have reached their peak and are leveling off somewhat. However, owing to annual natural variation there are still uncertainties as to whether the ODS phase-out campaign is having any effect. In the southern hemisphere where the process is often much faster, the spring-summer season saw a somewhat marginal improvement of the ozone hole. Generally the total column ozone loss in 2000 was smaller than that of the previous year. Therefore, the prospects for ozone recovery remain uncertain. Atmospheric chlorine concentrations are on the decrease. However, with halogen loadings in the atmosphere currently still high, the ozone layer remains vulnerable. In Swaziland, like in most developing countries the populace does not appreciate the impact that ozone depletion will have on development. Ozone depletion poses a threat on agricultural productivity. Increases in UV-B radiation have been scientifically found to cause statistically significant decreases in productivity of higher plants. In Swaziland this could spell disaster since agriculture still forms the backbone of the economy. Even minor variations in productivity (yield) tend to amplify themselves. Increases in UV-B radiation affects a wide range of natural processes both aquatic and terrestrial. One natural process that is affected and has an impact in Swaziland is the decomposition rate of organic matter in the soil. Increased UV-B radiation results in decreased decomposition rates, which inevitably affects the humus content of the soil. Another natural process that is affected is the nitrogen cycle. Nitrogen is the single most important limiting factor in the soil as nitrogen compounds determine the fertility of a soil. The nitrification processes are affected because UV-B radiation kills the nitrogen-fixing bacteria colonies in the soil. Trends

34
Globally ODS concentrations have leveled off reflecting marked declines world wide in ODS consumption. In Swaziland the CFC consumption rates show a downward trend. In the Methyl bromide sector there hasn’t been much difference. The lack of Methyl bromide consumption data in Swaziland makes it rather difficult to visualize any trends. Impact • Ecosystems Functions And Services
Apart from the aforementioned effect on productivity in higher plants (yields) many other UV-B effects are being observed in terrestrial ecosystems. Studies have reported sizeable influences or plant-insect interactions. This includes such important interactions as pollination and the degree to which plants are consumed by plants. The process of pollination itself is vital in food production. Increased UV-B radiation has been found to decrease fungi colonies involved in decomposition of organic matter and subsequently affects the humification of the soil. In aquatic ecosystems, reduced productivity as a result of enhanced levels of solar UV-B radiation results in reduced up-take of atmospheric carbon dioxide, which may augment global warming around the world. • Human Health And Well-Being
There is a long list of infectious diseases influenced by UV-B exposures. UV-B irradiation has been found to increase the lethality of both malaria and influenza virus infections. In other words some pathogens become more active under increased UV-B radiation. Ozone depletion and climate change may interact to enhance the spread of a number of diseases. It has also been long known that exposure to UV-B can suppress the effectiveness of immunization in humans. UV-B can suppress immune responses exposing leaving people defenseless against diseases. The frequency of eye damage cases like cataracts has been found to be directly proportional to increases in UV-B radiation. Additional genetic information directly links UV-B exposures to the development basal cell carcinomas (skin cancer) in humans. There is a strong suspicion in scientific circles that the increase in birth defects can be linked to UV-B induced genetic damage. • Economics
Any effect that UV-B radiation can have on productivity of crops will directly determine the perpetuation or collapse of the economy since in S.D. agriculture forms the economic corner stone. People requiring hospital attention from UV induced sickness put a strain on both resources and the health care system will further adversely affect the economy. Response/Activities • Swaziland is signatory to the Montreal Protocol. The protocol was ratified and is being
implemented. An ozone office was established in 1996 to deal with ozone issues.

35
• The ODS regulations were drafted in 1999 under the Refrigeration Master Plan. The regulations cover all CFC’s and equipment designed to use or containing CFC’s. They will only affect the refrigeration and agricultural sectors.
• The national Refrigerant Management Plan (RMP) has been prepared in collaboration with
UNEP and GTZ. The RMP outlines a design and implement an overall and integrated strategy for the cost effective phase out of CFCs in the refrigeration sector. Other RMP elements are development of policy, strategy, objectives and approach for the refrigeration sector: training of technicians and customs officials: strengthening the refrigerant recovery and recycling network, enhancing capacity for collection, monitoring and control of ODS consumption data.
• Recovery and recycling of refrigerants. A national program to train refrigeration and air-
conditioning technicians and engineers in recovery and recycling of ozone destroying refrigerants. This program aims to establish national capacity to recover and recycle refrigerants in the country.
• Awareness: This is done through messages on calendars, local newspapers, local phone
cards and the media during ozone day. Through international programmes like the Institutional Strengthening Project and the RMP, the country through the National Ozone Unit (NOU) is in the process of sensitizing the public about the dangers of ozone depletion and what needs to be done. Already CFC-based propellants in spray cans have been phased out and CFC-based refrigerants are in the process of being phased out or recycled. References:
1. “Environmental Effects Of Ozone Depletion” (2000) - Summary presentation by the Assessment Panel.
2. “Action On Ozone” 2000 edition - UNEP Ozone Secretariate. 2. Ozone Office Operative Progress report (1998) 3. National Meteorological Services, 2001 4. Green House Gas Inventory, National Meteorological Services, 1999

36
Chapter 5
URBAN Swaziland is one of the smallest countries in Africa and has the smallest capital city (Mbabane -60 000 people). However, the settlement problems typical of other larger developing countries are still evident. Swaziland's population growth is one of the highest in the world (2.7 %), but the rate of urbanisation is higher than the rate of population growth. The two largest cities of Mbabane and Manzini are growing at 4.7% and 5.7% respectively. It is predicted that by 2005, Swaziland will have more of her population living in urban centres than in any other country in east and southern Africa. Already more than 75% of the urban population are settled in the country's two cities and the corridor between them. Increased rates of urbanisation have presented challenges to Government in terms of urban management. Although the urbanisation rate is not particularly high is comparison to other countries in the region, the institutional capacity and technical skills of the local authorities have been sorely tested. As a result, there are numerous problems with regards to infrastructure - the cost of its installation, operation and maintenance1. A number of government agencies responsible for the provision and management of urban services, ranging from water supply to housing finance, and waste management, need to be strengthened to enable them to operate efficiently. Many implementing agencies suffer from problems with organisational structure, financing and manpower development. In addition, the management of local areas presents a constraint to effective and comprehensive management. Many local governments, through their own deficiencies, are not financially self-sufficient and rely on Central Government for subventions. In the light of the downturn (not cyclical but structural) in the national economy, subsidies have to be targeted, fully justifiable, transparent and accounted for to the granting body. Waste management Waste management is an issue in Swaziland. The problems are lack of awareness and training, weak management structures insufficient infrastructure for sustainable waste management. Currently, the National Solid Waste Strategy is being prepared. Legal tools used in waste management are the Swaziland Environment Act 1992, Environment Management Bill 200 and Swaziland Waste Regulations, 2000 Legislation • Environment Management Bill 2000.2
This Bill states that :

37
(a) Generation of waste shall be minimized wherever practicable and waste must, in order of priority, reused, recycled recovered and disposed of safely.
(b) Non-renewable natural resources should only be used prudently and renewable resources and ecosystem should only be used in a manner that is sustainable.
(c) The “Polluter Pays Principle” and the precautionary principle shall be adhered to. • Swaziland Waste Regulations 2000.3
These Regulations regulate the management of solid waste and liquid waste disposed of on land , and are binding to the State.
Status Generation of Household Waste, Commercial Waste and Litter As only a few statistical data are available on waste arising in Swaziland, it is necessary to verify the data regarding waste generation from household to commerce. The verification is carried out on the basis of number of inhabitants in specific areas multiplied with an estimate of the waste generation per capita.
The verification has furthermore been evaluated against the valuable information gathered for the last couple of years on Mbabane Sanitary Landfill Site.
• Waste Generation in Swaziland
The total amount of domestic waste, commercial waste and litter estimated overleaf. The table shows a synthesis of the estimation of waste generation in different urban and rural areas. It is seen from the table that it is estimated that a total amount of 86,323 tonnes of household and commercial waste is produced per year in Swaziland. These estimations are evaluated against generation of waste in similar areas and seem to be the best available data. The household and commercial waste generation in urban areas are estimated to 44,567 tonnes per year, while the waste generation in the rural areas is estimated to 41,756 tonnes per year. Table 5.0 shows estimations of waste generated in Swaziland based on Southern African waste demography.
Table 5.0 Estimated Waste Generation in Swaziland based on Southern African Waste Demography.
Area 1997
Number of residents
Waste Generation Rate kg/capita/day
Total amount of waste generated Tonnes/year
Mbabane Urban Serviced 24,000 0.55 4.818

38
Mbabane Urban Unserviced 36,000 0.40 5,256 Mbabane Peri-urban Unserviced
78,000 0.20 5,694
Sub-total Mbabane 138,000 15,768 Manzini Urban Serviced 30,000 0.53 5,804 Manzini Urban Unserviced 17,000 0.40 2,482 Manzini Peri- Urban Unserviced
60,000 0.20 4,380
Su-total Manzini 107,000 12,666 Matsapha
13,000
0.40
1,898
Other Town Boards 25,000 0.40 3,650 Company Towns 65,000 0.40 9,490 Sub-total Urban/Peri-Urban 370,000 0.33 44,567 Sub-total Rural 572,000 0.20 41,756
Total Domestic Waste 942,000 86,323 Source: National Solid Waste Management Strategy, 2000
The main problem related to estimation of the generation of household waste, commercial waste and litter is the lack of reliable data. Mbabane landfill is the only place where the weighing of waste is taking place. All local authorities are supposed to report waste amounts arising within their areas of jurisdiction to the SEA. However, reliable information will only be obtained through the maintenance of weigh bridge records at the larger landfill sites, good volume estimates at the small sites and regular surveys of different waste types and waste fractions from specific waste sources. Reliable data of waste generation is needed in the future in order to make realistic and affordable waste management plans. • Projection of Generation of Household, Commercial Waste and Litter
Table 5.1 below gives an estimate of the waste generated from households, commerce and litter. Table 5.1 Estimated waste generated from households, commerce and litter Household and Commercial Waste Generation 1996 Urban Areas 44,567 tonnes Rural Areas 41,756 tonnes

39
Total 86,323 tonnes Source: National Solid Waste Management Strategy, 2000
For the projection of waste quantities from households and commerce, the point of departure would be the expected growth in population combined with the expected development in private consumption. In 1991 the total population of Swaziland was 751,000 people. By 1997 the population had grown to 965,000 and the total population was estimated to about 1 million people in 1998. The population growth rate was 3.2% in 1997 and 3.1% in 1998. It is difficult to forecast future population growth rates. If the 3.1% growth rate per year continues, the population will be 1.44 million in 2010. According to the United Nations “Common Country Assessment” of June 1998 the remarkable growth of the economy in the eighties, which conferred a lower-middle income status on the country, has since experienced a slow down. The rapid population growth has grave implications for sustainable human development. Other concerns related to the population trends, besides the high fertility rate, are the incidences of HIV/AIDS amongst the youth. Although the HIV Sentinel Surveillance Report put HIV prevalence amongst antenatal clinic patients at 26%, Swaziland seems to be in a relatively early stage of the epidemic. Therefore, the NDS population trends analysis from 1997, forecasts that the foreseeable future HIV/AIDS will not necessarily lead to negative population growth rates. An estimate of projected population in 2010 could be 1.1 to 1.2 million people, corresponding to an increase in population by 10-20% over the next 10 years is foreseen. Based on the estimated lower but positive population growth rate anticipated above and provided that the population growth will take place among the proper part of the population, the generation of household waste could be expected to increase by about 15,000 to 30,000 tonnes (100,000- 200,000 people at 150kg per year) in 2010. This corresponds to a growth in household waste, commercial waste and litter of 9 to 17% in the next 10 years due to population growth. According to the annual report of Central Bank of Swaziland for the financial year 1998/99, the performance of the Swaziland economy declined further in 1998 when an economic growth rate of 2.3% was recorded compared to 3.7% the previous year. On average, private consumption expenditure has shown an annual growth rate of 16.9% between 1991 and 1998. If this increase in private consumption continues, the waste generation from household and commerce in the urban areas will also increase. It has not been possible to obtain information on expected future change in household and commercial waste generation resulting from change in private consumption.

40
Despite of this an increase in waste generation of 1-5% over the next 10 years can be foreseen due to increase in private consumption. A rough estimation of the waste generation in the year 2010 would be that the household and commercial waste generation would be between 100,000 tonnes and 120,000 tonnes. • Waste Management plan
No integrated waste management planning covering the full waste management system is taking place in cities or towns. But the Manzini City and Matsapha Town have been surveying waste amounts fir the planning of future common landfill. The waste management Regulations state that each local authority should prepare Waste Management Plans to be approved by the SEA in the future, but there are no guidelines for waste management planning to assist the local authorities at this time. It can therefore be seen that a uniform overview of waste generation and management in Swaziland cannot be obtained by the SEA at this time. The SEA needs to prepare guidelines for these waste generation and waste management planning activities Reference:
1. Swaziland Government, Swaziland National Report to Habitat II “City Summit”, Mbabane,1995.
2. Ministry of Tourism Environmnet & Communications ,Environmnet Management Bill Mbabane, 2000
3. Ministry of Tourism , Environment & Communications, Waste Regulations Mbabane, 2000
4. Swaziland Government, National Solid Waste Strategy – Status Quo Report, Mbabane, 2000
.

41
Chapter 6
FORESTRY The total forest cover of Swaziland as indicated by the 1999 forest Resource Assessment Report is 788 434 hectares. This represents 45% of the total land area. Three categories of forest types are identified in Swaziland. These are indegeneous forest covering 82.7%, wattle forests 3.4% and commercial plantations 14%1. Indegenous forests are further classified as Montane and highveld covring 11,349 hectares ( 1 %) , Reparian 25, 207 hectares ( 3 %), Moister Savanna 169, 620 hectares (22 %), Acacia Savanna 178, 313 hectares (23 %), drier Acacia Savanna 34, 328 hectares (4 % ), and Bushveld 232, 954 hectares (30 % ). An inventory done in 1990 and 1999 show that over the years there has been an increase in the total forest cover by 164 462 hectares. However this apparent increase may be a result of differences in mapping detail rather than actual increase. More inventories using similar level of detail may give more conclusive results. Commercial forestry sector The commercial forestry sector is a valuable economic asset to the national economy providing employment and foreign exchange. Climatic conditions in Swaziland with high rainfall and warm temperatures are very suitable for the commercial growing trees. particularly in the Highveld. The first trees for commercial production were planted in 1949, and areas under forest have steadily extended. The plantation forestry category is the large scale commercial sector based on pine and eucalyptus production with a high level of management. Wattle forestry started as a small scale commercial activities, however management and distribution of most wattle forests have deterorated over the past years, resulting in wattle jungles. The commercial forestry and related processing industry contributes approximately 15% to GDP. The forestry sector, including the secondary processing sector provides employment to approximately 8 000 people, which is 12 percent of the total employment in Swaziland. Commercial forestry is run by private companies of which Sappi-Usuthu, Mondi Peak and Shiselweni forest company are the largest. These three companies together with some small ones manage a total of 130 000 hectares, of this area about 20 000 hectares (15%) is unplanted and used for infrastructure, protection of biodiversity and ecosystems. Main species are pine (predominantly Pinus patula but also P. radiata and P. taeda) and eucalyptus (mainly Eucalyptus salinga and E. grandis), covering about 80% and 20 percent respectively. The productivity is relatively high, about 15-20 cubic metres/ha per

42
annum for pine. Overall annual yield is approximately 1.2 million, which is largely exported as pulp, logs and timber. Forestry issues Deforestation and degradation of natural forest and wood land. The current deforestation and degradation in the natural forest and woodland areas are caused by a complex of factors such as conversion of land to agriculture, uncontrolled extraction of forest products from commercial land and the large livestock populations. During the period 1985 to 2000 forests have been affected by a series of competing land-users. For example a total of 17 950 hectares of indigenous forests was lost to other land uses which included sugar cane growing, construction of dams, built up areas, cotton planting and conversion to exotic tree species. There is also heavy explotation of indigenous forests for firewood, wood curving, furniture making and building material. In the rural areas over 75% of the homestead population uses firewood for cooking and warming up their houses. The FRA 1999 indicate that there is a real decrease in the wood volume per hectare of the moist Savana & acicia Savanna indicating that this strata is under pressure. The underlying causes for depletion of natural forest resources in Swaziland are sinilar to those identified by IFF studies and include rapid population growth exertirg pressure on land, growing poverty, inequalities in land tanure, access and use rights, lack of capacity to manage forests, etc etc. Impact of forest plantations on soil & water Studies in South Africa and Swaziland on the impact of plantations on soil show a decline in soil fertility is usually experienced and in most cases they are left acidic through the deposits of their needle leaves. Similar negative impacts have been noted on the water table. Exotic tree species use substainlly more water than indeginious vegetation. The extent of this problem in Swaziand has however, not been well assessed. A study carried out by Scott and Olbrich (1996) acknowledges this negative effect on water availability but also emphasizes that the reduction could be justified by the important role that commercial forestry plays in the economy of Swaziland. Furthermore plantations have important positive secondary impacts in maintaining the hydrological properties of the soils in comparison with poorly managed catchments, exhibiting overgrazing and erosion.

43
Impact of forest plantations on biodiversity The importance of Environmental Management has not always been recognised as being responsibility of forestry owners or users2. The major impact of forest plantations are the creation of monotypic “green deserts” which are unfavourable to most local species of fauna. There is the also the hazard of uncontrolled forest fires which further lead to loss of habitat for flora and the removal of forests litter which provides cover and helps reduce run off. Bush Encroachment The occurrence of bush encroachment is consistent with the dominant vegetation types of the ecological zones. Highveld and Upper Middleveld are inherently grasslands, while mixed savanna of broad leaved trees, Acacia spp. and mixed bush are the inherent vegetation types in the Lower Middleveld, Lowveld and Lebombo (Compton 1966). Browsing hardly takes place, and it is therefore not surprising that bush encroachment is a localised problem, confined to the zones with savanna and mixed bush vegetation.
The inventory of bush encroachment by Manyatsi (1997) shows that severe encroachment is found concentrated in the Lowveld and the Lower Middleveld where the majority of the commercial ranches are found. Bush encroachment is developing predominantly in privately owned lands (TDL ranches) as there is not much clearing of land for cultivation, and relatively little extraction of firewood and building materials as compared to SNL, where a large proportion of the trees and shrubs has been removed (Sweet and Khumalo, 1994). Other factors exacerbating the problem of bush encroachment in private lands are the exclusion of fire, and the lack of browsing animals. The predominant encroaching woody plant in these areas are Dichrostachys cinerea, Acacia tortilis, Acacia nilotica, Maytenus spp. and Euclea spp. The problem of bush encroachment remains largely unsolved, although many attempts have been made over the past forty years to improve the situation. An example is the history of failed intervention in solving the bush encroachment problem at Mafutseni Ranch (FPLP, 2000c). National Policy Context In the past government has tended to focus on industrial forest resources. However, since the adoption of the Principles for the Sustainable Management of Forests originating from the UN Conference on Environment and Development in 1992 (Agenda 21), the world view of what constitutes forest has been dramatically widened. Over recent years, the Government of Swaziland has been formulating policies and strategies at several levels, towards a more pro-active approach to the considerable

44
opportunities and difficulties ahead. The long-term plan to 2022 is contained within the National Development Strategy (NDS). All other policies and strategies are to facilitate the vision of the NDS, and are to be coordinated by the Public Policy Coordination Unit. The National Forest Policy relates in particular to two other Policies, namely the National Land Policy (draft), and the National Environmental Policy (draft), both of which have a higher place in the hierarchy of National Policies. Both NLP and NEP are nested immediately under the NDS. The National Forest Policy occurs at the level under these two, at the same level of e.g. Agriculture, Biodiversity, Energy and Tourism. For that reason the National Forest Policy should be consistent with the broad policy framework set out in the higher level policies. International linkages At the global level, deforestation was unquestionably one of the major environmental issues of the 20th century, and is likely to be even more important in the 21st. Environmental problems were addressed at the 1992 United Nations Conference on Environment and Development, of which the general recommendations are known as Agenda 21, but there was also a set of principles established which relate specifically to forestry. There is a host of international programmes addressing various aspects relating to forestry. The present umbrella for all forestry related initiatives is the Intergovernmental Forum on Forests (IFF), which reports to the Commission on Sustainable Development (CSD) of the United Nations. The IFF was established in 1997, and is a follow-up to the Intergovernmental Panel on Forests (IPF) established in 1995. Such initiatives are based upon the core concept of Sustainable Forest Management (SFM). Swaziland is a signatory to international conventions and agreements emanating from Agenda 21, and has ratified such conventions. Details of these and other conventions and agreements Swaziland has an obligation to or is involved in are given in Appendix 1. The conventions most relevant to forestry are: • The International Convention on Biodiversity • The United Nations Convention to Combat Desertification (CCD) • The United Nations Framework Convention on Climate Change (UNFCCC) • The Convention on International Trade in Endangered Species of Wild Flora and
Fauna (CITES). An important regional development is the formulation of The Forest Protocol of the Southern African Development Community (SADC), which is part of the Protocol on the Environment, an initiative started by the Environment and Land Management Sector (ELMS), under its Green Environment issues category The Forest Protocol, which has now reached the drafting stage, intends to assist the member states to achieve the main objective, which is to establish within the SADC

45
region, and within the framework of the respective national laws of each Member State, concerted approaches to the conservation, sustainable management and sustainable development of forests. REFERENCES 1. Ministry of Agriculture & Cooperatives, Forest Resource Assessments, Mbabane,
1999 2. Ministry of Agriculture & Cooperatives, Green Paper A National Forest Policy
for Swaziland, Mbabane, 2000 pages 30-40. 3.. Ministry of Tourism, Environment & Communication, Swaziland Environment
Action Plan, Mbabane, 1997. 4. Ministry of Agriculture & Cooperatives, Livestock Development Policy,
Mbabane 1995 page. 6-9. `