state of california department of fish and wildlife
TRANSCRIPT
Smith River watershed 2012 summary report
August 16-21, 2012
State of California
Department of Fish and Wildlife
Heritage and Wild Trout Program
Prepared by Stephanie Hogan and Cameron Zuber
Introduction
The Smith River watershed, located northeast of Crescent City, CA in the Siskiyou Mountains of the Klamath River Province, encompasses a drainage exceeding 500,000 acres (Figure 1). The entire watershed is undammed, free-flowing and over 300 miles are designated under the National Wild and Scenic Rivers Act, including the main-stem Smith River; North, South and Middle forks, and 38 tributaries. Native salmonids include Chinook salmon (Oncorhynchus tshawytscha), coho salmon (Oncorhynchus kisutch), coastal rainbow trout/steelhead (Oncorhynchus mykiss irideus) and coastal cutthroat trout (Oncorhynchus clarkii clarkii).
The California Department of Fish and Wildlife (CDFW) Heritage and Wild Trout Program (HWTP) has conducted fisheries and habitat assessments throughout the Smith River drainage since 2010 to evaluate potential for designation as a Heritage and Wild Trout Water. Wild Trout Waters are those that support self-sustaining wild trout populations, are aesthetically pleasing and environmentally productive, provide adequate catch rates in terms of numbers or size of trout, and are open to public angling (Bloom and Weaver 2008). Wild Trout Waters may not be stocked with catchable-sized hatchery trout. Heritage Trout Waters are a sub-set of Wild Trout Waters that highlight wild populations of California’s native trout that are found within their historic drainages. The HWTP utilizes a phased approach when evaluating waters for potential designation. In 2010, a Phase 1 initial resource assessment was conducted to determine whether the Smith River watershed meets the minimum qualifications for designation (Weaver and Mehalick 2010). In 2011, the HWTP began a Phase 2 candidate water assessment (Bloom and Mehalick 2011). Phase 2 assessments generally occur over a multi-year period and provide a comprehensive evaluation of the fishery, habitats, and angler use, including estimates of trout abundance and delineation of species distribution.
Based on the results of the 2011 assessment, the HWTP recommended continued fisheries, habitat, and angler assessments throughout the Smith River watershed and collaboration with state, federal, and private entities. In 2012, the HWTP continued Phase 2 candidate water assessments including:
1. Direct observation snorkel surveys in the main-stem Smith River and South Fork Smith River to better understand species composition, size class structure and fish abundance.
2. Hook and line angling assessments in Lake Earl/Talawa to evaluate catch rates, species composition and catch sizes.
3. Continued assessment of angler use, satisfaction, catch rates, catch sizes and gear preferences using voluntary angler survey box (ASB) data.
4. Collaboration with local CDFW staff, US Forest Service (USFS) Gasquet Ranger District and the Smith River Alliance (SRA).
This report summarizes the results of the 2012 Phase 2 assessments in the Smith River watershed.
Methods
Direct observation
The HWTP (Headquarters and Northern Region staff) conducted direct observation surveys in the Smith and South Fork Smith rivers between August 16th and 21st, 2012 using snorkeling methods, an effective survey technique in many small streams and creeks in California and the Pacific Northwest (Figure 2; Hankin and Reeves 1988).
Five adjacent sections were surveyed on the Smith River from the confluence with the South Fork Smith River downstream to the mouth (approximately three miles; Sections 112-512). Surveys were conducted in a downstream direction with between four and seven divers. One section was surveyed in the South Fork Smith River (Section 212) with four divers and was located approximately one-quarter mile downstream of the confluence with Buck Creek. The number of divers per section was determined based on wetted width, water visibility, habitat complexity and available personnel.
Divers maintained an evenly-spaced line perpendicular to the current and counted fish by species. All observed salmonids were further categorized and counted by size class. Size classes were divided into the following categories: young of year (YOY); small (< 6 inches); medium (6-11.9 inches); large (12-17.9 inches); and extra-large (≥ 18 inches). YOY are defined by the HWTP as age 0+ fish, emerged from the gravel in the same year as the survey effort. Depending on species, date of emergence, relative growth rates, and habitat conditions, the size of YOY varies greatly, but is generally between zero and three inches in total length. If a salmonid was observed to be less than six inches in total length but it was difficult to determine whether it was an age 0+ or 1+ fish, by default it was classified in the small-size class (< 6 inches). If a fish could not be identified as either a trout or salmon it was classified as unknown salmonid (O. sp.).
Divers were instructed in both visual size class estimation and proper snorkel survey techniques (establishing a dominant side, determining the extent of their visual survey area, how and when to count (or not count) fish observed, safety considerations, etc.) prior to starting the survey. For each section, surveyors measured water and air temperature (ºC), average wetted width and water depth (ft), and water visibility (ft). Section lengths were determined based on Geographic Information System analysis (at a scale of 1:10,000). Habitat type (flatwater, riffle, or pool) was identified following Level 2 protocol as defined in the California Salmonid Stream Habitat Restoration Manual (Flosi et al. 1998).
Representative photographs were taken and geographic coordinates of the section boundaries were recorded using a Global Positioning System (GPS) hand-held unit (North American Datum 1983). To calculate estimates of abundance, the HWTP summed all observed fish by species in all sections and divided by the total survey length (fish/mi).
In addition, the HWTP provided personnel to assist with annual SRA surveys in the South Fork Smith River on August 18th, 2012. The South Fork Smith River was surveyed from the confluence with Buck Creek downstream approximately two miles (Section 112) following SRA protocols. Divers maintained a line perpendicular to the current and counted fish by species. Surveys were conducted in a downstream direction with between two and four divers, depending on wetted width, water visibility, and habitat complexity. All fish were identified to species and salmonids and suckers (Catostomus sp.) were further categorized and counted by size class following SRA protocols, which differed, depending on species (Table 1).
Only coastal rainbow trout/steelhead greater than 10 inches, Chinook salmon between 24 and 36 inches, and suckers between 8 and 20 inches were counted. All observed coastal cutthroat trout were further categorized and counted by size class. Size classes for coastal cutthroat trout were divided into two categories: 7 to12 inches and greater than 12 inches.
Representative photographs were taken and coordinates of the section boundaries were recorded using a GPS hand-held unit (North American Datum 1983). Air and water temperature were measured (ºC). Section length was determined based on analysis using Geographic Information System software (at a scale of 1:8,000). To calculate estimates of abundance, the HWTP summed all observed fish by species and divided by the total survey length (fish/mi).
Angling
Angling assessments were conducted by HWTP personnel in Lake Earl/Talawa on August 17th, 2012. Anglers recorded total fishing effort (hrs) and the number of fish caught by species and size class, following the size classes defined above for the HWTP direct observation surveys. Total length was measured using a calibrated landing net. Catch per unit effort (CPUE; fish/hr) was calculated for each angler per day and was averaged across all anglers.
Data from the voluntary ASB located in the Smith River watershed were examined to better understand angler use, catch rates, and catch sizes for the years 2011 and 2012. Forms missing pertinent information (date, number of hrs fished, and/or fish size classes) were not included in the analysis; all complete forms were examined.
Results
Direct observation
Five adjacent sections were surveyed on the Smith River, totaling 14.8 miles of stream habitat with an average wetted width of 253.2 feet and average water depth of 4.3 feet. Habitat was comprised of 68% flatwater and 32% pools. During the survey effort, water visibility ranged from 2 to 30 feet, depending on location (due to cloud cover and/or turbidity). Divers noted that at times, they were unable to clearly see to the streambed and/or adjacent divers (typically in areas with reduced water visibility and/or increased water depths or stream widths). Overhanging vegetation, water depth, and boulders provided fish cover. Weather during the survey effort was cloudy. Water temperature ranged from 18 to 30 ºC and air temperature was measured between 14 and 20 ºC.
Among the five sections, a total of 3743 coastal rainbow trout/steelhead, 625 coastal cutthroat trout, 5418 unknown trout, 5538 Chinook salmon, 378 coho salmon, 519 unknown salmonids, 846 suckers (Catostomus sp.), 7960 sculpin (Cottus sp.), 13977 threespine stickleback (Gasterosteus aculeatus) and 1500 topsmelt (Atherinops affinis) were observed (Table 2). The majority of unknown salmonids observed were believed to be either coastal rainbow trout or coastal cutthroat trout (89%). Trout, salmon, suckers and sculpin appeared distributed throughout the Smith River and estimated fish abundance was 254 coastal rainbow trout/mi, 42 coastal cutthroat trout/mi, 367 unknown trout/mi, 375 Chinook salmon/mi, 26 coho salmon/mi, 35 unknown salmonids/mi, 57 suckers/mi, 539 sculpin/mi and 947 threespine stickleback/mi. Topsmelt were only observed in the downstream-most section, which was tidally influenced during the survey effort (Section 112); estimated density of topsmelt in this section was 502 fish/mi.
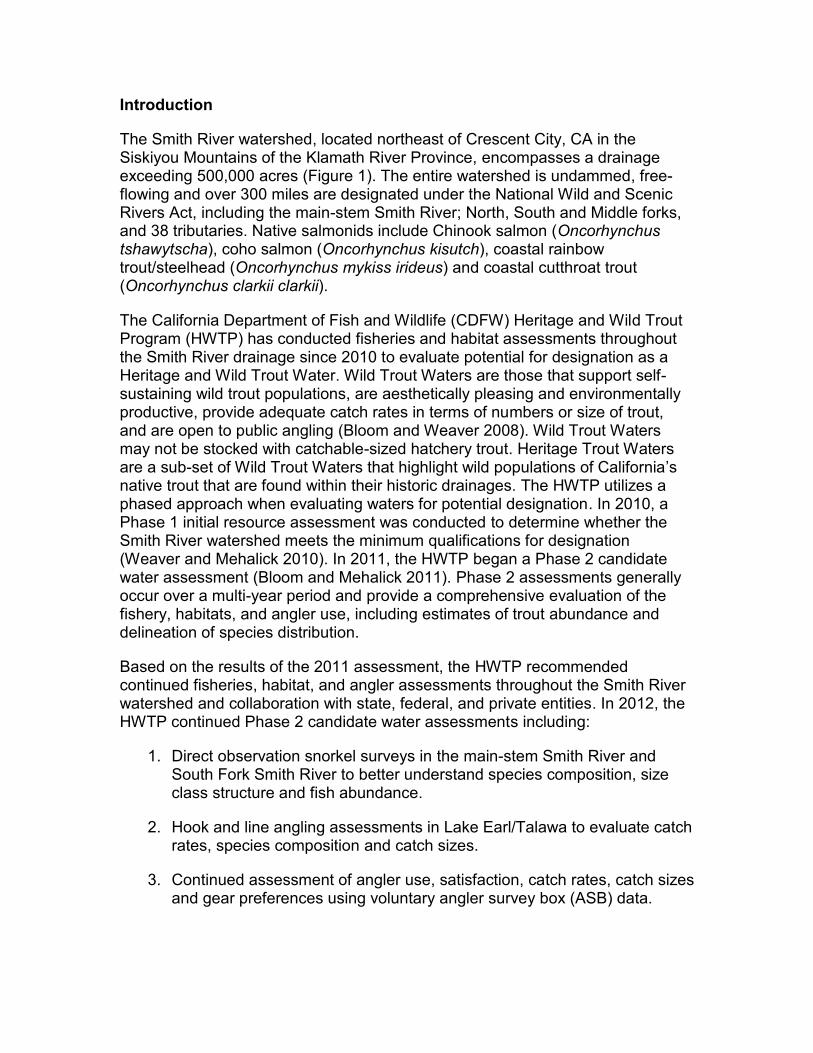
Size class distribution of observed coastal rainbow trout consisted of 2% YOY, 40% small-, 56% medium- and 2% large-sized fish. Size class distribution of observed coastal cutthroat trout was 21% small-, 53% medium-, 25% large- and 1% extra-large-sized fish. Size class distribution of observed unknown trout was 22% YOY, 56% small- and 21% medium-sized fish (Figure 3). All observed salmon were YOY. Divers also observed two coastal giant salamanders (Dicamptodon tenebrosus), three western toads (Bufo boreas), frog tadpoles, crayfish, mussels and snails, the latter of which were not identified to species. In addition, two threespine stickleback and two small-sized unknown trout were observed dead; the cause was unknown.
During the South Fork Smith River SRA direct observation surveys, water visibility ranged from 15 to 25 feet and weather conditions were clear and sunny. Water and air temperatures were both measured at 18 ºC. Section 112 was two miles in length and divers counted 151 coastal rainbow trout and 106 coastal cutthroat trout (Table 3). Divers also observed eight coastal giant salamanders, one skink, two snakes, one frog, numerous crayfish, and one dead lamprey none of which were identified to species. Fish abundance in Section 112 was estimated at 76 coastal rainbow trout/mi and 59 coastal cutthroat trout/mi.

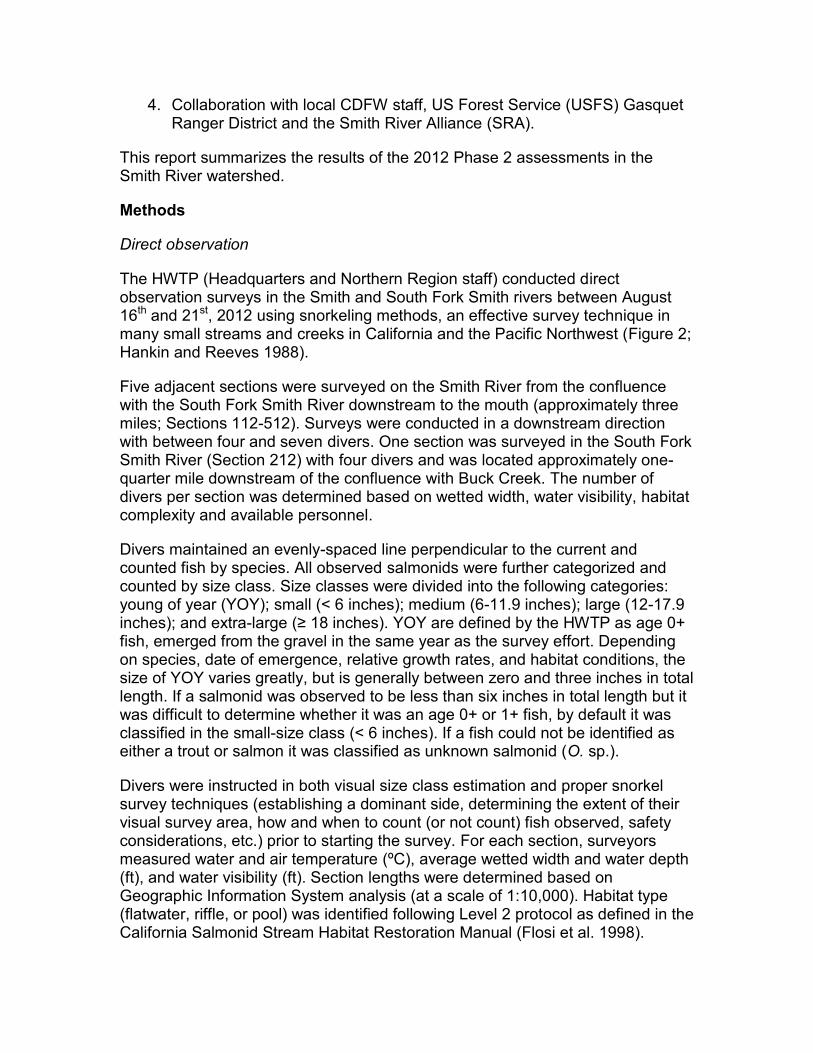
The SRA survey methodology documented larger-sized salmonids and suckers (Table 1). To gain further insight into fish size class distribution, a single pool within Section 112 was surveyed following HWTP protocol and size class structure (Section 212). It was selected because numerous smaller-sized trout were observed. The pool was 314.4 feet in length with a mean wetted width of 53.0 feet and mean water depth of 5.6 feet). During the surveys, water visibility was 20 feet and weather was clear and sunny. Water temperature was 16 ºC and air temperature was 25 ºC. A total of 163 coastal rainbow trout/steelhead, 5 coastal cutthroat trout, 87 unknown trout and 1 Chinook salmon were observed (Table 4). Estimated abundance of coastal rainbow trout/steelhead was 2737 fish/mi. Size class distribution of coastal rainbow trout consisted of 28% YOY, 33% small-, 36% medium- and 3% large-sized fish (Figure 4). Estimated abundance of coastal cutthroat trout was 84 fish/mi. Size class distribution of coastal cutthroat trout consisted of 80% medium- and 20% large-sized fish. Estimated abundance of unknown trout was 1461 fish/ mi. Size class distribution of unknown trout consisted of 83% YOY and 17% small-sized fish. Larger-sized fish observed in Section 212 within the SRA survey size class protocol were included in Section 112 results.
Angling
An angling assessment was conducted on Lake Earl/Talawa with six anglers (Table 5). Two trout were captured in 24.58 hrs of effort with catch rates ranging from 0 to 0.3 fish/hr with an average of 0.1 fish/hr. One captured fish was a large-sized coastal cutthroat trout and the other had characteristics of both coastal rainbow and coastal cutthroat trout (medium-size class).
Data from five ASB located in the Smith River watershed were examined for the years 2011 and 2012 (Table 6). Voluntary fishing information from these ASB provides further insight into the fishery, including angler use, catch rates and catch sizes. A total of 54 forms were analyzed with a reported effort of 143.9 hours and total catch of 94 trout (81 coastal rainbow trout/steelhead, 12 coastal cutthroat trout and 1 hatchery rainbow trout). Reported average CPUE was 0.98 trout/hr in 2011 and 0.64 trout/hr in 2012. The majority of trout captured were in the small- and medium-size classes. One salmon (not identified to species) was reported captured.
Discussion
Direct observation surveys in the lower portion of the Smith River were problematic due to decreased visibility, tidal influence, and stream depths and widths that likely negatively affected fish detection and identification. Future surveys in this portion of the drainage should involve a larger number of divers and surveys should be timed to correspond with outgoing tides.
The Smith River watershed falls within state (Jedediah Smith State Park), federal (USFS Six Rivers National Forest; Bureau of Land Management; Redwood
National Park), local (Ruby Van DeVenter County Park), and private lands. The Smith River is the longest National Wild and Scenic River in the United States and is managed by federal, state and local agencies for its outstanding recreational opportunities including angling, hiking, white water rafting, mountain biking, fishing, scenic beauty, water quality, wildlife values and other attributes. The Smith River National Recreation Area encompasses over 450 square miles within the Six Rivers National Forest and was created to protect the ecological diversity of the watershed, recreational opportunities, and sustained productivity of natural resources (Smith River National Recreation Area Act 1990). Section 5 of the Act identifies the need to develop a monitoring plan to gather fisheries data from sub-watersheds within the drainage; the 2012 HWTP surveys were developed in consultation with the USFS Gasquet Ranger District in an effort to collaborate on resource assessment and assimilate data.
The Smith River watershed contains self-sustaining wild populations of both coastal rainbow trout/steelhead and coastal cutthroat trout within their native ranges. However, it is worth noting that both the steelhead and Chinook salmon fisheries are supplemented with hatchery allotments of fingerling fish from the Rowdy Creek Fish Hatchery, largely to support high levels of angling pressure on the main-stem Smith River (from the confluence of the main-stem Smith River and South Fork Smith River downstream to the mouth). The Smith River watershed is a popular recreational fishery for numerous species, is currently being managed for its wild trout resources, and meets numerous criteria for designation as both a Heritage and Wild Trout Water. The HWTP recommends increasing stakeholder outreach in support of designation, continued maintenance and analysis of ASB, providing continued assistance to the SRA annual Smith River dive counts and further collaboration with other land and resource managers. Lake Earl/Talawa appears to be a seasonal fishery with relatively low catch rates and the HWTP does not recommend further evaluation of its potential for Wild Trout Water designation at this time.
References
Bloom, R. and J. Weaver. 2008. The California Heritage and Wild Trout Program Handbook (Draft). State of California Resources Agency. Department of Fish and Game. Heritage and Wild Trout Program. Rancho Cordova, CA.
Flosi, G., S. Downie, J. Hopelain, M. Bird, R. Coey and B. Collins. 1998. California Salmonid Stream Habitat Restoration Manual. 3rd Edition. Vol. 1. State of California Resources Agency. Department of Fish and Game. Inland Fisheries Division.
Hankin, D.G. and G.H. Reeves. 1988. Estimating total fish abundance and total habitat area in small streams based on visual estimation methods. Canadian Journal of Fisheries and Aquatic Sciences. 45:834-844.
Reedy, G. 2005. Smith River Adult Trout and Salmon Surveys. Smith River Alliance. Occidental, CA.
Smith River National Recreation Act. 1990. US Code Title 16; Chapter 1; Subchapter CXIII; Section 460bbb. 101st Congress, 2nd session.
Weaver, J. and S. Mehalick. 2010. Smith River Watershed 2010 Summary Report. State of California Resources Agency. Department of Fish and Game. Heritage and Wild Trout Program. Rancho Cordova, CA.
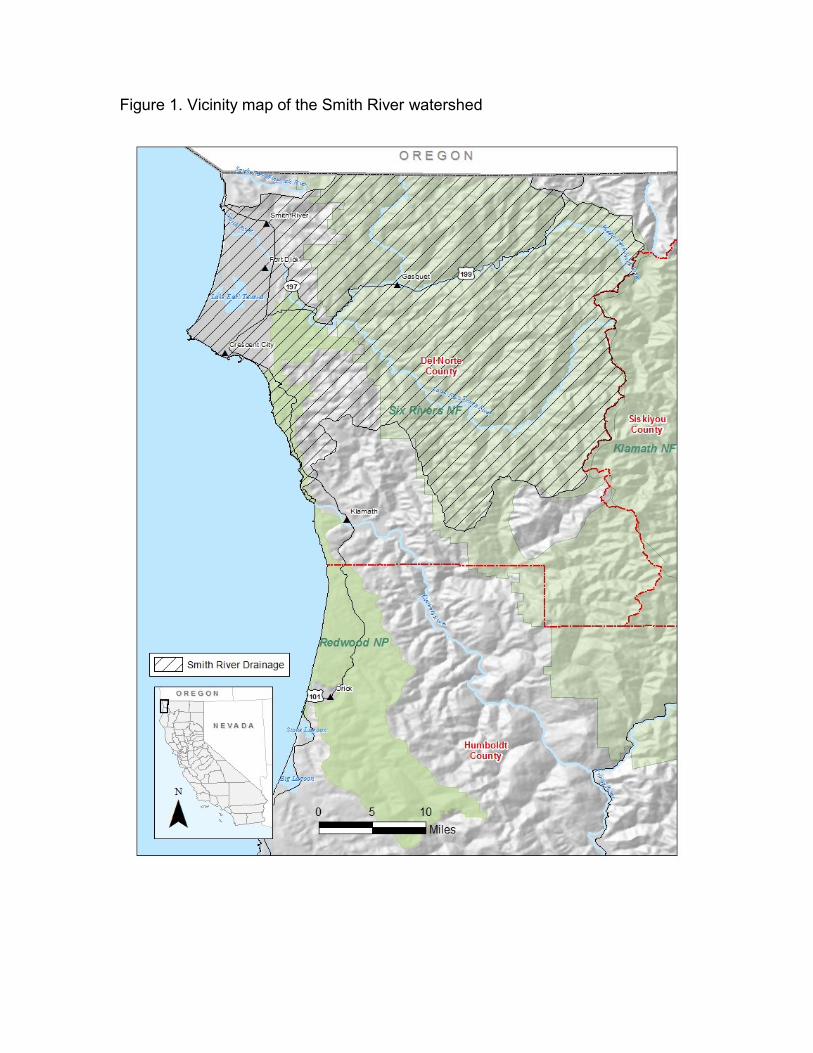
Figure 1. Vicinity map of the Smith River watershed
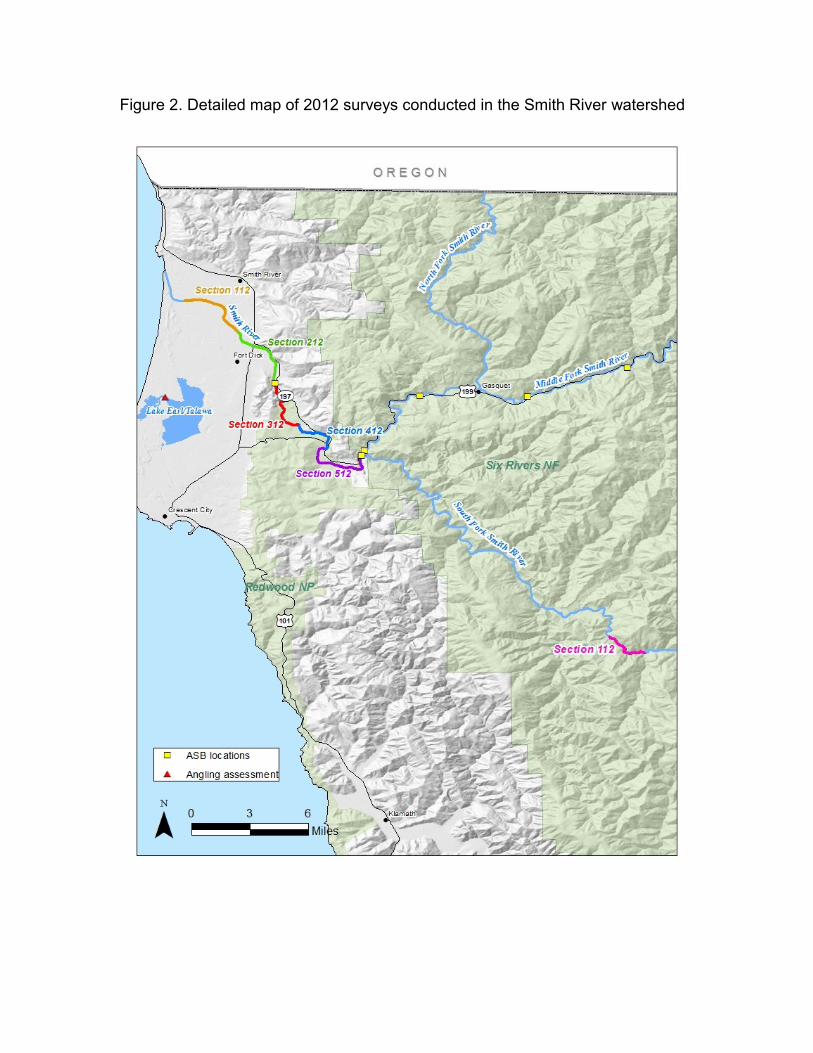
Figure 2. Detailed map of 2012 surveys conducted in the Smith River watershed

Figure 3. Graph of 2012 observed trout size class distribution in the main-stem Smith River
Figure 4. Graph of 2012 observed trout size class distribution in Section 212 of the South Fork Smith River
0%
10%
20%
30%
40%
50%
60%
YOY Small < 6" Medium 6"-11.9"
Large 12"-17.9"
Extra-large ≥ 18"
Smith River 2012 observed trout length frequency
coastal rainbow trout coastal cutthroat trout unknown trout
0%
10%
20%
30%
40%
50%
60%
70%
80%
90%
YOY Small < 6" Medium 6"-11.9"
Large 12"-17.9"
South Fork Smith River 2012 Section 212 observed trout length frequency
coastal rainbow trout coastal cutthroat trout unknown trout
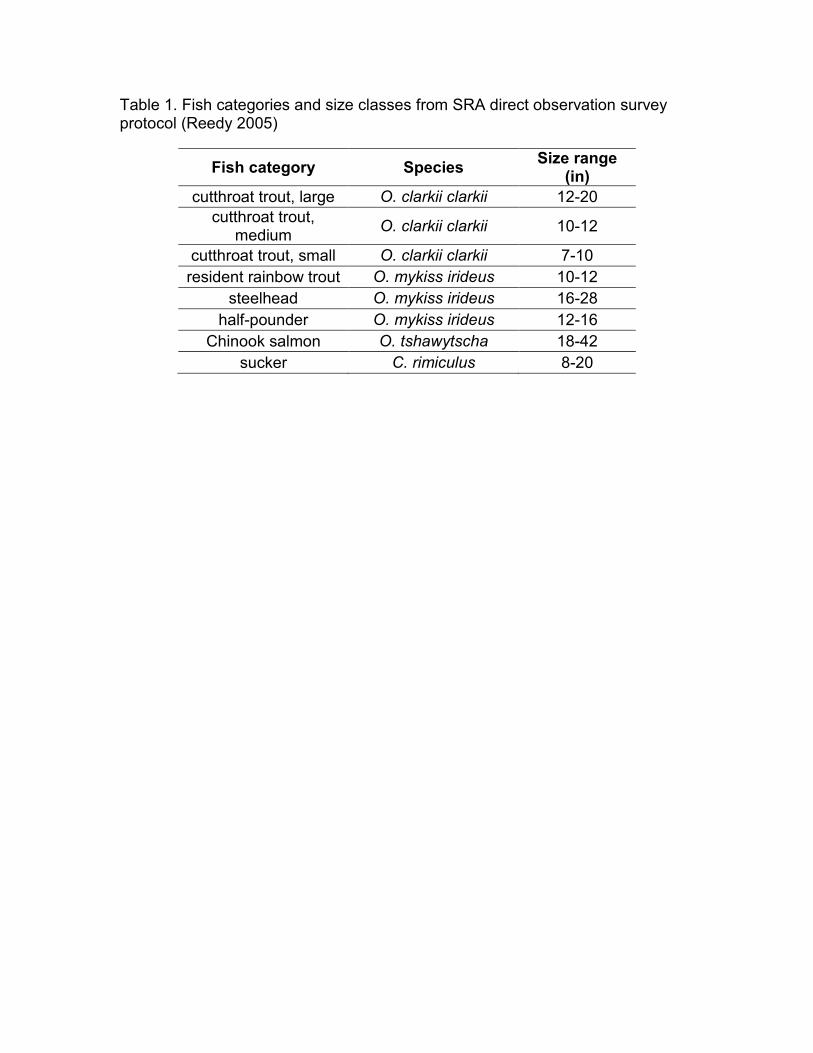
Table 1. Fish categories and size classes from SRA direct observation survey protocol (Reedy 2005)
Fish category Species Size range
(in)
cutthroat trout, large O. clarkii clarkii 12-20
cutthroat trout, medium
O. clarkii clarkii 10-12
cutthroat trout, small O. clarkii clarkii 7-10
resident rainbow trout O. mykiss irideus 10-12
steelhead O. mykiss irideus 16-28
half-pounder O. mykiss irideus 12-16
Chinook salmon O. tshawytscha 18-42
sucker C. rimiculus 8-20

Table 2. Smith River 2012 direct observation survey data including the number of fish observed by species and section
Section Section length
(ft)
Habitat type
Species
Number of fish observed Estimated density (fish/mi)
YOY Small Medium Large Extra-large
Total < 6" 6"-11.9" 12"-17.9" ≥ 18"
112 15,777.7 flatwater
coastal rainbow trout 0 41 151 16 1 209 70
coastal cutthroat trout 0 6 18 5 1 30 10
unknown trout 161 1055 31 3 0 1250 418
Chinook salmon 242 0 0 0 0 242 81
coho salmon 3 0 0 0 0 3 1
unknown salmon 30 0 0 0 0 30 10
unknown salmonid 1 0 0 0 0 1 0
sucker - - - - - 5 2
sculpin - - - - - 187 63
threespine stickleback - - - - - 7813 2615
topsmelt - - - - - 1500 502
212 18,093.8 flatwater/
pool
coastal rainbow trout 0 281 347 14 2 644 188
coastal cutthroat trout 0 48 64 34 3 149 43
unknown trout 173 500 74 2 0 749 219
Chinook salmon 2062 0 0 0 0 2062 602
coho salmon 260 0 0 0 0 260 76
unknown salmon 25 0 0 0 0 25 7
unknown salmonid 0 83 0 0 0 83 24
sucker - - - - - 589 172
sculpin - - - - - 7506 2190
threespine stickleback - - - - - 730 213
312 15,398.0 flatwater/
pool
coastal rainbow trout 0 293 613 39 2 947 325
coastal cutthroat trout 0 28 84 34 0 146 50
unknown trout 685 1039 172 0 0 1896 650
Chinook salmon 1290 0 0 0 0 1290 442
coho salmon 15 0 0 0 0 15 5
unknown salmon 6 0 0 0 0 6 2
unknown salmonid 45 0 0 0 0 45 15
sucker - - - - - 81 28
sculpin - - - - - 228 78
threespine stickleback - - - - - 1434 492
412 11,875.2 flatwater/
pool
coastal rainbow trout 5 474 246 3 0 728 324
coastal cutthroat trout 0 34 38 18 0 90 40
unknown trout 140 296 103 0 0 539 240
Chinook salmon 682 0 0 0 0 682 303
coho salmon 100 0 0 0 0 100 44
unknown salmon 12 0 0 0 0 12 5
unknown salmonid 350 40 0 0 0 390 173
sucker - - - - - 150 67
sculpin - - - - - 21 9
threespine stickleback - - - - - 2923 1300
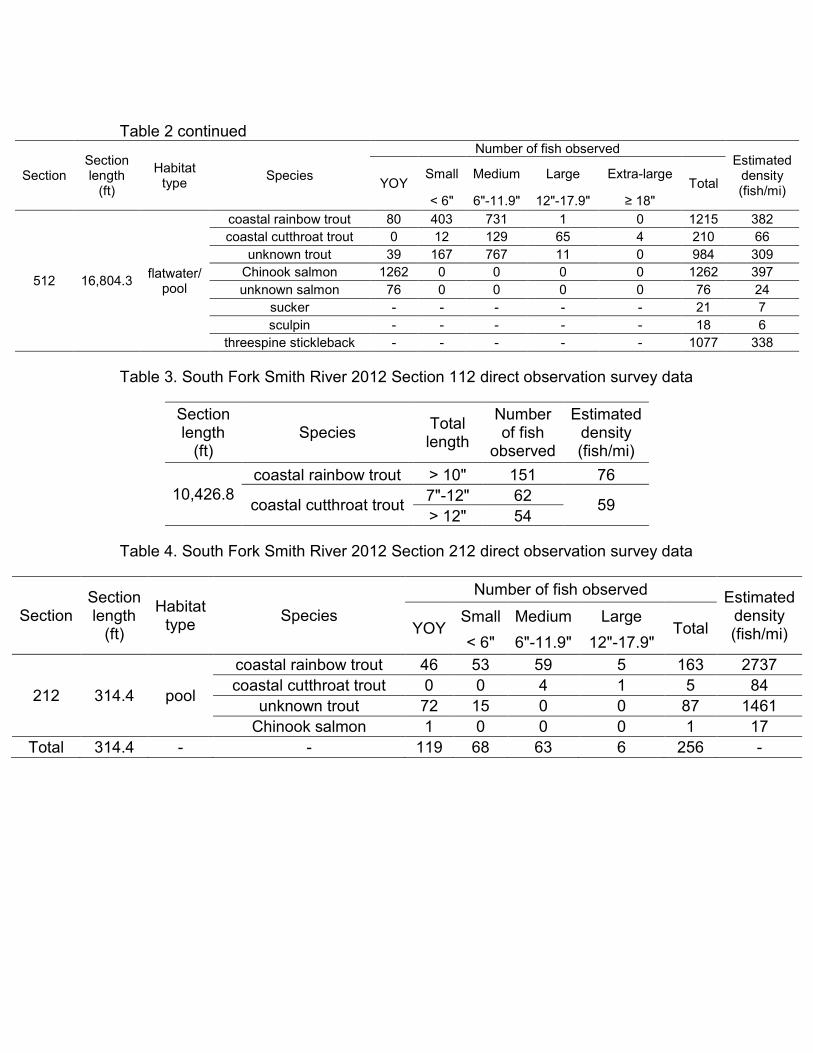
Table 2 continued
Section Section length
(ft)
Habitat type
Species
Number of fish observed Estimated
density (fish/mi)
YOY Small Medium Large Extra-large
Total
< 6" 6"-11.9" 12"-17.9" ≥ 18"
512 16,804.3 flatwater/
pool
coastal rainbow trout 80 403 731 1 0 1215 382
coastal cutthroat trout 0 12 129 65 4 210 66
unknown trout 39 167 767 11 0 984 309
Chinook salmon 1262 0 0 0 0 1262 397
unknown salmon 76 0 0 0 0 76 24
sucker - - - - - 21 7
sculpin - - - - - 18 6
threespine stickleback - - - - - 1077 338
Table 3. South Fork Smith River 2012 Section 112 direct observation survey data
Section length
(ft) Species
Total length
Number of fish
observed
Estimated density (fish/mi)
10,426.8
coastal rainbow trout > 10" 151 76
coastal cutthroat trout 7"-12" 62
59 > 12" 54
Table 4. South Fork Smith River 2012 Section 212 direct observation survey data
Section Section length
(ft)
Habitat type
Species
Number of fish observed Estimated
density (fish/mi) YOY
Small Medium Large Total
< 6" 6"-11.9" 12"-17.9"
212 314.4 pool
coastal rainbow trout 46 53 59 5 163 2737
coastal cutthroat trout 0 0 4 1 5 84
unknown trout 72 15 0 0 87 1461
Chinook salmon 1 0 0 0 1 17
Total 314.4 - - 119 68 63 6 256 -

Table 5. Lake Earl/Talawa 2012 angling data
Date Effort (hrs)
Species
Number of fish captured CPUE
(fish/hr) Medium Large
Total 6"-11.9" 12"-17.9"
08/17/12
4.75 - 0 0 0 0.0
5.50 coastal rainbow/cutthroat trout hybrid 1 0 1 0.2
4.67 - 0 0 0 0.0
3.00 coastal cutthroat trout 0 1 1 0.3
3.33 - 0 0 0 0.0
3.33 - 0 0 0 0.0
Average 0.1
Table 6. Summary of ASB forms from Smith River watershed
Year Number of forms analyzed
Effort (hrs)
Species
Number fish captured CPUE
(fish/hr) Small Medium Large Extra-large
Total < 6" 6"-11.9" 12"-17.9" ≥ 18"
2011 41 99.9
coastal cutthroat trout 4 7 0 1 12
0.98 coastal rainbow trout/steelhead
25 34 2 1 62
hatchery rainbow trout 1 0 0 0 1
2012 13 44.0 coastal rainbow trout/steelhead
11 8 0 0 19 0.64
Average 0.81